Article

A First Case Study of CCN Concentrations from Spaceborne Lidar Observations

1
Department of Meteorology and Climatology, School of Geology, Aristotle University of Thessaloniki, 54124 Thessaloniki, Greece
2
Institut für Physik der Atmosphäre, Deutsches Zentrum für Luft und Raumfahrt (DLR), Oberpfaffenhofen, 82234 Weßling, Germany
3
Institute for Astronomy, Astrophysics, Space Application and Remote Sensing, National Observatory of Athens, Athens, 15236 Penteli, Greece
4
Laboratory of Atmospheric Physics, Physics Department, Aristotle University of Thessaloniki, 54124 Thessaloniki, Greece
5
Satellite Applications, Met Office, Exeter EX1 3PB, UK
6
Leipzig Institute for Meteorology, Leipzig University, 04103 Leipzig, Germany
*
Author to whom correspondence should be addressed.
Remote Sens. 2020, 12(10), 1557; https://0-doi-org.brum.beds.ac.uk/10.3390/rs12101557
Submission received: 4 April 2020 / Revised: 7 May 2020 / Accepted: 13 May 2020 / Published: 14 May 2020
(This article belongs to the Special Issue Feature Papers of Section Atmosphere Remote Sensing)

Abstract

:
We present here the first cloud condensation nuclei (CCN) concentration profiles derived from measurements with the Cloud-Aerosol Lidar with Orthogonal Polarization (CALIOP) aboard the Cloud-Aerosol Lidar and Infrared Pathfinder Satellite Observations (CALIPSO), for different aerosol types at a supersaturation of 0.15%. CCN concentrations, along with the corresponding uncertainties, were inferred for a nighttime CALIPSO overpass on 9 September 2011, with coincident observations with the Facility for Airborne Atmospheric Measurements (FAAM) BAe-146 research aircraft, within the framework of the Evaluation of CALIPSO’s Aerosol Classification scheme over Eastern Mediterranean (ACEMED) research campaign over Thessaloniki, Greece. The CALIPSO aerosol typing is evaluated, based on data from the Copernicus Atmosphere Monitoring Service (CAMS) reanalysis. Backward trajectories and satellite-based fire counts are used to examine the origin of air masses on that day. Our CCN retrievals are evaluated against particle number concentration retrievals at different height levels, based on the ACEMED airborne measurements and compared against CCN-related retrievals from the Moderate Resolution Imaging Spectroradiometer (MODIS) sensors aboard Terra and Aqua product over Thessaloniki showing that it is feasible to obtain CCN concentrations from CALIPSO, with an uncertainty of a factor of two to three.

Graphical Abstract

1. Introduction

Aerosols impact the formation, the optical properties, and the life cycle of clouds. These aerosol-cloud interactions (ACI) mark the largest source of uncertainty in climate change studies [1]. Cloud droplets emerge from the condensation of supersaturated water vapor on aerosol particles that can nucleate liquid cloud droplets: so-called cloud condensation nuclei (CCN). Particles can act as CCN depending on, e.g., their size, solute content, the presence of surface-active or slightly soluble substances, the wettability and shape of insoluble particles, as well as the ambient supersaturation. The CCN concentration hence has a strong link to the cloud droplet number concentration (CDNC) [2].
High aerosol concentrations increase CDNC, which, at constant cloud water contents, leads to smaller cloud droplet effective radii, to an increase in cloud albedo, and, hence, to a negative radiative forcing (first indirect effect) [3]. This increase in CDNC is expected to increase cloud lifetime and cloud coverage reducing precipitation formation efficiency (second indirect effect) [4]. For polluted convective clouds, the suppression of precipitation may allow cloud droplets to reach the freezing level, where they can release latent heat which further invigorates cloud updrafts. This is expected to suppress precipitation and the development of downdrafts, and so prolong the growth of convective clouds [5,6]. The presence of absorbing aerosols leads to local heating that can evaporate existing clouds, cools the surface, stabilizes the temperature profile, and, hence, suppresses convection and cloud formation. This is the so-called semi-direct aerosol effect [7,8]. However, absorbing aerosols affect clouds also thermodynamically and may increase or decrease cloud coverage over an area, depending on the relative position of the aerosol and cloud layers [9].
All these effects are competing and the difficulty of discriminating between aerosol effects and effects of the meteorological background undermine the precise quantification of the influence that aerosols exert on clouds, radiation, and precipitation, and by extension on climate [10]. On top of that, the efforts to constrain model ACI estimates by observational data are based on the assumption that the aerosol optical depth (AOD) or Aerosol Index (AI: AOD multiplied by the Ångström exponent) measured by satellite sensors constitute a good proxy for the number of CCN that reside in the atmosphere [11,12,13,14,15,16,17,18,19,20].
Shinozuka et al. [21] suggest that AOD or AI are not always a good proxy of CCN concentrations in the atmosphere (see also Stier et al., [22]), and that parameterizations that connect AOD with CCN concentrations involve an uncertainty of a factor of two to three. Based on these findings and previous studies [23,24,25,26], more recent studies show the potential of using ground-based polarization lidar measurements to obtain estimates of CCN concentration [27,28,29,30,31]. In addition, satellite-based polarimeters, such as the Polarization and Directionality of the Earth’s Reflectances (POLDER) instrument, may allow for obtaining a better proxy for the columnar CCN concentrations compared to AOD and AI [32]. The use of polarimeter-based products instead of AOD or AI points towards a more negative radiative forcing, due to aerosol-cloud interactions (RFaci) than the one reported in IPCC [1].
Following these developments, we present a first case study in which CCN concentrations estimated from measurements with the Cloud-Aerosol Lidar with Orthogonal Polarization (CALIOP) aboard the Cloud-Aerosol Lidar and Infrared Pathfinder Satellite Observations (CALIPSO; Winker et al., [33]) satellite are compared to airborne in-situ measurements. Specifically, CCN concentrations for a nighttime CALIPSO track that crossed Eastern Europe, the Eastern Mediterranean, and Africa on 9 September 2011 are evaluated with airborne retrievals from the Evaluation of CALIPSO’s Aerosol Classification scheme over Eastern Mediterranean (ACEMED) research campaign. ACEMED offers a unique opportunity for a spaceborne lidar CCN evaluation study in the Eastern Mediterranean, as it made available CCN-related airborne data, which are spatially and temporally coincident with CALIPSO. In addition, our results are compared against data from the unvalidated CCN-related Moderate Resolution Imaging Spectroradiometer (MODIS)/Terra and Aqua product. The used data and methodology are presented in Section 2. Results are presented and discussed in Section 3. Section 4 summarizes the main findings and conclusions of this research.

2. Data and Methods

2.1. Data

2.1.1. CALIOP/CALIPSO

CALIPSO is part of the A-Train formation of satellites and has flown at a 705-km altitude sun-synchronous polar orbit since 2006. It crosses the equator at around 13:30 LT and has a 16-day repeat cycle [33]. CALIOP, the core instrument on CALIPSO, is an Nd:YAG elastic backscatter and polarization lidar, which transmits linear polarized laser light at 532 nm and 1064 nm [34]. CALIOP provides profiles of aerosol- and cloud-related properties [33] from the ground up to 30 km, by measuring the backscattered signals and the state of polarization of the backscattered light. The CALIPSO algorithm breaks down the measured signal into distinct atmospheric layers, e.g., clean air, aerosols, clouds, surface, [35,36], and attributes subtypes to cloud and aerosol layers [37]. Each aerosol subtype is associated with a pre-set lidar ratio (extinction-to-backscatter ratio) that is needed to calculate the aerosol extinction coefficient [36]. For this work, CALIPSO version 4.10 (v4.10) level-2 products [36] were acquired through the ICARE Data and Services Center (http://www.icare.univ-lille1.fr/). More specifically, we make use of aerosol and cloud backscatter coefficient profiles at 532 nm, the vertical feature mask (clean air, cloud, tropospheric aerosol, stratospheric aerosol, surface, subsurface, totally attenuated, low/no confidence), the aerosol subtype mask (marine, dust, polluted continental/smoke, clean continental, polluted dust, elevated smoke, dusty marine, polar stratospheric cloud (PSC) aerosols, volcanic ash, sulfate/other), and other auxiliary quality-related (e.g., cloud–aerosol discrimination score) and meteorological (relative humidity) parameters. These data are available at a horizontal resolution of 5 km, and a vertical resolution of 60 m for altitudes below 20 km.

2.1.2. ACEMED EUFAR Campaign

Two CALIPSO underflights were performed with the Facility for Airborne Atmospheric Measurements (FAAM, http://www.faam.ac.uk/) BAe-146 research aircraft within the framework of the ACEMED campaign over Thessaloniki, Greece (40.6° N, 22.9° E, 60 m a.s.l.): one on 2 September 2011 and one on 9 September 2011. Airborne in-situ and lidar remote-sensing data between 00:00 and 02:00 UTC on 9 September 2011 were used to retrieve ambient aerosol microphysical, optical, and hygroscopic properties at different altitudes [38], by applying the In situ/Remote sensing aerosol Retrieval Algorithm (IRRA). In order to derive the ambient aerosol properties in high-humidity conditions, IRRA utilizes the ISORROPIA II thermodynamic equilibrium model [39]. The BAe-146 aircraft performed several transect flights towards the SSW-NNE direction between 40 and 41.2° N, taking measurements at different altitudes over land and ocean (coastline located at 40.6° N) and a box-shape flight around the area of Thessaloniki. A detailed description of the aircraft measurements and the methodology is given in Tsekeri et al. [38]. For the scope of our study, we used the available dry particle number concentrations (in cm−3) at different height levels (1.8, 2.7 and 3.2 km a.s.l. over land and 1.3, 2.1, 2.7, 3.2 km a.s.l. over the sea) from Tsekeri et al. [38].

2.1.3. MODIS/Terra and Aqua

The two Moderate Resolution Imaging Spectroradiometer (MODIS) sensors [40] aboard NASA’s Terra and Aqua satellites are retrieving aerosol optical properties from space with daytime Equator crossing times at 10:30 LT (morning) and 13:30 LT (noon), respectively. For the area of Thessaloniki examined here, the two instruments take measurements at around 09:30 and 11:30 UTC [41]. MODIS has a viewing swath of 2330 km, and measures backscattered radiation in 36 spectral bands between 0.415 and 14.235 μm at a spatial resolution of 250, 500, and 1000 m. The instrument achieves almost global coverage on a daily basis. The Dark Target (DT) algorithms, one for vegetated/dark-soil land areas [42,43,44,45] and one for oceanic areas [43,44,45,46], provide a CCN product, which has rarely been validated or used so far. This product relies on the DT algorithm for oceanic areas, and is based on the retrieval of the size distribution of aerosols [43,47]: the MODIS CCN product is the integral of the small-mode aerosol size distribution from a fixed radius of 30 nm. Starting from Collection 6, the MODIS CCN (Cloud_Condensation_Nuclei) scientific data set (SDS) was renamed to PSML003_Ocean (Particles of the Small Mode Larger than 0.03 μm) [45]. In this work, we utilized MODIS/Terra and Aqua level-2 Collection 6.1 (MYD04_L2 and MYD04_L2) PSML003_ocean best solution data (in particles/cm2 or else cm−2) to evaluate our CCN estimates.

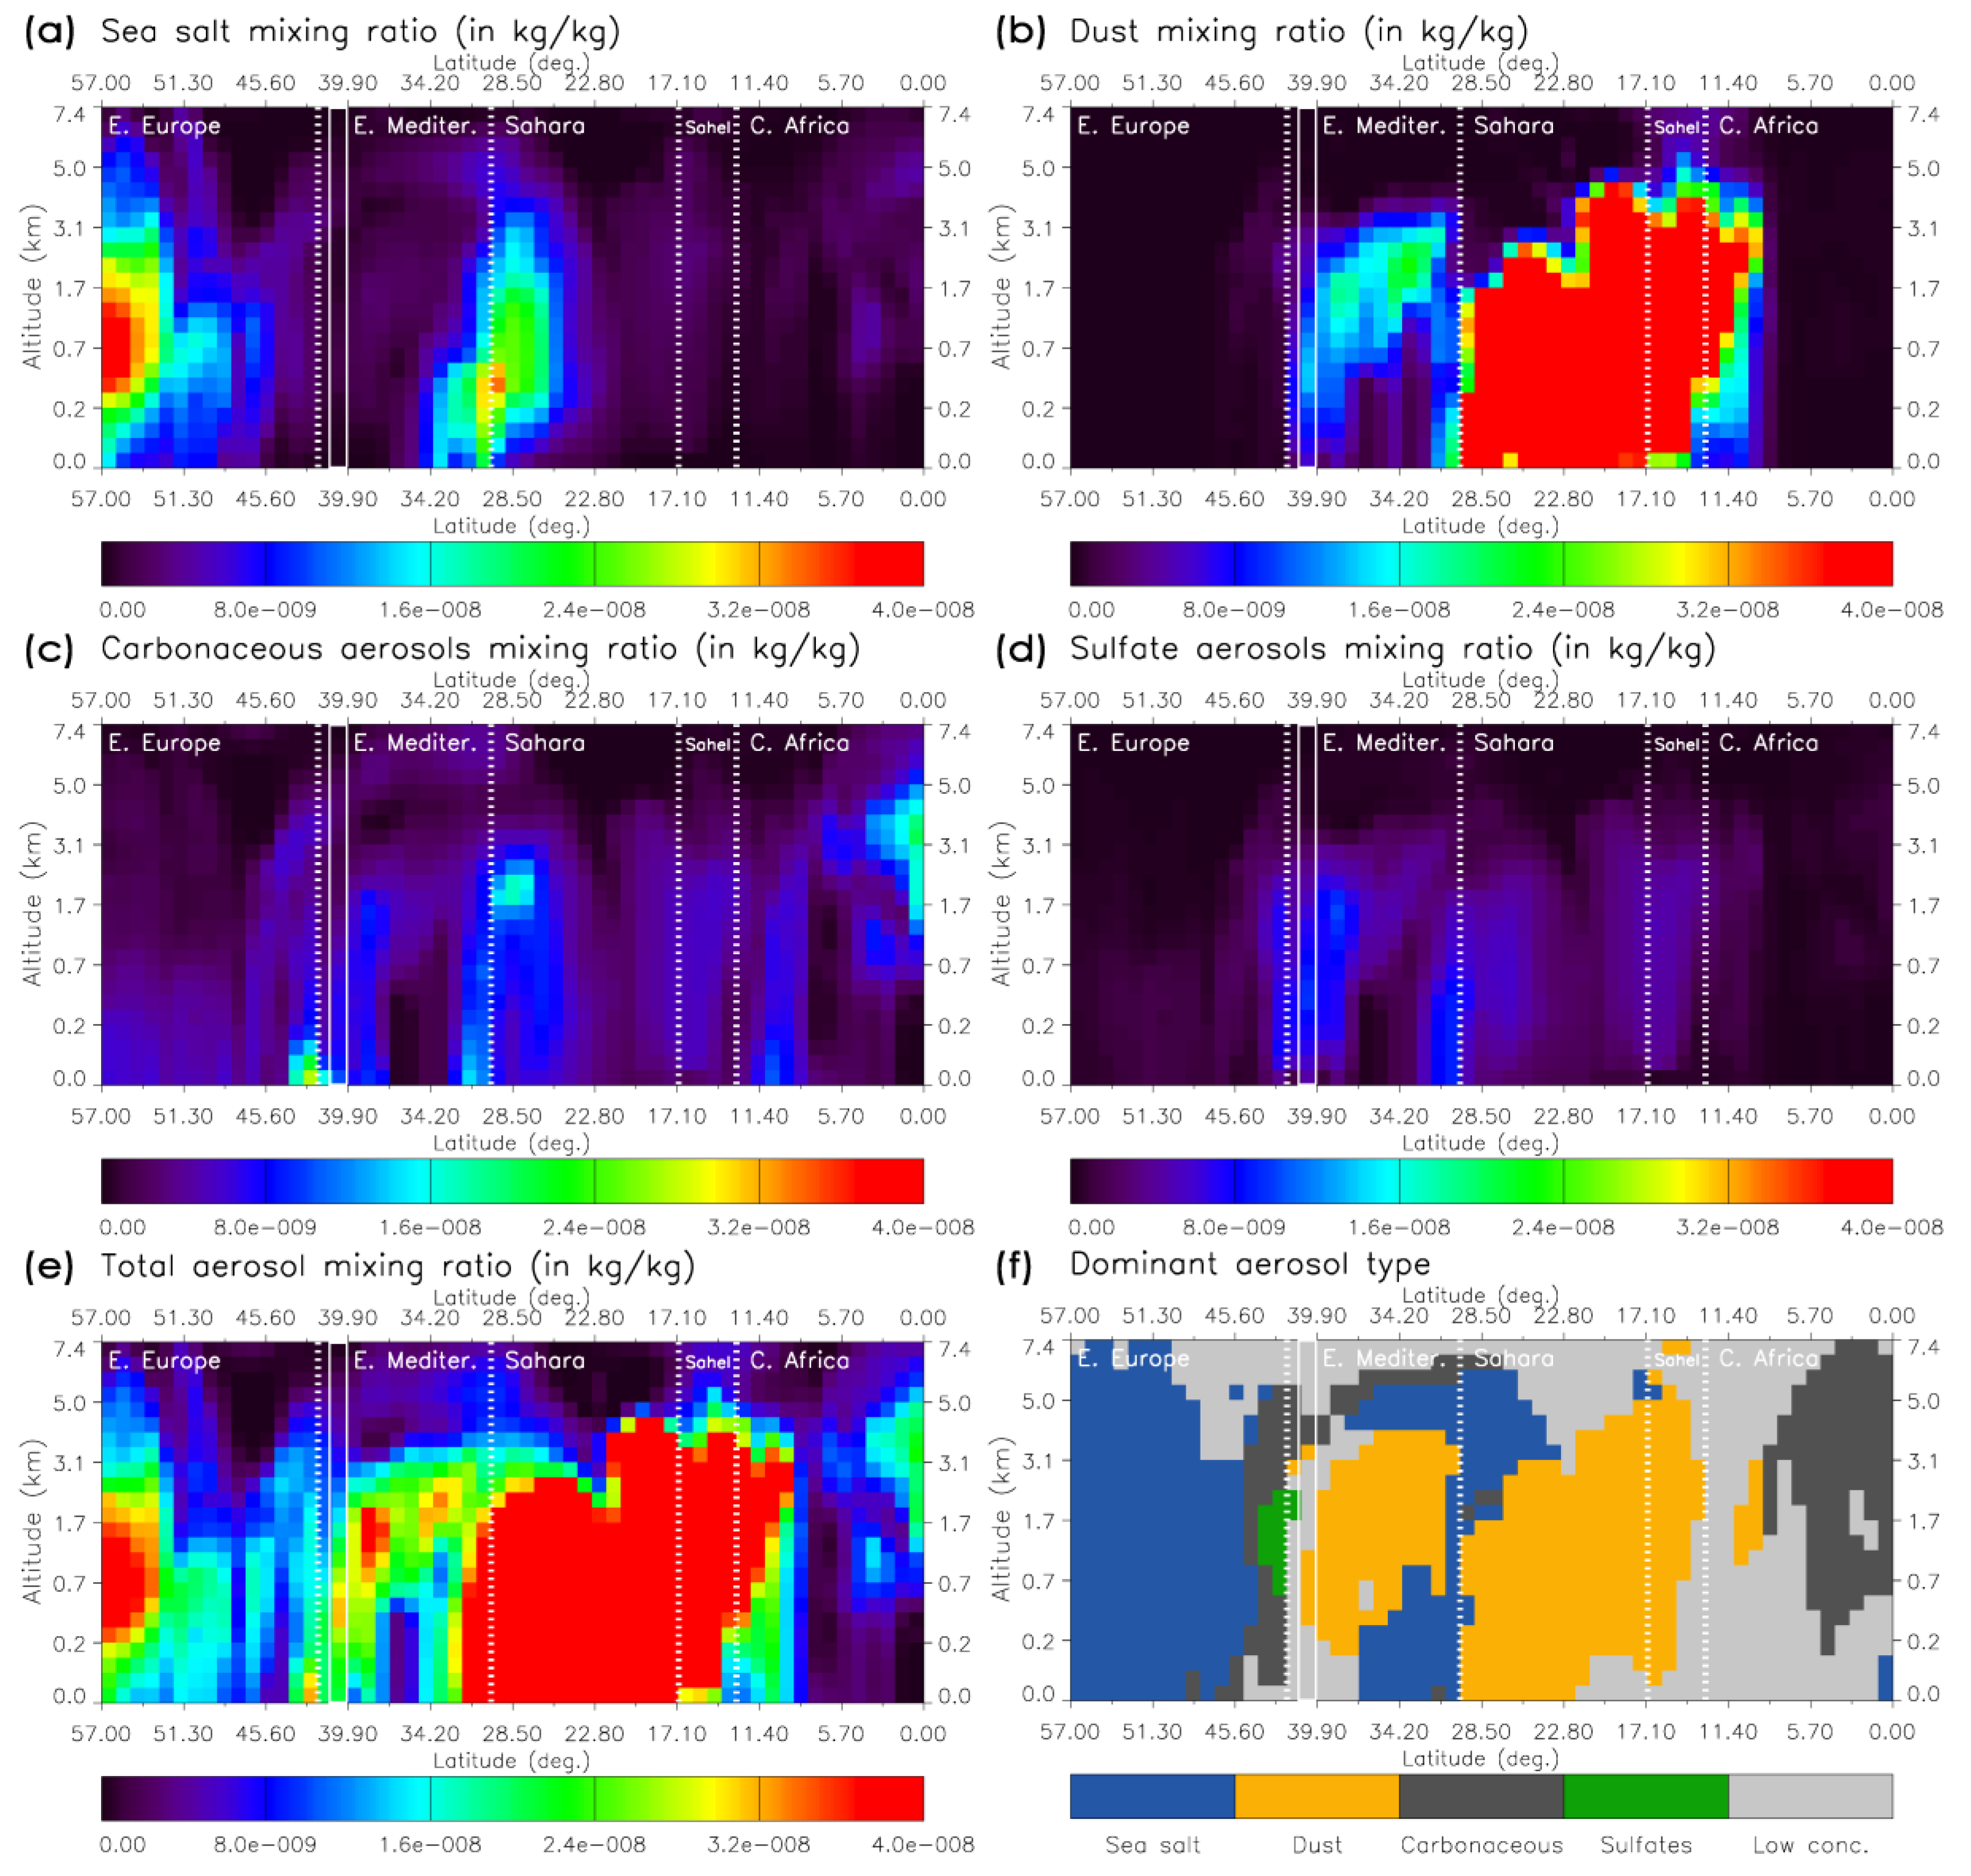
2.1.4. CAMS Reanalysis

Aerosol mass mixing ratio data from the Copernicus Atmosphere Monitoring Service (CAMS) reanalysis product [48] are used to support our analysis. The CAMS reanalysis includes 3-dimensional fields of both chemical species and aerosols for the time period from 2003 to 2016. It is based on European Centre for Medium-Range Weather Forecasts (ECMWF) Integrated Forecast System (IFS) (CY42R1 release) and a 4D-Var data assimilation system [48,49,50]. Satellite retrievals of total column CO, tropospheric column NO2, aerosol optical depth, and total column, partial column, and profile ozone retrievals are assimilated. The emissions include the MACCity (MACC and CityZEN EU projects) anthropogenic emissions, the GFAS (Global Fire Assimilation System) fire emissions, the MEGAN (Model of Emissions of Gases and Aerosols from Nature) biogenic emissions, and several greenhouse gas emission datasets (Inness et al., [48] and references therein). Online parameterizations are used to calculate sea salt and dust surface fluxes using as input surface wind speed and other factors [51,52]. The CAMS reanalysis aerosol dataset includes five basic aerosol types: sea salt, dust, organic matter, black carbon, and sulfates. These are further subdivided into eleven aerosol types: three different size bins are used for sea salt particles (0.03–0.50, 0.50–5.00, and 5.0–20.0 μm) and dust (0.03–0.55, 0.55–0.90, and 0.9–20.0 μm), while organic matter and black carbon are differentiated into a hydrophilic and a hydrophobic mode. The data used here cover the time period from 8 to 10 September 2011, with a temporal resolution of three hours. The spatial resolution is approximately 80 km with 60 hybrid pressure levels (top level at 0.1 hPa). The data were obtained from ECMWF’s web repository (https://apps.ecmwf.int/data-catalogues/cams-reanalysis/?class=mc&expver=eac4) through the corresponding WebAPI.

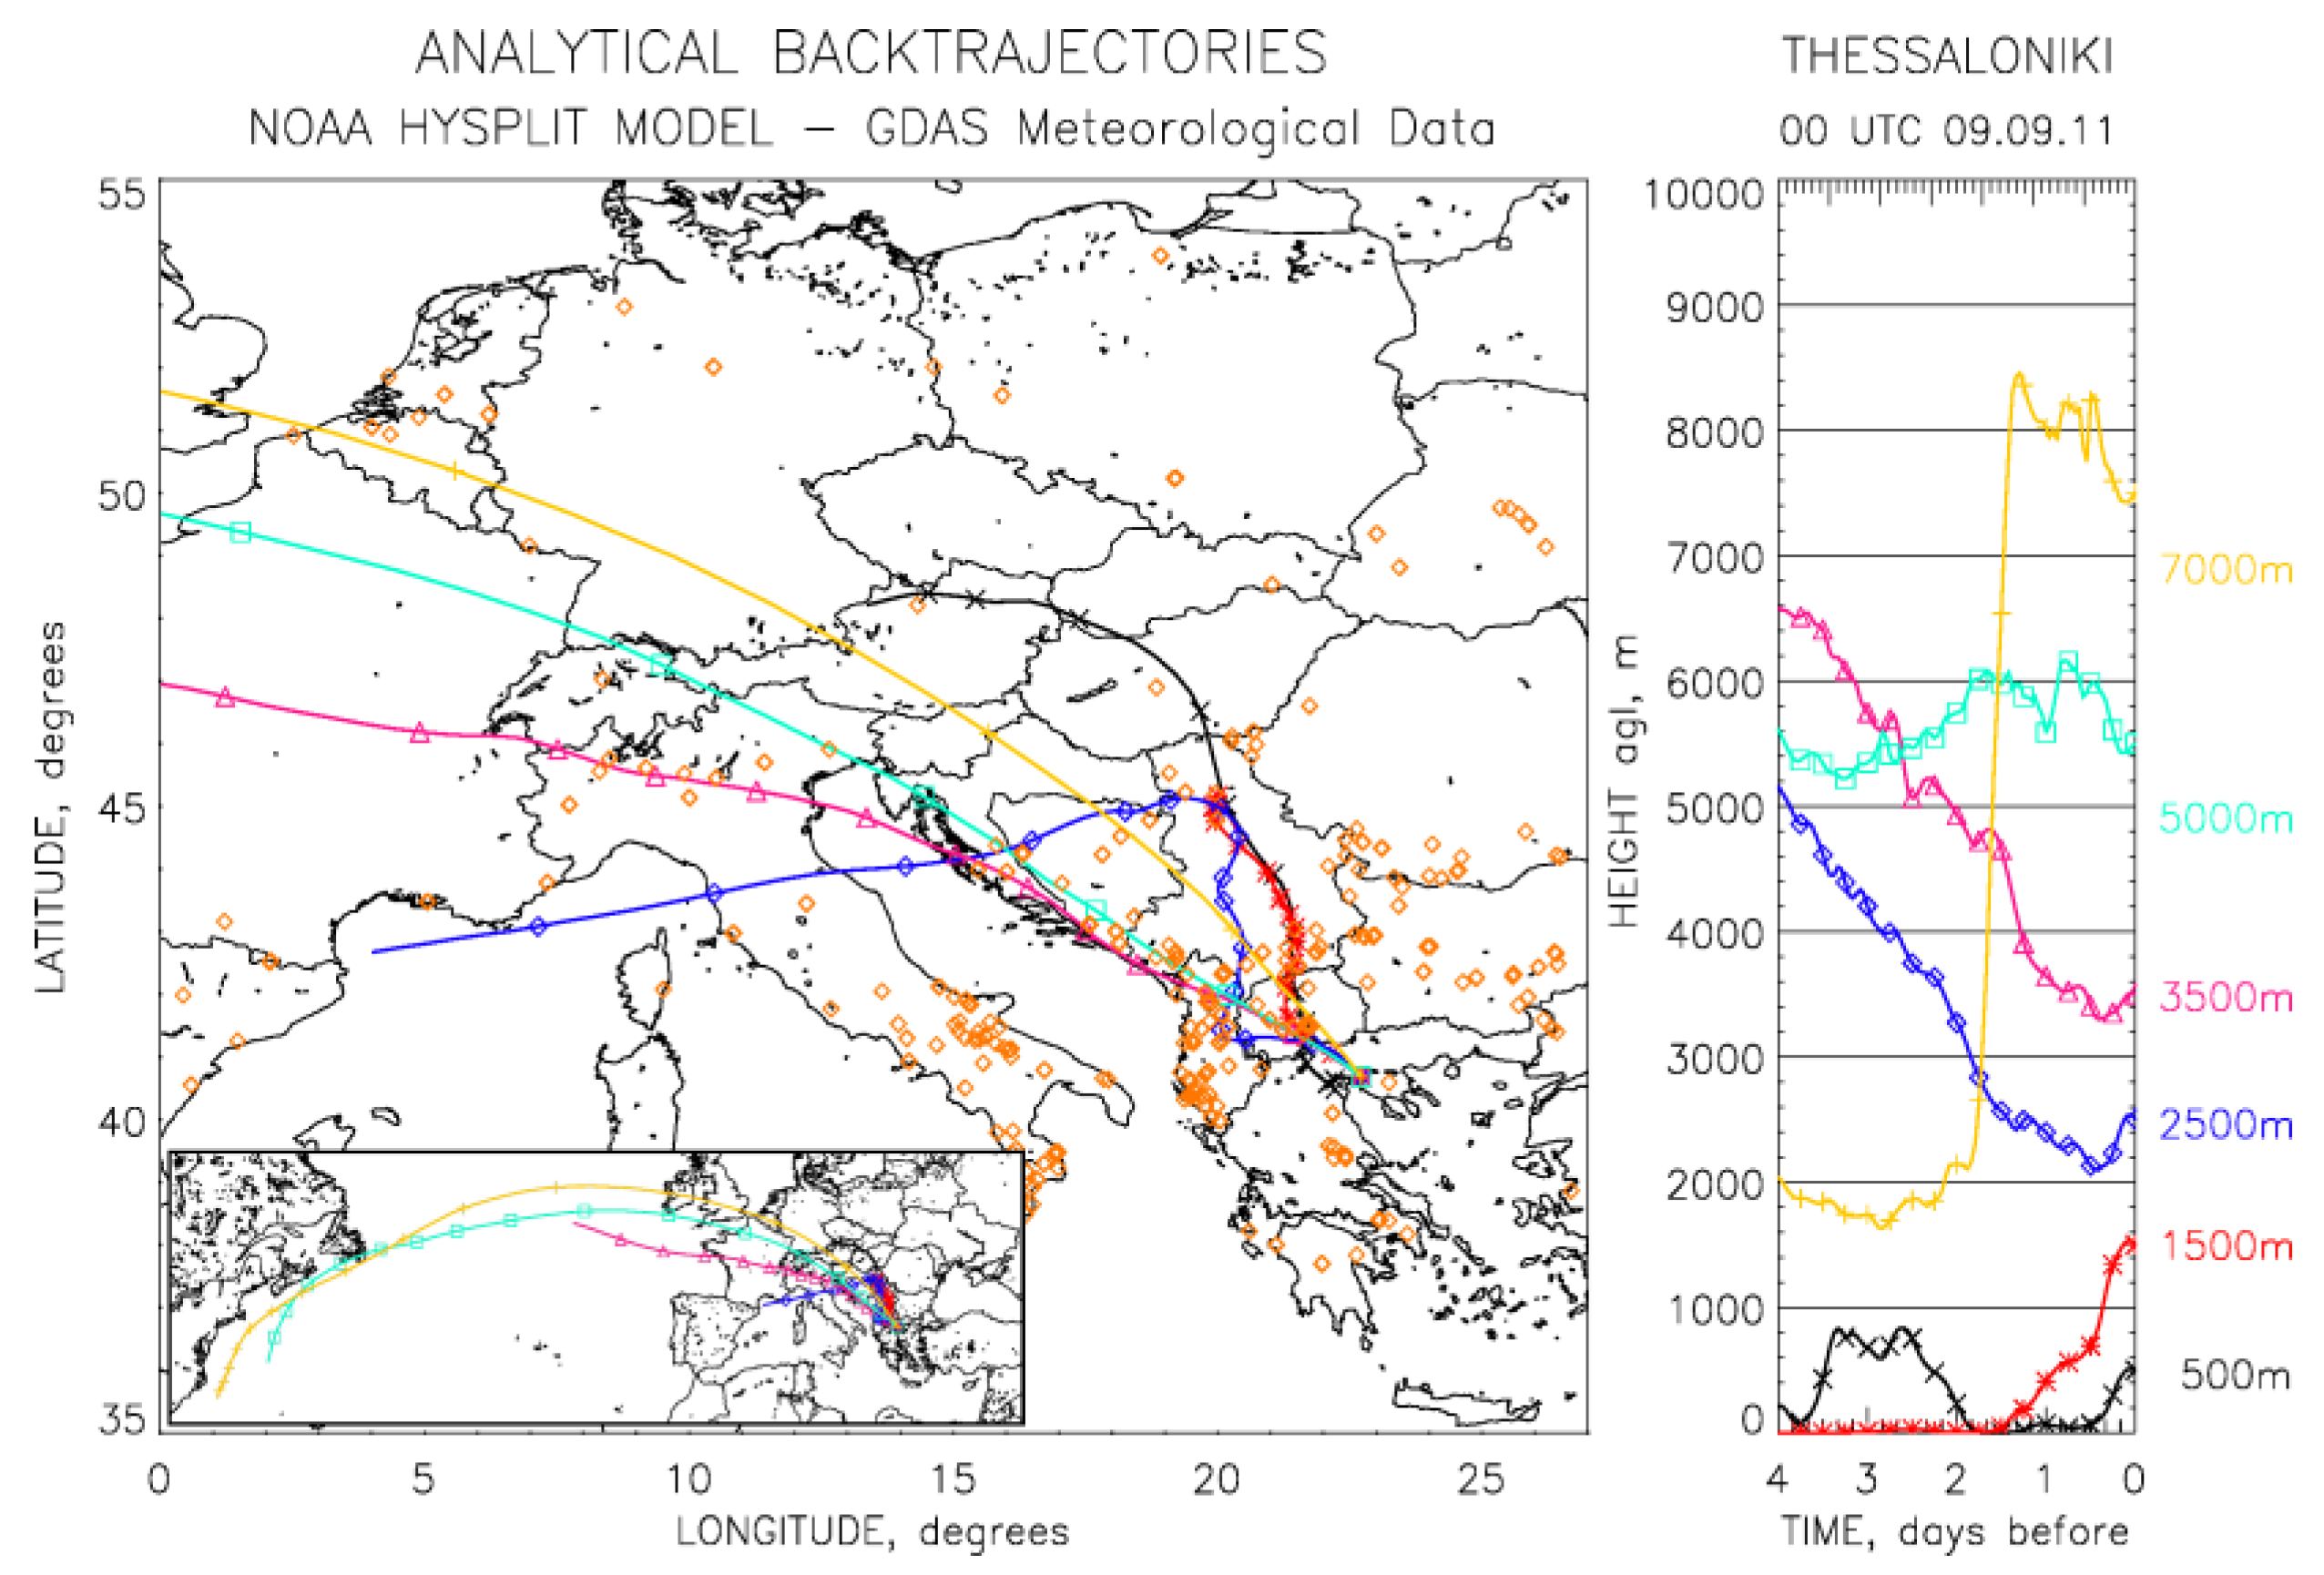
2.1.5. HYSPLIT Backward Trajectories

The Hybrid Single-Particle Lagrangian Integrated Trajectory (HYSPLIT) model [53], developed by NOAA’s Air Resources Laboratory, is used to calculate 96-h backward trajectories that end over Thessaloniki, Greece, at six arrival heights of 0.5, 1.5, 2.5, 3.5, 5.5, and 7.5 km above ground level at 00:00 UTC on 9 September 2011. The calculations are driven by Global Data Assimilation System (GDAS) reanalysis data with a resolution of 1° × 1°.

2.1.6. FIRMS

Data from NASA’s Fire Information for Resource Management System (FIRMS) are utilized to investigate if the air masses arriving over Thessaloniki likely contained traces of biomass-burning smoke from active fires in the greater region. The fire location data as retrieved from MODIS spectral measurements [54] are available at a 1 km spatial resolution. The data used here are part of the Collection 6 MCD14ML dataset and cover the period from 5 to 9 September 2011.

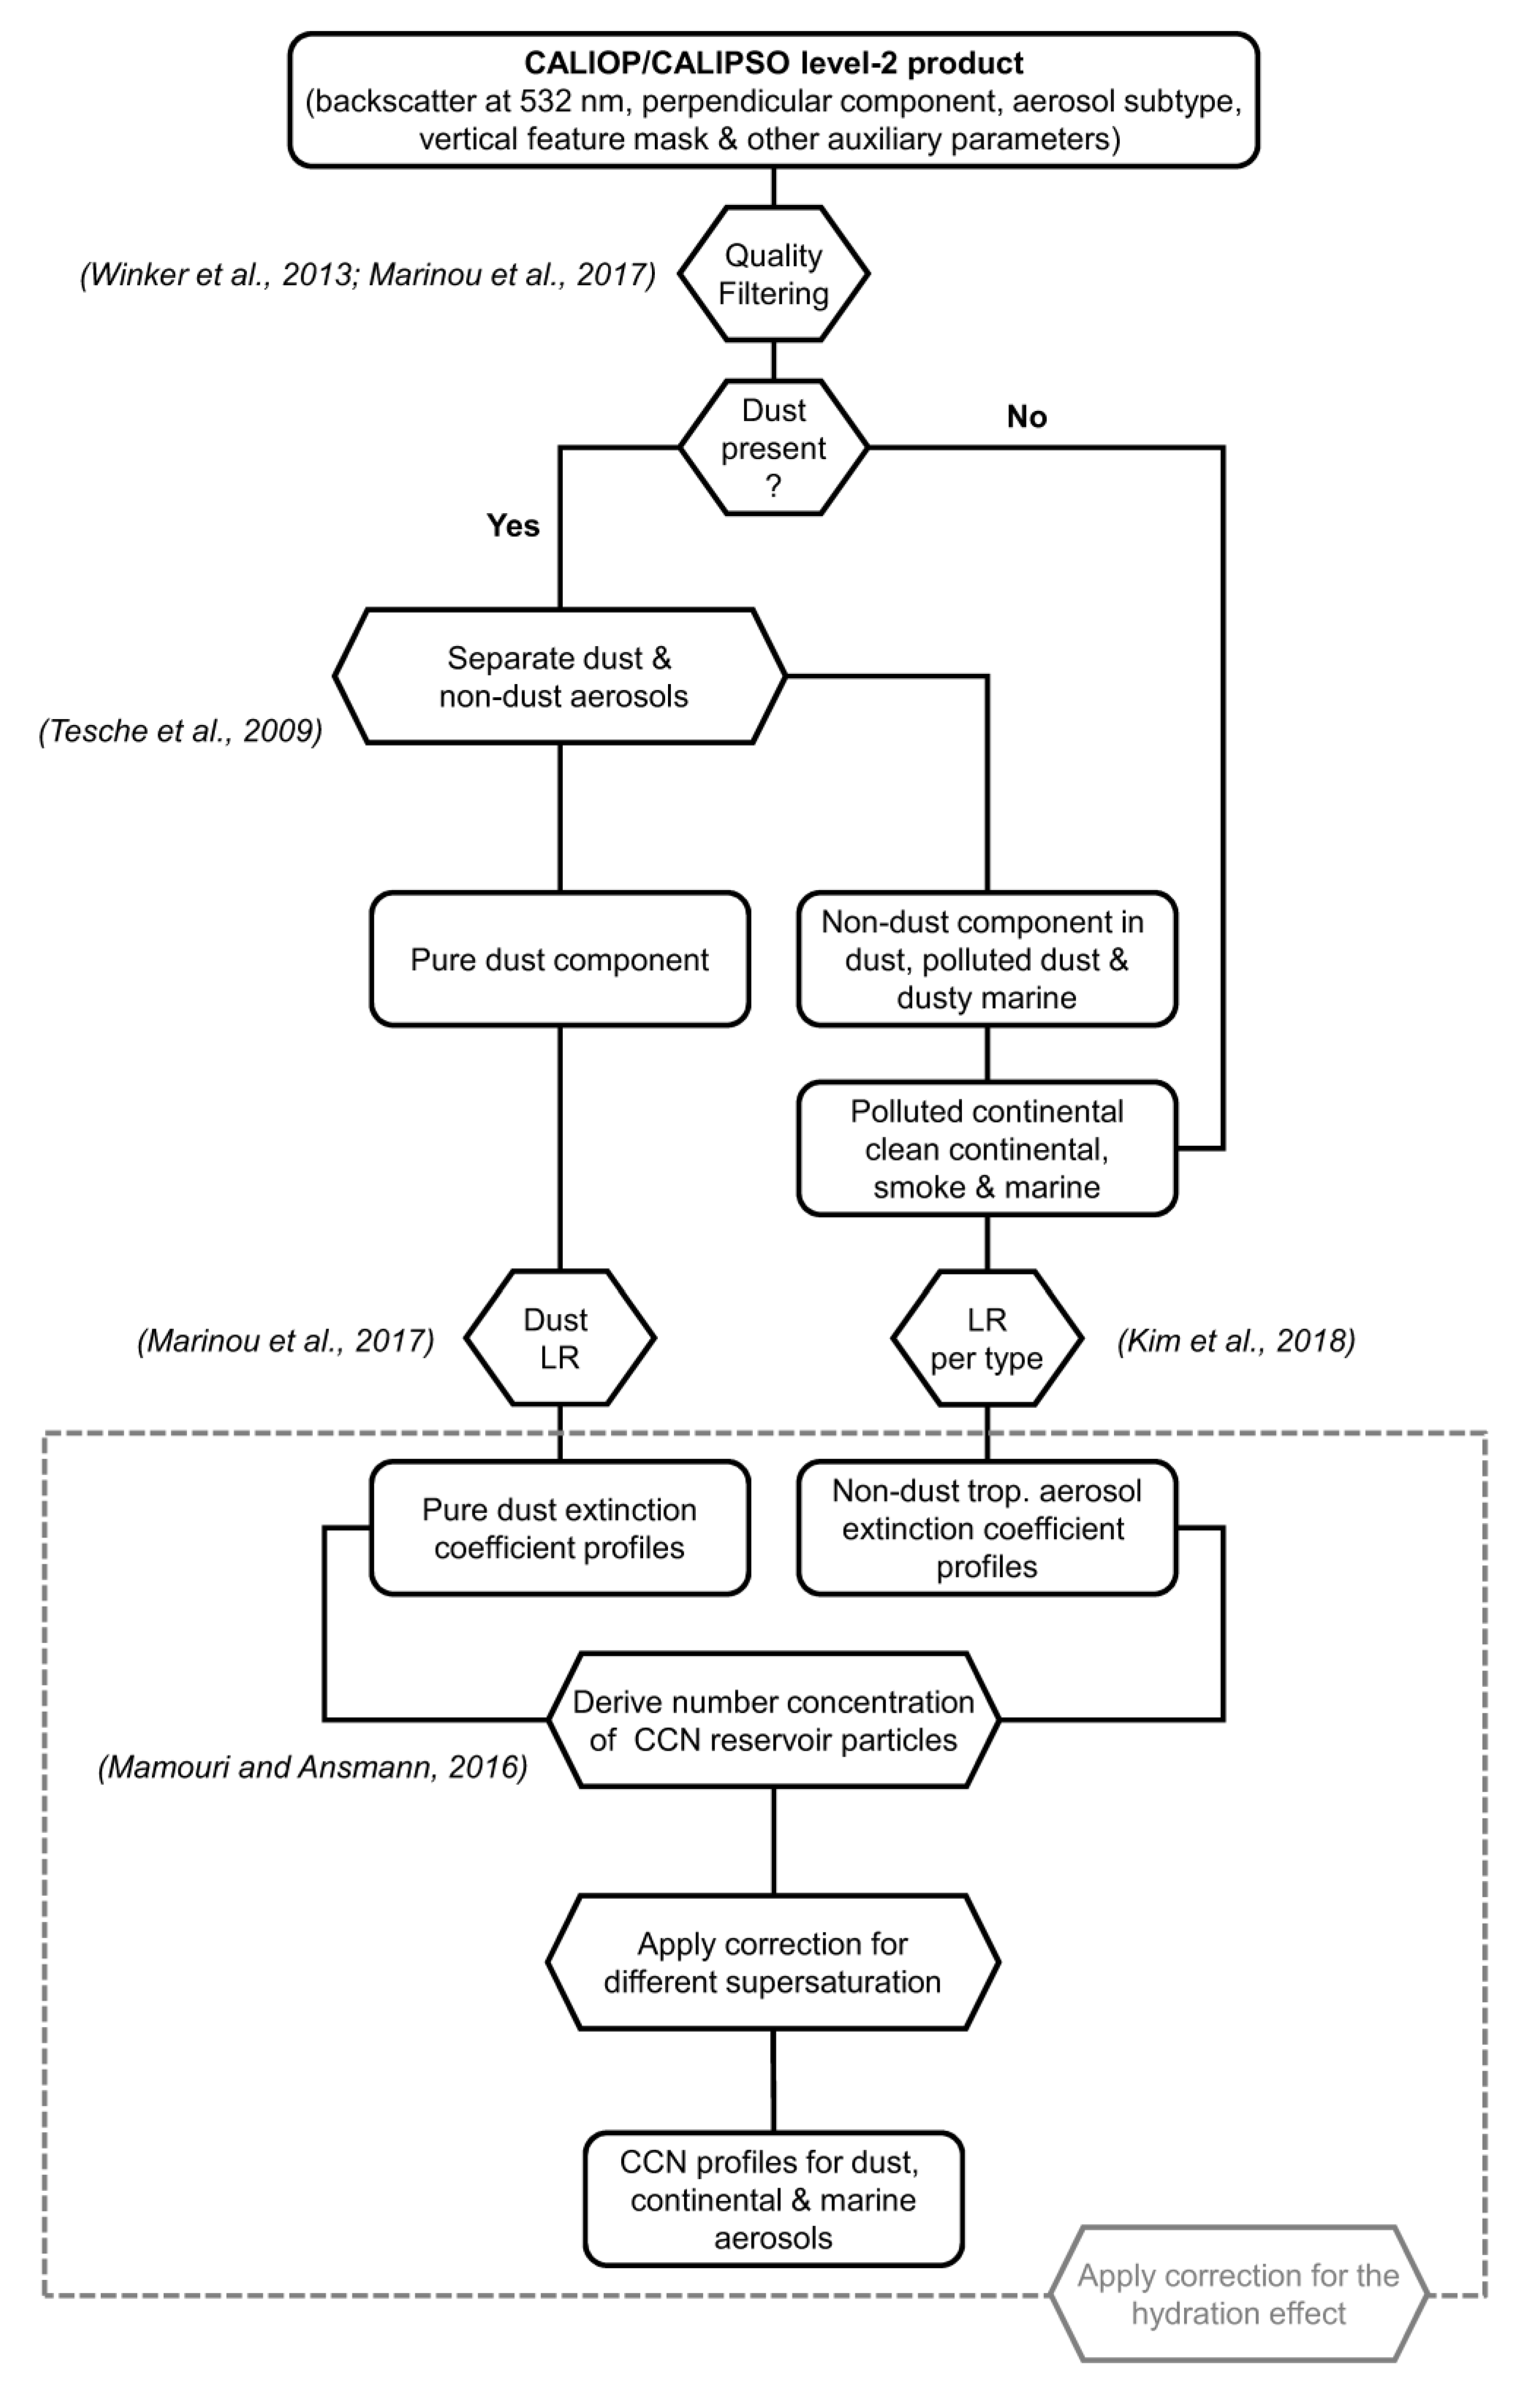
2.2. Methodology—CCN Estimates

Prior to estimating CCN concentrations, the CALIPSO level-2 data are separated according to the contributions of dust and non-dust aerosols [55,56,57,58,59,60]. Specifically, the pure-dust-separation methodology used here was developed within the framework of the EARLINET-ESA LIVAS (LIdar climatology of Vertical Aerosol Structure for space-based lidar simulation studies) research project [61]. This method obtains an improved typing compared to the standard CALIPSO product [57,58]. An overview of the workflow for obtaining CCN concentration profiles from CALIPSO measurements is shown in detail in Figure 1.
First of all, data quality control filters are applied, following Winker et al. [62] and Marinou et al. [58]. The pure dust separation is applied only when the CALIPSO aerosol classification indicates the presence of dust, polluted dust, or dusty marine aerosols. The pure dust backscatter component (β1) is calculated from the measured particle linear depolarization ratio (δp), the theoretical depolarization ratio of the pure dust (δ1), and non-dust components (δ2), and the total backscatter (βt) of the aerosol layer [55] as
β 1 = β t ( δ p δ 2 ) ( 1 + δ 1 ) ( δ 1 δ 2 ) ( 1 + δ p )
where values of δp < 0.31 are assumed to represent a mixture of pure dust and non-dust aerosol components. Values of 0.31 ± 0.04 and 0.05 ± 0.03 are used for δ1 and δ2, respectively [55,63,64]. The pure dust backscatter coefficient profile is multiplied by an appropriate Saharan dust lidar ratio (LR) of 55 ± 11 sr to calculate the corresponding pure dust extinction coefficients at 532 nm [58].
The non-dust mixture backscatter coefficients (βt–β1) are dedicated to marine aerosols and polluted continental aerosol, depending on the CALIPSO classification, as dusty marine and polluted dust, respectively. Non-dust aerosol subtypes are considered as provided in the CALIPSO aerosol typing. As in this work we are interested in tropospheric aerosols which act as CCN, we focus on the tropospheric aerosol subtypes (marine, polluted continental/smoke, and clean continental), and the elevated smoke, which is also frequently observed in the lower troposphere. The LRs used to convert the respective backscatter coefficients to extinction coefficients are given in Kim et al. [36].
Here, we consider three major aerosol types: mineral dust, continental aerosol (polluted continental/smoke, clean continental, and elevated smoke), and marine aerosol. The corresponding CCN concentrations are obtained following recently suggested parameterizations (Equations (2)–(5)). The method followed for the CCN estimates was originally suggested by Mamouri and Ansmann [27] for ground-based lidar measurements in Cyprus, Eastern Mediterranean, and was recently applied over areas with diverse aerosol typologies, e.g., Barbados, Caribbean [29], Germany, Central Europe [30,65] and Tajikistan, Central Asia [31]. First, using the extinction coefficients (σd, σc and σm) for the three major aerosol types (dust, continental and marine), we calculated profiles with particle number concentrations (n100,d,dry, n50,c,dry and n50,m,dry), following Equations (2)–(4). ni,j,dry expresses the concentration of dry particles with a radius larger than i nm, which is the reservoir of favourable CCN for aerosol type j. For dust (index d), i equals to 100 nm, while for continental (index c) and marine aerosols (index m), i equals to 50 nm.
n 100 , d , dry = c 100 , d σ d x d ( z )
n 50 , c , dry = c 60 , c σ c x c ( z )
n 50 , m , dry = c 100 , m σ m x m ( z )
Following Table 3 in Mamouri and Ansmann [27], c100,d was set to 6.5 ± 1.8 Mm cm−3 (based on measurements at Cape Verde and Barbados), c60,c to 25.3 ± 3.3 Mm cm−3 (Germany), c100,m to 7.2 ± 3.7 Mm cm−3 (Barbados), xd to 0.70 ± 0.05 (Cape Verde and Barbados), xc to 0.94 ± 0.03 (Germany), and xm to 0.85 ± 0.03 (Barbados). Despite that the CCN calculation method used here is the same with Mamouri and Ansmann [27] their aerosol types (dust, continental and marine) were identified in a different way. They also used the particle linear depolarization ratio to separate between dust and non-dust particles, but they separated non-dust particles into a continental and marine component, using a combination of backward trajectory analysis, Ångström exponent information and marine backscatter estimates.
In fact, the particle number concentrations in Equations (2)–(4) express the CCN concentration values (nCCN) for the different aerosol types for a supersaturation (ss) of 0.15%. For higher supersaturation, smaller particles may also act as CCN (i.e., particles with radius larger than 40 and 30 nm at supersaturations of 0.25% and 0.40%, respectively). The n30,dry/n50,dry and n40,dry/n50,dry ratios are estimated at 1.7 ± 0.8 and 1.35 ± 0.7 by Mamouri and Ansmann [27], while similar values are found, e.g., in Ji and Shaw [66] and Shinozuka et al. [21]. These ratios can be used as an enhancement factor fss in a generalized CCN equation
n C C N j = f s s n i , j , dry
where fss is equal to 1.0, 1.35, and 1.7 for supersaturations of 0.15%, 0.25%, and 0.40%, respectively. The application of these enhancement factors may be more complex for natural aerosols [67]. For dust particles with soluble coatings at a supersaturation of 0.15–0.20%, even particles with a dry radius up to 50 nm may act as CCN. This would lead to four times larger CCN concentrations than the ones estimated using n100,d,dry. The uncertainties introduced by the chemical composition of aerosols (unknown supersaturation and minimum radius of particles that act as CCN) are expected to lead to an overall uncertainty of a factor of two to three in the CCN estimates [21,27]. Here, we report CCN estimates for a supersaturation of 0.15%. The corresponding measurement uncertainties are calculated using error propagation, and are much lower than the overall uncertainty discussed above.

3. Results and Discussion

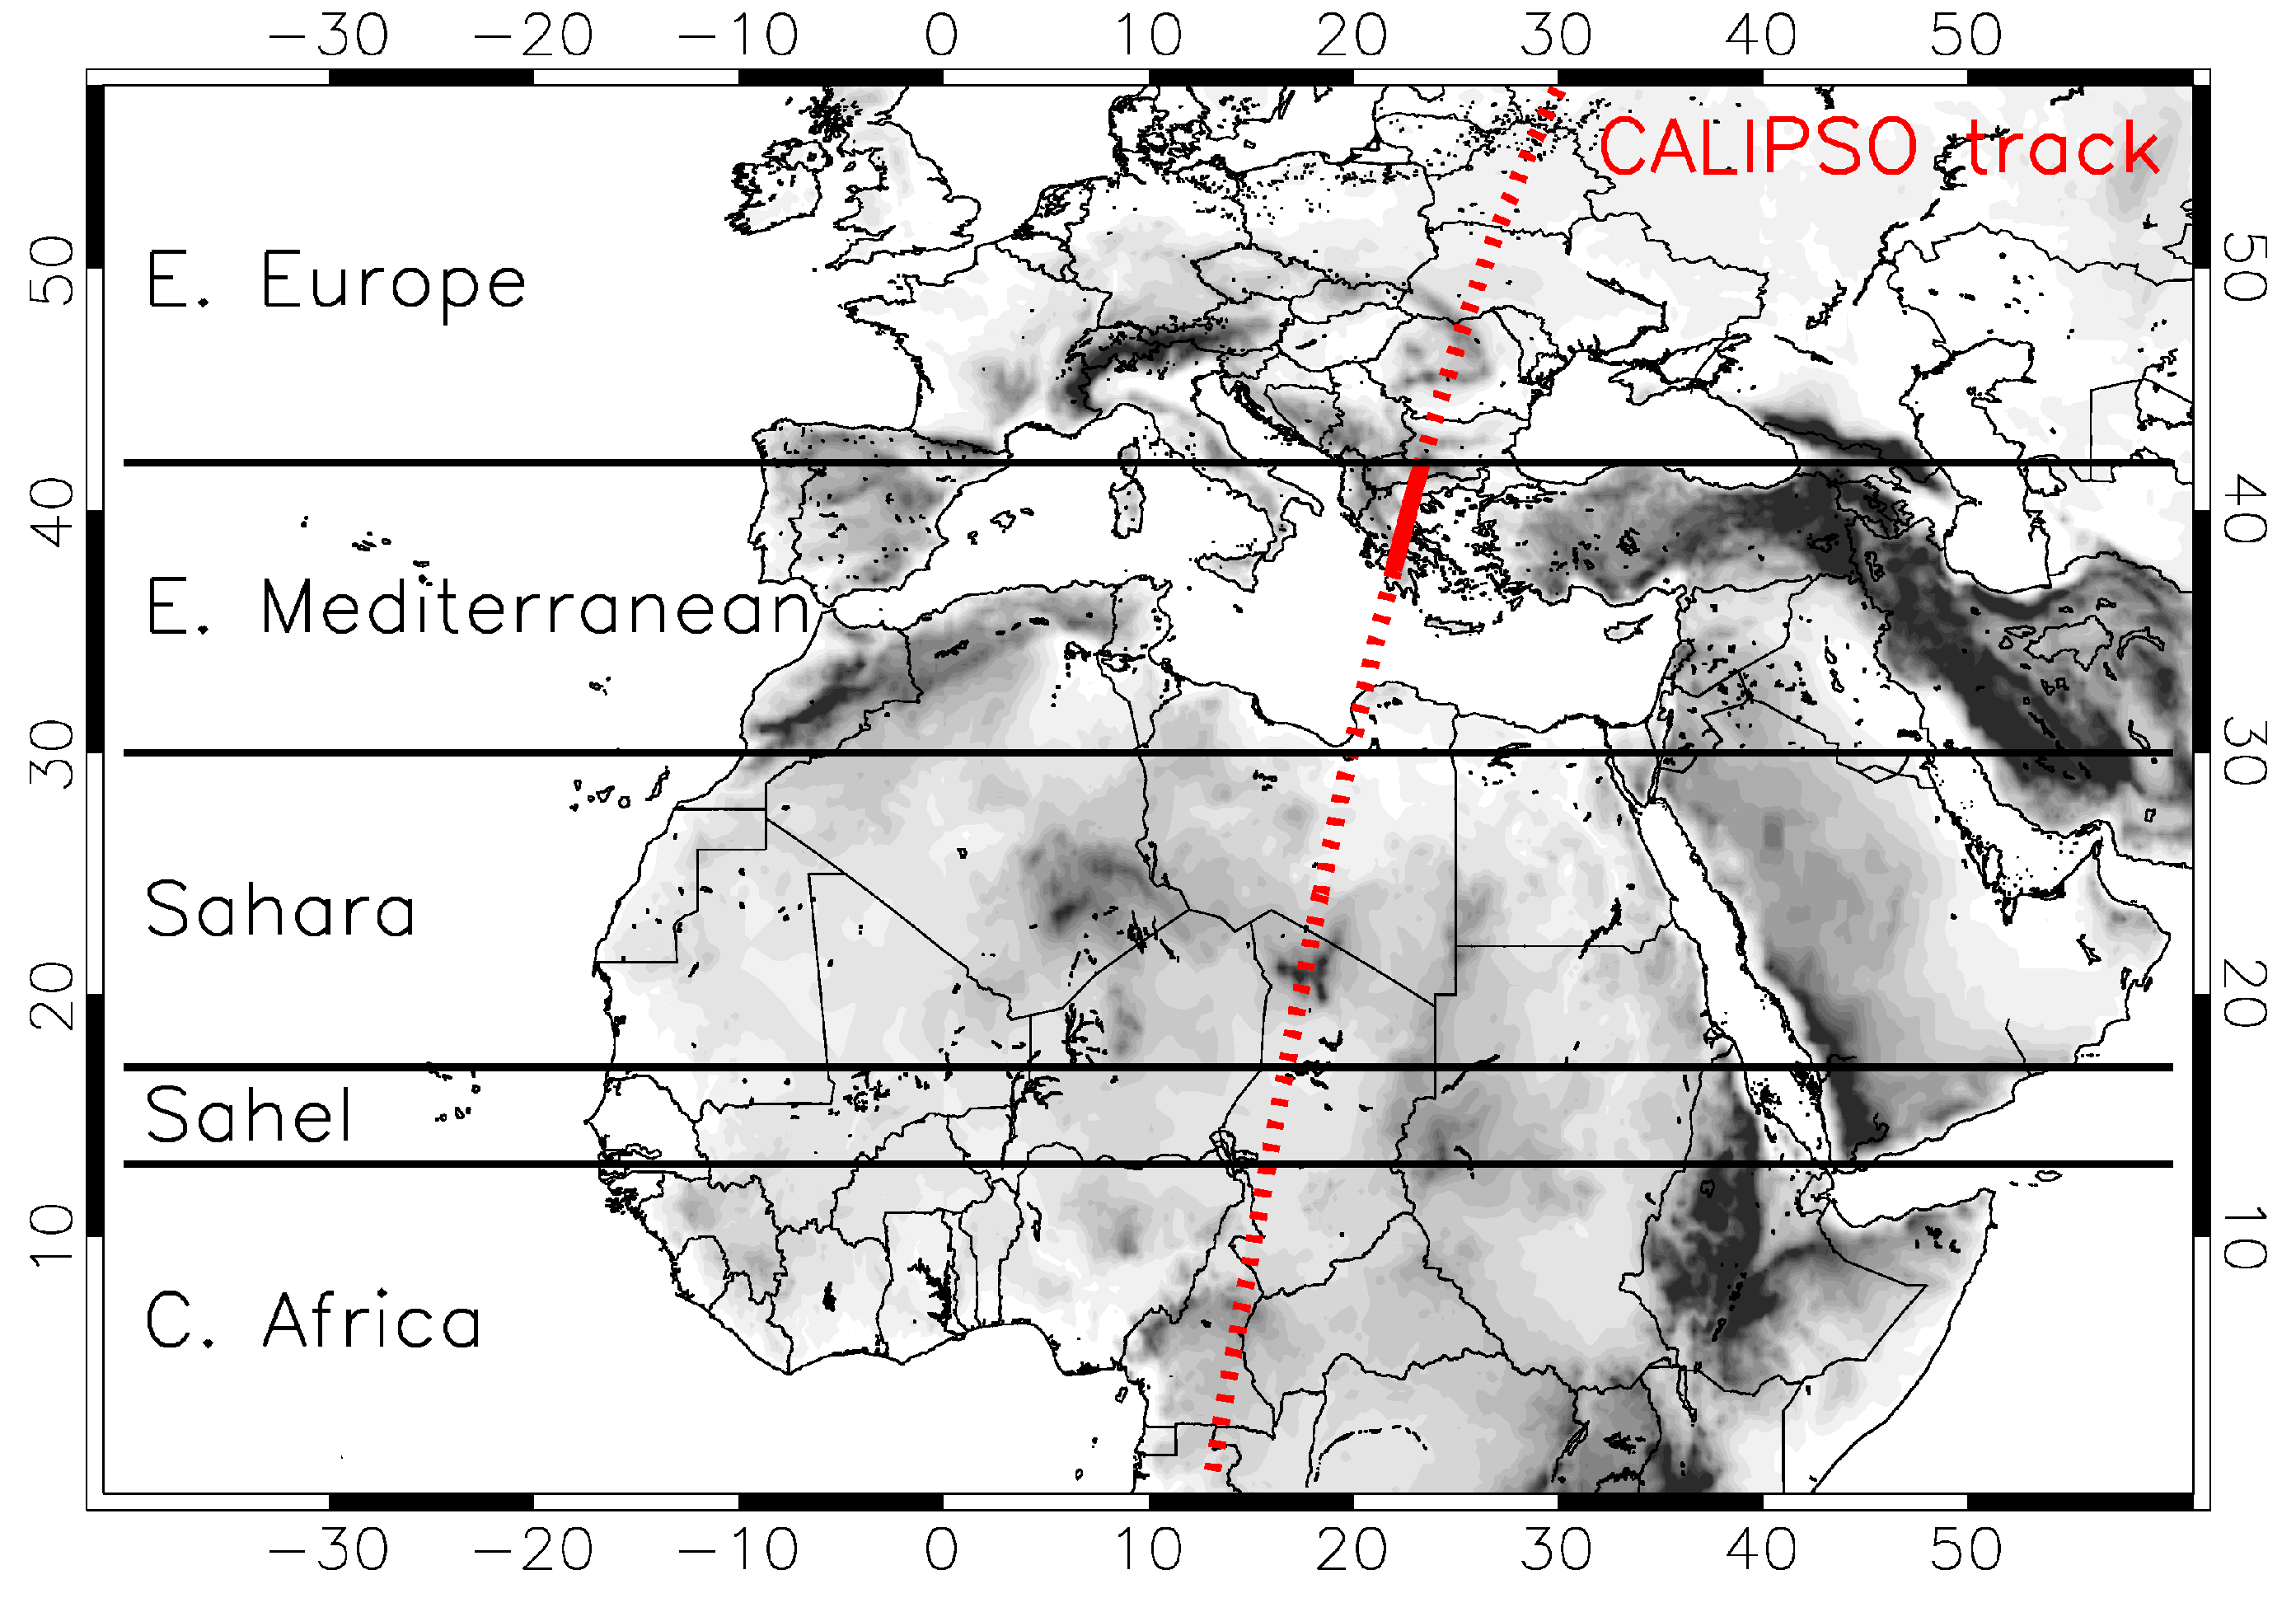
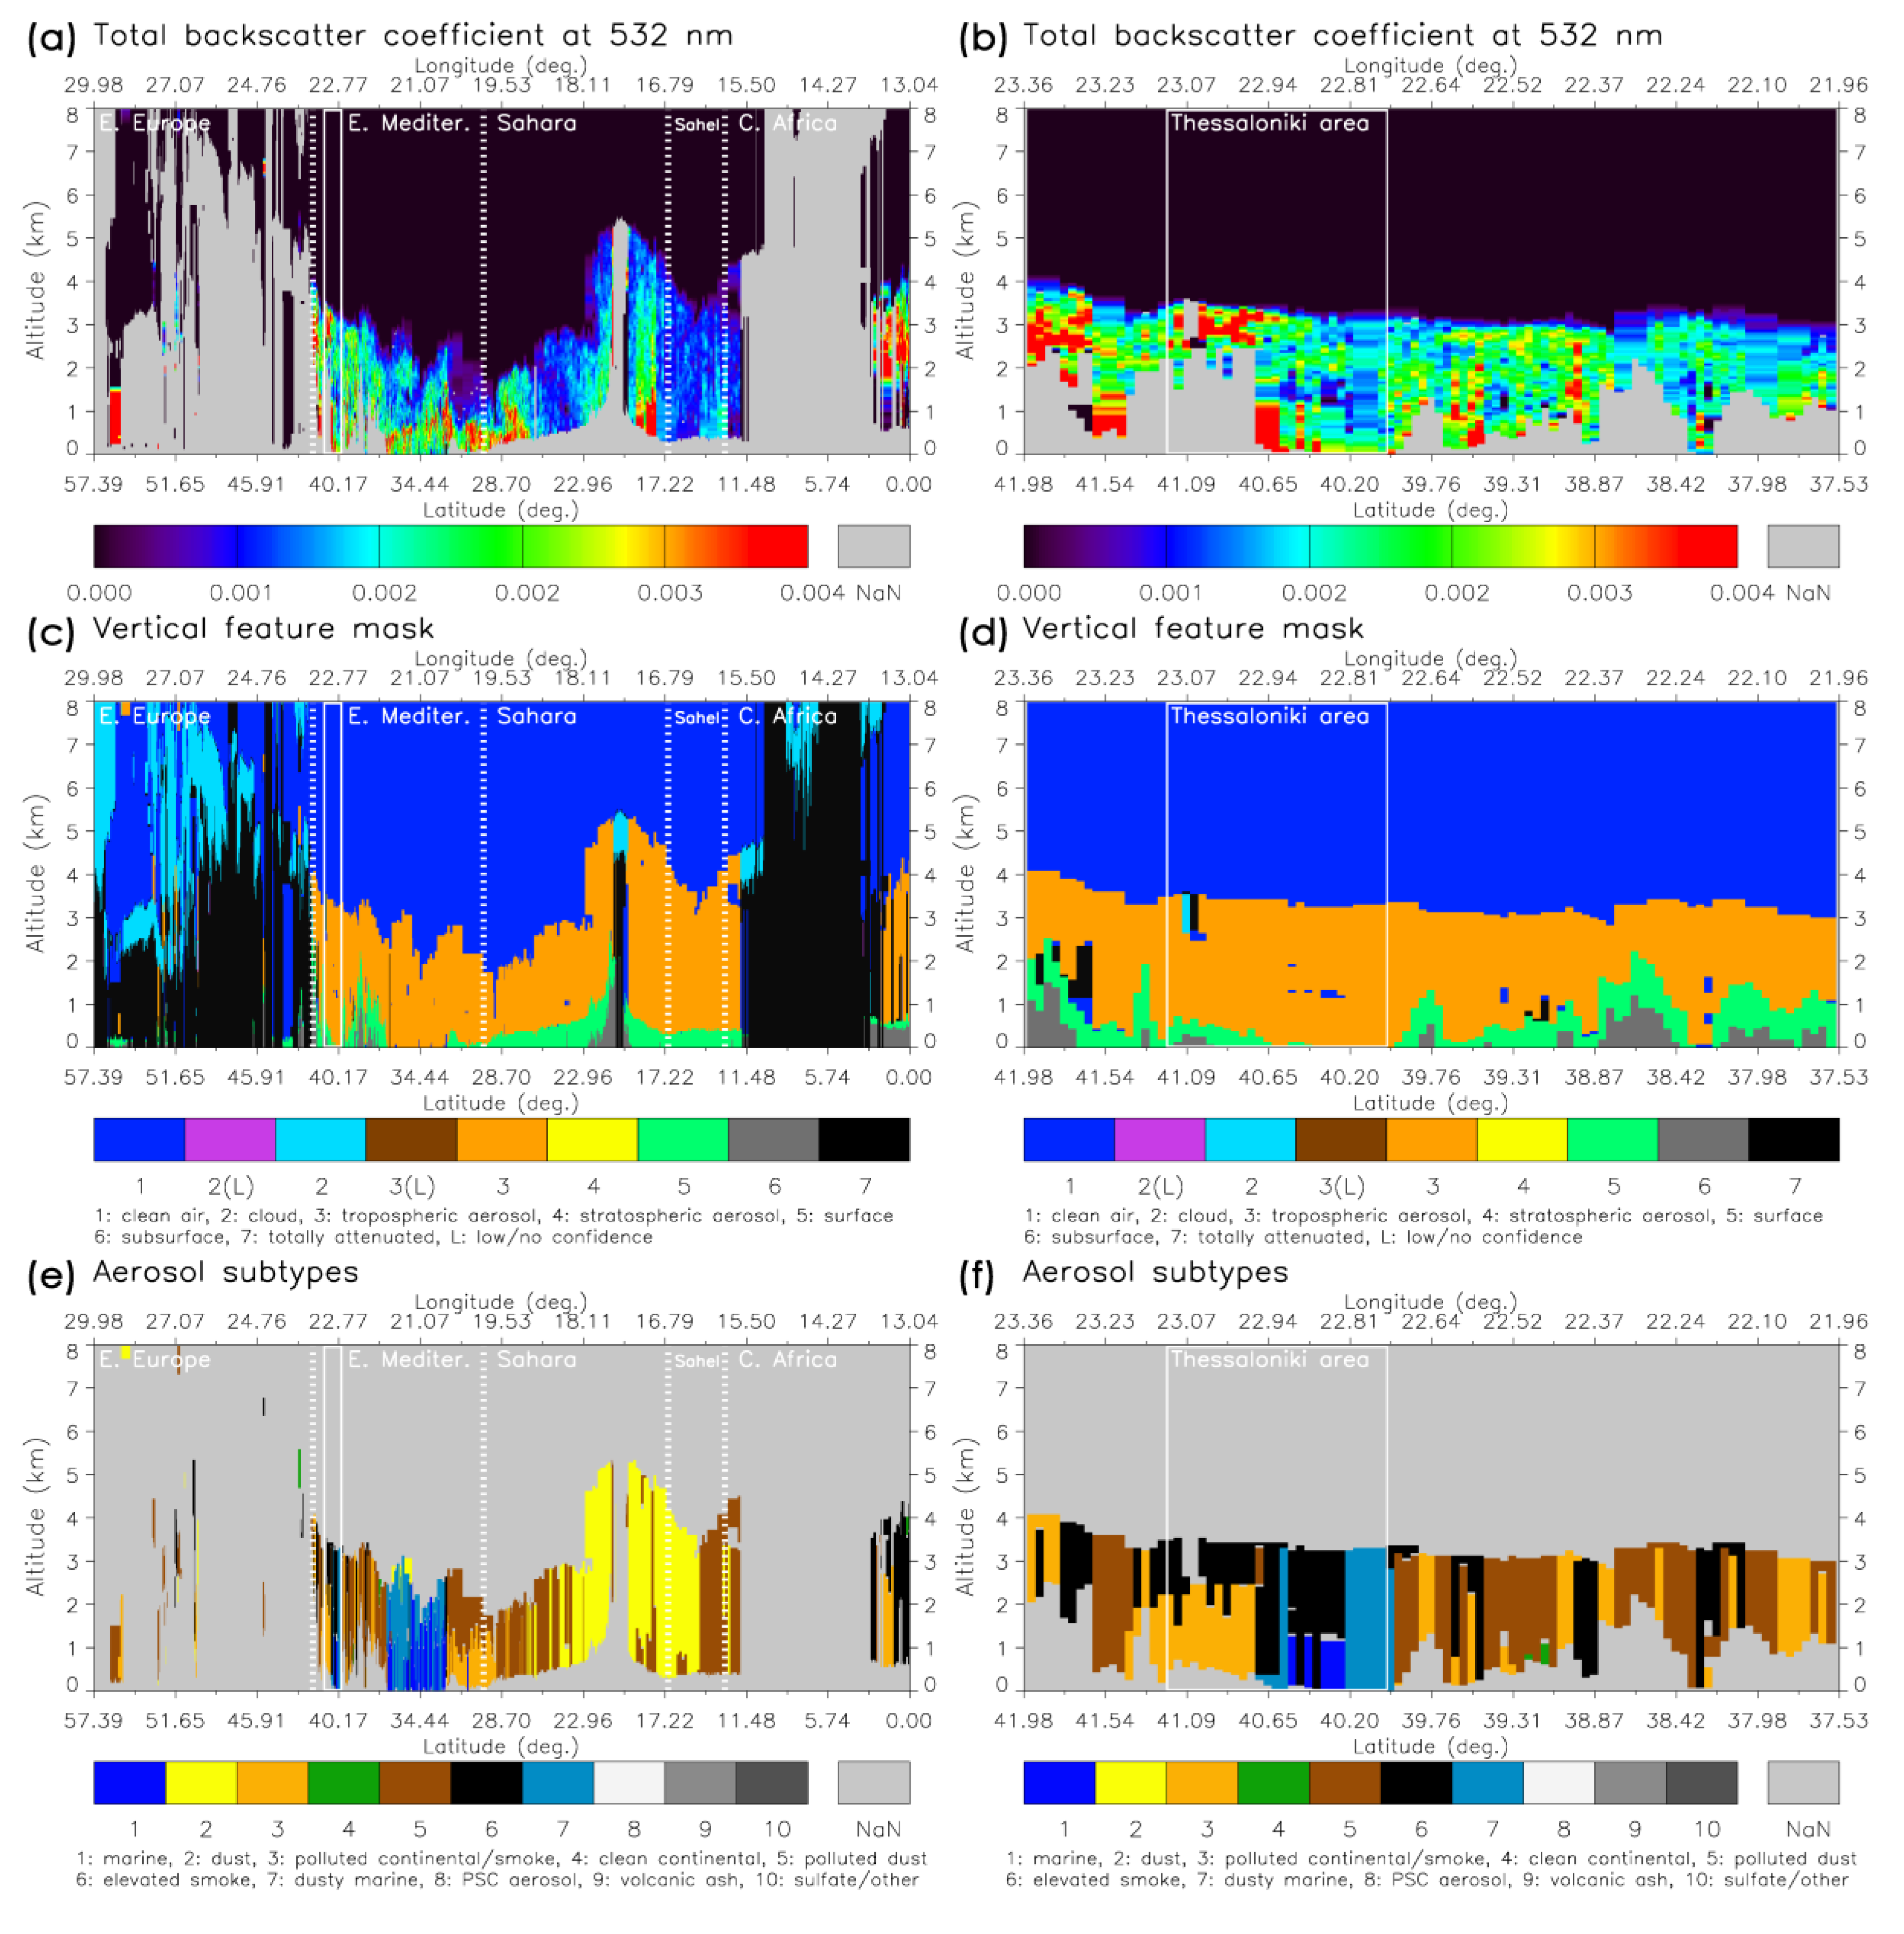
3.1. CALIPSO Aerosol Typing

For the scope of this work, a CALIPSO track for 9 September 2011 starting at 00:31 UTC was utilized. This track spans from ~57° N to 0° N, and passes over Thessaloniki, Greece (around 00:45 UTC) where the ACEMED campaign took place. The CALIPSO track (dotted red line) can be seen in Figure 2, along with the different areas of interest that crosses. To have a closer look into the greater Thessaloniki area, a part of the track was examined separately (solid red line in Figure 2).
The backscatter coefficients at 532 nm, along with the corresponding vertical feature mask and aerosol subtypes, can be seen in Figure 3. Unfortunately, over Eastern Europe and Central Africa there are only a few valid measurements (Figure 3a), mostly due to cloudiness, as shown in Figure 3c (the filtering applied on the data prior to the application of our pure dust separation algorithm allows only cloud free scenes). On the contrary, a strong aerosol signal is observed over the Eastern Mediterranean, the Sahara, and the Sahel region (Figure 3b). Mixed aerosols are found over the Eastern Mediterranean, while dusty marine and marine aerosols dominate over water. Over the North African coast (Libya), polluted continental/smoke and polluted dust aerosols prevail, while over the Balkan Peninsula (Greece-Bulgaria), the aerosol situation includes a mixture of polluted continental/smoke, polluted dust, and elevated smoke. Over the Sahara, dust prevails and shifts to polluted dust going south towards the Sahel. Over the Thessaloniki area, elevated smoke and dust dominate over land and elevated smoke, dusty marine, and marine over the sea (coastline at 40.6° N).
Independent data from the CAMS reanalysis are utilized to qualitatively evaluate the CALIPSO aerosol typing. The CAMS provides mass mixing ratio vertical cross sections for different aerosol types such as sea salt, dust, carbonaceous (organic matter and black carbon), and sulfates, along the CALIPSO track. The mass mixing ratio for these aerosol types together and the dominant aerosol type by means of mass mixing ratio are shown in Figure 4. In line with CALIPSO, a mixture of sea salt, dust, and carbonaceous aerosols is found over the Eastern Mediterranean; dust dominates over the Sahara and the Sahel, and carbonaceous aerosols from biomass-burning activities prevail over Central Africa. Over Eastern Europe, where there are only a few CALIPSO observations, we see a mixture of carbonaceous and sulfates, while over ~45° N, sea salt dominates, probably due to transport from the North Sea. Over Thessaloniki, the CAMS shows a plume of carbonaceous aerosols over a layer of dust and sulfates. The presence of carbonaceous aerosols over Thessaloniki and the broader Balkan region is probably due to the existence of several fires in the area the days before. In Figure 5, we see the fire spots which were detected from MODIS/Terra and Aqua satellite sensors (NASA FIRMS) over the area, along with the HYSPLIT calculated 4-day back-trajectories ending over Thessaloniki at 00:00 UTC on 9 September 2011. Indeed, the air masses that arrived over the site had previously passed over locations with fires.

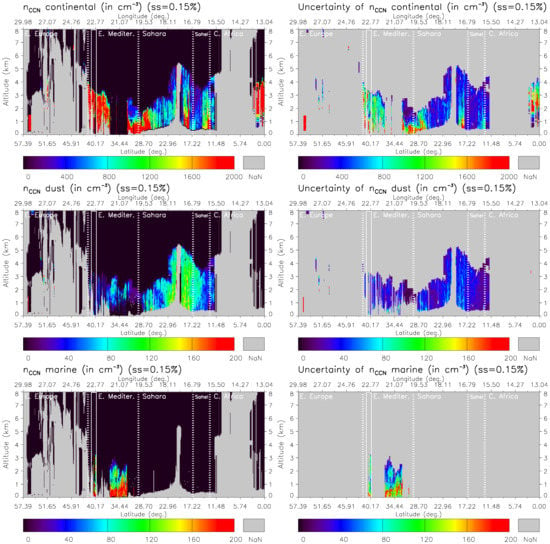
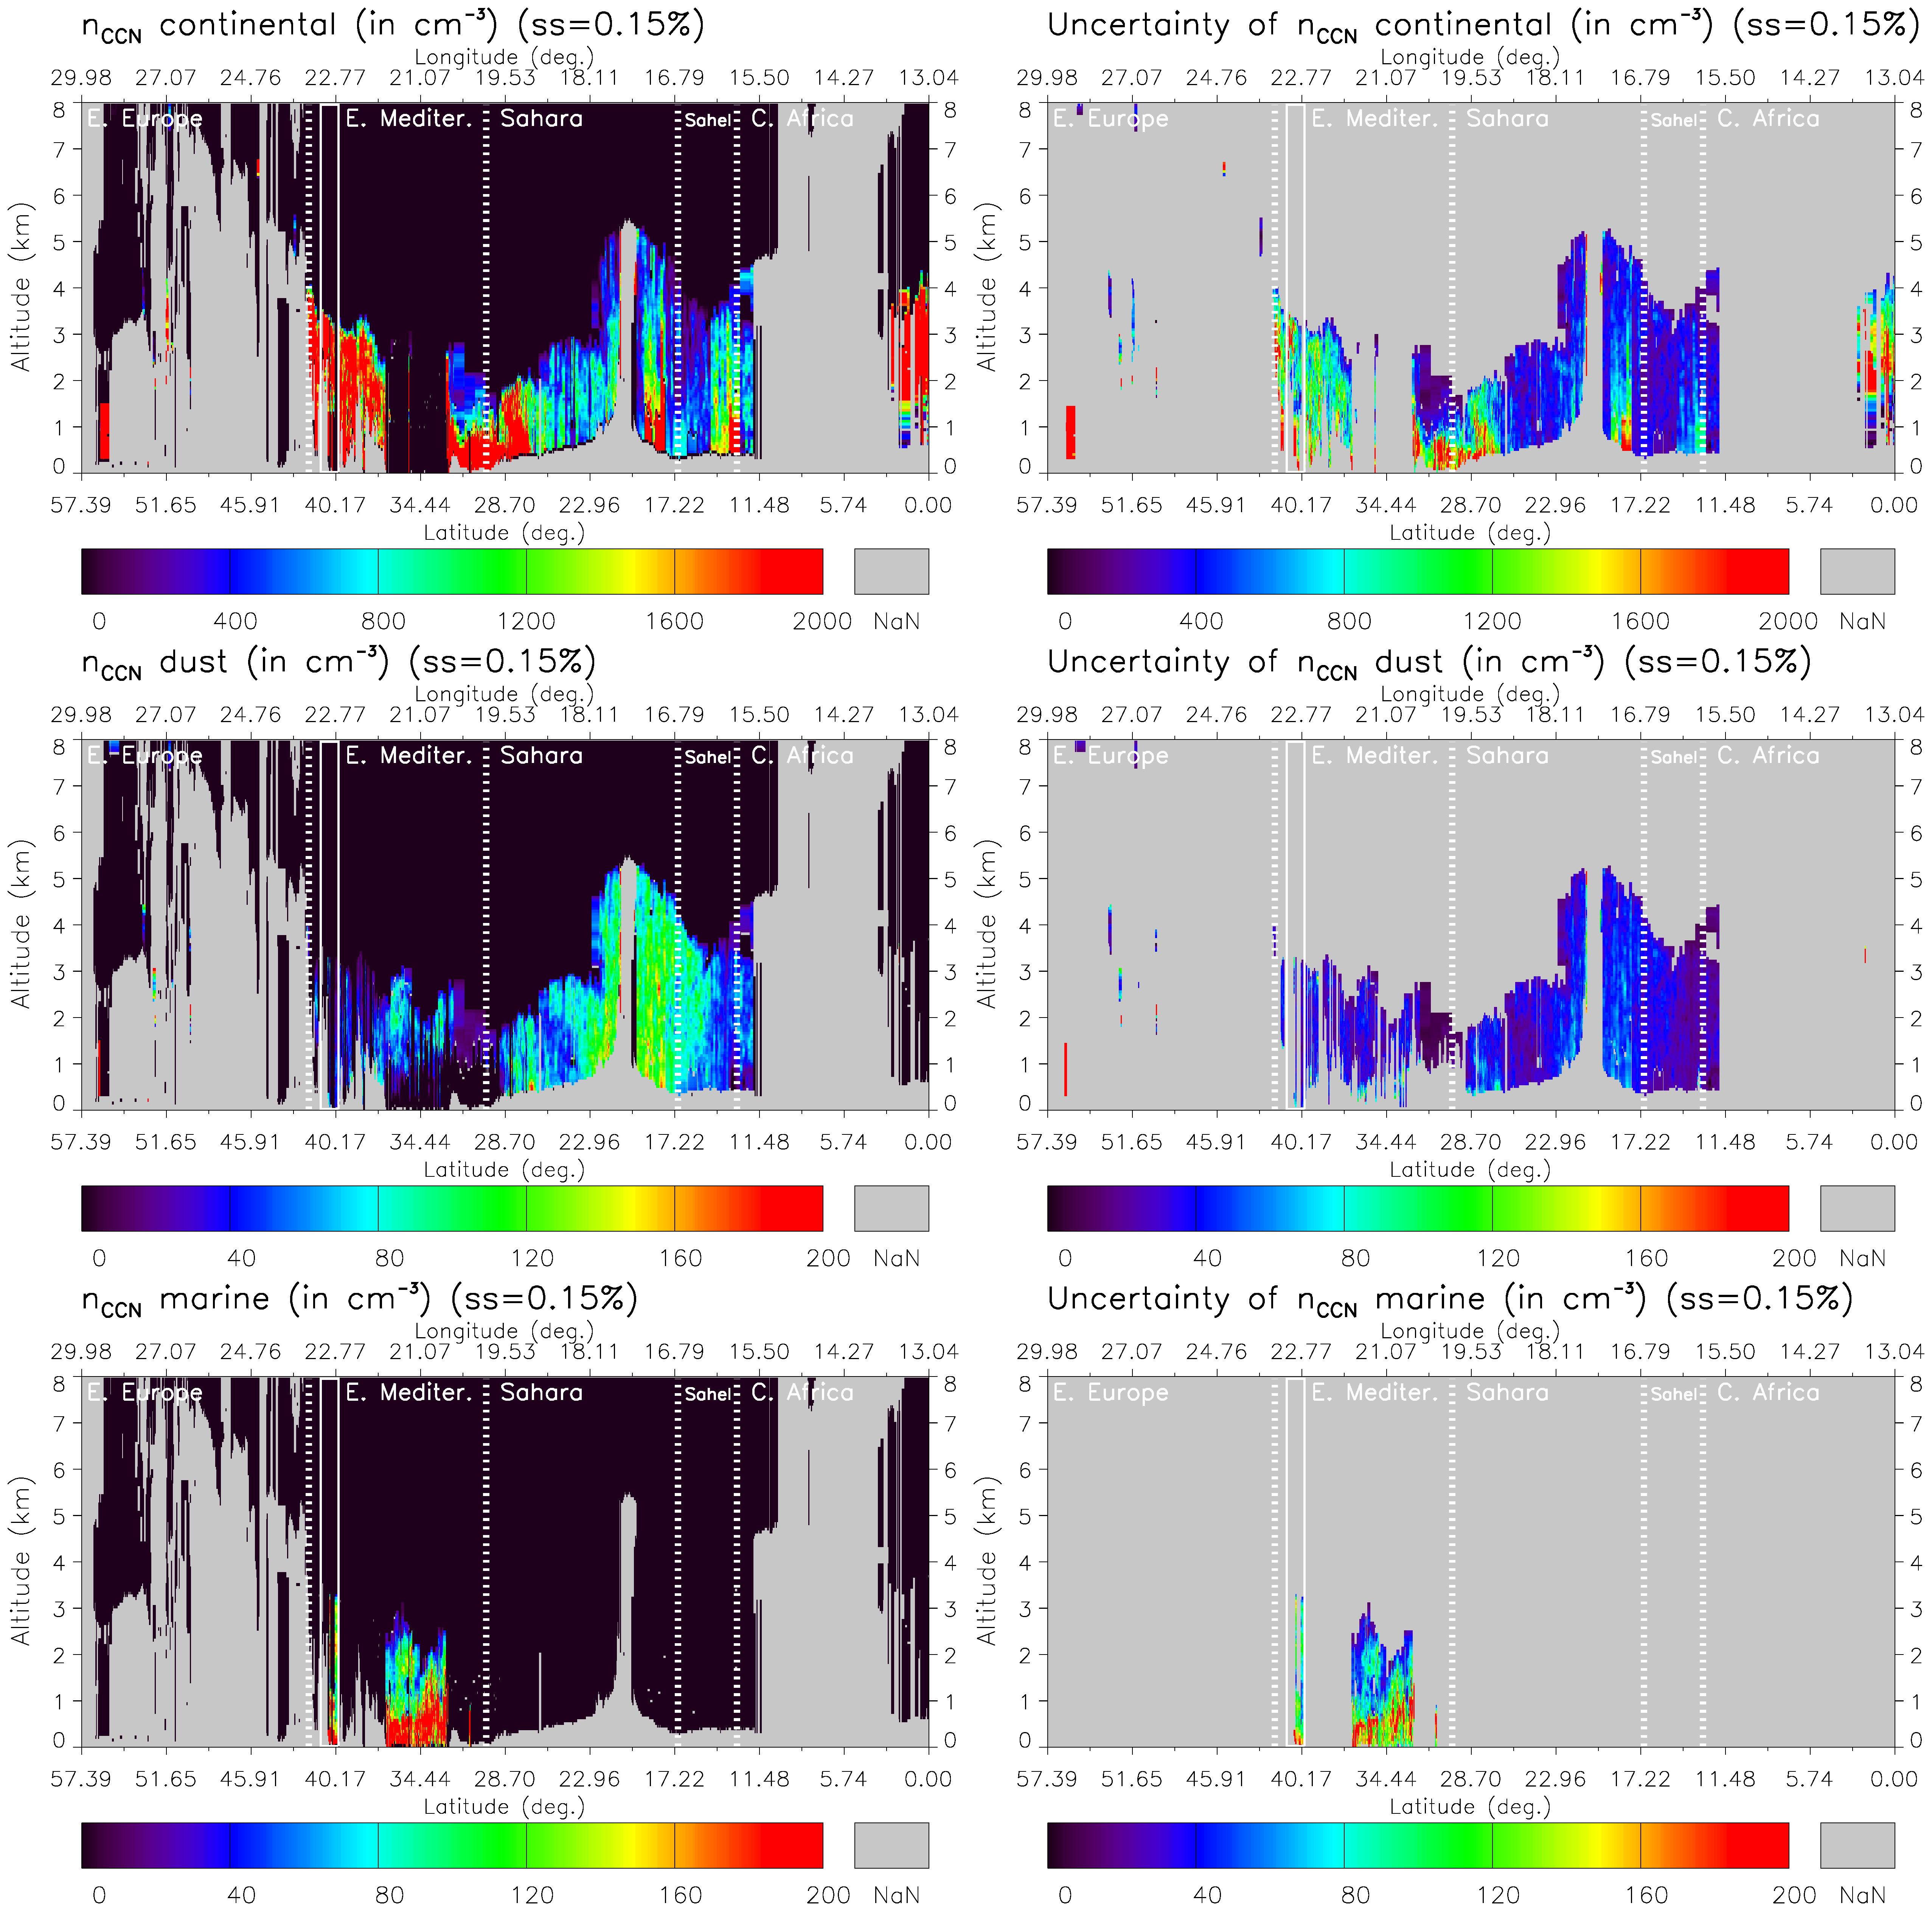
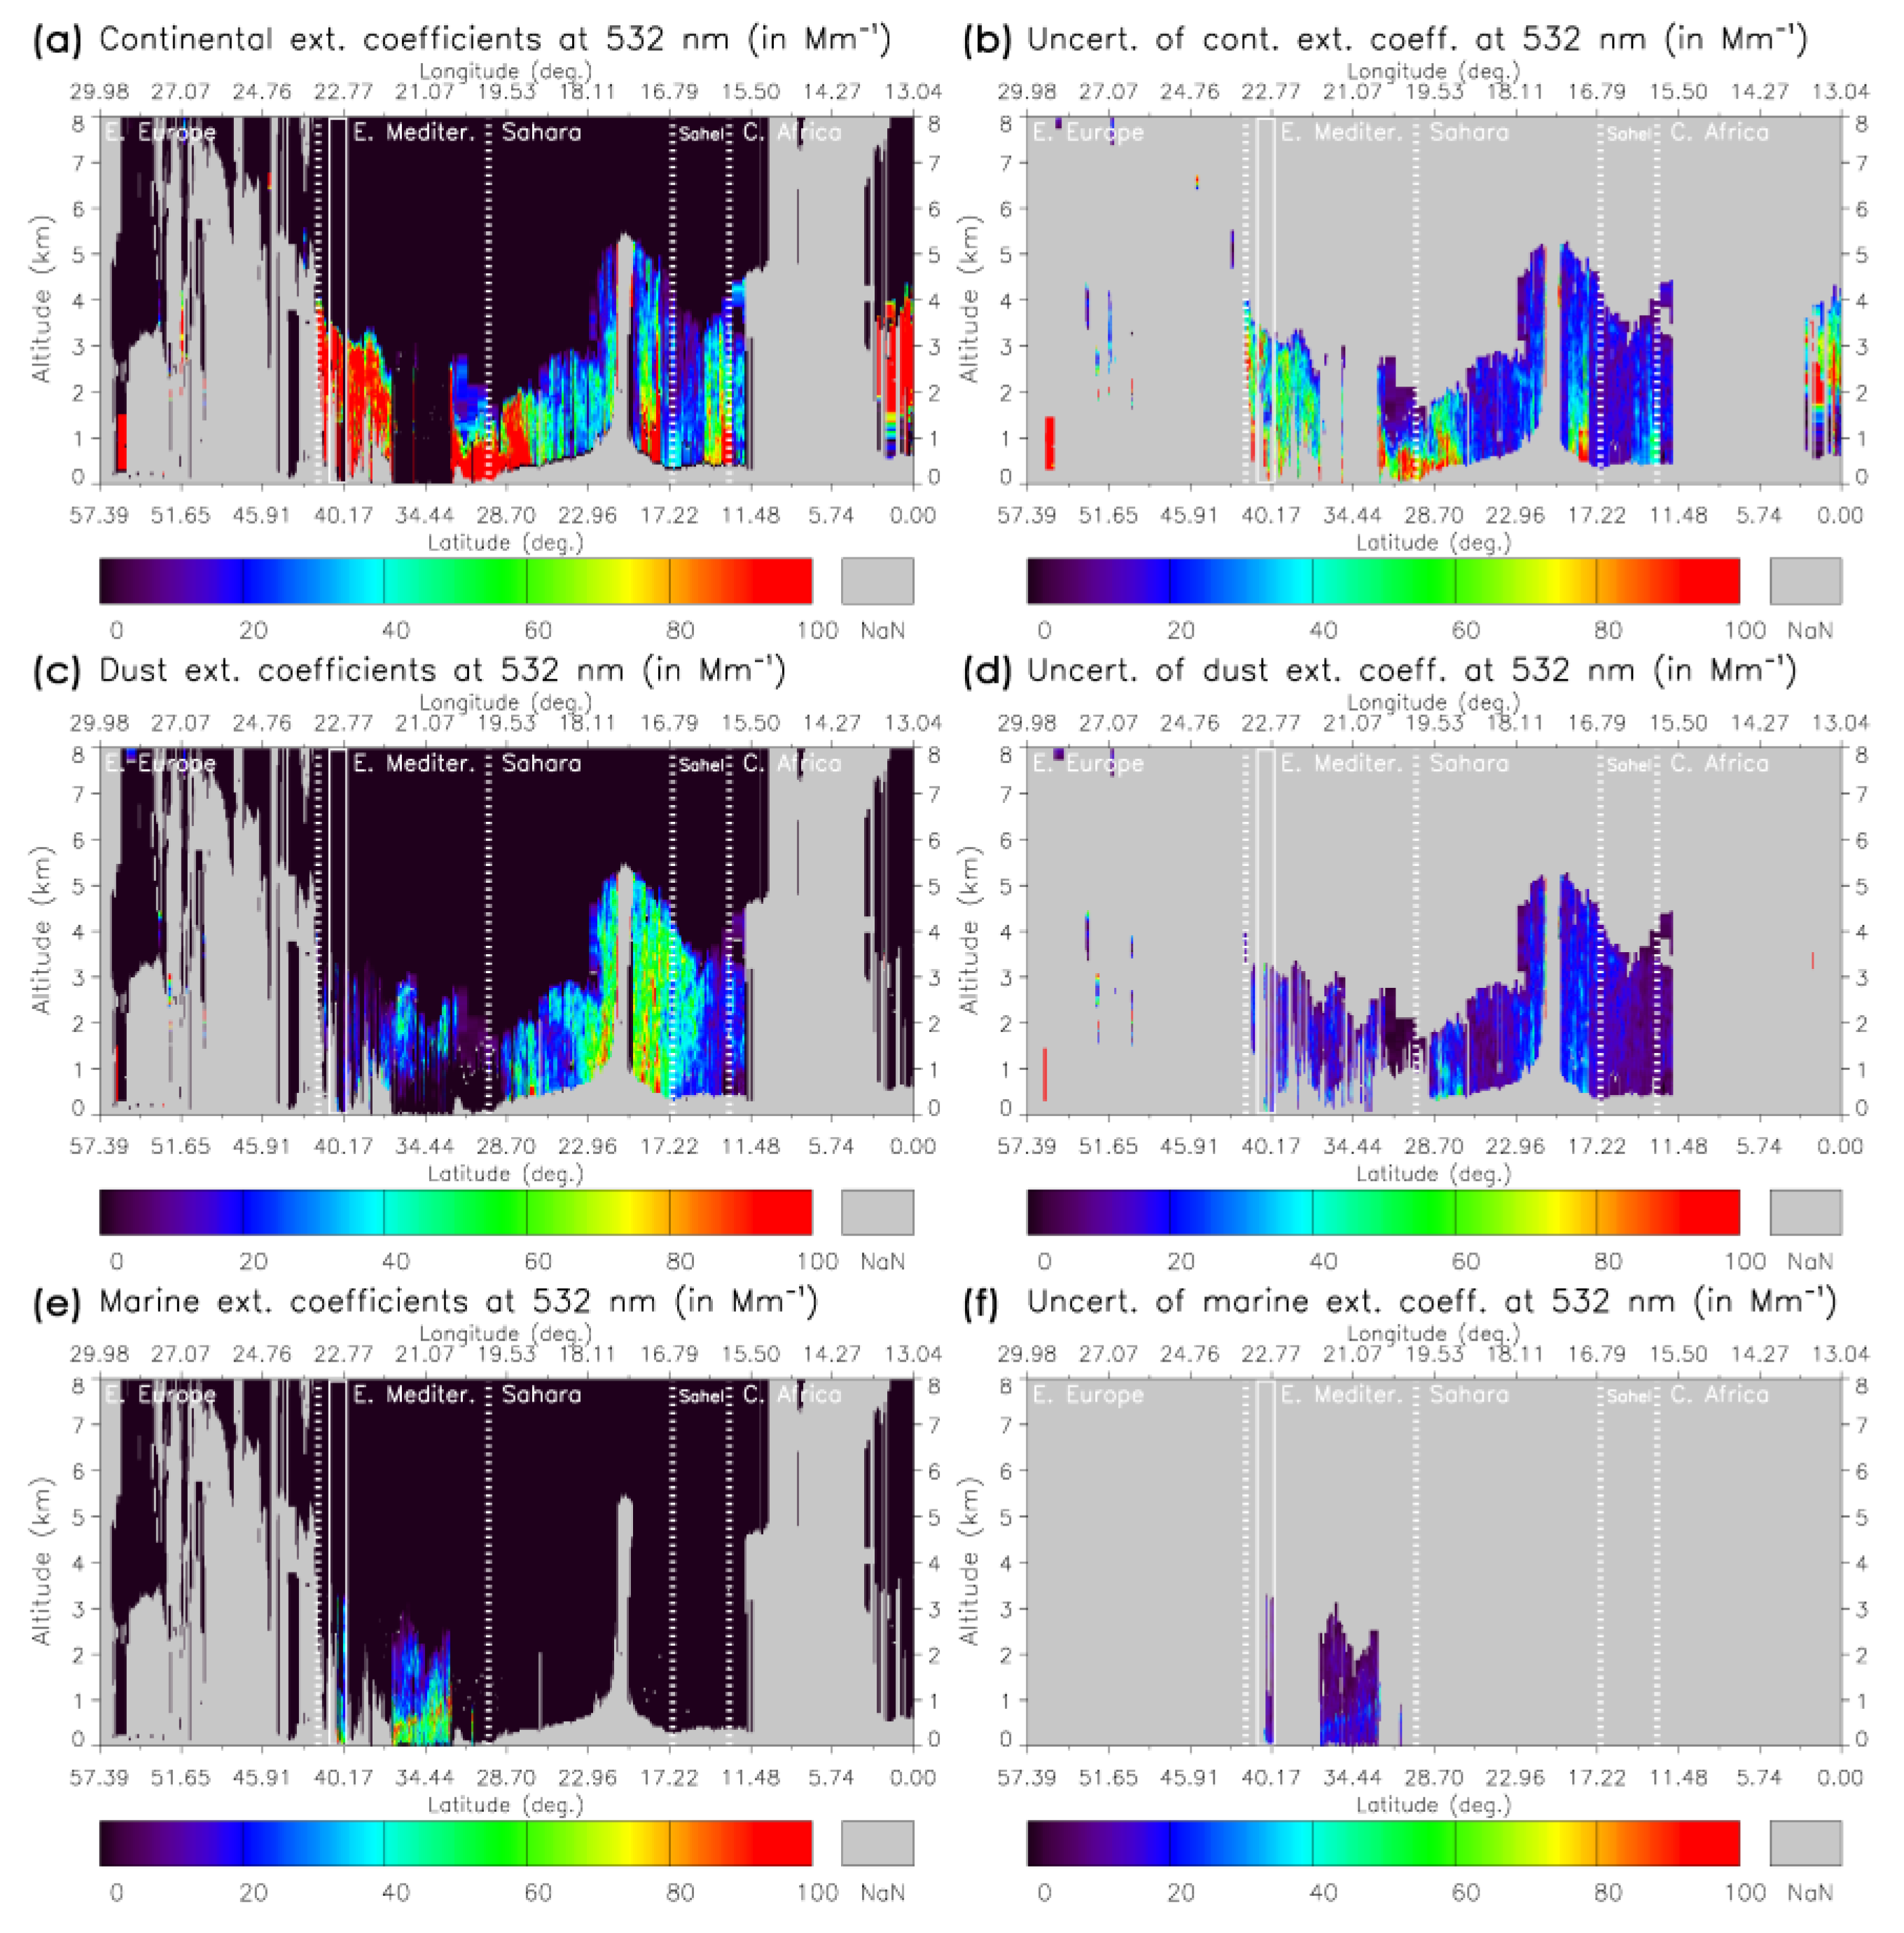
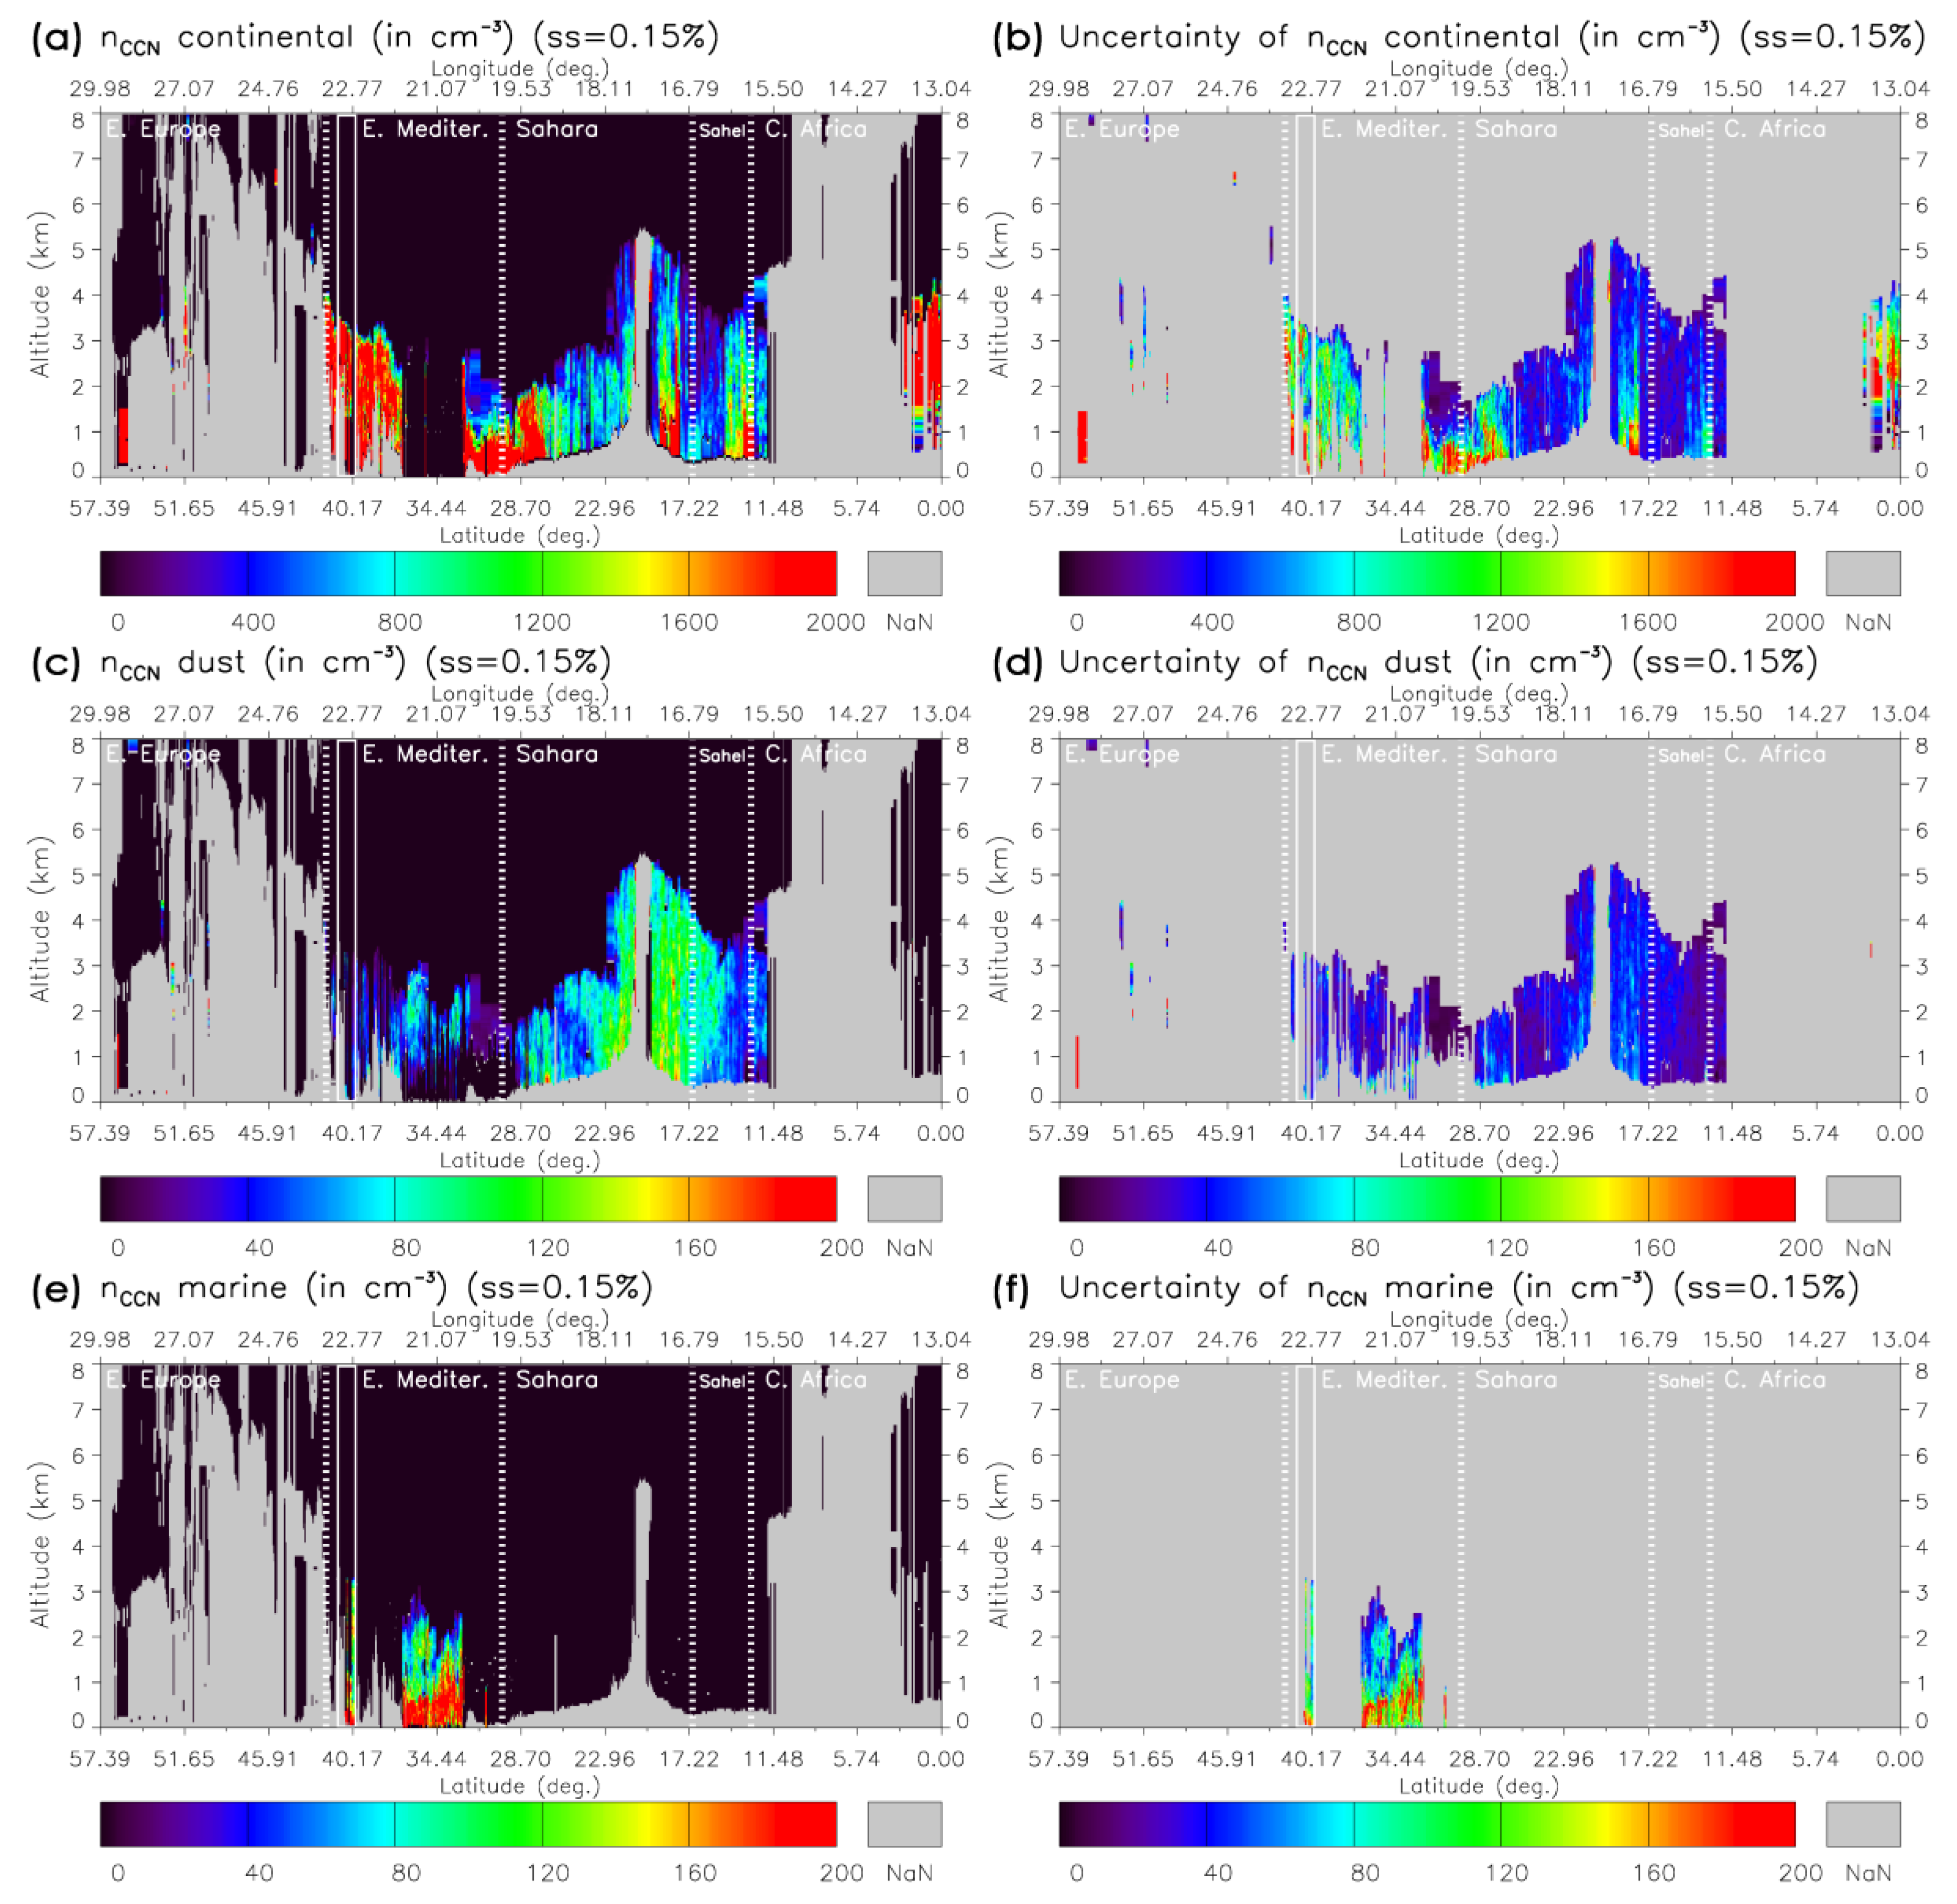
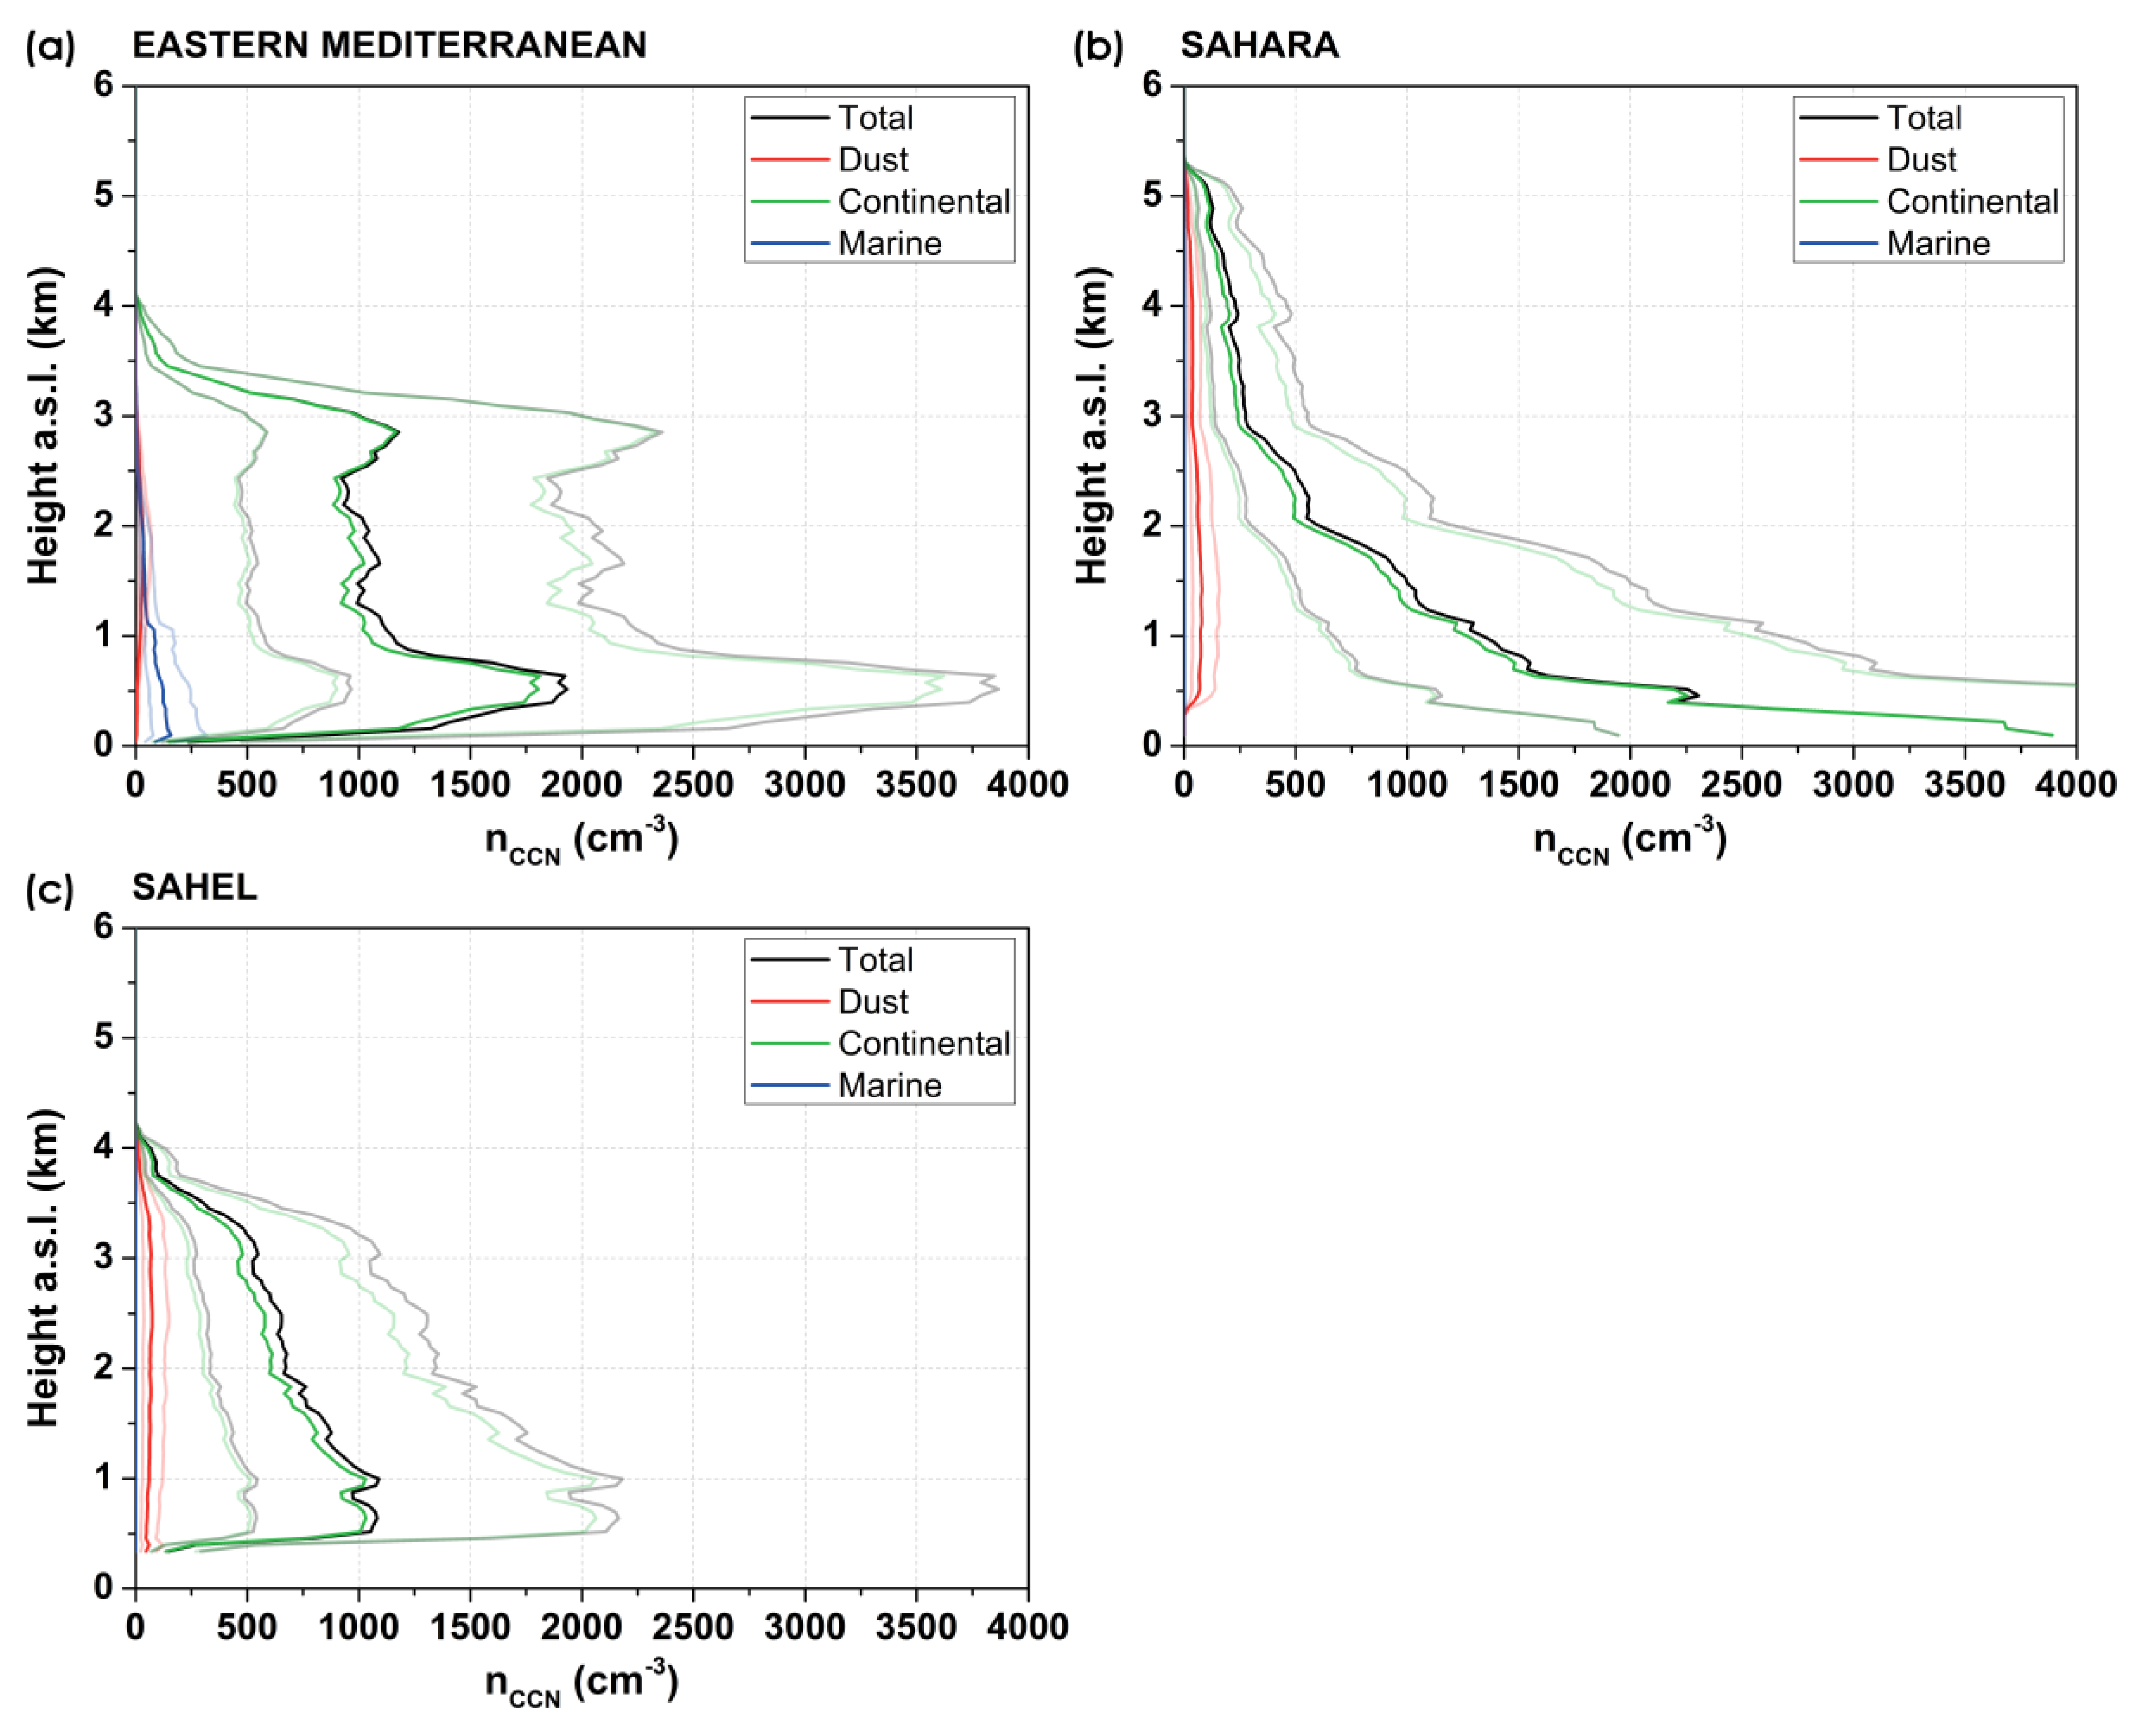
3.2. CALIPSO Extinction Coefficients and CCN Concentrations

Vertical cross sections of CALIPSO extinction coefficients at 532 nm and the corresponding uncertainties for continental, dust, and marine aerosols are shown in Figure 6 for the examined CALIPSO track.
In line with the discussion in the previous section, continental aerosols dominate (values larger than 100 Mm−1) over Eastern Europe, land areas of the Eastern Mediterranean, areas of the Sahara region across the North African coast and close to the Sahel, and over the Sahel. Dust dominates over the Sahara Desert (most values between 30–70 Mm−1) and at altitudes higher than ~1 km a.s.l. over the Mediterranean Sea, while marine aerosols dominate over the Mediterranean Sea (most values between 30–70 Mm−1) at lower altitudes within the boundary layer.
The corresponding vertical cross sections with our calculated CCN concentrations can be seen in Figure 7. Continental CCN concentrations larger than 2000 particles/cm3 (usually reported in cm−3) at a supersaturation of 0.15% appear over the areas where continental aerosols dominate. Dust CCN concentrations of 80 to 140 cm−3 appear over the areas where dust dominates, while marine CCN concentrations larger than 200 cm−3 appear at low altitudes over the Mediterranean Sea, where marine aerosols dominate.
Profiles of CCN concentrations at a supersaturation of 0.15% for the different regions of interest are presented in Figure 8. The uncertainty range of a factor of two is adapted from, e.g., Mamouri and Ansmann [27], Ansmann et al., [28], and Haarig et al., [29]. Only profiles for the Eastern Mediterranean, the Sahara and the Sahel regions are shown as, for the other two regions (Eastern Europe and Central Africa), there were large gaps and, hence, the spatial representativeness of their profiles is very limited. Continental CCNs clearly dominate for the three regions. Over the Eastern Mediterranean, the total CCN concentration is about 1900 cm−3 at altitudes around 0.5 km a.s.l., and about 1150 cm−3 at altitudes around 2.8 km a.s.l. For altitudes between 1.0 and 2.5 km a.s.l., CCN concentrations are around 1000 cm−3. Above 3.0 km a.s.l., CCN concentrations decrease and reach zero at about 4.0 km a.s.l. Continental aerosols contribute 94%, dust 1.5% (values up to 36 cm−3), and marine aerosols 4.5% (values up to 158 cm−3) to the total CCN concentration. Over the Sahara, the total aerosol CCN concentrations are much larger, reaching values up to 3900 cm−3 close to the surface. The CCN concentrations decrease sharply reaching zero at 5.3 km a.s.l. Continental aerosols account for 94% of the total CCN concentrations and dust for the remaining 6% (values up to 79 cm−3). Over the Sahel region, the CCN concentration of all aerosol types together reaches values of up to 1080 cm−3 at an altitude of 0.6 km a.s.l. and decrease to 540 cm−3 at 3.0 km a.s.l., and zero above 4.2 km a.s.l. Continental aerosols account for 91% of the total CCN concentrations and dust for the remaining 9% (values up to 75 cm−3).
Our findings are in line with recent ground-based lidar studies. Mamouri and Ansmann [27] derived CCN concentrations up to 2000 cm−3 at a supersaturation of 0.15% at low altitudes close to the surface at Cyprus, Eastern Mediterranean. Haarig et al. The authors of [29] found CCN concentrations up to 500 cm−3 at a supersaturation of 0.2% at 2.0 to 3.0 km a.s.l. over Barbados, Caribbean. Düsing et al. [65] inferred CCN concentrations up to 2000 cm−3 at 1.0 km a.s.l. at a supersaturation of 0.15% at Melpitz, Germany, Central Europe, while Genz et al. [30] retrieved CCN concentrations up to 1000 cm−3 close to the surface at the same location. Hofer et al. [31] found concentrations up to 1000 cm−3 at a supersaturation of 0.2% close to the surface in Tajikistan, Central Asia. This is a first confirmation that our satellite-based CCN estimates are within a reasonable range of values.

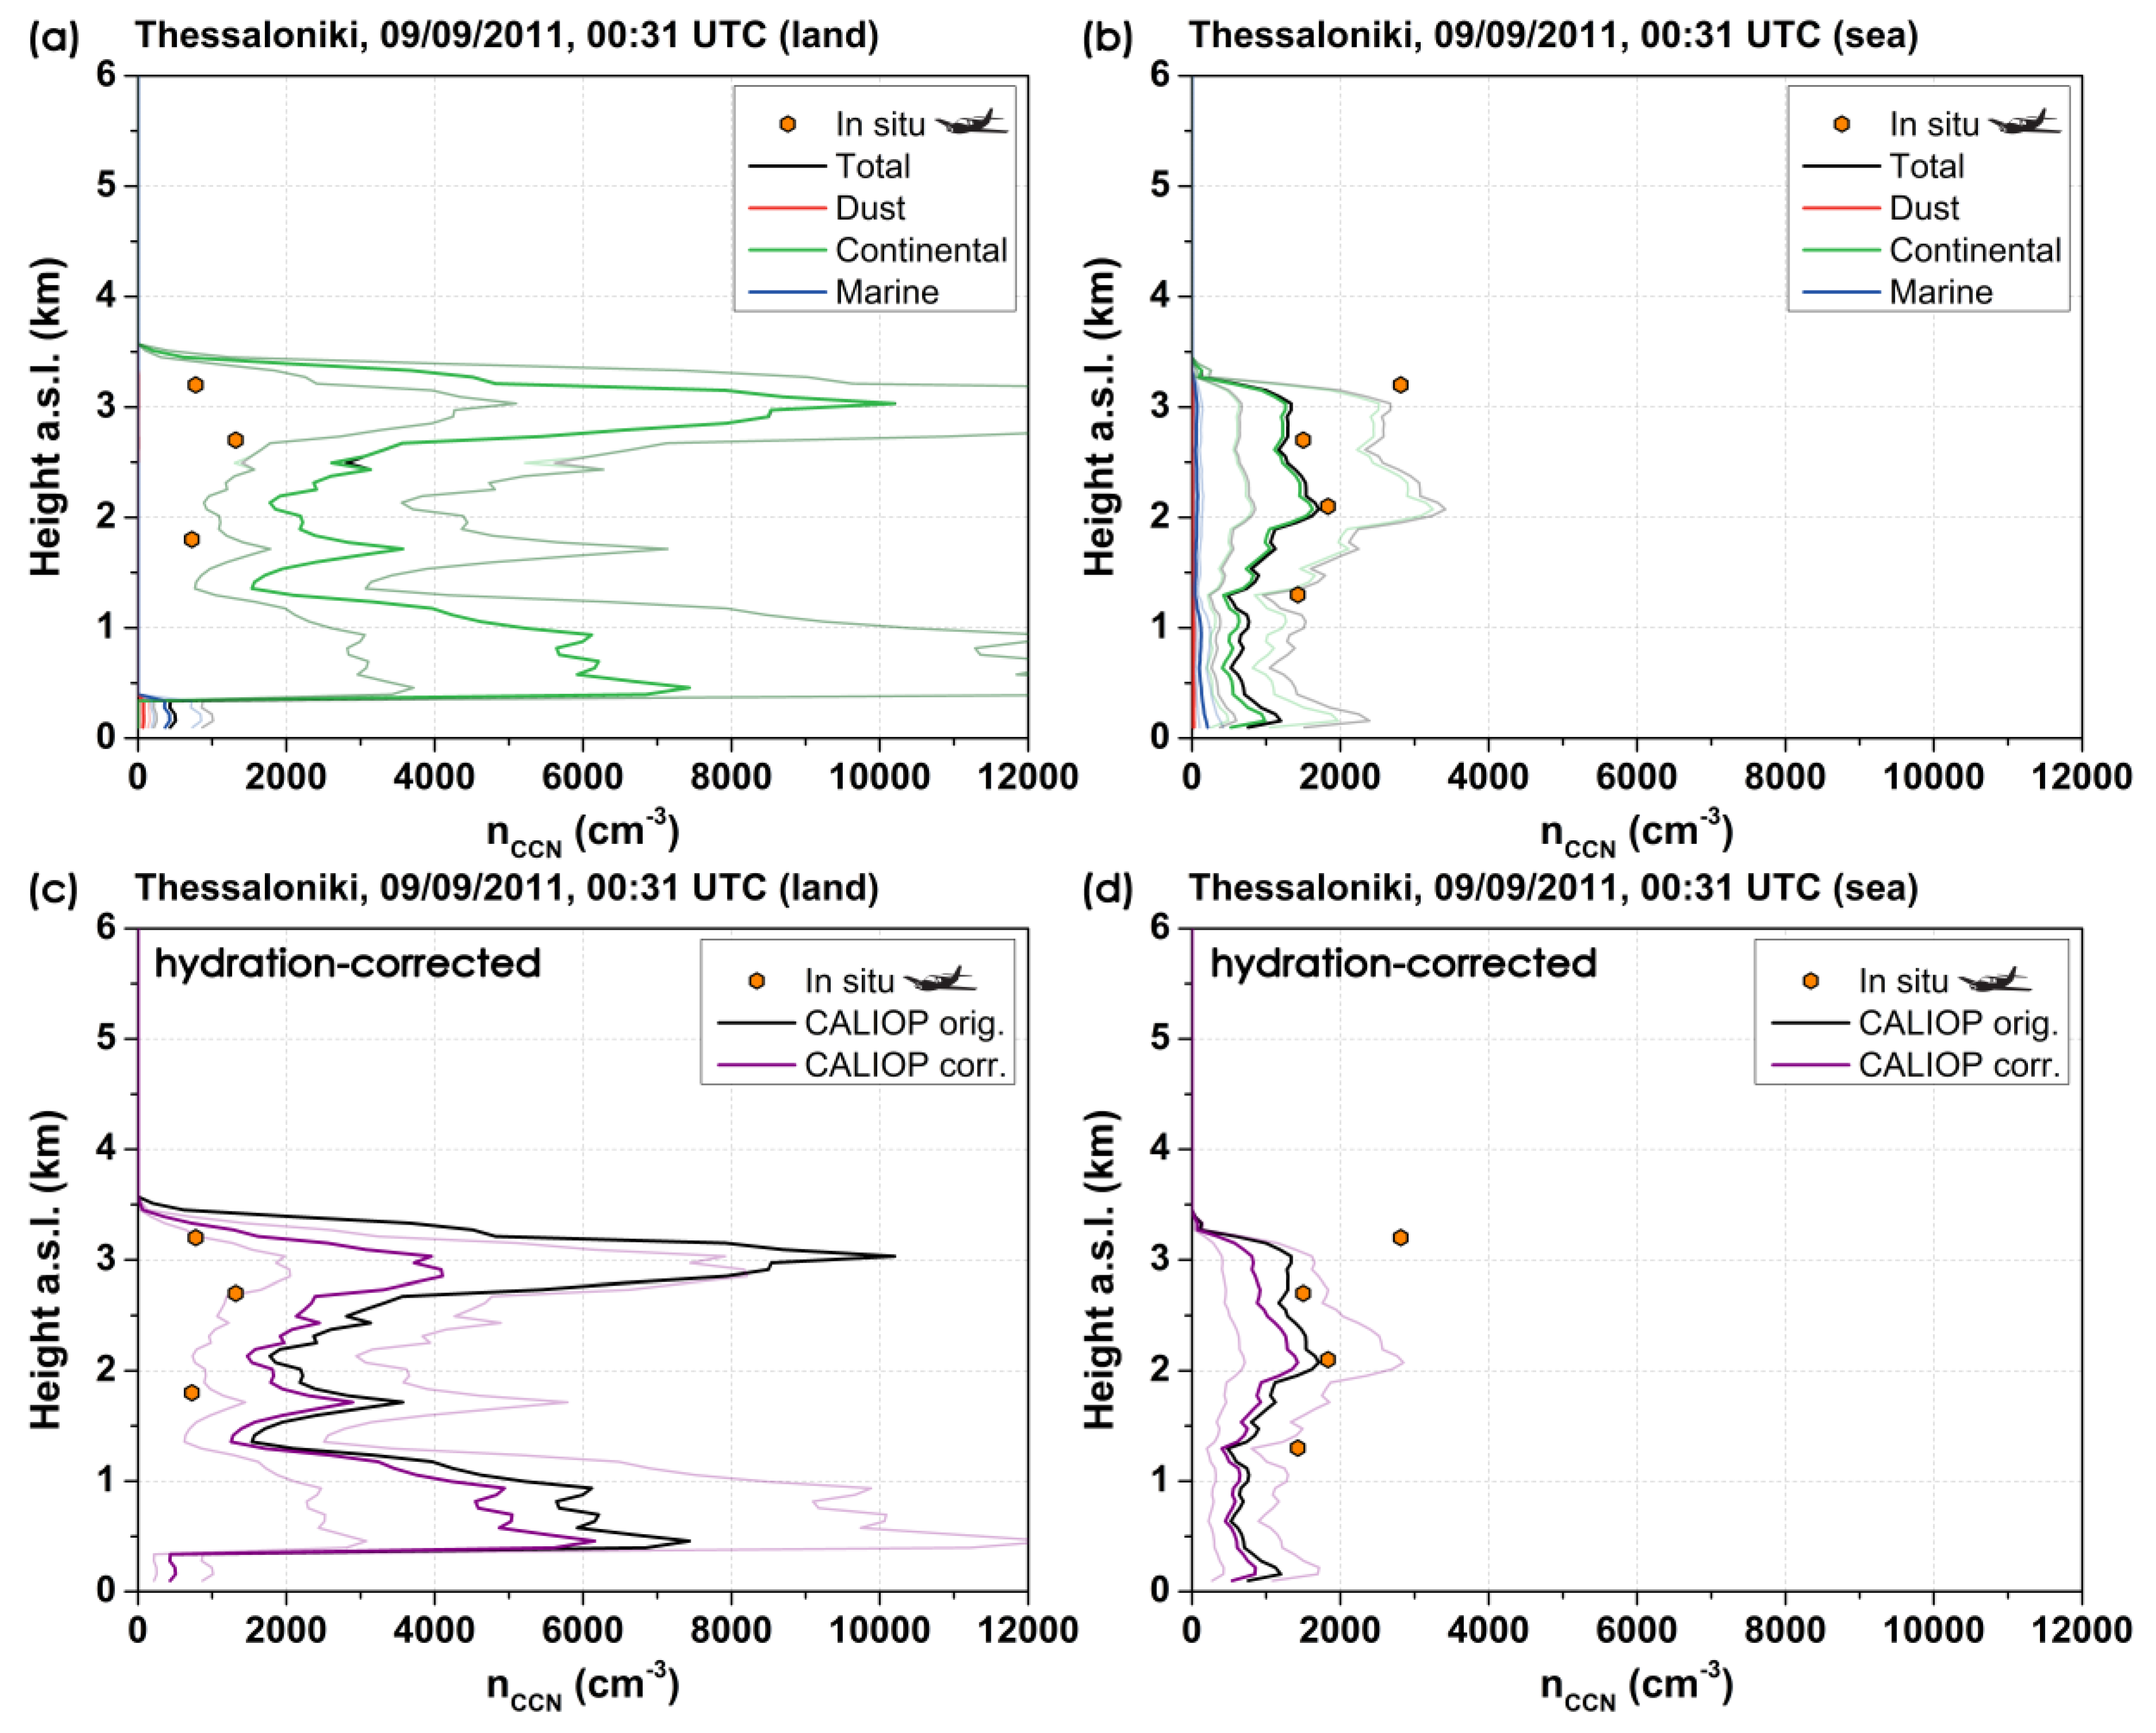
3.3. Evaluation of CALIPSO-Derived CCN Concentrations

The CALIPSO CCN concentration profiles for all the aerosol types together, for dust, continental and marine aerosols at a supersaturation of 0.15% (solid lines), and the corresponding factor of two uncertainty range (transparent lines) for the land (spatial average for 40.6°–41.2° N) and sea areas (spatial average for 40°–40.6° N) around Thessaloniki where the ACEMED took place are shown in Figure 9a,b, respectively. Dry particle number concentrations from the IRRA algorithm retrieved using in situ and lidar remote sensing data from the ACEMED flight [38], are overplotted. The flight tracks used for the IRRA retrievals (spatial representativeness) relative to the CALIPSO track are show in Figure 6 of Tsekeri et al. [38]. To compare our CCN profiles with the IRRA retrievals, the three CALIPSO height levels which are closer to each IRRA height level are defined, and an average CCN value is calculated. It has to be noted that the CALIPSO overpass time (around 00:45 UTC) falls within the IRRA retrievals time (between 00:00 and 02:00 UTC). Over land CALIPSO overestimates CCN concentrations up to four times, relative to the IRRA retrievals, while over the sea it underestimates by ~43%. In the first case, all the IRRA retrievals fall outside the CALIPSO factor of two uncertainty range while in the second case two values out a total of four fall outside. The calculated CCN values along with the IRRA retrievals for the ACEMED flight altitudes appear in Table 1.
As the parameterizations for the calculation of CCN concentrations assume dry particles, it is necessary to correct for hydration effects, i.e., the uptake of water by hydrophilic aerosols. Aerosols observed during the ACEMED campaign experienced hygroscopic growth that affected their optical properties [38]. Over land areas, the relative humidity (RH) reached values larger than 90%, whereas, over the sea, RH reached values of 80% (not shown here), as seen from the Modern-Era Retrospective analysis for Research and Applications, Version 2 (MERRA-2) meteorological profiles, which are included in the CALIPSO v4.1 product [68]. Significant deviations can be expected between the extinction coefficients of ambient and dry particles. In order to correct for the hydration effect, we use dry-to-ambient extinction coefficient ratios (DAR) for different RH values from Tsekeri et al. [38]. A third-degree polynomial is used to fit the DAR and RH data and applied thereafter on the MERRA-2 RH data. The original (ambient) CALIPSO extinction coefficients at 532 nm are multiplied by the emerging DAR values to calculate “dry” CALIPSO extinction coefficients at 532 nm, which are subsequently used in Equations (2)–(5) to obtain the CCN concentrations that are now corrected for the hydration effect.
The original and the corrected total CCN concentrations are shown in Figure 9 for the land and sea areas around Thessaloniki, respectively. Over land, the CALIPSO estimates overestimate the in-situ retrievals by a factor of two. This changes to an underestimation of 57% over sea. In the first case, one IRRA retrieval falls inside the CALIPSO factor of two uncertainty range and a second one marginally falls outside this range. In the second case, two values out of a total of four fall outside (one of them marginally). The corrected CCN values for the ACEMED flight altitudes are also given in Table 1. Overall, the correction leads to a significant decrease of 110% of the retrieved CCN concentrations over land and a smaller decrease of 22% over the sea, due to the overall lower RH. Six out of seven points from the in-situ measurements agree with the CALIPSO estimates within a factor of three.
We also compare our results with MODIS-derived columnar concentration (in cm−2) of fine mode particles with radius larger than 30 nm. More specifically, the spatial average of MODIS/Terra and Aqua pixels, whose center falls within a half-degree window centered at the ACEMED sea area is used for the comparison. To calculate columnar concentrations, CALIPSO-derived CCN concentrations are integrated over the atmospheric column. However, as our results are reported at a supersaturation of 0.15% assuming that particles with a radius larger than 50 nm may act as CCN, the columnar concentrations were multiplied by a factor of 1.7 that expresses the ratio of the n30,dry and n50,dry concentrations [27] in the comparison to the merged MODIS/Terra and Aqua data. The CALIPSO-derived column CCN concentrations are smaller than the ones inferred from MODIS. However, the MODIS values lie within the factor of two uncertainty range of the CALIPSO values as listed in Table 1. This comparison cannot be considered a validation as the sample is very limited, the MODIS dataset itself is not yet validated and the two datasets are not temporally collocated (MODIS/Terra and Aqua sensors pass over Thessaloniki around 09:30 and 11:30 UTC, respectively). However, the fact that two completely different satellite-based retrieval schemes applied on measurements from a passive and an active sensor give comparable results is promising.

4. Summary and Conclusions

This work investigates the potential of using spaceborne CALIPSO lidar measurements to obtain profiles of CCN concentrations as suggested by Mamouri and Ansmann [27] for ground-based lidar measurements. A CALIPSO measurement on 9 September 2011 over the Thessaloniki region (in northern Greece) is used for an assessment of the CCN retrieval based on independent in-situ observations with the FAAM Bae-146 research aircraft during the ACEMED campaign. The CALIPSO extinction coefficient is separated into contributions of dust and non-dust aerosols. The presence of biomass burning aerosols over Thessaloniki is corroborated by data from the CAMS aerosol reanalysis, and the combined inspection of MODIS fire counts and HYSPLIT backward trajectories.
The extinction coefficients related to mineral dust, continental aerosols, and marine aerosols are used to estimate CCN concentrations at a supersaturation of 0.15%. Continental CCN concentrations larger than 2000 cm−3 appear over areas where continental aerosols dominate, dust CCN concentrations of 80 to 140 cm−3 appear over dust dominating areas, while marine CCN concentrations larger than 200 cm−3 appear at low altitudes over the Mediterranean Sea. Continental aerosols account for more than 90% of the total CCN concentrations over all the examined regions. The values appearing here are of the same magnitude with values appearing in recent ground-based lidar studies giving confidence to our calculations.
Our CCN concentrations are evaluated against dry particle number concentrations retrieved using in situ and lidar remote sensing measurements from a FAAM BAe-146 flight over Thessaloniki during the ACEMED campaign. We suggest here that it is necessary to apply a correction for the hydration effect. To do so we used dry-to-ambient extinction coefficient ratios for different RHs from Tsekeri et al. [38]. Without such a correction, CALIPSO will tend to overestimate CCN concentrations, especially at RHs larger than 70–80%. Most of the CALIPSO-derived CCN concentrations are found to match the aircraft measurements within a factor of two. A comparison to the unvalidated MODIS CCN product over Thessaloniki shows smaller values for the CALIPSO estimate, again with an agreement within a factor of two.
Overall, this first effort shows that it is feasible to obtain CCN concentrations using CALIPSO observations with an uncertainty of a factor of two to three. The need for more detailed validation studies with measurements at various altitudes from other campaigns and improved parameterizations is acknowledged in order to produce in the future a robust climatological product that will be suitable for the evaluation of climate models, for intercomparison with other satellite-based products, and to constrain global ACI estimates.

Author Contributions

Conceptualization, A.K.G.; methodology, A.K.G., E.M., A.T., E.P. and V.A.; software, A.K.G. and E.M.; validation, A.K.G., A.T. and F.M.; formal analysis, A.K.G., D.A. and G.A.; investigation, A.K.G., E.M., A.T., E.P., D.A. and G.A.; resources, P.Z. and V.A.; data curation, A.K.G.; writing—original draft preparation, A.K.G.; writing—review and editing, A.K.G., E.M., A.T., E.P., D.A., G.A., P.Z., D.B., F.M., M.T. and V.A.; visualization, A.K.G.; supervision, A.K.G.; project administration, A.K.G.; funding acquisition, P.Z. and V.A. All authors have read and agreed to the published version of the manuscript.

Funding

This research was funded by the project “PANhellenic infrastructure for Atmospheric Composition and climatE change” (MIS 5021516) which is implemented under the Action “Reinforcement of the Research and Innovation Infrastructure”, funded by the Operational Programme “Competitiveness, Entrepreneurship and Innovation” (NSRF 2014-2020) and co-financed by Greece and the European Union (European Regional Development Fund). Part of this research was funded by the project “PROTEAS II - Advanced Space Applications in the Exploration of the Universe, Space and Earth” (MIS 5002515) also implemented under the Action “Reinforcement of the Research and Innovation Infrastructure”, funded by the Operational Programme “Competitiveness, Entrepreneurship and Innovation” (NSRF 2014-2020) and co-financed by Greece and the European Union (European Regional Development Fund) and supported through the European Research Council (ERC) under the European Community’s Horizon 2020 research and innovation framework program—ERC grant agreement 725698 (D-TECT). The ACEMED campaign received funding from the European Union’s Seventh Framework Programme (FP7/2007-2013) under grant agreement no. 227159 (EUFAR: European Facility for Airborne Research). EM was funded by a DLR VO-R young investigator group and the Deutscher Akademischer Austauschdienst (grant no. 57370121). MT was supported by the Franco-German Fellowship Programme on Climate, Energy, and Earth System Research (Make Our Planet Great Again - German Research Initiative, MOPGA-GRI) of the German Academic Exchange Service (DAAD), funded by the German Ministry of Education and Research.

Acknowledgments

The CALIPSO data were provided by NASA. The authors thank the ICARE Data and Services Center (http://www.icare.univ-lille1.fr/) for providing access to the CALIPSO data used here and to their computational center. The CAMS reanalysis data were generated using Copernicus Atmosphere Monitoring Service Information 2019. The authors gratefully acknowledge the NOAA Air Resources Laboratory (ARL) for the provision of the HYSPLIT transport and dispersion model and/or READY website (http://www.ready.noaa.gov) used in this publication. The use of data from LANCE FIRMS operated by NASA’s Earth Science Data and Information System (ESDIS) with funding provided by NASA Headquarters is also acknowledged. Airborne data were obtained using the BAe-146-301 Atmospheric Research Aircraft operated by Airtask Ltd and managed by the Facility for Airborne Atmospheric Measurements (FAAM). NASA Goddard Space Flight Center (GSFC) Level-1 and Atmosphere Archive and Distribution System (LAADS) (https://ladsweb.modaps.eosdis.nasa.gov/) is acknowledged for making available the level-2 MODIS/Terra and Aqua Collection 6.1 aerosol datasets.

Conflicts of Interest

The authors declare no conflict of interest.

References

  1. Climate Change 2013—The Physical Science Basis: Working Group I Contribution to the Fifth Assessment Report of the Intergovernmental Panel on Climate Change; Intergovernmental Panel on Climate Change (Ed.) Cambridge University Press: Cambridge, UK, 2014; ISBN 978-1-107-41532-4. [Google Scholar]
  2. Andreae, M.O.; Rosenfeld, D. Aerosol–cloud–precipitation interactions. Part 1. The nature and sources of cloud-active aerosols. Earth-Sci. Rev. 2008, 89, 13–41. [Google Scholar] [CrossRef]
  3. Twomey, S. Pollution and the planetary albedo. Atmos. Environ. 1974, 8, 1251–1256. [Google Scholar] [CrossRef]
  4. Albrecht, B.A. Aerosols, Cloud Microphysics, and Fractional Cloudiness. Science 1989, 245, 1227–1230. [Google Scholar] [CrossRef]
  5. Andreae, M.O.; Rosenfeld, D.; Artaxo, P.; Costa, A.A.; Frank, G.P.; Longo, K.M.; Silva-Dias, M.A.F. Smoking Rain Clouds over the Amazon. Science 2004, 303, 1337–1342. [Google Scholar] [CrossRef] [Green Version]
  6. Rosenfeld, D.; Lohmann, U.; Raga, G.B.; O’Dowd, C.D.; Kulmala, M.; Fuzzi, S.; Reissell, A.; Andreae, M.O. Flood or Drought: How Do Aerosols Affect Precipitation? Science 2008, 321, 1309–1313. [Google Scholar] [CrossRef] [Green Version]
  7. Hansen, J.; Sato, M.; Lacis, A.; Ruedy, R. The missing climate forcing. Philos. Trans. R. Soc. Lond. B 1997, 352, 231–240. [Google Scholar] [CrossRef]
  8. Ackerman, A.S. Reduction of Tropical Cloudiness by Soot. Science 2000, 288, 1042–1047. [Google Scholar] [CrossRef] [PubMed] [Green Version]
  9. Koch, D.; Del Genio, A.D. Black carbon semi-direct effects on cloud cover: Review and synthesis. Atmos. Chem. Phys. 2010, 10, 7685–7696. [Google Scholar] [CrossRef] [Green Version]
  10. Tao, W.-K.; Chen, J.-P.; Li, Z.; Wang, C.; Zhang, C. Impact of aerosols on convective clouds and precipitation. Rev. Geophys. 2012, 50, RG2001. [Google Scholar] [CrossRef] [Green Version]
  11. Myhre, G.; Stordal, F.; Johnsrud, M.; Kaufman, Y.J.; Rosenfeld, D.; Storelvmo, T.; Kristjansson, J.E.; Berntsen, T.K.; Myhre, A.; Isaksen, I.S.A. Aerosol-cloud interaction inferred from MODIS satellite data and global aerosol models. Atmos. Chem. Phys. 2007, 7, 3081–3101. [Google Scholar] [CrossRef] [Green Version]
  12. Quaas, J.; Boucher, O.; Bellouin, N.; Kinne, S. Satellite-based estimate of the direct and indirect aerosol climate forcing. J. Geophys. Res. 2008, 113, D05204. [Google Scholar] [CrossRef]
  13. Bellouin, N.; Quaas, J.; Morcrette, J.-J.; Boucher, O. Estimates of aerosol radiative forcing from the MACC re-analysis. Atmos. Chem. Phys. 2013, 13, 2045–2062. [Google Scholar] [CrossRef] [Green Version]
  14. Ma, X.; Yu, F.; Quaas, J. Reassessment of satellite-based estimate of aerosol climate forcing. J. Geophys. Res. Atmos. 2014, 119, 10394–10409. [Google Scholar] [CrossRef] [Green Version]
  15. Kourtidis, K.; Stathopoulos, S.; Georgoulias, A.K.; Alexandri, G.; Rapsomanikis, S. A study of the impact of synoptic weather conditions and water vapor on aerosol–cloud relationships over major urban clusters of China. Atmos. Chem. Phys. 2015, 15, 10955–10964. [Google Scholar] [CrossRef] [Green Version]
  16. Gryspeerdt, E.; Stier, P. Regime-based analysis of aerosol-cloud interactions. Geophys. Res. Lett. 2012, 39, L21802. [Google Scholar] [CrossRef]
  17. Gryspeerdt, E.; Stier, P.; Partridge, D.G. Satellite observations of cloud regime development: The role of aerosol processes. Atmos. Chem. Phys. 2014, 14, 1141–1158. [Google Scholar] [CrossRef] [Green Version]
  18. Gryspeerdt, E.; Stier, P.; Partridge, D.G. Links between satellite-retrieved aerosol and precipitation. Atmos. Chem. Phys. 2014, 14, 9677–9694. [Google Scholar] [CrossRef] [Green Version]
  19. Gryspeerdt, E.; Quaas, J.; Bellouin, N. Constraining the aerosol influence on cloud fraction. J. Geophys. Res. Atmos. 2016, 121, 3566–3583. [Google Scholar] [CrossRef] [Green Version]
  20. Gryspeerdt, E.; Goren, T.; Sourdeval, O.; Quaas, J.; Mülmenstädt, J.; Dipu, S.; Unglaub, C.; Gettelman, A.; Christensen, M. Constraining the aerosol influence on cloud liquid water path. Atmos. Chem. Phys. 2019, 19, 5331–5347. [Google Scholar] [CrossRef] [Green Version]
  21. Shinozuka, Y.; Clarke, A.D.; Nenes, A.; Jefferson, A.; Wood, R.; McNaughton, C.S.; Ström, J.; Tunved, P.; Redemann, J.; Thornhill, K.L.; et al. The relationship between cloud condensation nuclei (CCN) concentration and light extinction of dried particles: Indications of underlying aerosol processes and implications for satellite-based CCN estimates. Atmos. Chem. Phys. 2015, 15, 7585–7604. [Google Scholar] [CrossRef] [Green Version]
  22. Stier, P. Limitations of passive remote sensing to constrain global cloud condensation nuclei. Atmos. Chem. Phys. 2016, 16, 6595–6607. [Google Scholar] [CrossRef] [Green Version]
  23. Ghan, S.J.; Collins, D.R. Use of In Situ Data to Test a Raman Lidar–Based Cloud Condensation Nuclei Remote Sensing Method. J. Atmos. Ocean. Technol. 2004, 21, 8. [Google Scholar] [CrossRef]
  24. Andreae, M.O. Correlation between cloud condensation nuclei concentration and aerosol optical thickness in remote and polluted regions. Atmos. Chem. Phys. 2009, 9, 543–556. [Google Scholar] [CrossRef] [Green Version]
  25. Jefferson, A. Empirical estimates of CCN from aerosol optical properties at four remote sites. Atmos. Chem. Phys. 2010, 10, 6855–6861. [Google Scholar] [CrossRef] [Green Version]
  26. Liu, J.; Li, Z. Estimation of cloud condensation nuclei concentration from aerosol optical quantities: Influential factors and uncertainties. Atmos. Chem. Phys. 2014, 14, 471–483. [Google Scholar] [CrossRef] [Green Version]
  27. Mamouri, R.-E.; Ansmann, A. Potential of polarization lidar to provide profiles of CCN- and INP-relevant aerosol parameters. Atmos. Chem. Phys. 2016, 16, 5905–5931. [Google Scholar] [CrossRef] [Green Version]
  28. Ansmann, A.; Mamouri, R.-E.; Hofer, J.; Baars, H.; Althausen, D.; Abdullaev, S.F. Dust mass, cloud condensation nuclei, and ice-nucleating particle profiling with polarization lidar: Updated POLIPHON conversion factors from global AERONET analysis. Atmos. Meas. Tech. 2019, 12, 4849–4865. [Google Scholar] [CrossRef] [Green Version]
  29. Haarig, M.; Walser, A.; Ansmann, A.; Dollner, M.; Althausen, D.; Sauer, D.; Farrell, D.; Weinzierl, B. Profiles of cloud condensation nuclei, dust mass concentration, and ice-nucleating-particle-relevant aerosol properties in the Saharan Air Layer over Barbados from polarization lidar and airborne in situ measurements. Atmos. Chem. Phys. 2019, 19, 13773–13788. [Google Scholar] [CrossRef] [Green Version]
  30. Genz, C.; Schrödner, R.; Heinold, B.; Henning, S.; Baars, H.; Spindler, G.; Tegen, I. Estimation of Cloud Condensation Nuclei number concentrations and comparison to in-situ and lidar observations during the HOPE experiments. Atmos. Chem. Phys. Discuss. 2019. in review. [Google Scholar] [CrossRef] [Green Version]
  31. Hofer, J.; Ansmann, A.; Althausen, D.; Engelmann, R.; Baars, H.; Abdullaev, S.F.; Makhmudov, A.N. Long-term profiling of aerosol light-extinction, particle mass, cloud condensation nuclei, and ice-nucleating particle concentration over Dushanbe, Tajikistan, in Central Asia. Atmos. Chem. Phys. Discuss. 2019. in review. [Google Scholar] [CrossRef] [Green Version]
  32. Hasekamp, O.P.; Gryspeerdt, E.; Quaas, J. Analysis of polarimetric satellite measurements suggests stronger cooling due to aerosol-cloud interactions. Nat. Commun. 2019, 10, 5405. [Google Scholar] [CrossRef]
  33. Winker, D.M.; Vaughan, M.A.; Omar, A.; Hu, Y.; Powell, K.A.; Liu, Z.; Hunt, W.H.; Young, S.A. Overview of the CALIPSO Mission and CALIOP Data Processing Algorithms. J. Atmos. Ocean. Technol. 2009, 26, 2310–2323. [Google Scholar] [CrossRef]
  34. Hunt, W.H.; Winker, D.M.; Vaughan, M.A.; Powell, K.A.; Lucker, P.L.; Weimer, C. CALIPSO Lidar Description and Performance Assessment. J. Atmos. Ocean. Technol. 2009, 26, 1214–1228. [Google Scholar] [CrossRef]
  35. Vaughan, M.A.; Powell, K.A.; Winker, D.M.; Hostetler, C.A.; Kuehn, R.E.; Hunt, W.H.; Getzewich, B.J.; Young, S.A.; Liu, Z.; McGill, M.J. Fully Automated Detection of Cloud and Aerosol Layers in the CALIPSO Lidar Measurements. J. Atmos. Ocean. Technol. 2009, 26, 2034–2050. [Google Scholar] [CrossRef]
  36. Kim, M.-H.; Omar, A.H.; Tackett, J.L.; Vaughan, M.A.; Winker, D.M.; Trepte, C.R.; Hu, Y.; Liu, Z.; Poole, L.R.; Pitts, M.C.; et al. The CALIPSO version 4 automated aerosol classification and lidar ratio selection algorithm. Atmos. Meas. Tech. 2018, 11, 6107–6135. [Google Scholar] [CrossRef] [Green Version]
  37. Omar, A.H.; Winker, D.M.; Vaughan, M.A.; Hu, Y.; Trepte, C.R.; Ferrare, R.A.; Lee, K.-P.; Hostetler, C.A.; Kittaka, C.; Rogers, R.R.; et al. The CALIPSO Automated Aerosol Classification and Lidar Ratio Selection Algorithm. J. Atmos. Ocean. Technol. 2009, 26, 1994–2014. [Google Scholar] [CrossRef]
  38. Tsekeri, A.; Amiridis, V.; Marenco, F.; Nenes, A.; Marinou, E.; Solomos, S.; Rosenberg, P.; Trembath, J.; Nott, G.J.; Allan, J.; et al. Profiling aerosol optical, microphysical and hygroscopic properties in ambient conditions by combining in situ and remote sensing. Atmos. Meas. Tech. 2017, 10, 83–107. [Google Scholar] [CrossRef] [Green Version]
  39. Fountoukis, C.; Nenes, A. ISORROPIA II: A computationally efficient thermodynamic equilibrium model for K+–Ca2+–Mg2+–NH4+–Na+–SO42−NO3Cl–H2O aerosols. Atmos. Chem. Phys. 2007, 7, 4639–4659. [Google Scholar] [CrossRef] [Green Version]
  40. Salomonson, V.V.; Barnes, W.L.; Maymon, P.W.; Montgomery, H.E.; Ostrow, H. MODIS: Advanced facility instrument for studies of the Earth as a system. IEEE Trans. Geosci. Remote Sens. 1989, 27, 145–153. [Google Scholar] [CrossRef]
  41. Georgoulias, A.K.; Alexandri, G.; Kourtidis, K.A.; Lelieveld, J.; Zanis, P.; Pöschl, U.; Levy, R.; Amiridis, V.; Marinou, E.; Tsikerdekis, A. Spatiotemporal variability and contribution of different aerosol types to the aerosol optical depth over the Eastern Mediterranean. Atmos. Chem. Phys. 2016, 16, 13853–13884. [Google Scholar] [CrossRef] [Green Version]
  42. Kaufman, Y.J.; Tanré, D.; Remer, L.A.; Vermote, E.F.; Chu, A.; Holben, B.N. Operational remote sensing of tropospheric aerosol over land from EOS moderate resolution imaging spectroradiometer. J. Geophys. Res. 1997, 102, 17051–17067. [Google Scholar] [CrossRef]
  43. Remer, L.A.; Kaufman, Y.J.; Tanré, D.; Mattoo, S.; Chu, D.A.; Martins, J.V.; Li, R.-R.; Ichoku, C.; Levy, R.C.; Kleidman, R.G.; et al. The MODIS Aerosol Algorithm, Products, and Validation. J. Atmos. Sci. 2005, 62, 947–973. [Google Scholar] [CrossRef] [Green Version]
  44. Levy, R.C.; Remer, L.A.; Kleidman, R.G.; Mattoo, S.; Ichoku, C.; Kahn, R.; Eck, T.F. Global evaluation of the Collection 5 MODIS dark-target aerosol products over land. Atmos. Chem. Phys. 2010, 10, 10399–10420. [Google Scholar] [CrossRef] [Green Version]
  45. Levy, R.C.; Mattoo, S.; Munchak, L.A.; Remer, L.A.; Sayer, A.M.; Patadia, F.; Hsu, N.C. The Collection 6 MODIS aerosol products over land and ocean. Atmos. Meas. Tech. 2013, 6, 2989–3034. [Google Scholar] [CrossRef] [Green Version]
  46. Tanré, D.; Kaufman, Y.J.; Herman, M.; Mattoo, S. Remote sensing of aerosol properties over oceans using the MODIS/EOS spectral radiances. J. Geophys. Res. 1997, 102, 16971–16988. [Google Scholar] [CrossRef]
  47. Gassó, S.; Hegg, D.A. On the retrieval of columnar aerosol mass and CCN concentration by MODIS. J. Geophys. Res. 2003, 108, 4010. [Google Scholar] [CrossRef]
  48. Inness, A.; Ades, M.; Agustí-Panareda, A.; Barré, J.; Benedictow, A.; Blechschmidt, A.-M.; Dominguez, J.J.; Engelen, R.; Eskes, H.; Flemming, J.; et al. The CAMS reanalysis of atmospheric composition. Atmos. Chem. Phys. 2019, 19, 3515–3556. [Google Scholar] [CrossRef] [Green Version]
  49. Morcrette, J.-J.; Boucher, O.; Jones, L.; Salmond, D.; Bechtold, P.; Beljaars, A.; Benedetti, A.; Bonet, A.; Kaiser, J.W.; Razinger, M.; et al. Aerosol analysis and forecast in the European Centre for Medium-Range Weather Forecasts Integrated Forecast System: Forward modeling. J. Geophys. Res. 2009, 114, D06206. [Google Scholar] [CrossRef]
  50. Benedetti, A.; Morcrette, J.-J.; Boucher, O.; Dethof, A.; Engelen, R.J.; Fisher, M.; Flentje, H.; Huneeus, N.; Jones, L.; Kaiser, J.W.; et al. Aerosol analysis and forecast in the European Centre for Medium-Range Weather Forecasts Integrated Forecast System: 2. Data assimilation. J. Geophys. Res. 2009, 114, D13205. [Google Scholar] [CrossRef] [Green Version]
  51. Monahan, E.C.; Spiel, D.E.; Davidson, K.L. A Model of Marine Aerosol Generation via Whitecaps and Wave Disruption. In Oceanic Whitecaps; Monahan, E.C., Niocaill, G.M., Eds.; Springer: Dordrecht, The Netherlands, 1986; Volume 2, pp. 167–174. ISBN 978-94-010-8575-5. [Google Scholar]
  52. Ginoux, P.; Chin, M.; Tegen, I.; Prospero, J.M.; Holben, B.; Dubovik, O.; Lin, S.-J. Sources and distributions of dust aerosols simulated with the GOCART model. J. Geophys. Res. 2001, 106, 20255–20273. [Google Scholar] [CrossRef]
  53. Stein, A.F.; Draxler, R.R.; Rolph, G.D.; Stunder, B.J.B.; Cohen, M.D.; Ngan, F. NOAA’s HYSPLIT Atmospheric Transport and Dispersion Modeling System. Bull. Am. Metrorol. Soc. 2015, 96, 2059–2077. [Google Scholar] [CrossRef]
  54. Giglio, L.; Schroeder, W.; Justice, C.O. The collection 6 MODIS active fire detection algorithm and fire products. Remote Sens. Environ. 2016, 178, 31–41. [Google Scholar] [CrossRef] [Green Version]
  55. Tesche, M.; Ansmann, A.; Müller, D.; Althausen, D.; Engelmann, R.; Freudenthaler, V.; Groß, S. Vertically resolved separation of dust and smoke over Cape Verde using multiwavelength Raman and polarization lidars during Saharan Mineral Dust Experiment 2008. J. Geophys. Res. 2009, 114, D13202. [Google Scholar] [CrossRef]
  56. Tesche, M.; Wandinger, U.; Ansmann, A.; Althausen, D.; Müller, D.; Omar, A.H. Ground-based validation of CALIPSO observations of dust and smoke in the Cape Verde region. J. Geophys. Res. Atmos. 2013, 118, 2889–2902. [Google Scholar] [CrossRef]
  57. Amiridis, V.; Wandinger, U.; Marinou, E.; Giannakaki, E.; Tsekeri, A.; Basart, S.; Kazadzis, S.; Gkikas, A.; Taylor, M.; Baldasano, J.; et al. Optimizing CALIPSO Saharan dust retrievals. Atmos. Chem. Phys. 2013, 13, 12089–12106. [Google Scholar] [CrossRef] [Green Version]
  58. Marinou, E.; Amiridis, V.; Binietoglou, I.; Tsikerdekis, A.; Solomos, S.; Proestakis, E.; Konsta, D.; Papagiannopoulos, N.; Tsekeri, A.; Vlastou, G.; et al. Three-dimensional evolution of Saharan dust transport towards Europe based on a 9-year EARLINET-optimized CALIPSO dataset. Atmos. Chem. Phys. 2017, 17, 5893–5919. [Google Scholar] [CrossRef] [Green Version]
  59. Proestakis, E.; Amiridis, V.; Marinou, E.; Georgoulias, A.K.; Solomos, S.; Kazadzis, S.; Chimot, J.; Che, H.; Alexandri, G.; Binietoglou, I.; et al. Nine-year spatial and temporal evolution of desert dust aerosols over South and East Asia as revealed by CALIOP. Atmos. Chem. Phys. 2018, 18, 1337–1362. [Google Scholar] [CrossRef] [Green Version]
  60. Georgoulias, A.K.; Tsikerdekis, A.; Amiridis, V.; Marinou, E.; Benedetti, A.; Zanis, P.; Alexandri, G.; Mona, L.; Kourtidis, K.A.; Lelieveld, J. A 3-D evaluation of the MACC reanalysis dust product over Europe, northern Africa and Middle East using CALIOP/CALIPSO dust satellite observations. Atmos. Chem. Phys. 2018, 18, 8601–8620. [Google Scholar] [CrossRef] [Green Version]
  61. Amiridis, V.; Marinou, E.; Tsekeri, A.; Wandinger, U.; Schwarz, A.; Giannakaki, E.; Mamouri, R.; Kokkalis, P.; Binietoglou, I.; Solomos, S.; et al. LIVAS: A 3-D multi-wavelength aerosol/cloud database based on CALIPSO and EARLINET. Atmos. Chem. Phys. 2015, 15, 7127–7153. [Google Scholar] [CrossRef] [Green Version]
  62. Winker, D.M.; Tackett, J.L.; Getzewich, B.J.; Liu, Z.; Vaughan, M.A.; Rogers, R.R. The global 3-D distribution of tropospheric aerosols as characterized by CALIOP. Atmos. Chem. Phys. 2013, 13, 3345–3361. [Google Scholar] [CrossRef] [Green Version]
  63. Tesche, M.; Müller, D.; Gross, S.; Ansmann, A.; Althausen, D.; Freudenthaler, V.; Weinzierl, B.; Veira, A.; Petzold, A. Optical and microphysical properties of smoke over Cape Verde inferred from multiwavelength lidar measurements. Tellus B Chem. Phys. Meteorol. 2011, 63, 677–694. [Google Scholar] [CrossRef] [Green Version]
  64. Marinou, E.; Tesche, M.; Nenes, A.; Ansmann, A.; Schrod, J.; Mamali, D.; Tsekeri, A.; Pikridas, M.; Baars, H.; Engelmann, R.; et al. Retrieval of ice-nucleating particle concentrations from lidar observations and comparison with UAV in situ measurements. Atmos. Chem. Phys. 2019, 19, 11315–11342. [Google Scholar] [CrossRef] [Green Version]
  65. Düsing, S.; Wehner, B.; Seifert, P.; Ansmann, A.; Baars, H.; Ditas, F.; Henning, S.; Ma, N.; Poulain, L.; Siebert, H.; et al. Helicopter-borne observations of the continental background aerosol in combination with remote sensing and ground-based measurements. Atmos. Chem. Phys. 2018, 18, 1263–1290. [Google Scholar] [CrossRef] [Green Version]
  66. Ji, Q.; Shaw, G.E. On supersaturation spectrum and size distributions of cloud condensation nuclei. Geophys. Res. Lett. 1998, 25, 1903–1906. [Google Scholar] [CrossRef]
  67. Hiranuma, N.; Kohn, M.; Pekour, M.S.; Nelson, D.A.; Shilling, J.E.; Cziczo, D.J. Droplet activation, separation, and compositional analysis: Laboratory studies and atmospheric measurements. Atmos. Meas. Tech. 2011, 4, 2333–2343. [Google Scholar] [CrossRef] [Green Version]
  68. Kar, J.; Vaughan, M.A.; Lee, K.-P.; Tackett, J.L.; Avery, M.A.; Garnier, A.; Getzewich, B.J.; Hunt, W.H.; Josset, D.; Liu, Z.; et al. CALIPSO lidar calibration at 532 nm: Version 4 nighttime algorithm. Atmos. Meas. Tech. 2018, 11, 1459–1479. [Google Scholar] [CrossRef] [Green Version]
Figure 1. Methodology for the retrieval of cloud condensation nuclei (CCN) concentrations from Cloud-Aerosol Lidar and Infrared Pathfinder Satellite Observations (CALIPSO) measurements of different aerosol types.
Remotesensing 12 01557 g001
Figure 2. CALIPSO track (dotted red line) along with different areas of interest. The track over the greater Thessaloniki area is marked with a solid red line.
Remotesensing 12 01557 g002
Figure 3. Vertical cross sections of total backscatter coefficient at 532 nm, vertical feature mask and aerosol subtypes over the whole CALIPSO track (a,c,e) and over the greater Thessaloniki area (b,d,f). The boundaries of different areas of interest along with that of Thessaloniki are overplotted.
Remotesensing 12 01557 g003
Figure 4. Vertical cross sections of the Copernicus Atmosphere Monitoring Service (CAMS) reanalysis mass mixing ratio along the CALIPSO track for sea salt (a), dust (b), carbonaceous aerosols (organic matter—black carbon)) (c), sulfates (d), and all aerosol types (e). Vertical cross section of the dominant aerosol type (f).
Remotesensing 12 01557 g004
Figure 5. The Hybrid Single-Particle Lagrangian Integrated Trajectory (HYSPLIT) 4-day back-trajectories arriving over Thessaloniki at six different heights at 00:00 UTC on 9 September 2011. Fire spots detected from Moderate Resolution Imaging Spectroradiometer (MODIS)/Terra and Aqua satellite sensors (NASA Fire Information for Resource Management System (FIRMS)) over the area for the same period are overplotted (orange diamonds).
Remotesensing 12 01557 g005
Figure 6. Vertical cross sections of CALIPSO extinction coefficients at 532 nm, and the corresponding uncertainties (using error propagation) for continental (a,b), dust (c,d), and marine aerosols (e,f).
Remotesensing 12 01557 g006
Figure 7. Vertical cross sections of CALIPSO-derived CCN concentrations, and the corresponding uncertainties (using error propagation), at a supersaturation of 0.15% for continental (a,b), dust (c,d), and marine aerosols (e,f). Different scale is used for continental CCNs (values up to ten times larger than dust and marine CCNs).
Remotesensing 12 01557 g007
Figure 8. Profiles of CALIPSO-derived CCN concentrations for the total aerosol, for mineral dust, continental aerosols, and marine aerosols at a supersaturation of 0.15% for the Eastern Mediterranean (a), Sahara (b), and Sahel regions (c). Transparent color lines indicate an uncertainty of a factor of two.
Remotesensing 12 01557 g008
Figure 9. Profiles of CALIPSO-derived CCN concentrations for all the aerosol types together (total), for dust, continental, and marine aerosols at a supersaturation of 0.15% for the land (40.6°–41.2° N) (a) and sea (40°–40.6° N) (b) areas around Thessaloniki during the Aerosol Classification scheme over Eastern Mediterranean (ACEMED) Facility for Airborne Atmospheric Measurements (FAAM) BAe-146 flight. Transparent color lines indicate an uncertainty of a factor of two. Dry particle number concentrations retrieved with the In situ/Remote sensing aerosol Retrieval Algorithm (IRRA) algorithm using in situ and lidar remote sensing data from the ACEMED flight are shown as circles. Profiles of the original and the hydration-corrected Cloud-Aerosol Lidar with Orthogonal Polarization (CALIOP)-derived total CCN concentrations are plotted separately for the land (c) and sea (d) areas around Thessaloniki. Continental CCNs dominate and hence their profile (green color) overlaps with the total CCN profile (black line).
Remotesensing 12 01557 g009
Table 1. Original and hydration-corrected CALIPSO-derived CCN concentrations (in cm−3) and dry particle number concentrations (in cm−3), retrieved with the IRRA algorithm using ACEMED flight measurements at different height levels over Thessaloniki, Greece. The factor of two uncertainty range is given in parentheses. Columnar CCN concentrations (including particles with radius larger than 30 nm) based on the original and the corrected CALIPSO data and collocated MODIS PSML003_Ocean data (in cm−2) are also given.
AreaAltitudeCALIOP (Original)CALIOP (Hydration-Corrected)In SituMODIS
Land2.1 km1816 (908,3632)1504 (752,3008)727-
Land2.7 km4505 (2253,9010)2851 (1426,5702)1318-
Land3.2 km6370 (3185,12740)2086 (1043,4172)779-
Sea1.3 km609 (305,1218)508 (254,1016)1427-
Sea2.1 km1683 (842,3366)1405 (703,2810)1834-
Sea2.7 km1264 (632,2528)912 (456,1824)1501-
Sea3.2 km794 (397,1588)459 (230,918)2814-
Seacolumn5.51 × 108
(2.76 × 108,11.02 × 108)
4.37 × 10⁸
(2.19 × 108,8.74 × 108)
-7.27 × 10⁸

