Article

Characterization of Background Temperature Dynamics of a Multitemporal Satellite Scene through Data Assimilation for Wildfire Detection

by
Gustave Udahemuka
1,*,
Barend J. van Wyk
2 and
Yskandar Hamam
1,3
1
Department of Electrical Engineering & French South African Institute of Technology, Tshwane University of Technology, Private Bag X680, Pretoria 0001, South Africa
2
Faculty of Engineering, the Built Environment and Technology, Nelson Mandela University, P.O. Box 77000, Port Elizabeth 6031, South Africa
3
École Supérieure d’ Ingénieurs en Électrotechnique et Électronique, Cité Descartes, BP 99, Noisy-le-Grand, 93162 Paris, France
*
Author to whom correspondence should be addressed.
Remote Sens. 2020, 12(10), 1661; https://0-doi-org.brum.beds.ac.uk/10.3390/rs12101661
Submission received: 26 March 2020 / Revised: 26 April 2020 / Accepted: 5 May 2020 / Published: 21 May 2020

Abstract

:
Detection of an active fire in an image scene relies on an accurate estimation of the background temperature of the scene, which must be compared to the observed temperature, to decide on the presence of fire. The expected background temperature of a pixel is commonly derived based on spatial-contextual information that can overestimate the background temperature of a fire pixel and therefore results in the omission of a fire event. This paper proposes a method that assimilates brightness temperatures acquired from the Geostationary Earth Orbit (GEO) sensor MSG-SEVIRI into a Diurnal Temperature Cycle (DTC) model. The expected brightness temperatures are observational forecasts derived using the ensemble forecasting approach. The threshold on the difference between the observed and expected temperatures is derived under a Constant False Alarm Rate (CFAR) framework. The detection results are assessed against a reference dataset comprised of MODIS MOD14/MYD14 and EUMETSAT FIR products, and the performance is presented in terms of user’s and producer’s accuracies, and Precision-Recall and Receiver Operating Characteristic (ROC) graphs. The method has a high detection rate when the data assimilation is implemented with an Ensemble Kalman Filter (EnKF) and a Sampling Importance Resampling (SIR) particle filter, while the weak-constraint Four-Dimensional Variational Assimilation (4D-Var) has comparatively lower detection and false alarm rates according to the reference dataset. Consideration of the diurnal variation in the background temperature enables the proposed method to detect even low-power fires.

Graphical Abstract

1. Introduction

Data acquired from satellite sensors are widely used in the automatic detection of active wildfires. Fire detection techniques supported by such data provide the most feasible and practical means for the detection and continuous monitoring of regional and global fire activities [1]. Though data used in the design of satellite-based fire detection have been acquired from sensors onboard sun-synchronous Low Earth Orbit (LEO) systems (mainly polar satellites) and onboard GEO satellites, thermal imagery data obtained from the global system of GEO sensors are the most appropriate satellite-based data for early fire detection in most regions of the earth susceptible to wildfires. The devastating effects of wildfires on land, atmosphere, flora, and fauna can be mitigated when wildfire outbreaks are timely detected to enable early interventions.
In thermal-based fire detection, satellites have relied on images received from the fire-sensitive Mid-Infrared (MIR) spectral window (i.e., 3–5  μ m spectral range) to distinguish fire and non-fire pixels. This spectral region is highly sensitive to temperatures of vegetation fires—covering even a subpixel scale—and is less affected by solar reflections than the Shortwave Infrared (SWIR) spectral window. A pixel in a satellite image is directly or implicitly flagged as a fire pixel when the pixel’s observed temperature is significantly higher than its expected background temperature—the latter defined as the expected temperature of a pixel under non-fire condition. The first satellite-based remote sensing techniques for hotspot detection were developed using data from the LEO systems. Given the LEO system’s high spatial resolution advantage, the expected background temperature was extracted from spatial-contextual information (for example, see [2,3,4,5,6,7]). A pixel’s expected background temperature can also be estimated using a multitemporal model for the evolution of a pixel’s background temperature. It can also be defined using multispectral information either by assuming that the temperatures derived from the fire-sensitive MIR spectral window channel and temperatures derived from the earth surface-sensitive Long-Wave IR (LWIR) spectral window channel during non-fire conditions are correlated or by performing spectral unmixing [8,9]. Since GEO fire-sensitive MIR data were available, most GEO-based fire detection techniques were conceived by adapting the pre-existing LEO methods on GEO data. These techniques used the same spatial-contextual information to define the expected pixel’s background temperature during fire detection [10,11,12,13,14] or fire confirmation [15,16,17]. A spatial-contextual mechanism has its drawbacks, such as Point Spread Function (PSF) effect, spatial heterogeneity, and undetected cloud-contaminated pixels that contribute to both omission and commission errors [1,18,19]. The performance of such techniques is also restricted by the low spatial resolution of GEO data. GEO sensors have a high temporal resolution, and exploiting the high temporal resolution enhances the chance of detecting a fire at ignition. Given that fires are generally small when started, the high-temporal data can then allow the detection of small and low-power fire events, typically only possible with the LEO system [20,21,22]. In this study, GEO satellite temporal MIR data are assimilated into the model of DTC parameters of a pixel to describe non-fire background temperature dynamics to aid the early detection of wildfires. Temporal information incorporates land surface characteristics, but to also consider the weather and atmosphere, a combination of temporal, spatial, and spectral information must be assimilated into the background temperature model of a pixel.
Multitemporal fire detection algorithms define the expected pixel’s background brightness temperature in MIR in different ways. The detection statistic termed intensity index [23,24] defines the pixel’s expected background temperature as the mean of observed temperatures at the same time of the day and month of the year. Likewise, the temporal test for fire confirmation proposed by [17] defines the pixel’s expected background temperature as the mean at the same time of the day in a series of thirty days, and the temporal test in the fire detection method proposed by [25,26] that exploits the polar-orbiting NOAA-AVHRR MIR spectral channel, is determined as the mean of the brightness temperatures over a number of days prior to the inspected day. The change detection algorithm proposed by [27,28] defines the expected difference between a pixel’s background temperature and an auxiliary temperature at the current time as the difference of observed brightness temperature and auxiliary temperature at an anterior non-fire time. The time to an anterior time can be fixed to the minimum time between successive images up to and not exceeding twenty-four hours, and the auxiliary temperatures are modeled as temperatures that represent the natural evolution of temperatures and can be, among others, non-fire atmospherically corrected temperatures of the current day or previously observed DTC with no cloud or fire-contaminated samples. In computation of a detection statistic named ‘time differential index’, a fire detection method proposed by [24] predicts the expected difference between a pixel location’s background temperature at the current time to its background temperature at a previous time—the previous time and the current time are at the same time of the day and month of the year. Instances of cloud cover or missing samples in the available data up to the inspection time hinder the derivation of the expected background temperature in these multitemporal fire detection methods. The problem can be solved by interpolating the invalid values due to cloud cover or fire events. The interpolation is achievable by fitting available valid brightness temperatures to a physics-based or data-driven DTC model to produce the expected DTC of the current day of a pixel location that can be used to define the expected background temperature at an inspection time. Given the presence in observed temperatures at the Top Of the Atmosphere (TOA) of outliers, mainly cloud or fire-contaminated samples, the fitting can be undertaken by first detecting and removing outliers. However, instances of missed detection of clouds or fire events negatively affect the results of the estimation of the expected background temperatures. Another option is to use methods from robust statistics to avoid the need for clearing outliers from the data. A robust fit of a DTC model on past observed DTCs has been used to represent a pixel’s background temperature [29,30,31]. Some fire detection techniques apply, in one of their multiple tests, a dynamic threshold on observed MIR brightness temperature, and the threshold varies with the solar zenith angle [15,28,32]. This dynamic threshold that is also used by the current version (i.e., the third version) of the EUMETSAT FIR product [13,33] implicitly represents the pixel’s background temperature dynamics. Similar to the robust fit on previous DTCs, the dynamic threshold avoids the influence of both cloud and missed fire events on the result of the fire detection, but does not consider the particularity of a day: the dynamic threshold does not change with the day, and the robust fit on previous DTCs assumes that the previous days define the whole of the current day. To include all past temporal information on a pixel when deriving its expected brightness temperature, methods based on recursive Bayesian estimation adjust the expected brightness temperature of a pixel each time new information becomes available. The background temperature is derived by a Kalman filter-based prediction using one of the physics-based or data-driven DTC models as the forecast model that determines the time evolution of the background temperature [29,34,35,36]. The new valid observed brightness temperature, when available, is assimilated into the background temperature model. The expected background temperature can also incorporate both multitemporal and spatial information. For example, the spatial differential index proposed by [24], regressing the inspected image in the current scene on a number of past images of the scene [37,38], expected background temperature of a pixel as a convex combination of a spatial-contextual estimate and a temporal estimate [39], and a fire detection method proposed by [40] determines the expected rise of a pixel’s background radiance with respect to its neighborhood’s background temperature from a recent image, acquired at the same time of the day, of a non-fire condition on the pixel location and its neighbors. The background temperature can also be derived from information extracted from both multitemporal and multispectral information. For example, the method proposed by [41] predicts MIR background temperature from the earth sensitive LWIR temperature using a linear relation derived from the principal components of a temporal sequence of non-fire MIR and LWIR brightness temperatures. The current multitemporal fire detection methods based on recursive Bayesian estimation, first derive the expected DTC of a day (i.e., the model of a day) online before the start of the day and data are assimilated at observation time into the expected DTC. The derivation of the expected DTC of a day allows only for the inclusion of recent observed DTCs with a short period of invalid data (cloud or fire-contaminated data or missing data) into the training set but observed DTCs with a long period of invalid data are not included. The model of a day is also expected to change with land cover/use change, season, and even weather. Given that the model of a day is derived from previously observed DTCs, the required number of recent valid DTCs to include in the training set might not be available for a given period of no change in a pixel location. This approach, therefore, does not adapt rapidly to non-fire change on land or in the atmosphere, for example, in the aftermath of a fire on a pixel location. This paper, with the aim of rapid adaptation to normal change, proposes a method that derives the background temperature by assimilating data into the model of DTC’s parameters of a pixel location each time valid observations are available to estimate the vector of the best DTC model parameters, which is the initial value of the forecast. The ensemble forecasting approach is applied from the data assimilation time for a skillful forecast that is used to determine the expected background temperatures of a pixel location onward.
The method proposed in this paper implements an early active fire detection by subtracting the observed temperature from the expected background temperature to obtain the prediction residual at an inspection time in a given pixel location. The residual value is compared to an adaptive threshold computed using a CFAR framework to decide whether the pixel location is burning. The dynamics of the background temperature are described using a state-space model. The variables of the forecast model are a subset of the parameters of the DTC model proposed by [42] (this model is referred to as the BER06 model in this paper), and the forecast model variable vector is modeled as a Gaussian random walk process. Two types of data are assimilated into the model of the DTC parameters at each data assimilation cycle, namely, the observed TOA brightness temperatures derived from the MIR window data acquired from the MSG-Spinning Enhanced Visible and Infrared Imager (SEVIRI) sensor and the observed offsets of the thermal sunrise (i.e., the start time of a DTC) of a day to the sunrise of the same day. The latter is assimilated to transition from one DTC to the subsequent DTC. To produce a smooth continuous data assimilation result in the temporal dimension, three data assimilation methods—each offering different assimilation advantages—were separately used. A variational data assimilation method, which emulates the weak-constraint 4D-Var and is implemented only in the time dimension (one-dimensional analysis), performs a point estimation of the posterior. Two sequential data assimilation methods, namely the classical EnKF and SIR particle filter, estimate the posterior probability density function (pdf). The three methods are compared in terms of detection performance that depends on their ability to estimate the dynamics of the background brightness temperatures. The expected background brightness temperature is the observational forecast determined through model integration from the initial state and defined at a given False Alarm Rate (FAR). Observational forecasts are assumed to be uncorrelated across spatial and temporal dimensions, and the same for real observations. The observational forecasts and real observations are also assumed uncorrelated, and as result, each pixel is assessed independently from its neighbors and only the temporal dimension used to compute the expected background temperature. The proposed method has less computational complexity in terms of time than methods that rely on fitting past observations to a DTC model to determine the expected background temperature [29,31,34,35,36]. The computation time is reduced because the model fits are only required when the proposed detection system is launched to determine the initial values at launch. The proposed method is expected to achieve higher accuracy than that of other temporal fire detection methods because the estimation of background temperature is based even on the most recent non-fire observation without relying on the expected DTC of a day, and the detection uses a CFAR threshold to adapt to any non-fire condition in a single pixel location and to adapt to any region. Since the MIR spectral window is affected by solar reflections, cloud cover increases both omission and commission errors. Cloud detection and the masking of cloud-contaminated samples are usually undertaken as a pre-processing step, and fire detection results depend then on the accuracy and detection threshold of the cloud detection mechanism of choice. In this study, no step is taken to clear cloud samples from data. The potential improvement to the proposed method includes the assimilation of data in more dimensions than just the temporal dimension and the assimilation of more types of data to better characterize the background temperature dynamics under cloud cover. The identification of a water body is implemented as a post-processing step. This is done to set water body pixels, which might have been falsely classified as fire or undecided, to a non-fire status. The detection is assessed in terms of user’s accuracy (i.e., the performance in terms of commission error), producer’s accuracy (i.e., the performance in terms of omission error), and Precision-Recall and ROC graphs using data on a region of Southern Africa during the dry winter season of 2007. The detection performance of the proposed method is assessed and discussed using EUMETSAT FIR and MODIS MOD14/MYD14 active fire products.

2. Materials and Methods

2.1. Fire Detection Algorithm

Observed data are assimilated into the background DTC model. In this study, the data assimilation is implemented at each time a new observation is flagged as a non-fire observation (i.e., fire-contaminated samples are not assimilated). The data assimilation aims to derive better initial conditions of forecasts. The data assimilation and the forecast model of the background temperatures are presented in Section S1 of the Supplementary Materials to this article. The expected background temperature of a pixel is derived from the forecasts initiated at the time of the assimilation of data. The forecast is achieved using the ensemble forecasting scheme, described in Section S1 of the Supplementary Materials of this article. The shortest-range ensemble forecasts of brightness temperature verifying at the inspection time k in a pixel location represent the distribution of the background (non-fire ) temperature of the pixel location at time step k. The mean value of this ensemble is the expected value of the background (non-fire ) temperature of the pixel location at a time step k. The initial condition of the forecast is derived using the weak constraint 4D-Var with a data assimilation window of length N w = 6 , the EnKF with number of ensemble N e = 51 , and the SIR particle filter with number of particles N p = 51 .
The input to the fire detector comprises the observations (brightness temperatures in IR 3.9 MSG spectral channel) at the inspection time, not yet assimilated. It also comprises the expected distribution of the background temperature (non-fire temperature) of each pixel location at the inspection time. A pixel is classified as belonging to either the fire class or the non-fire class using an anomaly detection (one-class classification) mechanism. At each inspection time, only statistics on the non-fire class are available—i.e., this study models only the pixel’s non-fire condition and not the fire condition. The brightness temperatures in the IR 3.9 MSG spectral channel y 1 ( t k ) y 1 , k are mapped into the feature space that easily enables identification of the two classes with fewer fire omissions and false alarms. The aim is to detect the start and end of a fire with minimum delay and to monitor fire in real time. The extracted feature (or derived sufficient statistic for the detection) at time step k in a given pixel location is the difference between the pixel’s observed temperature and the pixel’s expected background temperature. The difference is the prediction residual expressed as
r k = y 1 , k 1 N e i h 1 , k x k f
where x k f is the forecast state, y 1 , k is the observed brightness temperature, and h 1 , k ( · ) is the observation operator relating the state vector to the observed brightness temperature. The predictable component of the brightness temperature (the expected background temperature) is filtered out from the observation to get the prediction residual. The (conditional) distribution of the prediction residual under non-fire class (i.e., p ( y 1 , k | x k , condition = non-fire ) ) is estimated. The classifier is applied to a prediction residual and outputs either non-fire pixel (do not reject H 0 ) or fire pixel (reject H 0 ) based on a decision boundary (threshold T k ) in the feature space provided by a CFAR detector whose design is detailed in Section 2.2. The fire detection algorithm is summarized in Algorithm 1. When the analysis is implemented using the weak-constraint 4D-Var, the feature extraction (residual generation) and the fire reporting start at k = 6 (end of the first analysis cycle), and five first samples are assumed to be under non-fire condition. When the analysis is achieved by the EnKF and the SIR particle filter, the fire reporting starts at k = 1 . Hereafter, we refer to the fire detection method according to the method used during the data assimilation stage. The weak constraint 4D-Var with a data assimilation window of length N w = 6 , the EnKF with the number of ensemble N e = 51 , and the SIR particle filter with the number of particles N p = 51 belong, respectively, to 4D-Var-CD ( N w = 6 )  method, EnKF-CD ( N e = 51 )  method, and the SIR-CD ( N p = 51 )  method.
Algorithm 1. Fire detection algorithm.
1: Initialize k
2: for each time step k do
3:  Given the analysis at k Δ [i.e., { x k Δ , i a } 1 51 for the ensemble-based analysis or x N w 1 , k Δ a for the weak-constraint 4D-Var
  (see Algorithm S1 in the Supplementary Materials)], forecast and extract ensemble forecasts at k [i.e., x k , i f | Y k Δ , i = 1 , , N e
  where Δ > = 1 is the shortest time from the past analysis, and N e = 51 is the number of ensemble members].
4:  Collect the observation y 1 , k
5:  Generate feature data r k (see Equation (1))
6:  if r k > T k then
7:   fire_detected ⇐ true (pixel flagged as fire pixel)
8:  else
9:   fire_detected ⇐ false (pixel flagged as non-fire pixel)
10:  end if
11: end for

2.2. Design of a CFAR Based Fire Detection

The optimal threshold on detection statistics (i.e., the prediction residual r k ) can only be derived when both the distribution of the fire (target) temperature and the distribution of the background temperature (non-fire temperature) are provided or estimated. Given that the background temperatures of a pixel location are modeled in this study (state-space model given by Equations (S2), (S5) and (S6)), and the distribution of background temperature can then be estimated while the distribution of fire temperature is unknown (i.e., no information on parameters of fire conditions is provided), a convenient design criterion that can be used to design fire detection system in online detection format consists of minimizing the delay for detection (that results in few omissions) for a fixed probability of false alarm (i.e., CFAR). The CFAR detector sets an adaptive threshold on the feature data r k based on the allowed level of false alarm probability (i.e., FAR). We assume that the non-fire prediction residual r k in one-pixel location over a lapse of one day long is independent and identically distributed (i.i.d) (a range of one day is taken to satisfy a compromise between the time before the land surface change and sufficient samples to characterize a time step k). Then, the CFAR window, R * , k , under H 0 , contains 96 consecutive fire-free samples (in a temporal CFAR mechanism considering every single pixel independently) generated up to time step k 1 . Since in a given moving window of 96 samples, some samples can be fire contaminated, samples are selected from time step k 1 down to the launch time of the detector, skipping fire-contaminated samples. Thus, the need for a censoring procedure is then lessened.
A simulation test was conducted to select the most suitable parametric model of the probability distribution of non-fire prediction residuals in a reference set R * , k (the pdf of R * , k under H 0 is denoted by f R * , k ( r k | H 0 ) ) and to model the relationship between the threshold coefficient γ ^ and the false alarm rate P F A , given that
P F A = P ( R * , 0 k > γ ^ | H 0 ) = γ ^ f R * , 0 k ( r 0 k | H 0 ) d r 0 k
where r 0 k is the standardized variate derived from the original variate r k , and R * , k is a random variable whose possible value is r k . The simulation was conducted by randomly drawing 2500 land pixel locations among land pixels not affected by fire (non-fire pixel) according to MODIS MOD14/MYD14 and EUMETSAT FIR products over a period of seven days, from 30 July 2007 at 12:00 a.m. UTC, and per each pixel location, randomly drawing 20-time instants from 31 July 2007. A uniform draw by a simple random sampling (with replacement) was performed using the Mersenne Twister pseudorandom number generator, which was initialized once at the start of the simulation (of each analysis method); and the simulation counts then a total of 50,000 realizations. Each pixel is described by a sequence of immediate previous 96 samples of r k of its location, which forms a set of generated prediction residuals under H 0 (i.e., one realization of the simulation). The suitable parametric model f R * , k ( r k | H 0 ) is asserted, taking into consideration that the medium was not cleared of outliers (e.g., clouds, fire-contaminated samples not reported by MODIS MOD14/MYD14 and EUMETSAT FIR products) and occurrences of possible abrupt changes in the DTC models from one day to the next (e.g., an unexpectedly hot day). After inspection of histograms of R * , k , the distribution of the test statistic, r k , was assumed to be unimodal, and of Location-Scale (L-S) type for the detection to conform to the CFAR requirements [43]. Based on the high proportion of the sets whose distributions have an excess kurtosis ( G 2 ) strictly less than 3 (i.e., a moderate kurtosis), and also based on the values of the first quartile, third quartile and the minimum of G 2 of the sets (presented in Table 1), Gaussian distribution and other L-S types, leptokurtic family of distributions with a moderate kurtosis can model the distribution of the prediction residual. The proportion of the sets with a skewness ( G 1 ) between 0.5 and 0.5 , and the first and third quartiles of G 1 of the sets recorded in Table 1, show that the distribution of prediction residual exhibits a considerable negative skewness. However, Anderson–Darling (A–D) goodness-of-fit test (using Best Linear Unbiased Estimate (BLUE) parameter estimates of distributions), implemented per analysis method, did not reject the null hypothesis of Gaussian distribution, at 1 % nominal significance level, of a high number of the sets of prediction residuals compared to the number of the sets that were not rejected under the null hypothesis of the Gumbel distribution for minima (reverse Gumbel) distribution at the same significance level (see observed rejection rate of H 0 presented in Table 1). Student’s t location-scale distribution is also generally applicable to the region of interest for non-fire pixels. However, a global constant shape parameter (i.e., the number of degrees of freedom ν ) must be determined per analysis method. The prediction residuals under H 0 when the analysis is implemented using 4D-Var-CD ( N w = 6 ) can also better be modeled by reverse Gumbel distribution. In this study, Gaussian distribution was selected as a single parametric model of the detection statistic r k under H 0 when any of the three different methods of analysis is used to initialize the forecast. It is defined by its BLUE of the location parameter ϕ ^ L ( R * , k ) and BLUE of the scale parameter ϕ ^ S ( R * , k ) extracted from the reference set R * , k at time step k. After the launch of a detection system, before 96 non-fire prediction residuals in the window R * , k are available, the location parameter is assumed to be zero at time step k and the scale parameter is the standard deviation of the prediction residuals estimated beforehand via the simulation test. For each of the randomly drawn 2500-pixel locations, and each analysis method (each pixel had 569 samples starting from 30 July 2007 at 5:57 a.m. UTC (this is the Level 1.5 image time)), the variance of the predictions was found first for each pixel location. Then, the median of these variances was retained. The estimated global variances are listed in Table 1.
Given equivariant estimators, ϕ ^ L ( R * , k ) and ϕ ^ S ( R * , k ) , for the location and the scale, respectively, at time step k estimated from the reference set R * , k , the detection is declared if the prediction residual at time step k exceeds the threshold T k given by
T k = ϕ ^ L ( R * , k ) + γ ^ ϕ ^ S ( R * , k )
By keeping the threshold coefficient γ ^ constant, the false alarm rate P F A is expected to be conserved in time and space. The threshold coefficient for r k (or the ( 1 P F A ) -quantile of the empirical distribution of r k ) under H 0 , used for this temporal detection, is modeled as
γ ^ = a ln ( P F A ) + b P F A + c
where P F A is the admissible false alarm rate. The number of samples in R * , k must also be an explanatory variable to this model, but, given that this number is constant, it is ignored. Parameters a, b, and c of the threshold coefficient model are obtained by MC simulations (50,000 runs from 2500 random pixel locations and 20 timestamps per pixel location, explained above in this section). For each MC run, 96 prediction residuals are standardized with location and scale parameters obtained by BLUE. The empirical Cumulative Distribution Function (CDF) is found for each random instant time of a random pixel location, and ( 1 P F A ) -quantile function is determined considering γ ^ > 0 . A Least Squares (LS) model fit on the threshold coefficient function given by Equation (4) is implemented using a Nelder–Mead simplex method with the initial parameters being the parameters obtained by fitting ( 1 P F A ) -quantile function of the standard Gaussian distribution on the function model for P F A ranging from 10 6 to 0.5 with a step of 10 6 . The coefficients found (with their 95 % sample confidence interval) are depicted in Table 2.

3. Results

3.1. Experimental Data and Detection Algorithm Setup

For our experiments, we used the MSG-SEVIRI IR 3.9 images covering a region of Southern Africa spanning from ( 20 S , 23 E ) to ( 33 S , 38 E ) (precisely, from pixel ( 778 , 822 ) to pixel ( 1153 , 1094 ) ; i.e., a 376 × 273 MSG Level 1.5 image data) recorded late July 2007 to early August 2007 (i.e., during the winter fire episode of 2007). Each image of the region counts 22 , 934 water pixels that fall in water bodies, identified through MODerate Resolution Imaging Spectroradiometer (MODIS) land/sea mask product (MOD03) and manual visual inspection. Estimation of background temperatures and detection algorithms run on all pixels of the study area, and water-body pixels are masked out after detection to report fires exclusively on land pixels. A fire that is detected in a single pixel at a given inspection time k is counted as one fire event, then instants of fire events are scrutinized. Fire detection results are reported per FAR and per analysis method. Moreover, no cloud screening is implemented (but noting that a very cloudy DTC or very fired DTC or water pixel DTC is more likely removed from the training set based on conditions set on DTC parameters highlighted in Table S2 in the Supplementary Materials), and no sunglint-contaminated sample screening is implemented. MATLAB is used to implement and test the proposed fire detection method (The source codes are publicly available online at https://github.com/satfiretech/fire-dataAssimilation).

3.2. Performance Evaluation Metrics

Results of fire detection are assessed and compared using two performance accuracies, user’s accuracy (a measure of the commission error) and producer’s accuracy (a measure of the omission error), given by
user s accuracy ( U ) = # correctly reported f i r e pixels # reported f i r e pixels
producer s accuracy ( P ) = # correctly reported f i r e pixels # f i r e pixels
where the # S stands for the cardinality of a set S, ‘ # f i r e pixels ’ is the number of fire pixels reported by the reference data product, namely MODIS MOD14/MYD14 and EUMETSAT FIR, ‘reported fire pixels’ is the number of pixels reported by the designed (proposed) fire detection algorithm (per analysis method), and ‘correctly reported fire pixels’ is the number of fire pixels according to the reference data products correctly reported (classified) by the designed algorithms. The performance of the fire detection method is also assessed through two performance curves, a graph of user’s accuracy against producer’s accuracy (also known as Precision-Recall curve) and ROC curve. The Precision-Recall curve is sensitive to both class skews and varying unequal/asymmetric misclassification (error) costs (i.e., when the cost of misclassifying a sample from one class is much higher than the cost of misclassifying a sample from the other class) while the ROC curve is insensitive to both [44], and the class skews are evident in a fire detection application where the true instances of non-fire class occur much more often than the true instances of fire class. However, due to a high number of non-fire pixels compared to fire pixels, the Precision-Recall curves visually expose clearer the difference between the detection methods, in a given FAR range of interest, that is not noticeable in the ROC space [
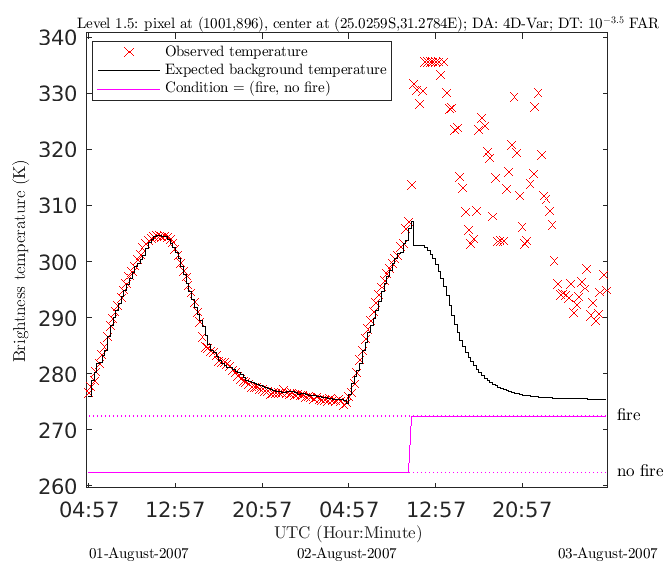
45]. The pixel reported as fire pixel by the validation fire products but is reported by the proposed fire detection method as a non-fire pixel or or has NaN (expected) background brightness temperature or has NaN observation (i.e., instant of completely missing data [missed pixels]), is counted as a missed detection. If an MSG-SEVIRI pixel containing more than one MODIS fire pixel is not reported as a fire pixel by a proposed fire detection algorithm, then all MODIS MOD14/MYD14 fire pixels belonging to the MSG pixel are missed (i.e., counted only under ‘fire pixels’), while if reported as a fire pixel, all MODIS fire pixels belonging to the MSG pixel are detected (i.e., counted under ‘correctly reported fire pixels’ and ‘fire pixels’). The process of deriving the best admissible CFAR at which a fire detection system can operate can be conducted during a phase that can be referred to as the ‘detection calibration phase’ using an available validation set [reference data] (in this study, the validation set is made solely of MODIS MOD14/MYD14 and EUMETSAT FIR reports). The operational CFAR (or the best CFAR for a detection method according to the reference data) can be determined based on different criteria. This study determines the operational CFAR, as a FAR, that minimizes an error function J, given by
J ( F A R ) = c ( non-fire | f i r e ) p ( f i r e ) 1 P ( F A R ) + c ( f i r e | non-fire ) p ( non-fire ) F A R m ( F A R )
where p ( f i r e ) and p ( non-fire ) are the prior probability that a fire condition and a non-fire condition, respectively, will occur – they represent the proportion of correct fire or non-fire pixels to the sum of all pixels, and can be referred to as fire or non-fire true class distribution, respectively. p ( f i r e ) and p ( non-fire ) are representations of class skews. c ( non-fire | f i r e ) and c ( f i r e | non-fire ) are the misclassification cost of omission and cost of commission, respectively. F A R m is the measured FAR while the variable F A R is the design FAR (known also as the nominal or the estimated FAR). Noting that the detection cost function J ( · ) given by Equation (7) assumes that the cost of correct classifications is zero, and J ( · ) accounts of class skew [46].

3.3. Fire Detection Performance
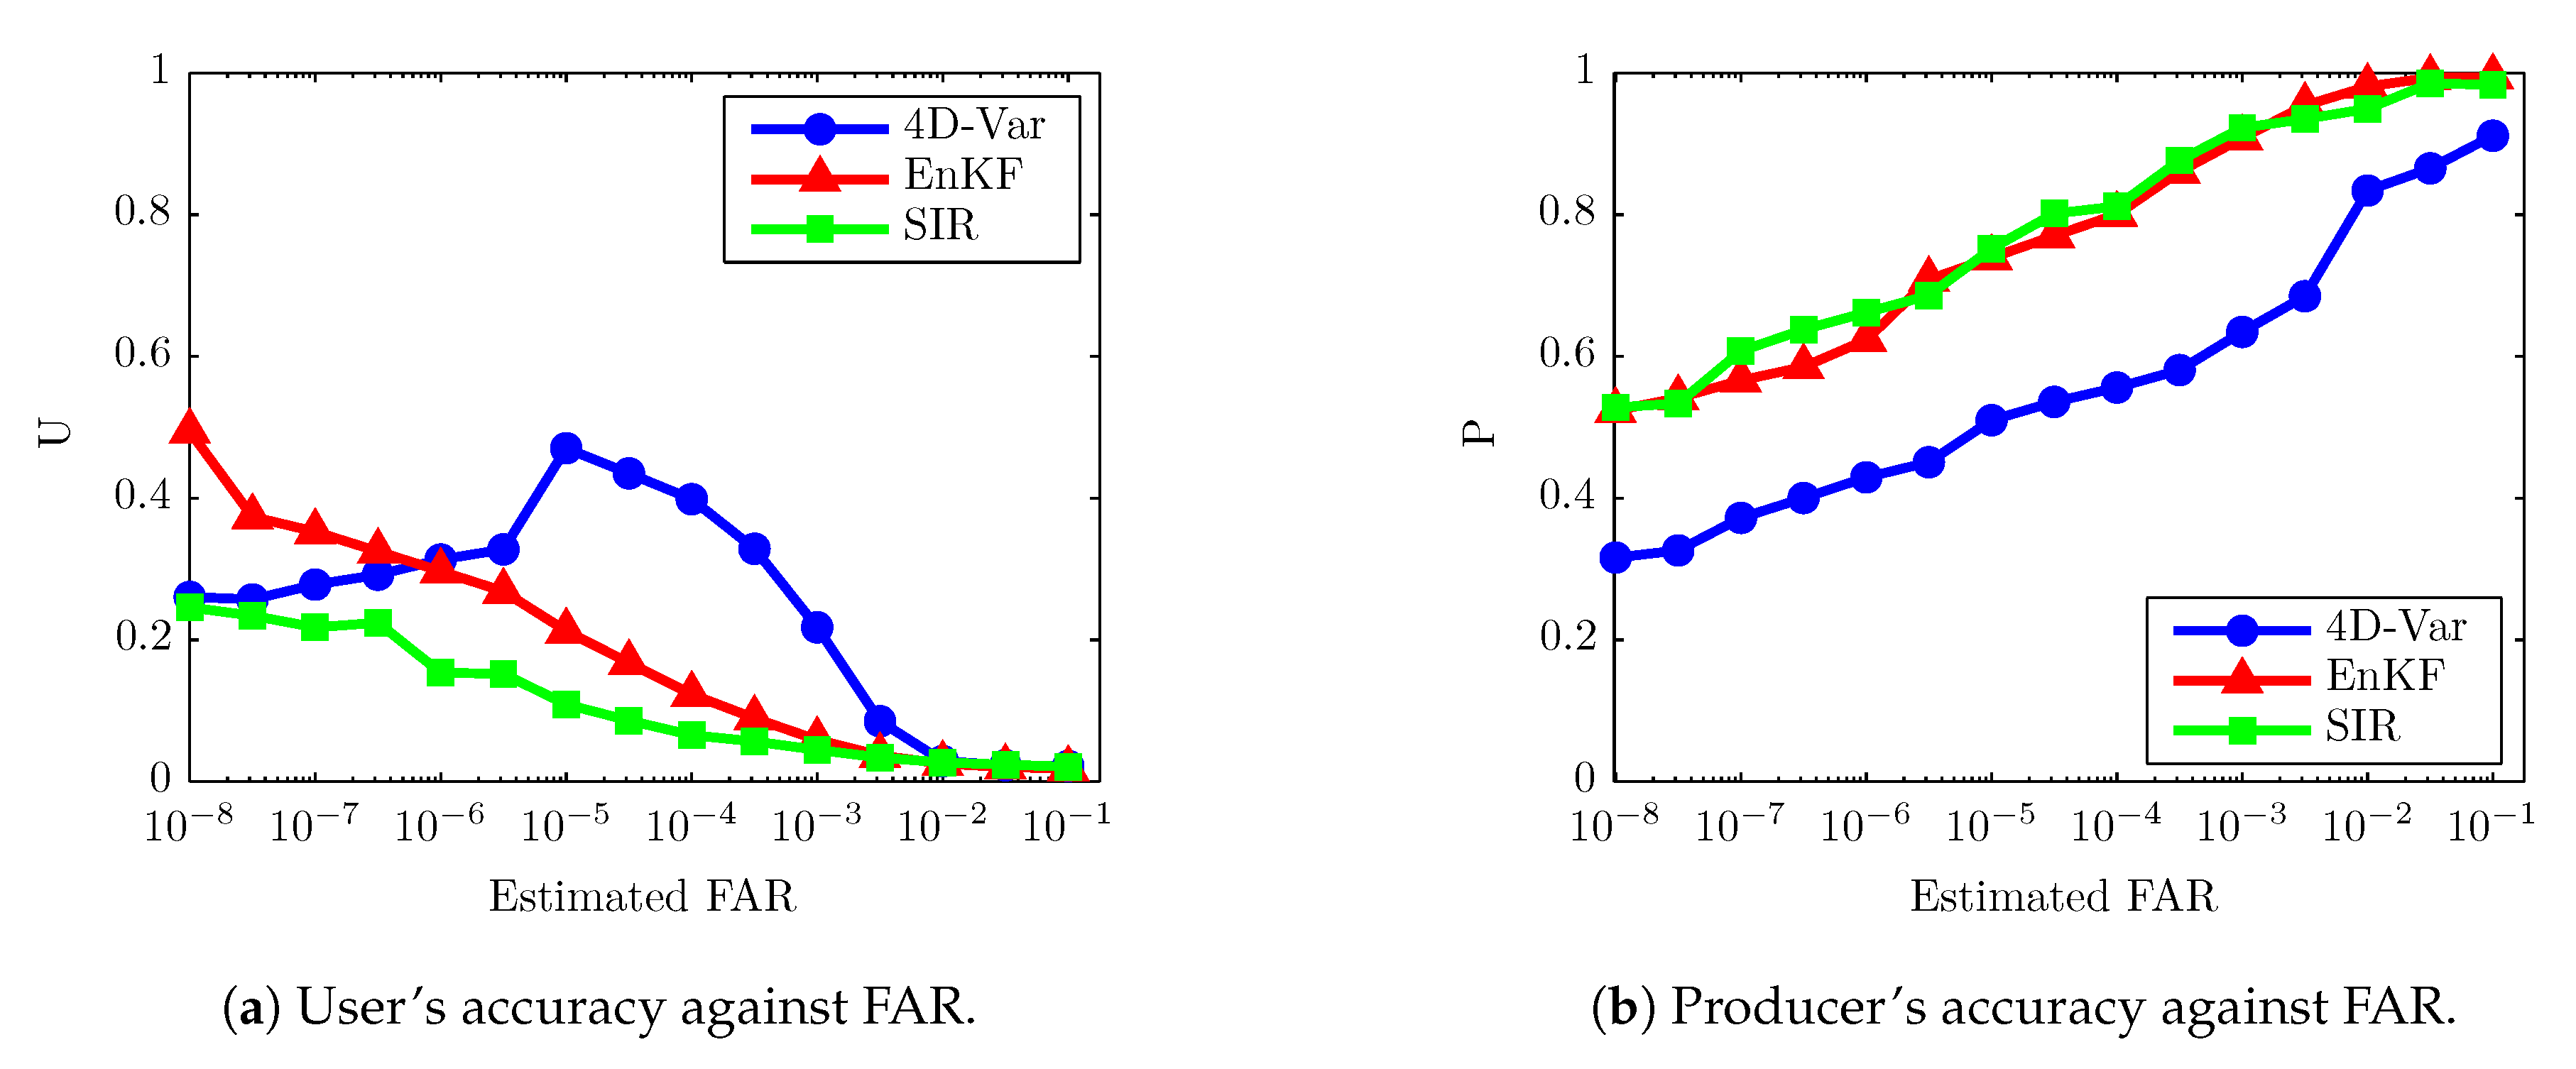
User’s accuracy (U) and producer’s accuracy (P) computed per estimated FAR are shown in Figure 1a and Figure 1b, respectively. The two accuracies are derived from the fire results of the proposed fire detection algorithms in the study area for the period of 31 July 2007 to 4 August 2007. The validation reference data are made of a combination of EUMETSAT FIR, and MODIS MOD14/MYD14 reports. MODIS detection time is rounded off to the nearest MSG-SEVIRI detection time (detection time is 12 min ahead of Level 1.5 observation time). 4D-Var-CD ( N w = 6 ) performs better than other detection methods in terms of U (gives less commission errors) except at the low estimated FARs. However, the low estimated FAR region was not considered during the design of the CFAR detector (the estimation of FAR starts from 10 6 to 0.5 as indicated in Section 2.2). For the estimated FARs in the low FAR region (i.e., high threshold values), 4D-Var-CD ( N w = 6 ) can produce a lot of false alarms given that the assimilation window of 4D-Var is more likely to contain more missed fire samples. SIR-CD ( N p = 51 ) performs worse than both 4D-Var-CD ( N w = 6 ) and EnKF-CD ( N e = 51 ) in terms of U. At high estimated FAR, all methods give similar results in terms of U. Overall, SIR-CD ( N p = 51 ) performs better than other methods in terms of P (low omission error or high probability of detection), and at some estimated FARs, it performs more like EnKF-CD ( N e = 51 ) .
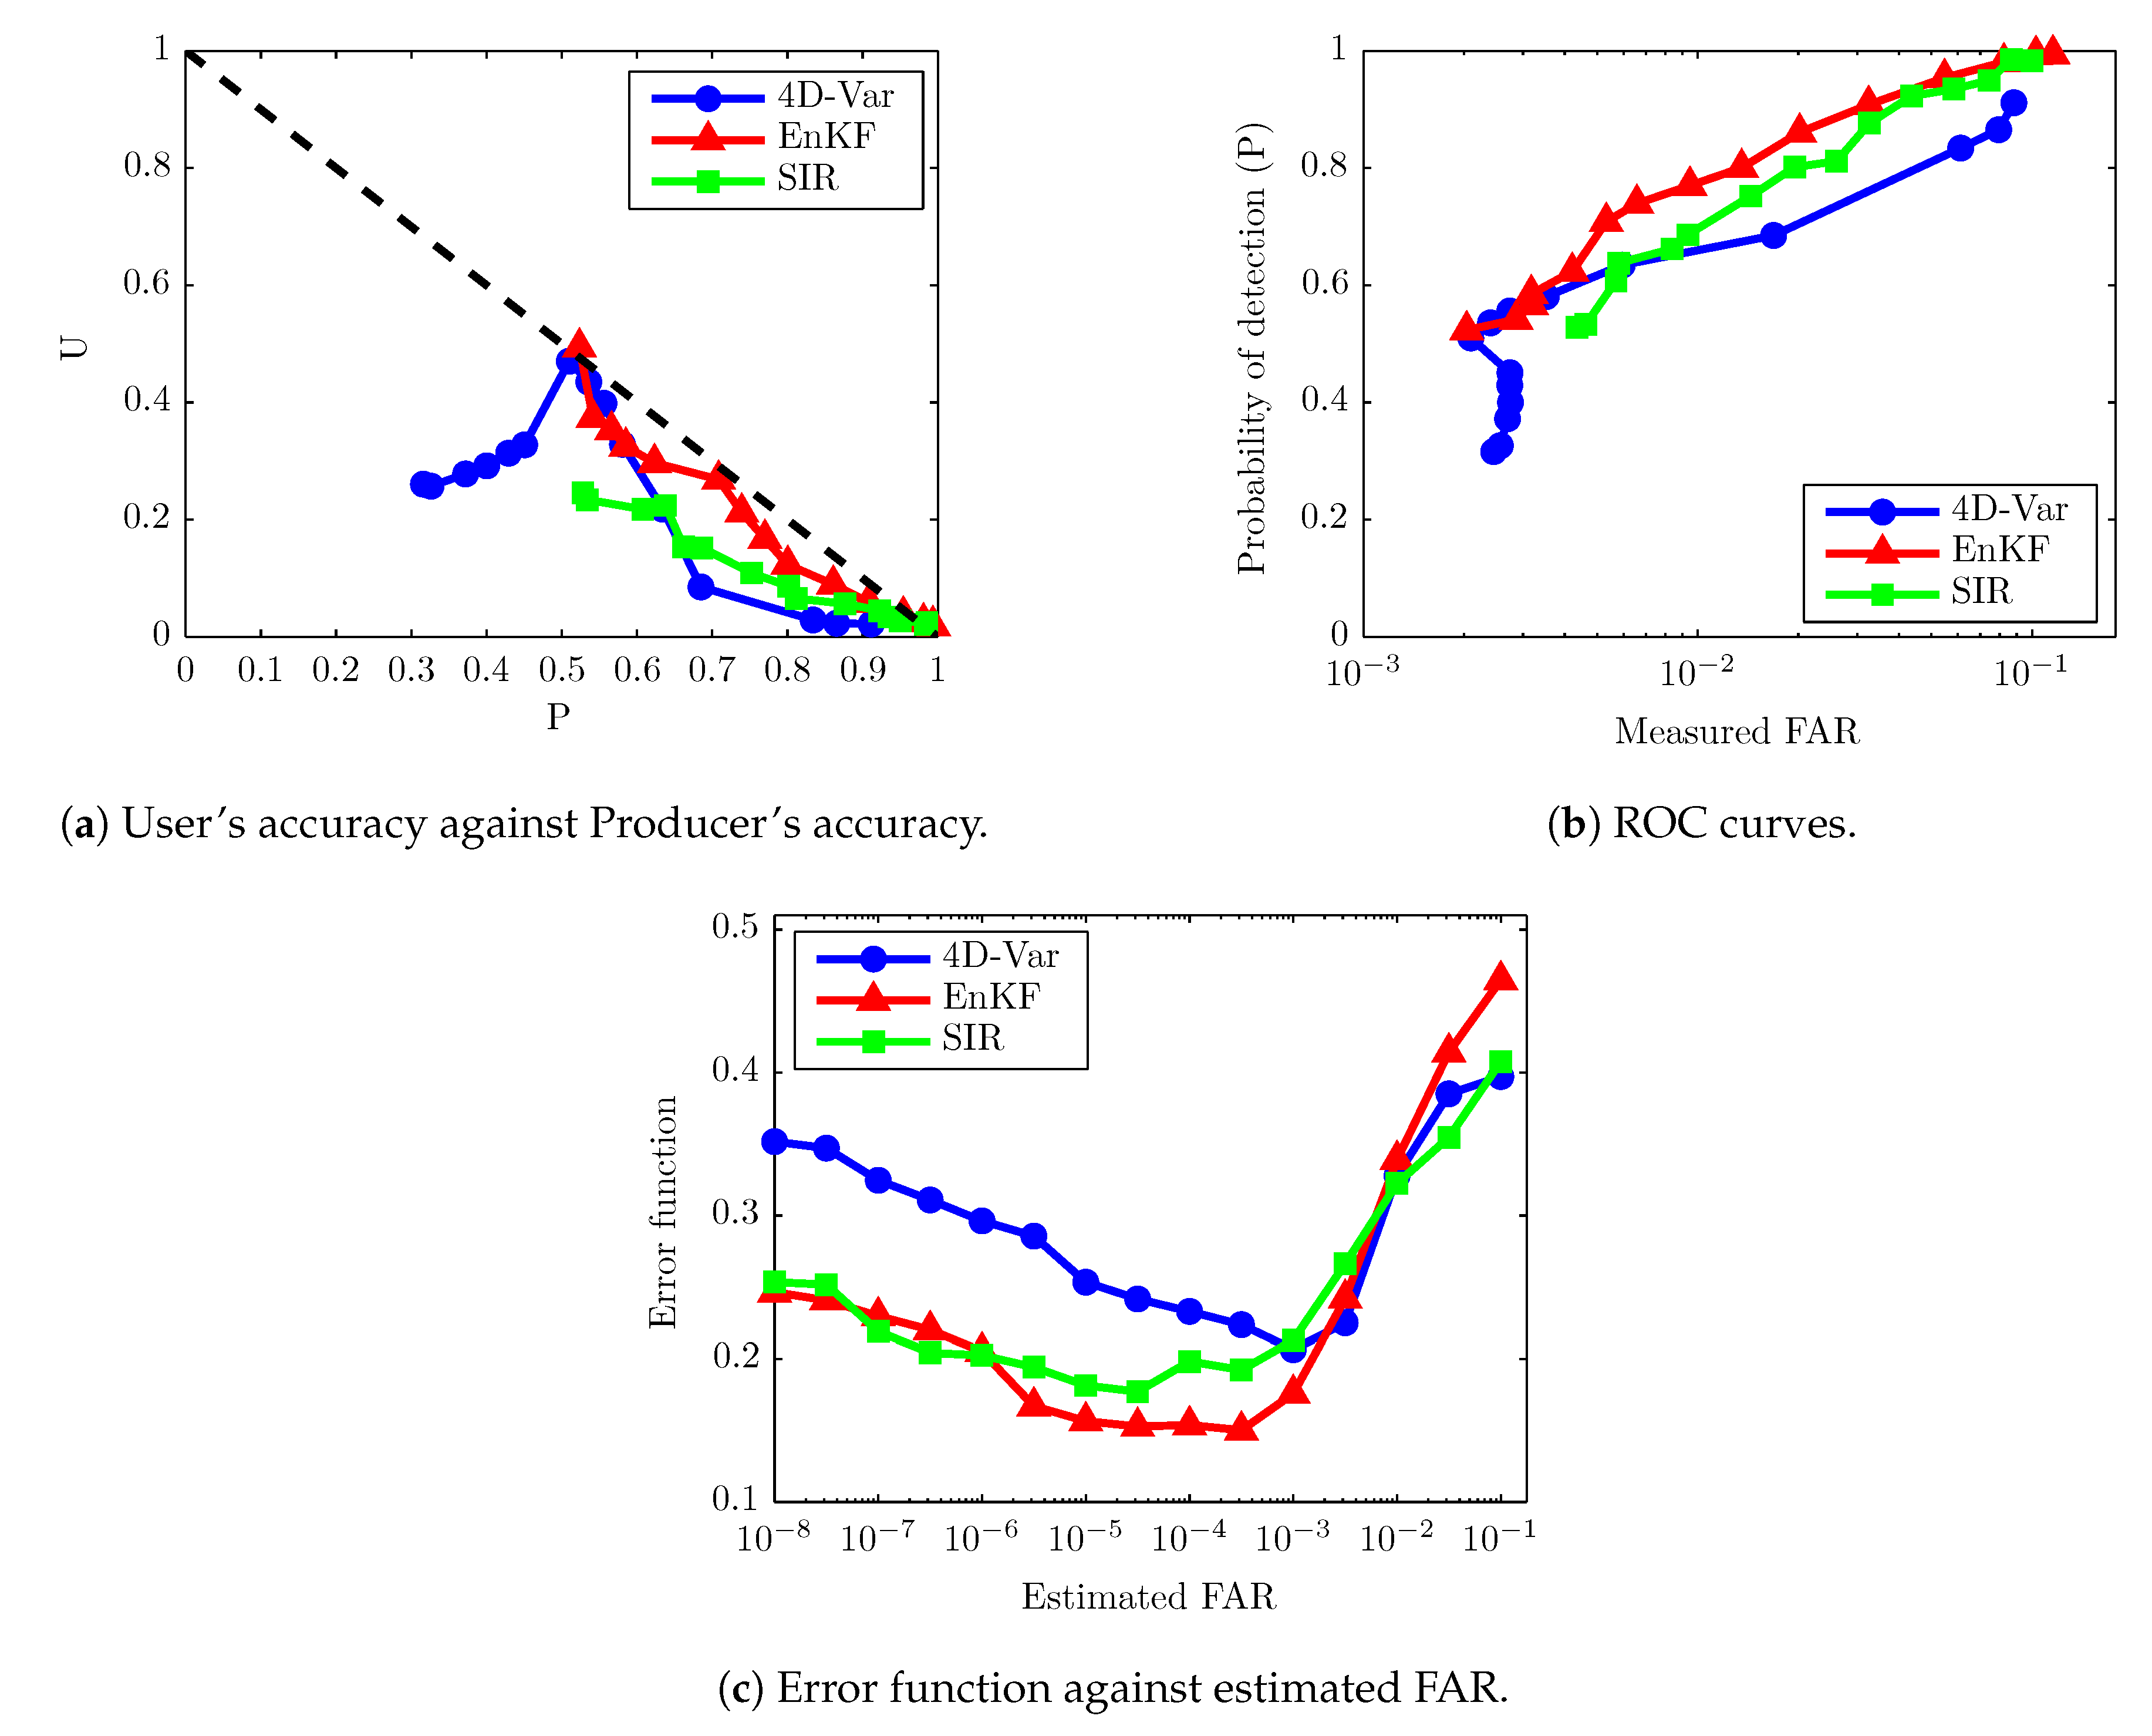
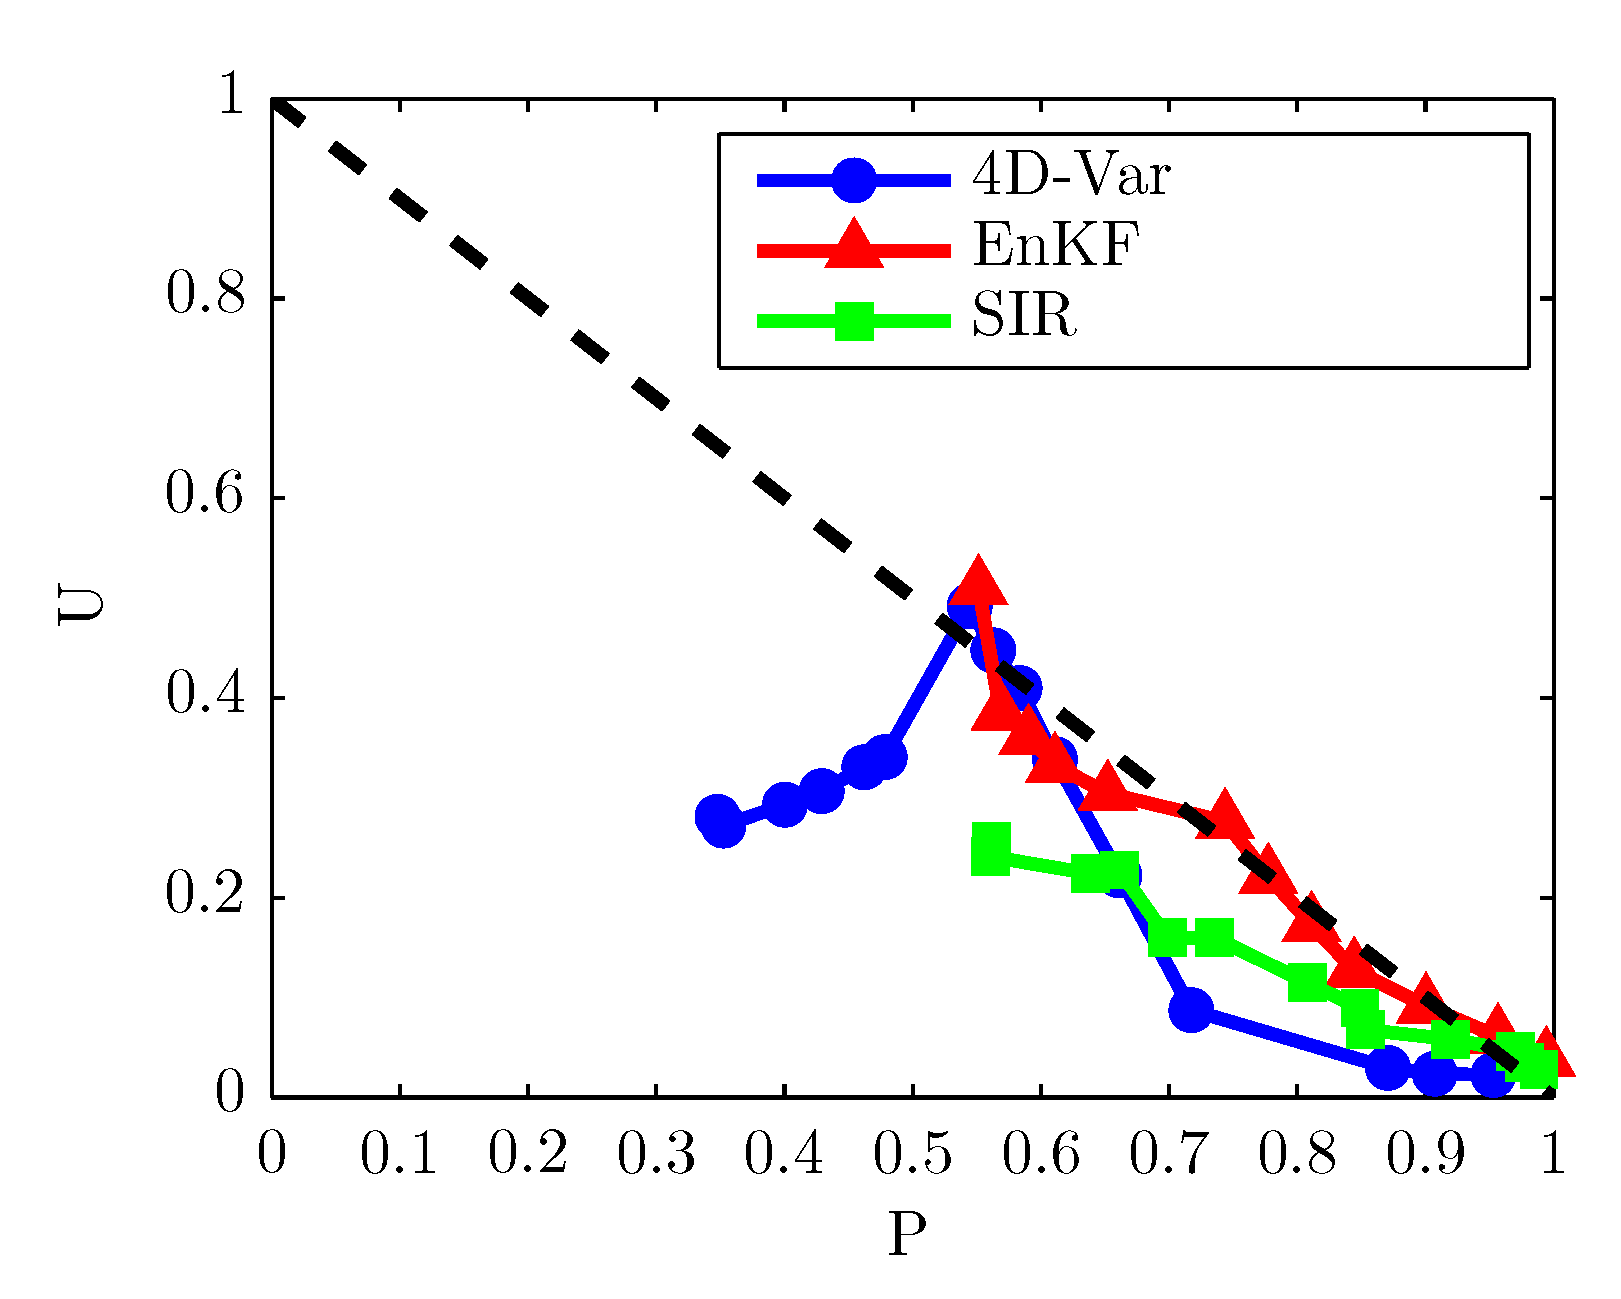
Figure 2a illustrates the Precision-Recall curve (i.e., U vs. P) for a single test set in which all data for period 31 July 2007–4 August 2007 are included, with validation reference data comprising of the combination of MODIS MOD14/MYD14 and EUMETSAT FIR products, and MODIS detection time rounded to the nearest SEVIRI detection time. The performance of the detection methods when any of the three analysis is implemented is fairly modest (no method with a Precision-Recall above the shown diagonal/random classifier) and is not good due to a high number of false alarms according to the reference data products. EnKF-CD ( N e = 51 ) shows a better performance compared to other detection methods, as EnKF-CD ( N e = 51 ) dominates in Precision-Recall space, it does also dominate in ROC space as shown in ROC curves in Figure 2b.
A single operational FAR, when the analysis is implemented with any of the three methods considered in this study, is derived using the error (cost) function J ( · ) given by Equation (7). This error function considers both commission and omission errors and is a function of the estimated FAR. It is assumed in this study that c ( non-fire | f i r e ) p ( f i r e ) = c ( f i r e | non-fire ) p ( non-fire ) = 0.5 and the error function simplifies then to J = 1 2 [ ( 1 P ) + F A R m ] . Figure 2c depicts a resulting J ( · ) for a single test set made of data spanning the period 31 July 2007–4 August 2007 with a reference dataset consisting of a combination of MODIS MOD14/MYD14 and EUMETSAT FIR products, and MODIS detection time is rounded to the nearest SEVIRI detection time. The optimal design FAR point is found among discrete points ranging from 10 8 to 10 1 (with a base-10 logarithmic step of 0.5 ). EnKF-CD ( N e = 51 ) gives the lowest error compared with other detection methods, and its optimal point 10 3.5 FAR gives the operational FAR. The 10 3.5 FAR point is closer to the optima of 4D-Var-CD ( N w = 6 ) and SIR-CD ( N p = 51 ) , and the error difference ( Δ J ) from 10 3.5 point to the optima of 4D-Var-CD ( N w = 6 ) and SIR-CD ( N p = 51 ) is 0.0172 and 0.0151 , respectively.
When each detection not confirmed by EUMETSAT FIR product is confirmed by any MODIS MOD14/MYD14 report in 20 min before or after the detection time, the number of reported false alarms according to the validation reference data (the combination of MODIS MOD14/MYD14 and EUMETSAT FIR ) is reduced for all detection methods as shown in Figure 3, and the reported overall performance is then increased. In this case under consideration, fire events confirmed by the same MODIS MOD14/MYD14 report are counted as one ‘correctly reported fire’ during computation of both P and U, and the number of ‘fire pixels’ is the sum of the number of EUMETSAT FIR reports and the number found by subtracting the number of MODIS MOD14/MYD14 fire reports to the number of times one or more EUMETSAT FIR fire reports are found in the interval of 20 min around a MODIS MOD14/MYD14 report (i.e., 1 to 3 fire events). The results depict an instance the validation products are used to validate a whole fire course on a pixel location and not just a fire event at a given inspection time k on a given pixel location.
Results of a comparison between 4D-Var-CD ( N w = 6 ) , EnKF-CD ( N e = 51 ) and SIR-CD ( N p = 51 ) detection methods at 10 3.5 FAR when only MODIS MOD14/MYD14 fire product is taken in the validation reference data (and MODIS detection time rounded to the nearest SEVIRI detection time) are depicted in Table 3. The number of true positives, according to a MODIS MOD14/MYD14 product, is presented (the number of true positives in Table 3, is presented in terms of the number of MODIS fire pixels). From the results presented in Table 3, we can conclude that SIR-CD ( N p = 51 ) performs better than other detection methods (throughout the 5 days) in terms of detection, according to MODIS MOD14/MYD14 product. EnKF-CD ( N e = 51 ) and SIR-CD ( N p = 51 ) at 10 3.5 FAR achieve a true positive rate of 78.64 % and 79.34 % , respectively, of fire events reported in MODIS MOD14/MYD14 product. A moderate portion of MODIS MOD14/MYD14 reports is detected by EnKF-CD ( N e = 51 ) and SIR-CD ( N p = 51 ) methods, and the accuracy is restricted given that small and cool fires might not be detected due to the low spatial resolution of the SEVIRI compared to the MODIS resolution.
Table 4 summarizes results for 4D-Var-CD ( N w = 6 ) (under ‘4D-Var-CD’ columns), EnKF-CD ( N e = 51 ) (under ‘EnKF-CD’ columns) and SIR-CD ( N p = 51 ) (under ‘SIR-CD’ columns) at 10 3.5 design FAR with reference data being both EUMETSAT FIR and MODIS MOD14/MYD14 products (‘FIR’ column presents the number of EUMETSAT FIR reports and ‘ FIR ( MOD ) ’ column portrays the number of MODIS MOD14/MYD14 reports not reported by EUMETSAT FIR ). For each of 4D-Var-CD ( N w = 6 ) , EnKF-CD ( N e = 51 ) , and SIR-CD ( N p = 51 ) detection methods, Table 4 lists the number of true positives, according to EUMETSAT FIR product (in ‘ FIR + ’ column). Among the remaining false positives of the proposed detection method, according to EUMETSAT FIR product, true positives according to MODIS MOD14/MYD14 are extracted (listed in ‘ FIR , MOD + ’ column), and false positives according to both EUMETSAT FIR and MODIS MOD14/MYD14 are presented in ‘ FIR , MOD ’ column. A significant portion of false alarms, according to EUMETSAT FIR, are reduced when MODIS MOD14/MYD14 product is introduced in the validation reference dataset. Comparing true positive results presented in Table 3 for MODIS MOD14/MYD14 and true positive results presented in Table 4, the proposed fire detection algorithms detect MODIS MOD14/MYD14 fire reports at a lesser extent than they detect EUMETSAT FIR fire reports. Because, as mentioned above, of the small and cool fires that might not be detected due to the low spatial resolution of SEVIRI compared to MODIS. The degree of omission of EUMETSAT FIR fire reports by the proposed algorithms mainly depends on the level of the design FAR, and in this section, the design FAR is taken to be 10 3.5 . However, the omission of EUMETSAT FIR reports at a given design FAR highly materializes while reporting fire events during times of extreme fires, and omission error arises in case the fire temperature dynamics at certain times are not far from the expected background temperature dynamics. Results of Table 4 show that EnKF-CD ( N e = 51 ) and SIR-CD ( N p = 51 ) perform relatively similar and better than 4D-Var-CD ( N w = 6 ) detection method. EnKF-CD ( N e = 51 ) detects EUMETSAT FIR reports at 94.10 % , and detects the combination of EUMETSAT FIR fire events and MODIS MOD14/MYD14 fire events not reported by EUMETSAT FIR at 86.09 % . SIR-CD ( N p = 51 ) detects EUMETSAT FIR reports at 96.48 % , and detects the combination of EUMETSAT FIR fire events and MODIS MOD14/MYD14 fire events not reported by EUMETSAT FIR at 87.67 % . All proposed detection methods report a significant number of false alarms according to MODIS MOD14/MYD14 and EUMETSAT FIR, and detect EUMETSAT FIR reports relatively well.
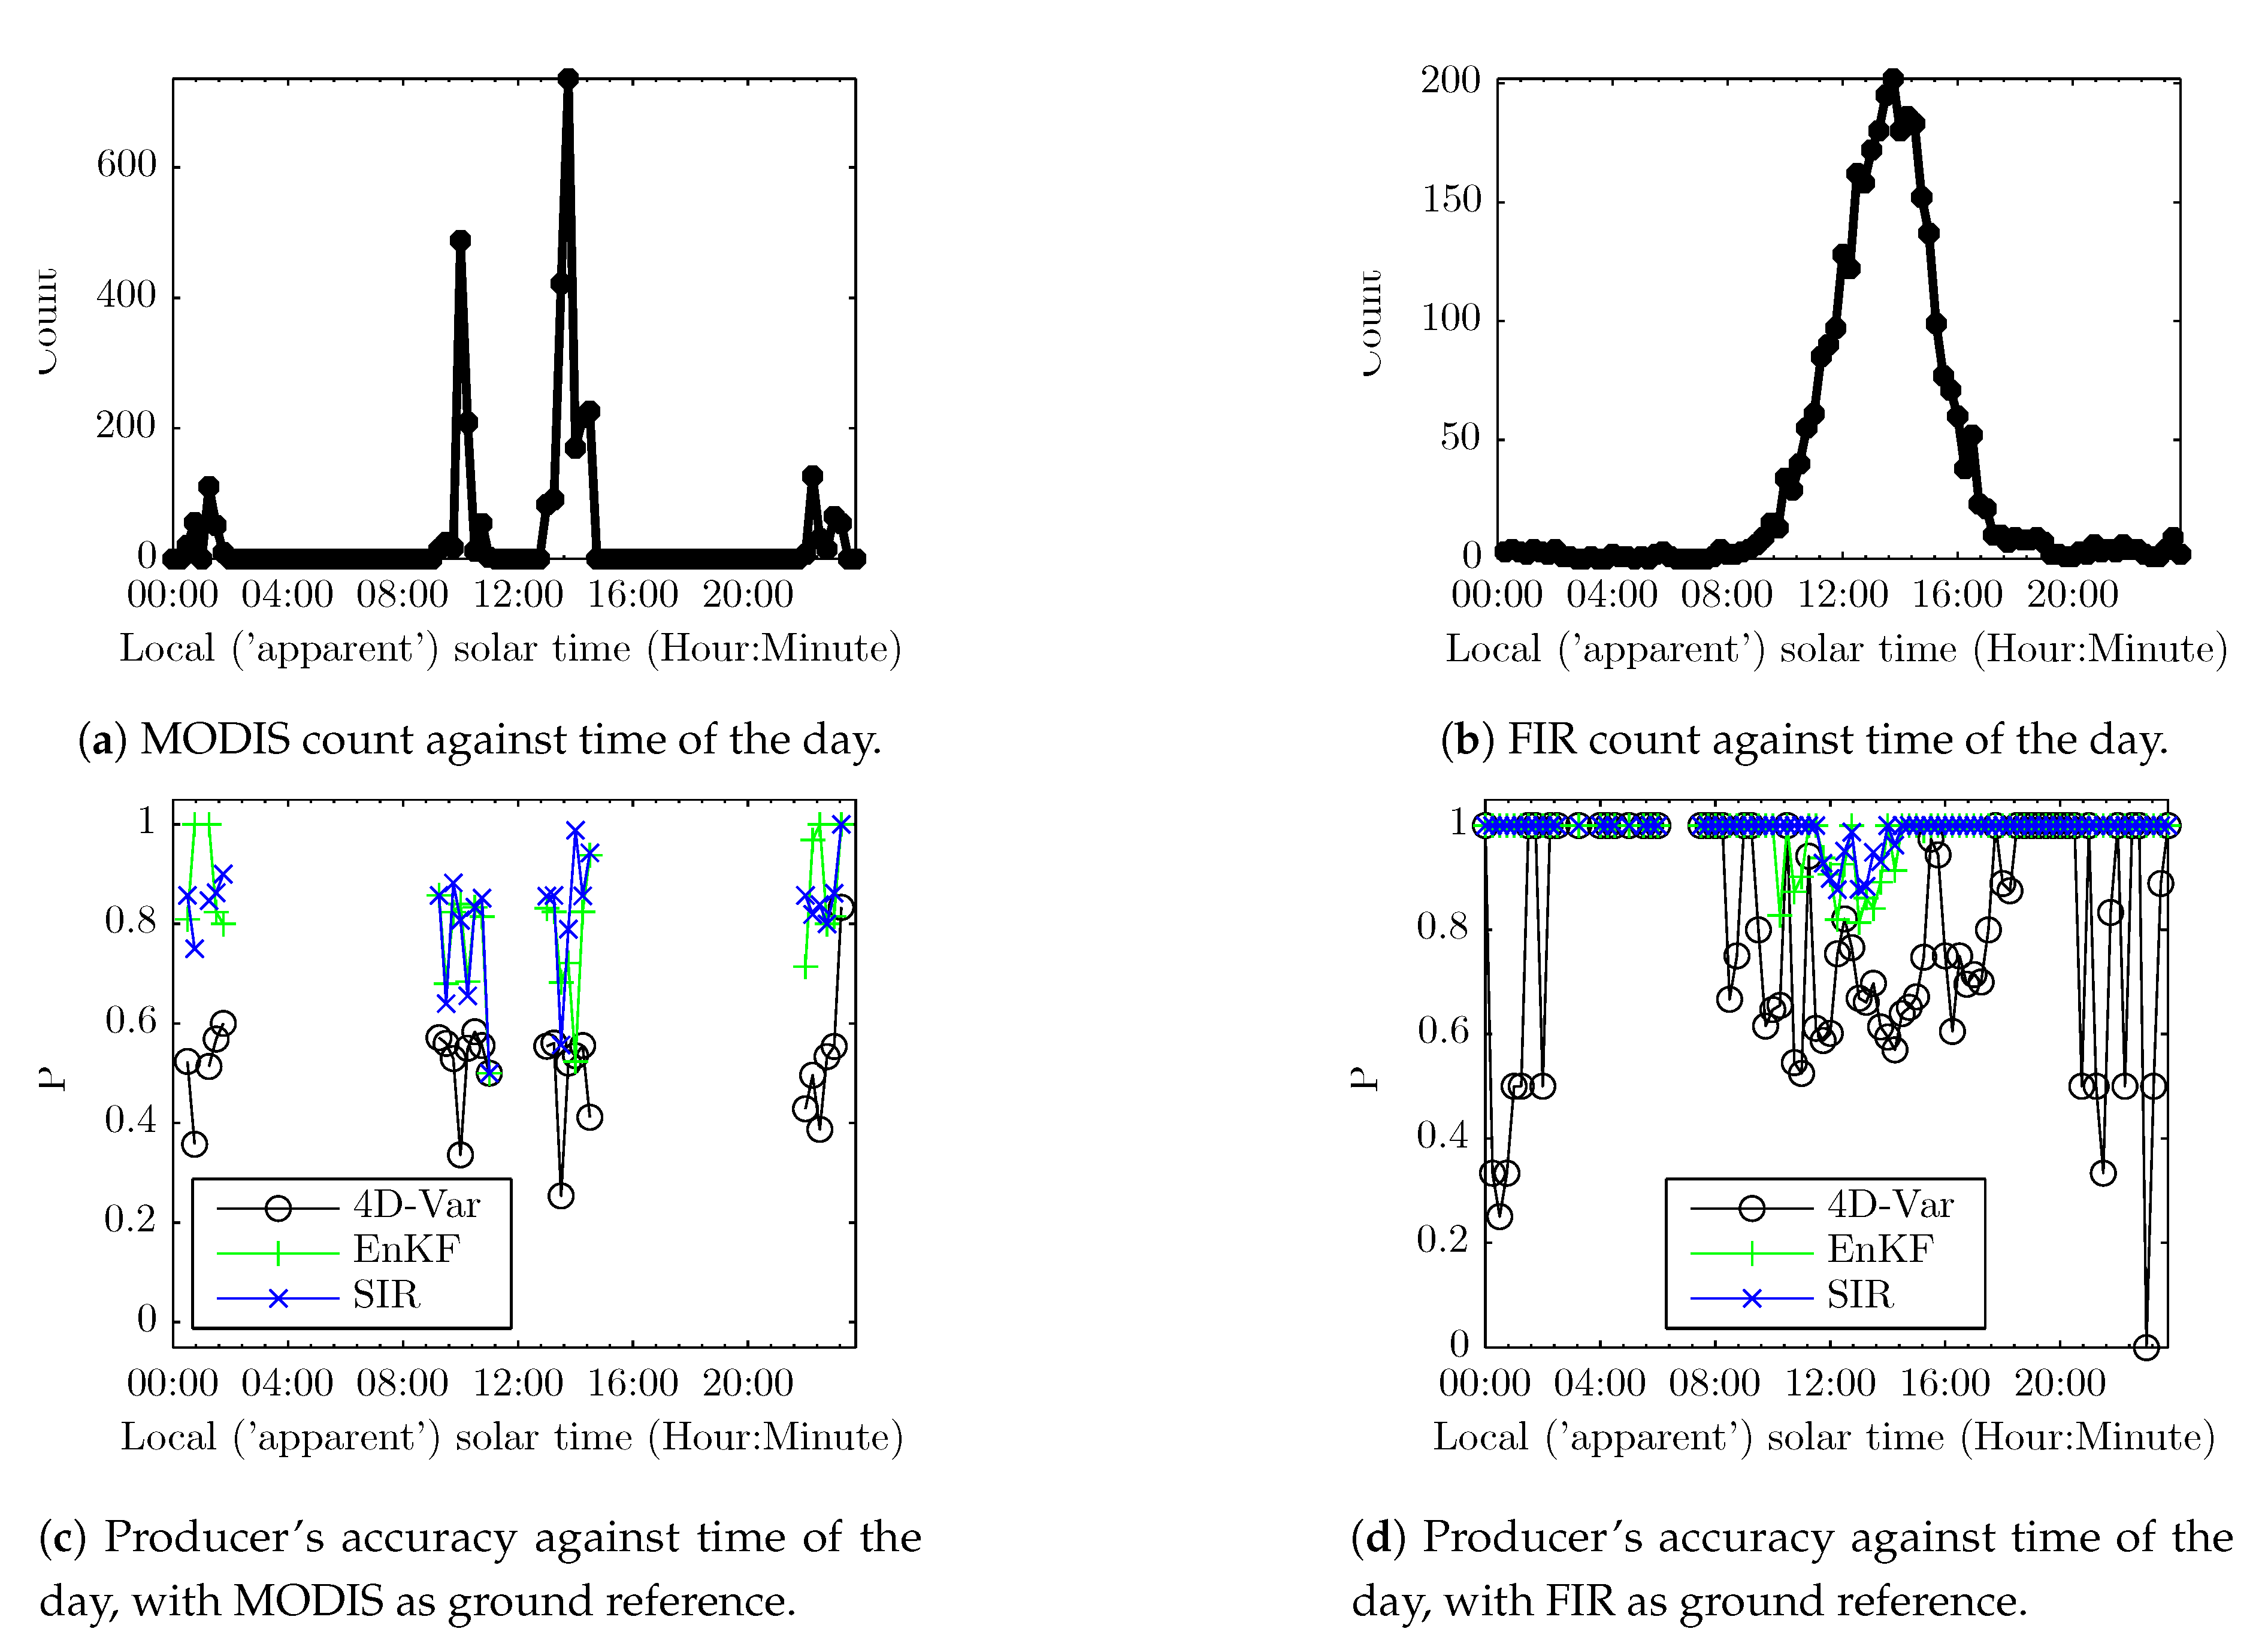
Figure 4a,b present number of fire events at each time of a day (where times are expressed in terms of local solar time) for MODIS MOD14/MYD14 product and EUMETSAT FIR product, respectively. The values of producer’s accuracy (or true positive rate) of the proposed detection algorithms at each time of a day are presented in Figure 4c,d for cases the validation reference dataset is made of MODIS MOD14/MYD14 product only and EUMETSAT FIR product only, respectively. Fires recorded by EUMETSAT FIR are significantly detected by EnKF-CD ( N e = 51 ) and SIR-CD ( N p = 51 ) detection methods at 10 3.5 FAR with EnKF-CD ( N e = 51 ) outperforming other methods in detection of MODIS night fires. Their detection performance is reduced from around t m (i.e., the time of the maximum thermal radiation) to around t s (onset of the nighttime temperature decay) with respect to EUMETSAT FIR and MODIS MOD14/MYD14 results, and such performance can be viewed to be more associated with a high number of fire events reported by both MODIS MOD14/MYD14 and EUMETSAT FIR products in the time range. During time of a high number of fire events, a proposed algorithm can miss a fire event reported by the fire products but can report a fire before or after the fire product reports. Furthermore, the observed temperature in MSG IR 3.9 spectral channel of an MSG pixel identified by MODIS to be affected by fire, might not deviate significantly from its expected background temperature. 4D-Var-CD ( N w = 6 ) has an overall low detection, especially during the nighttime—the time of high fluctuations in brightness temperatures due to different coupled land–atmosphere phenomena, such as orographic forcing effect. In the afternoon, its low detection is more explained by the DTC linearization from around t m to around t s (or likewise, based on the approximate observation operator given by Equation (S8)). The detection rate of MODIS MOD14/MYD14 report is low compared to the detection rate of EUMETSAT FIR reports, and SIR-CD ( N p = 51 ) and EnKF-CD ( N e = 51 ) perform better in detecting MODIS MOD14/MYD14 reports compared to 4D-Var-CD ( N w = 6 ) at the 4 MODIS overpass times ( EnKF-CD ( N e = 51 ) is better than all detection methods during the night). Based on the MODIS MOD14/MYD14 report, all detection methods certainly detect both daytime and nighttime fires, with 4D-Var-CD ( N w = 6 ) to a lower extent. Noting that MODIS detection time is rounded to the nearest SEVIRI detection time, and the number of ‘fire pixels’ is counted in terms of MODIS pixels to determine the true positive rate (P), according to MODIS MOD14/MYD14 product.
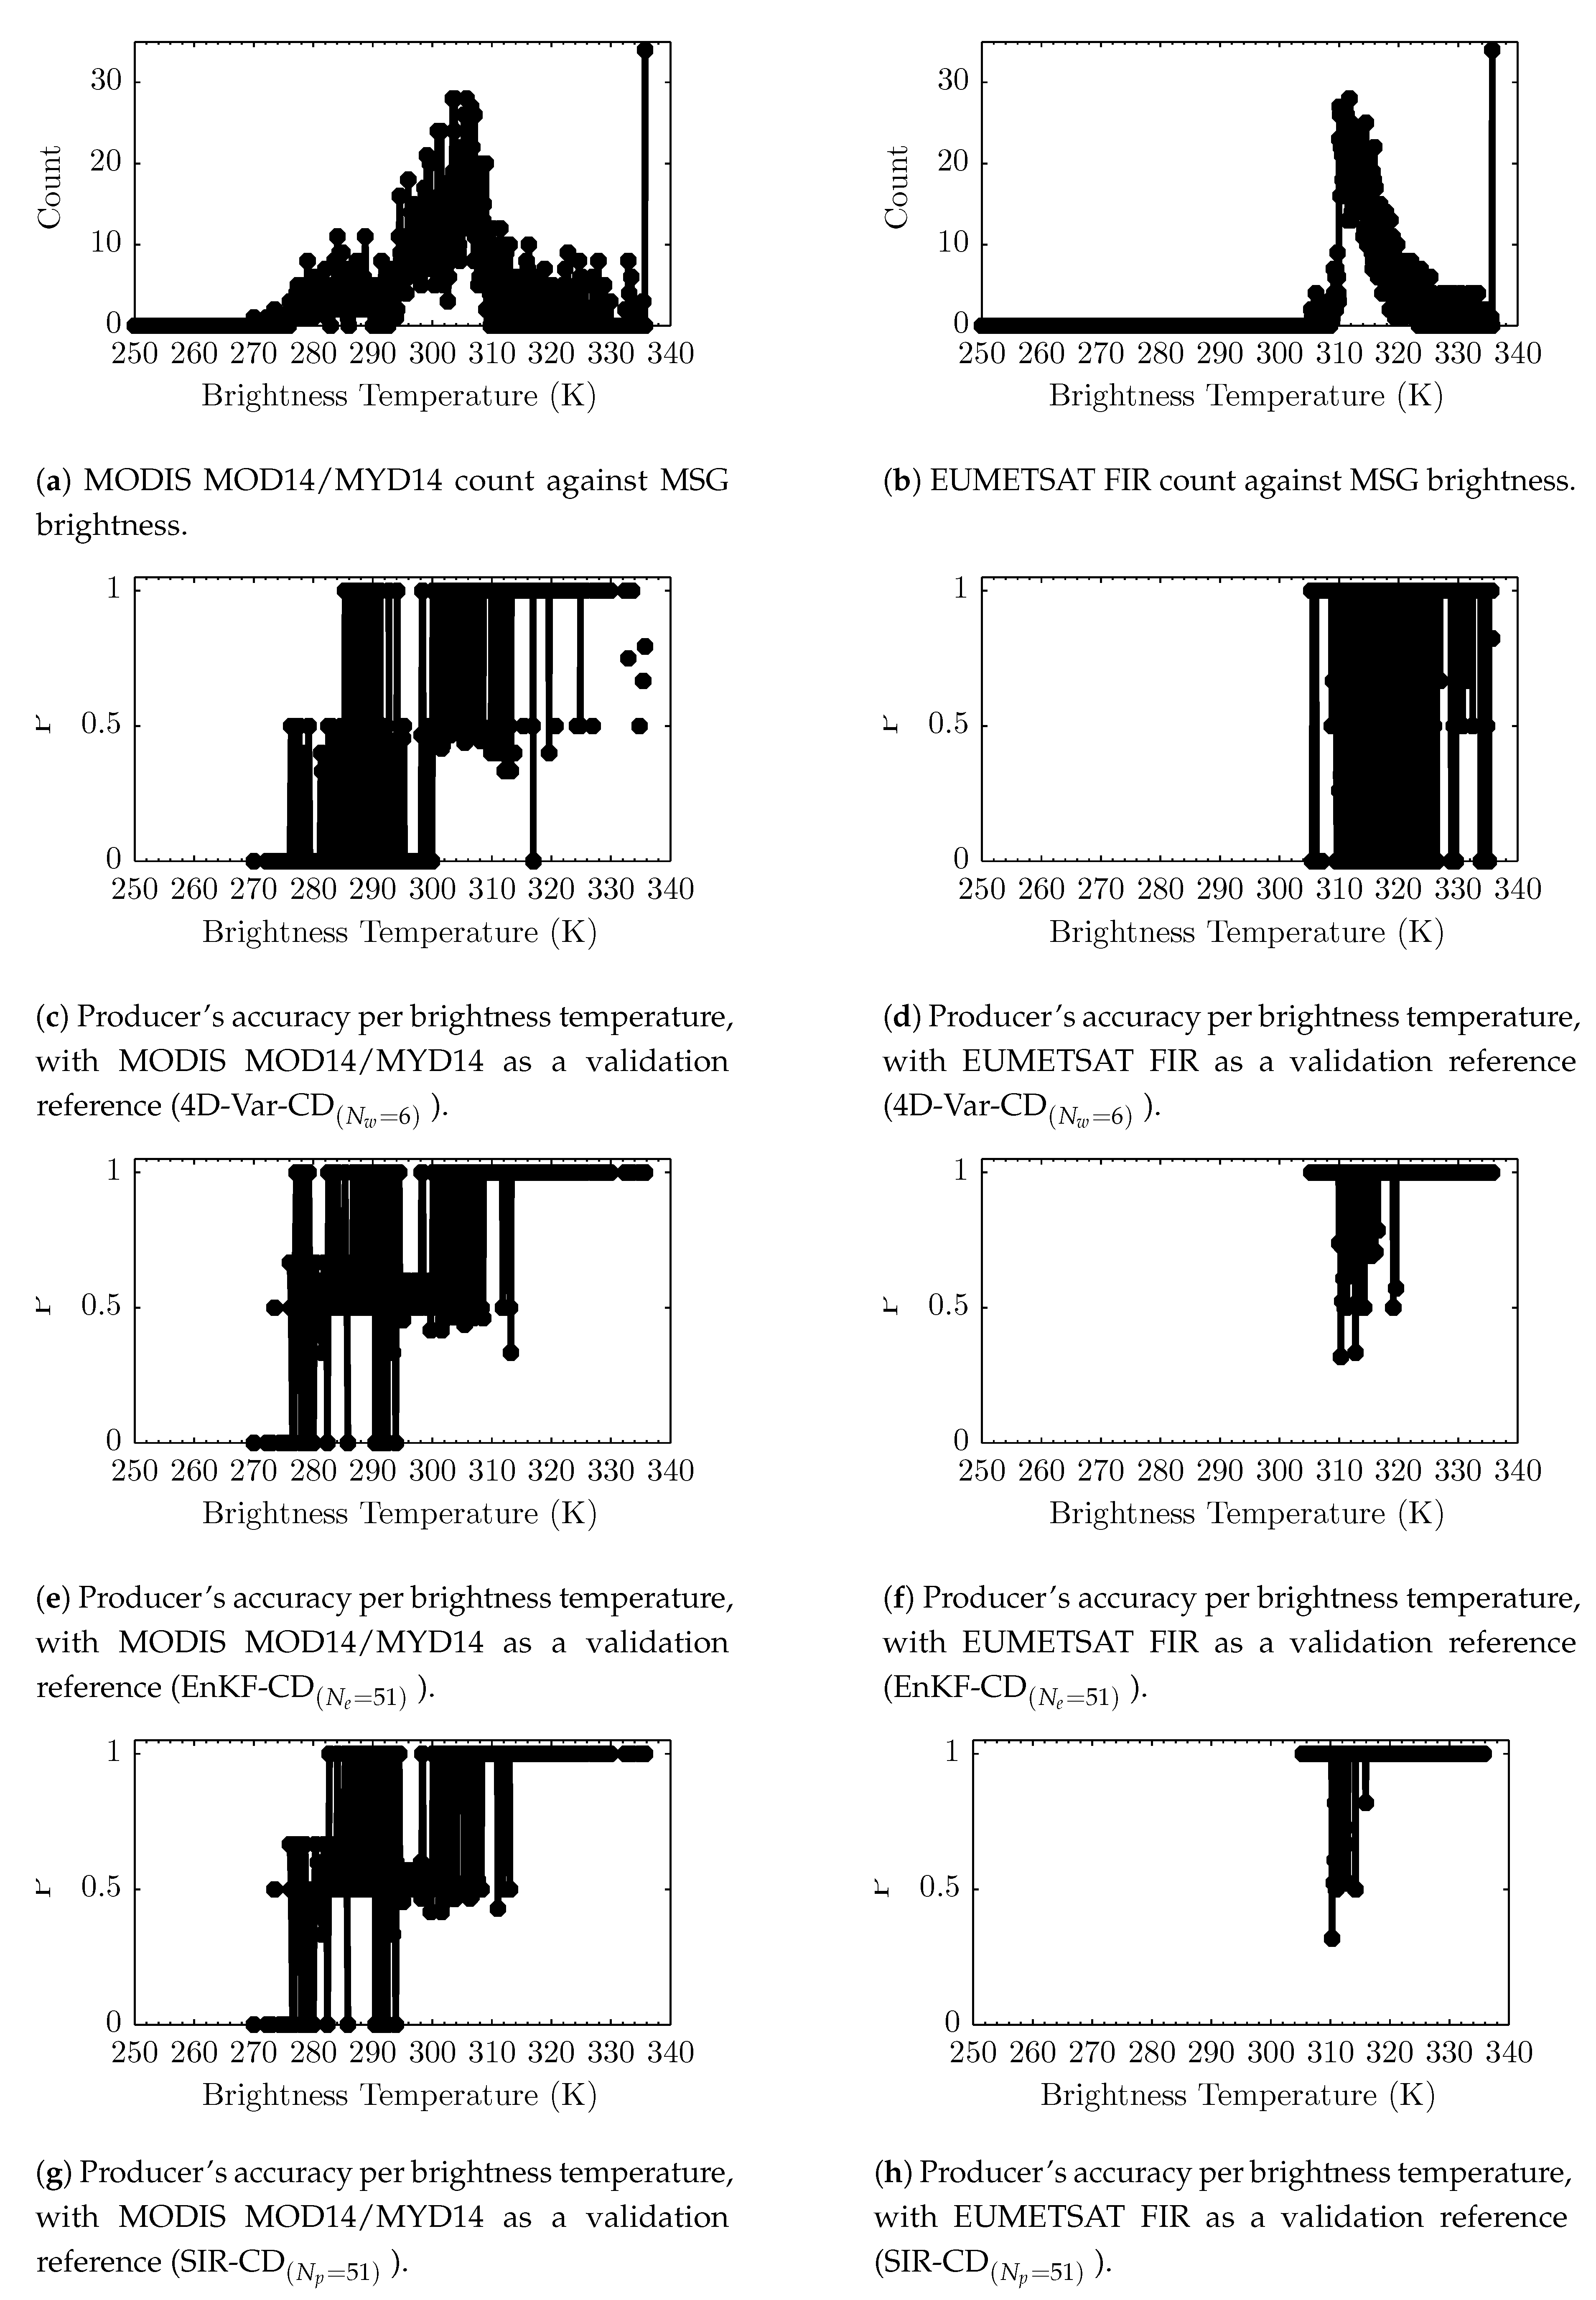
The empirical distribution of MSG IR 3.9 brightness temperatures for MODIS MOD14/MYD14 reported fire pixels and EUMETSAT FIR reported fire pixels are shown in Figure 5a,b, respectively. MODIS detection time is rounded off to the nearest MSG-SEVIRI detection time. For MODIS MOD14/MYD14 reported fire pixels, the temperature value of an MSG pixel containing the centers of a number of MODIS fire pixels at a given time step k is counted as many times as the number of the centers of the MODIS pixels. For fire detection results of 4D-Var-CD ( N w = 6 ) method, producer’s accuracy for each MSG brightness temperature value is shown in Figure 5c,d when the validation set is made of MODIS MOD14/MYD14 product and EUMETSAT FIR product, respectively. 4D-Var-CD ( N w = 6 ) is able to detect cooler fire compared to EUMETSAT FIR, down to approximately a brightness temperature value of 285 K (with P = 1 ), as shown in Figure 5c when only MODIS MOD14/MYD14 product is accommodated in the validation set. Some very hot fires are missed by 4D-Var-CD ( N w = 6 ) , especially at the SEVIRI’s saturation point (which can be attributed to the linear approximation of the observation function and the data assimilation window that does not contain only clean samples). For fire detection results of the SIR-CD ( N p = 51 ) method, producer’s accuracy for each brightness temperature value is shown in Figure 5g,h when the validation set is made of MODIS MOD14/MYD14 product and EUMETSAT FIR product, respectively. SIR-CD ( N p = 51 ) reports cold fires more frequently than 4D-Var-CD ( N w = 6 ) , and can detect fires with brightness temperatures below 285 K (with P = 1 ) as shown in Figure 5g. For fire detection results of EnKF-CD ( N e = 51 ) method, producer’s accuracy for each brightness temperature value is shown in Figure 5e,f when the validation set is made of MODIS MOD14/MYD14 product and EUMETSAT FIR product, respectively. Similar to 4D-Var-CD ( N w = 6 ) and SIR-CD ( N p = 51 ) methods, the EnKF-CD ( N e = 51 ) method is able to detect cooler fire compared to EUMETSAT FIR, even for fires with a brightness temperature value below 280 K (with P = 1 ) as shown in Figure 5e when only the MODIS MOD14/MYD14 product makes the validation set.
An example of MSG IR 3.9 images at three MSG timestamps on 3 August 2007 is illustrated in Table 5 to portray detection reports of 4D-Var-CD ( N w = 6 ) , EnKF-CD ( N e = 51 ) , and SIR-CD ( N p = 51 ) against both MODIS MOD14/MYD14 (MODIS detection time is rounded off to the nearest MSG-SEVIRI detection time) and EUMETSAT FIR reports. In addition, the detection reports of MODIS MOD14/MYD14 and EUMETSAT FIR at the three timestamps are provided to present and describe MODIS MOD14/MYD14 and EUMETSAT FIR products. The table provides Level 1.5 observation time (expressed in Coordinated Universal Time (UTC)) in ‘Time’ column, the pseudocolor versions of the MSG IR 3.9 images in ‘Pseudocolor image’ column to better visualize the brightness temperature distribution in the images, and MODIS MOD14/MYD14 and EUMETSAT FIR fire reports overlaid on the MSG IR 3.9 images in the ‘MOD14/MYD14 & FIR’ column. A great number of MODIS MOD14/MYD14 reports are not reported by EUMETSAT FIR. Essentially, since in this study, we assume that a MODIS pixel belongs to an MSG pixel into which its center falls, if a burning part of the MODIS pixel location is in a different MSG pixel, some reports would be missed by a fire detection method that uses MSG-SEVIRI data. The table also presents detection reports of 4D-Var-CD ( N w = 6 ) , EnKF-CD ( N e = 51 ) and SIR-CD ( N p = 51 ) methods on the three images, overlaid on the corresponding MSG IR 3.9 images and placed under ‘4D-Var’, ‘EnKF’ and ‘SIR’ columns, respectively. EnKF-CD ( N e = 51 ) and SIR-CD ( N p = 51 ) detect all EUMETSAT FIR reports while 4D-Var-CD ( N w = 6 ) missed, at 08:12 a.m. (corresponds to the detection time 08:00 a.m.) and at 12:42 p.m. (corresponds to the detection time 12:30 p.m.), 4 fire events and 22 fire events, respectively. EnKF-CD ( N e = 51 ) and SIR-CD ( N p = 51 ) detect a great number of MODIS MOD14/MYD14 reports with 4D-Var-CD ( N w = 6 ) detecting less at all the three timestamps consistently. The results of SIR-CD ( N p = 51 ) contain a great number of false alarms according to MODIS MOD14/MYD14 and EUMETSAT FIR products, compared to both EnKF-CD ( N e = 51 ) and 4D-Var-CD ( N w = 6 ) , and 4D-Var-CD ( N w = 6 ) has less false alarms.

4. Discussion

4D-Var-CD ( N w = 6 ) has the least level of false alarms while SIR-CD ( N p = 51 ) has the highest (see Figure 1a), but SIR-CD ( N p = 51 ) has the least number of missed detections (see Figure 1b). The Precision-Recall graphs shown in Figure 2a (when MODIS detection time is rounded off to the nearest SEVIRI detection time) and Figure 3 (when any MODIS fire event in 20 min around a reported fire detection is used to confirm detection), and the ROC graph shown in Figure 2b prove that both EnKF-CD ( N e = 51 ) and SIR-CD ( N p = 51 ) perform better than 4D-Var-CD ( N w = 6 ) . Both EnKF-CD ( N e = 51 ) and SIR-CD ( N p = 51 ) perform better in terms of detection but exhibit a high level of false alarms when the validation set is made of both MODIS MOD14/MYD14 and EUMETSAT FIR products. The ROC curves in Figure 2b also reveal a disparity between the measured FAR and the estimated FAR (the estimated FAR is varied from 10 8 to 10 1 with a base-10 logarithmic step of 0.5 ). A higher number of false alarms than expected can be attributed to, among others, true fire events missing from the validation fire products and the PSF effect on the MSG images with respect to MODIS MOD14/MYD14 report during the MODIS overpass. Though the proposed method registers false alarms in case of abrupt changes in temperature of a day due to cloud or smoke, they, however, minimize false alarms due to change in the model of temperatures from one day to the next—a problem inherent to previous temporal fire detection methods. False alarms in the results of the proposed method can be reduced in various ways, including the implementation of censoring mechanisms in the designed CFAR detector, lessening the PSF effect on MSG imagery, and incorporating spatial-neighborhood information and atmospheric effects into the model of the background temperature.
At an operational, best FAR found to be 10 3.5 (see Figure 2c), a high detection rate of fire events reported by the EUMETSAT FIR product is observed, and MODIS MOD14/MYD14 reported fires are also detected but with limitations caused by the low spatial resolution of MSG-SEVIRI. EnKF-CD ( N e = 51 ) and SIR-CD ( N p = 51 ) have the lowest fire omission. EnKF-CD ( N e = 51 ) and SIR-CD ( N p = 51 ) detect 94.10 % and 96.48 % of fires reported by EUMETSAT FIR, respectively, and both detect approximately 79 % of fires reported by MODIS. Given that the MODIS sensor has a high spatial resolution ( 1 km nominal GSD between pixel centers at nadir) compared to the SEVIRI sensor ( 3.4100 km to 4.6800 km nominal GSD between pixel centers in the study area), the MODIS sensor is expected to detect fires covering a small area or low-temperature fires. EnKF-CD ( N e = 51 ) and SIR-CD ( N p = 51 ) detect, respectively, 86.09% and 87.67% of MODIS reports that are not reported by EUMETSAT FIR product. The EUMETSAT FIR product used in this study is produced from SEVIRI results of the EUMETSAT FIR baseline algorithm, the same as the MODIS algorithm of MODIS MOD14/MYD14 product, it considers spatial neighborhood information but not multitemporal information in deciding whether a pixel is a fire pixel. Even though the SEVIRI sensor has a low spatial resolution, the early detection of fires enhances the possibility of detecting a fire on small areas or/and with low temperatures at any time. For example, in the DTCs given in Figure 6 (and results reported in Table 6), on 2 August 2007, MODIS MOD14/MYD14 reports a brief fire during Aqua morning overpass, but did not report any fire at an earlier time in the same day (i.e., during Terra morning overpass). However, EnKF-CD ( N e = 51 ) and 4D-Var-CD ( N w = 6 ) , which reports the fire at the time of Aqua morning overpass, report the fire at an earlier time even during the time of Terra morning overpass ( SIR-CD ( N p = 51 ) reports fires only during early morning and not during Aqua overpass). By visual inspection of the DTCs in Figure 6, we can conclude that, on 2 August 2007, EnKF-CD ( N e = 51 ) and 4D-Var-CD ( N w = 6 ) report the fire that MODIS MOD14/MYD14 reported at 11:40 a.m. (at Aqua morning overpass) earlier than MODIS MOD14/MYD14 if the fire had a single ignition time. The EUMETSAT FIR product does not report a fire on 2 August 2007 in a 5 × 5 pixel array around the examined pixel. Noting that, on 4 August 2007, MODIS MOD14/MYD14 reports a fire event in the examined pixel at 8:25 p.m. with a nominal detection confidence, and in a 3 × 3 vicinity of the examined pixel location, it reports only two fire events also at 8:25 p.m., all with detection confidence of 100 % . On the same day, EUMETSAT FIR reports fire events from 12:15 p.m. up to 6:00 p.m. in the examined pixel as conveyed in Table 6, and in a 3 × 3 vicinity of the examined pixel, it reports fire events in two pixels, and in each at 12:30 p.m. and 1:00 p.m.. All MODIS MOD14/MYD14 and EUMETSAT FIR reports on 1 August 2007 in the examined pixel are detected by 4D-Var-CD ( N w = 6 ) , EnKF-CD ( N e = 51 ) and SIR-CD ( N p = 51 ) .
Given the diurnal variation of background temperature of a pixel location, the use of an adaptive threshold in the detection of fire enhances the accuracy of detection (see Figure 5c,e,g). The proposed algorithms are able to detect fires at any time of a day, and EnKF-CD ( N e = 51 ) tends to outperform all other detection methods in detecting night fires (see Figure 4c). An example given in Figure 7 (and results reported in Table 7) depicts the expected background temperature (i.e., predicted brightness temperature) and the state of a pixel (either fire or non-fire ) at 10 3.5 FAR at each time step for two DTCs starting from 31 July 2007 and 1 August 2007 of an MSG pixel location ( 983 , 901 ) . No fire was reported in a 5 × 5 pixel array around the examined pixel by EUMETSAT FIR in the two DTCs, and MODIS MOD14/MYD14 reports a brief nighttime fire on 1 August 2007. Even though the MODIS MOD14/MYD14 report is a nominal-confidence fire (i.e., 32 % ) and is reported during the time of low diurnal temperature, EnKF-CD ( N e = 51 ) and SIR-CD ( N p = 51 ) detection approaches detected the fire report. EnKF-CD ( N e = 51 ) detected all MODIS MOD14/MYD14 reports and has a low level of false alarms, according to MODIS MOD14/MYD14 and EUMETSAT FIR reports. 4D-Var-CD ( N w = 6 ) missed the night MODIS MOD14/MYD14 fire report (due to its degraded detection performance during a time of high fluctuations in brightness temperature, mainly when the data assimilation window accumulates missed fire-contaminated samples during the first stage of a fire).
The proposed methods detect either brief or persistent fires. The persistent fires, throughout their duration, are well monitored at least from the time they are first detected (i.e., when the ignition is detected) to the last time the fire is detectable. The analysis methods proposed in this study adapt rapidly to the change in non-fire conditions (quick update of the DTC parameters). However, the detection methods that use these analysis methods might be slow in detecting the extinction of a real fire since the adaptation speed depends on the rate of change of the proportional between the forecast error variance and the observation error variance. Figure 8 (and results reported in Table 8) shows an example that helps analyze the performance of 4D-Var-CD ( N w = 6 ) , EnKF-CD ( N e = 51 ) , and SIR-CD ( N p = 51 ) in detecting a fire of great magnitude. Specifically, in this example, a fire that causes MSG-SEVIRI IR 3.9 saturation (i.e., a fire that evidently has a high intensity) and has a prolonged heating duration. It should be mentioned that the heating duration, together with the fire intensity, contribute to fire severity, and are among factors that are taken into consideration when quantifying the fire severity. In this example, fire extends over two DTCs and raises brightness temperatures in the MSG-SEVIRI IR 3.9 spectral channel to the saturation point of the IR 3.9 . MODIS MOD14/MYD14 reports fire events in the examined pixel at both the Terra and Aqua morning overpasses on 3 August 2007 (at 08:05 a.m and 12:25 p.m., respectively). In the outer window of a 3 × 3 vicinity of the examined pixel, on 2 August 2007, MODIS MOD14/MYD14 reports fire events at both Terra and Aqua night overpasses (at 09:10 p.m. and 10:40 p.m., respectively) while on 3 August 2007, apart from MODIS MOD14/MYD14 detection times in the examined pixel location, MODIS MOD14/MYD14 also reports fire events at 11:20 p.m.. On 4 August 2007, MODIS MOD14/MYD14 did not report fire events in a 5 × 5 pixel array around the examined pixel during the Terra morning overpass. EUMETSAT FIR reports, in a 3 × 3 pixel array around the examined pixel, some fire events on 2 August 2007, only during night time from 07:15 p.m. to 09:30 p.m.. On 3 August 2007, it reports some fire events during day time from 06:30 a.m. to 04:30 p.m. and during night time at 09:15 p.m. and 10:30 p.m. (noting that, in the examined pixel, EUMETSAT FIR reports 11 fire events on 3 August 2007 from 10:45 a.m. to 03:30 p.m. as indicated in Table 8, and EUMETSAT FIR does not report fire events in the 3 × 3 pixel array around the examined pixel location 01:45p.m.–02:00 p.m., 03:15 p.m. and 03:45 p.m.–04:00 p.m.). On 4 August 2007, in a 5 × 5 pixel array around the examined pixels, EUMETSAT FIR reports only a single fire event in the outer window of the pixel array at 12:00 a.m. in one pixel. Overall, the combination of MODIS MOD14/MYD14 and EUMETSAT FIR products suggests that the fire activities started on 2 August 2007 at 07:15 p.m. and stopped at the end of 3 August 2007 at least in the 3 × 3 pixel array around the examined pixel location. However, it could be argued that, during the time of fire activities reported by this combination, the fire was also burning in the examined pixel location and started even before 07:15 p.m. on 2 August 2007, primarily based on visual inspection in IR 3.9 brightness temperatures shown in Figure 8. EnKF-CD ( N e = 51 ) and SIR-CD ( N p = 51 ) start detecting the fire in the examined pixel location on 2 August 2007 (more consistently from 01:15 p.m. detection time for EnKF-CD ( N e = 51 ) and from 05:45 p.m. detection time for SIR-CD ( N p = 51 ) ). At the end of fire activities (i.e., at around the start of 4 August 2007), EnKF-CD ( N e = 51 ) and SIR-CD ( N p = 51 ) did not detect the extinction of the fire (i.e., the end of fire is approximated to be near the end of 3 August 2007). EnKF and SIR (i.e., the filter used in EnKF-CD ( N e = 51 ) and SIR-CD ( N p = 51 ) methods) lose track of non-fire brightness temperatures after the fire. They would track the non-fire observations again when the error variance in the forecast estimate dominates the variance of the observation noise. The omission of fire events by 4D-Var-CD ( N w = 6 ) from 2 August 2007 at 07:27 p.m. (i.e., at 07:15 p.m. detection time) follows from the high fluctuation in temperatures due to non-fire conditions (e.g., cloud or smoke) or fire conditions, and this fluctuation causes oscillations in value of the background temperature estimate. The oscillations start on 2 August 2007 at 05:42 p.m. (i.e., 05:30 p.m. detection time) and end at 07:27 p.m. (i.e., 07:15 p.m. detection time) with a high prediction residual and high value of adaptive threshold (the adaptive threshold is high due to a high variance in previous non-fire prediction residual samples). The amplitude of residuals decreases with each new analysis until 3 August 2007 at 06:42 p.m. when we have other oscillations that end at 09:42 p.m. with a prediction residual of zero with an already high value of the adaptive threshold. 4D-Var-CD ( N w = 6 ) reports non-fire conditions from 2 August 2007 at 07:27 p.m., and during this time, the adaptive threshold is high. To mention that the minimum nighttime observation on 2 August 2007 is at 05:27 p.m. (i.e., detection time 05:15 p.m.).
For near real-time fire detection, an assessment is implemented per fire event (per pixel). However, for a general assessment, a fire can be considered in its entirety across space and time (i.e., assess per object per image or likewise per object per time step), and this can help, among others, overcome the problem of overlapping of adjacent MSG pixels in the assessment of the detection. Fire detection can also be assessed per time interval (or per a fire incident) on a single-pixel location, and this can help, among others, overcome problems induced by smoke and cloud (e.g., obscuring a burning pixel location at some time instants during a fire) during performance assessment.

5. Conclusions

This study defined the expected background temperature of a pixel at a given constant False Alarm Rate (FAR) as a forecast from the latest analysis. The brightness temperatures in the MSG-SEVIRI IR 3.9 band and the offset of the sunrise to the thermal sunrise time of a non-fire condition are assimilated into the forecast model of the parameters of the DTC. The paper presented three analysis methods, namely, weak constraint 4D-Var, EnKF, and SIR particle filter, and a forecast is implemented using the ensemble forecasting scheme. The expected background and the observation temperatures of a pixel are used to identify a fire pixel in image acquired at each time step. A temporal CFAR detector that provides an adaptive threshold on the detection statistics is a component of the proposed fire detection method.
The paper proposed a multitemporal fire detection method that considers the diurnal variation in the background temperatures of a pixel location in assessing whether an observed brightness temperature at a given time step is extracted from a fire or non-fire pixel. The method is then able to detect even small and cool fires at any time of a day. Each time a non-fire observation is acquired, the DTC model is updated to help track rapidly variations in background temperatures, which leads to high performance of the fire detection method. The experimental results show a high detection rate of both EnKF-CD ( N e = 51 ) and SIR-CD ( N p = 51 ) but with a high level of unconfirmed detections. 4D-Var-CD ( N w = 6 ) recorded relatively a high omission (though exhibits a low level of false alarms) because the 4D-Var data assimilation window might include cloudy or smoky contaminated samples, or missed fire samples.
The use of assimilation strategies that will improve the efficiency in terms of both quality of the analysis estimate and computational cost in high dimensional space will result in better estimation of background temperature and accuracy of the fire detection. The improvement in modeling the variations of DTC parameters over time will be beneficial in fast adaptation to non-fire background change and early detection of the start and end of fires. False alarms can be reduced by extending the forecast model and observation model to include other parameters, such as parameters related to the atmosphere, land surfaces, or other MSG spectral bands apart from IR 3.9 . The spatial dimension and pressure levels will also be considered to formulate a global model (or regional model), taking into consideration the statistical correlation between neighbor pixels. The design of a method to deal with the Point Spread Function (PSF) effect will also be a task of future work. Different ensemble forecasting methods can be exploited for a better forecast skill. Different detection statistics can be derived from ensemble forecasts to detect a fire as soon as possible and be able to track it as long as it is still active. The content of the validation reference dataset will be improved.
The source codes are publicly available online at https://github.com/satfiretech/fire-dataAssimilation.

Supplementary Materials

The following are available online at https://0-www-mdpi-com.brum.beds.ac.uk/2072-4292/12/10/1661/s1, Section S1.1: Modeling—Pixel’s background description, Section S1.2: Data assimilation, Section S1.3: Derivation of pixel non-fire -state parameters, and Section S1.4: Ensemble forecasting-based change detection.

Author Contributions

Conceptualization, G.U. and B.J.v.W.; Formal analysis, G.U.; Funding acquisition, B.J.v.W. and Y.H.; Methodology, G.U. and B.J.v.W.; Resources, B.J.v.W. and Y.H.; Software, G.U.; Supervision, B.J.v.W. and Y.H.; Validation, G.U.; Writing—original draft, G.U.; Writing—review & editing, G.U., B.J.v.W. and Y.H. All authors have read and agreed to the published version of the manuscript.

Funding

This research was funded by Tshwane University of Technology.

Acknowledgments

The authors would like to thank EUMETSAT for making accessible MSG archived data which were used in this work—All MSG Data ©2007 and 2020 EUMETSAT.

Conflicts of Interest

The authors declare no conflict of interest. The funders had no role in the design of the study; in the collection, analyses, or interpretation of data; in the writing of the manuscript, or in the decision to publish the results.

Abbreviations

The following abbreviations are used in this manuscript:
3D-VarThree-Dimensional Variational Assimilation
4DDAFour-Dimensional Data Assimilation
4D-VarFour-Dimensional Variational Assimilation
AATSRAdvanced Along-Track Scanning Radiometer
A–DAnderson–Darling
AFISAdvanced Fire Information System
ANNArtificial Neural Network
AOTAerosol Optical Thickness
ASTERAdvanced Spaceborne Thermal Emission and Reflection Radiometer
AVHRRAdvanced Very High Resolution Radiometer
BIRDBispectral InfraRed Detection
BLUEBest Linear Unbiased Estimate
CDFCumulative Distribution Function
CFARConstant False Alarm Rate
COTCloud Optical Thickness
CSIRCouncil of Scientific and Industrial Research
CUSUMCumulative Sum
DDTPDay-to-day-temporal progression
DNDigital number
DTCDiurnal Temperature Cycle
EBBTEquivalent blackbody temperature
ECMWFEuropean center for Medium-range Weather Forecasts
EKFExtended Kalman Filter
ELLNegative Expected Log-Likelihood of state
gELLgeneralised (Negative) Expected Log-Likelihood of state
GSDGround Sampling Distance
EMExpectation–Maximization
EnKFEnsemble Kalman Filter
ENVISATEnvironmental Satellite
EOFEmpirical Orthogonal Function
ESAEuropean Space Agency
EUMETSATEuropean Organisation for Exploitation of Meteorological Satellites
FARFalse Alarm Rate
FIRActive Fire Monitoring
FDIFire Danger Index
FMCFuel Moisture Content
FREFire Radiative Energy
FRPFire Radiative Power
GEOGeostationary Earth Orbit
GEOSNormalized geostationary projection
GFOVGeometric Field of View
GOESGeostationary Operational Environment Satellites
GRS80Geodetic Reference System 1980
GSDGround Sampling Distance
HRITHigh Rate Information Transmission
HRVHigh Resolution Visible
HTEHigh-Temperature Event
IGFOVInstantaneous Geometric Field of View
i.i.dindependent and identically distributed
IMPFImage Processing Facility
IRInfrared
IRLSIteratively Reweighted Least Squares
ISImportance Sampling
KLKullback-Leibler
K-SKolmogorov-Smirnov
Land SAFLand Surface Analysis Facility
LANDSATLand Remote Sensing Satellite
LASSOLeast Absolute Shrinkage and Selection Operator
LASTLocal ‘apparent’ solar time
LEOLow Earth Orbit
LOOCVLeave-one-out cross-validation
L-SLocation-Scale
LSLeast Squares
LRITLow Rate Information Transmission
LSTLand Surface Temperature
LTILinear Time-Invariant
LUTlookup table
LWIRLong-Wave IR
MAMoving average filter
MAEMean Absolute Error
MADMedian Absolute Deviation
MBEmean-bias error
MCMonte Carlo
METEOSATMeteorological Satellite
MFBDMultiframe Blind Deconvolution
MIRMid-Infrared
MLEMaximum Likelihood Estimate
MMSEMinimum Mean Square Error
MODISMODerate Resolution Imaging Spectroradiometer
MODTRANMODerate resolution atmospheric TRANsmission
MPEFMeteorological Product Extract Facility
MSEMean Squared Error
MSGMETEOSAT Second Generation
MTFModulation Transfer Function
MVUEMinimum-Variance Unbiased Estimate
NAVDAS-ARNaval Research Laboratory (NRL) Atmospheric Variational Data Assimilation System - Accelerated Representer
NASANational Aeronautic and Space Agency
NCEPNational Centers for Environmental Prediction
NDVINormalized Difference Vegetation Index
NISNormalized Innovation Squared
NL-DDMNon-Linear Dynamic Detection Model
NMCNational Meteorological Center
NOAANational Oceanic and Atmospheric Administration
NWPnumerical weather prediction
OIOptimal Interpolation
OLObservation Likelihood
PCAPrincipal component analysis
pdfprobability density function
PSASPhysical-Space Statistical Analysis System
PSFPoint Spread Function
RKHSReproducing Kernel Hilbert Space
RMSroot mean square
RMSERoot Mean Squared Error
ROCReceiver Operating Characteristic
RSTRobust Satellite Technique
RTMRadiative Transfer Model
RTTOVRadiative Transfer model for TOVS
SACSatellite Applications Centre
SCMSuccessive Correction Method
SEVIRISpinning Enhanced Visible and Infrared Imager
SIRSampling Importance Resampling
SISSequential Importance Sampling
SLAFScaled-Lagged Average Forecasting
SMCSequential Monte Carlo
SSASample Size Adaptation
SVDSingular Value Decomposition
SVMSupport Vector Machine
SVRSupport Vector Regression
SWIRShortwave Infrared
SYNSATRADSYNthetic SATellite RADiance
TDEThermal diffusion equation
TETracking Error
TGSDThreshold Ground Sample Distance
TIRThermal InfraRed
TIROSTelevision Infrared Observation Satellite
TMThematic Mapper
TOATop Of the Atmosphere
TOTTotal Optical Thickness
TTGTime Thermal Gradient
TVOSTIROS Operational Vertical Sounder
TVXTemperature-Vegetation Index
UMARFUnified-Meteorological Archive and Retrieval Facility
UTCCoordinated Universal Time
VISvisible

References

  1. San-Miguel-Ayanz, J.; Ravail, N.; Kelha, V.; Ollero, A. Active fire detection for fire emergency management: Potential and limitations for the operational use of remote sensing. Nat. Hazards 2005, 35, 361–376. [Google Scholar] [CrossRef] [Green Version]
  2. Matson, M.; Dozier, J. Identification of subresolution high temperature sources using a thermal IR sensor. Photogramm. Eng. Remote Sens. 1981, 47, 1311–1318. [Google Scholar]
  3. Lee, T.F.; Tag, P.M. Improved Detection of Hotspots using the AVHRR 3.7-um channel. Bull. Am. Meteorol. Soc. 1990, 71, 1722–1730. [Google Scholar] [CrossRef] [Green Version]
  4. Flasse, S.P.; Ceccato, P. A contextual algorithm for AVHRR fire detection. Int. J. Remote Sens. 1996, 17, 419–424. [Google Scholar] [CrossRef]
  5. Kaufman, Y.J.; Justice, C.O.; Flynn, L.P.; Kendall, J.D.; Prins, E.M.; Giglio, L.; Ward, D.E.; Menzel, W.P.; Setzer, A.W. Potential global fire monitoring from EOS-MODIS. J. Geophys. Res. Atmos. 1998, 103, 32215–32238. [Google Scholar] [CrossRef]
  6. Giglio, L.; Kendall, J.D.; Mack, R. A multi-year active fire dataset for the tropics derived from the TRMM VIRS. Int. J. Remote Sens. 2003, 24, 4505–4525. [Google Scholar] [CrossRef]
  7. Zhukov, B.; Lorenz, E.; Oertel, D.; Wooster, M.; Roberts, G. Spaceborne detection and characterization of fires during the bi-spectral infrared detection (BIRD) experimental small satellite mission (2001–2004). Remote Sens. Environ. 2006, 100, 29–51. [Google Scholar] [CrossRef]
  8. Cisbani, E.; Bartoloni, A.; Marchese, M.; Elisei, G.; Salvati, A. Early fire detection system based on multi-temporal images of geostationary and polar satellites. In Proceedings of the IEEE International Geoscience and Remote Sensing Symposium (IGARSS), Toronto, ON, Canada, 24–28 June 2002; Volume 3, pp. 1506–1508. [Google Scholar] [CrossRef]
  9. Costantini, M.; Zavagli, M.; Cisbani, E.; Greco, B. A technique for automatic fire detection from geostationary optical sensors and its validation on MSG SEVIRI data. In Proceedings of the IEEE International Geoscience and Remote Sensing Symposium (IGARSS), Denver, CO, USA, 31 July–4 August 2006; pp. 4153–4156. [Google Scholar] [CrossRef]
  10. Prins, E.M.; Menzel, W.P. Geostationary satellite detection of bio mass burning in South America. Int. J. Remote Sens. 1992, 13, 2783–2799. [Google Scholar] [CrossRef]
  11. Prins, E.M.; Menzel, W.P. Trends in South American biomass burning detected with the GOES Visible infrared spin scan radiometer Atmospheric Sounder from 1983 to 1991. J. Geophys. Res. 1994, 99, 16719–16735. [Google Scholar] [CrossRef]
  12. EUMETSAT. Active Fire Monitoring with MSG-Algorithm Theoretical Basis Document; Document number: EUM/MET/REP/07/0170; Issue v1; EUMETSAT: Darmstadt, Germany, 2007. [Google Scholar]
  13. EUMETSAT. MSG Meteorological Products Extraction Facility Algorithm Specification Document; Document Number: EUM/MSG/SPE/022; Issue v5; EUMETSAT: Darmstadt, Germany, 2009. [Google Scholar]
  14. Xu, G.; Zhong, X. Real-time wildfire detection and tracking in Australia using geostationary satellite: Himawari-8. Remote Sens. Lett. 2017, 8, 1052–1061. [Google Scholar] [CrossRef]
  15. Roberts, G.J.; Wooster, M.J. Fire Detection and Fire Characterization Over Africa Using METEOSAT SEVIRI. IEEE Trans. Geosci. Remote Sens. 2008, 46, 1200–1218. [Google Scholar] [CrossRef] [Green Version]
  16. Amraoui, M.; DaCamara, C.C.; Pereira, J.M.C. Detection and monitoring of African vegetation fires using MSG-SEVIRI imagery. Remote Sens. Environ. 2010, 114, 1038–1052. [Google Scholar] [CrossRef]
  17. Lin, Z.; Chen, F.; Li, B.; Yu, B.; Jia, H.; Zhang, M.; Liang, D. A Contextual and Multitemporal Active-Fire Detection Algorithm Based on FengYun-2G S-VISSR Data. IEEE Trans. Geosci. Remote Sens. 2019, 1–13. [Google Scholar] [CrossRef]
  18. Calle, A.; Casanova, J.L.; González-Alonso, F. Impact of point spread function of MSG-SEVIRI on active fire detection. Int. J. Remote Sens. 2009, 30, 4567–4579. [Google Scholar] [CrossRef]
  19. Hally, B.; Wallace, L.; Reinke, K.; Jones, S.; Engel, C.; Skidmore, A. Estimating Fire Background Temperature at a Geostationary Scale–An Evaluation of Contextual Methods for AHI-8. Remote Sens. 2018, 10, 1368. [Google Scholar] [CrossRef] [Green Version]
  20. Schroeder, W.; Prins, E.; Giglio, L.; Csiszar, I.; Schmidt, C.; Morisette, J.; Morton, D. Validation of GOES and MODIS active fire detection products using ASTER and ETM+ data. Remote Sens. Environ. 2008, 112, 2711–2726. [Google Scholar] [CrossRef]
  21. Schroeder, W.; Morisette, J.T.; Csiszar, I.; Giglio, L.; Morton, D.; Justice, C.O. Characterizing vegetation fire dynamics in Brazil through multisatellite data: Common trends and practical issues. Earth Interact. 2005, 9, 1–26. [Google Scholar] [CrossRef] [Green Version]
  22. Reid, J.S.; Hyer, E.J.; Prins, E.M.; Westphal, D.L.; Zhang, J.; Wang, J.; Christopher, S.A.; Curtis, C.A.; Schmidt, C.C.; Eleuterio, D.P.; et al. Global monitoring and forecasting of biomass-burning smoke: Description of and lessons from the Fire Locating and Modeling of Burning Emissions (FLAMBE) program. IEEE J. Sel. Top. Appl. Earth Obs. Remote Sens. 2009, 2, 144–162. [Google Scholar] [CrossRef]
  23. Mazzeo, G.; Marchese, F.; Filizzola, C.; Pergola, N.; Tramutoli, V. A multi-temporal Robust Satellite Technique (RST) for forest fire detection. In Proceedings of the International Workshop on the Analysis of Multi-temporal Remote Sensing Images (MultiTemp 2007), Leuven, Belgium, 18–20 July 2007; pp. 1–6. [Google Scholar] [CrossRef]
  24. Filizzola, C.; Corrado, R.; Marchese, F.; Mazzeo, G.; Paciello, R.; Pergola, N.; Tramutoli, V. RST-FIRES, an exportable algorithm for early-fire detection and monitoring: Description, implementation, and field validation in the case of the MSG-SEVIRI sensor. Remote Sens. Environ. 2017, 192, e2–e25. [Google Scholar] [CrossRef]
  25. Cuomo, V.; Lasaponara, R.; Tramutoli, V. Evaluation of a new satellite-based method for forest fire detection. Int. J. Remote Sens. 2001, 22, 1799–1826. [Google Scholar] [CrossRef]
  26. Lasaponara, R.; Cuomo, V.; Macchiato, M.F.; Simoniello, T. A self-adaptive algorithm based on AVHRR multitemporal data analysis for small active fire detection. Int. J. Remote Sens. 2003, 24, 1723–1749. [Google Scholar] [CrossRef]
  27. Laneve, G.; Castronuovo, M.M.; Cadau, E.G. Continuous monitoring of forest fires in the Mediterranean area using MSG. IEEE Trans. Geosci. Remote Sens. 2006, 44, 2761–2768. [Google Scholar] [CrossRef]
  28. Biase, V.D.; Laneve, G. Geostationary sensor based forest fire detection and monitoring: An improved version of the SFIDE algorithm. Remote Sens. 2018, 10, 741. [Google Scholar] [CrossRef] [Green Version]
  29. Roberts, G.; Wooster, M.J. Development of a multi-temporal Kalman filter approach to geostationary active fire detection & fire radiative power (FRP) estimation. Remote Sens. Environ. 2014, 152, 392–412. [Google Scholar] [CrossRef]
  30. Hally, B.; Wallace, L.; Reinke, K.; Jones, S. A broad-area method for the Diurnal characterisation of upwelling medium wave infrared radiation. Remote Sens. 2017, 9, 167. [Google Scholar] [CrossRef] [Green Version]
  31. Hally, B.; Wallace, L.; Reinke, K.; Jones, S.; Skidmore, A. Advances in active fire detection using a multi-temporal method for next-generation geostationary satellite data. Int. J. Digit. Earth 2019, 12, 1030–1045. [Google Scholar] [CrossRef]
  32. Xu, W.; Wooster, M.J.; Roberts, G.; Freeborn, P. New GOES imager algorithms for cloud and active fire detection and fire radiative power assessment across North, South and Central America. Remote Sens. Environ. 2010, 114, 1876–1895. [Google Scholar] [CrossRef]
  33. Joro, S.; Lutz, H.J.; van de Berg, L.; Yildirim, A.; Samain, O. Towards an improved Active Fire Monitoring Product for MSG satellites. In Proceedings of the EUMETSAT Meteorological Satellite Conference, Darmstadt, Germany, 8–12 September 2008. [Google Scholar]
  34. Van den Bergh, F.; Frost, P.E. A Multi-temporal approach to fire detection using MSG data. In Proceedings of the International Workshop on the Analysis of Multi-temporal Remote Sensing Images (MultiTemp05), Biloxi, MS, USA, 16–18 May 2005; pp. 156–160. [Google Scholar] [CrossRef]
  35. Van den Bergh, F.; Udahemuka, G.; van Wyk, B.J. Potential fire detection based on Kalman-driven change detection. In Proceedings of the IEEE International Geoscience and Remote Sensing Symposium (IGARSS), Cape Town, South Africa, 12–17 July 2009; pp. IV-77–IV-80. [Google Scholar] [CrossRef]
  36. Xie, Z.; Song, W.; Ba, R.; Li, X.; Xia, L. A spatiotemporal contextual model for forest fire detection using Himawari-8 satellite data. Remote Sens. 2018, 10, 1992. [Google Scholar] [CrossRef] [Green Version]
  37. Koltunov, A.; Ustin, S.L. Early fire detection using non-linear multitemporal prediction of thermal imagery. Remote Sens. Environ. 2007, 110, 18–28. [Google Scholar] [CrossRef]
  38. Koltunov, A.; Ustin, S.L.; Quayle, B.; Schwind, B.; Ambrosia, V.G.; Li, W. The development and first validation of the GOES Early Fire Detection (GOES-EFD) algorithm. Remote Sens. Environ. 2016, 184, 436–453. [Google Scholar] [CrossRef] [Green Version]
  39. Lin, L.; Meng, Y.; Yue, A.; Yuan, Y.; Liu, X.; Chen, J.; Zhang, M.; Chen, J. A spatio-temporal model for forest fire detection using HJ-IRS satellite data. Remote Sens. 2016, 8, 403. [Google Scholar] [CrossRef] [Green Version]
  40. Wickramasinghe, C.H.; Jones, S.; Reinke, K.; Wallace, L. Development of a multi-spatial resolution approach to the surveillance of active fire lines using Himawari-8. Remote Sens. 2016, 8, 932. [Google Scholar] [CrossRef] [Green Version]
  41. Lin, Z.; Chen, F.; Niu, Z.; Li, B.; Yu, B.; Jia, H.; Zhang, M. An active fire detection algorithm based on multi-temporal FengYun-3C VIRR data. Remote. Sens. Environ. 2018, 211, 376–387. [Google Scholar] [CrossRef]
  42. Van den Bergh, F.; van Wyk, M.A.; van Wyk, B.J. A comparison of data-driven and model-driven approaches to brightness temperature diurnal cycle interpolation. In Proceedings of the 17th Symposium of the Pattern Recognition Association of South Africa, Parys, South Africa, 29 November–1 December 2006; pp. 252–256. [Google Scholar]
  43. Goldstein, G.B. False-alarm regulation in log-normal and Weibull clutter. IEEE Trans. Aerosp. Electron. Syst. 1973, 9, 84–92. [Google Scholar] [CrossRef]
  44. Fawcett, T. An introduction to ROC analysis. Pattern Recognit. Lett. 2006, 27, 861–874. [Google Scholar] [CrossRef]
  45. Davis, J.; Goadrich, M. The relationship between Precision-Recall and ROC curves. In Proceedings of the 23rd International Conference on Machine Learning (ICML2006), Pittsburgh, PA, USA, 25–29 June 2006; pp. 233–240. [Google Scholar] [CrossRef] [Green Version]
  46. Provost, F.; Fawcett, T. Robust classification for imprecise environments. Mach. Learn. 2001, 42, 203–231. [Google Scholar] [CrossRef]
Figure 1. User’s accuracy and Producer’s accuracy against estimated FAR.
Remotesensing 12 01661 g001
Figure 2. Error (cost) function, Precision-Recall curves and ROC curves.
Remotesensing 12 01661 g002
Figure 3. User’s-Producer’s plot for the case a comparison to MODIS MOD14/MYD14 is implemented considering 20 min before and after the MODIS detection.
Remotesensing 12 01661 g003
Figure 4. Producer’s accuracy against fire time of the day (96 samples) over five days.
Remotesensing 12 01661 g004
Figure 5. Producer’s accuracy per brightness temperature at 10 3.5 FAR over five days.
Remotesensing 12 01661 g005
Figure 6. Example of a detection of a brief morning fire reported by MODIS MOD14/MYD14 (on 2 August 2007). Level 1.5 pixel at ( 993 , 899 ) (Line, Column) with pixel center at ( 25.2829 S , 31.2502 E ) . Detection at 10 3.5 FAR.
Remotesensing 12 01661 g006
Figure 7. Example of a detection of a brief night fire reported by MODIS MOD14/MYD14. Level 1.5 pixel at ( 983 , 901 ) (Line, Column) with pixel center at ( 25.6083 S , 31.2846 E ) . Detection at 10 3.5 FAR.
Remotesensing 12 01661 g007
Figure 8. Example of a detection of a fire extending over two DTCs. Level 1.5 pixel at ( 995 , 896 ) (Line, Column) with pixel center at ( 25.2224 S , 31.3448 E ) . Detection at 10 3.5 FAR.
Remotesensing 12 01661 g008
Table 1. Characteristics of the distribution of the detection statistic r k (one Monte Carlo (MC) run).
Analysis P ( G 2 ( r k ) < 3 ) [ 0.25 , 0.75 ] Quantiles of G 2 ( r k ) Min of G 2 ( r k ) P ( 0.5 G 1 ( r k ) 0.5 ) [ 0.25 , 0.75 ] Quantiles of G 1 ( r k ) Rejection Rate of H 0 (A–D Test at α = 1 % )Global Variance
H 0 : r k Gaussian H 0 : r k Reverse Gumbel
4D-Var-CD ( N w = 6 )   0.6500 [ 1.0248 , 3.8404 ] 1.1318 0.2884 [ 1.3351 , 0.2776 ] 0.0854 0.1888 0.7904
EnKF-CD ( N e = 51 )   0.9383 [ 0.3594 , 1.1607 ] 1.6225 0.5240 [ 0.7615 , 0.0109 ] 0.0331 0.2524 0.8833
SIR-CD ( N p = 51 )   0.9445 [ 0.5555 , 0.8701 ] 1.6952 0.5144 [ 0.5935 , 0.3780 ] 0.1306 0.4608 1.9776
P(·): Probability, G1(·): Skewness, G2(·): Excess kurtosis, Min: Minimum, A-D test: Anderson–Darling test, and α: Significance level.
Table 2. Fitting parameters (with their 95 % (sample) confidence interval) for the threshold coefficient.
Parameters 4D-Var-CD ( N w = 6 )   EnKF-CD ( N e = 51 )   SIR-CD ( N p = 51 )  
a 0.3490 ( 0.3519 , 0.3462 ) 0.2397 ( 0.2419 , 0.2376 ) 0.1701 ( 0.1724 , 0.1678 )
b 2.6660 ( 2.7309 , 2.6011 ) 2.5700 ( 2.5954 , 2.5446 ) 3.8721 ( 3.9055 , 3.8388 )
c 0.2155 ( 0.2037 , 0.2273 ) 0.5241 ( 0.5162 , 0.5321 ) 0.8715 ( 0.8623 , 0.8807 )
Table 3. Detection accuracy comparison against MODIS MOD14/MYD14 fire products at 10 3.5 FAR.
DateMOD14/MYD14 (Number of Events)4D-Var-CDEnKF-CDSIR-CD
31 July 2007497126397426
1 August 2007579160470391
2 August 20071003702791822
3 August 20071000371819798
4 August 2007222165119182
‘MOD14/MYD14’ column shows the number of MODIS fire events reported by MODIS MOD14/MYD14 fire products while ‘4D-Var-CD’, ‘EnKF-CD’ and ‘SIR-CD’ columns list number of true positives according to MODIS MOD14/MYD14 product reported by 4D-Var-CD(Nw=6), EnKF-CD(Ne=51) and SIR-CD(Np=51), respectively.
Table 4. Detection accuracy comparison against EUMETSAT FIR and MODIS MOD14/MYD14 fire products at 10 3.5 FAR.
DateFIR (Number of Events)FIR (MOD) (Number of Events)4D-Var-CDEnKF-CDSIR-CD
FIR + FIR , MOD + FIR , MOD FIR + FIR , MOD + FIR , MOD FIR + FIR , MOD + FIR , MOD
31 July 2007302491302123732302392 11 , 780 302418 18 , 976
1 August 200769155151814468691442 10 , 207 691364 23 , 196
1 August 2007828972808685 1899 816759 10 , 995 828792 21 , 588
3 August 2007131793166333332101228750 13 , 595 1266727 20 , 750
4 August 200718321326160177588110 10 , 244 117175 9988
‘4D-Var-CD’, ‘EnKF-CD’ and ‘SIR-CD’ columns contain results of 4D-Var-CD(Nw=6), EnKF-CD(Ne=51), and SIR-CD(Np=51), respectively. ‘FIR’ provides fire events reported by EUMETSAT FIR, ‘FIR (MOD)’ provides MODIS MOD14/MYD14 fire events not reported by EUMETSAT FIR, ‘FIR+’ provides true positives according to EUMETSAT FIR fire product, ‘FIR,MOD+’ provides true positives according to MODIS MOD14/MYD14 fire product among false positives according to EUMETSAT FIR product and ‘FIR,MOD’ provides false positives according to both MODIS MOD14/MYD14 and EUMETSAT FIR products.
Table 5. Detection accuracy comparison against MODIS MOD14/MYD14 Fire products on 10 3.5 CFAR.
TimePseudo-Color Thermal ImageMOD14/MYD14 & FIR4D-VarEnKFSIR
08:12 a.m. Remotesensing 12 01661 i001 Remotesensing 12 01661 i002 Remotesensing 12 01661 i003 Remotesensing 12 01661 i004 Remotesensing 12 01661 i005
FIR MOD 14 FIR + / MOD 14 + FIR + FIR / MOD 14 + FIR / MOD 14 FIR + FIR / MOD 14 + FIR / MOD 14 FIR + FIR / MOD 14 + FIR / MOD 14
15 ( 469 , 281 ) ( 30 , 9 ) 11 ( 173 , 84 ) 415 ( 331 , 195 ) 15115 ( 331 , 195 ) 204
12:42 p.m. Remotesensing 12 01661 i006 Remotesensing 12 01661 i007 Remotesensing 12 01661 i008 Remotesensing 12 01661 i009 Remotesensing 12 01661 i010
FIR MYD 14 FIR + / MYD 14 + FIR + FIR / MYD 14 + FIR / MYD 14 FIR + FIR / MYD 14 + FIR / MYD 14 FIR + FIR / MYD 14 + FIR / MYD 14
61 ( 339 , 209 ) ( 32 , 16 ) 39 ( 194 , 114 ) 061 ( 250 , 151 ) 15061 ( 282 , 174 ) 451
11:27 p.m. Remotesensing 12 01661 i011 Remotesensing 12 01661 i012 Remotesensing 12 01661 i013 Remotesensing 12 01661 i014 Remotesensing 12 01661 i015
FIR MYD 14 FIR + / MYD 14 + FIR + FIR / MYD 14 + FIR / MYD 14 FIR + FIR / MYD 14 + FIR / MYD 14 FIR + FIR / MYD 14 + FIR / MYD 14
2 ( 89 , 34 ) ( 2 , 2 ) 2 ( 47 , 13 ) 822 ( 76 , 25 ) 4122 ( 69 , 20 ) 560
(,): First element is MODIS pixel fire events while the second element is MSG pixel fire events. FIR+/MYD14+ or FIR+/MOD14+, fire pixels reported by both FIR and MOD14 products or by both FIR and MYD14 products, respectively. FIR+: also reported by FIR, FIR/MOD14+ or FIR/MYD14+, also reported by MOD14 or MYD14, respectively but not by FIR, FIR/MOD14 or FIR/MYD14, not reported by both FIR and MOD14/MY14 products, i.e., false alarm according to both FIR and MOD14/MYD14 products. The Level 1.5 image of 3 August 2007 and time is expressed in UTC.
Table 6. Table corresponds to results in Figure 6.
DatesMOD14/MYD14FIR 4D-Var-CD ( N w = 6 ) EnKF-CD ( N e = 51 ) SIR-CD ( N p = 51 )
1 August 2007(25.2901 S, 31.2658 E) 20:25[65](25.2829 S, 31.2502 E) 12:15[40] 12:30[80] 13:00[80] 18:00[80]11:30-23:4511:30-23:4511:30-15:15 17:00-21:15
2 August 2007(25.2770 S, 31.2656 E) 11:40[59] (25.2784 S, 31.2557 E) 11:40[77]00:00 07:00-12:0000:00-01:00 07:00-12:0007:00-08:45
3 August 2007
[]:Detection confidence in percentage, where for EUMETSAT FIR [80] represents ‘probable fire’, [40]: possible fire. Detection time for 4D-Var-CD(Nw=6), EnKF-CD(Ne=51) and SIR-CD(Np=51) is brightness observation time reported in Level1.5 image minus 12 min, the time is expressed in UTC and MODIS MOD14/MYD14 time in the table is the rangeStartingTime, where rangeEndingTime minus rangeStartingTime is 5 min.
Table 7. Table corresponds to results in Figure 7.
DatesMOD14/MYD14FIR 4D-Var-CD ( N w = 6 )   EnKF-CD ( N e = 51 )   SIR-CD ( N p = 51 )  
31 July 200712:3012:3012:30
1 August 2007(25.6208 S, 31.3016 E) 20:25[32]20:30-21:4520:30-21:45
2 August 2007
[]:Detection confidence in percentage, where for EUMETSAT FIR [80] represents ‘probable fire’, [40]: possible fire. Detection time for 4D-Var-CD(Nw=6), EnKF-CD(Ne=51) and SIR-CD(Np=51) is brightness observation time reported in Level1.5 image minus 12 min, the time is expressed in UTC and MODIS MOD14/MYD14 time in the table is the rangeStartingTime, where rangeEndingTime minus rangeStartingTime is 5 min.
Table 8. Table corresponds to results in Figure 8.
DatesMOD14/MYD14FIR 4D-Var-CD ( N w = 6 )   EnKF-CD ( N e = 51 )   SIR-CD ( N p = 51 )  
2 August 200714:30 17:45 18:15 18:4513:15-23:4504:45 05:00 17:45-23:45
3 August 2007(25.2120 S, 31.3550 E) 08:05[59] (25.2273 S, 31.3534 E) 12:25[100] (25.2243 S, 31.3475 E) 12:25[100](25.2224 S, 31.3448 E) 10:45[40] 11:00[40] 11:15[40] 11:45[80] 12:00[80] 12:15[80] 12:45[80] 14:30[80] 14:45[80] 15:00[80] 15:30[80]00:00-23:4500:00-23:45
4 August 200700:00-04:3000:00-04:30
[]:Detection confidence in percentage, where for EUMETSAT FIR [80] represents ‘probable fire’, [40]: possible fire. Detection time for 4D-Var-CD(Nw=6), EnKF-CD(Ne=51) and SIR-CD(Np=51) is brightness observation time reported in Level1.5 image minus 12 min, the time is expressed in UTC and MODIS MOD14/MYD14 time in the table is the rangeStartingTime, where rangeEndingTime minus rangeStartingTime is 5 min.

