Article

Analysis of Landslide Movements Using Interferometric Synthetic Aperture Radar: A Case Study in Hunza-Nagar Valley, Pakistan

1
College of Earth and Environmental Sciences, Lanzhou University, Lanzhou 730000, China
2
Department of Earth Sciences, COMSATS University Islamabad-Abbottabad Campus, Abbottabad 22060, Pakistan
3
School of Earth Sciences, Lanzhou University, Lanzhou 730000, China
4
Earth Science Department, University of Florence, 50121 Firenze, Italy
5
Department of Geology, University of Peshawar, Peshawar 25210, Pakistan
6
Pakistan Atomic Energy Commission, Islamabad 1114, Pakistan
*
Author to whom correspondence should be addressed.
Remote Sens. 2020, 12(12), 2054; https://0-doi-org.brum.beds.ac.uk/10.3390/rs12122054
Submission received: 14 May 2020 / Revised: 21 June 2020 / Accepted: 22 June 2020 / Published: 25 June 2020

Abstract

:
From a geological standpoint, northern Pakistan is one of the most active and unstable areas in the world. As a consequence, many massive landslides have occurred in the area in historical times that have destroyed infrastructure, blocked the Hunza River, and damaged the Karakoram Highway repeatedly. However, despite the high frequency of large magnitude landslide events, and the consequent damages, the entire area is largely understudied, mainly due to the difficult logistics and the large distances involved. This work is aimed at applying the potential use of Interferometric Synthetic Aperture Radar (InSAR) for landslide identification and investigation for the Hunza-Nagar Region. Sentinel-1 images covering a period of more than two years (February 2017–August 2019) were used and processed by adopting the small baseline subset (SBAS) method. The obtained deformation rate measured along the line of sight (VLOS) varies from −114 to 20 mm/year. The downslope velocity deformation rates (Vslope) range from 0 to −300 mm/year. The Vslope stability threshold for our study area was calculated to be −14 mm/year from the Vslope standard deviation. Four active landslides with Vslope exceeding 14 mm/year were recognizable and have been confirmed by field inspection. The identified landslides listed from the most active to least active are the Humarri, Mayoon, Khai, and Ghulmet landslides, respectively. VLOS exceeding 114 mm/year was observed in the Humarri landslide, which posed a threat of damming a lake on the Hispar River and was also a risk to the Humarri Village located below the landslide. The maximum mean deformation detected in the Ghulmet, and Mayoon landslide was in the order of 30 mm/year and 20 mm/year, respectively. More importantly, it was found that in places, the slope deformation time series showed a patchy correlation with precipitation and seismic events in the area. This may indicate a complex, and possibly uncoupled, relationship between the two controlling agents promoting the deformation. However, the collective impact of the two factors is evident in the form of a continuously descending deformation curve and clearly indicates the ground distortion. The results indicate a potentially critical situation related to the high deformation rates measured at the Humarri landslide. On this specific slope, conditions leading to a possible catastrophic failure cannot be ruled out and should be a priority for the application of mitigation measures.

1. Introduction

Landslides are the most common and frequent hazards in the mountainous regions of the world which, directly or indirectly, affect the lives of the native dwellers [1]. In the period between 1998 and 2017, landslides, and their associated hazards, affected an estimated 4.8 million people and caused more than 18,000 deaths globally [2]. By improving the overall understanding of the science of this hazard, the safety of the communities could be ensured, as well as the annual damage and death toll could be significantly reduced. The northern rugged mountainous regions of Pakistan are prone to landslide hazards [3]. A higher number of recorded landslide events is linked to population growth and development in these areas [4].
The Hunza-Nagar region in northern Pakistan is well known for its unique geologic and geomorphologic features. Topographically, the Hunza-Nagar valley is characterized by deeply incised valleys and rugged mountains, with elevations ranging from 1746 m to 7315 m above sea level (Figure 1d). The topography has a strong influence on local climate in the region. The high relative relief causes rainfall to concentrate in the high-altitude areas (≥1000 mm/year), with much less precipitation in the valleys (250–500 mm/year) [5]. Northern Pakistan is located in a region which is seismically very active and has experienced many disastrous earthquakes in the past. The seismic activity in the region is demonstrated by about 300 M > 5 and seven M > 7 earthquakes events since 1980 (Kashmir Earthquake October, 2005: M = 7.6; Afghanistan October, 2015: M = 7.5) according to the USGS Earthquake Catalog, [6] (Figure 1b). Undercutting of landslide toes by Hunza River below the rock/debris fall upslope are major concerns in this area [7]. All the conditions mentioned above, coupled with the active tectonics, makes this region prone to geohazards. The authors of [8] have generated a landslide inventory map for the Hunza-Nagar valley by using the visual interpretation of the SPOT-5 satellite imagery and mapped a total of 172 landslides. Numerous landslide scars can be seen on the valley walls along with mass movement deposits commonly found on the valley floors and the lower part of the valley walls (Figure 2). The old landslide deposits and associated layers of very fine-grained late sediment of variable thickness in an otherwise steep gradient channel point towards the frequent damming of the Hunza River valley in the past [9].
In 1858, a landslide event occurred near the Salmanabad village, 3 km southwest of Attabad village, blocked the Hunza valley (Figure 2a). The lake formed because of the landslide and was sustained for six months [3]. The landslide dam was ultimately breached, causing a catastrophic flood that damaged substantial life and property along a >400 km long valley [9]. In 1992 (7–9 September), intense rainfall triggered the slope collapse at Sarat village, which affected the Karakoram Highway (KKH) and deposited enormous volumes of boulders several meters in diameter downstream [3,10]. In January 2010, a sizeable Attabad landslide dammed the Hunza River raising the water level to 100 m from the normal flow. At least 20 people died in the event that blocked the Hunza River, creating a landslide dam and lake that progressively extended 23 km upstream, submerging four villages. The landslide also blocked the KKH, a vital link to China, cutting off 26,000 people in Upper Hunza. The debris obstructed approximately three kilometers of the Hunza River and a long stretch of the KKH [11]. Even though the area is familiar with such events, this was the most significant landslide events in the last two decades.
The increasing frequency of such geohazard events can be attributed to the increasing population pressure in this region, which is rapidly pushing the human settlements closer to the areas which have a known history of recurring natural hazards. It thus has strong socio-economic effects on the overall development of the region because it directly threatens the infrastructure and human settlements [13]. The recent investments in the Hunza Valley under the initiative of the China Pakistan Economic Corridor (CPEC) has profoundly increased the installation of infrastructure including dams, road, tunnels, bridges, and ports, which have also increased the importance of hazard monitoring in the valley [14]. As CPEC will be the major direct trade route from China to Europe, the Middle East, and Africa, the probable blockage in trade due to landslide hazard will have global effects.
To ensure the safety of the communities, the investments in the area, and the continuity of trade in the region, the detection, and monitoring of such devastating effects of landslides is essential [13,15]. However, to detect and monitor the slope movements of such a complex area with a large number of slopes is a challenge [16].
Remote sensing (RS) is a powerful tool for landslide displacement detection [17,18]. It provides a solution in the form of a survey or early warning in those unstable areas where massive landslides occur frequently and accelerate suddenly [13,19]. The RS images offer a regional understanding of a region both in terms of its spatial spread as well as its chronological evolution. However, compared to traditional RS techniques such as Global Navigation Satellite System (GNSS), geophysical surveys, and optical remote sensing, the Interferometric Synthetic Aperture Radar (InSAR) technique has been widely used in landslide research due to its broad coverage, high spatial resolution, and ability to operate under all weather conditions [20,21,22]. InSAR is a remote sensing technique used to detect and quantify the superficial geomorphological changes on the Earth, which in ordinary cases might happen unnoticed in an inaccessible area. It has been widely used for 30 years for Earth remote sensing and reporting of many landslide events [23]. The InSAR technique can be applied at regional scales for slope movements monitoring, ground subsidence, glacier monitoring, and for studying the movements of the tectonic plate [24]. Many studies [13,25,26,27,28,29,30] have used the InSAR technique because of its wide-ranging applications which are achievable through the data with a high spatial and temporal resolution. Mainly, a permanent scatters InSAR (PS-InSAR) method introduced by [31] Ferretti et al. and a small baseline subset InSAR (SBAS-InSAR) method proposed by Berardino et al. have been widely used in related fields with millimetric accuracy [32,33].
SBAS method is based on the selection of multi-master interferograms having a short spatial and temporal baseline. Short spatial and temporal baselines overpower the spatio-temporal decorrelation effects [34], and therefore, it is valuable for ground deformation detection. The SBAS-SAR interferometry technique can detect broad areas of ground deformations with high accuracy, making this method appropriate to investigate surface deformation of both regional and local scale [22,35].
The previous work in the region [5,8,36,37,38] is based on deterministic and statistical relationships and regression investigation of landslides and their contributing factors. This paper, for the first time, uses the SBAS-InSAR technique to investigate the surface ground deformation in a highly active collision zone between two continents. This makes it a novel approach to detect landslide movements in the northern Pakistan in specific and in southeast Asia in general. The aim is to detect and monitor landslides in areas with rugged topography, a typical challenge for InSAR analysis, to highlight the presence of potentially hazardous landslides which were previously unknown to the attention of local authorities, and to ultimately prompt dedicated field surveys and confirmation studies of the priority cases. This technique would also offer a basis for the reduction and possible prevention of the landslide risk over a large area which is otherwise difficult to monitor by using field methods, due to the difficult logistics and long distances. Incidentally, this area is also home to several important local communities and hosts strategic water resources and transport networks of paramount importance for the connections between Pakistan and its north-border countries.

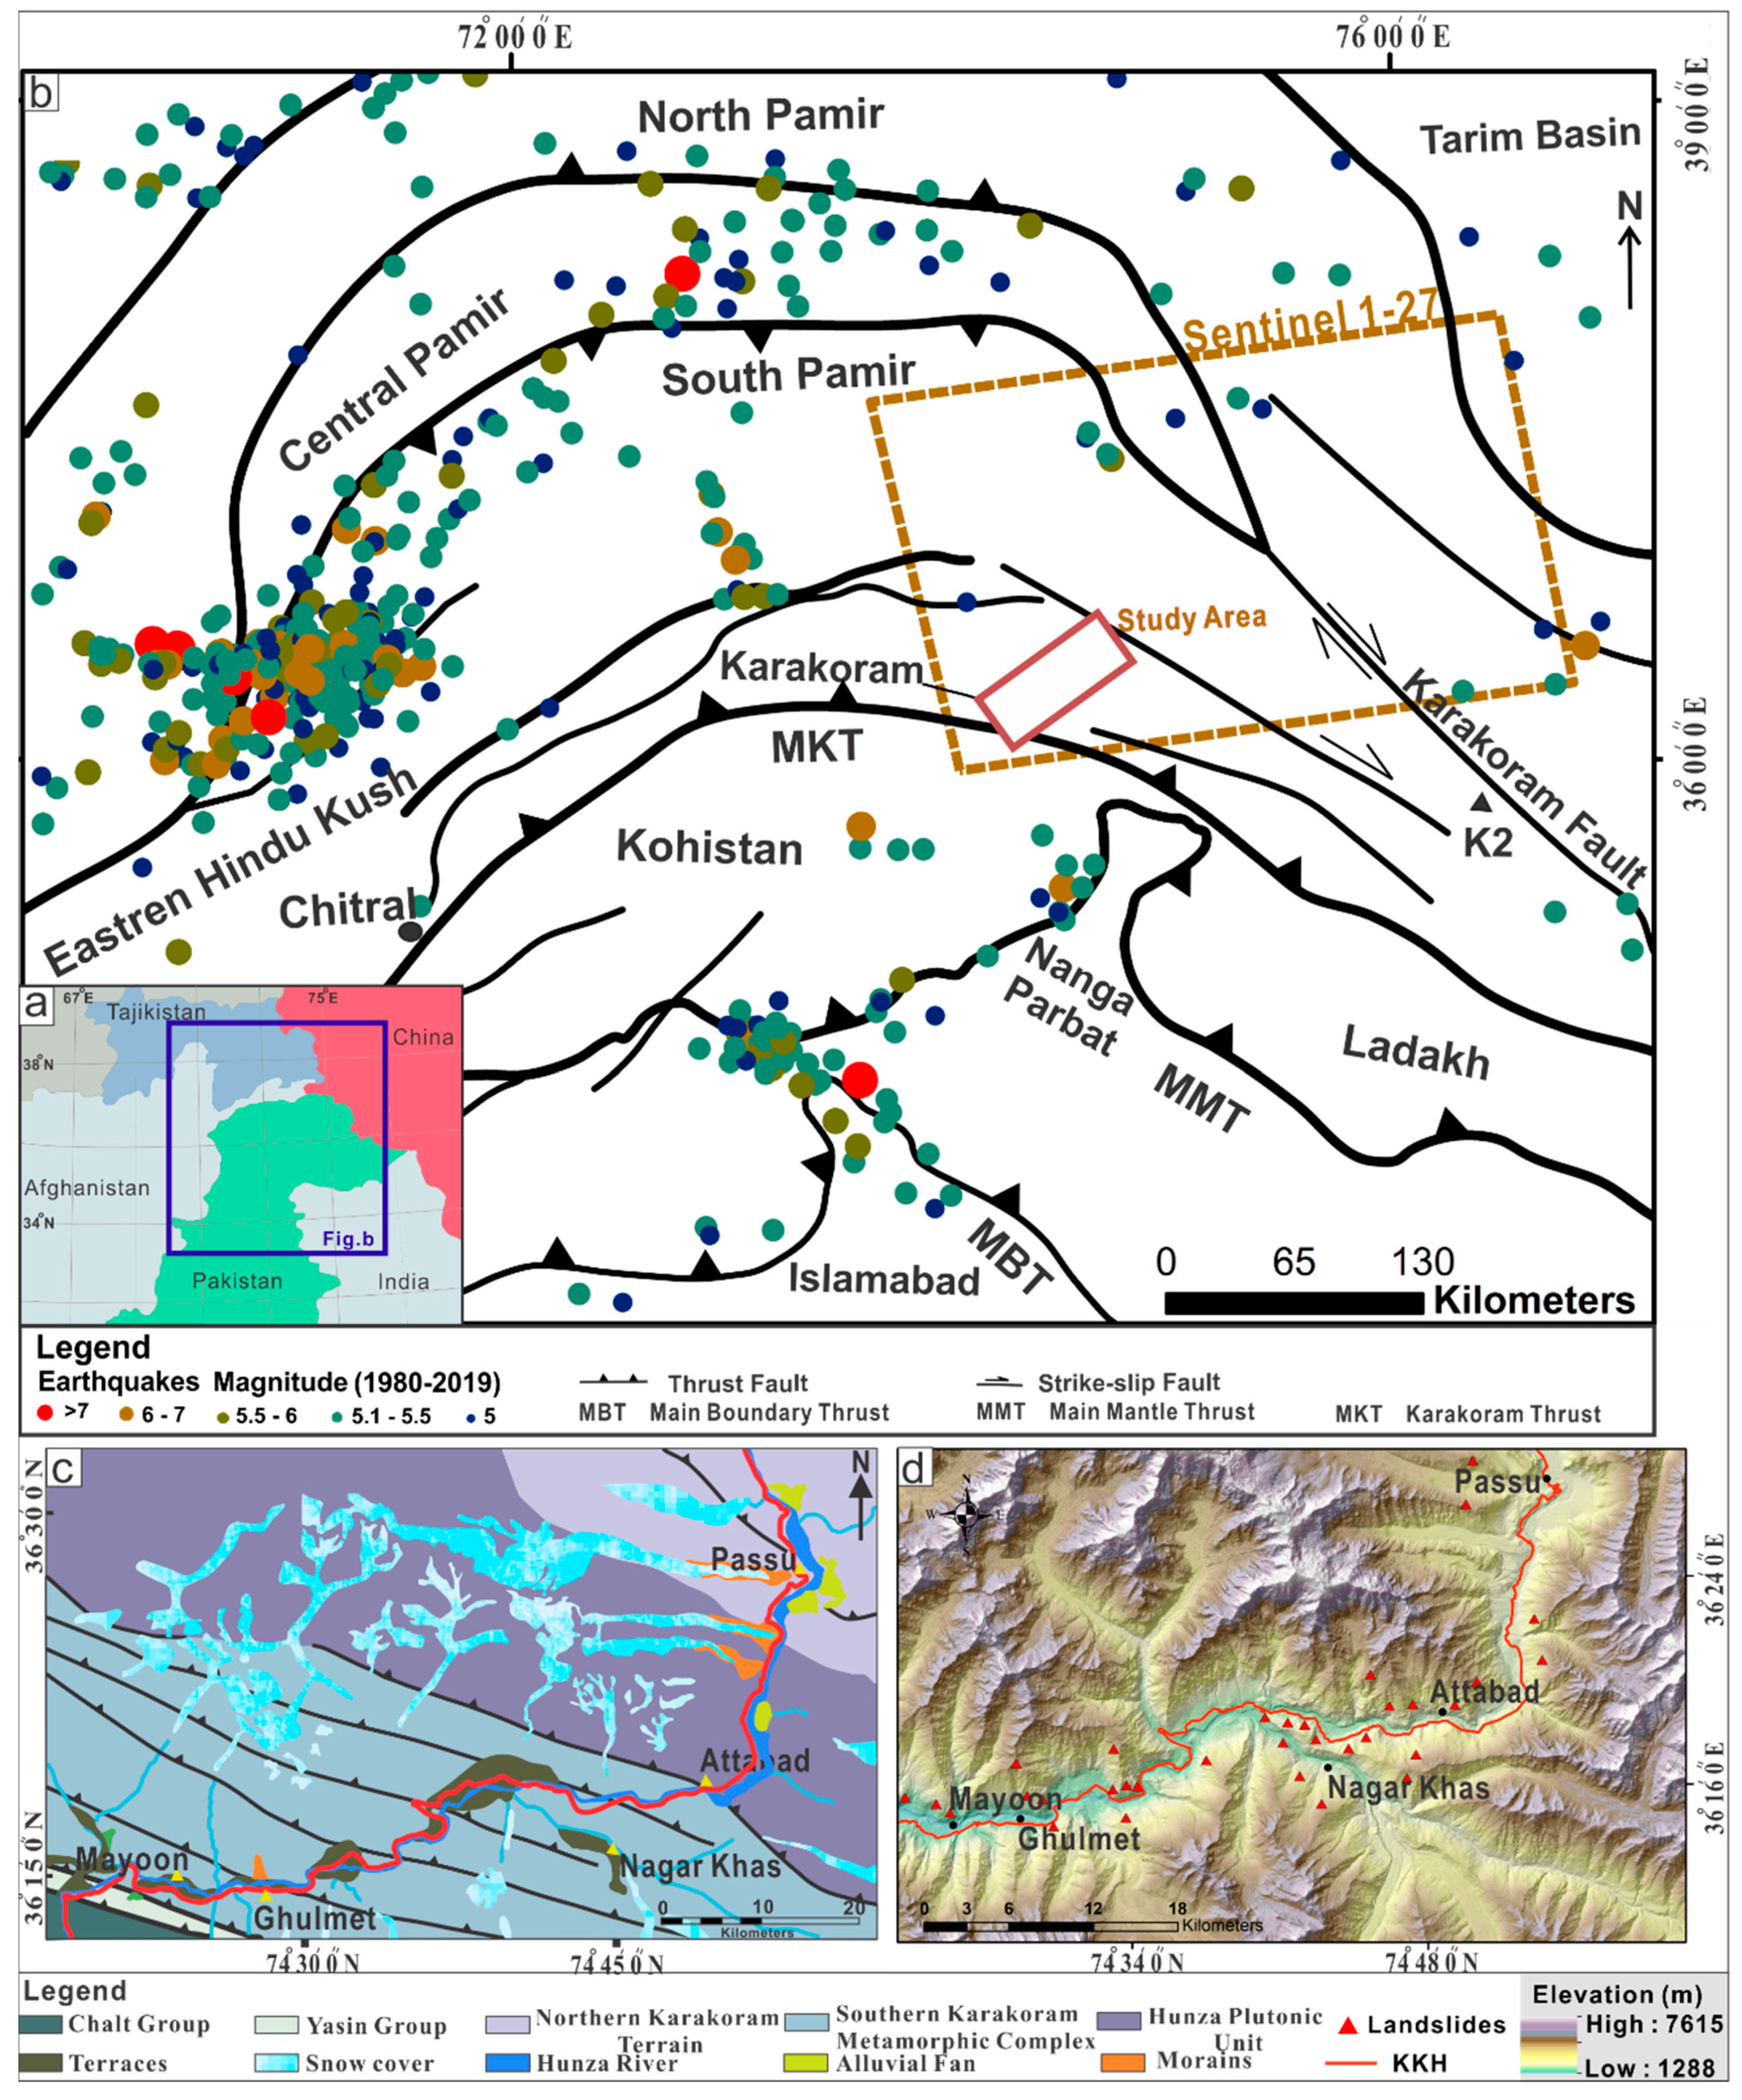
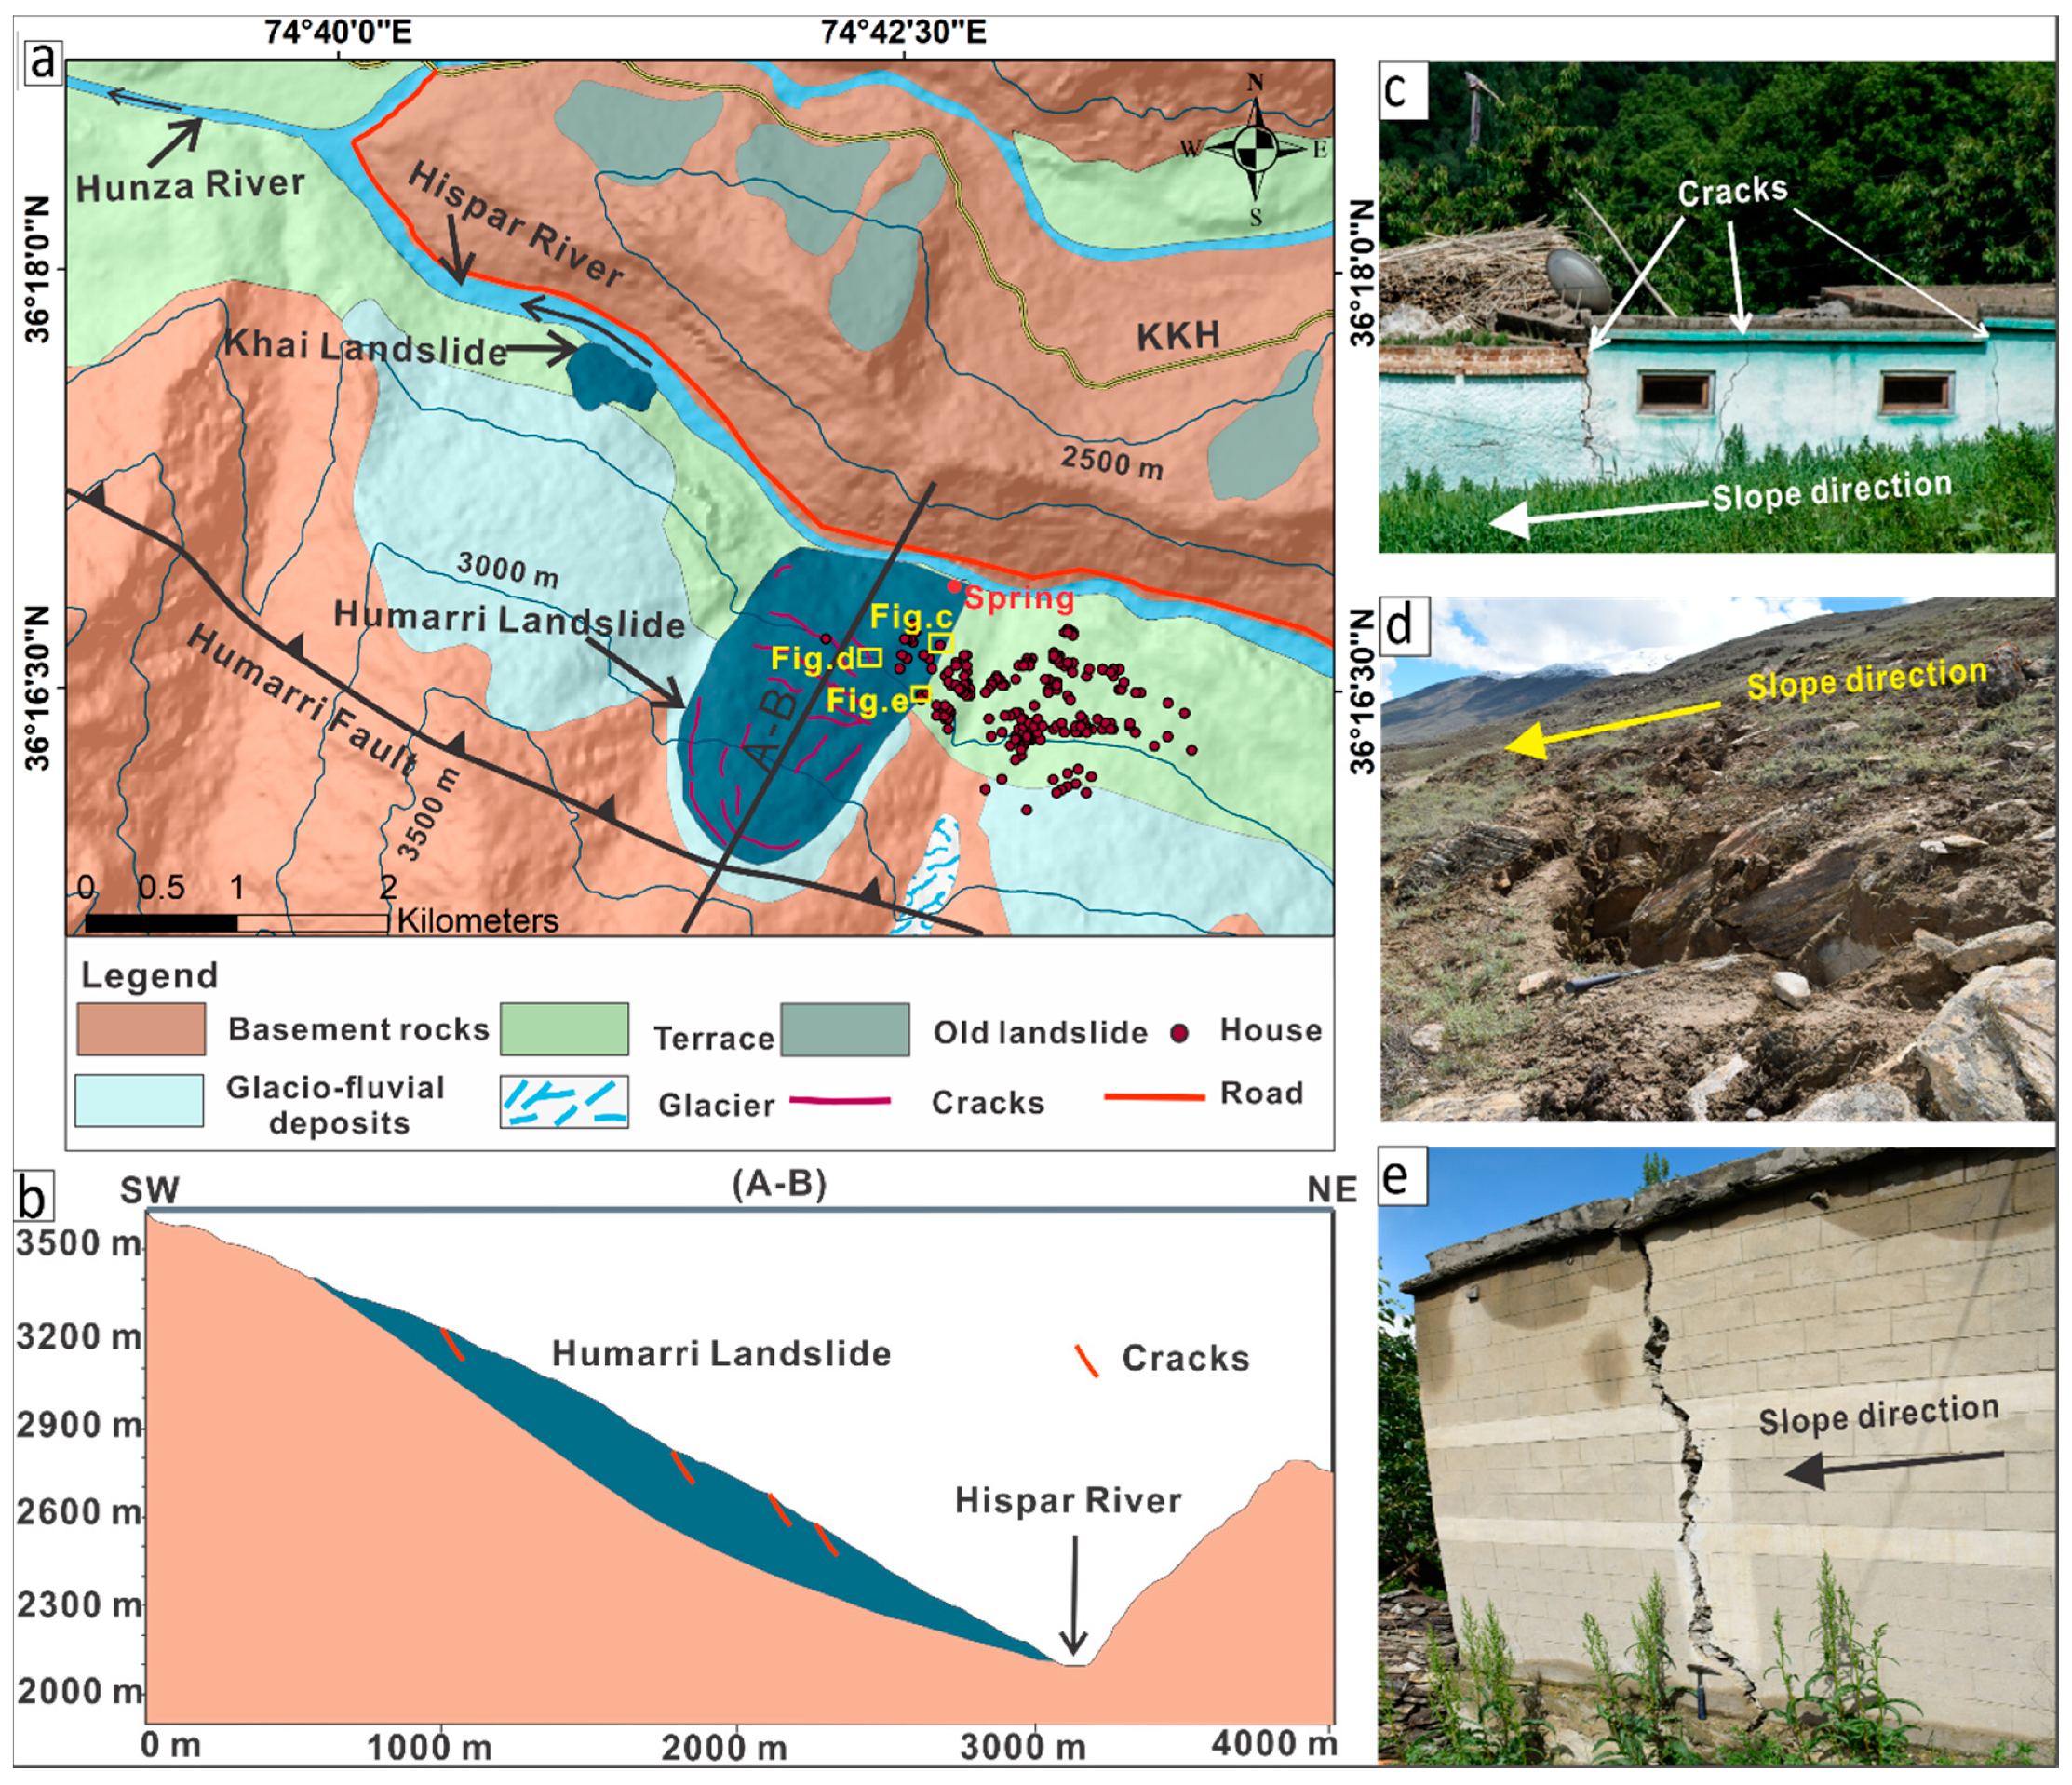
2. Geological and Geomorphological setting of the Study Area

The research area lies in the strategically important Hunza-Nagar Districts, northern Pakistan. The section of the Karakorum Highway (KKH) along the narrow Hunza Nagar valley connecting Pakistan and China can potentially impede the trade route in case of a major landslide event. This area hosts some of the highest peaks and active glaciers of northern Pakistan. The general structural trend in the Karakoram ranges along the Hunza-Nagar valley in the NW-SE direction (Figure 1c). The topography of the area is defined by steep-walled glacially scoured valleys dominated by arete and horn geometries. The valley shows enormous relative relief, and the topographic slopes of 60° and above adjacent to the glaciers are significant in contributing large masses of snow and rocks to glacier surfaces. The Passu, Hussaini, Gulmit, and Hoper are important glaciers of the area while Hunza and Haspir rivers control the drainage system of the area [7].
Tectonically the area is in the active collision zone of the Indian and Asian plates (Figure 1b) [12]. The crustal shortening, active faulting, and subduction are continuing with convergence and uplift rates of ~4–5 cm/year [12] and ~7mm/year, respectively [39,40]. The significant tectonic features in this area are Main Karakoram Thrust (MKT) and Karakorum Fault (KF), which are responsible for brittle deformation (Figure 1c) [41]. Due to this brittle deformation, the rock mass is highly fractured and jointed. The MKT is the collision zone of the southern margin of the Eurasian plate and extends into Baltistan through the Hashupa, Shigar, and Shyok valleys, respectively. MKT is a seismically active thrust fault that has a high angle along which many earthquakes occurred [42].
The study area includes granites, meta-volcanic, and meta-sedimentary rocks, as well as quaternary deposits (glacial moraines, debris deposits, flood plain deposits, and lake deposits) (Figure 1c) [43]. Sediments of various genesis like alluvial, debris-flow, morainic, lacustrine, and aeolian are irregularly dispersed along the Hunza-Nagar valley [44]. These deposits having a thickness of more than hundred meters unconformably overlaying the bedrock through the whole valley [43]. Most of these deposits are unconsolidated and lack cementation. Rugged topography, massive amounts of unconsolidated scree bounded by erosional river valleys, accompanied by steep slopes, define the geomorphological character of the study area, making it vulnerable to large-scale landslides. A combination of geomorphology with the sharp expected ground accelerations from seismic activity amplifies the landslide triggers.

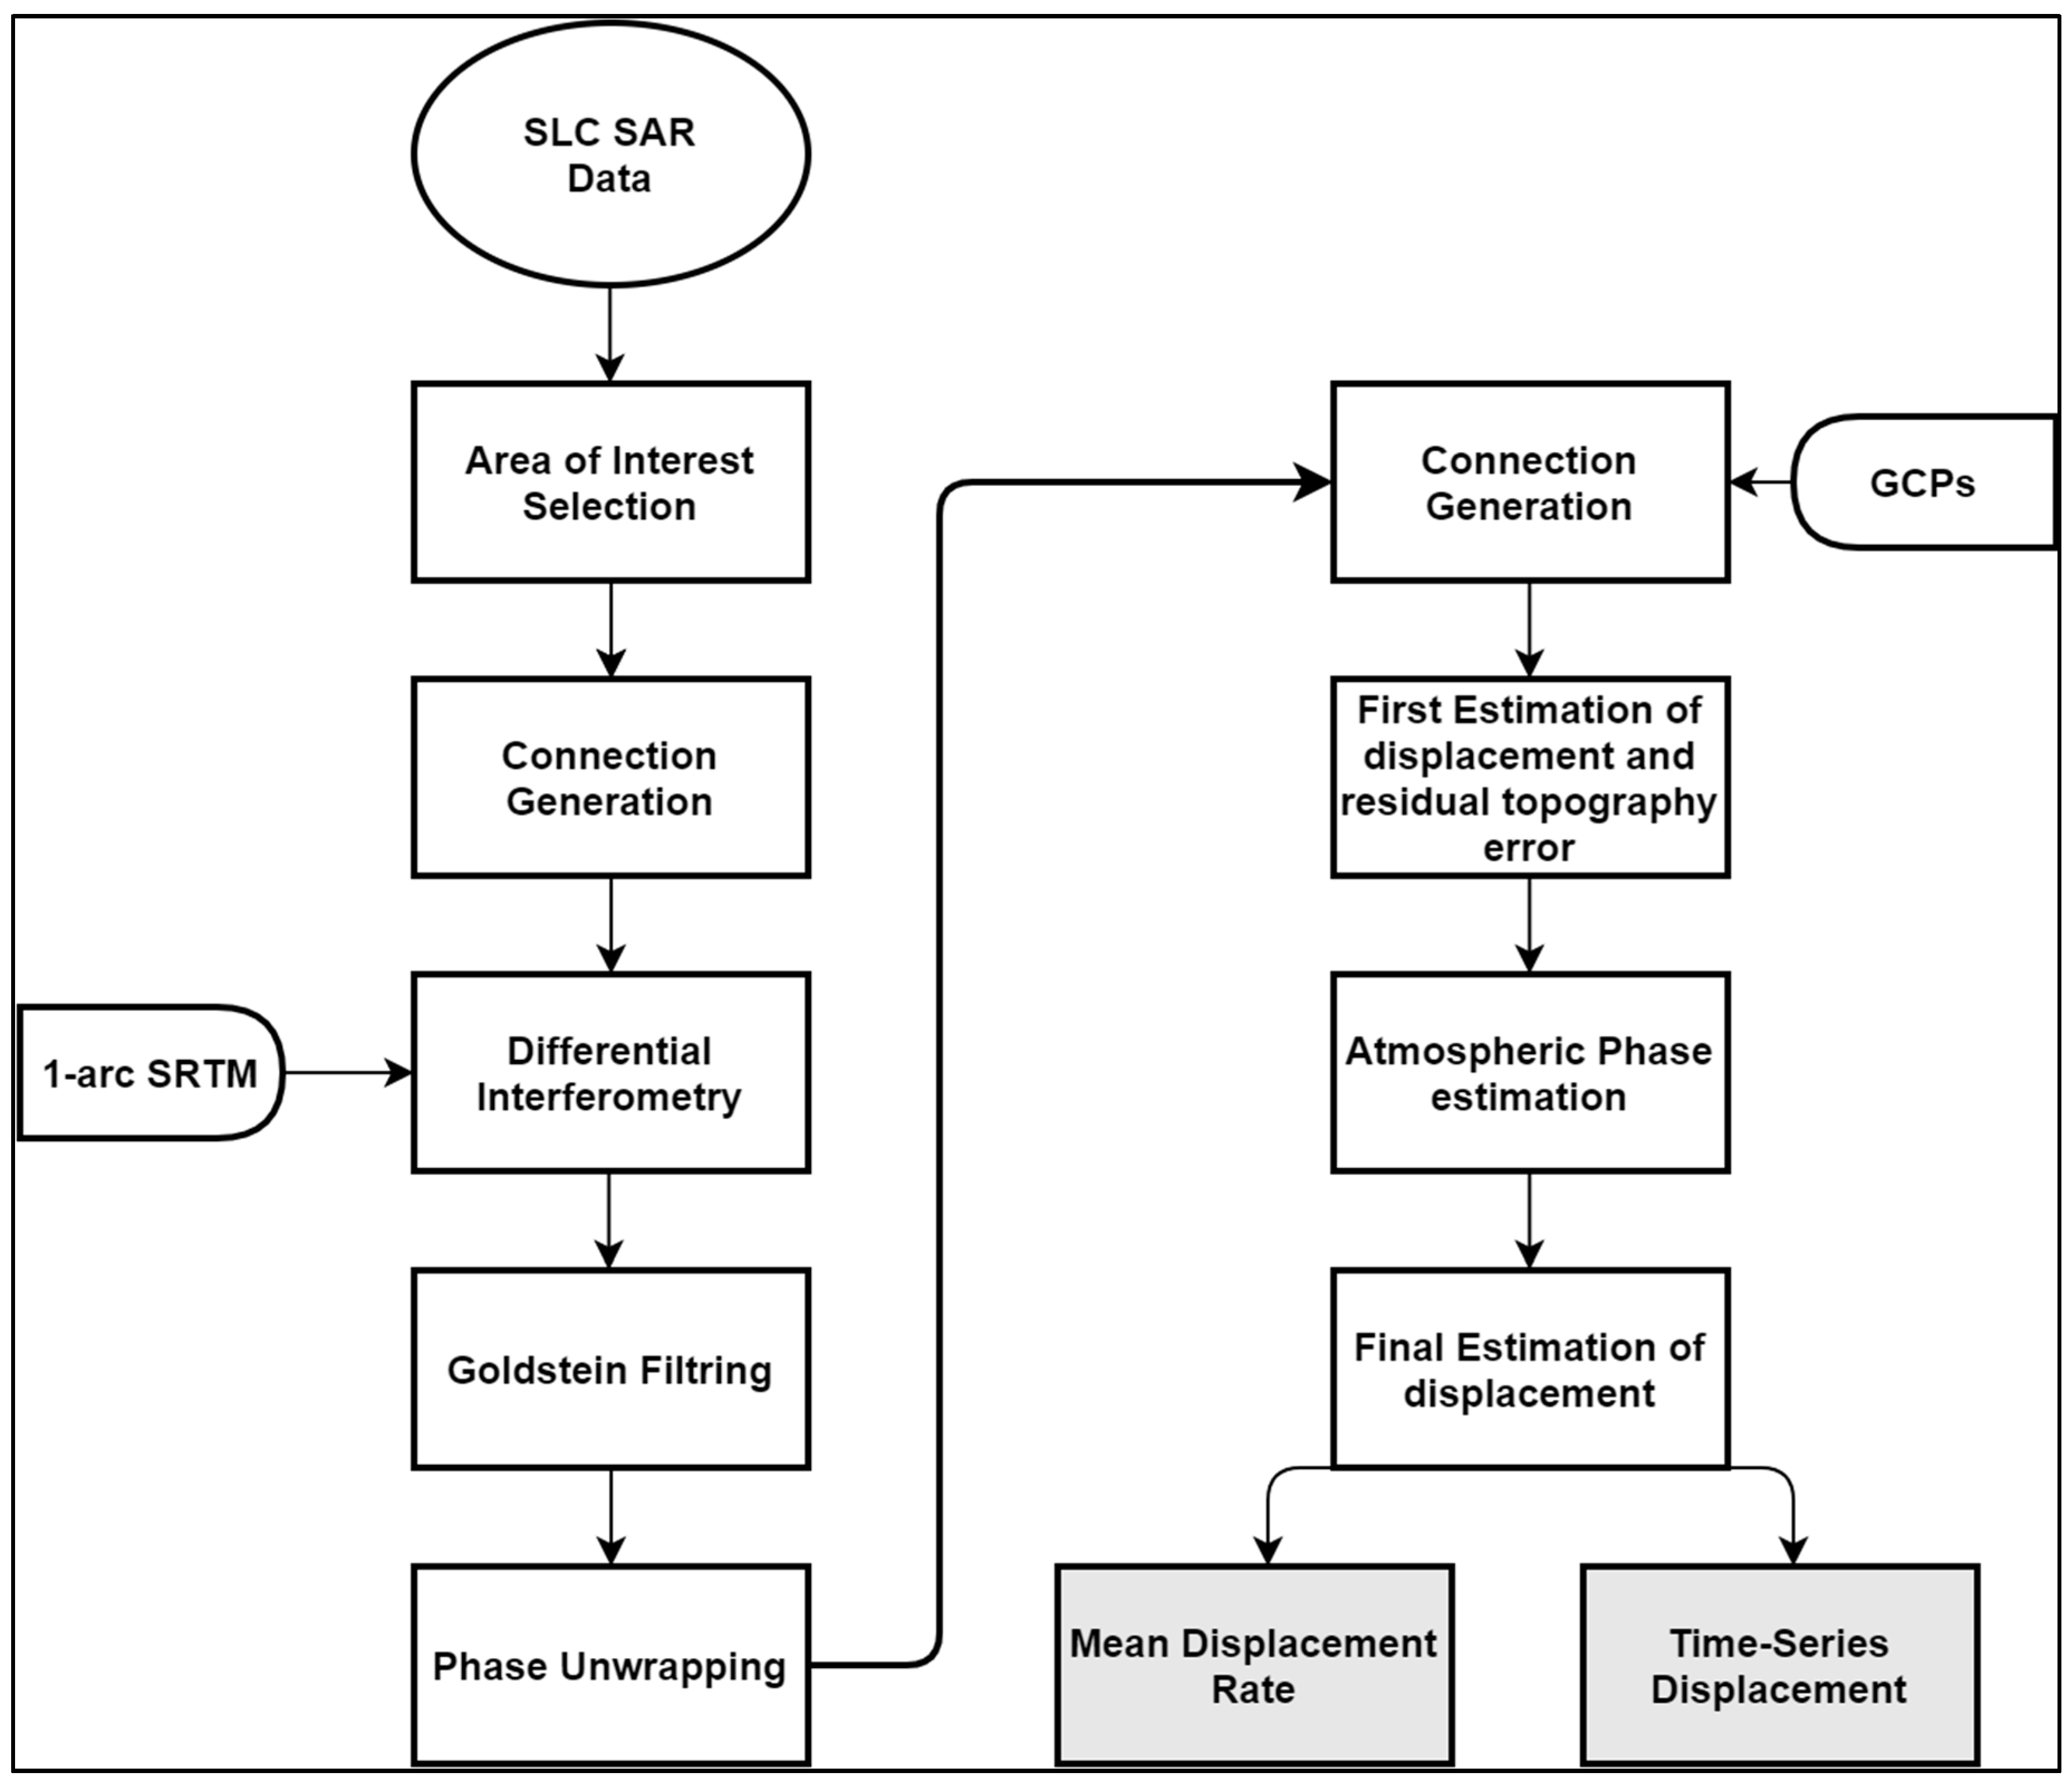
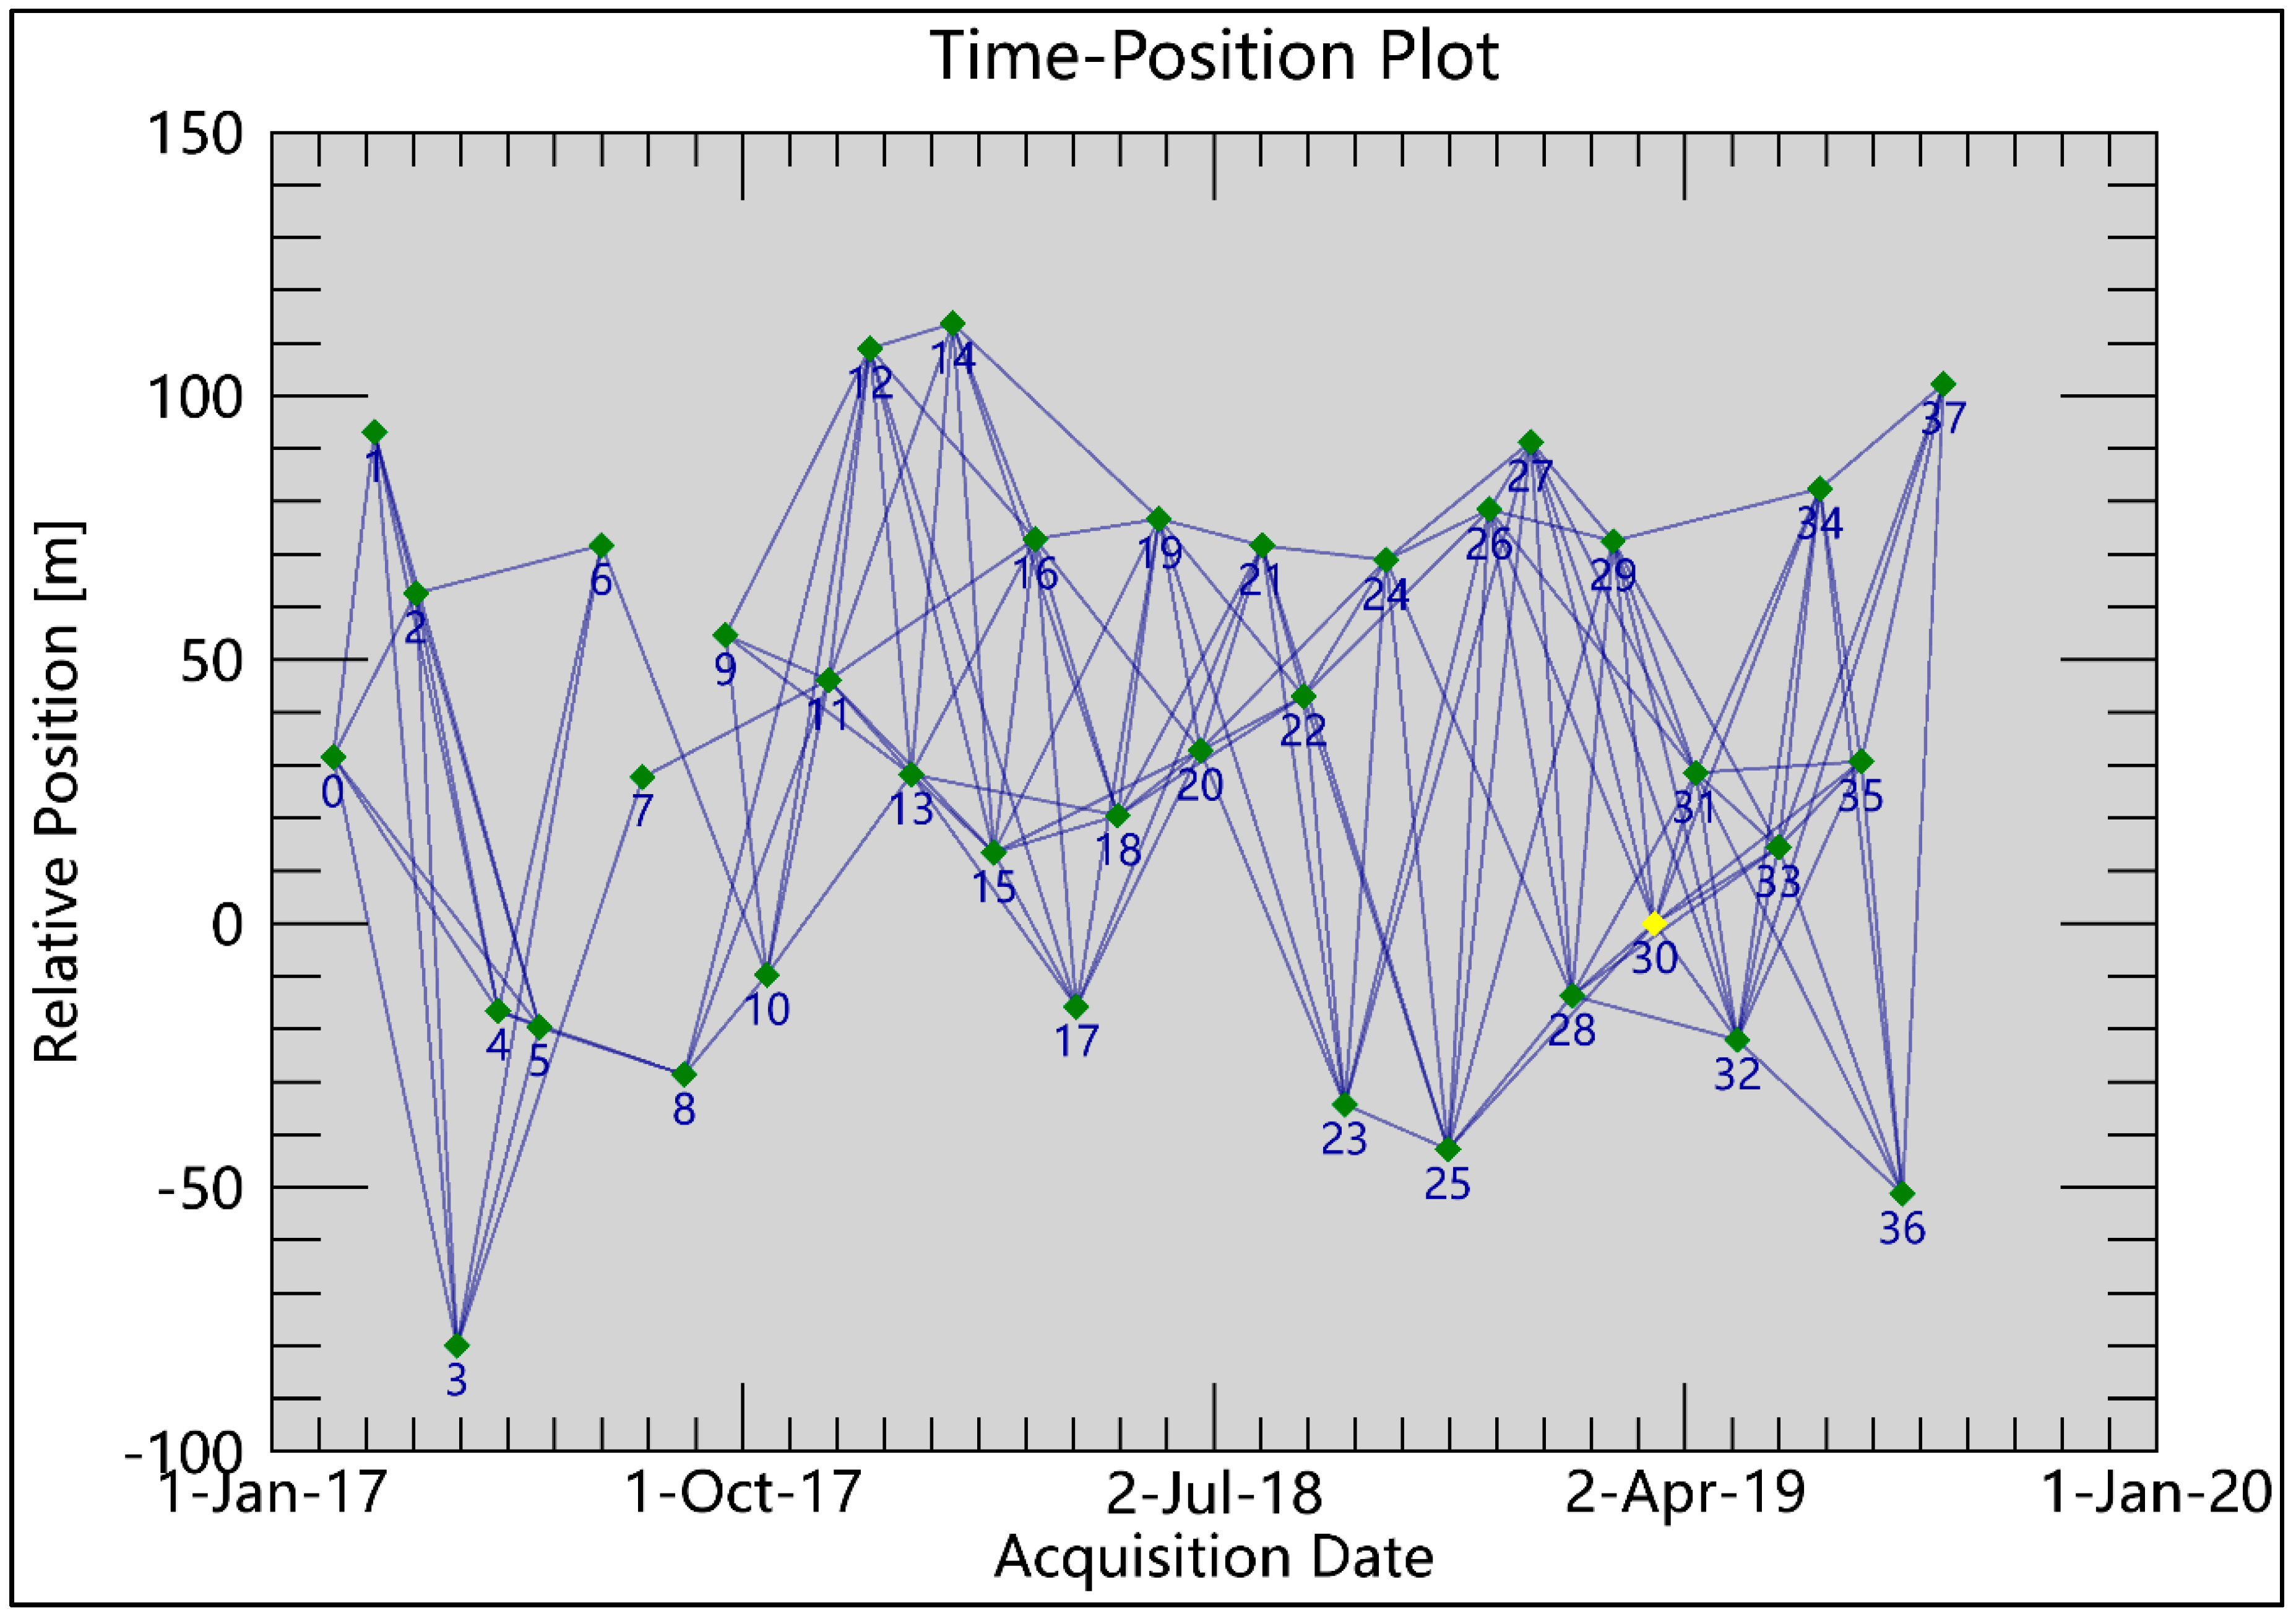
3. Data and Methodology

SAR data is one of the most significant and available remote sensing resources which can be used in the investigation of the Earth’s surface deformation [45]. It can be applied at various scales from regional to local, for example, for faults monitoring, landslide detection, and analysis of the movement of a landslide. In this study, 37 scenes of Sentinel-1 multi-temporal dataset IW (Interferometric Wide-swath) mode SLC (Single Look Complex) acquired from February 2017 to August 2019 were used to obtain land deformation information. The data were acquired from the Copernicus Open Hub. Spatially, this series of images covers part of northern Pakistan and contains the area of interest for this research. To eliminate the residual atmospheric and topographic noise, digital elevation model 1 arc-seconds SRTM was used.
The SBAS-InSAR technique is adopted to process Sentinel-1 data in the ENVI SARScape module to get the surface deformation map of the study area. This technique is an advanced InSAR method that could improve the monitoring precision [46]. The SBAS-InSAR method is based on a suitable combination of differential interferograms within the thresholds of temporal and spatial baselines, so the geometric decorrelation is insignificant [33,47,48,49]. Moreover, the SBAS-InSAR method is more appropriate to regions, which lack persistent enough scatters [50].
The processing of the SBAS-InSAR technique starts from the connection graph in which pairs within small spatial and temporal baseline were chosen (Figure 3). The image acquired on 2019-03-15 is selected as the super master image (SMI). The SMI is the reference image of the entire operation, and all the pairs co-registered on SMI reference geometry. The connection graphs are drawn with segments, consistent each to an interferometric couple to be processed. Each related point links to an input acquisition. The chosen acquisitions are illustrated as green points and the SMI as the yellow point. In this study, the maximum normal baseline was set to 45% of the critical baseline, and a maximum temporal baseline was set to 120 days. One hundred and forty-one differential interferograms were generated in this step (Figure 4).
In the next step of the interferometric process, the Goldstein filter method was implemented to improve the signal/noise ratio of the interferograms. The minimum cost flow (MCF) method and 3D-unwrapping method was chosen to finish phase unwrapping, and a coherence threshold of 0.35 was selected [51]. Refinement and re-flattening were performed to analyze and remove the residual phase coefficients and phase ramps from the unwrapped phase stack using 34 ground control points (GCPs). The GCPs were selected from the better-unwrapped phase area with the coherence value >0.7 [52]. Some interferometric pairs with poor unwrapping and low coherence were removed. As for the estimation of the extra height and the displacement related information through steps of refinement and re-flattening and inversion, preliminary displacements were estimated by the cubic model that is robust and commonly used [52].
The residual atmospheric phase was removed from the displacement by high-pass temporal filtering and low-pass spatial filtering with window size of 365 days and 1000 m respectively. Subsequently, geocoding in the line of sight (LOS) direction with a resolution of 10 m is employed. To further study the characteristics of the unstable slope, the velocity in the line of sight (VLOS) is converted into velocity in the slope direction (Vslope) using the equation adopted from [13].
V slope = V los Index
the Index can be formulated as below.
Index = n los × n slope
n los = ( sin θ   cos α s ,   sin θ   sin α s , cos θ )
n slope = ( sin α cos φ , cos α cos φ ,   sin φ )
In this equation, V slope is the deformation rate along the slope angle, V los is the deformation rate of the LOS direction, α is the aspect of slope, θ is the radar incident angle, φ is the gradient degree of slope, α s   is the angle between the direction of the satellite orbit and true north (which is the radar satellite flight direction), ascending data are positive, and descending data are negative. Finally, the time-series deformation was obtained and mapped to the study area.

4. Results and Analysis:

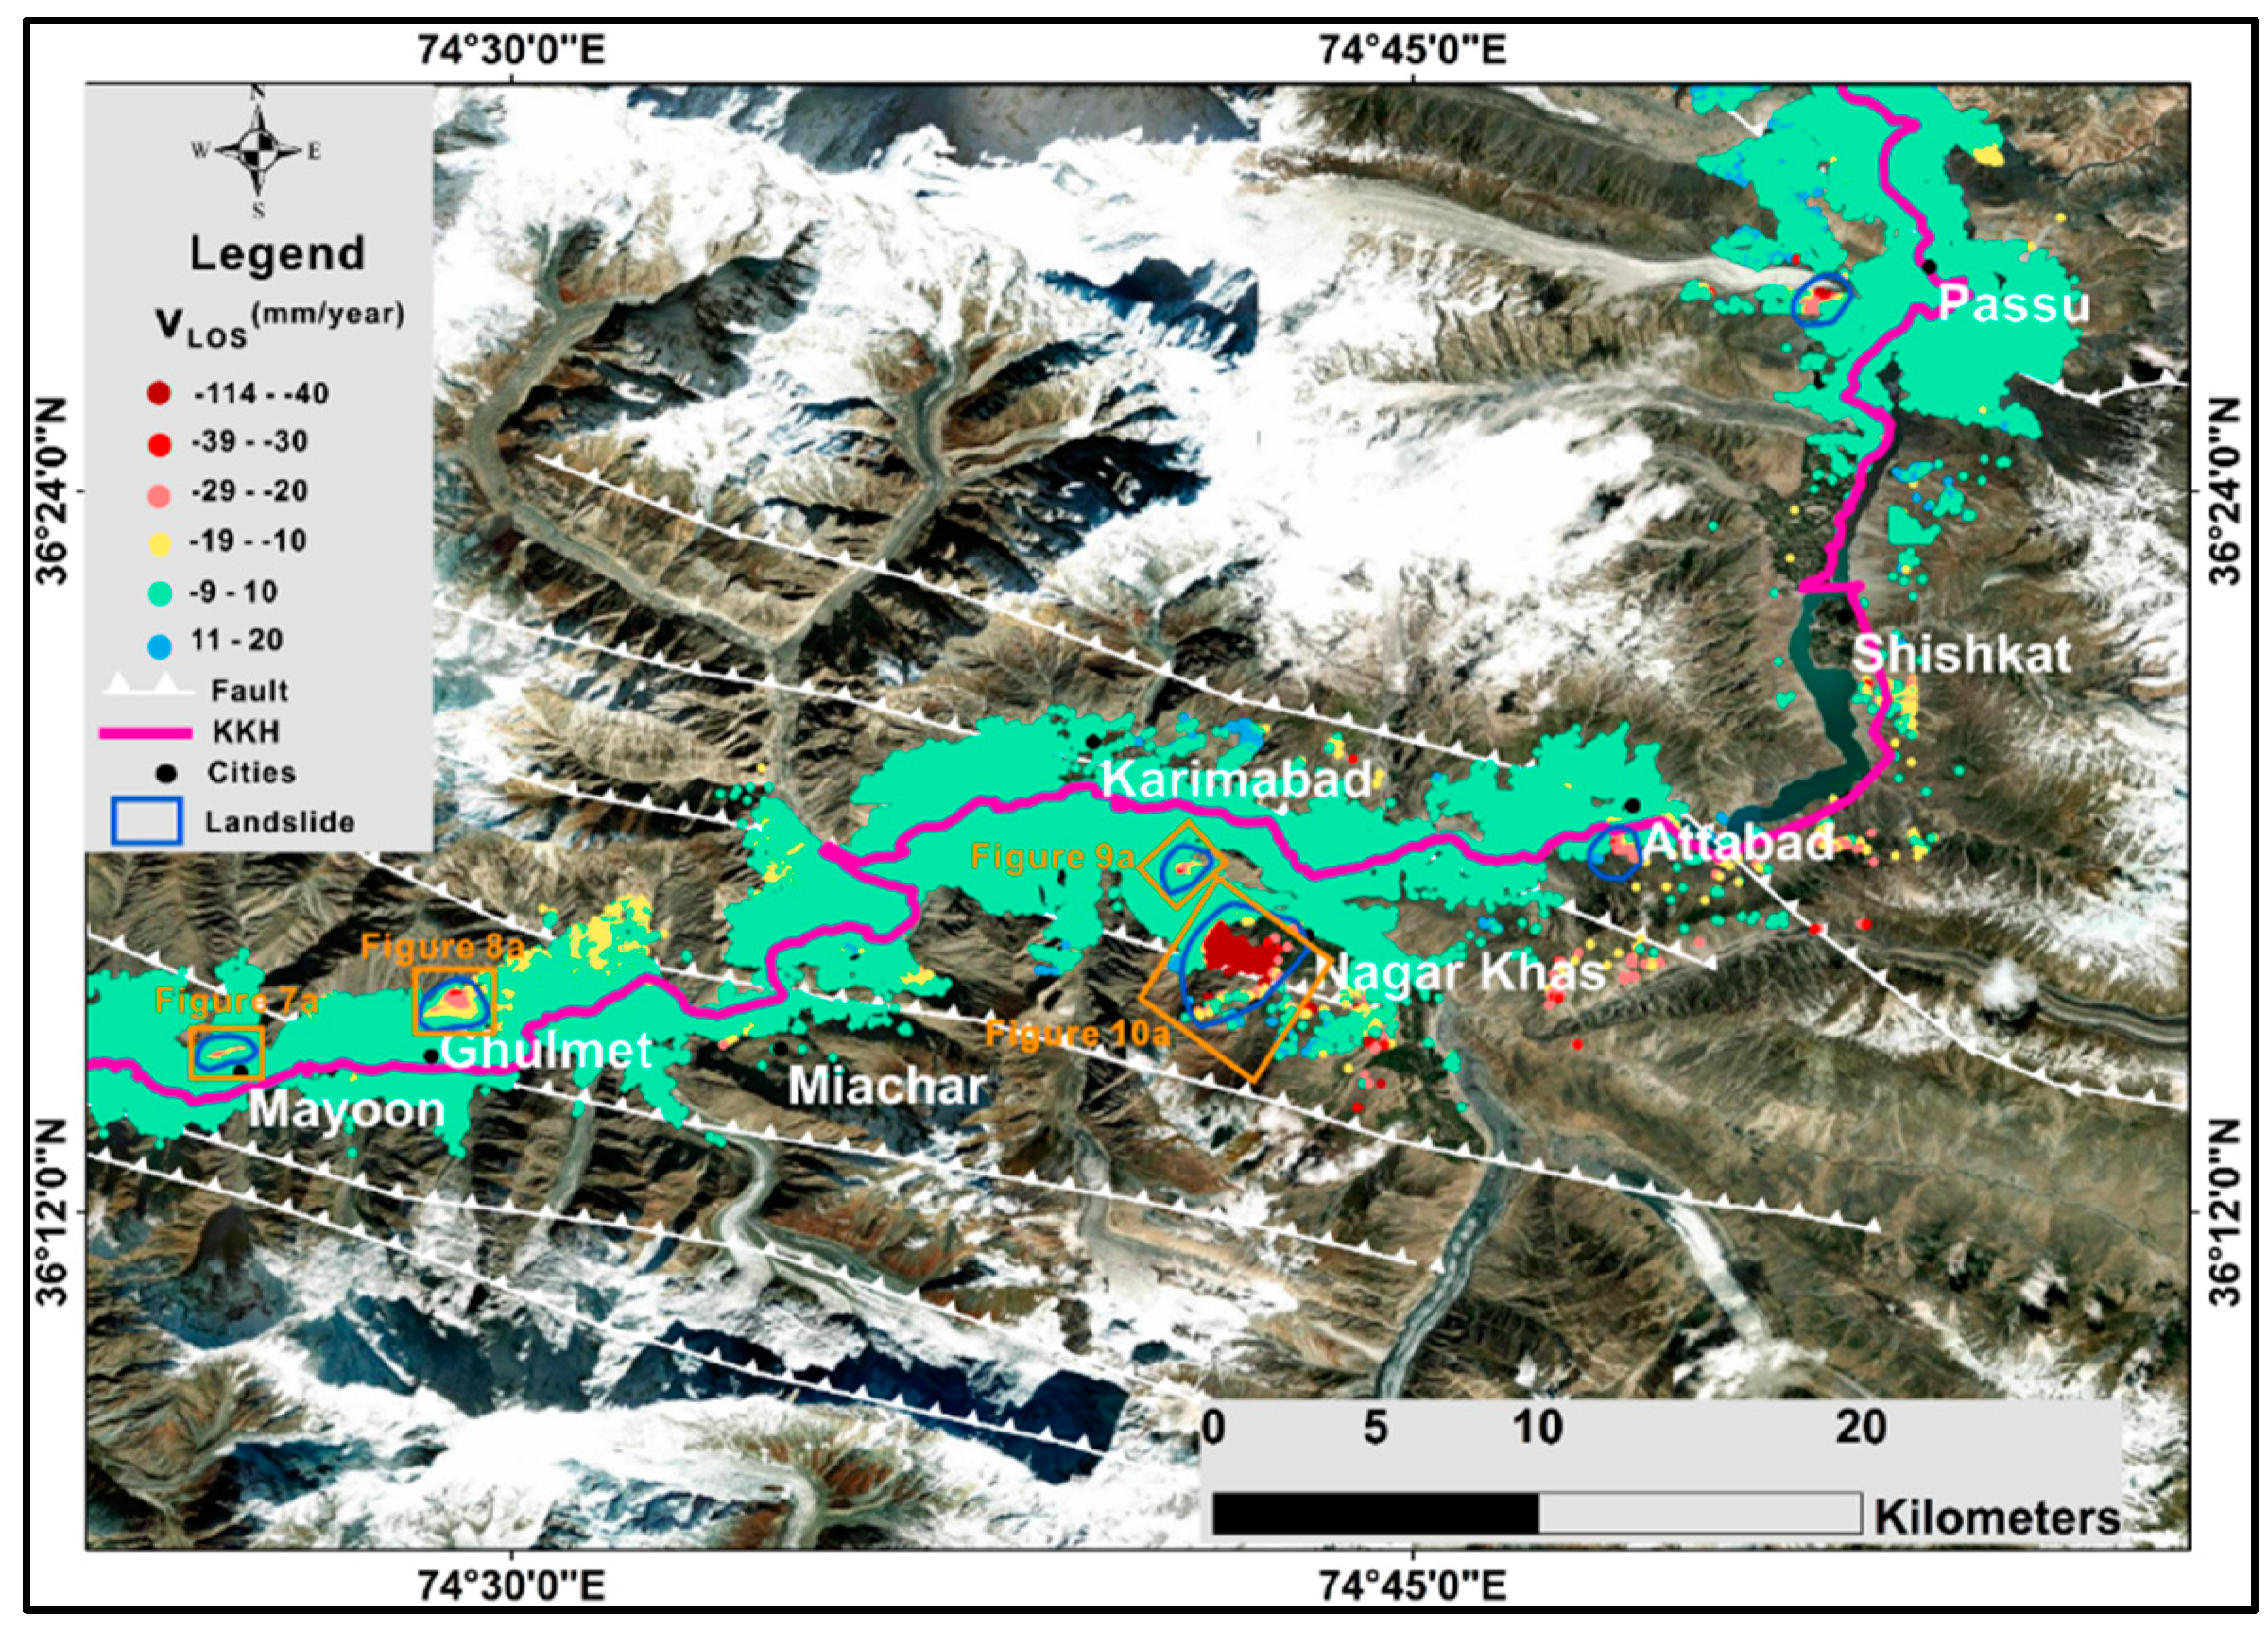
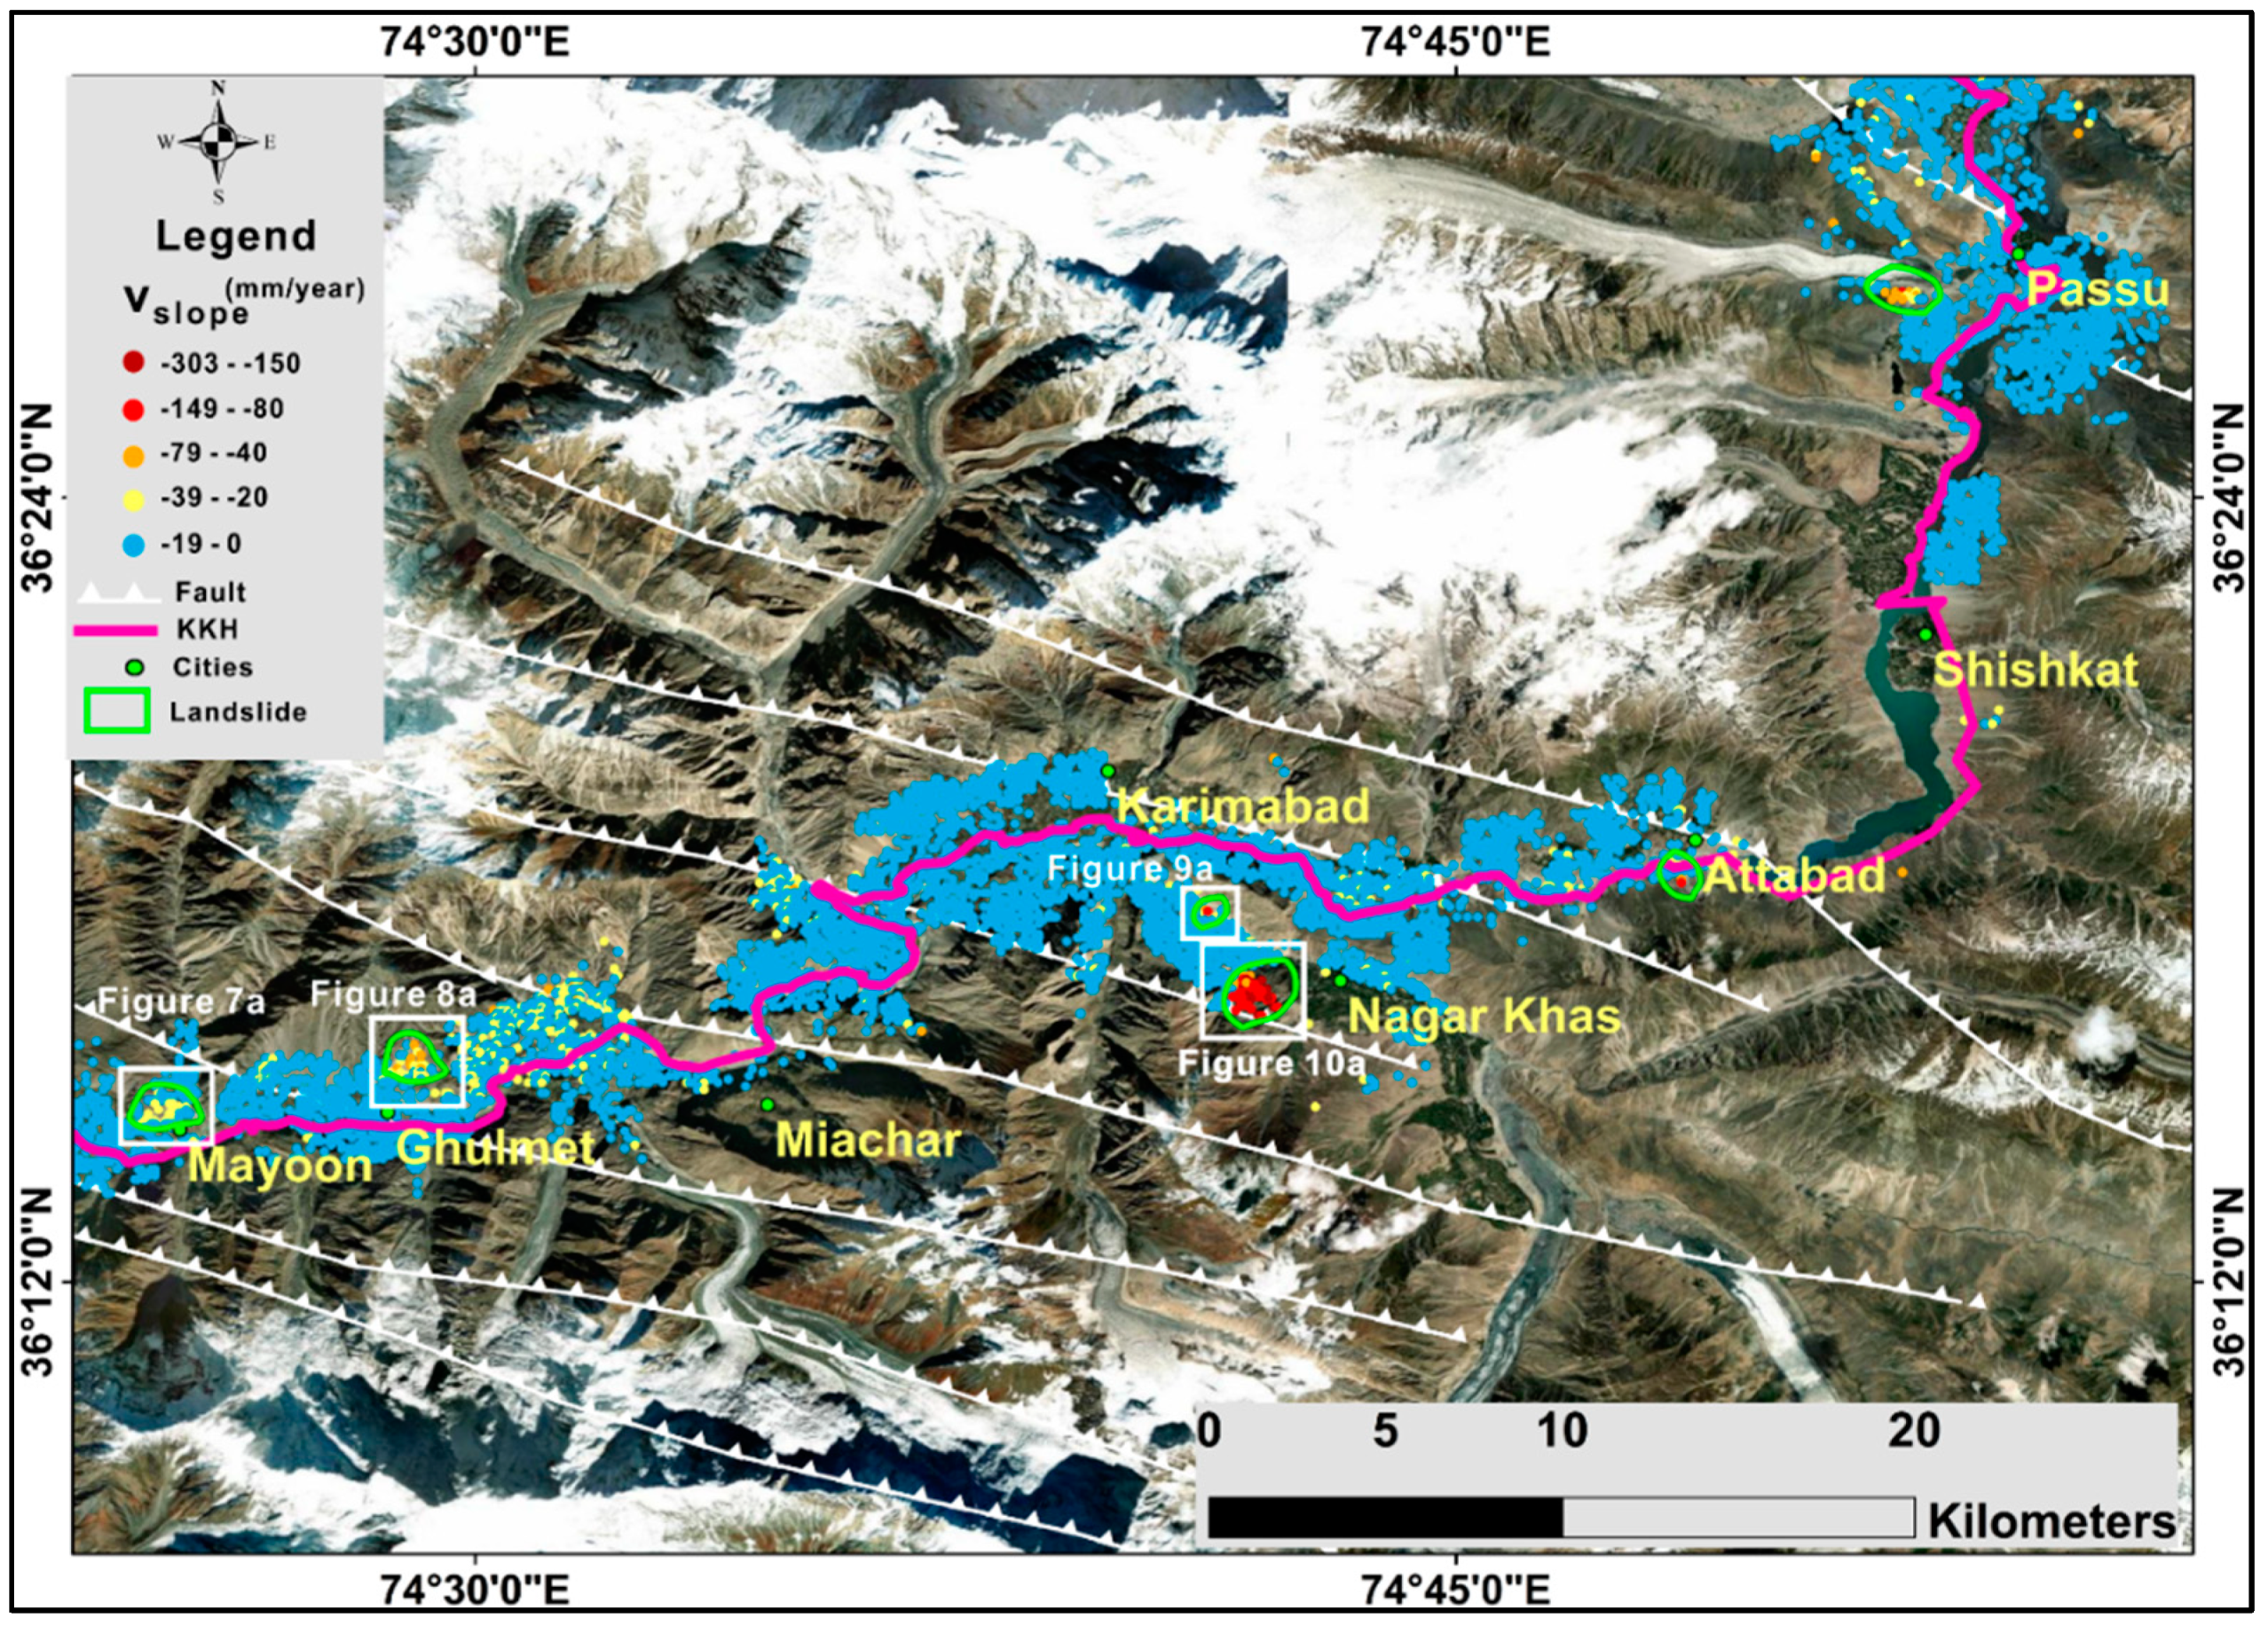
4.1. Spatial Distribution of Surface Deformation

The results of the regional deformation time series from February 2017 to August 2019 are shown in Figure 5 and Figure 6. The surface displacement rate was extracted for points with temporal coherence threshold >0.5. The total numbers of derived coherent targets (CTs) was 520,750 with average density of 612 CTs per Km2. The deformation rate in the LOS varies from −114 to 20 mm/year (Figure 5). Positive values indicate that CTs move towards the satellite along LOS, whereas negative values indicate that CTs move away from the satellite along LOS. The CTs cover most of the hillslopes in the valley with the exception those around Attabad lake (Figure 5). The reasons of the low density around Attabad lake are the layover and the foreshortening caused by the westward and eastward hillslopes orientations with a high slope angle over 40°. CTs with high VLOS (>30 mm/year) were detected around Attabad, Nagar, and Ghulmet villages. Moreover, large surface deformation was also detected on Passu glacier deposits with VLOS >50 mm/year (Figure 5). Since, depending on the slope orientation, even a positive VLOS could indicate a downslope movement [13,53], the VLOS was converted into displacement rates along the steepest slope direction (Vslope) to highlight the actual downslope component of the slope deformation. The SBAS-derived downslope velocity deformation rates (Vslope) range from 0 to −300 mm/year (Figure 6), and the location of CTs with higher Vslope is consistent with VLOS. Considering that a positive value of Vslope indicates uphill movement, CTs with positive value were not included in the final results which induced a lower density of CTs in Vslope map (Figure 6). Several previous studies identify the unstable areas based on the displacement rate overcoming a constant threshold calculated as the standard deviation of Vslope when the slope cell contains a sufficient number of CTs with Vslope over the stability threshold [21,22,54,55,56]. The Vslope stability threshold for our study area was calculated to be −14 mm/year from the Vslope standard deviation. And the active landslides and unstable slopes were identified as a slope cell containing at least three CTs with Vslope exceeding 14 mm/year.
A field survey of the anomalous areas was conducted to check the reliability of InSAR results. Among the coherent locations characterized by high downslope deformation rates and field surveys, we selected the landslides which either show strong ground movement or pose a direct threat to the nearby population. The detail results obtained on such landslides are as follows.

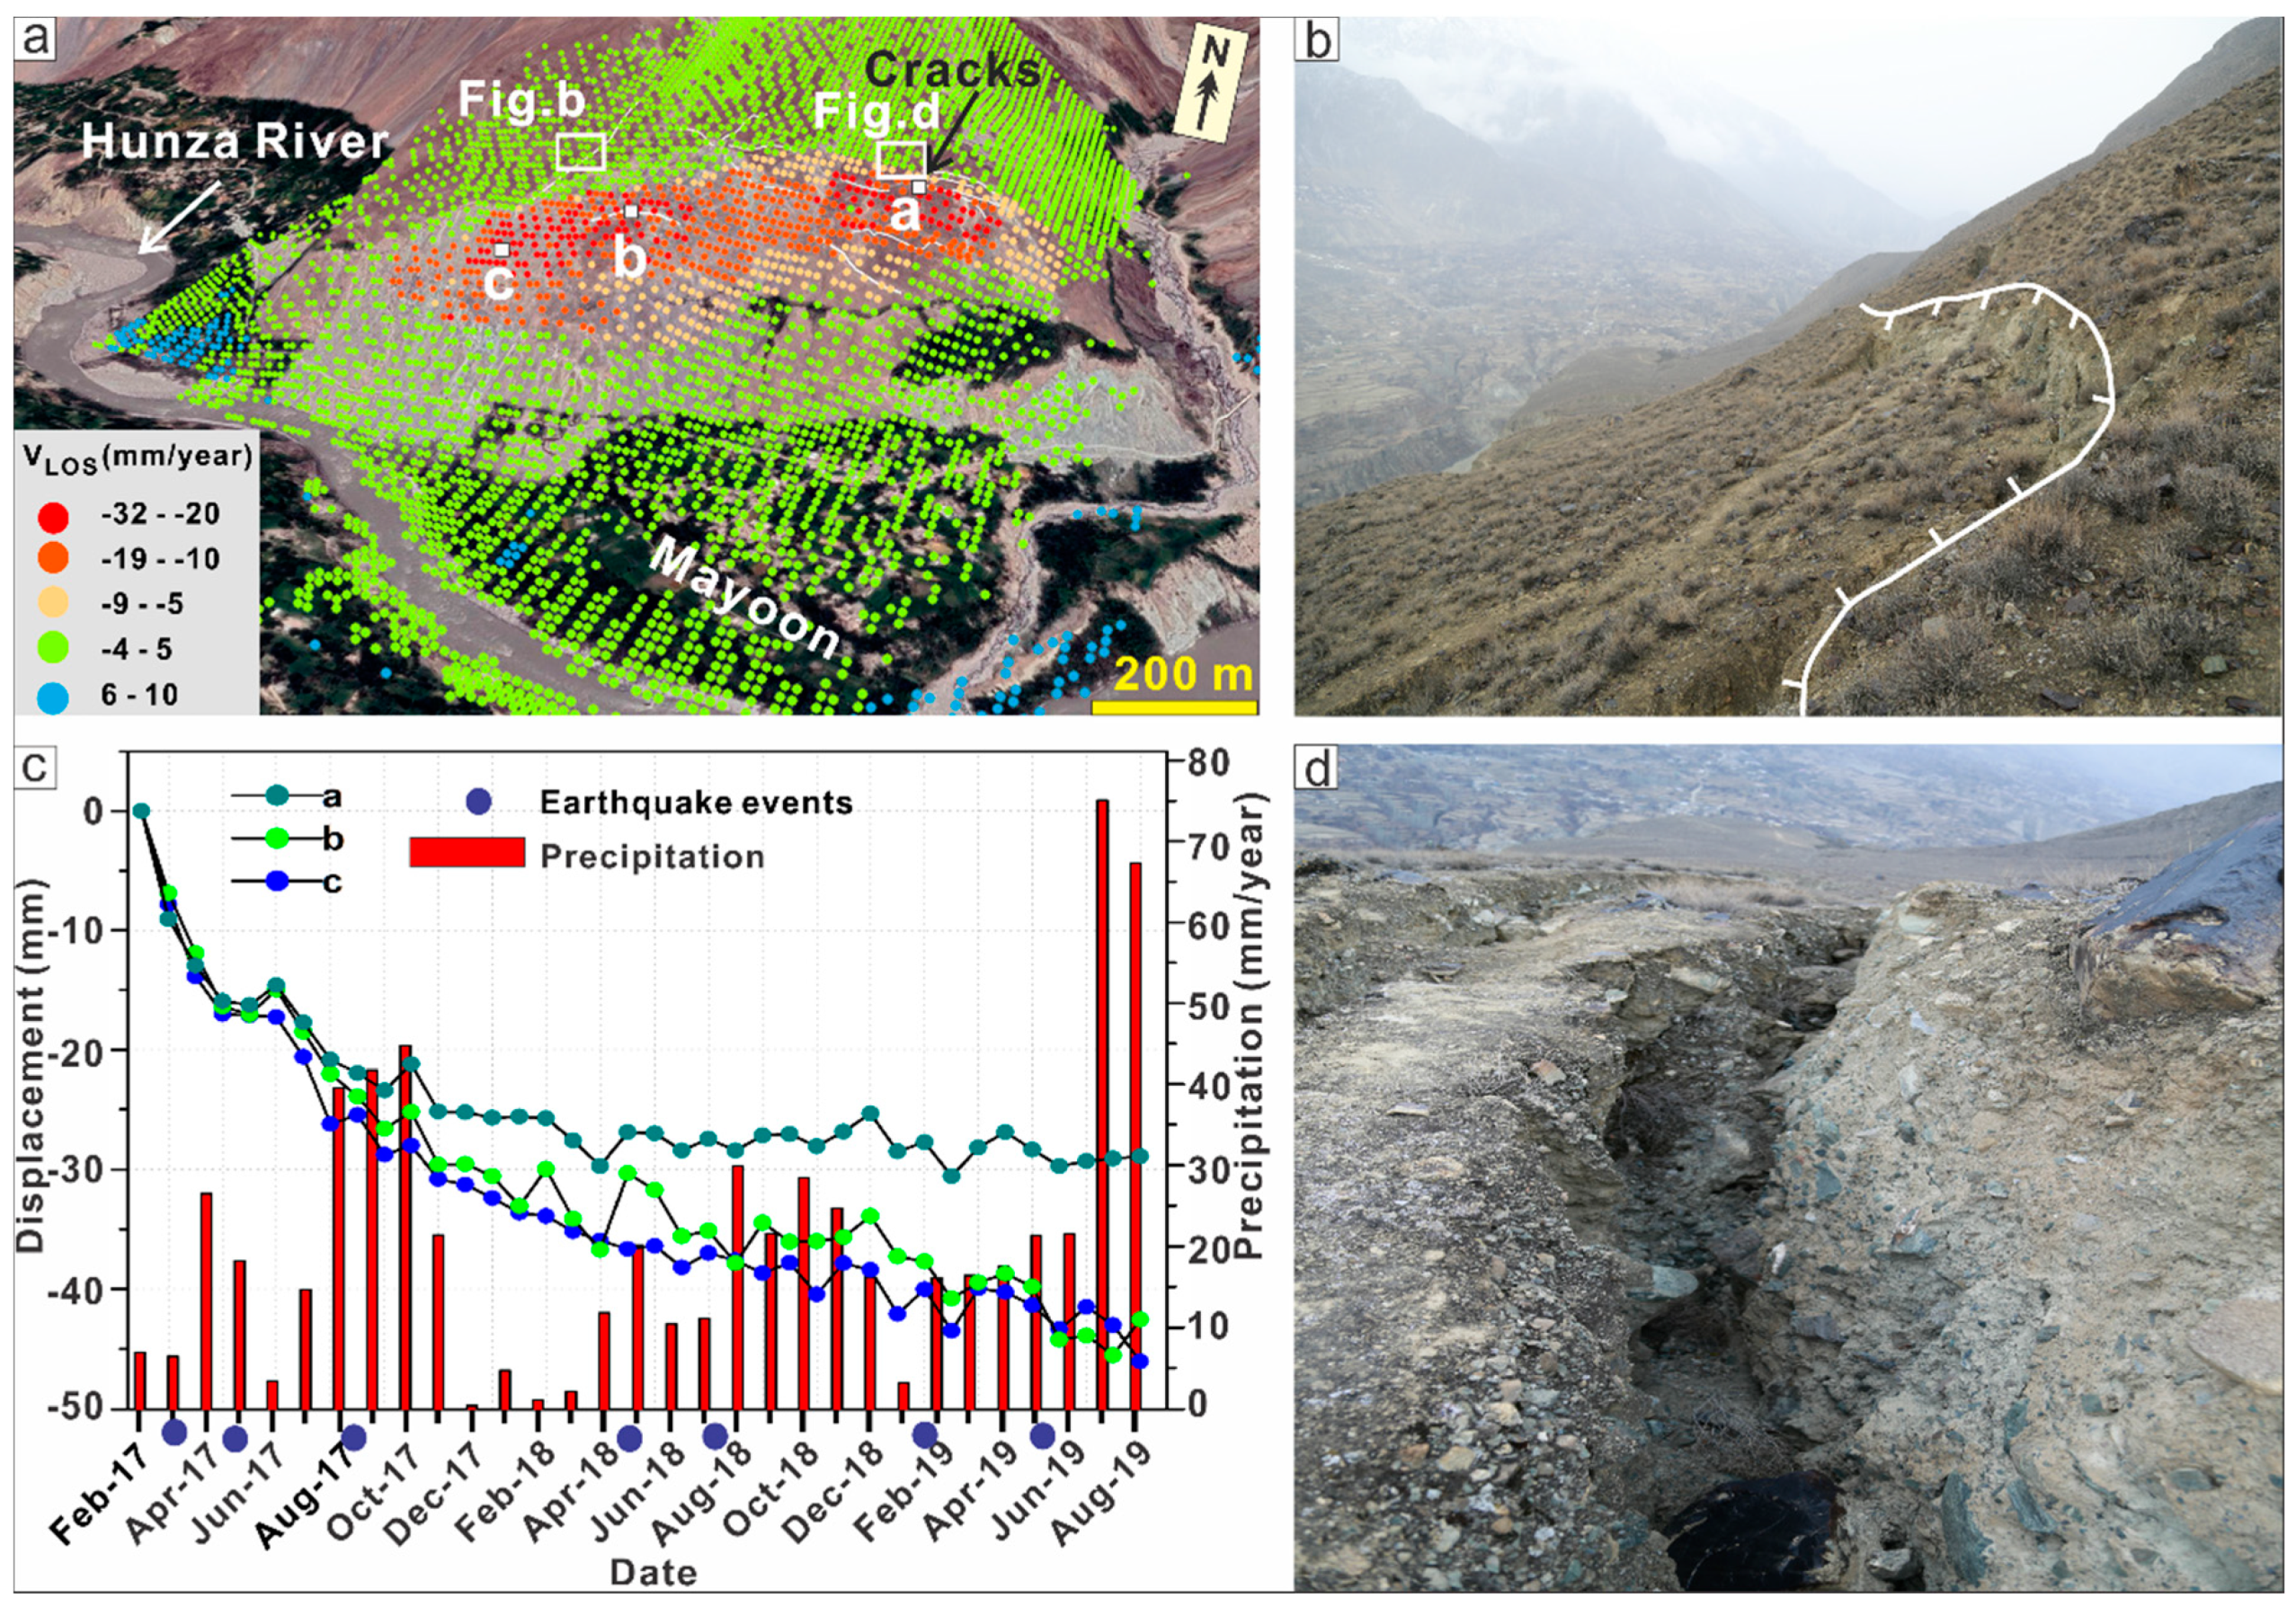
4.1.1. Mayoon Landslide

Mayoon landslide is located in the north of the Mayoon village, which rests on the Hunza River’s right bank and is 15 km northwest of the Rakaposhi peak. The landslide covers a surface area of around 1500 m2. The general direction of the slide is towards the south, and its slope gradient varies from 20° to 45°. The landslide body is consisting of Yasin group sediments overlain by quaternary moraine deposits (Figure 1c). Deformation with mean VLOS >20 mm/year and Vslope >30 mm/year was detected on the landslide (Figure 7a). Due to continuous slip along the slide, a series of parallel cracks on the main scarp face initially widen before the major failure, while new cracks emerge on the yet undisturbed scree slope up the hill. The cracks’ width varies with the continuous sliding movement; however, a rough estimate of the opening along the cracks range between 0.1 and 5 m (Figure 7 b,d). According to local knowledge, the landslide event was first triggered in 1976, damaging the agricultural land. Another slope failure occurred on the eastern end of the escarpment in 2011, damaging the infrastructure. Another event of relatively smaller magnitude occurred in 2012, which prompted the evacuation of 20 families from the area.

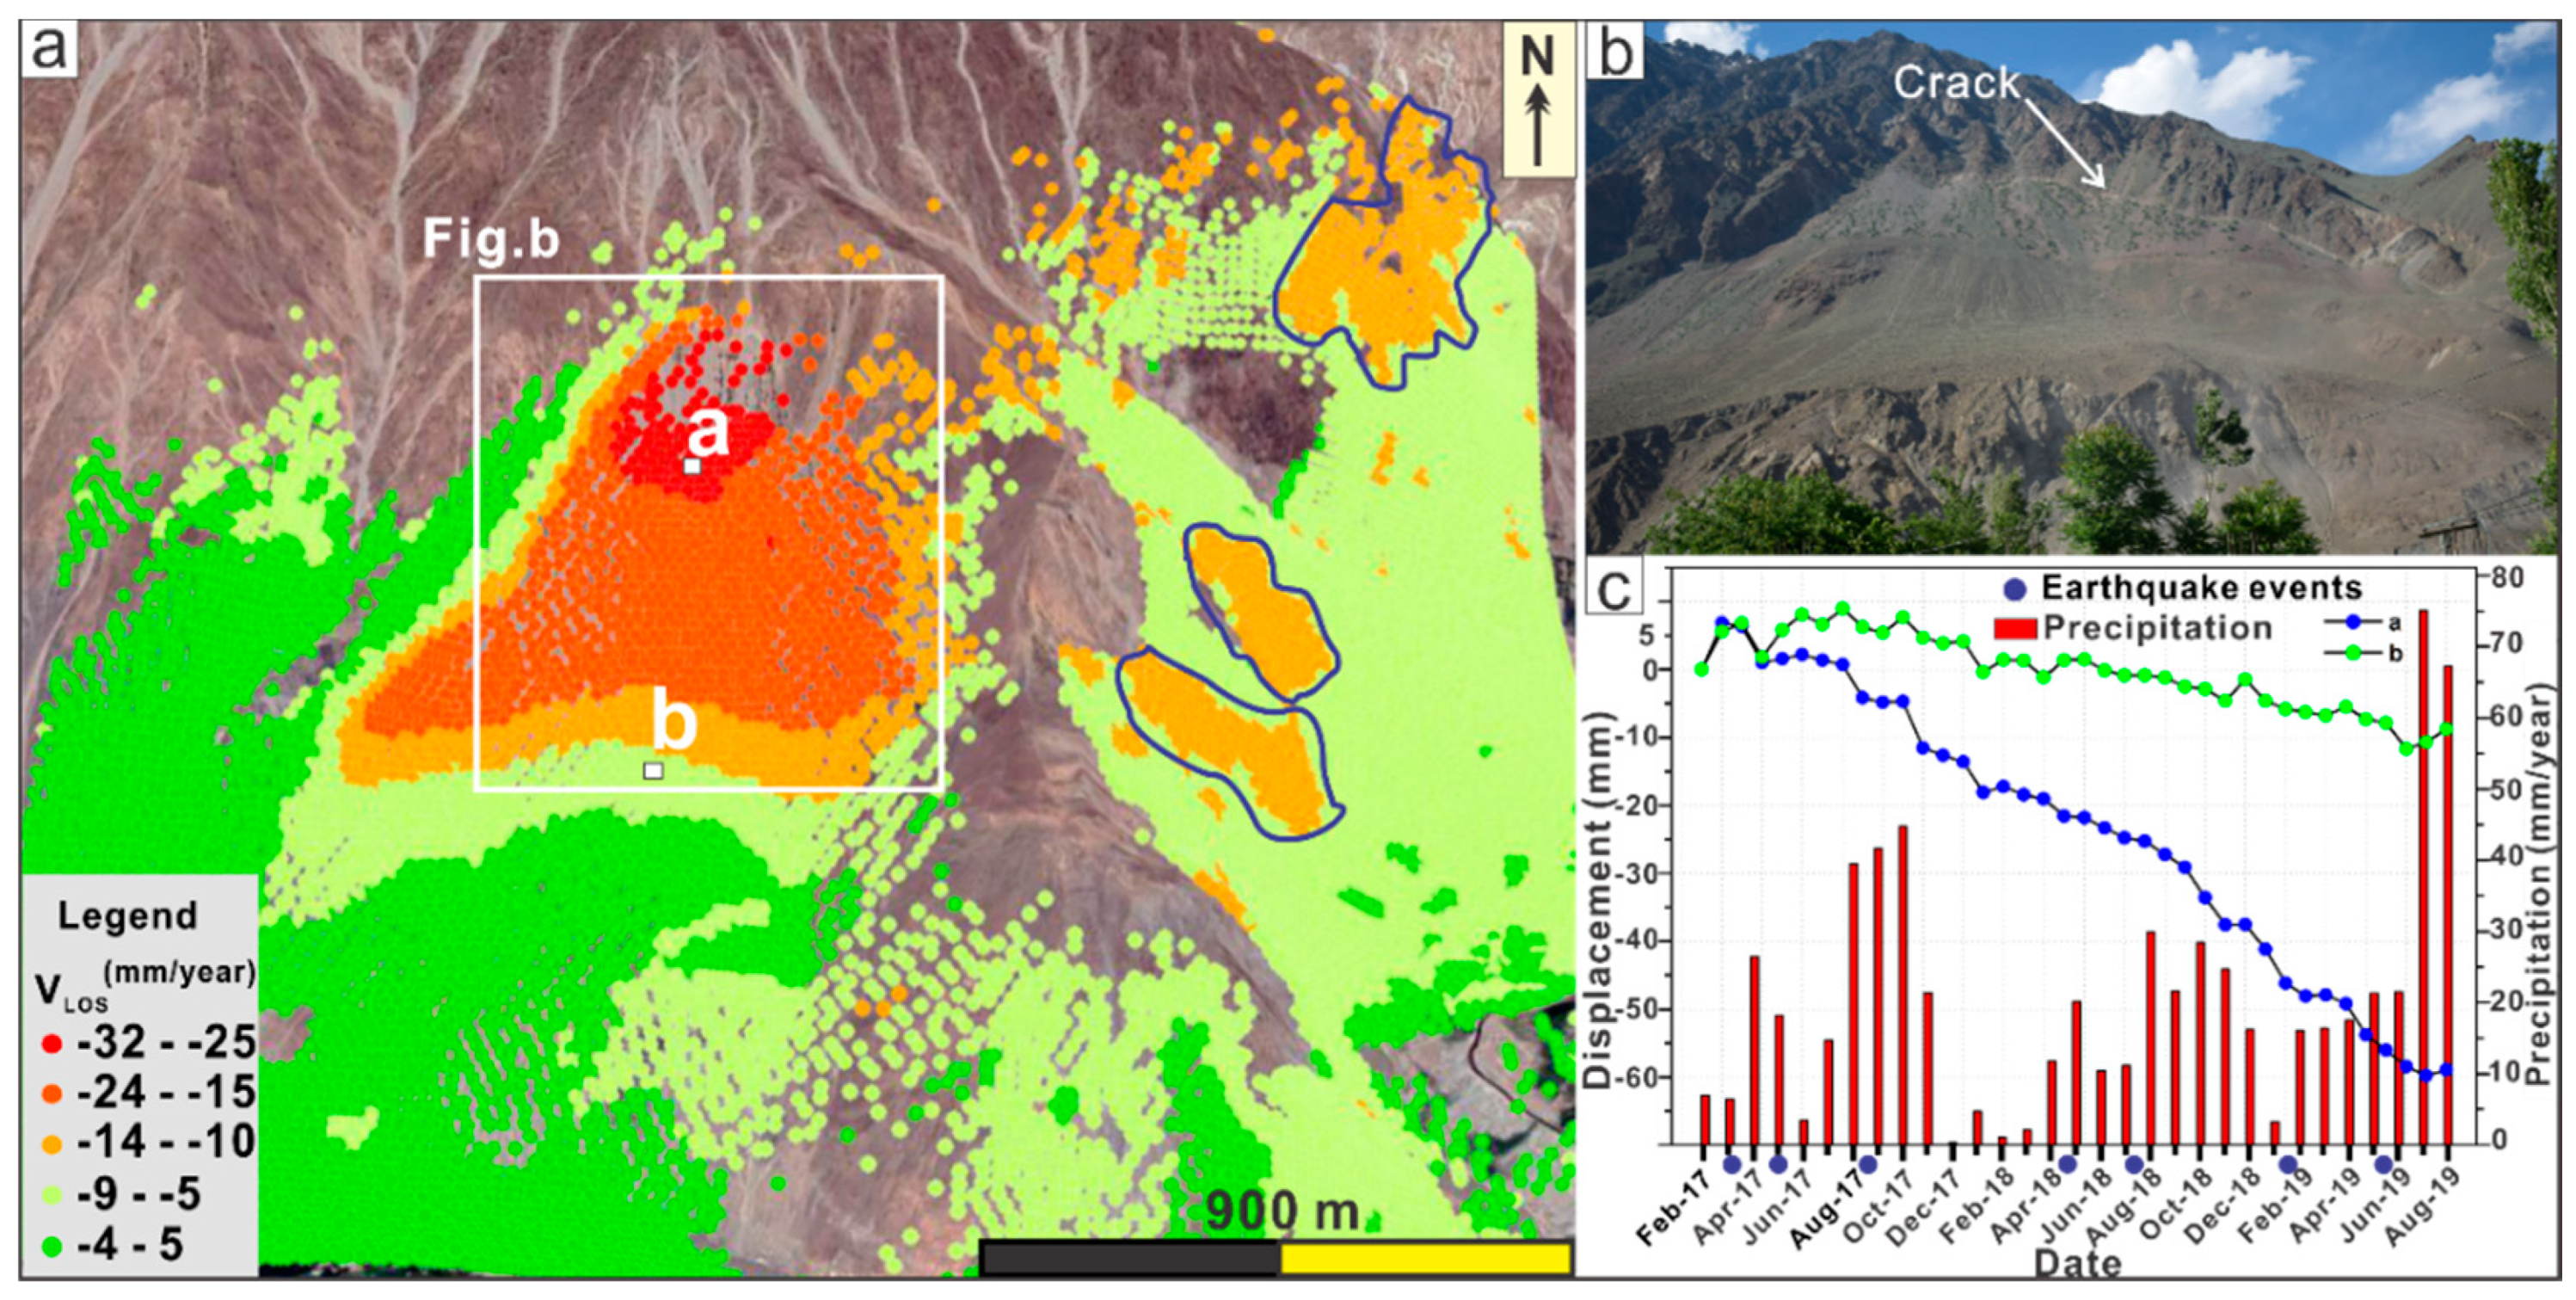
4.1.2. Ghulmet Landslide

The Ghulmet landslide covers about 0.7 km2 area, located on the right bank of the Hunza River near Ghulmet village. It is an active rotational landslide with a slope direction towards the south (Figure 8). Tectonically the landslide is bounded by MKT and Chalt faults (Figure 1c). The landslide body is consisting of meta-sediments overlain by quaternary moraine deposits (Figure 1c). The slope gradient varies from 30° to 55°. A maximum mean deformation rate of >30 mm/year was detected in the LOS direction (Figure 8a). The upper sector of the landslide exhibits high VLOS as compared to the lower section of the landslide (Figure 8a). Deformations with Vslope >70 mm/year were found in the slope (Figure 6). Another significant slope deformation was located in the downslope area of morphologically distinct scarps, which shows the existence of relict landslide masses in this zone. A giant crack is visible on the optical satellite imagery, and it has been observed during the field survey as well (Figure 8b). Based on the sliding direction of the slope and the gradient in this area, the landslide is moving towards the Hunza River and the KKH, posing a potential threat as a landslide dam for the Hunza River and the highway in case of sudden mass failure.

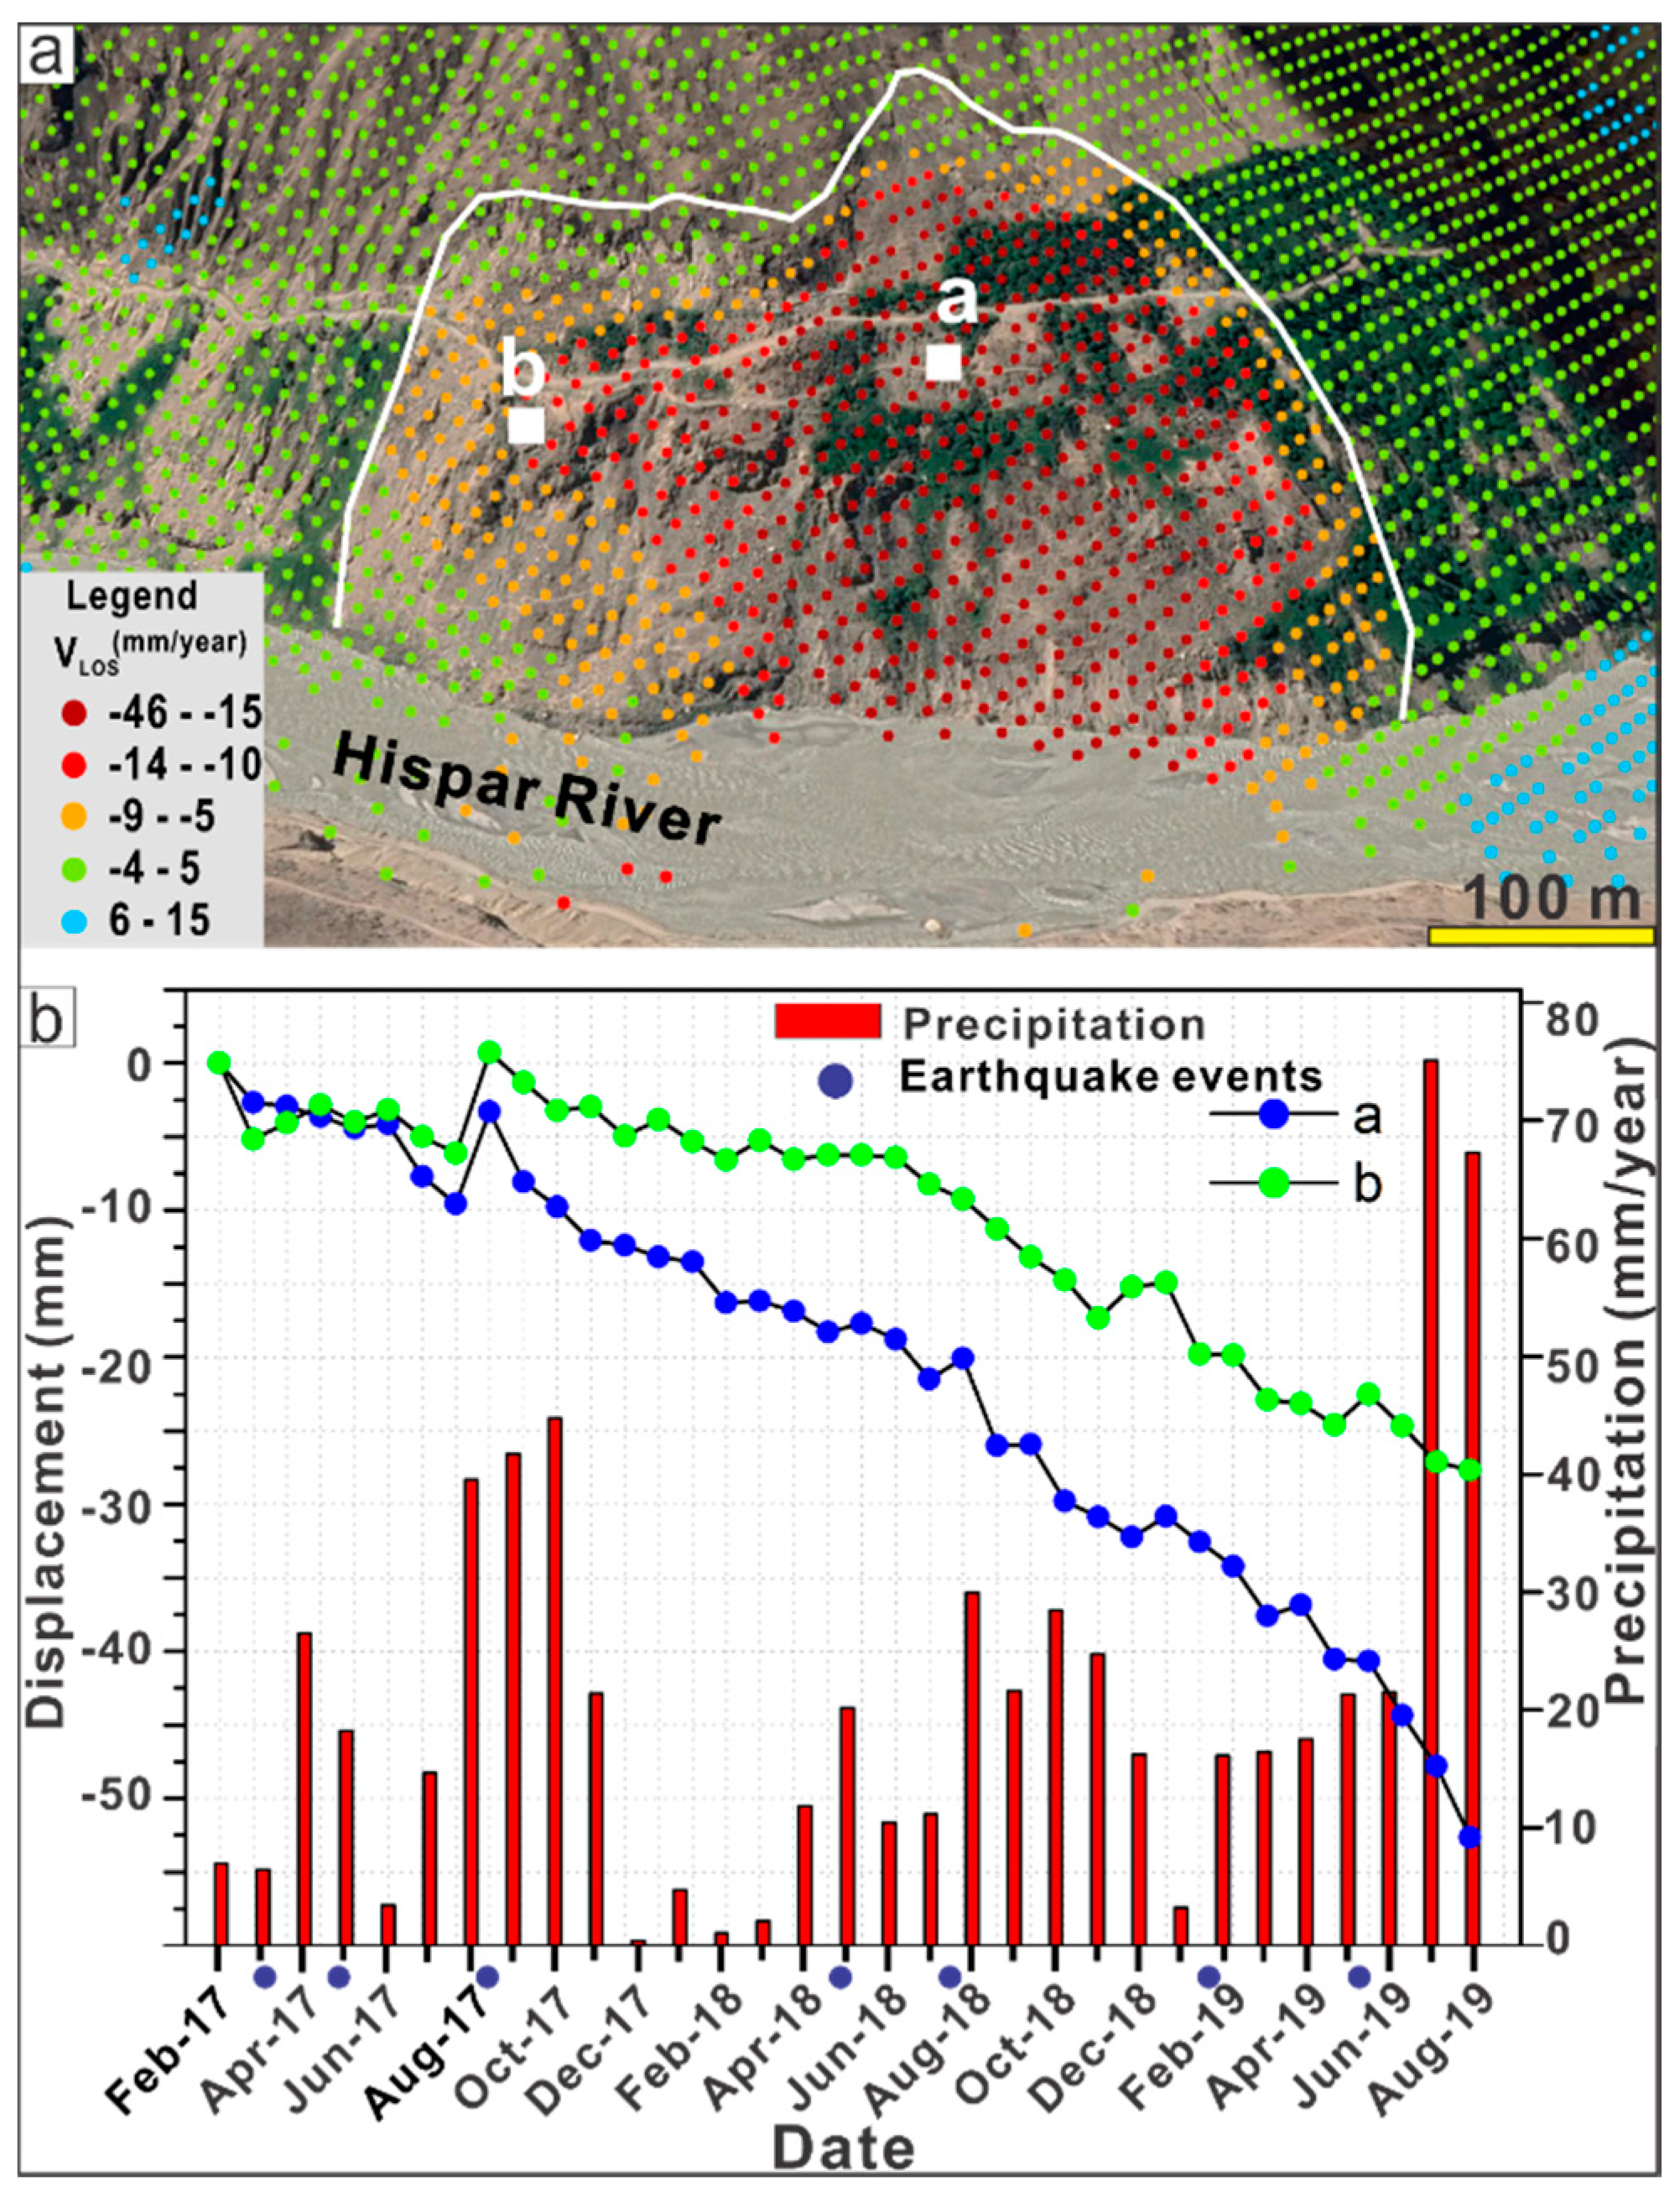
4.1.3. Khai Landslide

The Khai landslide is a small landslide of about 500 m in length. The landslide covers a 150,000 m2 area and ranges in elevation from 2100 m to 2370 m from sea level. The scar of the landslide is visible on satellite imagery acquired on 05 May, 2017 (Figure 9a). High surface deformation rates are detected in the middle part of the landslide. VLOS ranges from −10 to −30 mm/y (Figure 9a).
Despite the notable active displacement of the previous three cases, the most pronounced surface deformation identified in this study is situated shortly south of Khai, near Humarri village (Figure 5). Here, a significant slope deformation has been identified, which has not been detected previously. The deformation results from the Humarri village are of great importance and are addressed in detail in Section 5.

4.2. Temporal Change in Displacement Pattern in Relationship to the Precipitation and Seismicity

In addition to analyzing the mean deformation rates, we investigated the temporal correlation of the identified surface deformations, in the period between February 2017 and August 2019, with the rainfall pattern and the seismicity in the same time frame. To this end, we plotted the values of the displacement times series against the monthly rainfall data and the temporal occurrence of significant seismic events in the area. The data were obtained from the Meteorological Department and Water and Power Development Authority (WAPDA) Pakistan (Table 1).
The relationship of the total deformation and the monthly average rainfall over February 2017 to August 2019 can be found in Figure 7c, Figure 8b, Figure 9c, and Figure 10c. The study area is typically humid from May to October and becomes very dry from November to April, revealing an apparent periodicity. Time series analysis reveals that the displacement in Ghulmet, Mayoon, and Khai landslides may be partially correlated to the precipitation data; however, in general, the displacement curve does not truly follow the precipitation or the seismic events. Therefore, it is possible to assume that there is no clear causal relationship between rainfall and seismic stress in the selected cases. In some cases, however, some weak correlation is visible, as highlighted in the following. The time series of displacements shows that the Ghulmet landslide has reactivated over the time covered by this study (Figure 8c). Analysis of the deformation pattern indicates that the movement of the landslide has some significant relationships to the changes in rainfall seasonal regime. For example, the deceleration in the beginning of November 2017 ends after two months into the new rainfall season, in October 2018. Again, the short stationarity observed from February to April 2019 follows a short dry period in January 2019. However, the rainfall peaks at the end of the recorded period do not seem to force any significant response into the displacement pattern, implying that different factors are controlling the slope deformation at this stage. The Mayoon landslide showed a sudden increase in the deformation corresponding to an increase in rainfall intensity in August and September 2017 with a one-month delay (Figure 7c). Other rainfall events show only a scanty correlation with rainfall, though. For example, the dry period from January to April 2018 does not seem to influence the displacement velocity in the main landslide body (Figure 7a, points b and c) and it is only capable of inducing a deceleration upslope of the main scrap (Figure 7a, point a). A slightly stronger positive correlation is found between deformation time series and rainfall data in the Khai landslide, which indicates that the part of landslide might possibly be triggered by rainfall (Figure 9b). However, the response to rainfall variations is much more visible for the central part of the landslide body (Figure 9a, point a) than for the right flank (Figure 9a, point b).
Seismic activities in and around Hunza valley are also thought to perform an essential part in predisposing and triggering landslides [5]. In addition to the rainfall, the correlation between deformation time series and earthquake events during the investigated periods shows that the deformations may be, in part, significantly corresponding to the earthquake events in the area. The temporal evolution of the deformation along the selected points in Ghulmet and Mayoon landslides show a distinct acceleration in deformation in March and August 2017 (Figure 7c and Figure 8c). These accelerations in the deformation are in functional correlations with the earthquake events in these months. Higher mean deformation rates were recorded in the Humarri landslide following the March 2017 earthquake (Figure 10c).
By associating the time series of deformation with the precipitation and earthquakes events, it can be concluded that the movement of the landslides partly corresponds to the rainfall and earthquake events around the study area. This partial correspondence can be attributed to the complex interference of triggering agents and their overlapping role in controlling a specific landslide event. The interplay between seismic forcing, monthly rainfall changes and possibly existing, dynamic factors in the area produce the spurious single-variable correlations seen in the above cases. A deeper understanding of such relationships may be possibly gained by focusing on local slope scale studies supported by high-frequency rainfall measurement and seismic ground response analysis.

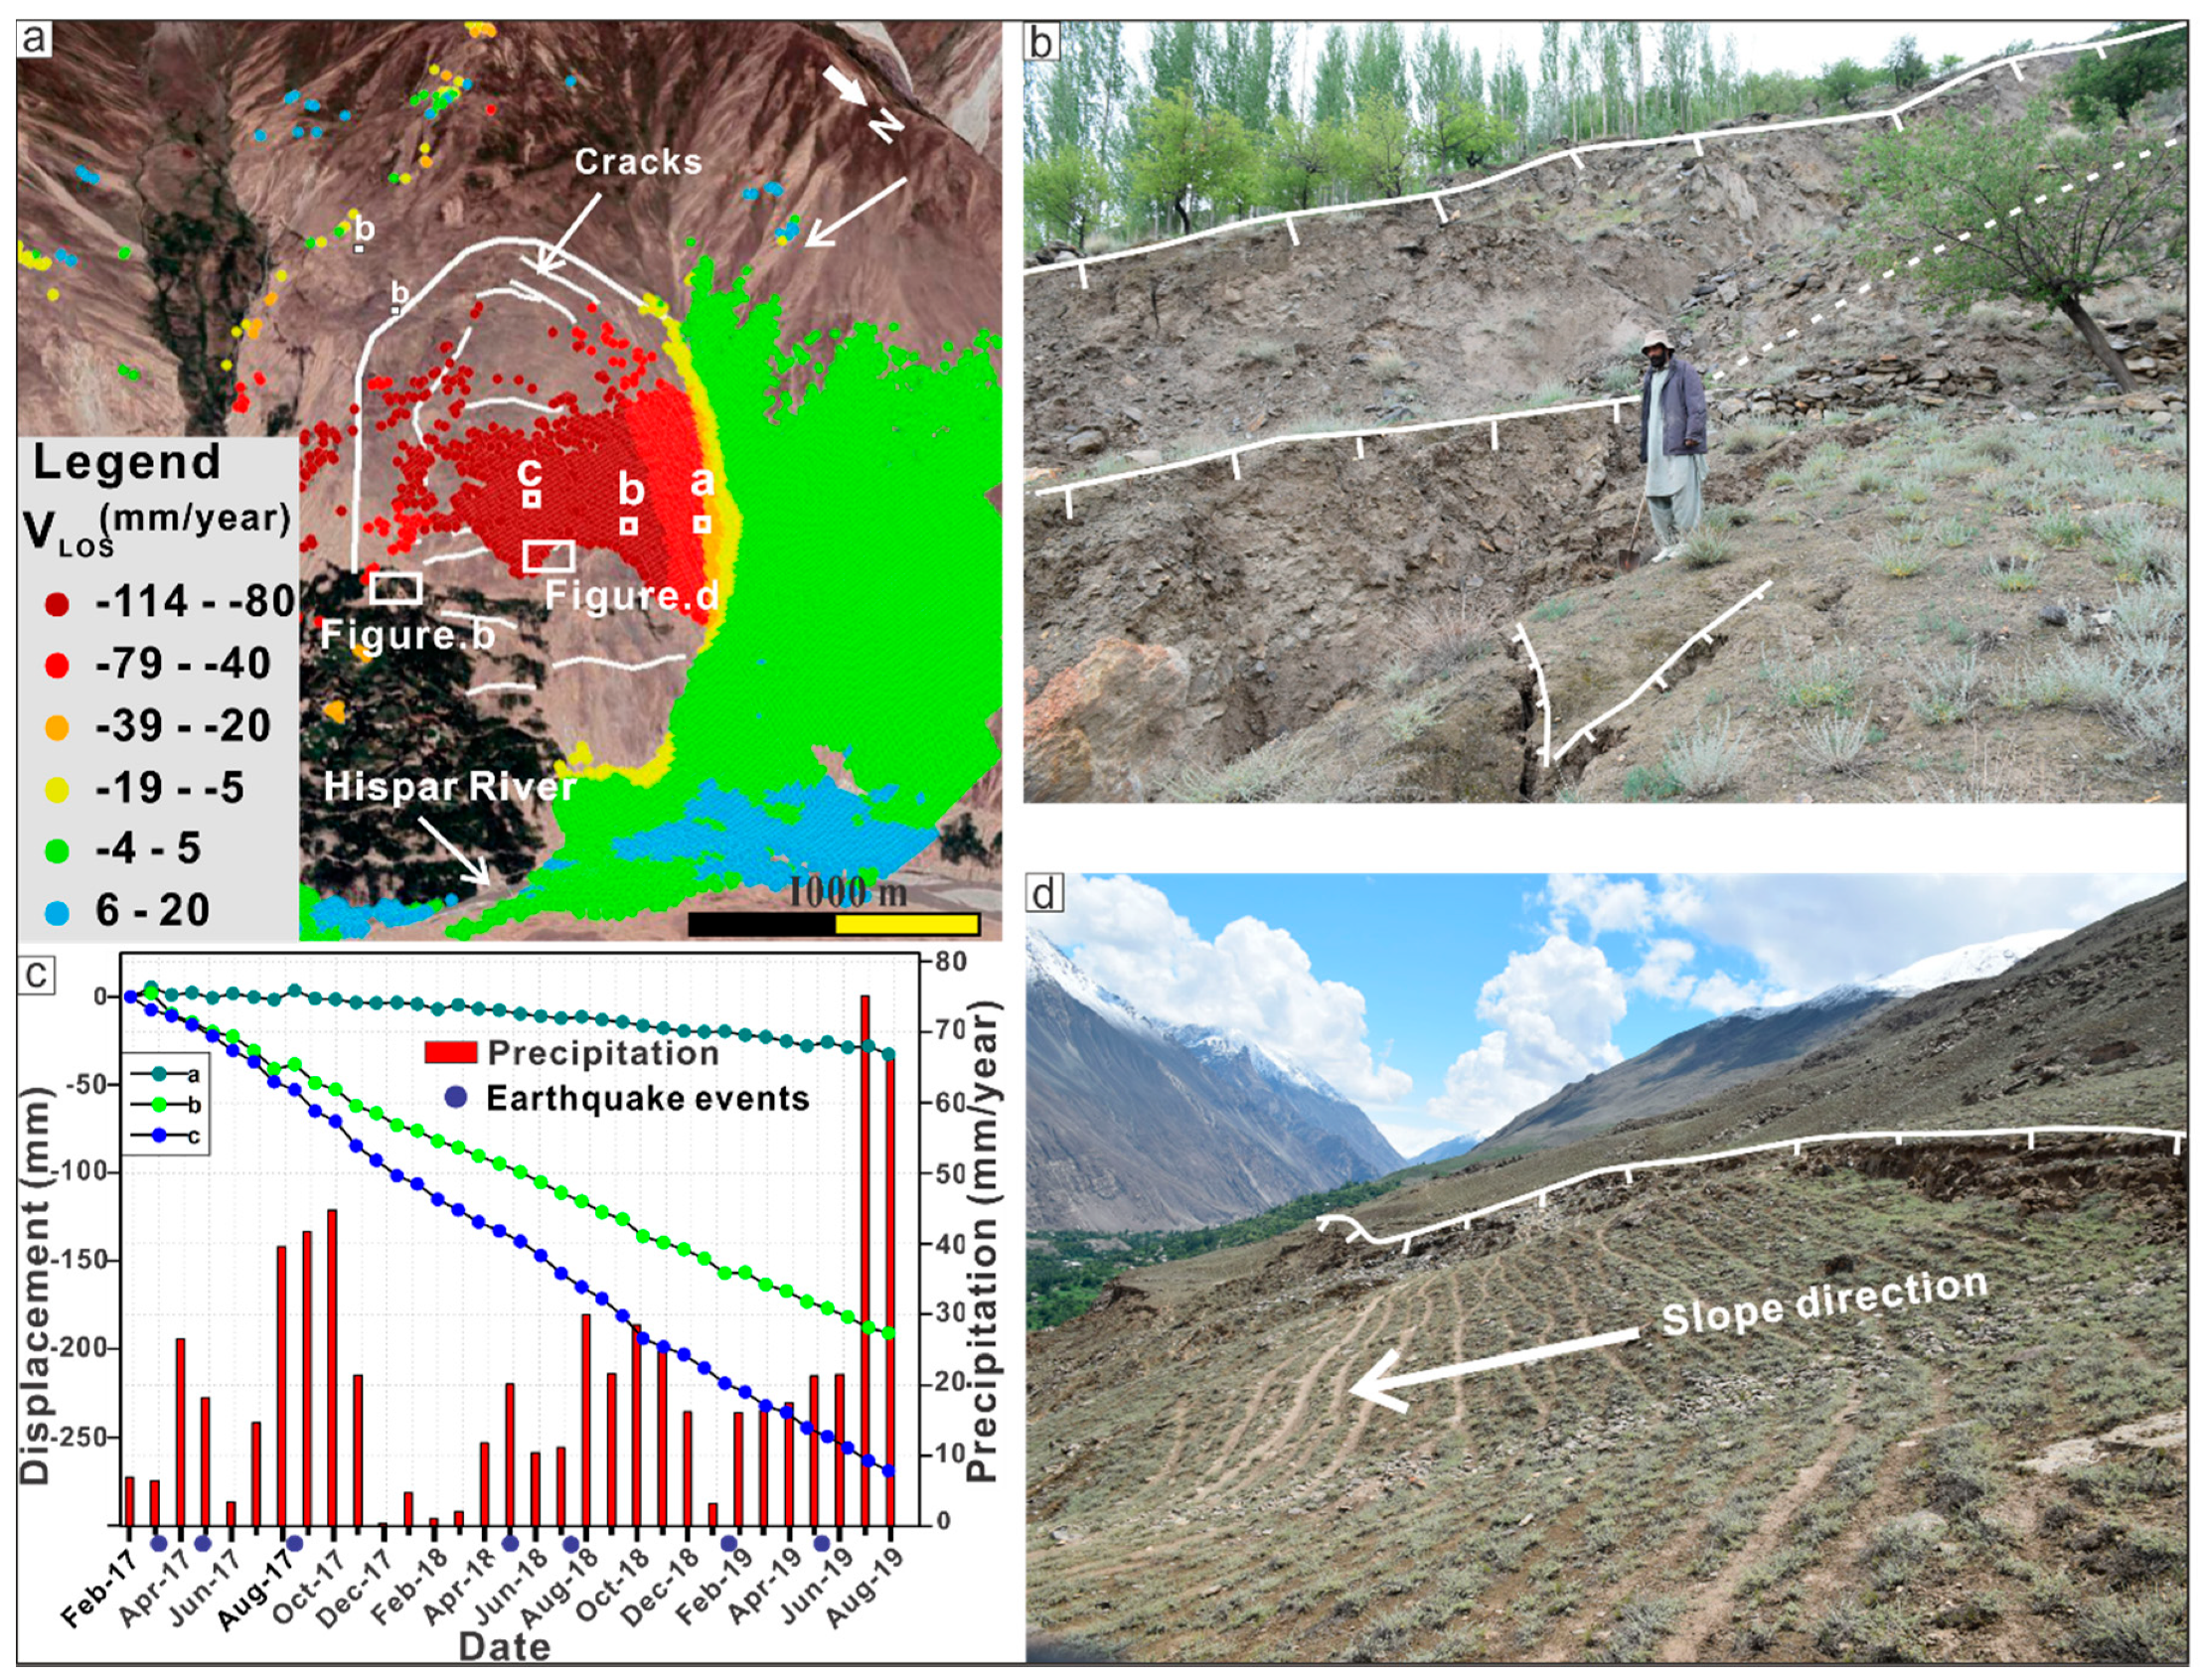
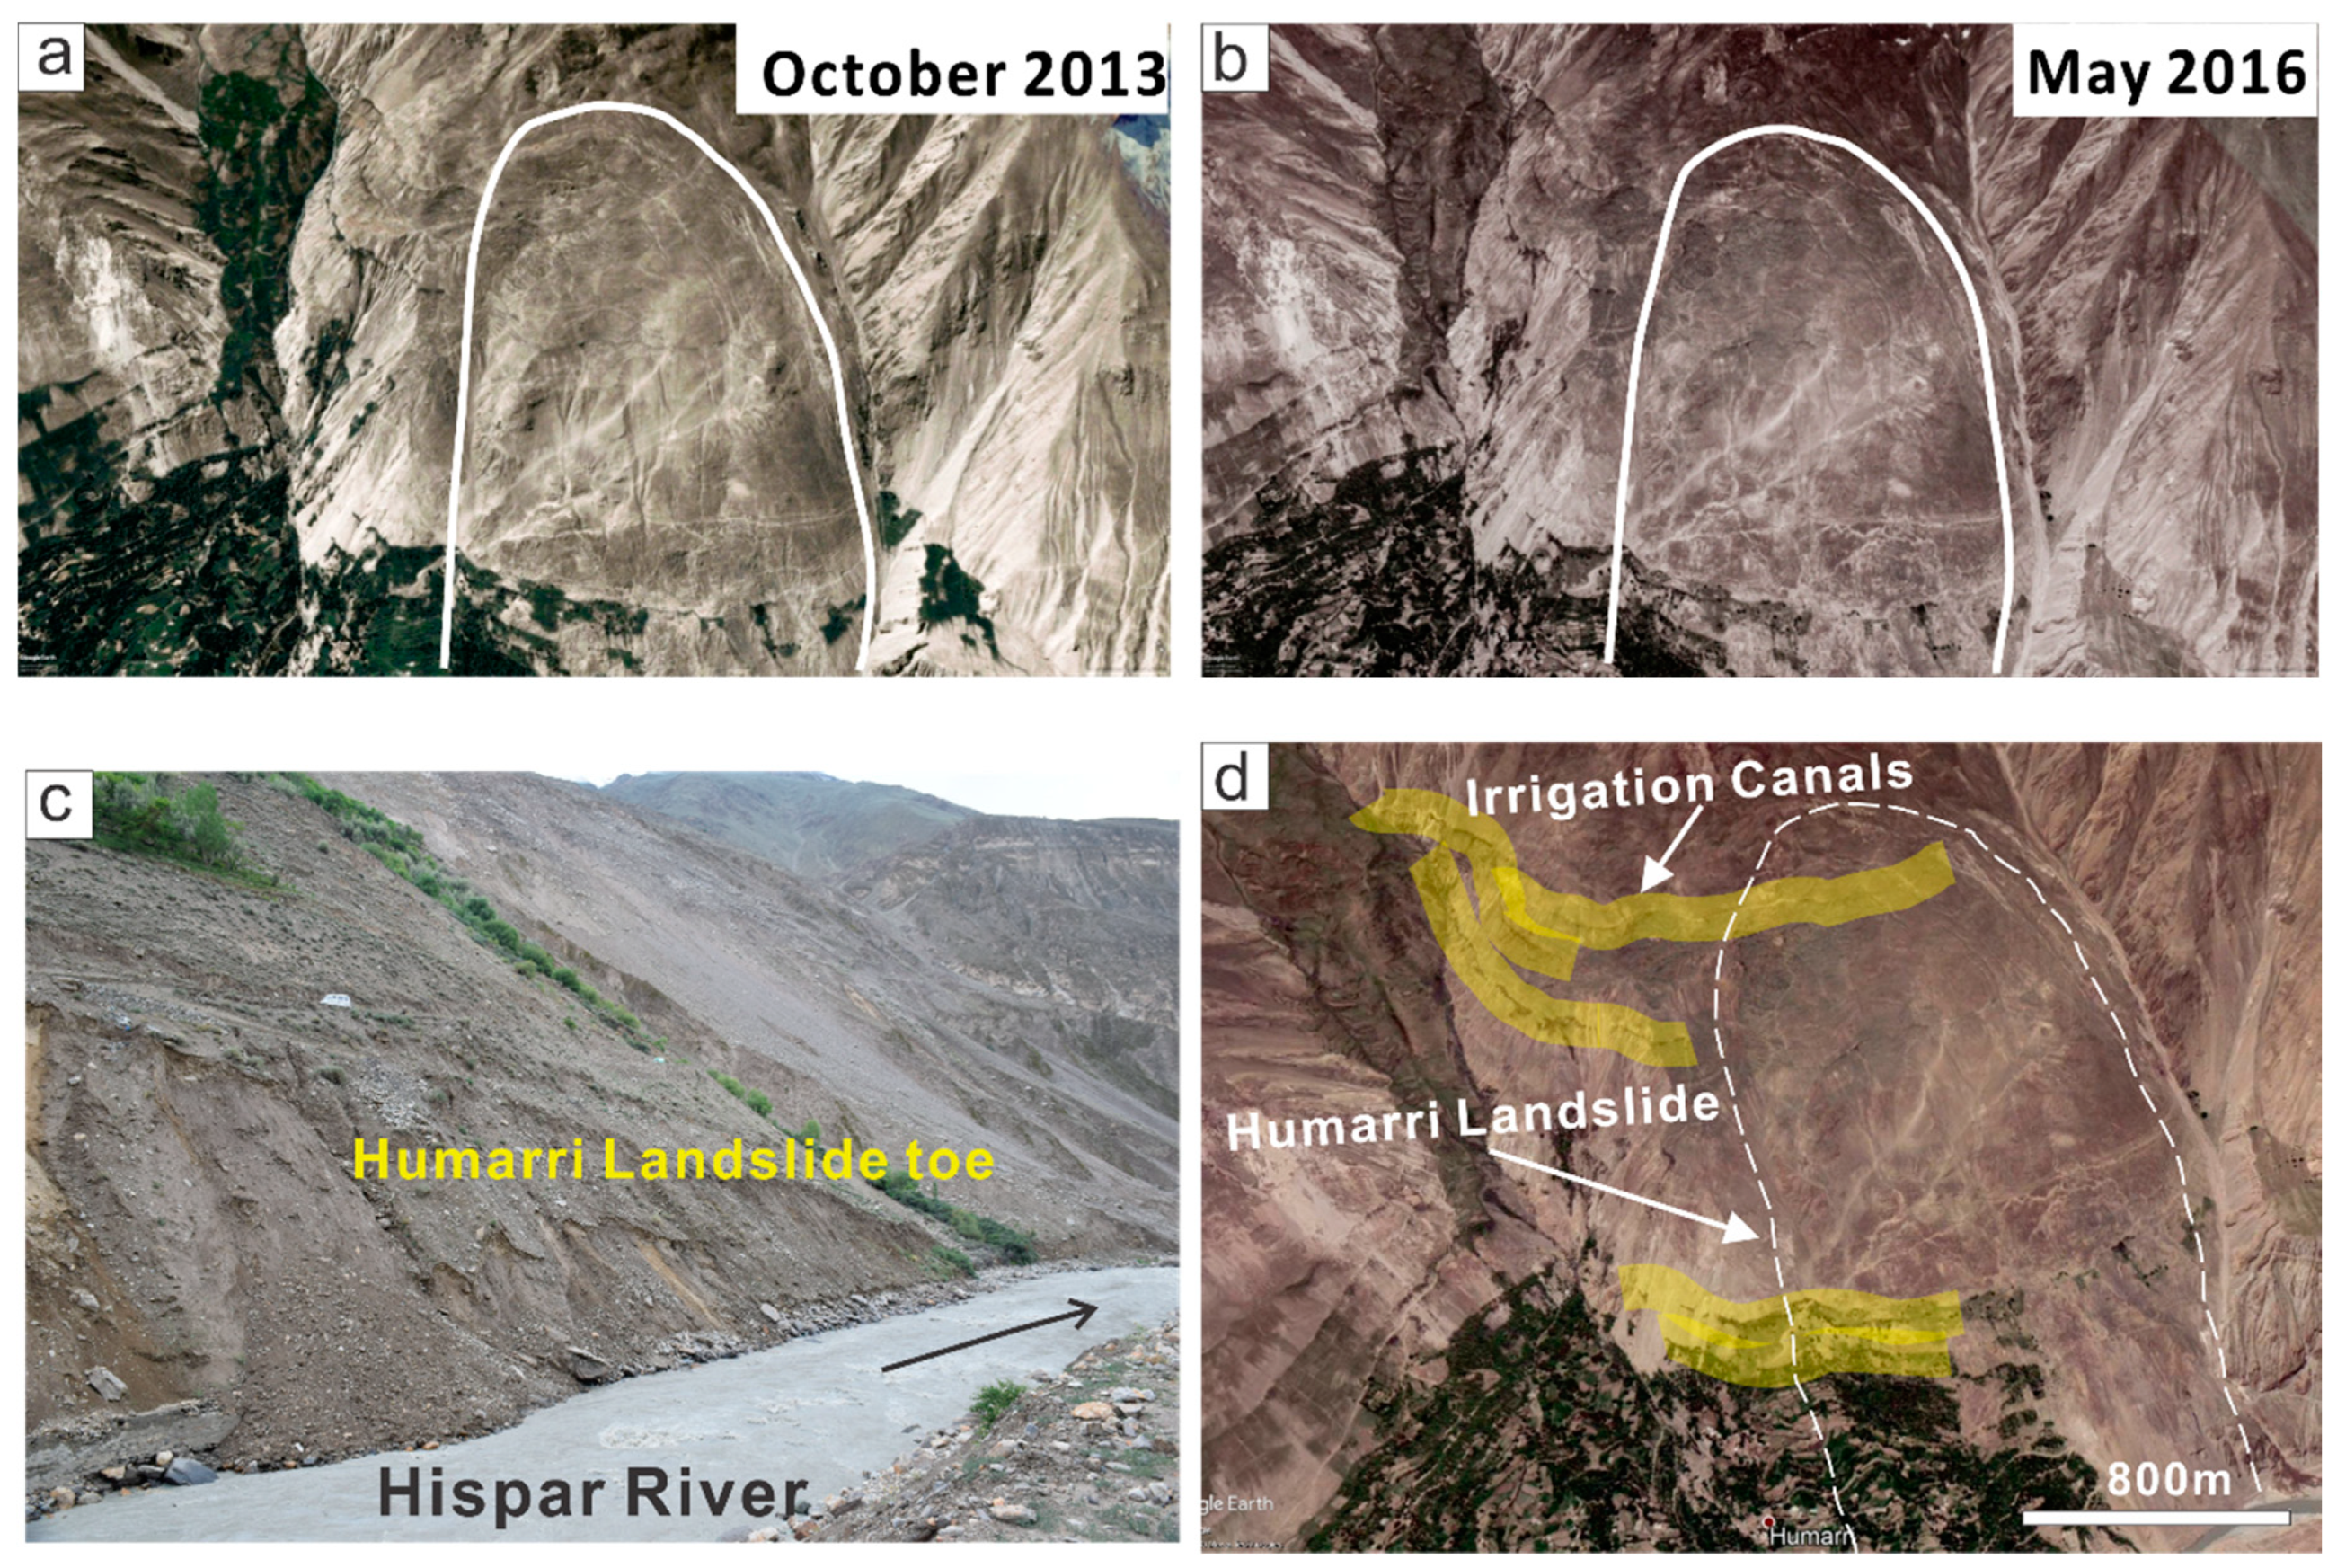
5. Humarri Landslide

The Humarri landslide is situated on the hanging wall of the MKT in the south-west of Humarri village in district Nagar (Figure 5). This village is located on the valley slope of Glacio-fluvial deposits underlain by high grade metamorphic rocks of Karakoram block (Figure 11a) on the left bank of the Hispar River. A local fault named the Humarri fault trending in the direction of NE-SW passes through the Landslide (Figure 8a). It is an active landslide with steep slopes ranging 30° to 70°. The Humarri landslide’s crest is highly fractured, and the fractures in its crown area are even visible on the satellite imagery (Figure 10a and Figure 11a). This region is located between the Hunza River and the Hoper glacier in the MKT zone (Figure 11a). The mass movements’ quantity in the hanging wall block of the MKT has been observed previously to be higher as compared to the footwall block [38]. In order to demarcate the geometry of the landslide material, subsurface model is constructed using surface geology. The landslide area is estimated to be 3.4 km2, with a volume of 4.1 × 10⁷ m3. This is a massive landslide in size, with a length of 2.3 km, a width of 1.3 km, and a maximum thickness of about 250 m (Figure 11a,b).
The area with significant rates of deformation was observed to be concentrated around and close to the Humarri fault (Figure 10a). The slope is orientated in the north-east direction. The sliding body consists of loose glacio-fluvial deposits, while the bedrock is mainly composed of ortho and para-gneisses. The deformation map of the hillslope that shows average velocities within the time series for the selected CTs is given in Figure 10. VLOS ranges between −30 and −114 mm/year, and locally even higher values, have been observed inside the landslide compared to stable points beyond its periphery (Figure 10a). Large deformation rates (>100 mm/year) are detected in the middle and lower part of the landslide. The significant slope deformation has never been detected previously in any study related to this area, and the considerable deformation is a clear indication of a potential major landslide. The different sectors of the slide show different velocity patterns. The deformation time series of the landslide reveal different deformation rates corresponding to their different gradients. These different deformation rates may be related to the nature of the materials involved in the displacement, which are mainly loose glacio-fluvial deposits and thus have an intrinsic heterogeneity.
According to the slope orientation and gradient in the region, this landslide is moving towards the Humarri village, Hispar River, and Nagar Khas road (Figure 11a). The valley is only about 80 m wide at this place. In the event of Humarri landslide triggering, which is much larger than Attabad landslide, the potential of a huge lake damming the Hispar River is possible (Figure 11c). This situation is threatening in the form of a possible landslide dam that would also, most probably, block the road connecting Nagar district to KKH and would be devastating to the community living in the near vicinity of the landslide. The large active deformation rate in the area is evident from the large fractures in the walls of many houses of the Humarri area (Figure 11c,d). The Humarri village alone comprises 80 households and 700 individuals approximately. This inhabited area may be in danger if any event triggers and accelerates the landslide movement.

6. Analysis of Potential triggers to Humarri Landslide

Karakoram-Himalayas is one of the most active mountain belts of the world that originated after the continent–continent collision of the Indian Plate with the Eurasian Plate. Being an ongoing collision, the major faults, along with their active splays, frequently release seismic energy. Major tectonic faults, including the MKT and the Karakoram Fault, play a significant role in triggering seismic events. Seismic activities in and around the region of Hunza and Nagar are thought to play a critical role in predisposing and triggering landslides. Earthquakes in 2002 (Mw 6.3), 2004, and 2005 (Mw 7.8) are the most evident among many tremors and jolts [57]. The more recent Mw 7.5 earthquake in the region of Yamgan, Afghanistan, on October 26, 2015, with its epicenter being around 300 km away from the Hunza-Nagar region, also triggered numerous landslides in the study area [6]. Interviews of the local people were conducted during the field survey, and it was deduced that the cracks and damages in the houses started to appear after the 2015 earthquake. However, no indicative satellite images were available for the detailed examination of the impact of the mentioned earthquake event. Figure 12a,b represents that the scar and cracks were already present before 2013, and no sudden accelerations in the scars can be seen from the satellite acquired after the 2015 earthquake. The slow-moving landslides typically respond to precipitation that results in an upsurge in pore-water pressure and a reduction in the effective normal stress along basal shear zones [58]. The temporal correlation analysis between the precipitation and the movement of the landslide were examined through a time series analysis. The association of the total deformation and the monthly average precipitation over February 2017 to August 2019 can be found in Figure 8c. Due to the unavailability of meteorological station information for the investigated landslide, rainfall data from Hunza station was used to evaluate the results. However, a correlation between the precipitation and the deformation was not evident. The deformation rates from February 2017 to August 2019 are quite linear and uncorrelated to precipitation. That could mean that other factors are at play, such as irrigation canals in the area, river incision, and tectonics that produce slope dynamics leading to a fast (but linear) displacement trend that may typical be of loose materials [59] (Figure 10c).
Irrigation is one of the factors which can trigger landslide by increasing groundwater level [60,61]. In north Pakistan, the irrigation channels are diverted from the glaciers at a higher elevation, and then by maintaining a gentle slope, these irrigation channels run for kilometers at higher elevation before they reach the target population cluster. Because these irrigation channels are openly dredged into mud, debris, and sand, the water easily percolates through the channel base and weakens the slope. In the upper part of Humarri landslide near the fresh escarpments, there are two irrigation channels that supply water for agricultural purposes (Figure 12d). These channels are derived from the glacial valley in the east and seem active as vegetation could be traced along with them. The irrigation system may leak a large amount of melt water in the predicted landslide area, and the slope is being affected continuously. The springs along the slope are indicative of soil saturation in the terrace area (Figure 11a).
The continuous erosion and destabilization of the toe of the Humarri landslide by the Hispar river adds to the slope instability (Figure 12c). When the soil at the toe crumbles, slumps, or liquefies, large areas of the bluff toe support can then disastrously fail in the form of a landslide. The different sectors of the slide show different velocity patterns. The deformation time series of the landslide reveals different deformation rates corresponding to their different gradients. These different deformation rates may be related to the nature of the materials involved in the displacement, which are mainly loose glacio-fluvial deposits.
Interactions between tectonic uplift, landslide erosion on hillslopes, and valley incision lead to the steep topography of the mountainous landscapes [62,63]. Hillslopes in rapidly elevating landscapes are believed to respond to river incision into bedrock by steepening to a threshold [64]. The removal of soil material by river erosion causes variations in the stress distribution in the adjacent soil and thus can make the slope unstable. These changes might contribute to disturbing the static equilibrium that makes a slope stable and consequently results in slope failure, and thus, a landslide occurs [65]. The seismic activity, toe cutting, and irrigation system leakage are probably the most prominent triggering agents for the landslides in the research area followed by precipitation and the unconsolidated nature of the scree slope. However, all these triggering factors together contribute to the ultimate slip pattern creating a net result.

7. Conclusions

The focus of the current study was to verify the capacity of the InSAR technique in rugged terrain using Sentinel-1 data for the detection of landslide deformation. The SBAS time series InSAR technique, applied to process Sentinel-1 images, successfully identified the landslides in the Hunza-Nagar area. This ultimately helped to highlight the rates of movement of these landslides, which in some of the cases raise concerns on the possible development of accelerations. The landslides identified through the InSAR technique, and the displacement velocities measured, remarkably correspond to the actual ground situation surveyed on the field, where scars, cracks on the ground and on buildings, and infrastructures were clearly observed. Comparing ground conditions at the studied sites to the known recent events of landslides in the broader North Pakistan region, prompts the conclusion that these unstable slopes may progress towards potential catastrophic failures in the near future. This is especially true for the Humarri landslide, previously undetected, that shows VLOS velocities overcoming 100 mm/year in the surveyed period. The successful application of InSAR analysis based on freely available radar images such as ESA’s Sentinel-1 is a potential breakthrough for the application of the same methods over much larger areas. Such areas may include as the whole northern Pakistan including the CPEC route for ensuring the identification of all possible locations for the landslides which have the potential to either directly impact the communities or could create ground deformation related geohazards.

Author Contributions

M.U.R. conceived the idea and wrote the first draft of the paper; X.M. and Y.Z. analyzed the results; X.S., D.Y., S.A., and I.A. revised the manuscript; Z.K. helped to collect field data. F.C. and G.R. contributed to the discussion of the results. All authors conceived the study and reviewed and approved the manuscript.

Funding

This study was supported by National Key Research and Development Program of China (Grant No. 2017YFC1501005), Science and Technology Major Project of Gansu Province (Grant Nos. 19ZD2FA002), National Natural Science Foundation of China (Grant No. 41661144046), Program for International S&T Cooperation Projects of Gansu Province (No. 2018-0204-GJC-0043), and the Fundamental Research Funds for the Central Universities (Grant No. lzujbky-2019-28, lzujbky-2018k14).

Acknowledgments

We greatly appreciated the editors and the reviews for their constructive suggestions and insightful comments which helped us greatly to improve this manuscript. The Sentinel-1A images were provided by the European Space Agency (ESA).

Conflicts of Interest

The authors declare no conflict of interest. The founding sponsors had no role in the design of the study; in the collection, analyses, or interpretation of data; in the writing of the manuscript, or in the decision to publish the results.

References

  1. Regmi, N.R.; Giardino, J.R.; Vitek, J.D. Modeling susceptibility to landslides using the weight of evidence approach: Western Colorado, USA. Geomorphology. 2010, 115, 172–187. [Google Scholar] [CrossRef]
  2. Wallemacq, P. Economic Losses, Poverty & Disasters: 1998–2017; Centre for Research on the Epidemiology of Disasters, CRED: Brussels, Belgium, 2018. [Google Scholar]
  3. Derbyshire, E.; Fort, M. «Mountain Hazards and Geomorphology in the Hunza Valley»; Oxford University Press: Oxford, UK, 2006. [Google Scholar]
  4. Kanwal, S.; Atif, S.; Shafiq, M. GIS based landslide susceptibility mapping of northern areas of Pakistan, a case study of Shigar and Shyok Basins. Geomat. Nat. Hazards Risk 2017, 8, 348–366. [Google Scholar] [CrossRef]
  5. Ali, S.; Biermanns, P.; Haider, R.; Reicherter, K. Landslide susceptibility mapping by using a geographic information system (GIS) along the China–Pakistan Economic Corridor (Karakoram Highway), Pakistan. Nat. Hazards 2019, 19, 999–1022. [Google Scholar] [CrossRef] [Green Version]
  6. Zhiquan, Y.; Yingyan, Z.; Shanguang, Q.; Kepeng, H. Types and space distribution characteristics of debris flow disasters along China-Pakistan Highway. Electron. J. Geotech. Eng. 2016, 21, 191–200. [Google Scholar]
  7. Derbyshire, E.; Fort, M.; Owen, L.A. Geomorphological Hazards along the Karakoram Highway: Khunjerab Pass to the Gilgit River, Northernmost Pakistan. Erdkunde 2001, 55, 49–71. [Google Scholar] [CrossRef]
  8. Bacha, A.S.; Shafique, M.; van der Werff, H. Landslide inventory and susceptibility modelling using geospatial tools, in Hunza-Nagar valley, northern Pakistan. J. Mt. Sci.-Engl. 2018, 15, 1354–1370. [Google Scholar] [CrossRef]
  9. Rehman, G. GLOF Risk and Reduction Approaches in Pakistan. In Disaster Risk Reduction Approaches in Pakistan. Disaster Risk Reduction (Methods, Approaches and Practices); Rahman, A.U., Khan, A., Shaw, R., Eds.; Springer: Tokyo, Japan, 2015; pp. 217–237. [Google Scholar]
  10. Kuhle, M.; Meiners, S.; Iturrizaga, L. Glacier-induced Hazards as a Consequence of glacigenic Mountain Landscapes, in particular glacier-and moraine-dammed Lake outbursts and Holocene Debris production. In Geomorphological Hazards in High Mountain Areas; Springer: Berlin/Heidelberg, Germany, 1998; pp. 63–96. [Google Scholar]
  11. Tariq, S.; Gomes, C. Landslide environment in Pakistan after the earthquake-2005: Information revisited to develop safety guidelines for minimizing future impacts. J. Geogr. Nat. Disasters 2017, 7, 1–11. [Google Scholar] [CrossRef]
  12. Searle, M.; Khan, M.A.; Fraser, J.; Gough, S.; Jan, M.Q. The tectonic evolution of the Kohistan-Karakoram collision belt along the Karakoram Highway transect, north Pakistan. Tectonics 1999, 18, 929–949. [Google Scholar] [CrossRef] [Green Version]
  13. Schlögel, R.; Doubre, C.; Malet, J.-P.; Masson, F. Landslide deformation monitoring with ALOS/PALSAR imagery: A D-InSAR geomorphological interpretation method. Geomorphology 2015, 231, 314–330. [Google Scholar] [CrossRef]
  14. Mirza, F.M.; Fatima, N.; Ullah, K. Impact of China-Pakistan economic corridor on Pakistan’s future energy consumption and energy saving potential: Evidence from sectoral time series analysis. Energy Strategy Rev. 2019, 25, 34–46. [Google Scholar] [CrossRef]
  15. Chae, B.-G.; Park, H.-J.; Catani, F.; Simoni, A.; Berti, M. Landslide prediction, monitoring and early warning: A concise review of state-of-the-art. Geosciences 2017, 21, 1033–1070. [Google Scholar] [CrossRef]
  16. Greif, V.; Vlcko, J.J.E.E.S. Monitoring of post-failure landslide deformation by the PS-InSAR technique at Lubietova in Central Slovakia. Environ. Earth Sci. 2012, 66, 1585–1595. [Google Scholar] [CrossRef]
  17. Scaioni, M.; Longoni, L.; Melillo, V.; Papini, M. Remote sensing for landslide investigations: An overview of recent achievements and perspectives. Remote Sens. 2014, 6, 9600–9652. [Google Scholar] [CrossRef] [Green Version]
  18. Corsini, A.; Borgatti, L.; Cervi, F.; Dahne, A.; Ronchetti, F.; Sterzai, P. Estimating mass-wasting processes in active earth slides—Earth flows with time-series of High-Resolution DEMs from photogrammetry and airborne LiDAR. Nat. Hazards Earth Syst. Sci. 2009, 9, 433–439. [Google Scholar] [CrossRef]
  19. Intrieri, E.; Gigli, G.; Mugnai, F.; Fanti, R.; Casagli, N. Design and implementation of a landslide early warning system. Eng. Geol. 2012, 147, 124–136. [Google Scholar] [CrossRef] [Green Version]
  20. Wasowski, J.; Bovenga, F. Investigating landslides and unstable slopes with satellite Multi Temporal Interferometry: Current issues and future perspectives. Eng. Geol. 2014, 174, 103–138. [Google Scholar] [CrossRef]
  21. Cigna, F.; Bateson, L.B.; Jordan, C.J.; Dashwood, C. Simulating SAR geometric distortions and predicting Persistent Scatterer densities for ERS-1/2 and ENVISAT C-band SAR and InSAR applications: Nationwide feasibility assessment to monitor the landmass of Great Britain with SAR imagery. Remote Sens. Environ. 2014, 152, 441–466. [Google Scholar] [CrossRef] [Green Version]
  22. Zhang, Y.; Meng, X.; Jordan, C.; Novellino, A.; Dijkstra, T.; Chen, G. Investigating slow-moving landslides in the Zhouqu region of China using InSAR time series. Landslides 2018, 15, 1299–1315. [Google Scholar] [CrossRef]
  23. Liang, S.; Wang, J. Advanced Remote Sensing: Terrestrial Information Extraction and Applications; Academic Press: Cambridge, MA, USA, 2019. [Google Scholar]
  24. Massonnet, D.; Feigl, K.L. Radar interferometry and its application to changes in the Earth’s surface. Rev. Geophys. 1998, 36, 441–500. [Google Scholar] [CrossRef] [Green Version]
  25. Zhao, C.; Zhang, Q.; Yin, Y.; Lu, Z.; Yang, C.; Zhu, W.; Li, B. Pre-, co-, and post-rockslide analysis with ALOS/PALSAR imagery: A case study of the Jiweishan rockslide, China. Nat. Hazards Earth Syst. Sci. 2013, 13, 2851–2861. [Google Scholar] [CrossRef] [Green Version]
  26. Zhang, L.; Liao, M.; Balz, T.; Shi, X.; Jiang, Y. Monitoring landslide activities in the three gorges area with multi-frequency satellite SAR data sets. In Modern Technologies for Landslide Monitoring and Prediction; Springer: Berlin/Heidelberg, Germany, 2015; pp. 181–208. [Google Scholar]
  27. Baum, R.L.; Godt, J.W. Early warning of rainfall-induced shallow landslides and debris flows in the USA. Landslides 2010, 7, 259–272. [Google Scholar] [CrossRef]
  28. Righini, G.; Pancioli, V.; Casagli, N. Updating landslide inventory maps using Persistent Scatterer Interferometry (PSI). Int. J. Remote Sens. 2012, 33, 2068–2096. [Google Scholar] [CrossRef]
  29. Tofani, V.; Raspini, F.; Catani, F.; Casagli, N. Persistent Scatterer Interferometry (PSI) technique for landslide characterization and monitoring. Remote Sens. 2013, 5, 1045–1065. [Google Scholar] [CrossRef] [Green Version]
  30. Zhang, Y.; Meng, X.; Chen, G.; Qiao, L.; Zeng, R.; Chang, J. Detection of geohazards in the Bailong River Basin using synthetic aperture radar interferometry. Landslides 2016, 13, 1273–1284. [Google Scholar] [CrossRef]
  31. Ferretti, A.; Prati, C.; Rocca, F. Permanent scatterers in SAR interferometry. IEEE Trans. Geosci. Remote Sens. 2001, 39, 8–20. [Google Scholar] [CrossRef]
  32. Ferretti, A.; Prati, C.; Rocca, F. Nonlinear subsidence rate estimation using permanent scatterers in differential SAR interferometry. IEEE Trans. Geosci. Remote Sens. 2000, 38, 2202–2212. [Google Scholar] [CrossRef] [Green Version]
  33. Berardino, P.; Fornaro, G.; Lanari, R.; Sansosti, E. A new algorithm for surface deformation monitoring based on small baseline differential SAR interferograms. IEEE Trans. Geosci. Remote Sens. 2002, 40, 2375–2383. [Google Scholar] [CrossRef] [Green Version]
  34. Zhang, Y.; Liu, Y.; Jin, M.; Jing, Y.; Liu, Y.; Liu, Y.; Sun, W.; Wei, J.; Chen, Y. Monitoring Land Subsidence in Wuhan City (China) using the SBAS-InSAR Method with Radarsat-2 Imagery Data. Sensors 2019, 19, 743. [Google Scholar] [CrossRef] [Green Version]
  35. Hooper, A.; Bekaert, D.; Spaans, K.; Arıkan, M. Recent advances in SAR interferometry time series analysis for measuring crustal deformation. Tectonophysics 2012, 514, 1–13. [Google Scholar] [CrossRef]
  36. Ahmed, M.F.; Rogers, J.D.; Ismail, E. A regional level preliminary landslide susceptibility study of the upper Indus river basin. Eur. J. Remote Sens. 2014, 47, 343–373. [Google Scholar] [CrossRef] [Green Version]
  37. Basharat, M.; Shah, H.R.; Hameed, N. Landslide susceptibility mapping using GIS and weighted overlay method: A case study from NW Himalayas, Pakistan. Arab. J. Geosci. 2016, 9, 292. [Google Scholar] [CrossRef]
  38. Ali, S.; Biermanns, P.; Haider, R.; Reicherter, K. Landslide susceptibility mapping by using GIS along the China–Pakistan economic corridor (Karakoram Highway), Pakistan. Nat. Hazards Earth Syst. Sci. 2018. [Google Scholar] [CrossRef]
  39. Zeitler, P.K. Cooling history of the NW Himalaya, Pakistan. Tectonics 1985, 4, 127–151. [Google Scholar] [CrossRef]
  40. Coward, M.P.; Rex, D.C.; Khan, M.A.; Windley, B.F.; Broughton, R.D.; Luff, I.W.; Petterson, M.G.; Pudsey, C.J. Collision tectonics in the NW Himalayas. Geol. Soc. Lond. Spec. Publ. 1986, 19, 203–219. [Google Scholar] [CrossRef]
  41. Goudie, A.; Kalvoda, J. Recent geomorphological processes in the Nagar region, Hunza Karakoram. Acta Univ. Carol. Geogr. 2004, 39, 135–148. [Google Scholar]
  42. Verma, R.; Sekhar, C.C. Focal mechanism solutions and nature of plate movements in Pakistan. J. Geodyn. 1986, 5, 331–351. [Google Scholar] [CrossRef]
  43. Owen, L.A. Terraces, Uplift and Climate, Karakoram Mountains, Northern Pakistan. Ph.D. Thesis, University of Leicester, Leicester, UK, 1988. [Google Scholar]
  44. Owen, L.A.; Derbyshire, E. Quaternary and Holocene intermontane basin sedimentation in the Karakoram Mountains. In Himalaya to the Sea; Routledge: London, UK, 2002; pp. 88–102. [Google Scholar]
  45. Guo, J.; Zhou, L.; Yao, C.; Hu, J. Surface subsidence analysis by multi-temporal insar and grace: A case study in Beijing. Sensors 2016, 16, 1495. [Google Scholar] [CrossRef] [Green Version]
  46. SARscape Sarmap. Synthetic Aperture Radar and SARscape: SAR Guidebook. Switzerland, 2009. Available online: http://www.sarmap.ch/pdf/SAR-Guidebook (accessed on 14 May 2020).
  47. Nikos, S.; Ioannis, P.; Constantinos, L.; Paraskevas, T.; Anastasia, K.; Charalambos, K. Land subsidence rebound detected via multi-temporal InSAR and ground truth data in Kalochori and Sindos regions, Northern Greece. Eng. Geol. 2016, 209, 175–186. [Google Scholar] [CrossRef]
  48. Castellazzi, P.; Arroyo-Domínguez, N.; Martel, R.; Calderhead, A.I.; Normand, J.C.; Gárfias, J.; Rivera, A. Land subsidence in major cities of Central Mexico: Interpreting InSAR-derived land subsidence mapping with hydrogeological data. Int. J. Appl. Earth Obs. 2016, 47, 102–111. [Google Scholar] [CrossRef]
  49. Chen, G.; Zhang, Y.; Zeng, R.; Yang, Z.; Chen, X.; Zhao, F.; Meng, X. Detection of land subsidence associated with land creation and rapid urbanization in the chinese loess plateau using time series insar: A case study of Lanzhou new district. Remote Sens. 2018, 10, 270. [Google Scholar] [CrossRef] [Green Version]
  50. Hooper, A. A multi-temporal InSAR method incorporating both persistent scatterer and small baseline approaches. Geophys. Res. Lett. 2008, 35. [Google Scholar] [CrossRef] [Green Version]
  51. Aimaiti, Y.; Yamazaki, F.; Liu, W.; Kasimu, A. Monitoring of land-surface deformation in the karamay oilfield, Xinjiang, China, using sar interferometry. Appl. Sci. 2017, 7, 772. [Google Scholar] [CrossRef] [Green Version]
  52. Gaber, A.; Darwish, N.; Koch, M. Minimizing the residual topography effect on interferograms to improve DInSAR results: Estimating land subsidence in Port-Said City, Egypt. Remote Sens. 2017, 9, 752. [Google Scholar] [CrossRef] [Green Version]
  53. Chen, F.; Lin, H.; Zhou, W.; Hong, T.; Wang, G. Surface deformation detected by ALOS PALSAR small baseline SAR interferometry over permafrost environment of Beiluhe section, Tibet Plateau, China. Remote Sens. Environ. 2013, 138, 10–18. [Google Scholar] [CrossRef]
  54. Meisina, C.; Zucca, F.; Notti, D.; Colombo, A.; Cucchi, A.; Savio, G.; Giannico, C.; Bianchi, M. Geological interpretation of PSInSAR data at regional scale. Sensors 2008, 8, 7469–7492. [Google Scholar] [CrossRef] [PubMed] [Green Version]
  55. Colesanti, C.; Wasowski, J. Investigating landslides with space-borne Synthetic Aperture Radar (SAR) interferometry. Eng. Geol. 2006, 88, 173–199. [Google Scholar] [CrossRef]
  56. Zhang, Y.; Meng, X.; Dijkstra, T.; Jordan, C.; Chen, G.; Zeng, R.; Novellino, A. Forecasting the magnitude of potential landslides based on InSAR techniques. Remote Sens. Environ. 2020, 241, 111738. [Google Scholar] [CrossRef]
  57. Sarwar, F.; Iqbal, S.; Qaisar, M.; Rehman, A.; Akhtar, F.; Raza, S.M. Earthquake statistics and earthquake research studies in Pakistan. Open J. of Earthq. Res. 2016, 5, 97. [Google Scholar] [CrossRef] [Green Version]
  58. Fell, R.; Corominas, J.; Bonnard, C.; Cascini, L.; Leroi, E.; Savage, W.Z. Guidelines for landslide susceptibility, hazard and risk zoning for land-use planning. Eng. Geol. 2008, 102, 99–111. [Google Scholar] [CrossRef] [Green Version]
  59. Intrieri, E.; Carlà, T.; Gigli, G. Forecasting the time of failure of landslides at slope-scale: A literature review. Earth-Sci. Rev. 2019, 193, 333–349. [Google Scholar] [CrossRef]
  60. Peng, D.; Xu, Q.; Liu, F.; He, Y.; Zhang, S.; Qi, X.; Zhao, K.; Zhang, X. Distribution and failure modes of the landslides in Heitai terrace, China. Eng. Geol. 2018, 236, 97–110. [Google Scholar] [CrossRef]
  61. Li, T.; Zhao, J.; Li, P.; Wang, F. Failure and motion mechanisms of a rapid loess flowslide triggered by irrigation in the Guanzhong irrigation area, Shaanxi, China. In Progress of Geo-Disaster Mitigation Technology in Asia; Springer: Berlin/Heidelberg, Germany, 2013; pp. 421–433. [Google Scholar]
  62. Montgomery, D.R.; Brandon, M.T. Topographic controls on erosion rates in tectonically active mountain ranges. Earth Planet. Sci. Lett. 2002, 201, 481–489. [Google Scholar] [CrossRef]
  63. Burbank, D.W.; Leland, J.; Fielding, E.; Anderson, R.S.; Brozovic, N.; Reid, M.R.; Duncan, C. Bedrock incision, rock uplift and threshold hillslopes in the northwestern Himalayas. Nature 1996, 379, 505. [Google Scholar] [CrossRef]
  64. Montgomery, D.R. Slope distributions, threshold hillslopes, and steady-state topography. Am. J. Sci. 2001, 301, 432–454. [Google Scholar] [CrossRef] [Green Version]
  65. Scesi, L.; Gattinoni, P. Water Circulation in Rocks; Springer Science & Business Media: Berlin, Germany, 2009. [Google Scholar]
Figure 1. Overview of geological setting of the study area. (a) Location of the study area in the region, (b) regional tectonic map of north Pakistan showing active faults and major earthquake events in the region (USGS Earthquake Catalog, 2019), (c) geological map of the study area (modified from Searle, 1999 [12]), and (d) digital elevation model of a part of Hunza-Nagar area.
Remotesensing 12 02054 g001
Figure 2. (a) Overview of old landslides scars near to Attabad Lake: white lines are representing the main scarps of old large landslides/rock avalanches; yellow polygons represent deposits of these old landslides, (bd) show old landslides in the area.
Remotesensing 12 02054 g002
Figure 3. Flowchart of the small baseline subset (SBAS) processing used in this study [34].
Remotesensing 12 02054 g003
Figure 4. Spatial–temporal distribution of interferogram formation. Green dots and blue lines represent images and interferometric pairs, respectively. Yellow dot is the master images used for the co-registration.
Remotesensing 12 02054 g004
Figure 5. The average velocity in line of sight (LOS) from February 2017 to August 2019 plotted in Google Earth over a part of Hunza-Nagar region. The blue polygons represent the high deformation zone detected using SBAS-InSAR technique.
Remotesensing 12 02054 g005
Figure 6. The average velocity in Vslope from February 2017 to August 2019 plotted in Google Earth over a part of Hunza-Nagar region. The green polygons represent the CTs cluster exceeding threshold velocity.
Remotesensing 12 02054 g006
Figure 7. Mayoon landslide. (a) The LOS displacement rates in the Mayoon landslide as superimposed on Google Earth map for a perspective view; (b,d) shows cracks for the locations as marked on (a); and (c) the displacement time series for three representative pixels a, b, and c, respectively.
Remotesensing 12 02054 g007
Figure 8. Ghulmet landslide. (a) The LOS displacement rates in the Ghulmet landslide as superimposed on Google Earth map for perspective view; (b) field picture of Ghulmet landslide, and (c) displacement time series for representative pixels, for point a and b.
Remotesensing 12 02054 g008
Figure 9. Khai landslide. (a) The LOS displacement rates in the Khai landslide as superimposed on Google Earth map for perspective view; (b) Displacement time series for representative pixels, for points a and b.
Remotesensing 12 02054 g009
Figure 10. Humarri Landslide. (a) Slope deformation rates in the direction of LOS as determined from InSAR at Humarri Slope. (b,d) Examples of tension cracks in the landslide. (c) Displacement time series for representative pixels, for point a, b, and c.
Remotesensing 12 02054 g010
Figure 11. (a) Geomorphic map of Humarri landslide region. (b) Cross-section along line A-B as shown in (c,e) with cracks in houses recognized during the field survey in the Humarri village. (d) Example of tension cracks in the landslide.
Remotesensing 12 02054 g011
Figure 12. Satellite images of Humarri Landslide, (a) October 2013, (b) May 2016, (c) toe erosion of Humarri landslide due to the Hispar River, and (d) abandoned Irrigation canal in the upper part of Humarri landslide.
Remotesensing 12 02054 g012
Table 1. The significant earthquake recorded from February 2017 to August 2019 in the northern Pakistan.
DateMagnitudeDepth (km)LocationDistance of the Research Area from Epicenter
2019-06-125.212.9034.681°N, 72.857°E230 km
2019-02-055.220.67 35.103°N, 74.169°E120 km
2018-07-074.383.2735.692°N, 74.446°E55 km
2018-05-096.2116.0036.994°N, 71.382°E270 km
2017-08-23 4.649.61 35.407°N, 74.578°E85 km
2017-05-064.277.3036.771°N,73.982°E70 km
2017-03-06 4.490.3237.051°N, 73.504°E130 km

