Assessing Snow Phenology over the Large Part of Eurasia Using Satellite Observations from 2000 to 2016


1
Key Laboratory of West China’s Environment (DOE), College of Earth and Environment Sciences, Lanzhou University, Lanzhou 730000, China
2
University Corporation for Polar Research, Beijing 100875, China
3
School of Geographical Sciences, Nanjing University of Information Science and Technology, Nanjing 210044, China
*
Author to whom correspondence should be addressed.
Remote Sens. 2020, 12(12), 2060; https://0-doi-org.brum.beds.ac.uk/10.3390/rs12122060
Submission received: 25 May 2020
/
Revised: 20 June 2020
/
Accepted: 23 June 2020
/
Published: 26 June 2020
(This article belongs to the Special Issue Remote Sensing of Climatic and Environmental Changes over the Antarctic, Arctic, and the Qinghai-Tibet Plateau)
Abstract
:Snow plays an important role in meteorological, hydrological and ecological processes, and snow phenology variation is critical for improved understanding of climate feedback on snow cover. The main purpose of the study is to explore spatial-temporal changes and variabilities of the extent, timing and duration, as well as phenology of seasonal snow cover across the large part of Eurasia from 2000 through 2016 using a Moderate Resolution Imaging Spectroradiometer (MODIS) cloud-free snow product produced in this study. The results indicate that there are no significant positive or negative interannual trends of snow cover extent (SCE) from 2000 to 2016, but there are large seasonal differences. SCE shows a significant negative trend in spring (p = 0.01) and a positive trend in winter. The stable snow cover areas accounting for 78.8% of the large part of Eurasia, are mainly located north of latitude 45° N and in the mountainous areas. In this stable area, the number of snow-covered days is significantly increasing (p < 0.05) in 6.4% of the region and decreasing in 9.1% of the region, with the decreasing areas being mainly located in high altitude mountain areas and the increasing area occurring mainly in the ephemeral snow cover areas of northeastern and southern China. In central Siberia, Pamir and the Tibetan Plateau, the snow onset date tends to be delayed while the end date is becoming earlier from 2000 to 2016. While in the relatively low altitude plain areas, such as the West Siberian Plain and the Eastern European Plain region, the snow onset date is tending to advance, the end date tends to be delayed, but the increase is not significant.
1. Introduction
Snow cover, an indispensable component of the cryosphere and climate system, affects the surface radiation balance through its high albedo and provides fresh water for human beings, particularly in arid and semi-arid regions [1,2,3]. Variations of snow cover have a huge impact on ecosystems and regional climate [4,5]. Snow phenology is used to characterize snow cover changes response to climate change, and shows great seasonal and inter-annual variations. Increasing air temperature postpones the snow cover onset date in autumn and results in an earlier snow melt event in spring. The variations of snow can also lead to local and regional temperature or precipitation anomalies [6,7,8]. Therefore, the characteristics of snow phenology are very important for studying the snow cover change response to climate change, and also provide a benefit for climate models used for future forecasts [9].
Eurasia is the largest continent of snow-covered area in the Northern Hemisphere. It has a vast territory, a large north–south latitude span, and a complex and undulating topography. This region has formed a complex and diverse climatic zone. Snow cover extent (SCE) in winter over Eurasia accounts for about 60%–65% of the total snow-covered area in the Northern Hemisphere [10]. The snow cover persists longer, especially in some parts of the Russian Arctic, where snow-covered days (SCDs) are more than 8 months [11,12,13]. The Arctic Oscillation is the main mode of atmospheric variability in the Northern Hemisphere, which is closely related to the changes in snow cover in Eurasia [14]. More snow cover in October across Eurasia has a beneficial effect on the formation of higher ocean surface pressure throughout northern Eurasia in early November to mid-December, thereby increasing the poleward heat flux in the lower stratosphere [15]. Snow cover anomalies over Siberia are conducive to the eastward (westward) phase of the Quasi-Biennial Oscillation in the equatorial stratosphere [16]. The SCE of Eurasia has progressively decreased over the past few decades [17,18,19] due to the effect of Arctic amplification [20,21], which indicates the Arctic has the strongest and the fastest warming in the Northern Hemisphere relative to the whole earth.
Remote sensing data play an important role in monitoring snow cover spatiotemporal dynamics with its low cost and high efficiency advantages. Currently, the Rutgers University Global Snow Lab and the binary snow cover mask data derived from the climate data record of Northern Hemisphere Snow Cover Extent (NHSCE) can provide a long-term snow dataset (1967–present). However, the spatial resolution of the dataset is relatively coarse, at 24 km [22]. In addition, the implementation of the interactive multi-sensor snow and ice mapping system (IMS) provides another approach for monitoring of snow cover, but it does not provide consistent spatial resolution: 24, 4 and 1 km [23]. The passive microwave data AMSR-E can provide SCE and snow water equivalent (SWE) at both global and hemisphere scales, with reliable accuracy, but this data was discontinued on September 2, 2011 due to instrument issues [24]. The GlobSnow data provide high accuracy of SCE on a global scale from 1995 to 2012 and the SWE for the Northern Hemisphere from 1995 to the present, but the SWE product did not provide the areas of mountainous regions and Greenland [25]. The moderate resolution imaging spectroradiometer (MODIS) provides global snow cover products with higher accuracy; the snow classification accuracy is about 94% under clear sky [26], which can be used as an ideal data source for snow cover monitoring.
Previous satellite observations have shown a continuous decline in the spring SCE in the Northern Hemisphere during the past 50 years [27]. The SCE of the Northern Hemisphere during March and April from 1970 to 2010 exhibits a stable, decreasing trend and has reduced by approximately 0.8 × 10⁶ km2/10 y on average as a result of increasing temperatures [28]. The stable snow cover duration during the winter in the Northern Hemisphere has steadily shrunk from 1967 to 2008, reducing by about 5.3 days/10yr [29]. From 1967 to 2012, the satellite data indicate that SCE has gradually decreased, and the reduction of snow cover reported by most stations has mainly occurred in spring [30]. In the Northern Hemisphere, the SCE decrease in March and April is about 1.6%/10 yr, and about 11.7%/10 y in June, respectively [27]. The SCE displays a downward trend in spring and an upward trend in fall with no obvious change trend in winter in the Northern Hemisphere during 2000–2015 [31]. Nevertheless, due to the limitation of the spatial and temporal resolution of current snow cover products and the complicated terrain, the features of snow phenology in the Eurasia have not been fully recorded. The MODIS snow product was previously employed and it was found that SCE in the Northern Hemisphere showed a decreasing trend; SCE decreased significantly in high-latitude and high-elevation mountainous regions, while the SCE at some middle and low latitudes shows an increasing trend [32]. However, Eurasia is the main region of snow cover distribution in the Northern Hemisphere. At present, it is very important to use high-resolution snow cover products to analyze the snow cover dynamics in this region to reveal the response of snow cover to climate change.
The study of snow cover and its phenology variations in the large part of Eurasia has a key impact on further revealing the interaction between snow cover and climate change. In view of the significance of seasonal snow cover changes, it is essential to quantify and comprehend the spatial and temporal variations characteristics of snow phenology. The chief aim here is to investigate the variations of snow phenology across the large part of Eurasia using a higher spatial resolution daily cloud-free snow product produced in this study. To achieve this goal, we used multisource remote sensing snow datasets from 2000 to 2016 in order to produce a set of higher resolution and more accurate snow cover products. Based on ground observations of snow cover, we verified this set of products, then quantified snow phenology changes. We calculated spatiotemporal variabilities of SCE, SCDs, snow cover onset day (SOD), snow cover ending day (SED), and snow cover duration days (SDDs) over the large part of Eurasia and analyzed temporal change of the snow cover area index (SCAI). We then elucidated the spatial distributions and trends of snow phenology characteristics and their relationships between geographic locations, to further reveal the response of snow cover to climate change.
2. Data and Methods
2.1. Study Area
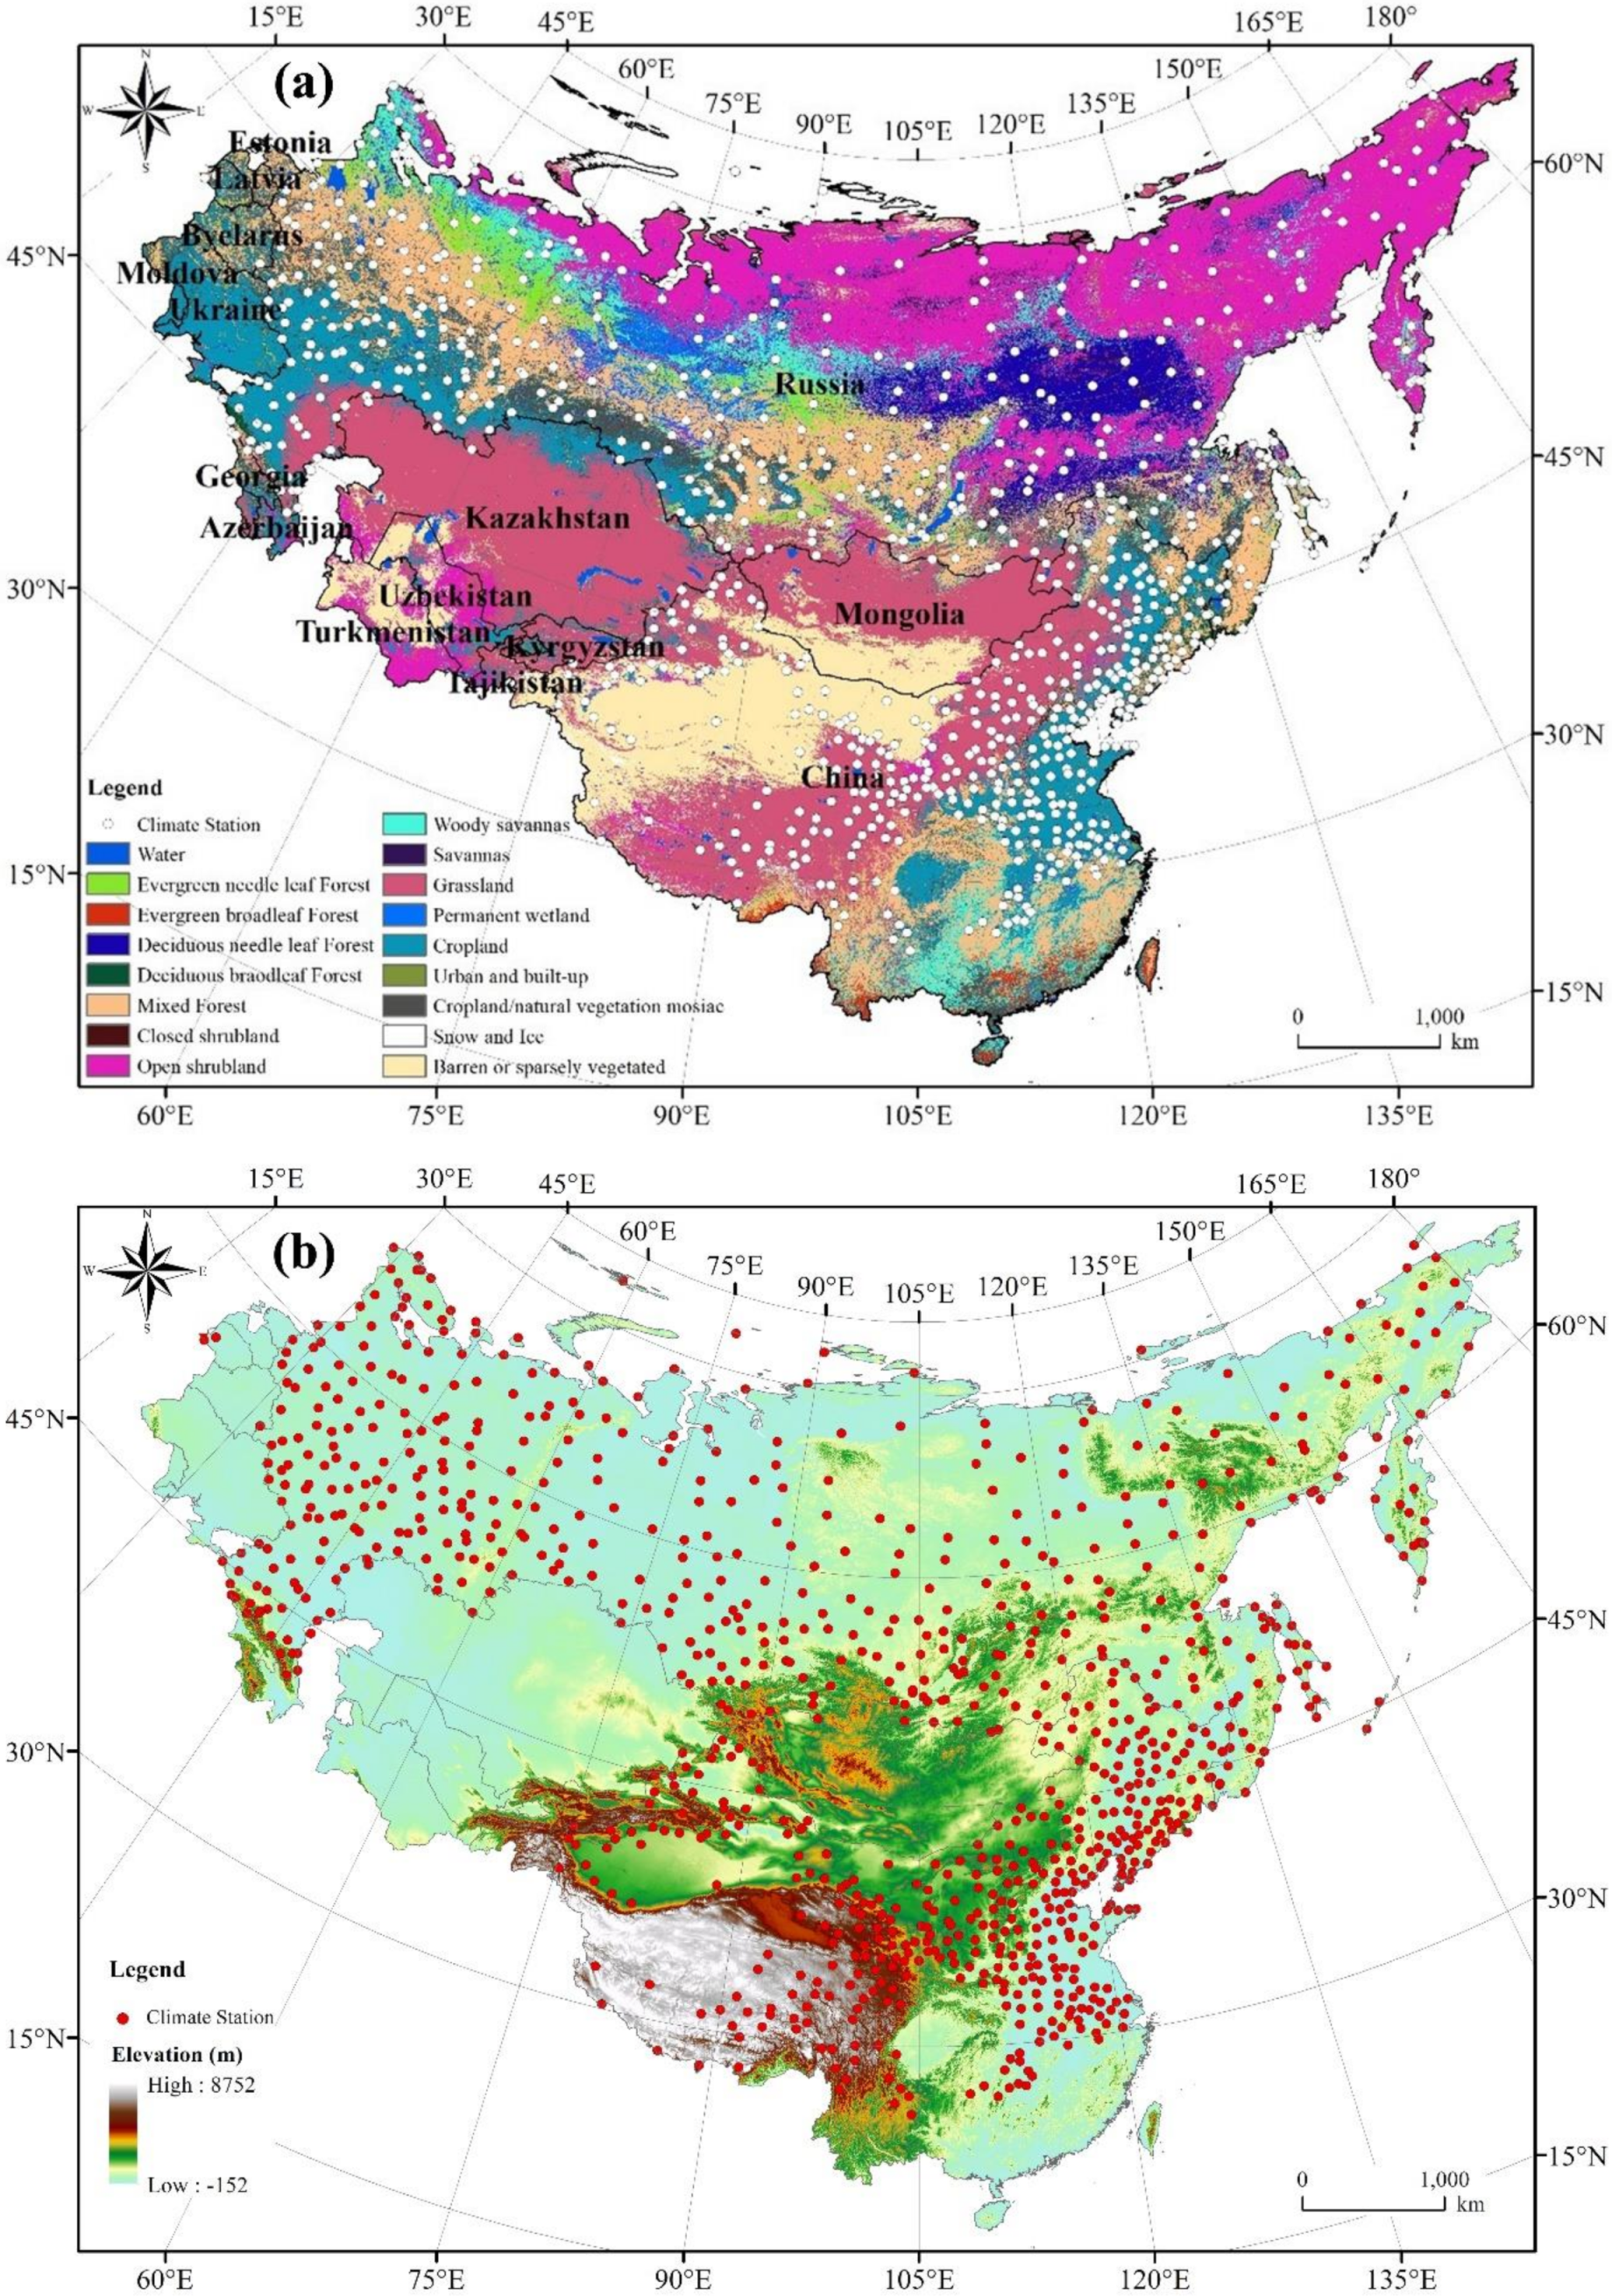
The study area is the large part of Eurasia that includes Russia, Mongolia, China, and some of the eastern European countries, with a total of 17 countries in Europe and Asia accounting for 61.3% of the total area of Eurasia. The land types include shrubland, forests, grasslands, farmland, bare land and other land cover units, with forest coverage exceeding 20%. The elevation ranges from −152 to 8752 m.a.s.l. (Figure 1). Because of the large latitudinal span, complex topography and undulation, the study region consists of complex and diverse climatic zones such as temperate monsoon climate, Mediterranean climate, highland climate, and high latitude cold climate.
2.2. Data
2.2.1. Snow Cover Products from Satellite Remote Sensing
Remote sensing products of snow cover adopted in this study include the following: a) MODIS daily snow cover products (MOD10A1 (https://nsidc.org/data/MOD10A1/versions/6) and MYD10A1 (https://nsidc.org/data/MYD10A1/versions/6)) [33]; threshold of 0.4 was used to process NDSI snow products into binary snow data [34]. b) AMSR-E/Aqua snow cover water equivalent (SWE) product (https://nsidc.org/data/AE_DySno/versions/2) [35], and c) IMS product (https://nsidc.org/data/G02156/versions/1). Detailed information about the above remote sensing data are listed in Table 1.
The MODIS daily snow product is originally in the hierarchical data format with a spatial resolution of 500 m and a sinusoidal map projection [36]. The original format of AMSR-E/Aqua daily SWE product data is HDF-EOS, with a spatial resolution of 25 km, and the projection format is EASE-Grid_north, covering the entire Northern Hemisphere [35]. The IMS product adopts a zenithal projection with the North Pole as the center point. The IMS data is in ASCII format with a resolution of 24 km from January 1, 2000 to September 1, 2002; tag image file format (TIFF) data with a resolution of 4 km from September 4, 2011 to December 1, 2014; and TIFF data with a resolution of 1 km from December 2, 2014 to December 31, 2016 (Table 1) [37]. All the remote sensing data were reprojected into Albers equal area projection with the ellipsoid WGS-84 and resampled to 500 m resolution using the nearest neighbor method to match the MODIS snow products.
2.2.2. Data from Ground Observations
Snow depth (SD) data were obtained from 1393 ground observations stations across the study area. The data from 743 sites distributed across China are from the National Meteorological Information Center of the China Meteorological Administration (http://data.cma.cn). In the former Soviet Union (FSU), the data from 599 sites are from the Russia Research Institute of Hydrographic Information-World Data Centre (RIHMI-WDCA) (http://www.wdcb.ru/) and 283 sites are from Nation Snow and Ice Data Center (NSIDC) (https://nsidc.org/). Snow depth of ground observations is measured manually using the same method across Eurasia. This entails using a graduated stake installed at a fixed-point location at the station or a wooden ruler to measure the snow depth once a day. Snow depth measurements of the former Soviet Union and China are identical. The snow depth is measured when it meets the measurements standard of snow depth. The snow depth measurements standard refers to condition that the snow depth should be observed when the ground in the field of view around the meteorological station is covered by more than half in snow (including snow grains, graupel and ice grains). Snow depth is measured with a snow ruler at 8 o’clock every day when the snow depth measurements standard is reached. The measurements are made thrice and the distance between the three measurements is more than 10 m. The measured value is accurate to 0.1 cm. The final snow depth at each station was determined as the average of the three measurements. If the snow depth measurements standard is not reached at 8 o’clock, make supplementary measurements at 2 p.m. or 8 p.m. in the same way when the measurement standard is reached due to snowfall. An average snow depth of less than 0.5 cm is recorded as 0 [38]. Although the time span of SD data in China and the other countries are different, both of them have complete observations during the period of 2000 to 2012. Therefore, SD ground observations from 2000 to 2012 were used when evaluating the accuracy of the daily cloud-free snow cover product produced in our study and compared with snow phenology parameters obtained from the snow cover product.
3. Methodology
3.1. Daily Cloud-Free Snow Cover Product
Recently, cloud removal from MODIS daily snow cover products has been a research hotspot for many researchers, and several algorithms related to it have been developed [39,40,41]. Based on previous cloud removal algorithms, three maturing algorithms were adopted in this study to eliminate the cloud contamination of daily MODIS snow cover products. The cloud removal algorithms include four steps, which are described as follows:
- (a)
- Daily synthesis of MOD10A1 and MYD10A1: Since the difference of imaging time between MOD10A1 and MYD10A1 is about 3 h and clouds will move during this period, the two products can be synthesized to remove cloud pixels. For two pixels at the same location on the same day, if one pixel represents cloud but the other one is snow or no snow, then we replaced the cloud pixel with snow or no snow. If two pixels are both recorded as cloud, then we kept the cloud pixel.
- (b)
- Adjacent day fusion: The snow cover will last several days on the ground. By comparing adjacent images, if a pixel is classified as “snow” or “no snow” on the previous day and next day, then the pixel of image on the current day can be classified as “snow” or “no snow”. If the classification of the previous and the next day of a pixel is inconsistent, that is, the previous day is classified as “snow”, and the next day is classified as “no snow”, or vice versa, then the image of the current day remains as cloud pixel.
- (c)
- Multiple snow products fusion: Using the above steps, a large portion of the cloud pixels are eliminated. Then the AMSR-E SWE and IMS products are used to eliminate the remaining cloud cover. For each day’s images, if a pixel in the AMSR-E SWE product shows SWE greater than 0, and IMS is snow, then the remaining cloud pixel is classified as snow; if SWE is greater than 0, but IMS is snow free, then the fusion product pixel is classified as snow free; if SWE is 0, then the cloud pixel is determined to be snow free.
- (d)
- Date gap filled: The correction method is similar as the AMSR-E correction, but is used to fill the date gap after AMSR-E data stopped on September 2, 2011. To ensure the daily snow product integrity, the data before the MOD10A1 data release was also filled in by IMS resampling data, supplemented by January 1, 2000 to February 23, 2000.
3.2. Validation
The SD ground observations of 1393 meteorological stations are used to assess the accuracy of the daily cloud-free remote sensing snow cover product. According to the observation standard, the ground observed SD were divided into two categories: ground with snow cover (SD > 1 cm) and no snow cover (SD < 1 cm), which is to make the validation results consistent throughout the whole study area. By comparing ground observations with daily bare ground and remote sensing snow cover data, the total classification accuracy (TA), snow accuracy (SA) and snow-free accuracy (SFA) were calculated using the following equations:
where SCT represents the number of corresponding points in which snow is observed both on ground and in remote sensing images; SFF represents the number of points in which snow is not observed on the ground but is detected on images; SCF represents the number of points in which snow is observed on the ground but is not detected on images; and SFT represents the number of points in which snow is not observed either on the ground or in images. In sum, the greater value of TA, SA and SFA, the higher the credibility of the remote sensing SCE products.
3.3. Snow-Covered Area Index (SCAI)
The quantitative variation of overall snow cover conditions is indicated by the SCAI [42]. The SCAI is a measure which combines SCDs and snow-covered area during winter months. It is the accumulation of the snow-covered area over the snow cover season. The SCAI (km2 × day) in a hydrological year is defined as
where A is the area of a pixel (in km2; for MODIS, it is 0.25 km2); SCDi is the value (days) of SCD at pixel i within a snow cover year; and N is the total number of pixels on a MODIS image.
3.4. Snow Cover Parameters
Three snow cover parameters, SCE, SCAI, SCDs, and three snow phenology parameters: snow onset date (SOD), snow end date (SED), snow duration days (SDDs), were used to analyze the snow cover changes over study area during 2000–2016. To mitigate the impact of ephemeral snow cover and errors in snow cover product, the SOD is defined as the first date of the first five continuous days in a snow accumulation period. The SED is defined as the last date of the last five continuous days in a snowmelt period. The SDDs are defined as the number of days between SOD and SED. The SCDs are the total number of days that are characterized by snow-covered ground throughout a hydrological year. It should be noted that because the SCDs include ephemeral snow cover events, they may be longer than SDDs. Because in some parts of the study areas, especially the Tibetan Plateau, although there is much snowfall in winter, the snow melts quickly (usually within 1–3 days) due to the high radiation intensity, resulting in a very short duration of snow cover on the ground. In order to more comprehensively and objectively reflect the snow cover changes in the study area, the SCDs are analyzed separately.
3.5. Trend Analysis
To study trends of snow cover, SOD, SDDs, SED and SCDs are analyzed for the period from 2000 to 2016. The Slope is adopted to analyze the interannual variability of these four snow cover parameters over the 17-year time period by using the linear regression method [43],
where i is the serial number from 1 to 17 for the years from 2000 to 2016, respectively; SPi, jk is the day of a year for SOD and SED, and the number of days for SDDs and SCDs in the pixel in the jth row and kth column of the snow cover image for the ith year, and n is the number of years. For the above parameters, when Slope = 0, there is no increasing or decreasing tendency; when Slope < 0, the trend is negative; and when Slope > 0, the trend is positive, and the significance levels (P) of the F-tests are presented.
4. Results
4.1. Snow Cover Product Validation
The overall total accuracy of the produced daily cloud-free snow cover product for the large part of Eurasia is 90.8% (Figure 2a), the snow classification accuracy is 71.0% (Figure 2b), and the snow-free classification is 94.6% during the period of 2000 to 2012 (Figure 2c). Figure 2b indicates the sites with the worst snow classification errors are predominantly distributed in southern China, Azerbaijan, Turkmenistan, and the Tibetan plateau. Combined with Figure 2d, the snow-covered days in these areas are few; most of the sites have fewer than 20 snow-covered days. Compared to other areas, there is less snowfall in southern China which when coupled with high temperatures leads to the snow melting quickly in winter. The Azerbaijan and Turkmenistan are areas of extreme drought which also has little snowfall. The observation time difference between satellites and sites, coupled with quickly melting snow cause larger snow classification errors in produced snow cover products in this study. Despite the high elevations and lower temperatures of the Tibetan Plateau, strong solar radiation also causes the snow to melt quickly. This coupled with seriously fragmental of snow cover distribution, cause large snow classification errors on the Tibetan Plateau [41]. On the other hand, in those stable snow cover areas where snow-covered days are greater than 60 d, the snow agreement at most sites is greater than 80%, which indicates that these areas are also the typical snow cover areas that have ideal accuracy. Therefore, the daily cloud-free product synthesized in this study has reliable accuracy and can be used for analysis.
4.2. Spatiotemporal Dynamics of SCE
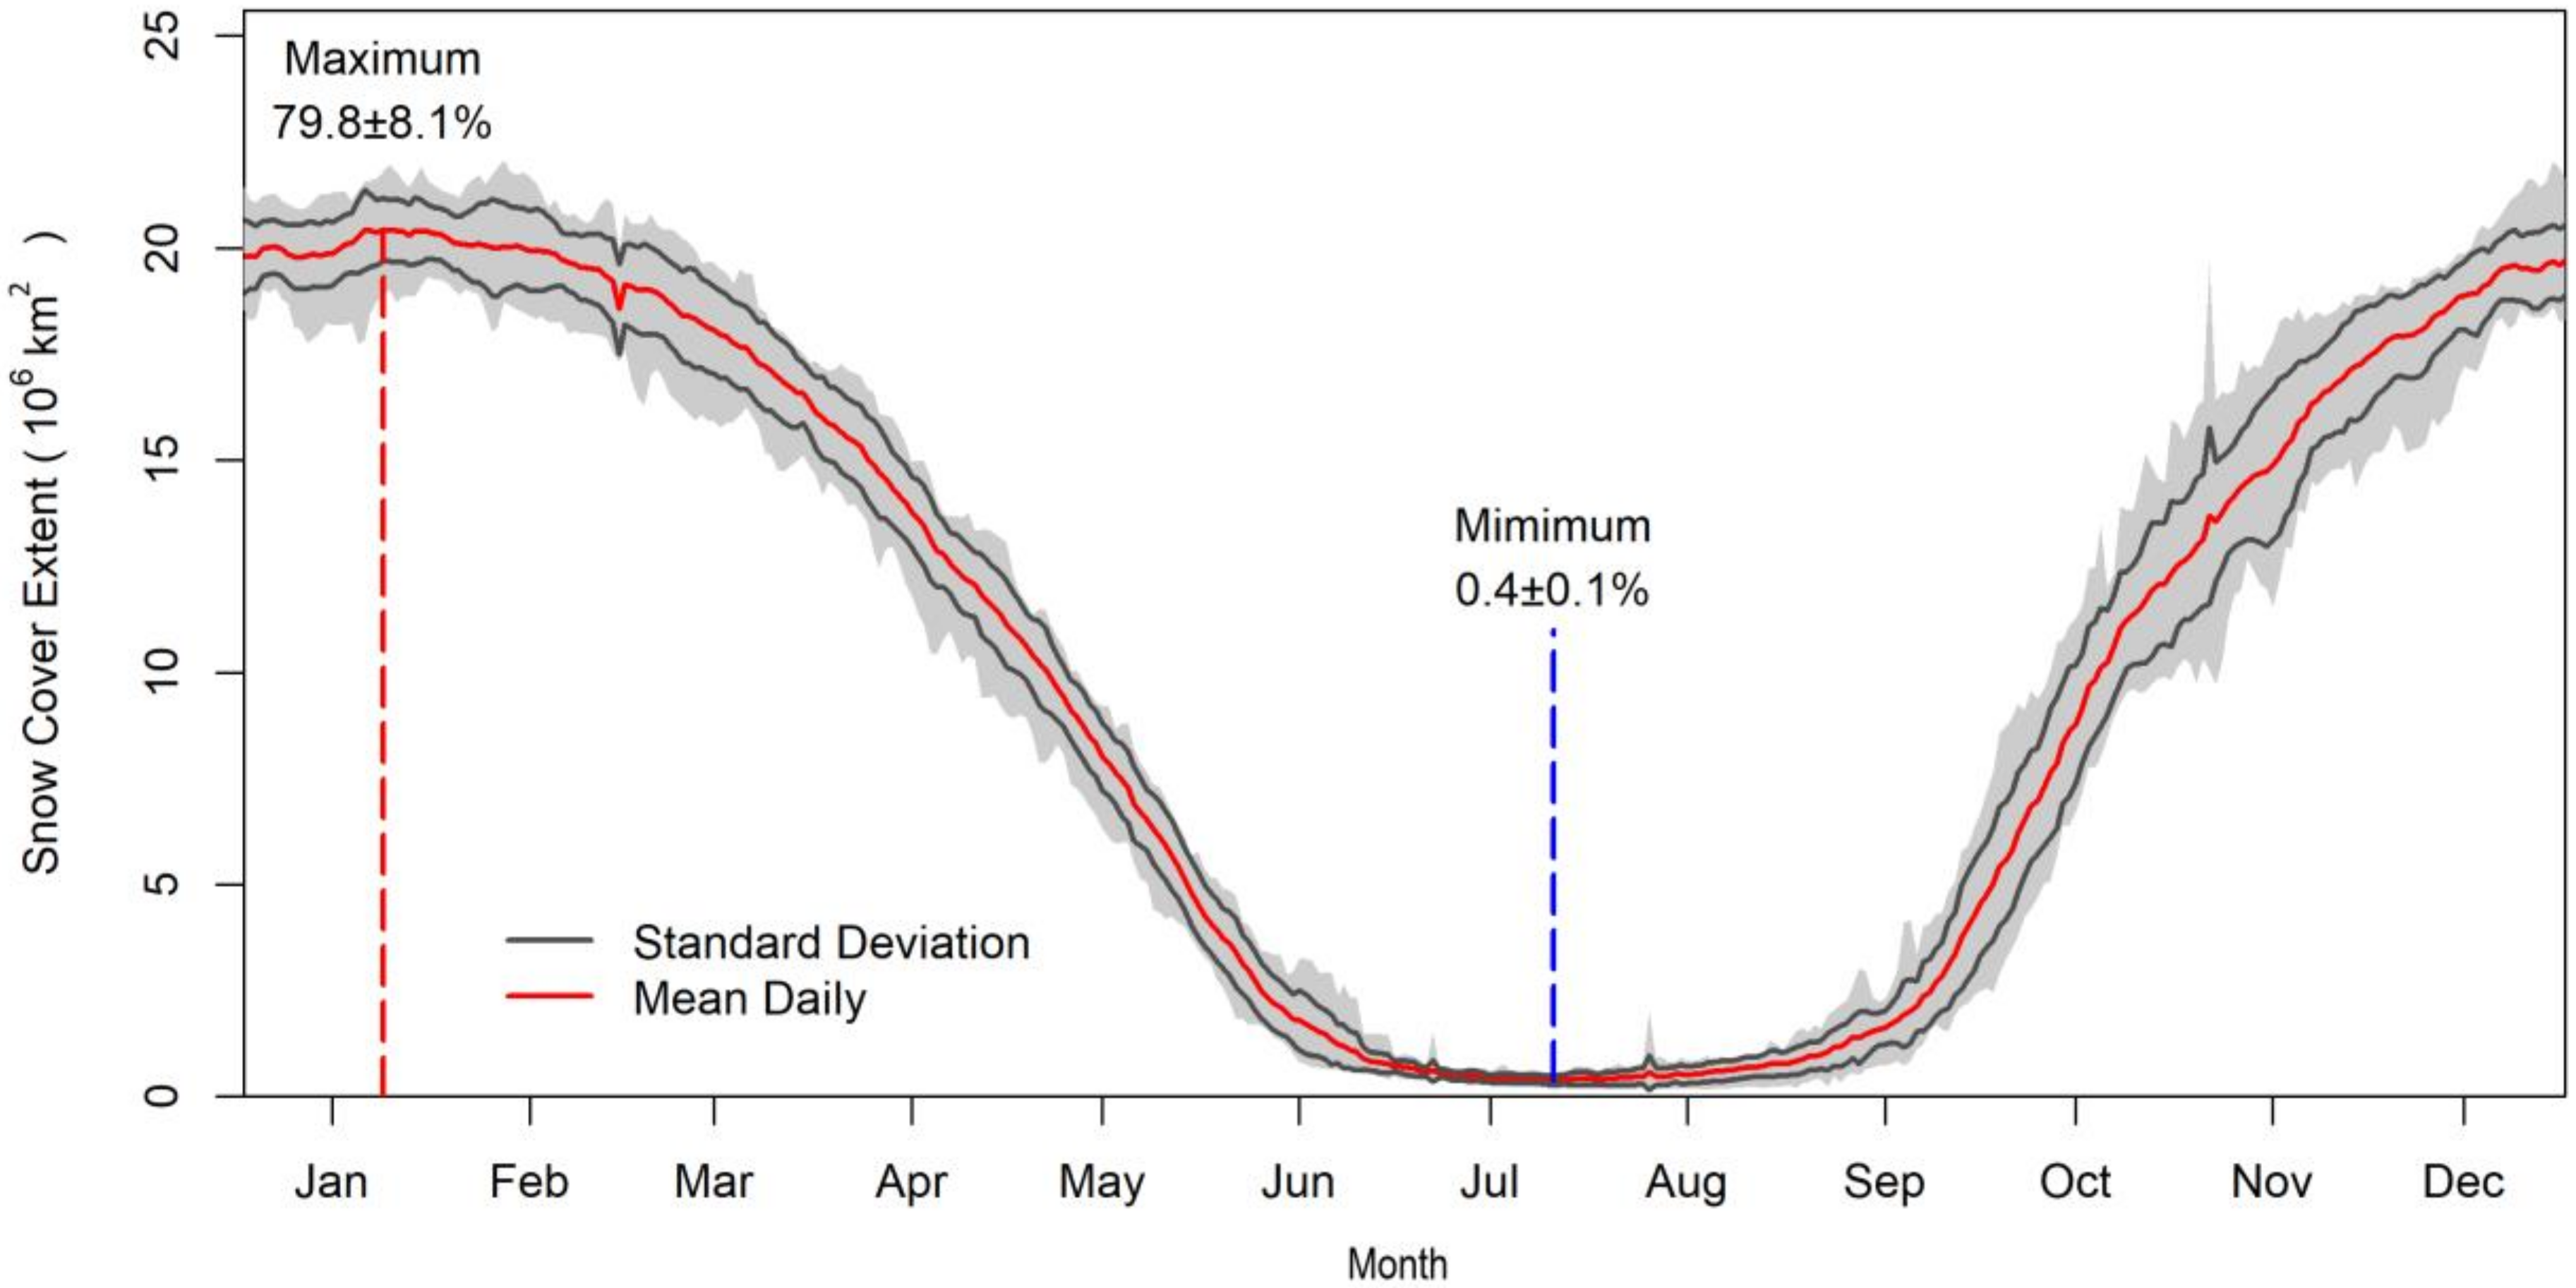
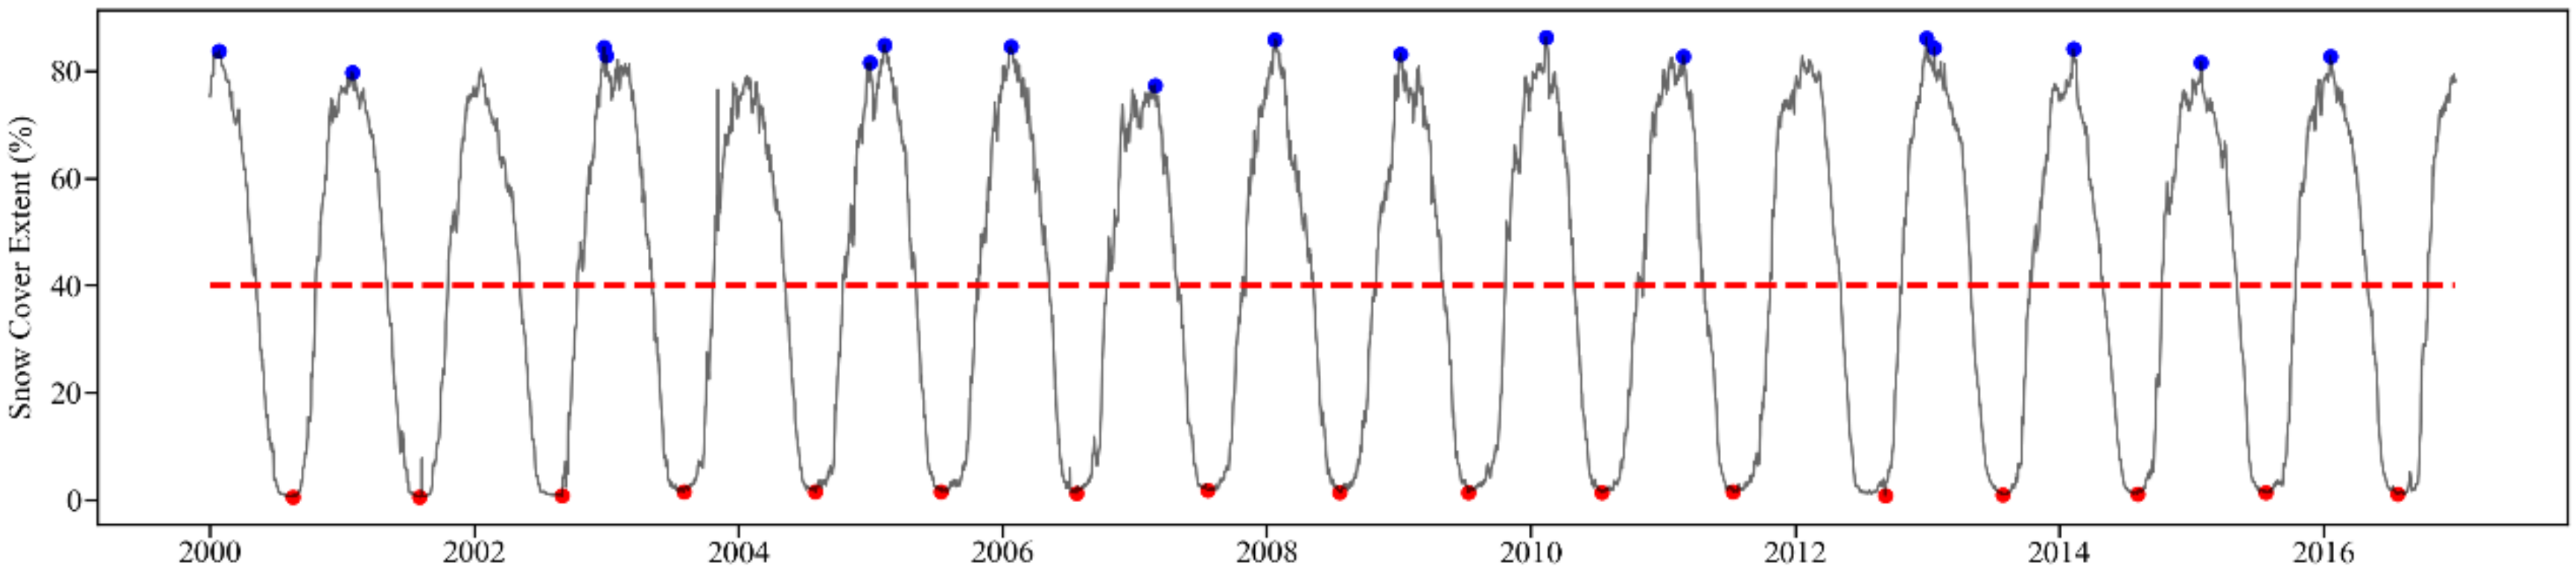
On the basis of the daily cloud-free snow cover product, the SCE dynamics from 2000 to 2016 were analyzed. Snow accumulation in the large part of Eurasia begins in late September and reaches its maximum in early January, with an average maximum SCE of 27.08 × 10⁶ km2 (79.8% of study area) during the period of 2000–2016. The snowmelt season begins at the end of February and lasts until the end of May, reaching a minimum in early July, with an average minimum SCE of 0.14 × 10⁶ km2 (0.4% of study area) (Figure 3).
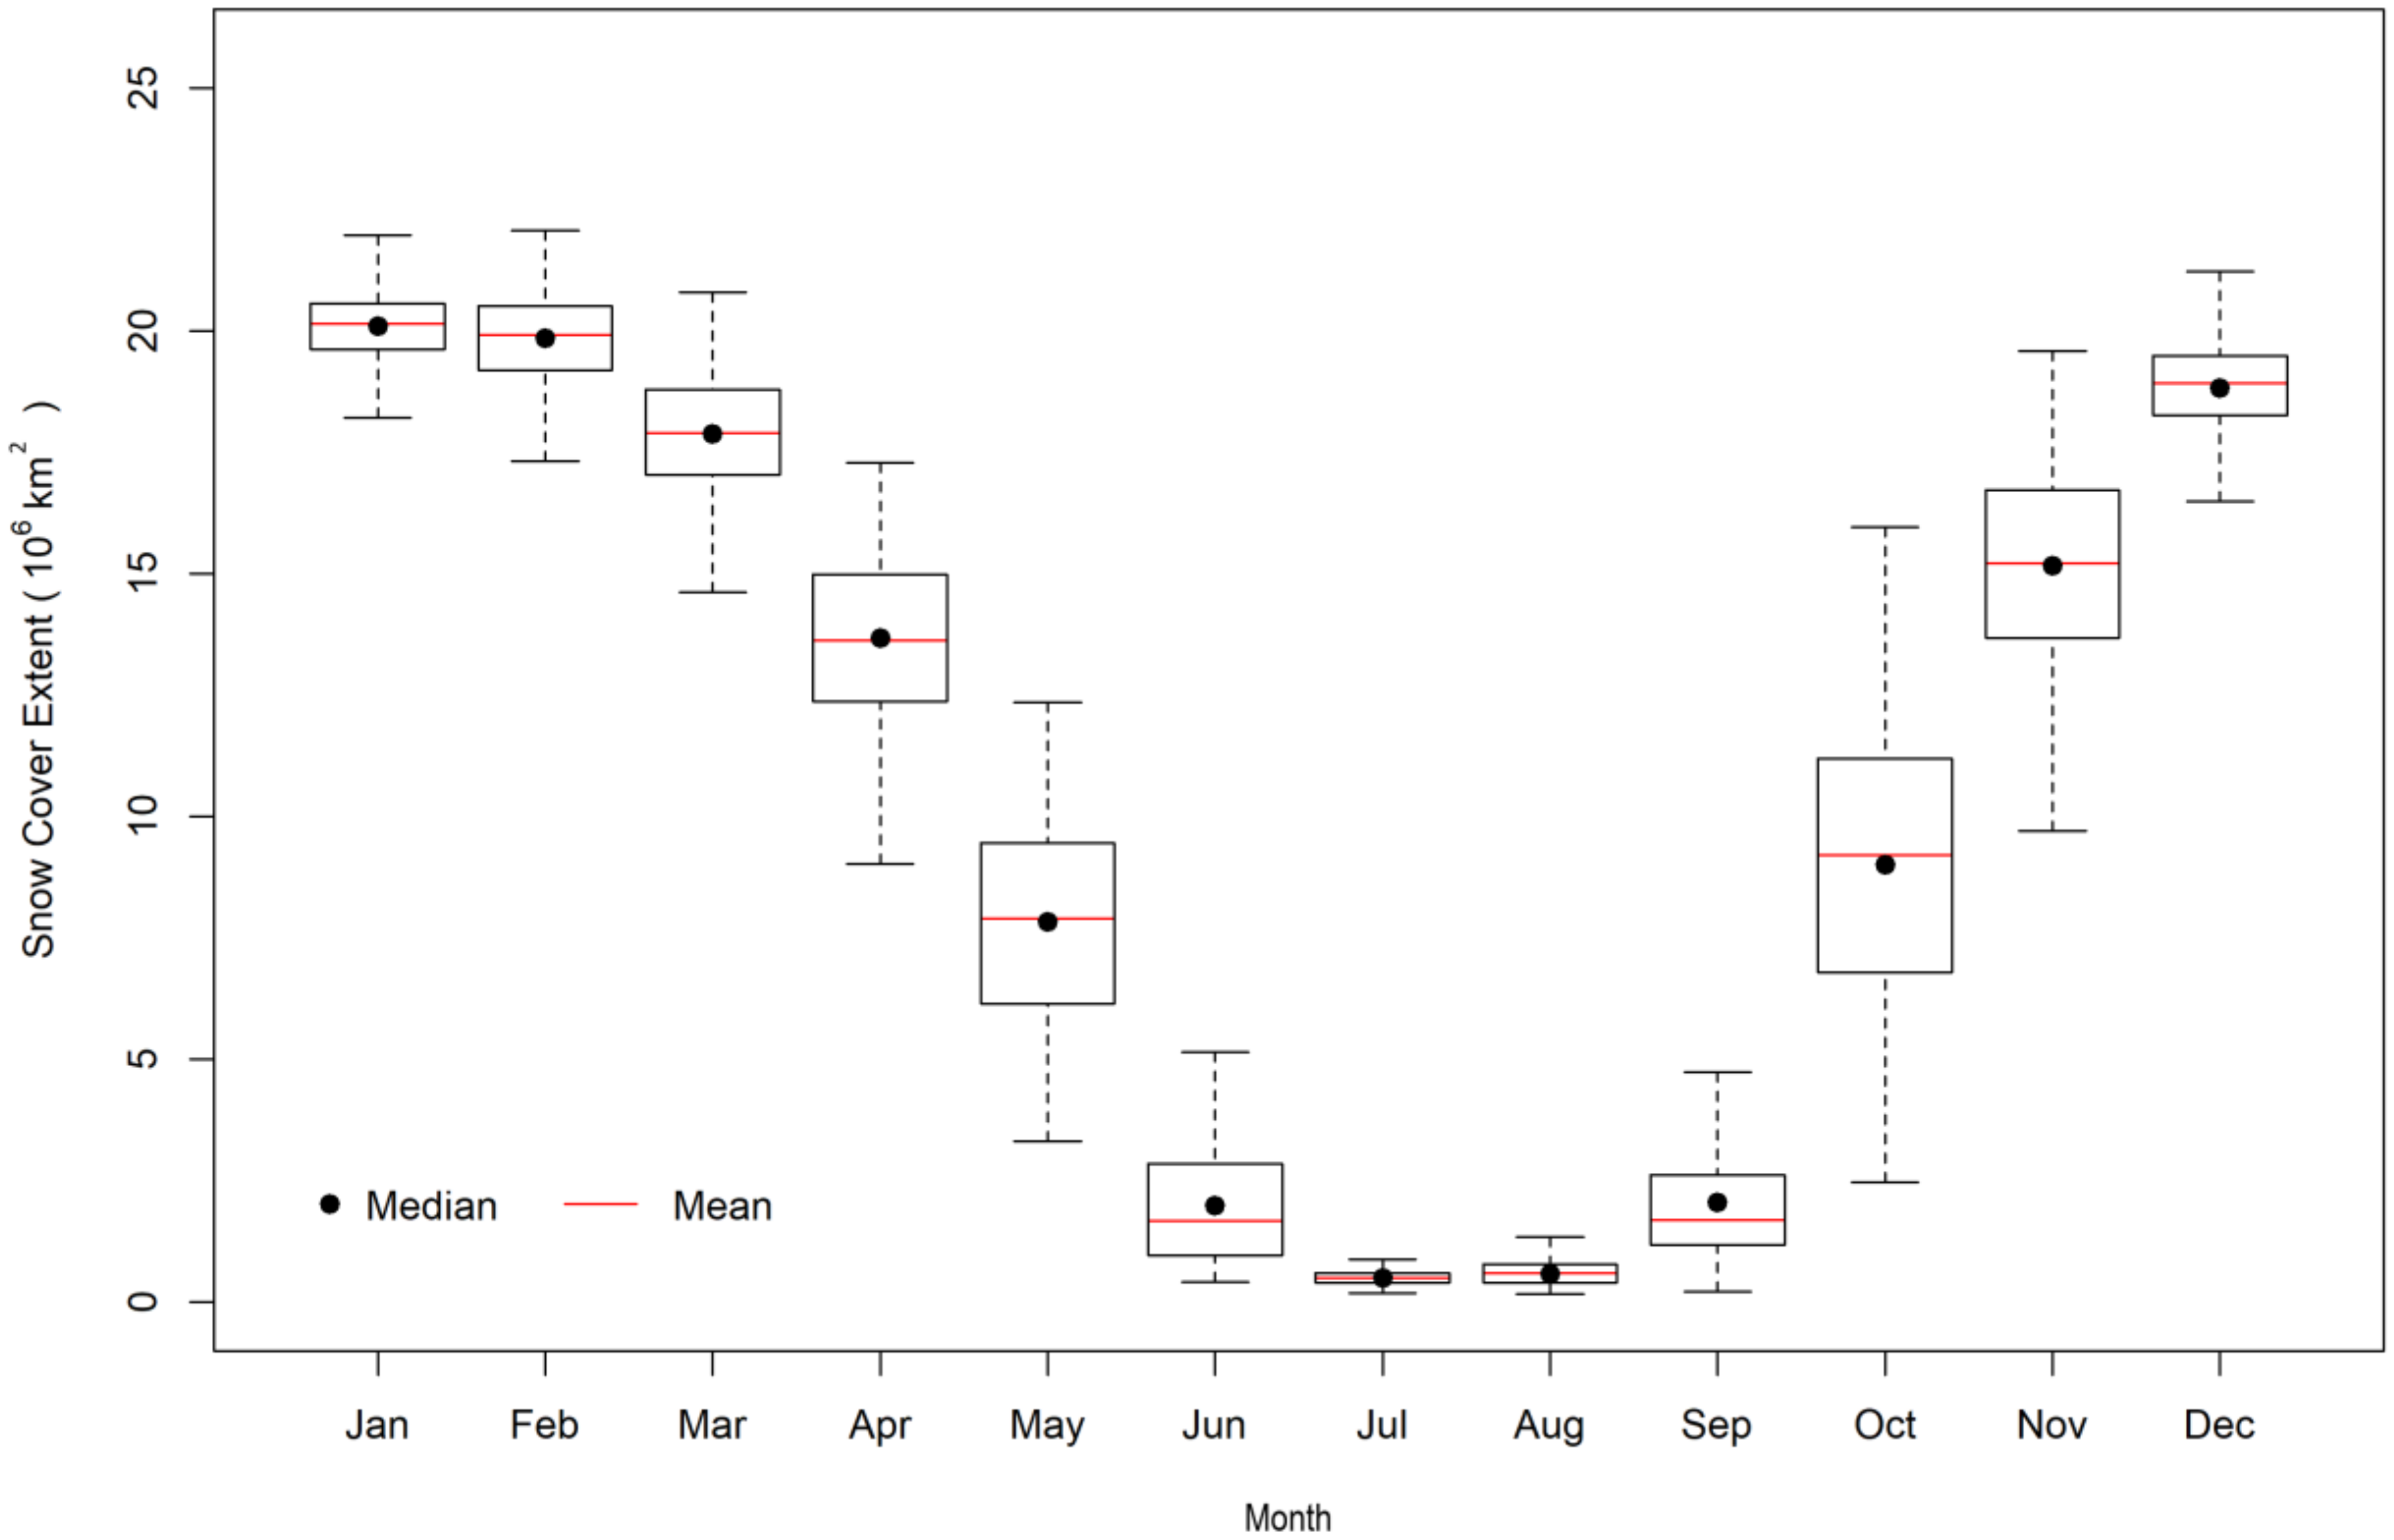
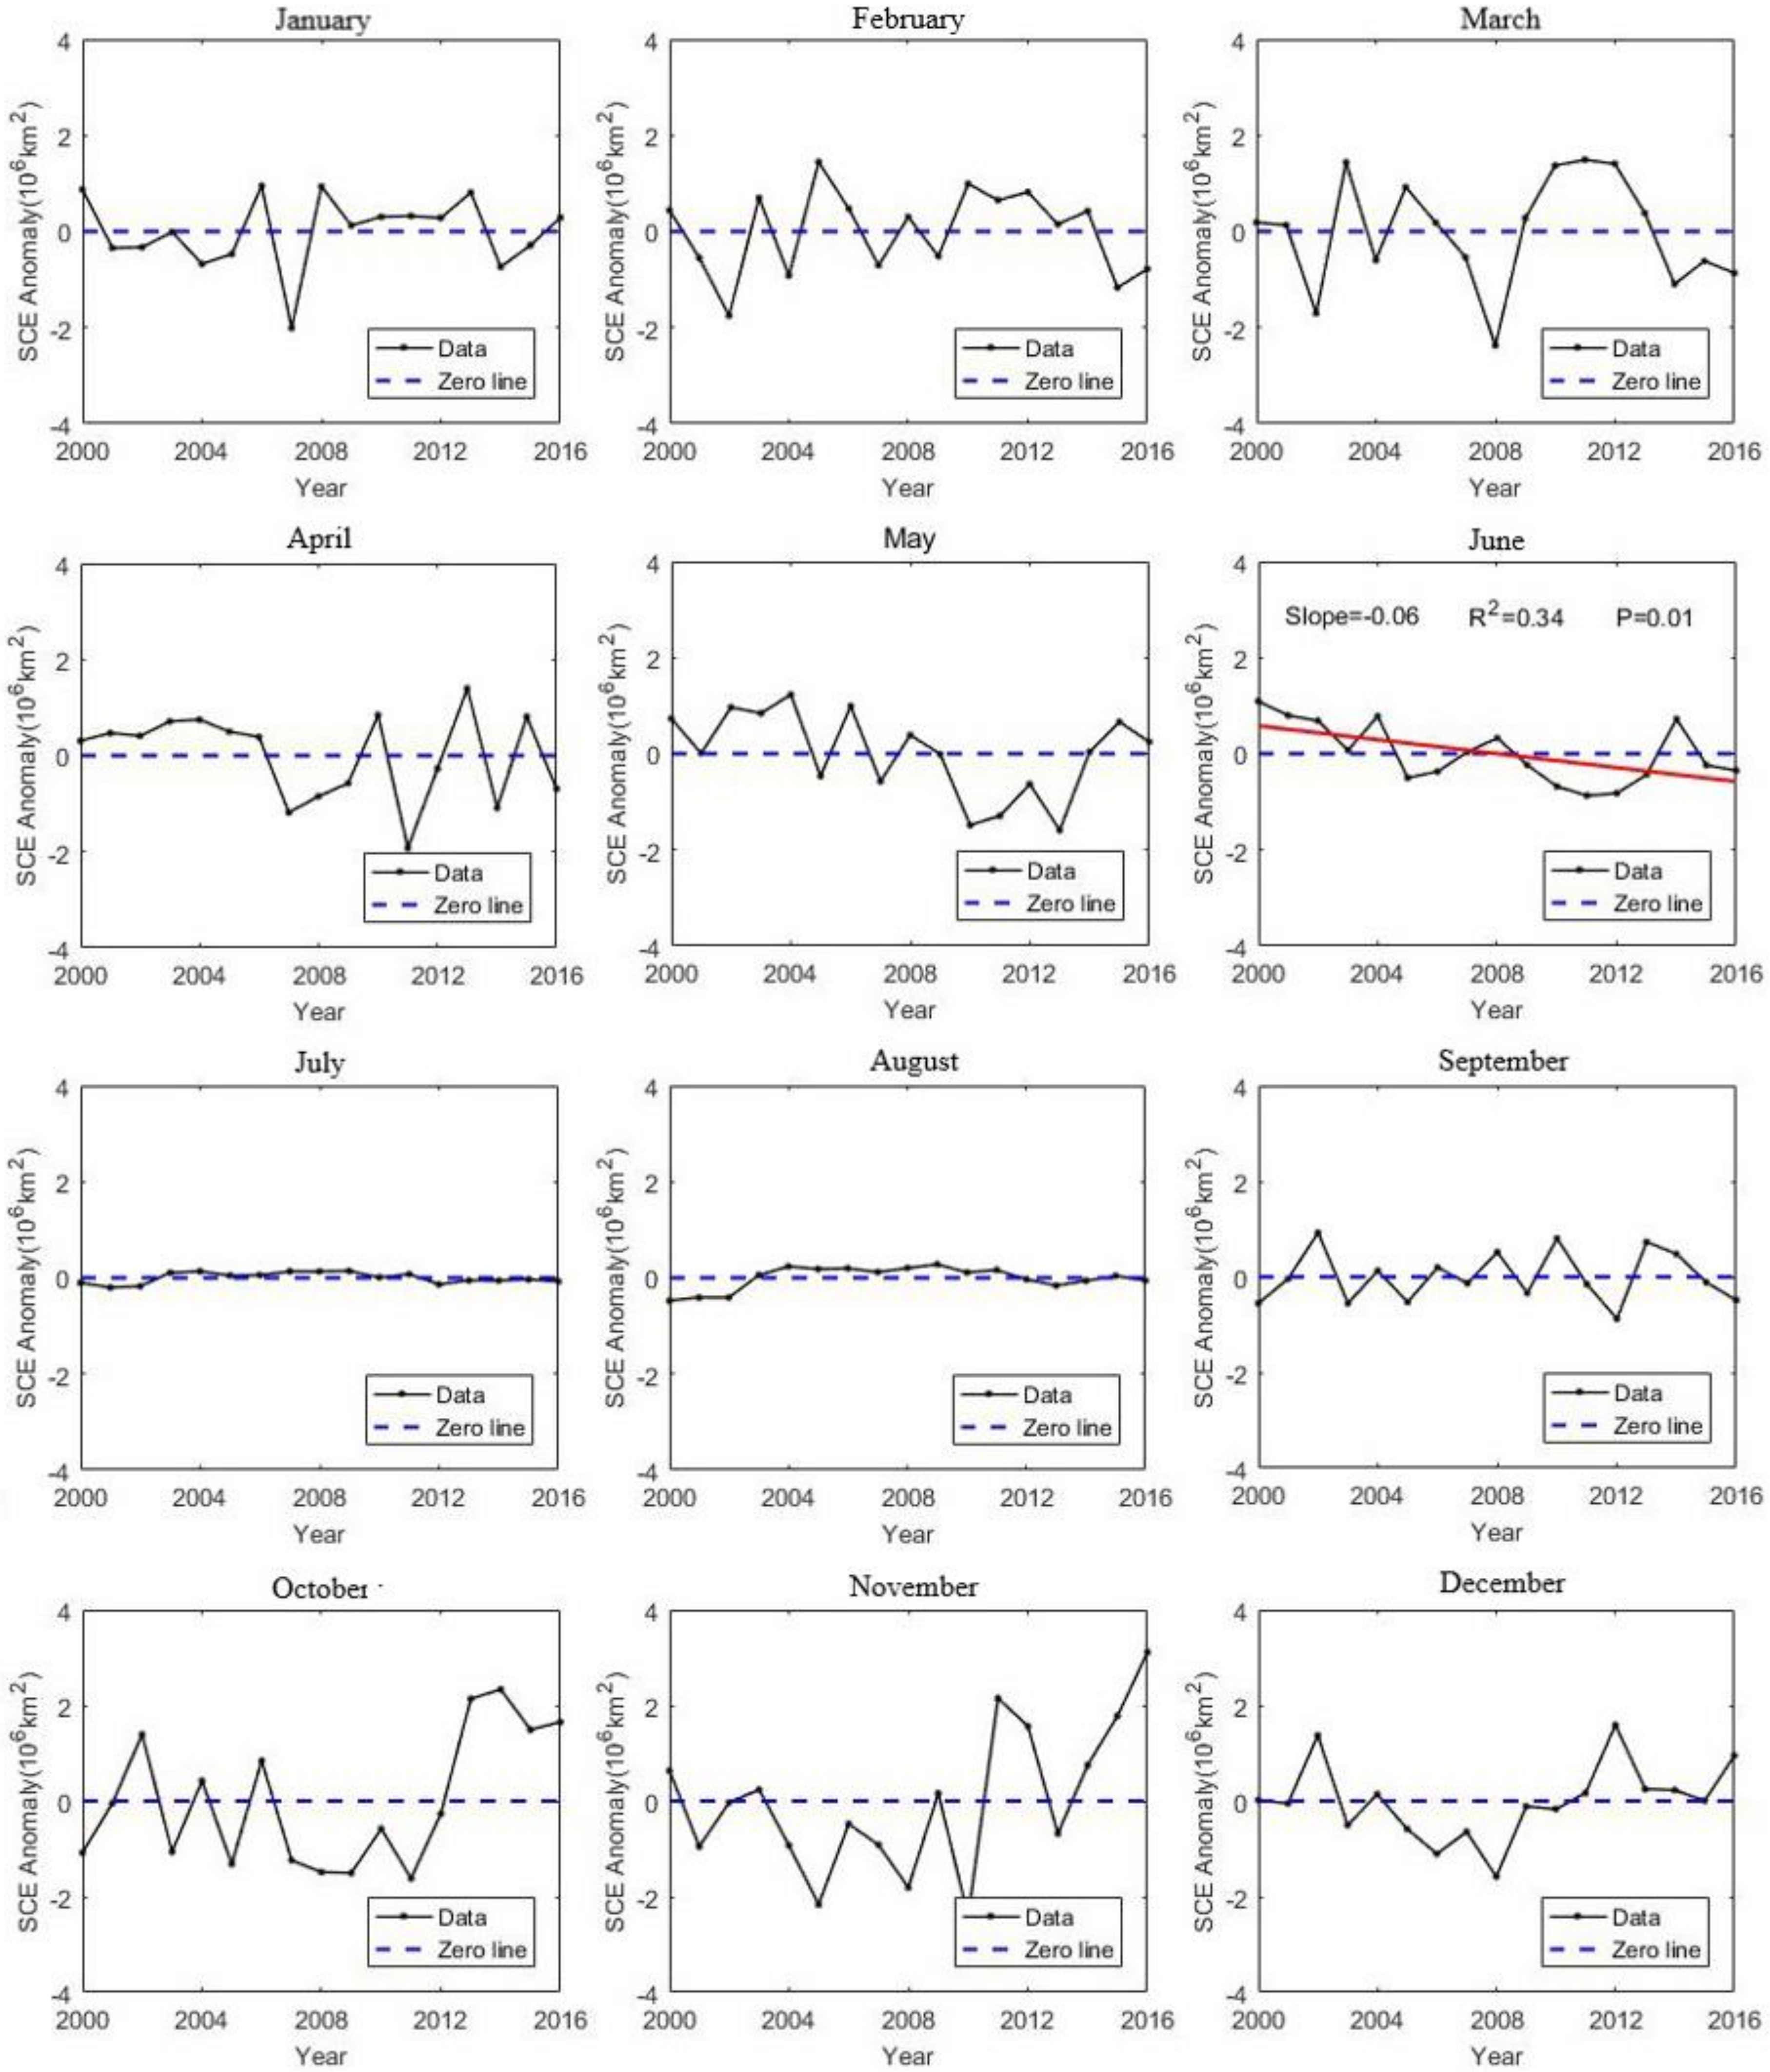
Figure 4 indicates the monthly variation of SCE from 2000 to 2016. In winter (from December to February of the following year), the SCE variation is small and relatively stable. On the contrary, it is relatively large during the period of the early stage of the snow accumulation (from September to November) and during the melting season (from March to May). Figure 5 shows that the monthly variations of SCE from 2000 to 2016 are different. The inter-annual change of SCE in summer (from June to August) is relatively small, but SCE decreases significantly in June with a rate of 0.06 × 10⁶ km2/yr. The results are consistent with the conclusions of IPCC report [27], that is, the overall snow cover in the Northern Hemisphere is decreased, while the decreasing tendency of snow cover in spring is the most significant. The average monthly snow cover from October to December shows an increasing trend from 2000 to 2016, especially from 2011 to 2016. Overall, there is no obvious increasing or decreasing tendency as shown in (Figure 6).
4.3. Temporal Dynamics of SCAI
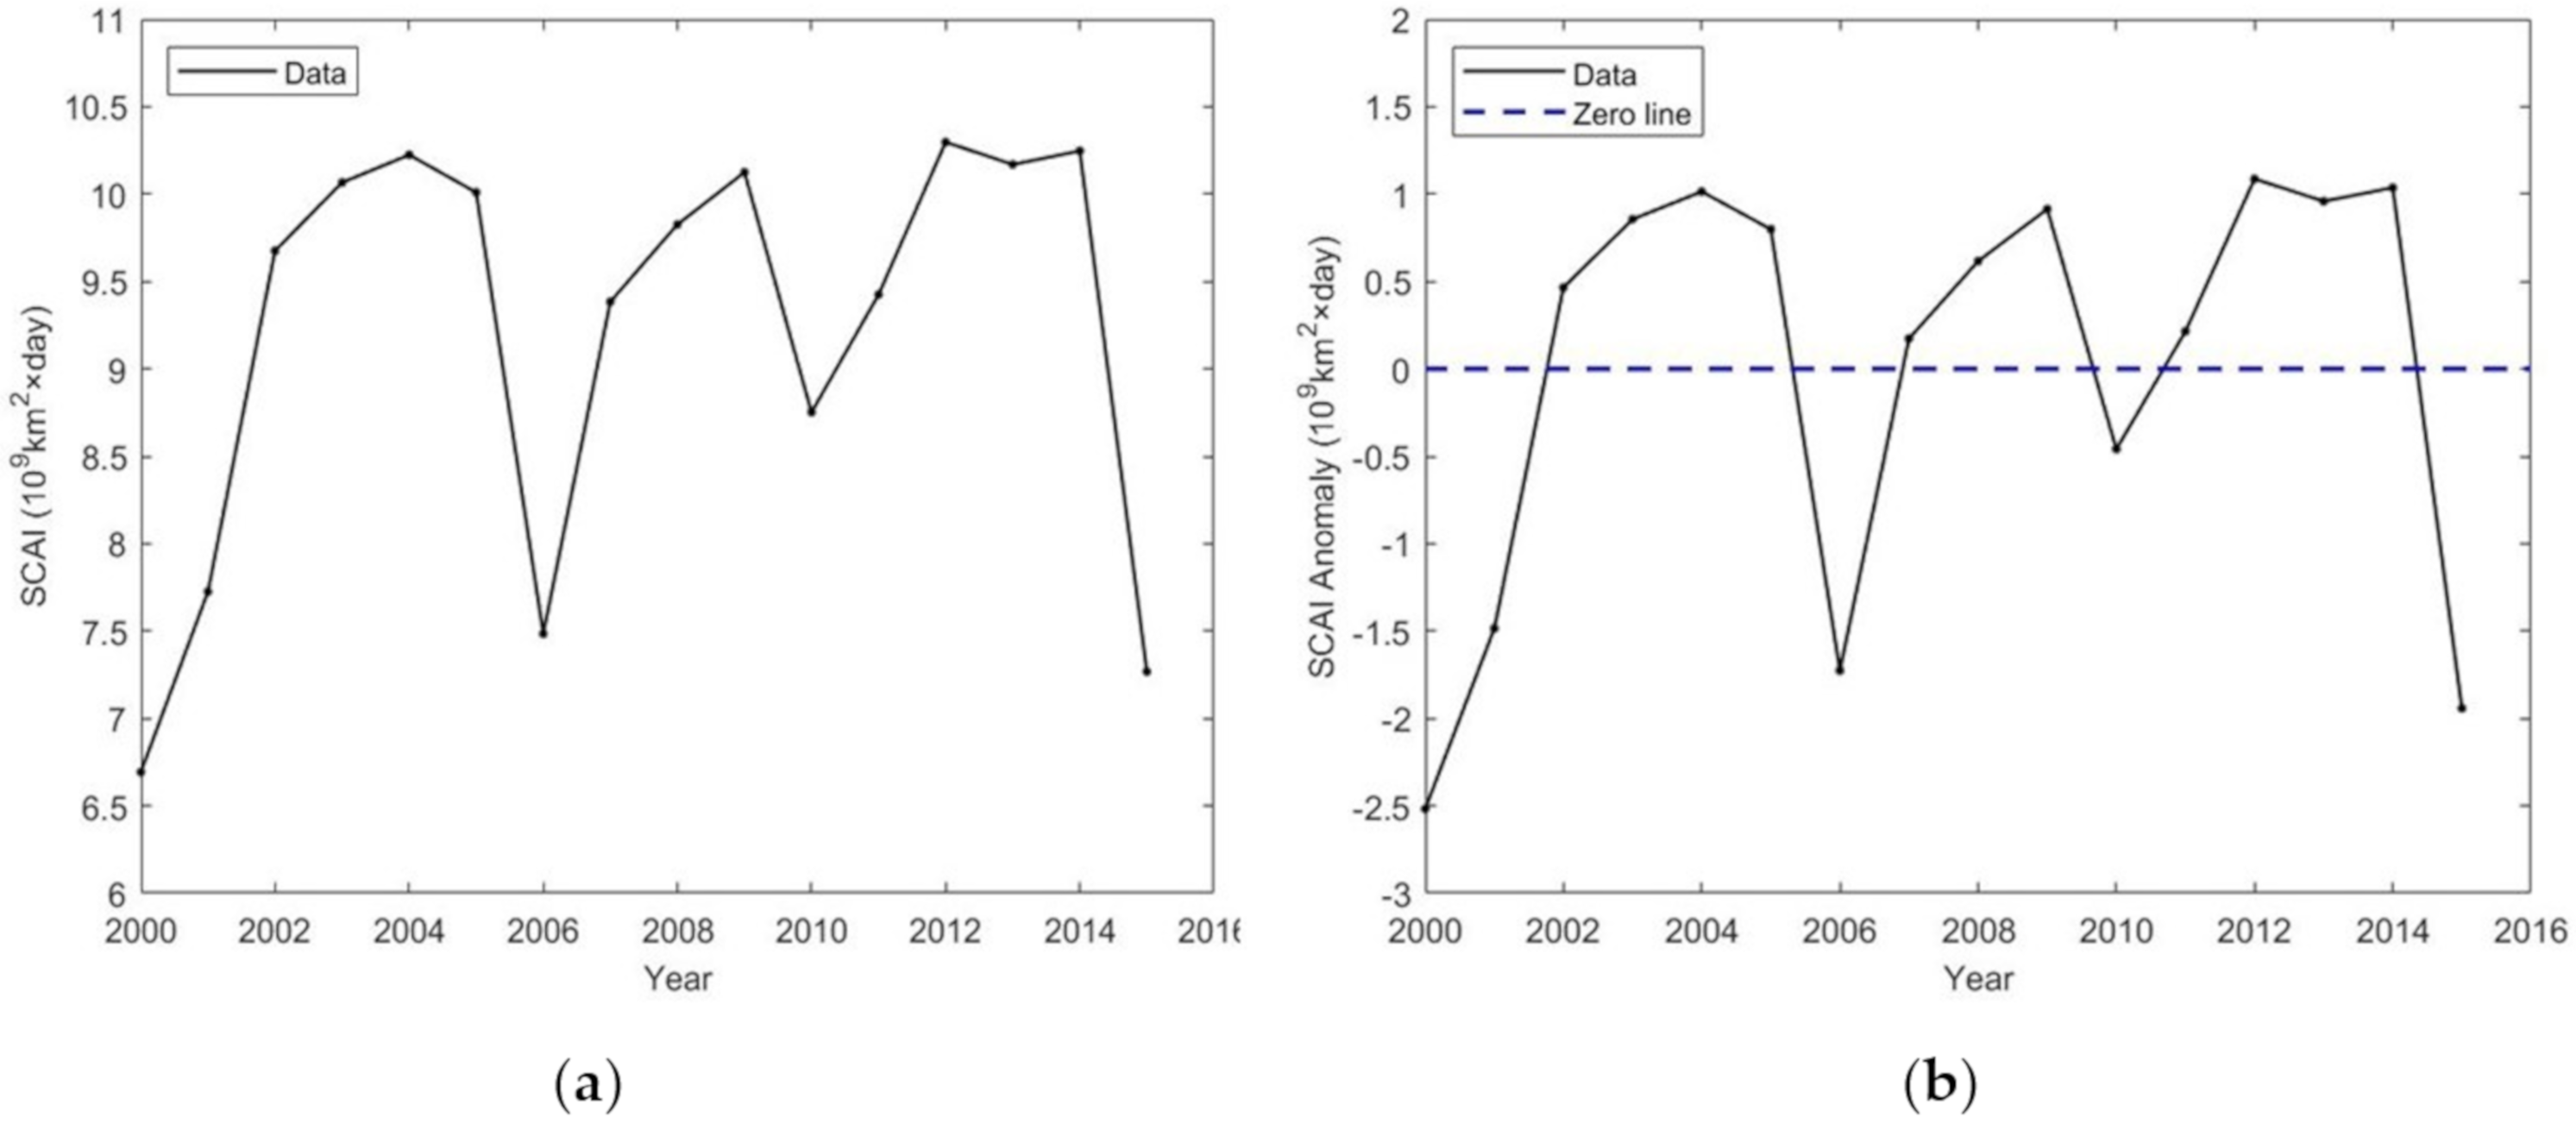
The SCAI value (km2 × day), one single number per hydrological year, contains both snow cover duration and extent and is ideally used to examine the inter-seasonal or annual variation of the snow cover situation. Figure 7 shows the SCAI variation between 2000 and 2016 in the study area. The SCAI increases sharply from 6.7 × 10⁹ km2 × day in 2001 to 10.2 × 10⁹ km2 × day in 2004. In 2006, it drops to 7.7 × 10⁹ km2 × day. From 2006 to 2015, SCAI shows a trend of rising volatility, and the trend is relatively stable. The SCAI then experiences another sharp decrease from about 10.3 × 10⁹ km2 × day in 2015 to about 7.4 × 10⁹ km2 × day in 2016 (Figure 7a). On the whole, there is a weak upward trend with fluctuation (−2.51 × 10⁹ to 1.08 × 10⁹ km2 × day) from 2000 to 2016 (Figure 7b), which indicates the snow cover duration and extent experienced interannual fluctuation.
4.4. SCDs Dynamics
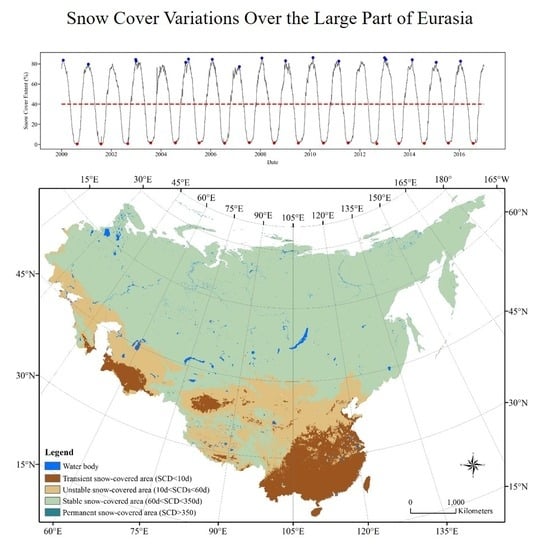
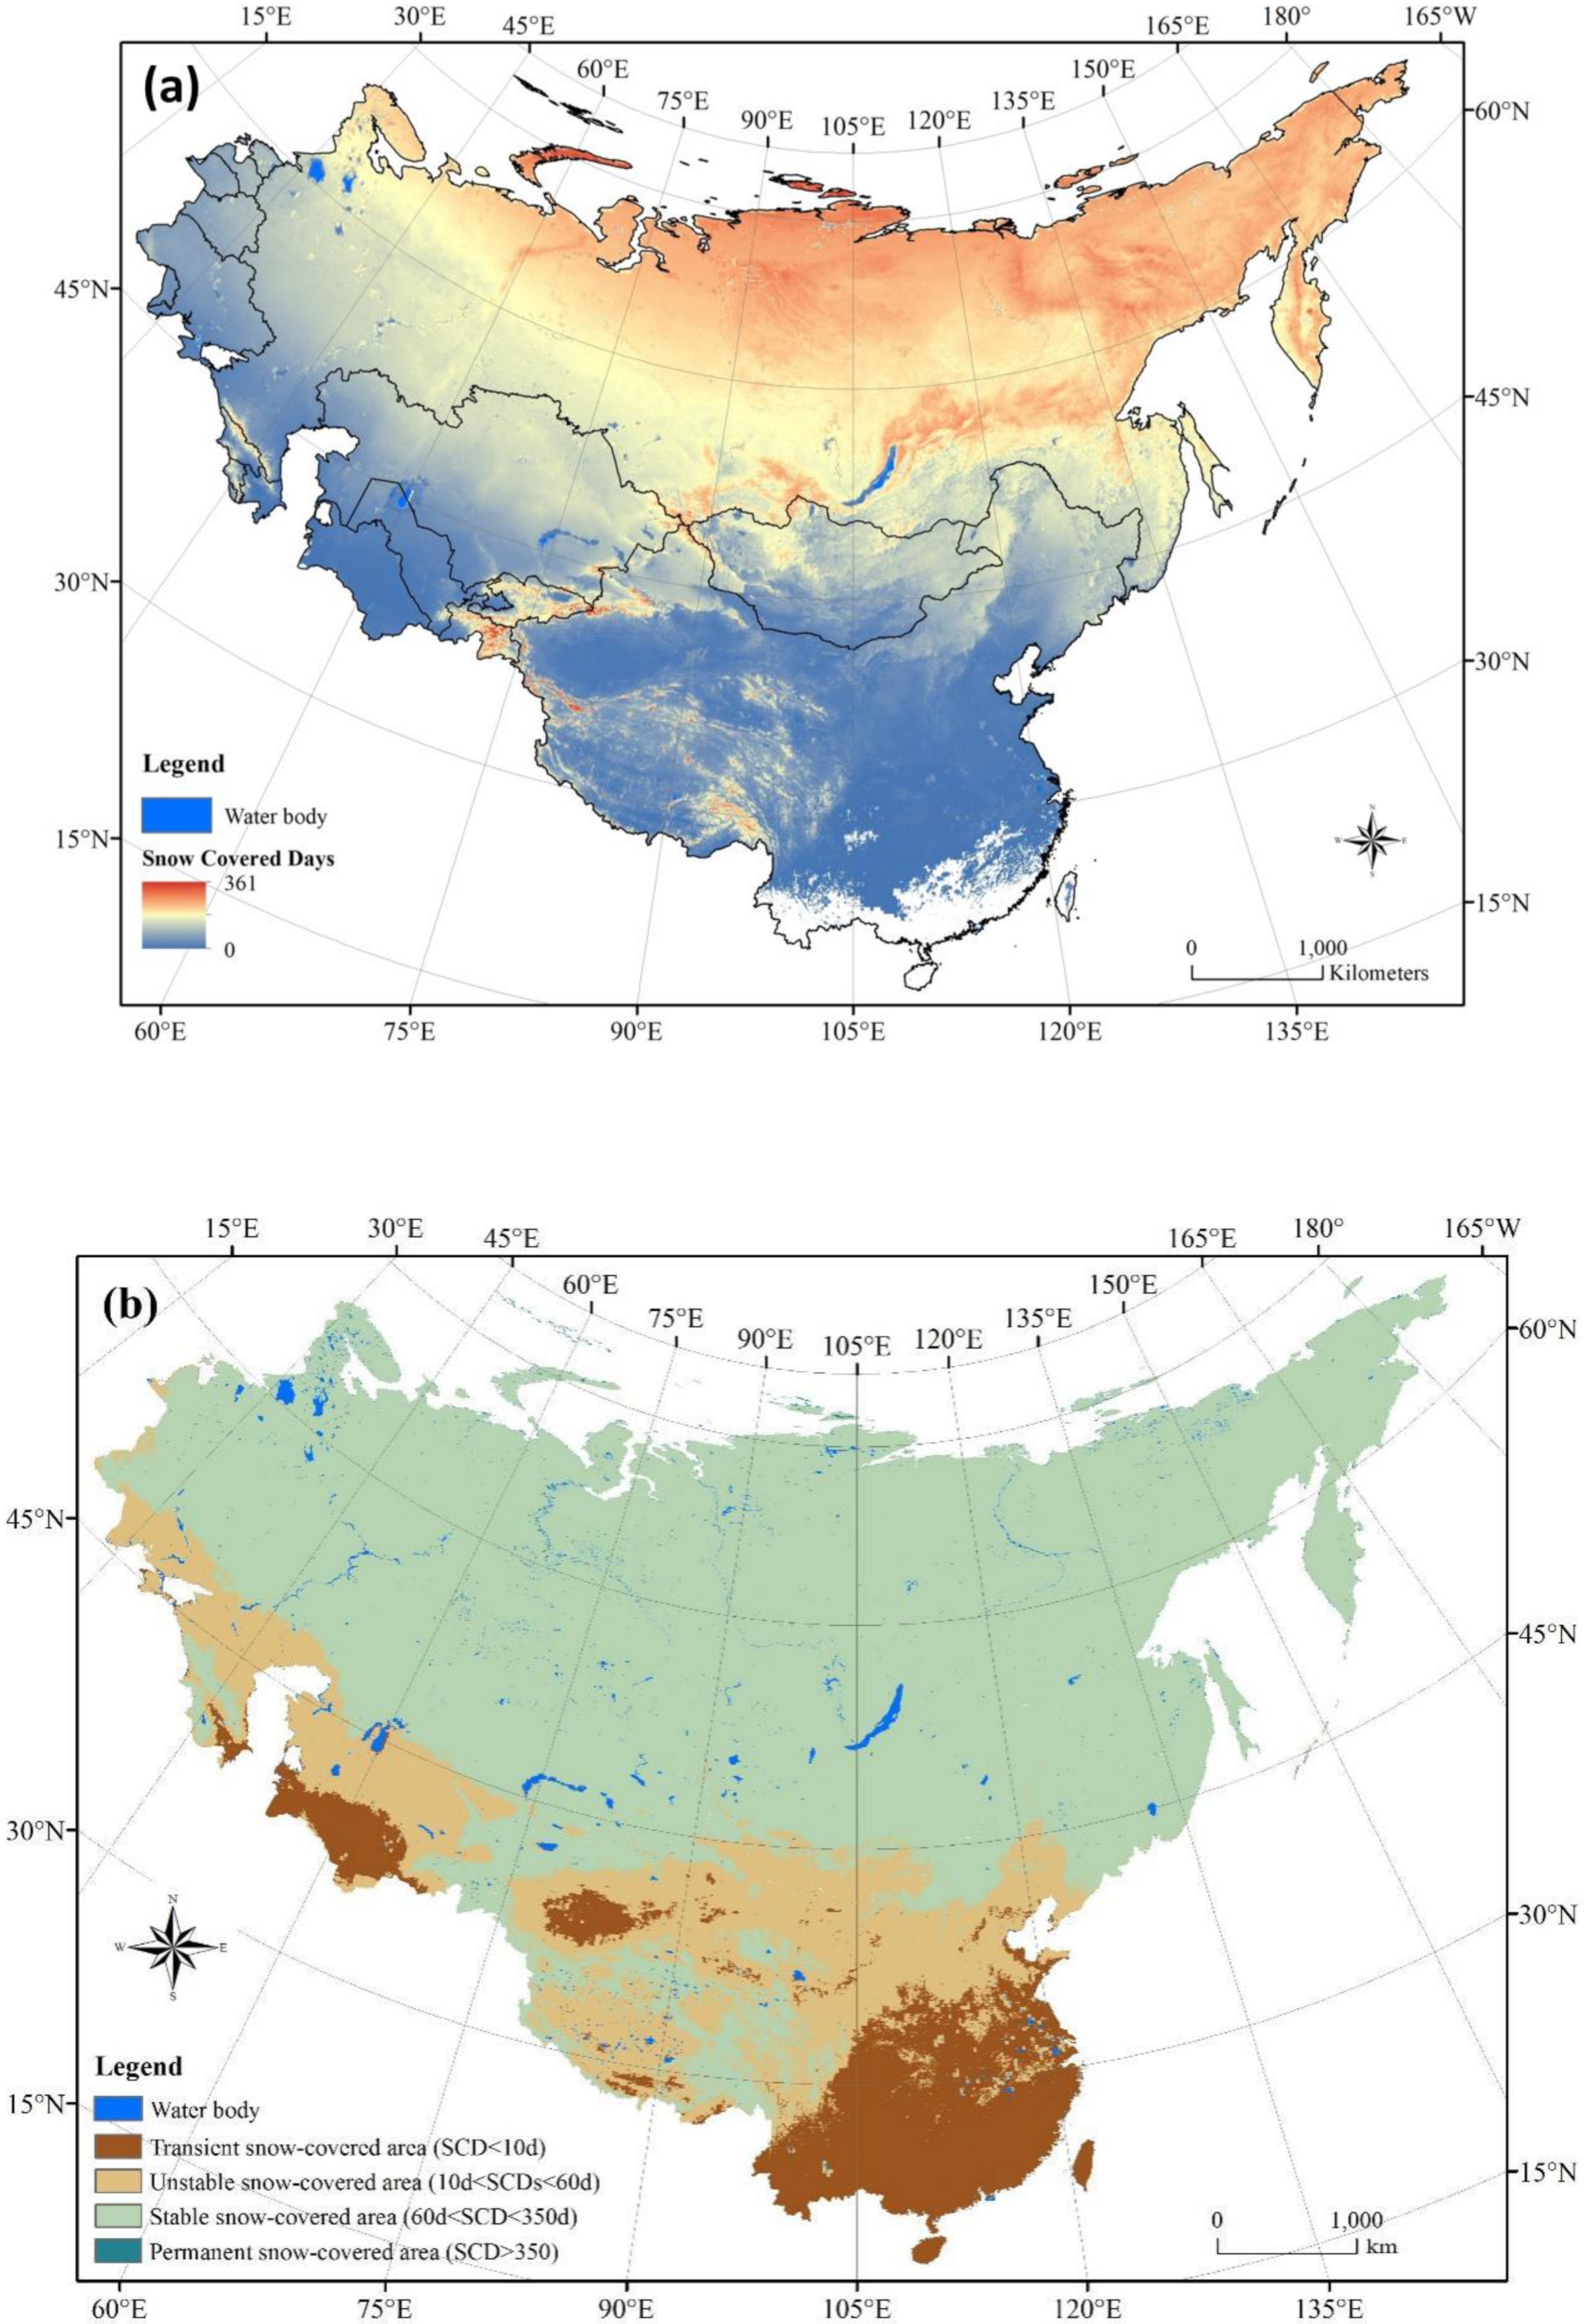
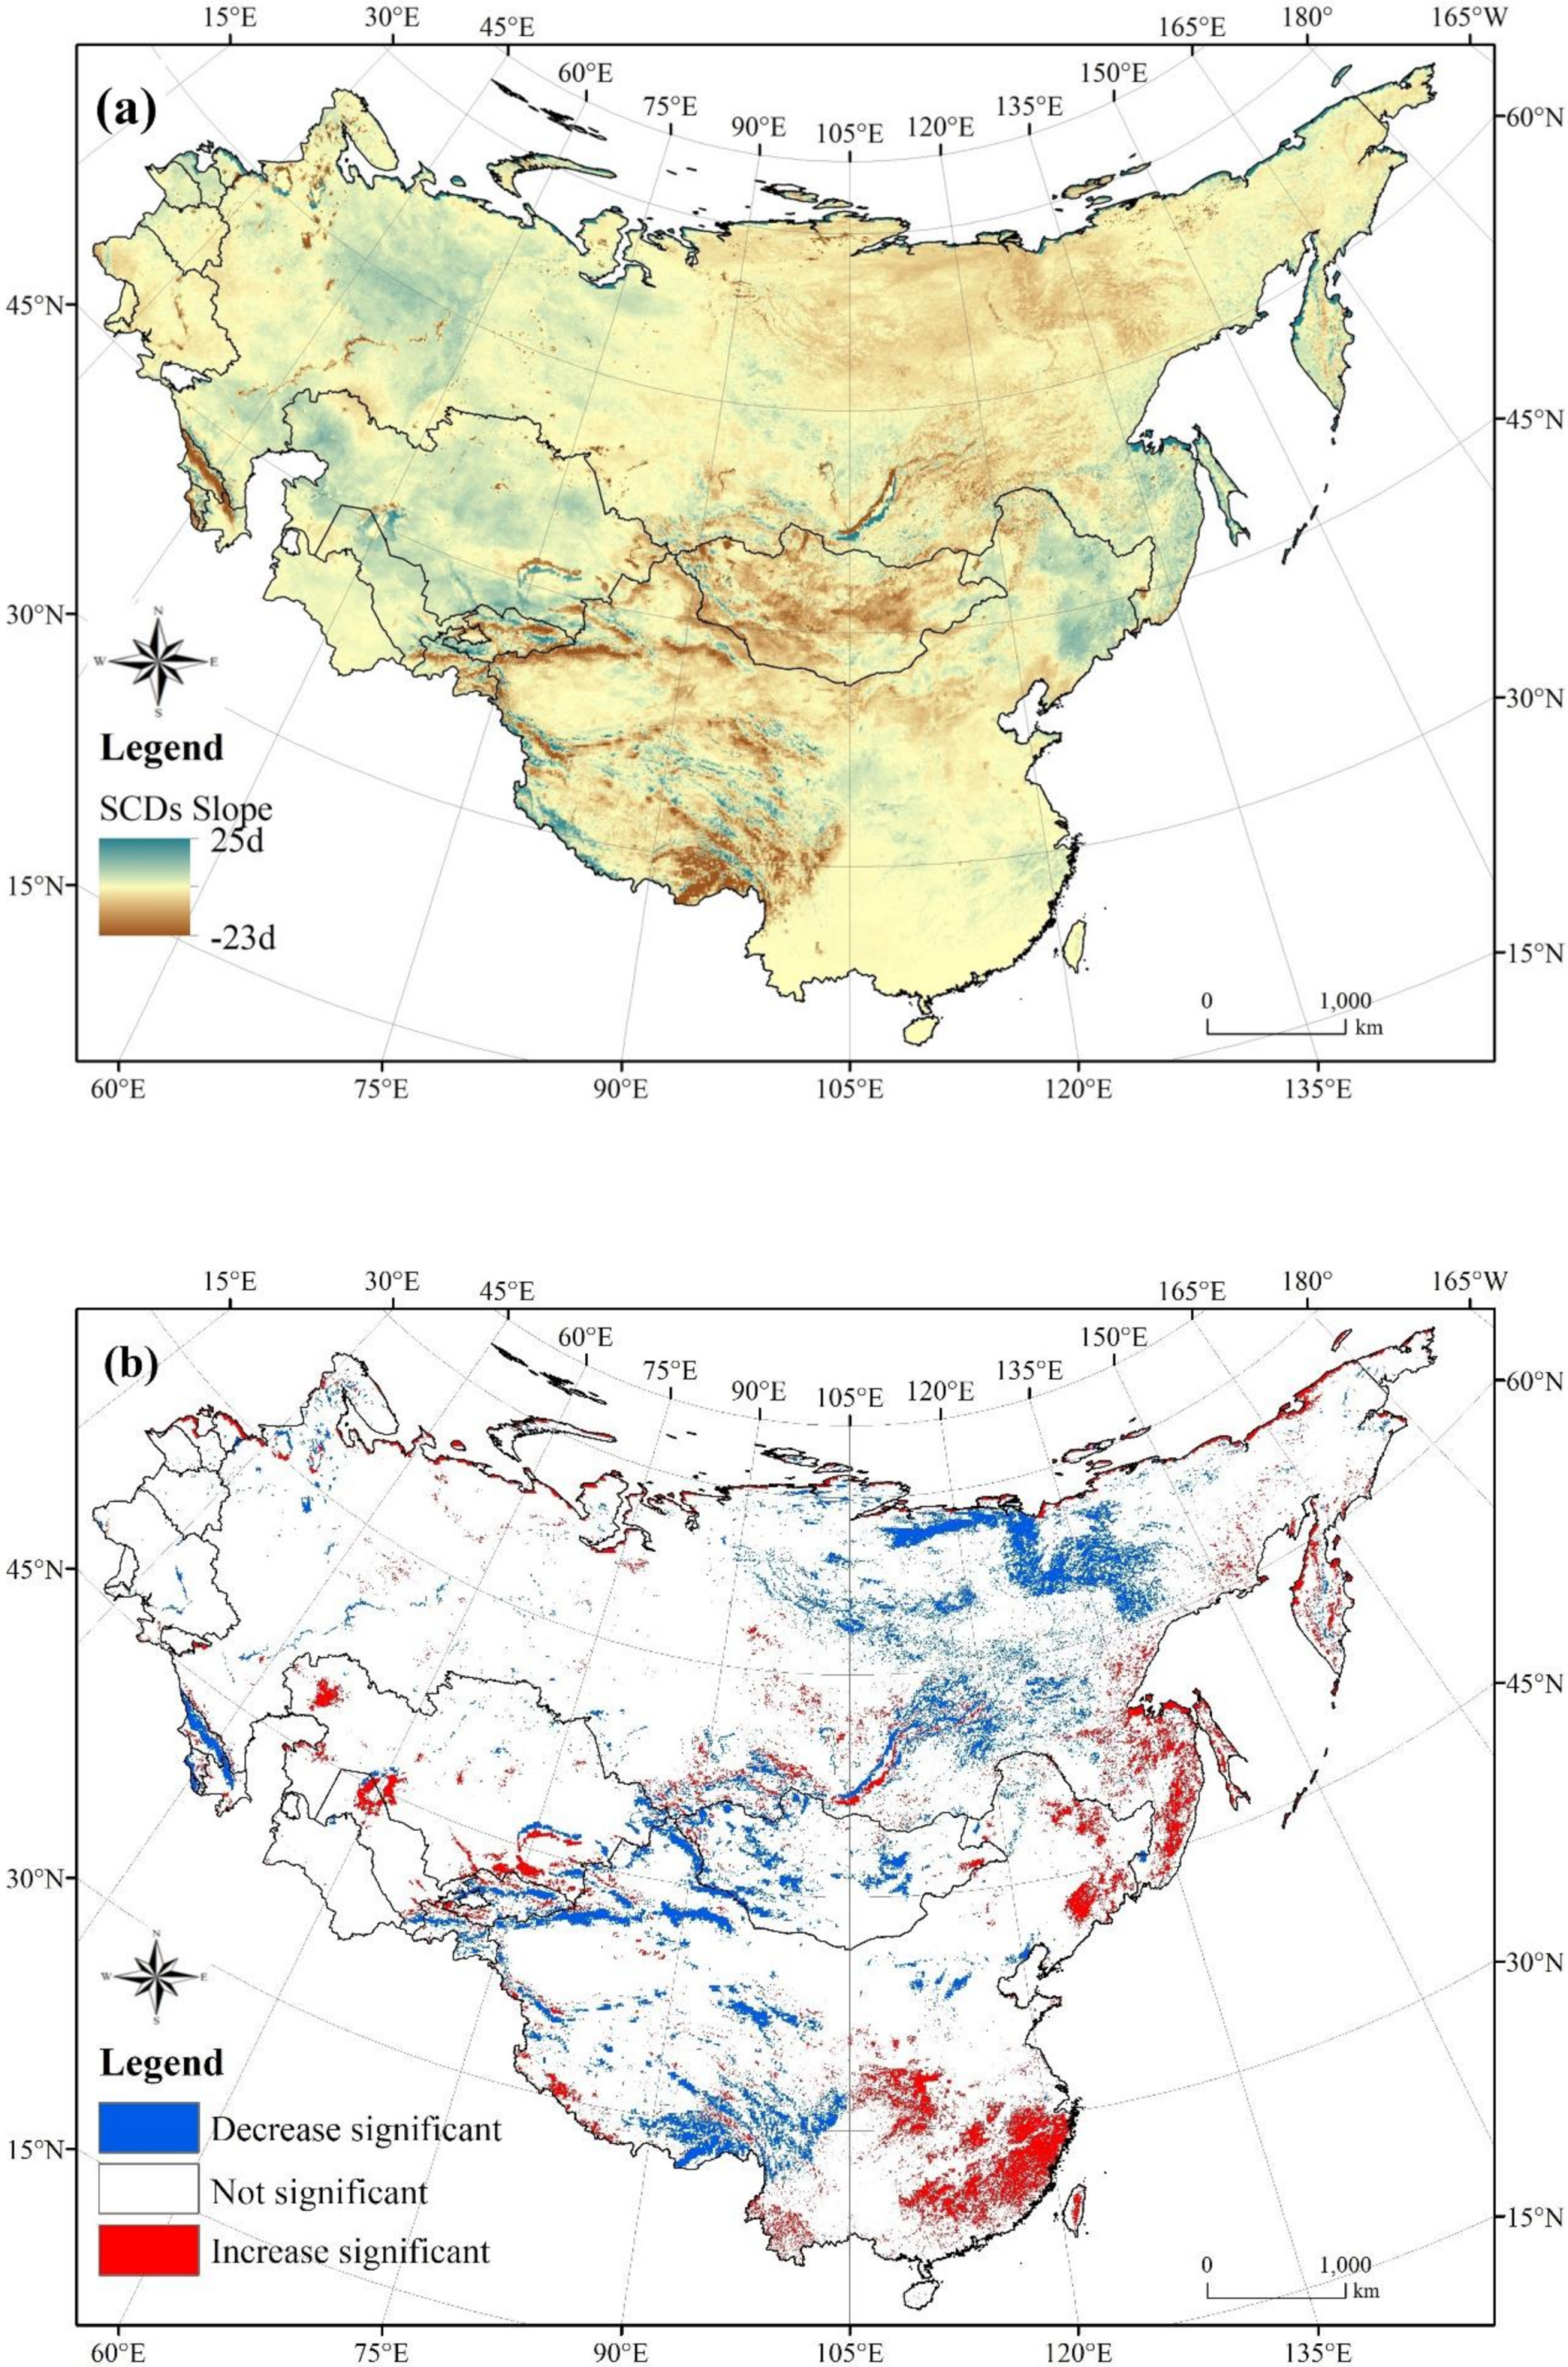
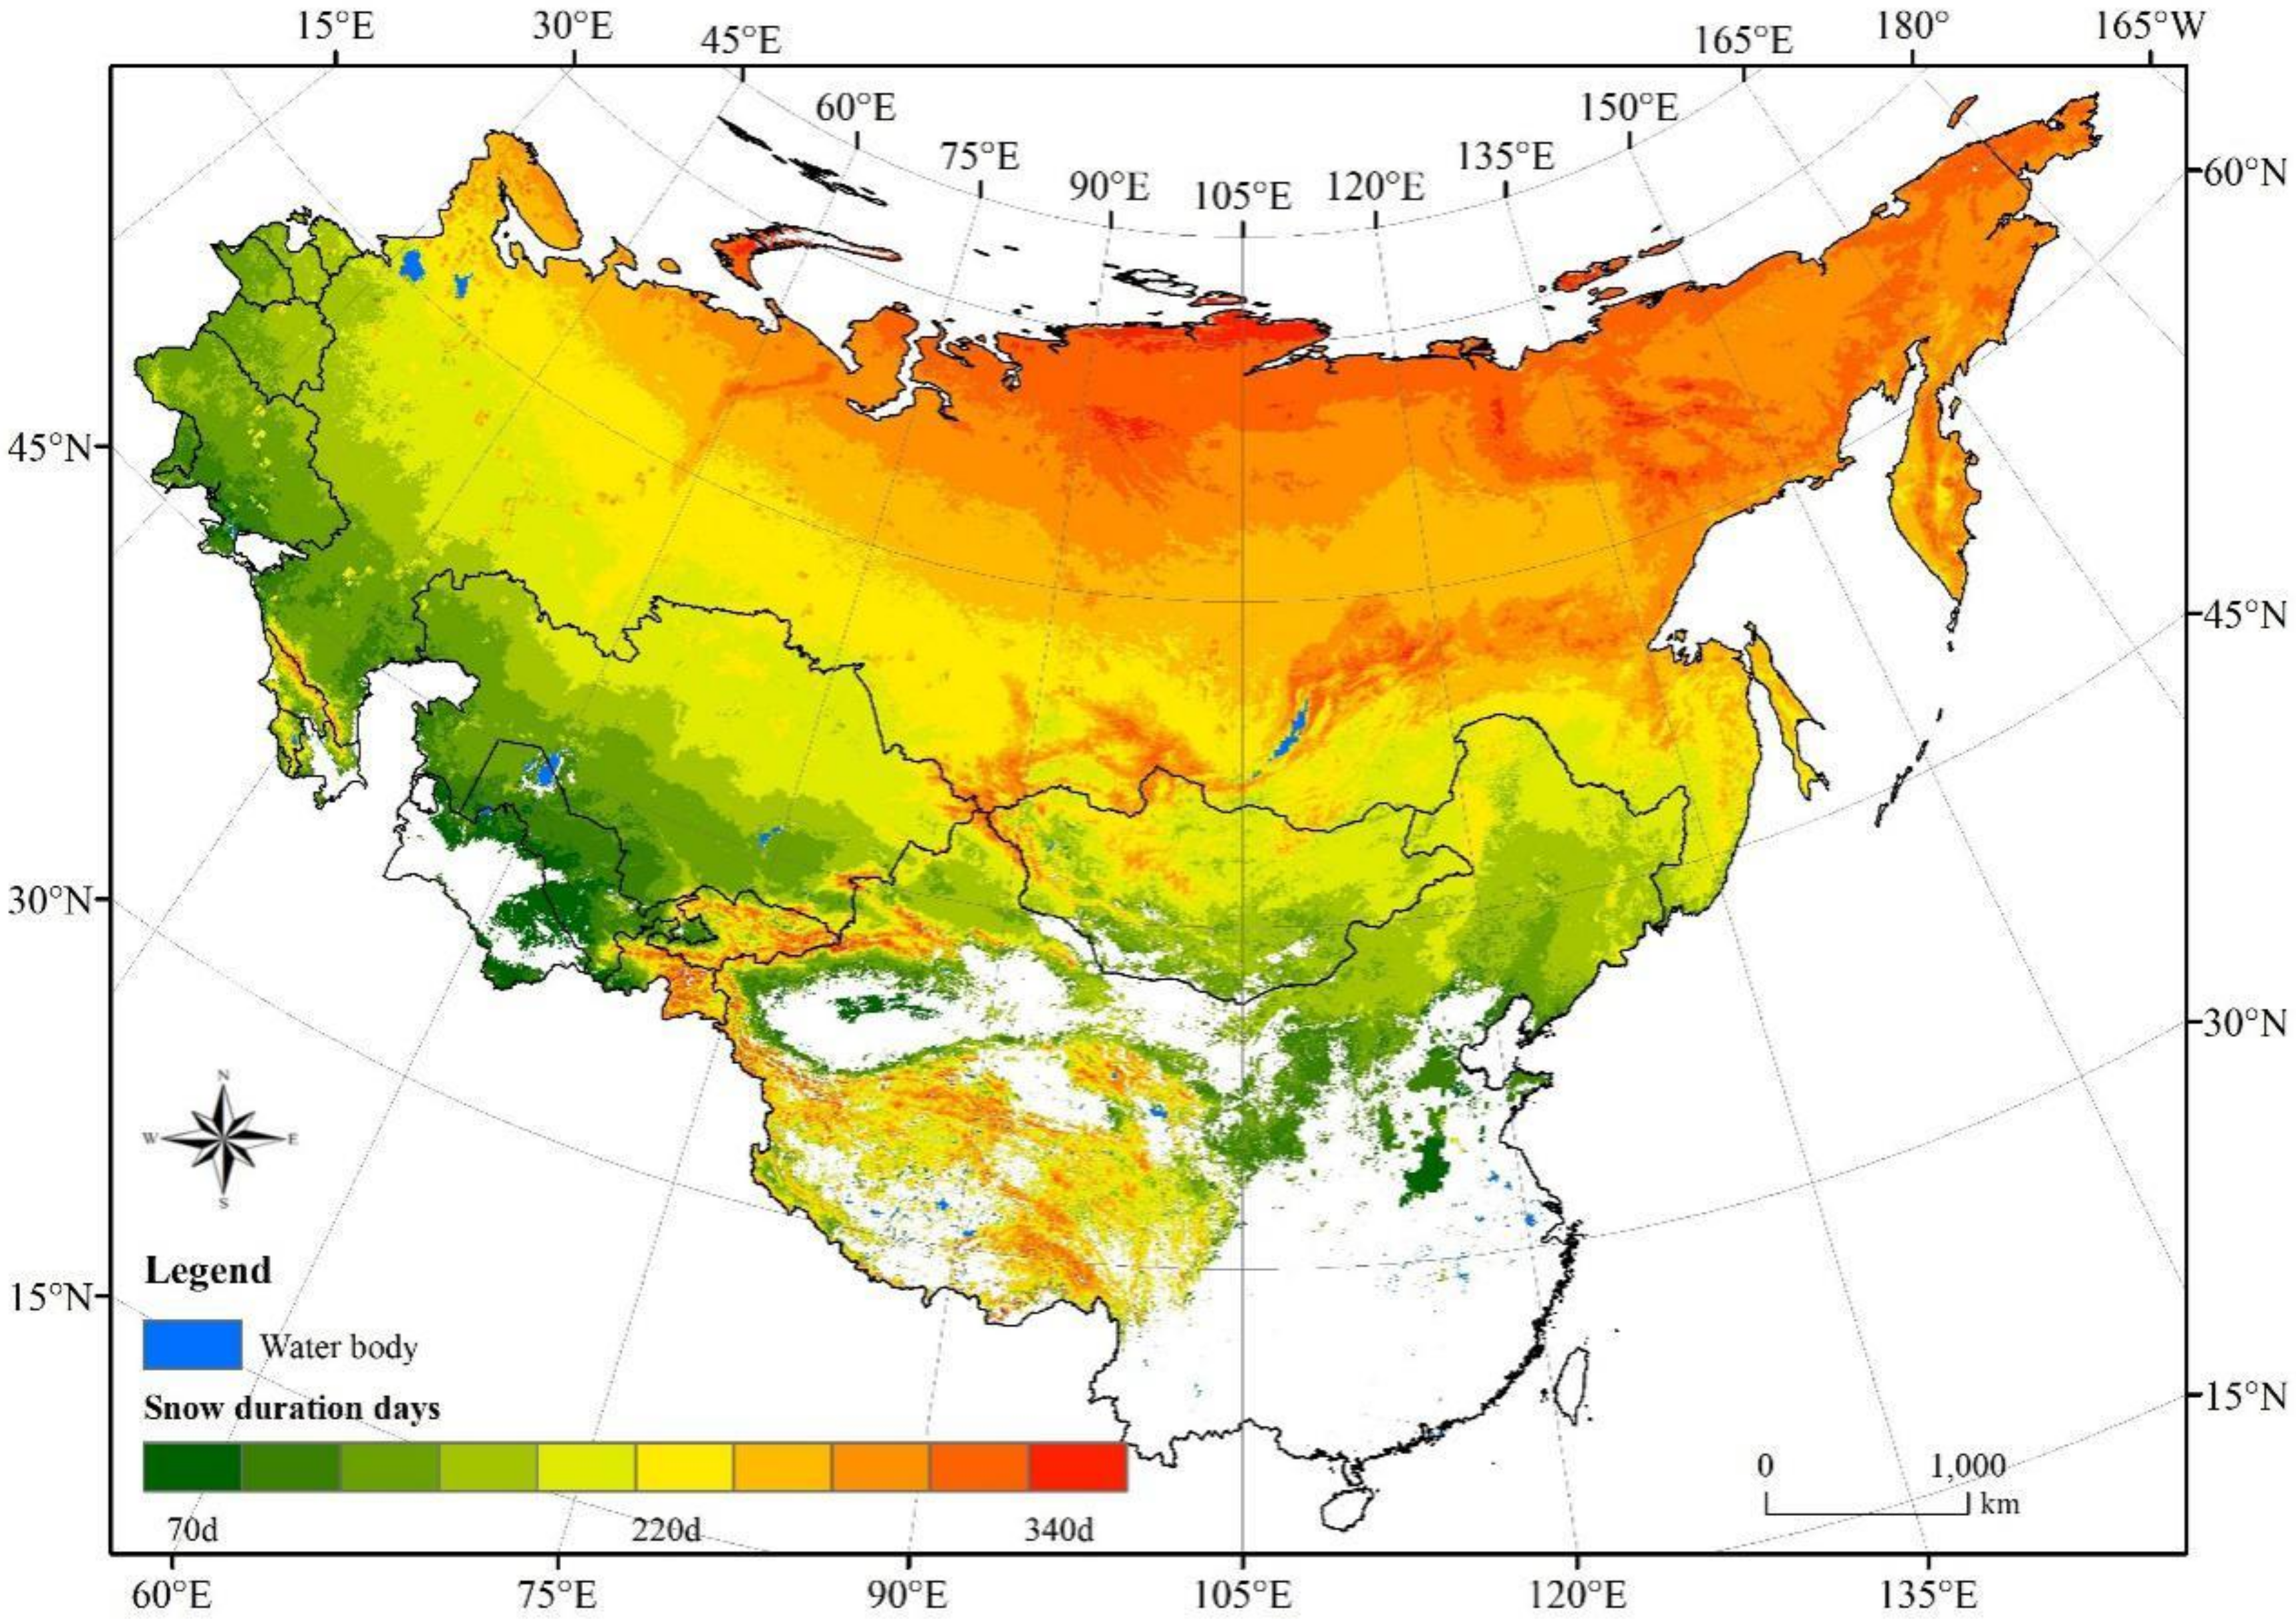
The spatial distribution of average SCDs shows significant latitude and vertical zonal distribution characteristics. The SCDs in mountainous areas such as the Tibetan Plateau, Tianshan, and Altai Mountains in China, Stanovoy Khrebet in southeastern Siberia, and the Eurasia boundary of the Ural and Caucasus Mountains are relatively higher than the surrounding plains at the same latitude (Figure 8a). Based on SCDs, the snow-covered area in the study area is classified into four types: instantaneous/ephemeral snow (SCDs < 10 d), unstable snow cover (10 d < SCDs < 60d), stable snow cover (60d <= SCDs < 350 d), and permanent snow (SCDs > 350 d) [44]. Figure 8b indicates that the snow-free area accounts for only 3.2% of the entire study area, which is mostly distributed in the low latitudes of southern China, and the instantaneous snow cover area is approximately 5.7%, which is mainly distributed in the southern part of China, Tarim Basin, and Turkmenistan. The unstable snow cover is approximately 12.3%, which is mainly distributed between 30° N and 45° N. The stable snow cover area accounts for 78.8%, which is mainly distributed in regions north of 45° N and in the mountainous area in western China. Permanent snow cover accounts for only about 0.4% of the study area, which is distributed in the Tibetan Plateau and near the Arctic Circle at the northern tip of Russia. Figure 9 shows the SCDs trends as well as the significant test of SCDs over the last 17 years. The results show that the increased area of SCDs accounted for 16.1% of the whole study area, with a significantly increased area of approximately 6.4% (p < 0.05) from 2000 to 2016. The SCDs decrease by 16.1%, with a significant decrease of approximately 9.1% (p < 0.05). The increasing area is mainly distributed in northeastern and southern China, while the decreasing area is mainly distributed in the Siberian Plateau, Mongolian Plateau and the Tibetan Plateau.
4.5. Snow Phenology Dynamics
4.5.1. SOD
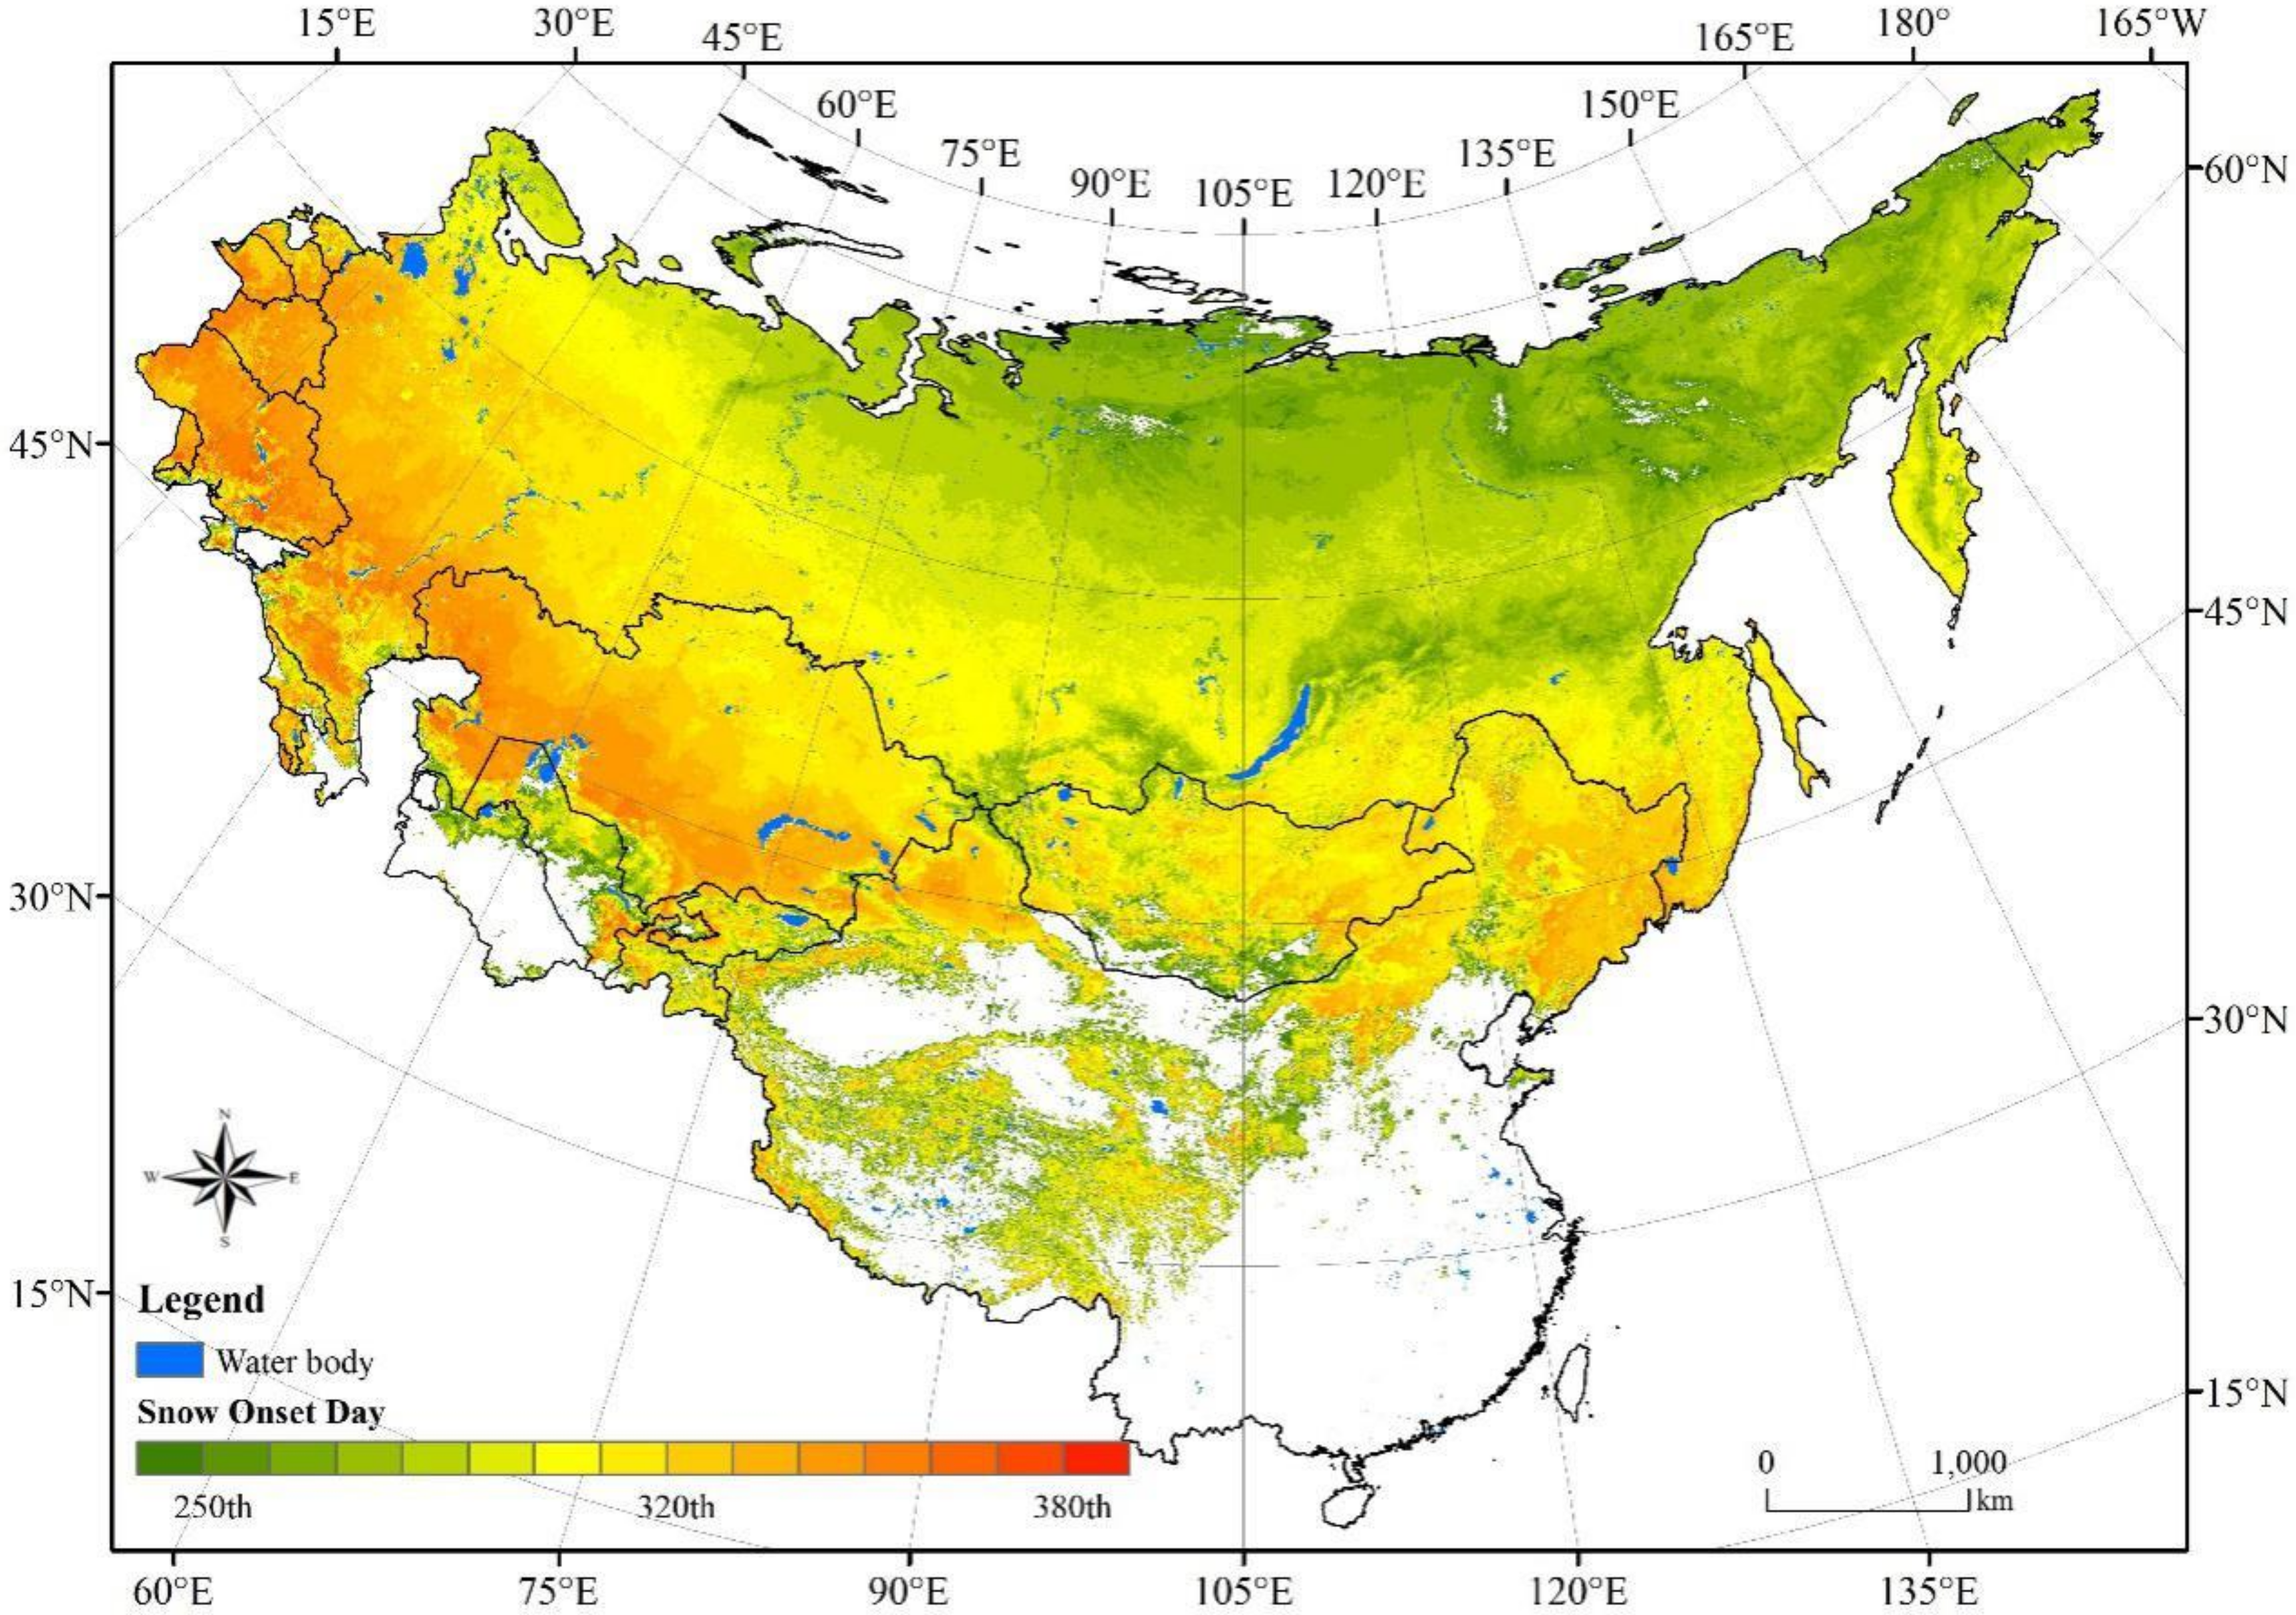
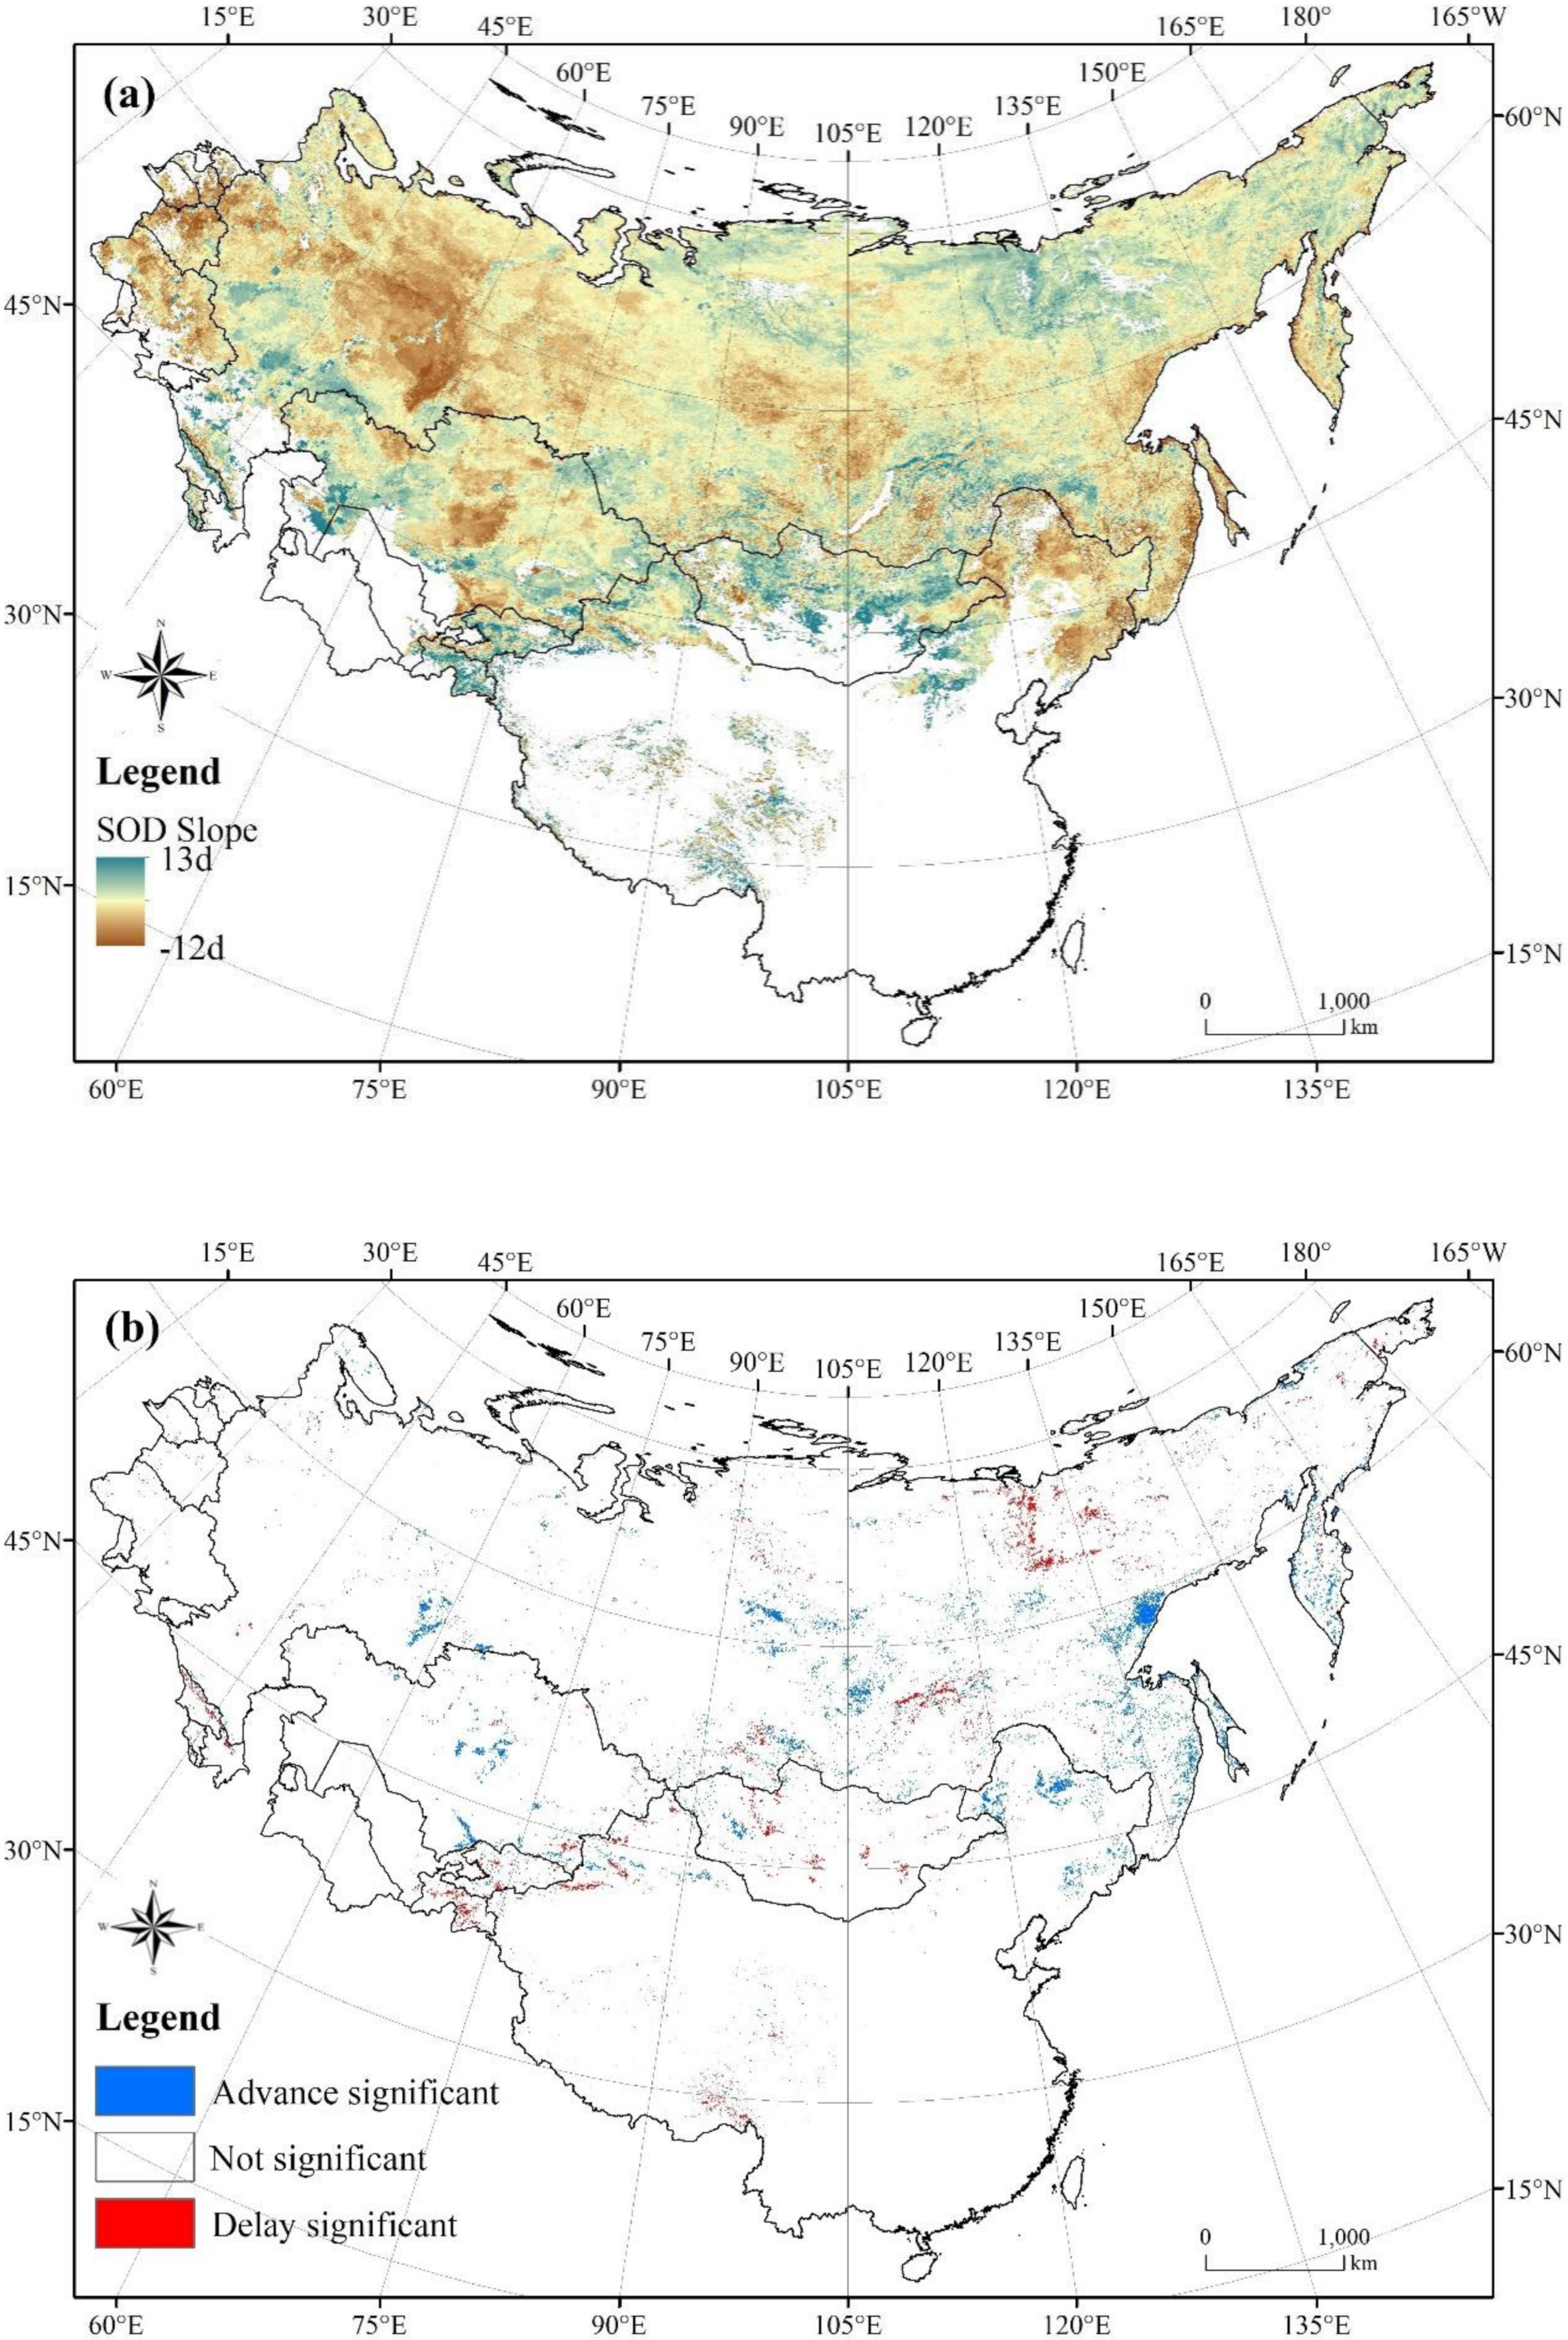
Figure 10 shows that with increasing altitude, SOD begins earlier. The SOD at mid-latitude 45° N basically begins in November (330th day). With an increment in latitude, the SOD is advanced to the end of September (270th day). Specially, the SOD starts nearly 30 days earlier in the Tibetan Plateau than the surrounding areas. Figure 11 indicates that approximately 30.8% of the snow cover areas in the large part of Eurasia show signs of SOD delay, among which only 1.2% of the area was significantly delayed (p < 0.05). The spatial distribution of the SOD trend is extremely irregular in the large part of Eurasia. As far as the Tibetan Plateau is concerned, SOD shows a delayed trend in most areas of the inside plateau, especially in the south of the Tibetan Plateau where the trend of SOD delay is the most significant.
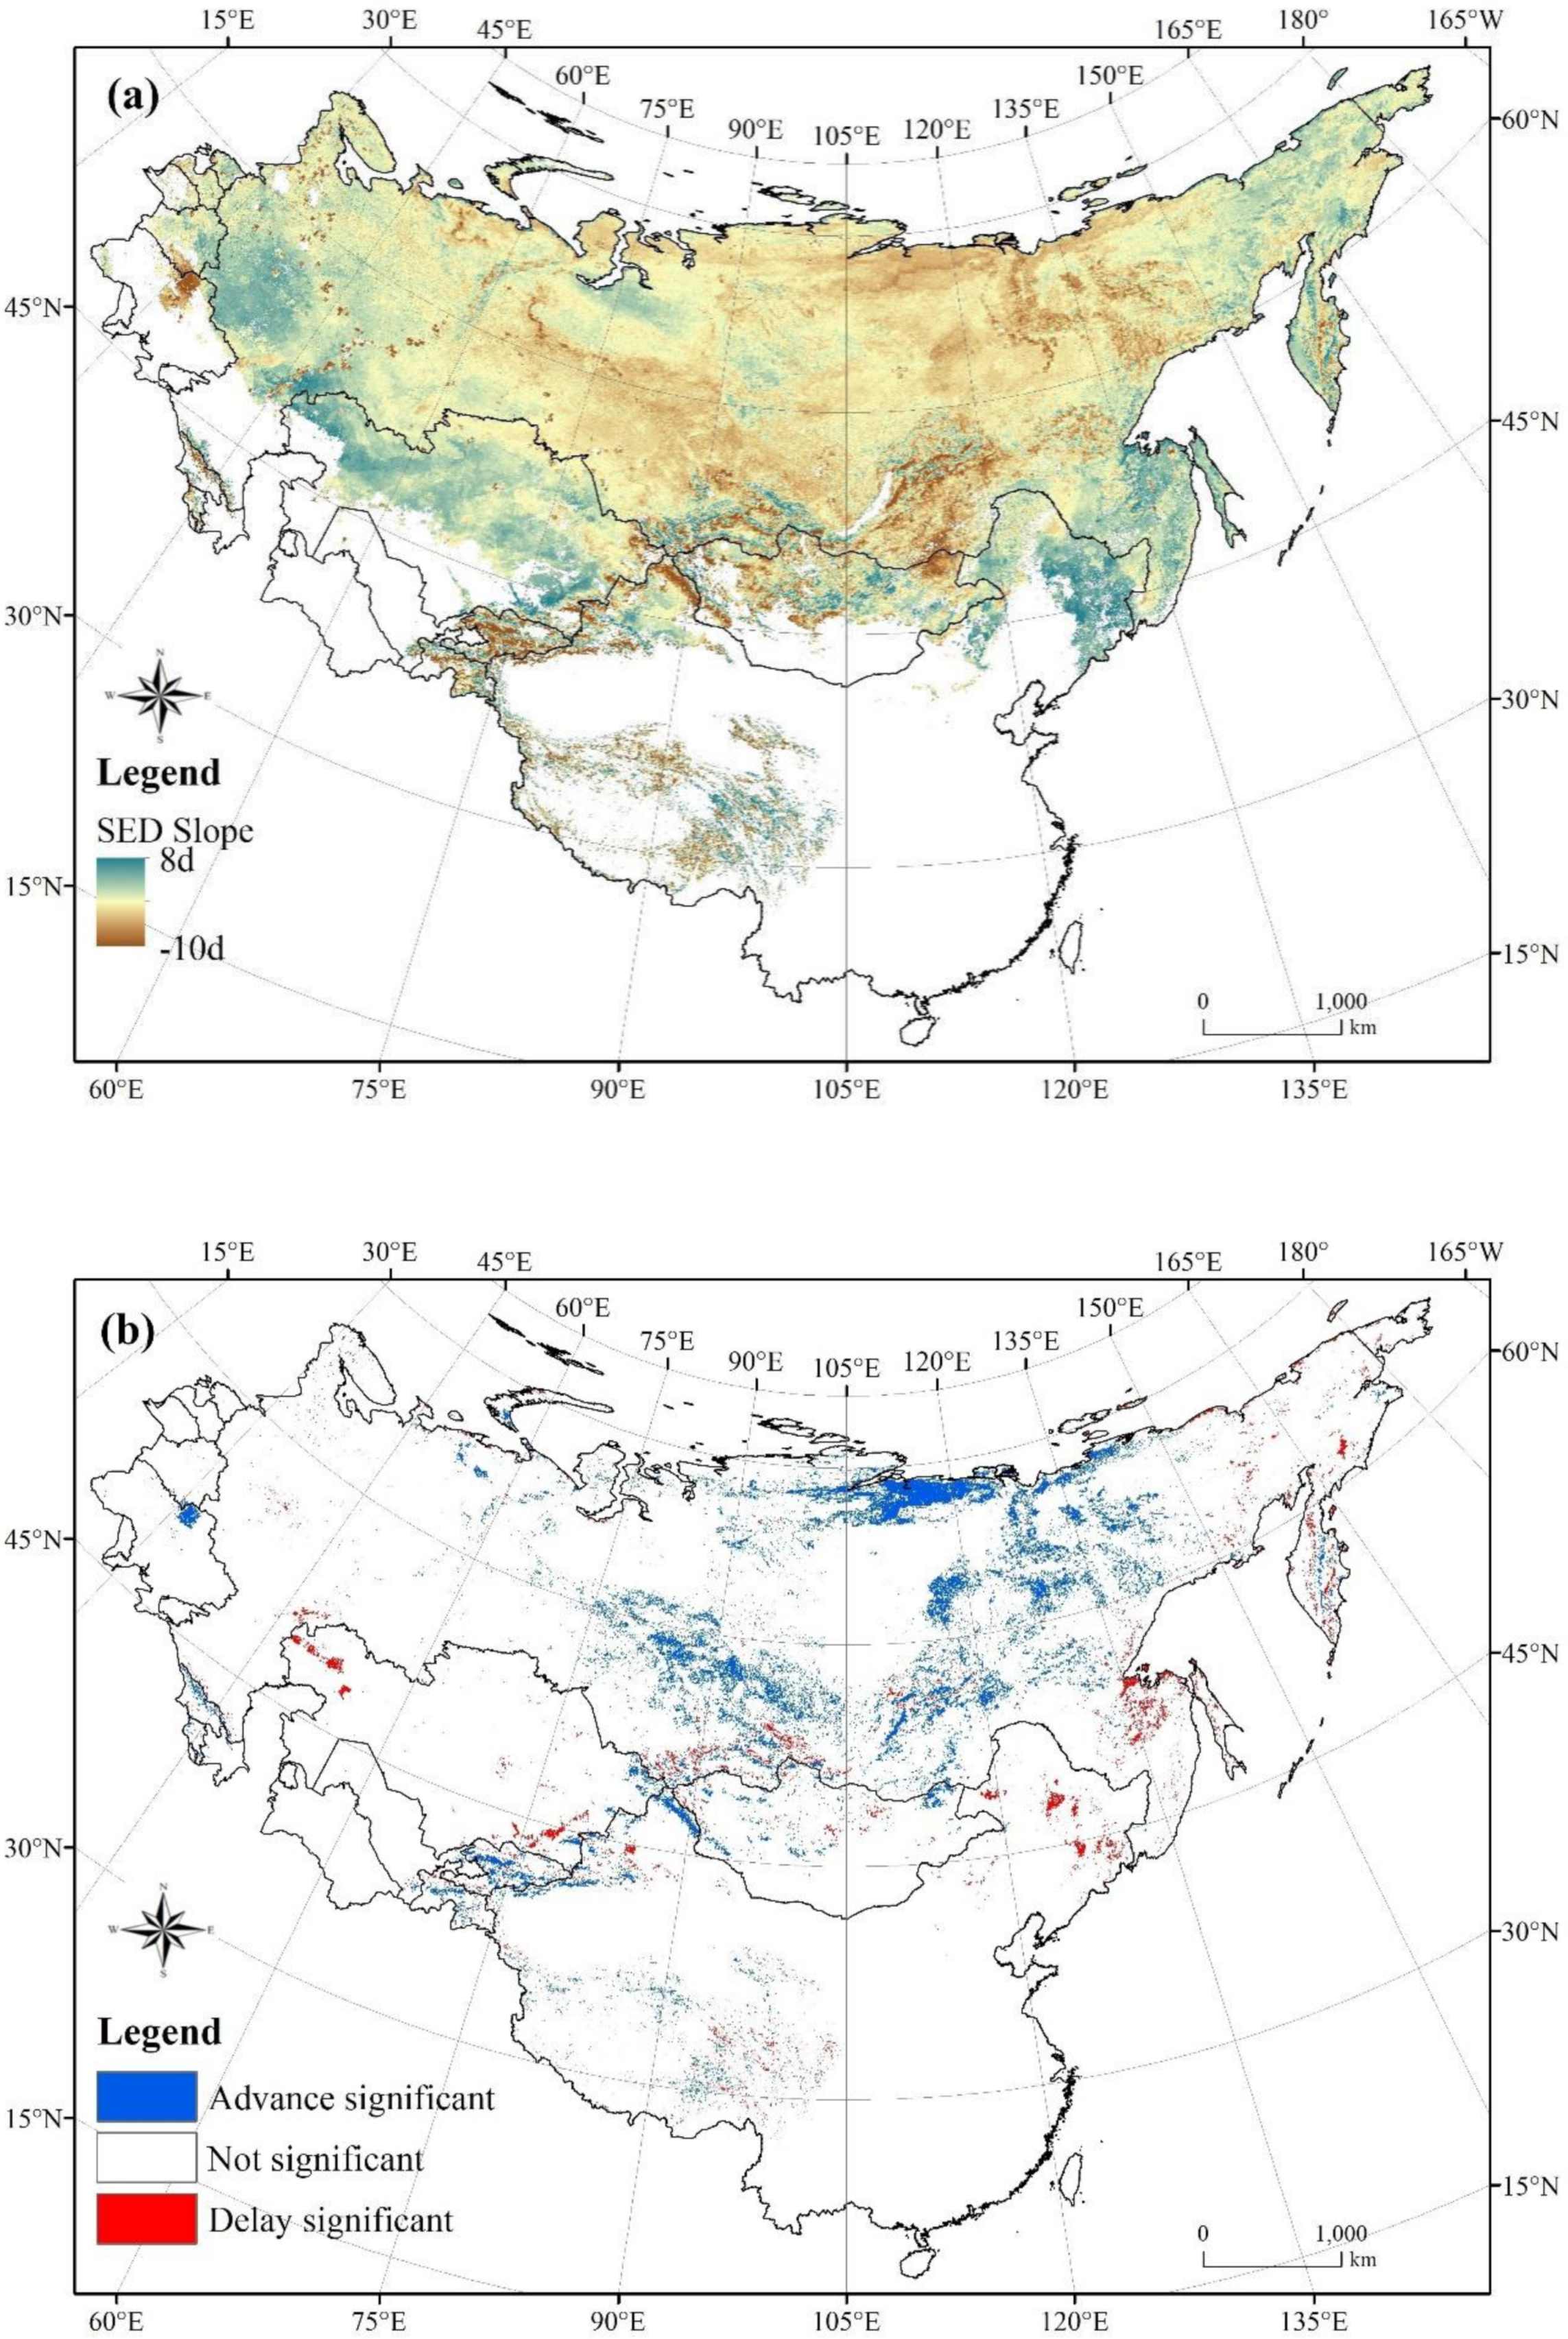
4.5.2. SED
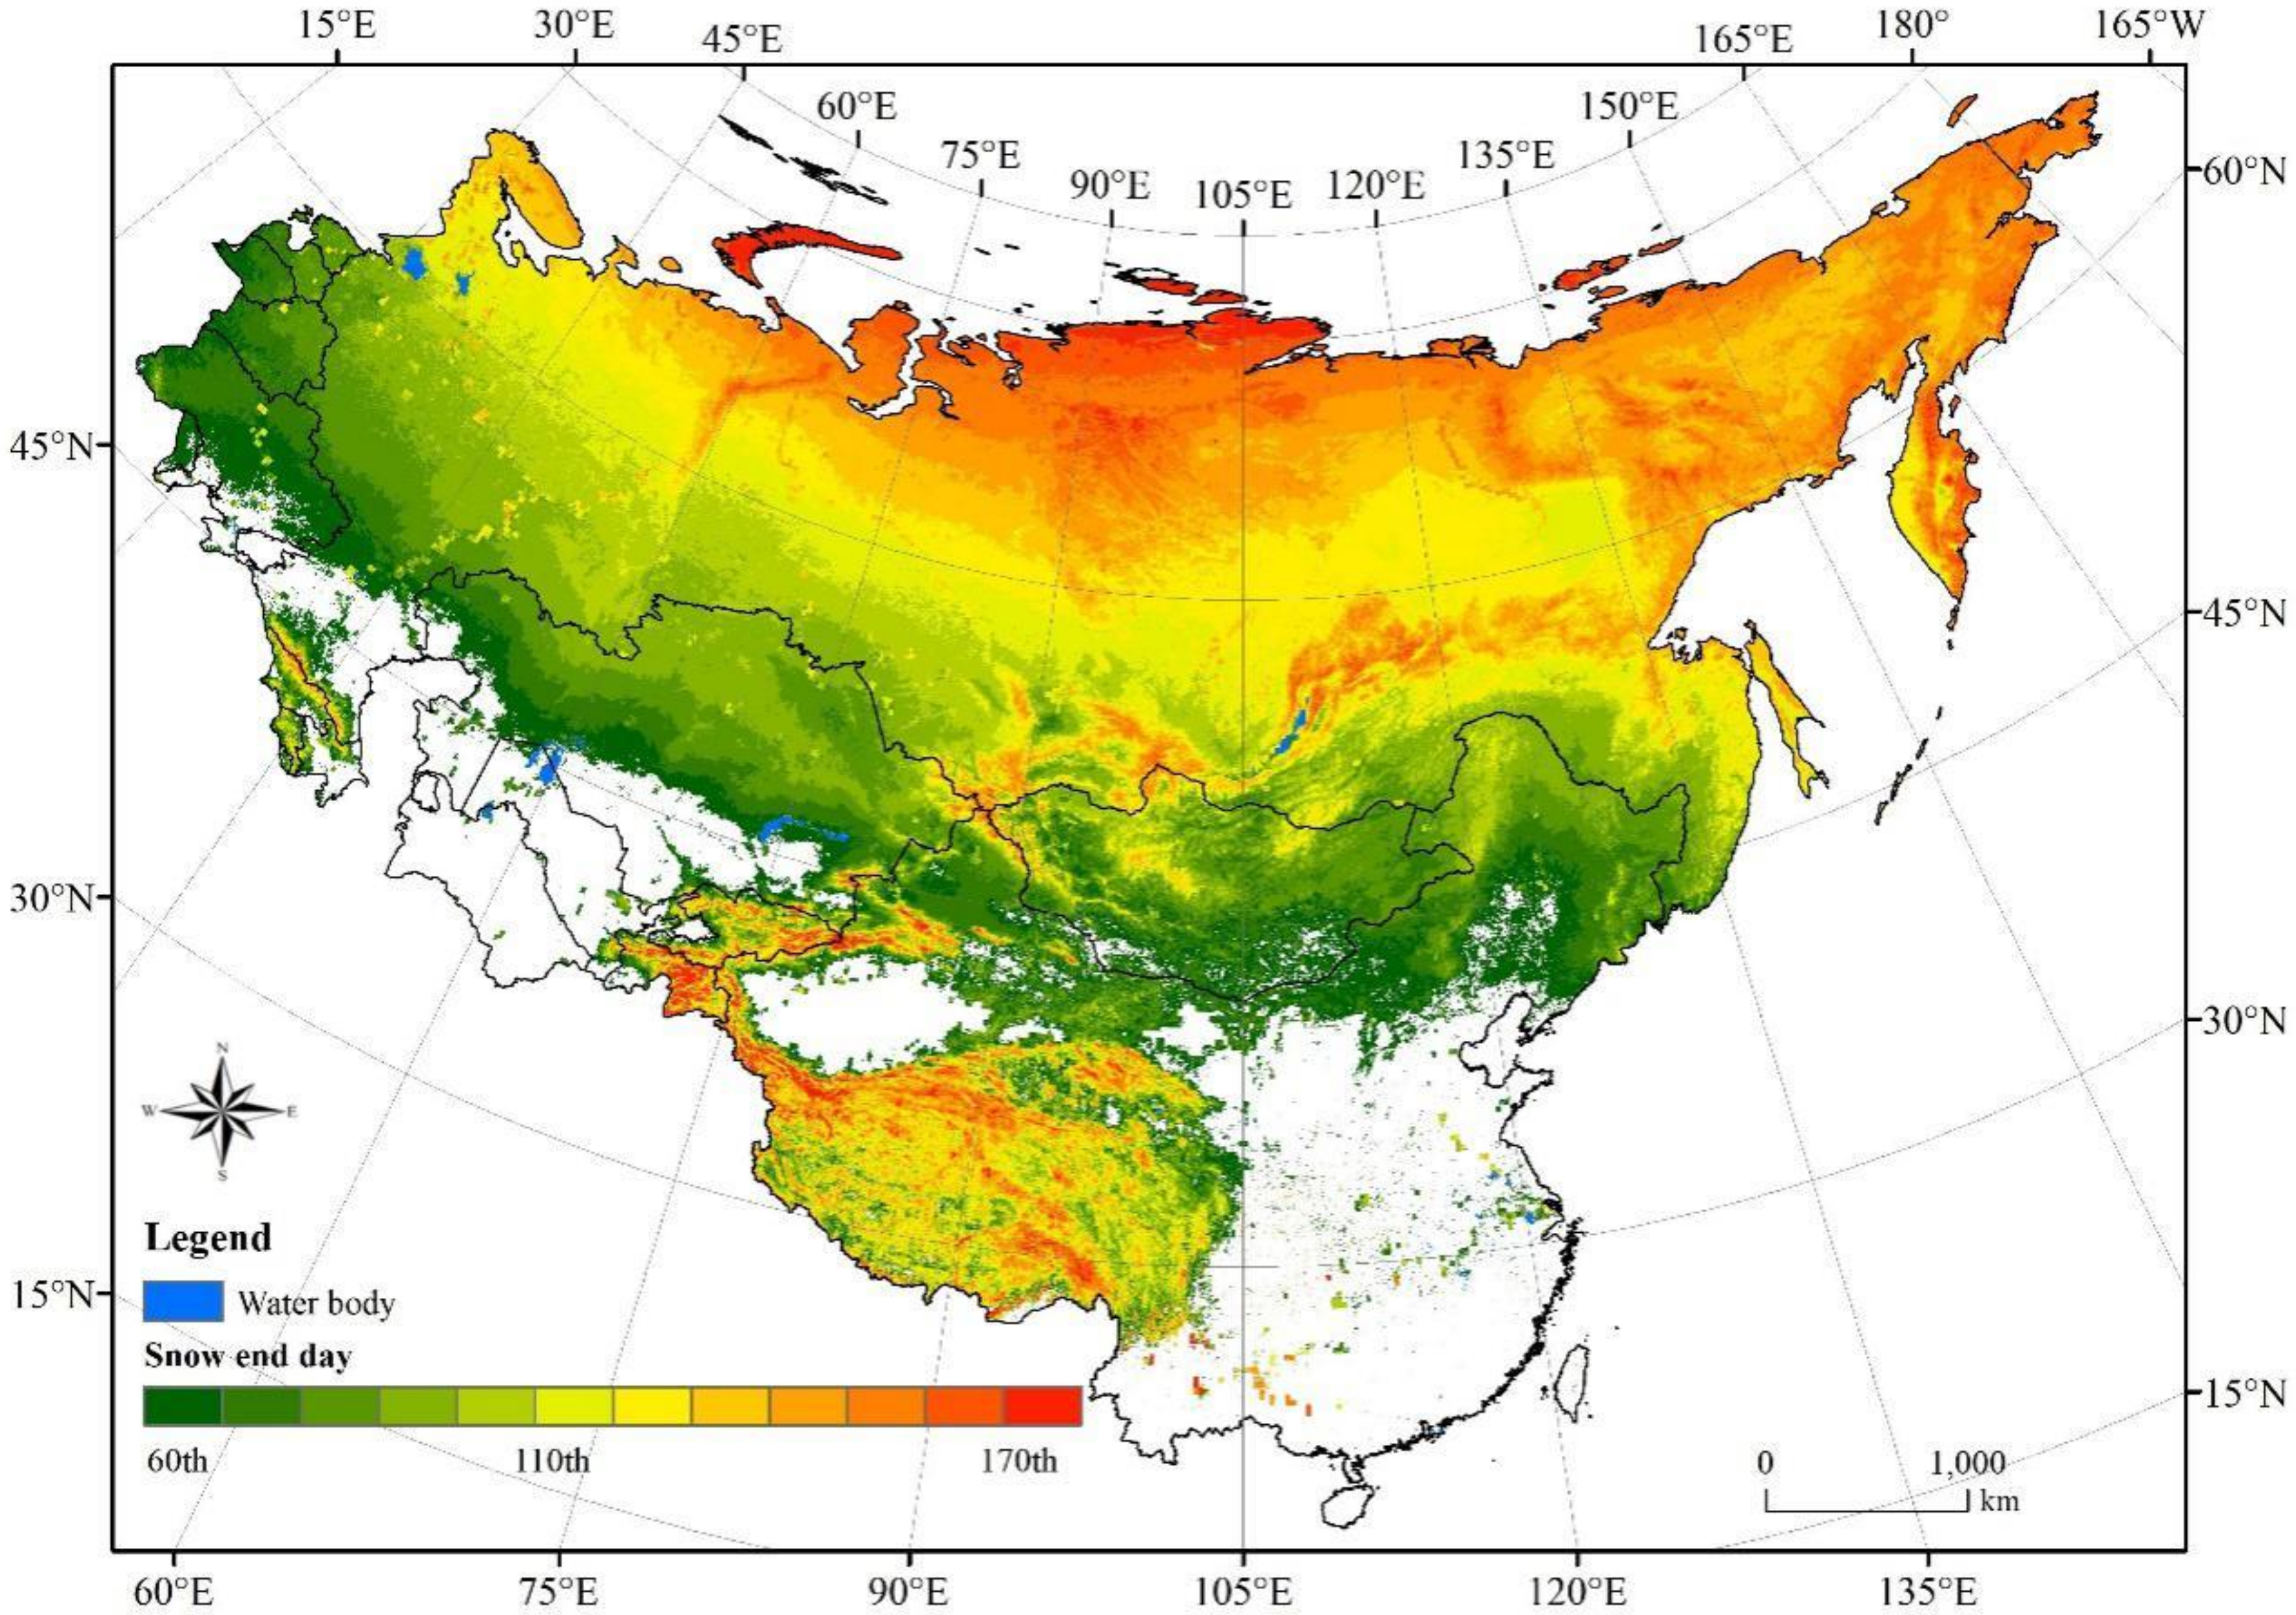
The average annual SED is approximately in mid-February at 45° N in the large part of Eurasia. With increasing latitude, the SED becomes delayed, and the SED occurs in approximately mid-April at 60° N and is delayed until early June in the higher latitude of Arctic circle. The SED distribution displays an obvious latitude zonality. On the other hand, in the high altitude mountainous areas, the SED basically occurs in late May, which is later than in the plains at the same latitudes, such as the Siberian Plateau, Pamirs Plateau, and the Tibetan Plateau of China (Figure 12). Approximately 28.3% of snow cover areas in the study area show that the SED advances, among which only 1.8% tend to advance significantly (p < 0.05). There are 9.3% delayed regions and 8.5% significantly delayed regions (p < 0.05). Overall, the SED tends to advance from 2000 to 2016 in the large part of Eurasia, especially in plateau areas such as the Siberian Plateau and Mongolian Plateau. The SED in the Tibetan Plateau has both tendencies, and the advanced regions are mainly located in mountainous areas such as the Pamir and Nyainqentanglha Mountains (Figure 13).
4.5.3. SDDs
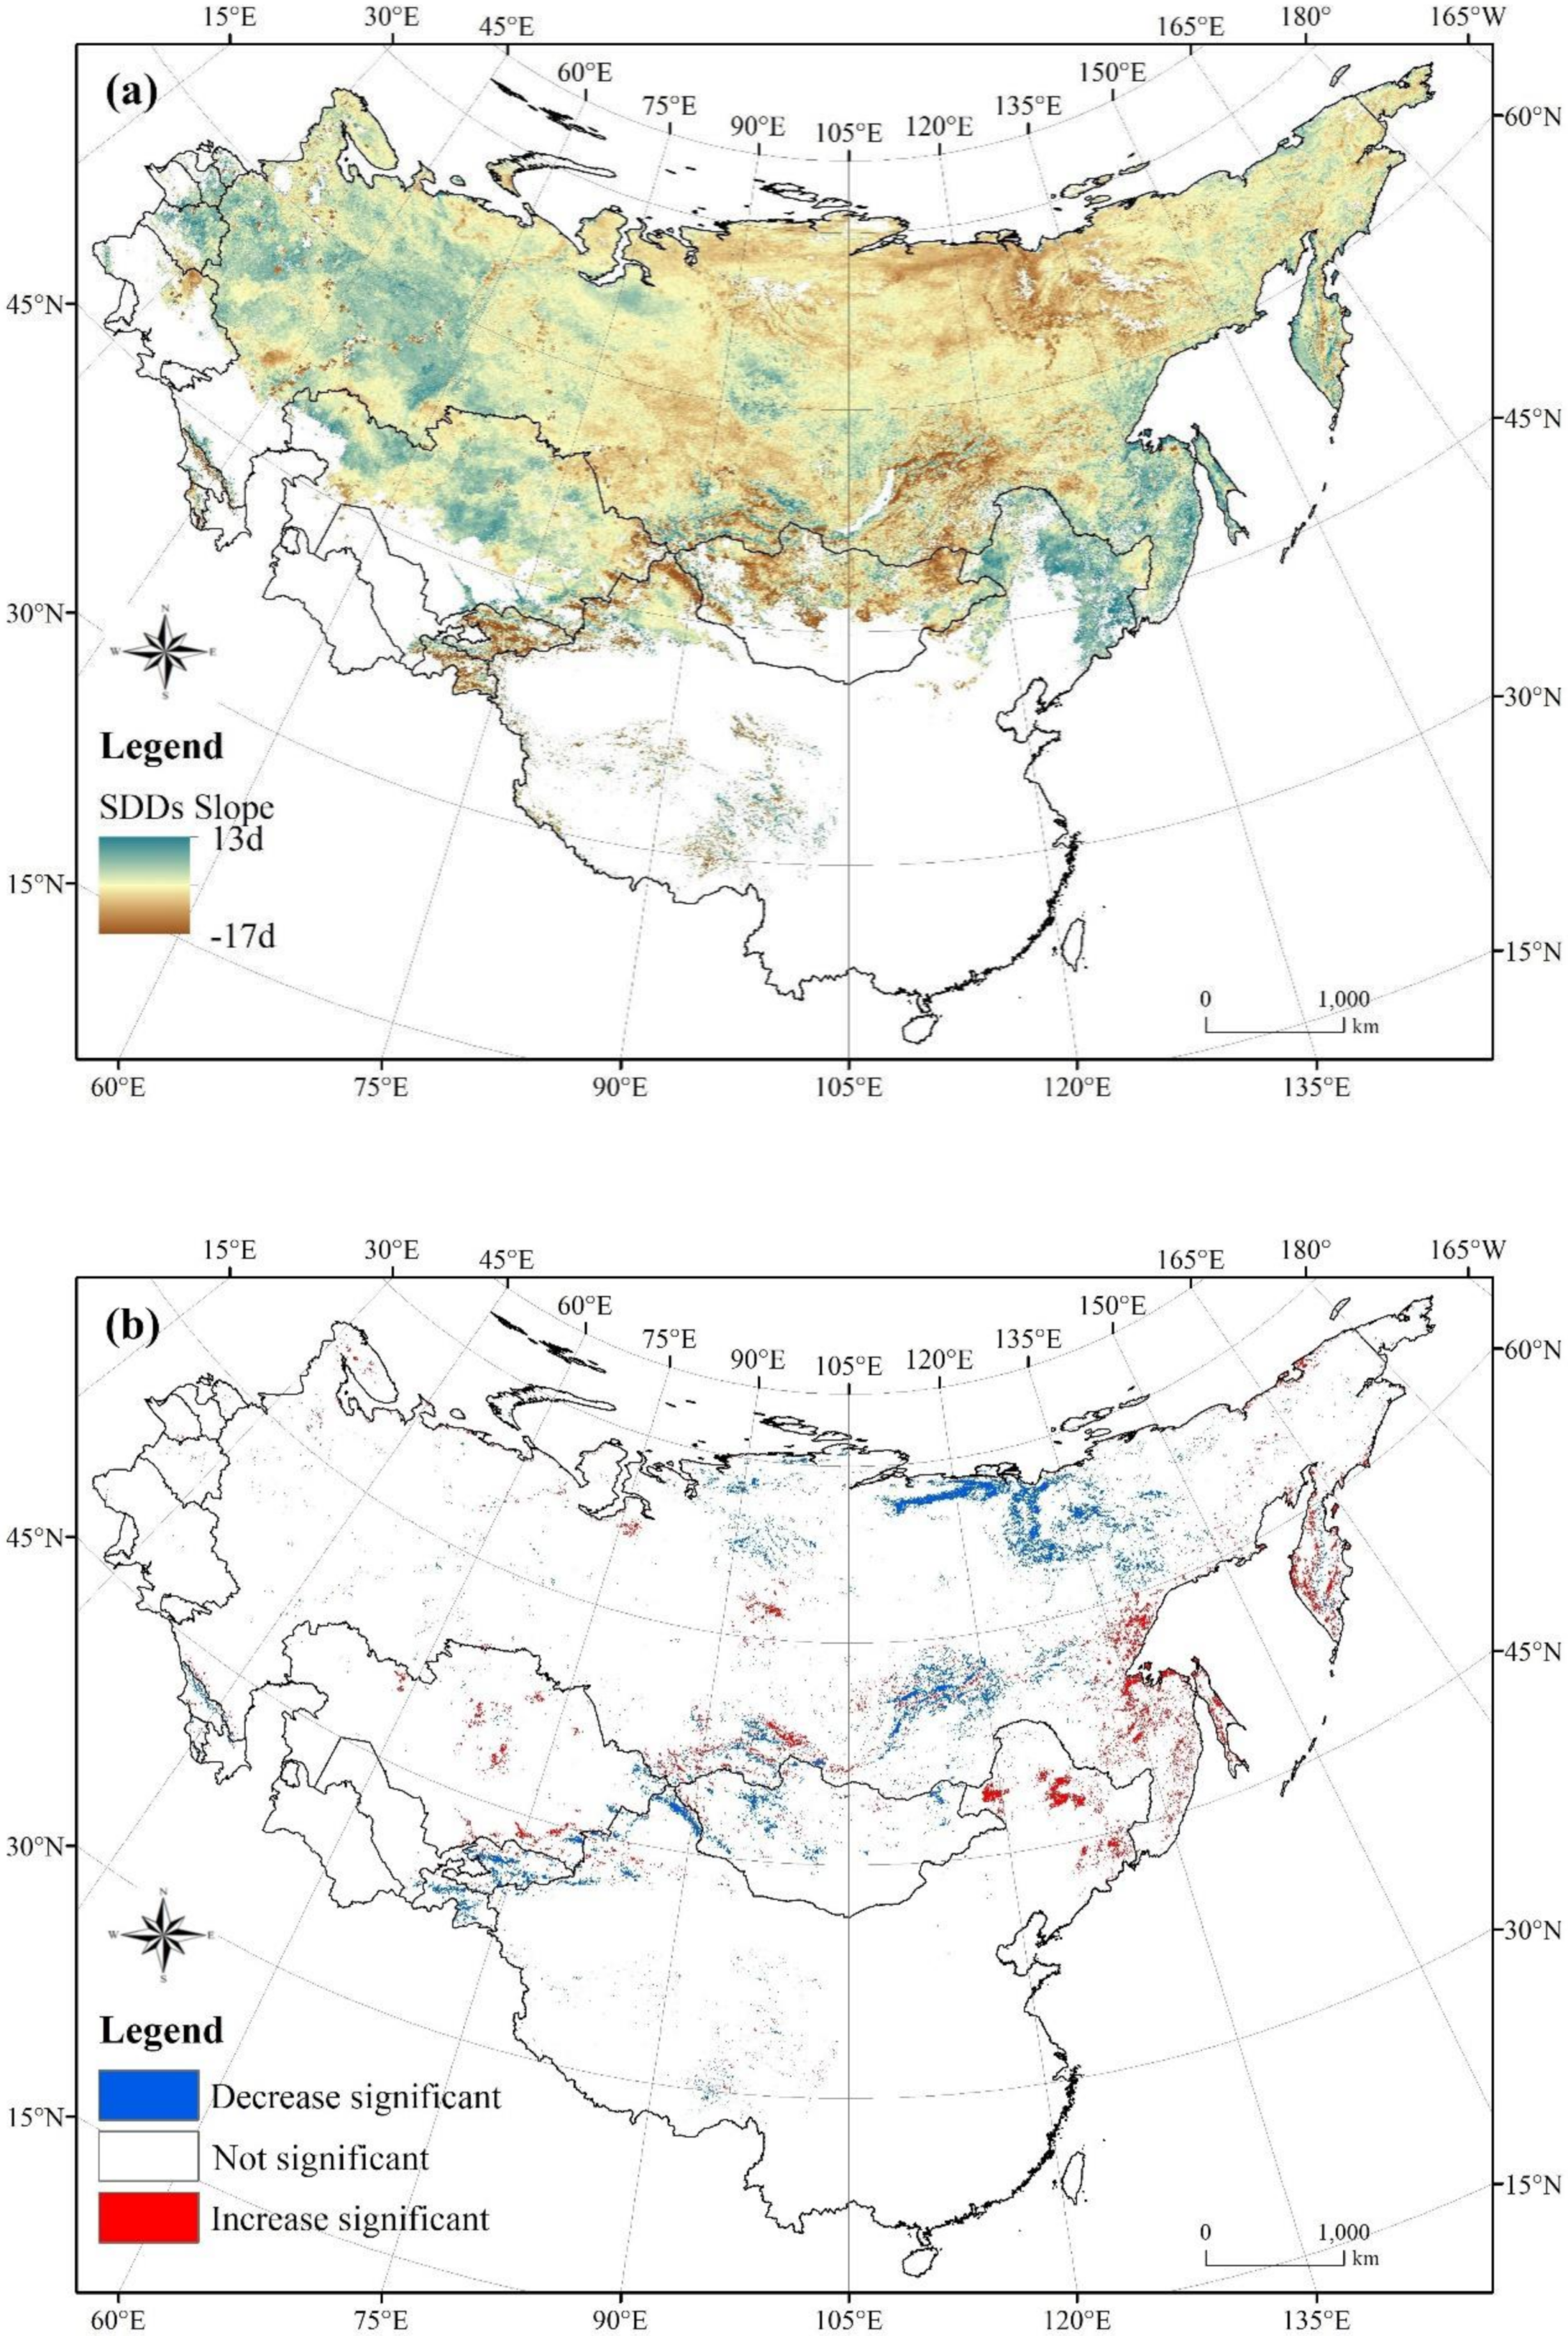
The SDDs also show characteristics of latitudinal and vertical zonal distribution. The SDDs are only about 3 months in length in the low latitudes and more than 200 days in the high latitudes. North of 60° N, the SDDs last almost 250 days. The SDDs in high altitude mountainous areas are on average longer than 200 days (Figure 14). The increase of SDDs accounts for 44.5% of the snow-covered area in the study area, while the decrease area accounts for 14.1%. Figure 15 indicates that the significant decrease in area accounts for 4.0% (p < 0.05), and the significant increase in area accounts for only 2.4% (p < 0.05). Among the regions, shortening SDDs are mainly concentrated in the inland highlands of the large part of Eurasia, such as the Siberian Plateau, Mongolian Plateau, and Tibetan Plateau. The regions with significantly increasing SDDs are mainly located in northeast China and the far eastern area near the Pacific Ocean.
5. Discussion
5.1. Daily Cloud-Free Snow Cover Products
MODIS daily snow cover products play a significant part in global and regional snow cover monitoring because of their high accuracy, good spatiotemporal continuity and high spatial resolution. However, because of cloud contamination, the MODIS daily snow cover products cannot sufficiently fulfill the snow cover product potential. Therefore, eliminating clouds in MODIS daily snow cover products has been one of the primary objectives in recent years [45]. Currently, the MODIS daily snow cover product cloud elimination algorithms are mainly obtained through the use of MODIS daily snow cover product fusion [46], adjacent day fusion [47,48], the snow-line method [49], and fusion with passive microwave [46,50]. In this study, three cloud removal algorithms, including the MODIS daily snow cover product fusion, adjacent day fusion and fusion with passive microwave and IMS snow cover products, were composited to eliminate cloud contamination. The results illustrate that the overall snow cover classification accuracy of the produced snow cover product was 71.04%, basically achieving the accuracy of the MODIS standard daily snow cover product released by NSIDC under clear sky conditions [51]. However, the shortcomings of the original snow cover product in complex terrain and canopy in a mountainous area have not been resolved in this study, which depends on the further improvement of the MODIS snow cover mapping algorithm in mountain and forest areas. Thus far, the snow cover mapping algorithm for MODIS data in mountain and forest regions is still challenging [52], and there are no special mature algorithms to improve the accuracy of present MODIS daily snow cover products.
5.2. Cross-Validation of Snow Cover Phenomenon between Remote Sensing and Ground Observations
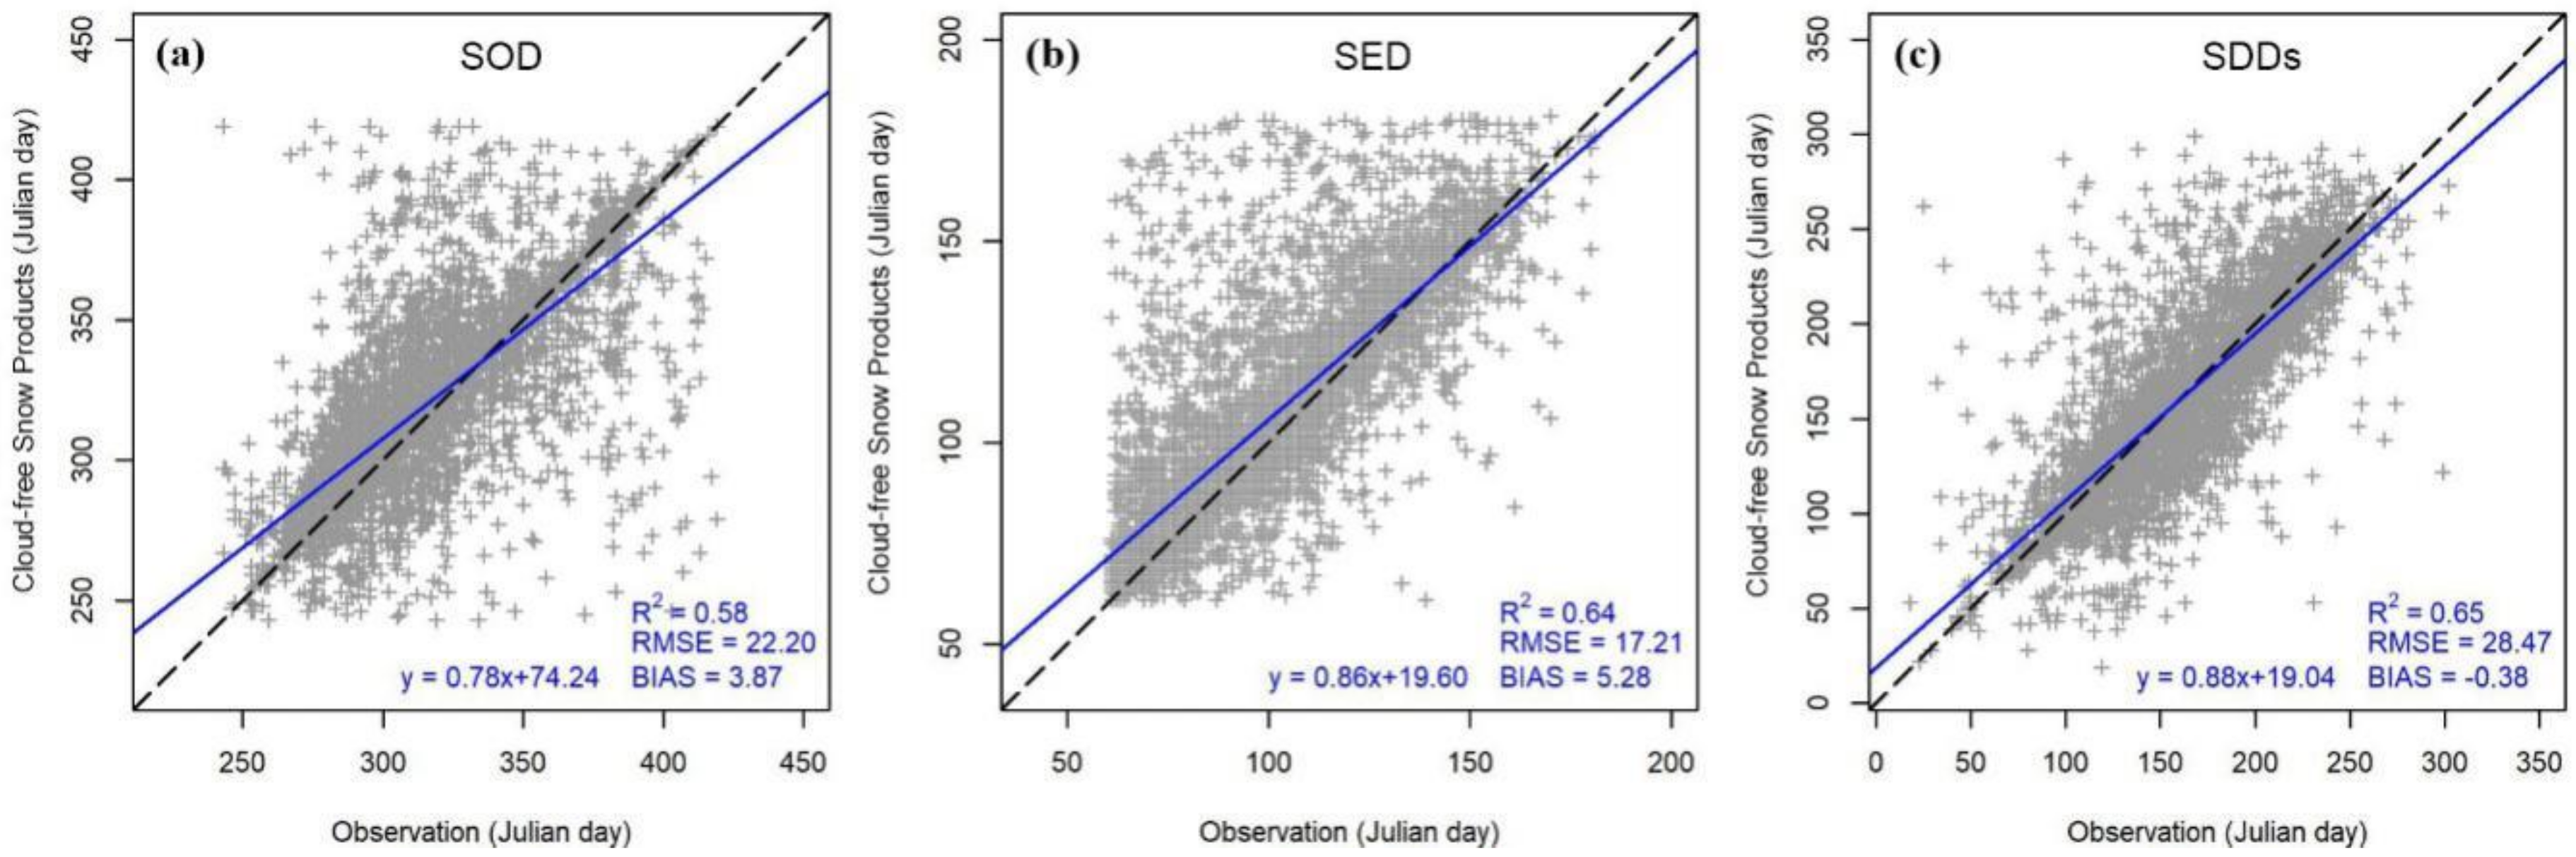
In order to further verify the spatiotemporal variations of snow phenology observed by satellite in this study, according to the same snow phenology parameter extraction scheme, the SOD, SED and SDDs were extracted from the ground observations in the large part of Eurasia and compared with the snow phenology parameters obtained by snow cover remote sensing products. Figure 16 shows that there are deviations between ground observations and remote sensing observations, but the overall correlation is good; the fitting coefficient (R2) ranges from 0.53 to 0.65, and the bias ratio ranges from -0.38 to 5.28, which indicates snow phenology dynamics observed by our produced daily snow product over the study area during the period from 2000 to 2016 is credible. The main reason for the deviation is that although the ground observations data can provide snow cover records in even longer time series, most ground stations had missing measurements. So even if the remote sensing observation has the characteristics of spatiotemporal continuity, there is still a certain gap between the two observations. Nevertheless, the daily high spatial resolution snow cover cloud-free product produced in this study has great reliability, which can be used to monitor long-term snow cover changes on a large scale with 500 m spatial resolution.
5.3. Heterogeneity Analysis
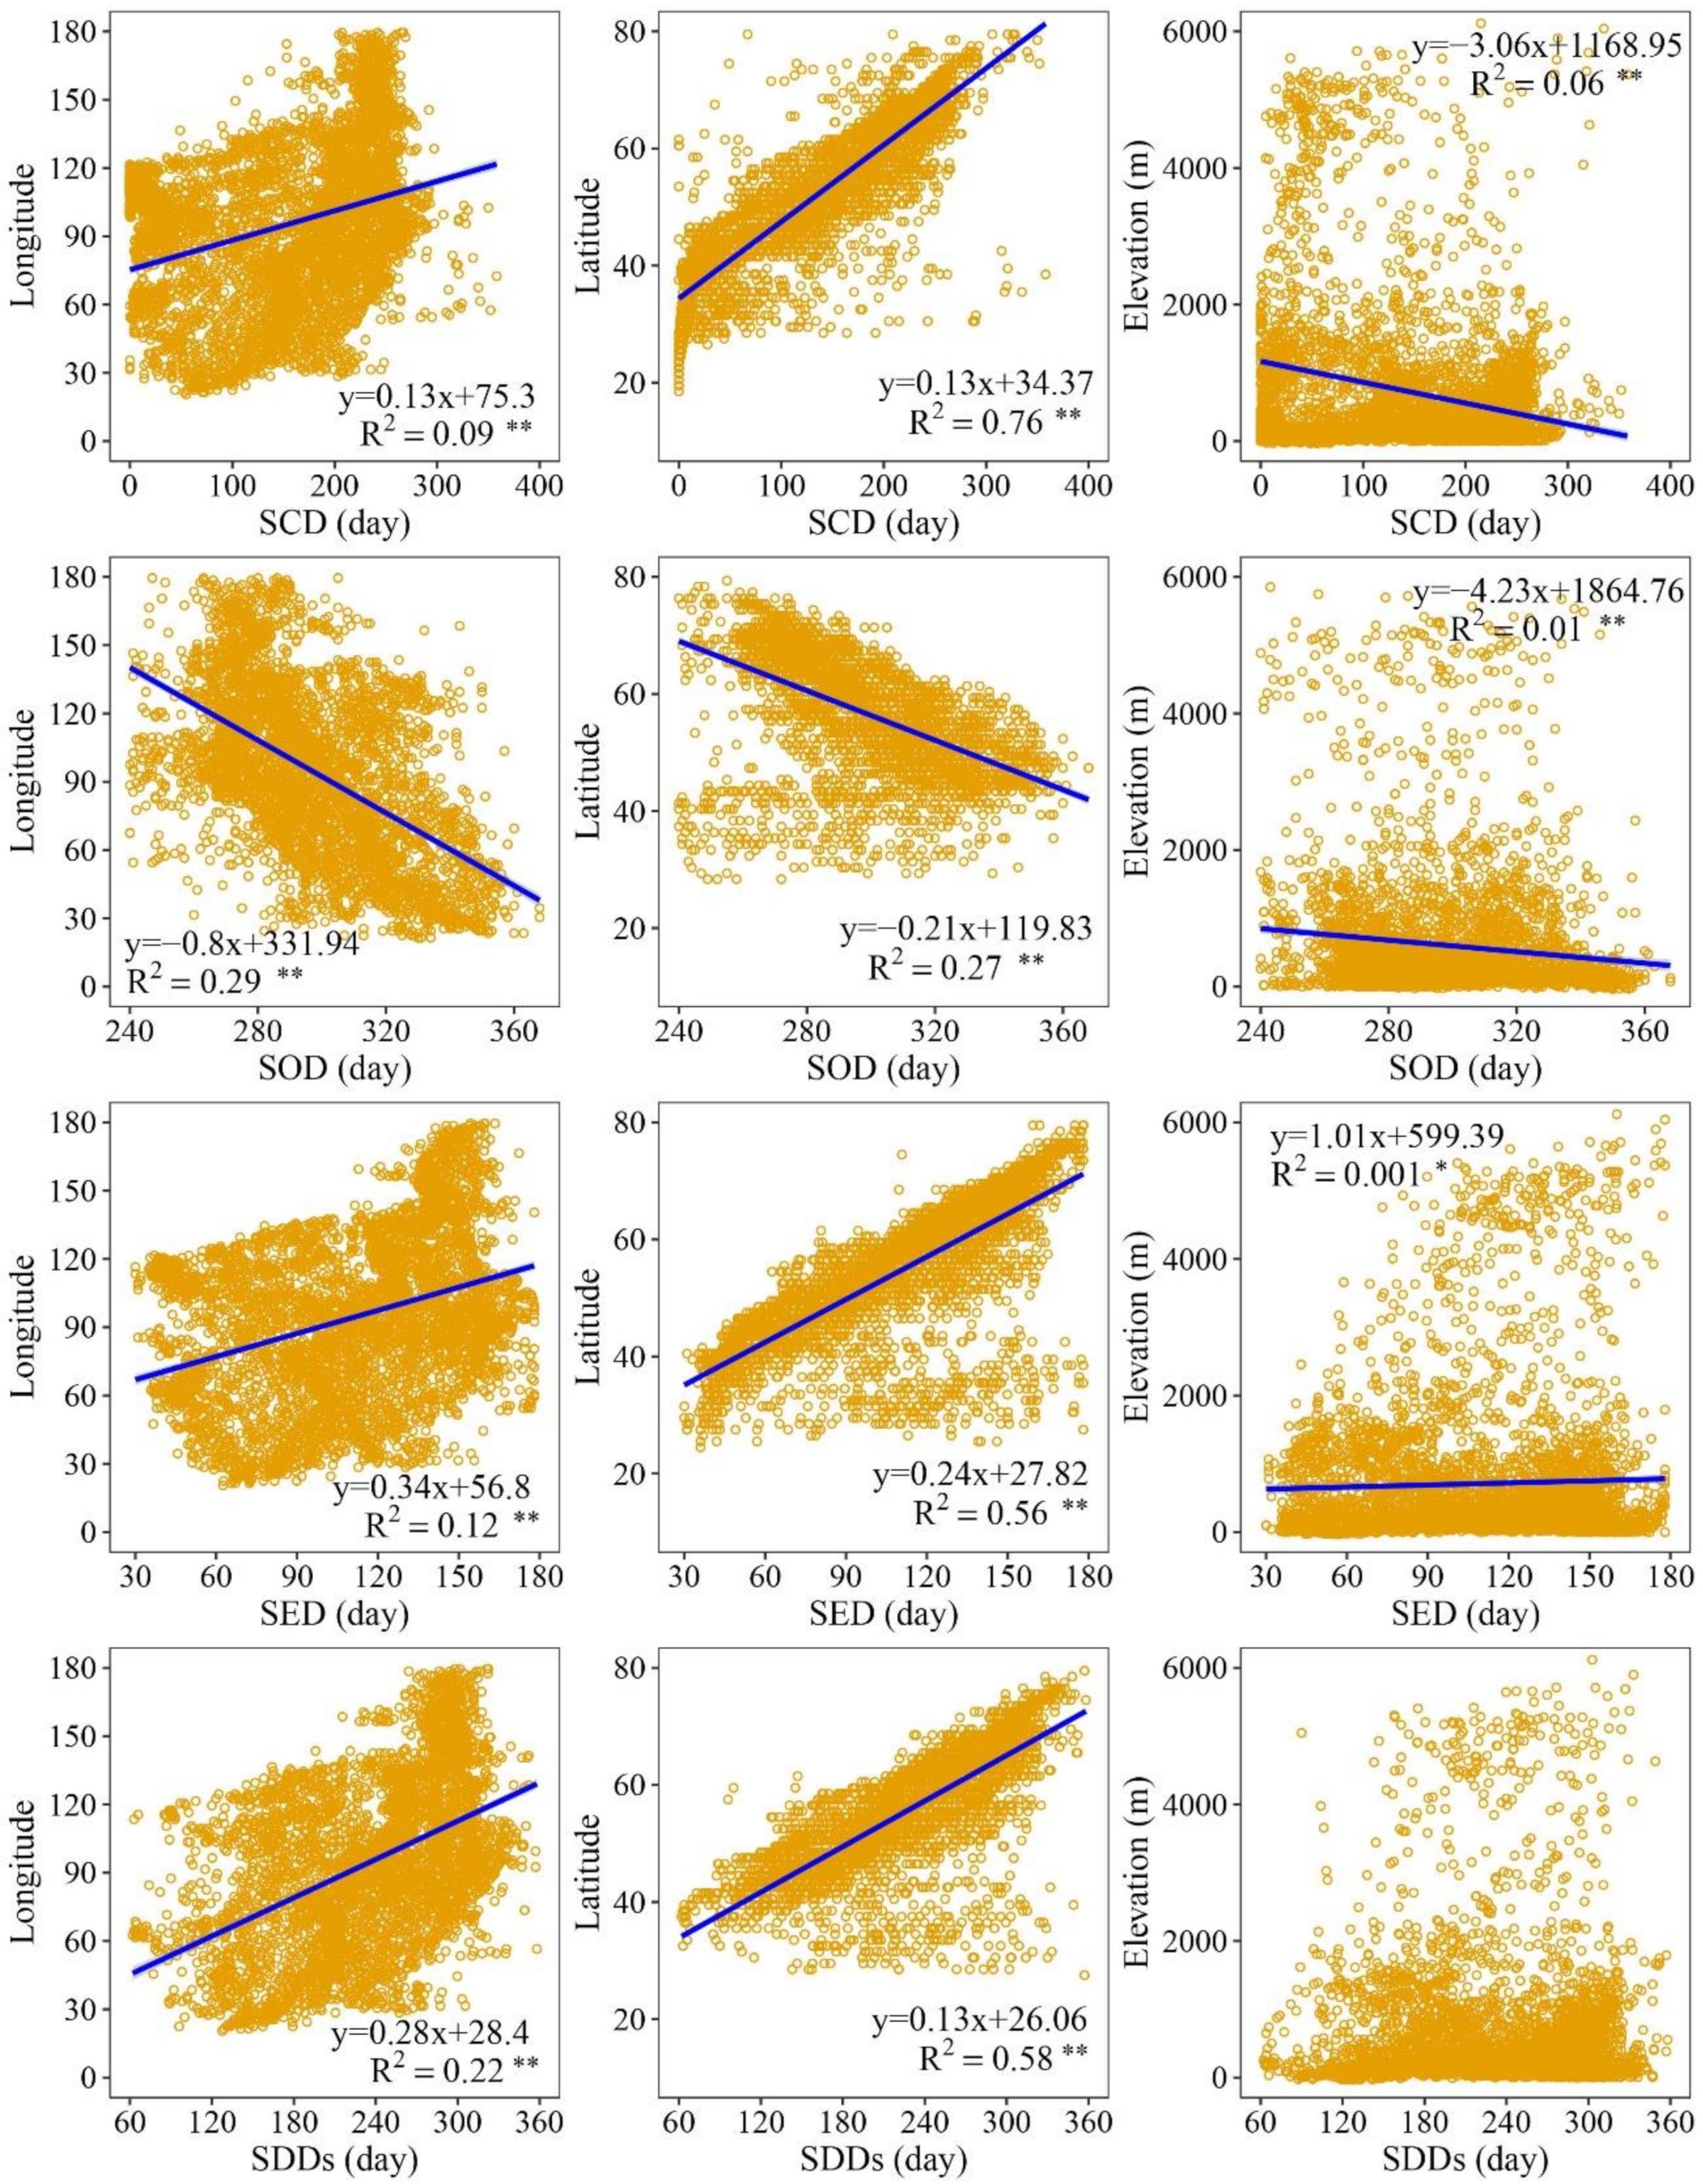
Figure 17 shows that latitude, longitude and altitude all contributed to the heterogeneity of SCDs and snow phenology (SOD, SED, SDDs). With the increase of latitude, SCDs gradually increase, SOD advances, SED delays, and SDDs gradually increase. From east to west, especially to the west of the study area SCDs decrease gradually, SOD delays, SED advances, and SDDs decrease gradually. The altitude in the mountainous areas will affect the SCDs and snow phenology. When the altitude is more than 1000 m, the SCDs increase gradually with the increase of altitude, the SOD advances, the SED delays, and the SDDs increase gradually. When the altitude is greater than 5000 m, the average SCDs is more than 200 days, SOD changes dramatically, and most of SED gradually begins after June. By analyzing the spatial distribution of snow phenology parameters, it can be found that geographical location and altitude are the main reasons that affect the spatial-temporal heterogeneity of snow phenology parameters.
5.4. Comparisons with Previous Results
Previous studies have demonstrated that the SCE over Eurasia has gradually declined in recent decades [17,18,19]. 70% of the Eurasia sites illustrated that SED occurs earlier during 1980–2006, while the SOD seemed to occur later, resulting in an overall decrease in SDDs [16]. The Eurasia SCE displays a declining tendency, although the SCE exhibits a clear increasing tendency in autumn, particularly in October. The declining SCE during springtime is mainly ascribed to warm air temperature. In addition, owing to the reduction of sea ice and the succeeding moisture transport to the atmosphere, the SCE in October increased [14]. In China, SCE decreases in summertime and wintertime, increases in spring and the fall seasons and experiences smooth annual variation [53]. The SCDs decline significantly in the west of the Tibetan Plateau as well as fractional areas over Central Asia and northwestern Russia but do not change much in other regions of Eurasia during 1972–2006 [54]. Rikiishi and Nakasato also reported that the SCDs decreased at all elevations of the Tibetan Plateau during 1966–2011 [55]. Groisman et al. recognized an increase in the SCDs in Russia during 1936–2004 [56]. On the other hand, Qin et al. pointed out an obviously increasing tendency of annual SCDs over the Tibetan Plateau from 1957 to 1998 [57]. Ye and Ellison found that the SDDs increase in some ways in northern Eurasia, but a decrease was apparent in southern Siberia during 1937–1994 [58]. An increase in SCDs is observed in the northeastern Kazakh Steppe, low as well as mid-elevation western Tien Shan, Pamiro-Alai and western Pamir, associated with both SOD advance and SED delay. A decrease in SCDs is observed in mountainous areas of Altai, Tien Shan and Pamir and vast areas of the plains surrounding the Aral Sea from 1986 to 2008 [59]. The SCDs show a decreasing trend on the Tibetan Plateau, especially at high altitudes, mainly due to decreased snowfall and increased rainfall and temperature for the SCDs decrease over the Tibetan Plateau during the period of 2001 to 2014 [60].
The results in this study are partially in line with previous results. Contrary to the snow cover change in the Northern Hemisphere, the average monthly SCE increased in winter in the large part of Eurasia but did not show an obvious increasing or decreasing tendency in the annual SCE throughout the large part of Eurasia between 2000 and 2016. The variation in snow phenology in the large part of Eurasia is spatially heterogeneous, which is also found in previous studies. The results of our study show that the SDDs decrease in plateaus, such as the central Siberian, Pamir and Tibetan Plateau, and the SDDs increase in the relatively low altitude plain areas, such as the West Siberian Plain and the Eastern European Plain region during the period of 2000 to 2016.
6. Conclusions
Snow phenology change is a direct response to climate change. It is of great significance to explore snow cover changes and its response to climate change on regional and hemisphere scales. The temporal and spatial dynamics of snow phenology in the large part of Eurasia from 2000 to 2016 were analyzed using the daily cloud-free snow cover product produced in this study. The following conclusions are obtained:
- (1)
- The snow cover accumulation begins in late September and reaches its maximum in early January, and the average maximum SCE reaches 79.8%. From the end of February, the snow cover begins to melt, and the ablation lasts until the end of May and reaches a minimum in early July. Although the snow cover in the Northern Hemisphere has decreased over the past 50 years [61,62], the results of this study indicate that SCE in the study area decreased only in June from 2000 to 2016; there is no obvious trend of daily SCE in the study area during the 17 years.
- (2)
- The stable snow cover areas, accounting for 78.8% of the study area, are mainly located north of latitude 45° N and the mountainous area of western China. The SCDs increase significantly in 6.4% and decrease significantly in 9.1% of the regions, respectively. The decreasing areas are mainly located in the Siberian Plateau, Mongolian Plateau and Tibetan Plateau, while the significant increase occurs mainly in the instantaneous snow cover areas of northeastern and southern China.
- (3)
- The variation in snow phenology is spatially heterogeneous. In the central Siberia, Pamir and Tibetan Plateau, the SOD tends to be delayed, the SED shows an advancing tendency, and the SDDs decrease from 2000 to 2016. While in the relatively low altitude plain areas, such as the West Siberian Plain and the Eastern European Plain region, the SOD tends to advance, the SED tends to be delayed, and the SDDs increase, but the increase is not significant.
Author Contributions
Y.S. implemented the data analysis and wrote the paper. T.Z. conceived the research and guided the implementation of the research, and revised and finalized the manuscript. Y.L. and W.Z. provided data analysis. X.H. provided some data and provided suggestions. All authors have read and agreed to the published version of the manuscript.
Funding
This research was funded by the Strategic Priority Research Program of Chinese Academy of Sciences (XDA20100313), the National Research and Development Program of China (2019YFC1509100) and the National Research and Development Program of China (2019YFA0607003).
Acknowledgments
The authors thank Gary D. Clow of Institute of Arctic and Alpine Research at the University of Colorado Boulder for improving the language of the manuscript, and the editors and three anonymous reviewers for their help and suggestions.
Conflicts of Interest
The authors declare no conflict of interest.
References
- Barnett, T.; Dümenil, L.; Schlese, U.; Roeckner, E. The effect of Eurasian snow cover on global climate. Science 1988, 239, 504–507. [Google Scholar] [CrossRef] [PubMed]
- Hansen, J.; Nazarenko, L. Soot climate forcing via snow and ice albedos. Proc. Natl. Acad. Sci. USA 2004, 101, 423–428. [Google Scholar] [CrossRef] [PubMed] [Green Version]
- Halder, S.; Dirmeyer, P.A. Relation of Eurasian snow cover and Indian summer monsoon rainfall: Importance of the delayed hydrological effect. J. Clim. 2017, 30, 1273–1289. [Google Scholar] [CrossRef]
- Chen, X.; Liang, S.; Cao, Y.; Wang, D. Observed contrast changes in snow cover phenology in northern middle and high latitudes from 2001–2014. Sci. Rep. 2015, 5, 1–9. [Google Scholar] [CrossRef] [Green Version]
- Trishchenko, A.P.; Wang, S. Variations of climate, surface energy budget, and minimum snow/ice extent over Canadian arctic landmass for 2000–2016. J. Clim. 2018, 31, 1155–1172. [Google Scholar] [CrossRef]
- Haynes, M.A.; Kung, K.-J.S.; Brandt, J.S.; Yongping, Y.; Waller, D.M. Accelerated climate change and its potential impact on Yak herding livelihoods in the eastern Tibetan plateau. Clim. Chang. 2014, 123, 147–160. [Google Scholar] [CrossRef]
- Cess, R.o.; Potter, G.; Zhang, M.H. Interpretation of snow-climate feedback as produced by 17 general circulation models. Science 1991, 253, 888–892. [Google Scholar] [CrossRef]
- Flanner, M.G.; Shell, K.M.; Barlage, M.; Perovich, D.K.; Tschudi, M.A. Radiative forcing and albedo feedback from the Northern Hemisphere cryosphere between 1979 and 2008. Nat. Geosci. 2011, 4, 151–155. [Google Scholar] [CrossRef]
- Thackeray, C.W.; Fletcher, C.G. Snow albedo feedback: Current knowledge, importance, outstanding issues and future directions. Prog. Phys. Geogr. 2016, 40, 392–408. [Google Scholar] [CrossRef]
- Parkinson, C.L. Earth’s cryosphere: Current state and recent changes. Annu. Rev. Environ. Resour. 2006, 31, 33–60. [Google Scholar] [CrossRef] [Green Version]
- Musselman, K.N.; Clark, M.P.; Liu, C.; Ikeda, K.; Rasmussen, R. Slower snowmelt in a warmer world. Nat. Clim. Chang. 2017, 7, 214–219. [Google Scholar] [CrossRef]
- Bulygina, O.; Razuvaev, V.; Korshunova, N. Changes in snow cover over Northern Eurasia in the last few decades. Environ. Res. Lett. 2009, 4, 045026. [Google Scholar] [CrossRef]
- Zhang, J.; Tian, W.; Chipperfield, M.P.; Xie, F.; Huang, J. Persistent shift of the Arctic polar vortex towards the Eurasian continent in recent decades. Nat. Clim. Chang. 2016, 6, 1094–1099. [Google Scholar] [CrossRef]
- Najafi, M.R.; Zwiers, F.W.; Gillett, N.P. Attribution of the spring snow cover extent decline in the Northern Hemisphere, Eurasia and North America to anthropogenic influence. Clim. Chang. 2016, 136, 571–586. [Google Scholar] [CrossRef] [Green Version]
- Cohen, J.; Furtado, J.C.; Jones, J.; Barlow, M.; Whittleston, D.; Entekhabi, D. Linking Siberian snow cover to precursors of stratospheric variability. J. Clim. 2014, 27, 5422–5432. [Google Scholar] [CrossRef]
- Mark, J.A.F.; Serreze, C. The Arctic on the fast track of change. Weather 2006, 61, 65–69. [Google Scholar]
- Intergovernmental Panel on Climate Change (IPCC); Working Group I Technical Support Unit. Climate Change 2013: The Physical Science Basis; Intergovernmental Panel on Climate Change: Geneva, Switzerland, 2013. [Google Scholar]
- Nolin, A.W. Recent advances in remote sensing of seasonal snow. J. Glaciol. 2010, 56, 1141–1150. [Google Scholar] [CrossRef] [Green Version]
- Choi, G.; Robinson, D.A.; Kang, S. Changing northern hemisphere snow seasons. J. Clim. 2010, 23, 5305–5310. [Google Scholar] [CrossRef]
- Cohen, J.; Screen, J.A.; Furtado, J.C.; Barlow, M.; Whittleston, D.; Coumou, D.; Francis, J.; Dethloff, K.; Entekhabi, D.; Overland, J.; et al. Recent Arctic amplification and extreme mid-latitude weather. Nat. Geosci. 2014, 7, 627. [Google Scholar] [CrossRef] [Green Version]
- Wang, Y.; Huang, X.; Liang, H.; Sun, Y.; Feng, Q.; Liang, T. Tracking snow variations in the Northern Hemisphere using multi-source remote sensing data (2000–2015). Remote Sens. 2018, 10, 136. [Google Scholar] [CrossRef] [Green Version]
- Brown, R.D.; Robinson, D.A. Northern Hemisphere spring snow cover variability and change over 1922–2010 including an assessment of uncertainty. Cryosphere 2011, 5, 219–229. [Google Scholar] [CrossRef] [Green Version]
- Mazari, N.; Ahmet, T.; Xie, H.; Sharif, H.; ElHassan, A.A. Assessment of ice mapping system and moderate resolution imaging spectroradiometer snow cover maps over Colorado Plateau. J. Appl. Remote Sens. 2013, 7, 073540. [Google Scholar] [CrossRef]
- Wulder, M.A.; Nelson, T.A.; Derksen, C.; Seemann, D. Snow cover variability across central Canada (1978–2002) derived from satellite passive microwave data. Clim. Chang. 2007, 82, 113–130. [Google Scholar] [CrossRef]
- Takala, M.; Luojus, K.; Pulliainen, J.; Derksen, C.; Lemmetyinen, J.; Karna, J.-P.; Koskinen, J.; Bojkov, B. Estimating northern hemisphere snow water equivalent for climate research through assimilation of space-borne radiometer data and ground-based measurements. Remote Sens. Environ. 2011, 115, 3517–3529. [Google Scholar] [CrossRef]
- Hall, D.K.; Foster, J.L.; Salomonson, V.V.; Klein, A.G.; Chien, J.Y.L. Development of a technique to assess snow-cover mapping errors from space. IEEE Trans. Geosci. Remote Sens. 2001, 39, 432–438. [Google Scholar] [CrossRef]
- Dye, D.G. Variability and trends in the annual snow-cover cycle in Northern Hemisphere land areas, 1972–2000. Hydrol. Process 2002, 16, 3065–3077. [Google Scholar] [CrossRef]
- Stocker, T.F.; Qin, D.; Plattner, G.K.; Tignor, M.M.B.; Allen, S.K.; Boschung, J.; Nauels, A.; Xia, Y.; Bex, V.; Midgley, P.M.; et al. Climate change 2013: The physical science basis. In Contribution of Working Group I to the Fifth Assessment Report of the Intergovernmental Panel on Climate Change; Cambridge University Press: Cambridge, UK, 2013. [Google Scholar]
- Rupp, D.E.; Mote, P.W.; Bindoff, N.L.; Scott, P.A.; Robinson, D.A. Detection and attribution of observed changes in Northern Hemisphere spring snow cover. J. Clim. 2013, 26, 6904–6914. [Google Scholar] [CrossRef]
- Brown, R.; Derksen, C.; Wang, L. A multi-data set analysis of variability and change in Arctic spring snow cover extent, 1967–2008. J. Geophys. Res. Atmos. 2010, 115, D16. [Google Scholar] [CrossRef]
- Hall, D.K.; Riggs, G.A.; Salomonson, V.V.; DiGirolamo, N.E.; Bayr, K.J. MODIS snow-cover products. Remote Sens. Environ. 2002, 83, 181–194. [Google Scholar] [CrossRef] [Green Version]
- Feng, Q.; Zhang, X.; Liang, T. Dynamic monitoring of snow cover based on MOD10A1 and AMSR-E in the north of Xinjiang Province, China. Acta Pratacult. Sin. 2009, 18, 125–133. [Google Scholar]
- Helfrich, S.R.; McNamara, D.; Ramsay, B.H.; Baldwin, T.; Kasheta, T. Enhancements to, and forthcoming developments in the Interactive Multisensor Snow and Ice Mapping System (IMS). Hydrol. Process 2007, 21, 1576–1586. [Google Scholar] [CrossRef]
- Liang, H.; Huang, X.; Sun, Y.; Wang, Y.; Liang, T. Fractional snow-cover mapping based on MODIS and UAV data over the Tibetan Plateau. Remote Sens. 2017, 9, 1332. [Google Scholar] [CrossRef] [Green Version]
- Liu, X.; Jin, X.; Ke, C. Accuracy evaluation of the IMS snow and ice products in stable snow covers regions in China. J. Glaciol. Geocryol. 2014, 36, 500–507. [Google Scholar]
- Huang, X.; Hao, X.; Wang, W.; Feng, Q.S.; Liang, T. Algorithms for cloud removal in MODIS daily snow products. J. Glaciol. Geocryol. 2012, 34, 1118–1126. [Google Scholar]
- Lee, Y.-K.; Kongoli, C.; Key, J. An in-depth evaluation of heritage algorithms for snow cover and snow depth using AMSR-E and AMSR2 measurements. J. Atmos. Ocean. Technol. 2015, 32, 2319–2336. [Google Scholar] [CrossRef]
- World Meteorological Organization (WMO). Guide to Meteorological Instruments and Methods of Observation, WMO-No. 8; Chairperson, Publications Board: Geneva, Switzerland, 1996. [Google Scholar]
- Yu, J.; Zhang, G.; Yao, T.; Xie, H.; Zhang, H.; Ke, C.; Yao, R. Developing Daily Cloud-Free Snow Composite Products From MODIS Terra-Aqua and IMS for the Tibetan Plateau. IEEE Trans. Geosci. Remote Sens. 2016, 54, 2171–2180. [Google Scholar] [CrossRef]
- Gao, Y.; Xie, H.; Lu, N.; Yao, T.; Liang, T. Toward advanced daily cloud-free snow cover and snow water equivalent products from Terra–Aqua MODIS and Aqua AMSR-E measurements. J. Hydrol. 2010, 385, 23–35. [Google Scholar] [CrossRef]
- Yang, J.; Jiang, L.; Ménard, C.B.; Luojus, K.; Lemmetyinen, J.; Pulliainen, J. Evaluation of snow products over the Tibetan Plateau. Hydrol. Process 2015, 29, 3247–3260. [Google Scholar] [CrossRef]
- Xianwei, W.; Xi, H. New methods for studying the spatiotemporal variation of snow cover based on combination products of MODIS Terra and Aqua. J. Hydrol. 2009, 371, 192–200. [Google Scholar]
- Stow, D.A.; Hope, A.; McGuire, D.; Verbyla, D.; Gamon, J.; Huemmrich, F.; Houston, S.; Racine, C.; Sturm, M.; Tape, K.; et al. Remote sensing of vegetation and land-cover change in Arctic Tundra Ecosystems. Remote Sens. Environ. 2004, 89, 281–308. [Google Scholar] [CrossRef] [Green Version]
- Zhang, T.J.; Zhong, X.Y. Classification and regionallization of the seasonal snow cover across the Eurasian Continent. J. Glaciol. Geocryol. 2014, 36, 481–490. [Google Scholar]
- Gafurov, A.; Bárdossy, A. Cloud removal methodology from MODIS snow cover product. Hydrol. Earth Syst. Sci. 2009, 13, 1361–1373. [Google Scholar] [CrossRef] [Green Version]
- Liang, T.G.; Huang, X.D.; Wu, C.X.; Liu, X.Y.; Li, W.L.; Guo, Z.G.; Ren, J.Z. An application of MODIS data to snow cover monitoring in a pastoral area: A case study in Northern Xinjiang, China. Remote Sens. Environ. 2008, 112, 1514–1526. [Google Scholar] [CrossRef]
- Hall, D.K.; Riggs, G.A.; Foster, J.L.; Kumar, S.V. Development and evaluation of a cloud-gap-filled MODIS daily snow-cover product. Remote Sens. Environ. 2010, 114, 496–503. [Google Scholar] [CrossRef] [Green Version]
- Huang, X.D.; Hao, X.H.; Wang, W.; Liang, T. A new MODIS daily cloud free snow cover mapping algorithm on the Tibetan Plateau. Sci. Cold Arid Reg. 2014, 6, 0116–0123. [Google Scholar]
- Parajka, J.; Pepe, M.; Rampini, A.; Rossi, S.; Blöschl, G. A regional snow-line method for estimating snow cover from MODIS during cloud cover. J. Hydrol. 2010, 381, 203–212. [Google Scholar] [CrossRef]
- Liang, T.; Zhang, X.; Xie, H.; Wu, C.; Feng, Q.; Huang, X.; Chen, Q.; Quangong, C. Toward improved daily snow cover mapping with advanced combination of MODIS and AMSR-E measurements. Remote Sens. Environ. 2008, 112, 3750–3761. [Google Scholar] [CrossRef]
- Hall, D.K.; Riggs, G.A. Accuracy assessment of the MODIS snow products. Hydrol. Process 2007, 21, 1534–1547. [Google Scholar] [CrossRef]
- Wang, W.; Huang, X.; Deng, J.; Xie, H.; Liang, T. Spatio-temporal change of snow cover and its response to climate over the Tibetan Plateau based on an improved daily cloud-free snow cover product. Remote Sens. 2015, 7, 169–194. [Google Scholar] [CrossRef]
- Huang, X.; Deng, J.; Ma, X.; Wang, Y.; Feng, Q.; Hao, X.; Liang, T. Spatiotemporal dynamics of snow cover based on multi-source remote sensing data in China. Cryosphere 2016, 10, 2453. [Google Scholar] [CrossRef] [Green Version]
- Zhang, Y.; Ma, N. Spatiotemporal variability of snow cover and snow water equivalent in the last three decades over Eurasia. J. Hydrol. 2018, 559, 238–251. [Google Scholar] [CrossRef]
- Rikiishi, K.; Nakasato, H. Height dependence of the tendency for reduction in seasonal snow cover in the Himalaya and the Tibetan Plateau region, 1966–2001. Ann. Glaciol. 2006, 43, 369–377. [Google Scholar] [CrossRef] [Green Version]
- Groisman, P.Y.; Knight, R.W.; Razuvaev, V.N.; Bulygina, O.N.; Karl, T.R. State of the ground: Climatology and changes during the past 69 years over northern Eurasia for a rarely used measure of snow cover and frozen land. J. Clim. 2006, 19, 4933–4955. [Google Scholar] [CrossRef]
- Qin, D.H.; Liu, S.Y.; Li, P.J. Snow cover distribution, variability, and response to climate change in western China. J. Clim. 2006, 19, 1820–1833. [Google Scholar]
- Ye, H.; Ellison, M. Changes in transitional snowfall season length in northern Eurasia. Geophys. Res. Lett. 2003, 30, 1252. [Google Scholar] [CrossRef]
- Zhou, H.; Aizen, E.; Aizen, V. Seasonal snow cover regime and historical change in Central Asia from 1986 to 2008. Glob. Planet. Change 2017, 148, 192–216. [Google Scholar] [CrossRef] [Green Version]
- Huang, X.; Deng, J.; Wang, W.; Feng, Q.; Liang, T. Impact of climate and elevation on snow cover using integrated remote sensing snow products in Tibetan Plateau. Remote Sens. Environ. 2017, 190, 274–288. [Google Scholar] [CrossRef]
- Notarnicola, C. Hotspots of snow cover changes in global mountain regions over 2000–2018. Remote Sens. Environ. 2020, 243, 111781. [Google Scholar] [CrossRef]
- Wang, X.; Wu, C.; Wang, H.; Gonsamo, A.; Liu, Z. No evidence of widespread decline of snow cover on the Tibetan Plateau over 2000–2015. Sci. Rep. 2017, 7, 1–10. [Google Scholar] [CrossRef]
Figure 1.
Location and distribution of ground observation sites across the study area: (a) MODIS land cover types (MCD12Q1), and (b) Shuttle Radar Topography Mission (SRTM) digital elevation model.
Figure 1.
Location and distribution of ground observation sites across the study area: (a) MODIS land cover types (MCD12Q1), and (b) Shuttle Radar Topography Mission (SRTM) digital elevation model.

Figure 2.
Validation of the daily cloud-free snow cover product using ground observation for each individual site during the period of 2000 and 2012. (a) Total accuracy, (b) Snow cover accuracy, (c) Snow free accuracy, and (d) Snow-covered days.
Figure 2.
Validation of the daily cloud-free snow cover product using ground observation for each individual site during the period of 2000 and 2012. (a) Total accuracy, (b) Snow cover accuracy, (c) Snow free accuracy, and (d) Snow-covered days.

Figure 3.
Average daily variation of snow cover extent (SCE) across the study area from 2000 to 2016. The red line represents the average daily value of SCE. The black lines show average daily SCE increases and decreases with one standard deviation, respectively. The grey region indicates the range of SCE of each day. The red dotted line shows the time of average maximum SCE of 27.08 × 10⁶ km2 (79.8% of study area), that is January 7. The blue dotted line shows the time of average minimum SCE of 0.14 × 10⁶ km2 (0.4% of study area), that is July 11.

Figure 4.
Average monthly variation of SCE in the study area from 2000 to 2016. The black dots and red lines represent median and mean values, respectively.
Figure 4.
Average monthly variation of SCE in the study area from 2000 to 2016. The black dots and red lines represent median and mean values, respectively.

Figure 5.
Monthly anomaly of average SCE in the study area from 2000 to 2016. The black line and blue line show the anomaly and zero values, respectively.
Figure 5.
Monthly anomaly of average SCE in the study area from 2000 to 2016. The black line and blue line show the anomaly and zero values, respectively.

Figure 6.
Daily variation of SCE in the study area from 2000 to 2016. The blue dots and red dots indicate the maximum and minimum SCE in every year, respectively.
Figure 6.
Daily variation of SCE in the study area from 2000 to 2016. The blue dots and red dots indicate the maximum and minimum SCE in every year, respectively.

Figure 7.
Inter-annual variation of snow cover area index (SCAI) in the study area from 2000 to 2016: (a) SCAI variation, and (b) SCAI anomaly, respectively.
Figure 7.
Inter-annual variation of snow cover area index (SCAI) in the study area from 2000 to 2016: (a) SCAI variation, and (b) SCAI anomaly, respectively.

Figure 8.
(a) The spatial distribution of annual mean snow-covered days (SCDs) in the study area from 2000 to 2016, and (b) reclassification of SCDs based on snow cover types.
Figure 8.
(a) The spatial distribution of annual mean snow-covered days (SCDs) in the study area from 2000 to 2016, and (b) reclassification of SCDs based on snow cover types.

Figure 9.
(a) The trend of SCDs, and (b) the significant test in the study area from 2000 to 2016.

Figure 10.
The spatial distribution of the annual mean cover onset day (SOD) in the study area from 2000 to 2016. (Note: SPi > 365 accounts for SOD in the next year, e.g., 370th for January 5 in the next year).
Figure 10.
The spatial distribution of the annual mean cover onset day (SOD) in the study area from 2000 to 2016. (Note: SPi > 365 accounts for SOD in the next year, e.g., 370th for January 5 in the next year).

Figure 11.
(a) The trend of SOD, and (b) the significant test in the study area from 2000 to 2016.

Figure 12.
The spatial distribution of annual mean snow cover ending day (SED) in the study area from 2000 to 2016.
Figure 12.
The spatial distribution of annual mean snow cover ending day (SED) in the study area from 2000 to 2016.

Figure 13.
(a) The trend of SED, and (b) the significant test in the study area from 2000 to 2016.

Figure 14.
The spatial distribution of annual mean snow cover duration days (SDDs) in the study area from 2000 to 2016.
Figure 14.
The spatial distribution of annual mean snow cover duration days (SDDs) in the study area from 2000 to 2016.

Figure 15.
(a) The trend of SDDs, and (b) the significant test in the study area from 2000 to 2016.

Figure 16.
Cross-validation of snow phenology parameters ((a) SOD, (b) SED, (c) SDDs) between cloud-free snow cover product and ground observations. The blue line is the linear fit between cloud-free snow cover product and ground observations. The grey points show the agreement between cloud-free snow cover product and ground observations.

Figure 17.
The variation of annual mean snow phenology characteristics with the change of latitude, longitude and elevation in the study area from 2000 to 2016. The blue lines and yellow dots represent the linear fit and agreement between snow phenology parameters and longitude, latitude, and elevation, respectively. Significant codes for linear regressions: **, p < 0.01; *, p < 0.05.


Table 1.
Remote sensing data used in this study.
| Dataset | Resolution (km) | Period |
|---|---|---|
| MOD10A1 | 0.5 | February 24, 2000–December 31, 2016 |
| MYD10A1 | 0.5 | September 4, 2002–December 31, 2016 |
| AMSR-E | 25 | September 4, 2002–September 2, 2011 |
| IMS | 24 | January 1, 2000–September 4, 2002 |
| 4 | September 4, 2011–December 1, 2014 | |
| 1 | December 2, 2014–December 31, 2016 |
IMS = ice mapping system.
© 2020 by the authors. Licensee MDPI, Basel, Switzerland. This article is an open access article distributed under the terms and conditions of the Creative Commons Attribution (CC BY) license (http://creativecommons.org/licenses/by/4.0/).
Share and Cite
MDPI and ACS Style
Sun, Y.; Zhang, T.; Liu, Y.; Zhao, W.; Huang, X. Assessing Snow Phenology over the Large Part of Eurasia Using Satellite Observations from 2000 to 2016. Remote Sens. 2020, 12, 2060. https://0-doi-org.brum.beds.ac.uk/10.3390/rs12122060
AMA Style
Sun Y, Zhang T, Liu Y, Zhao W, Huang X. Assessing Snow Phenology over the Large Part of Eurasia Using Satellite Observations from 2000 to 2016. Remote Sensing. 2020; 12(12):2060. https://0-doi-org.brum.beds.ac.uk/10.3390/rs12122060
Chicago/Turabian StyleSun, Yanhua, Tingjun Zhang, Yijing Liu, Wenyu Zhao, and Xiaodong Huang. 2020. "Assessing Snow Phenology over the Large Part of Eurasia Using Satellite Observations from 2000 to 2016" Remote Sensing 12, no. 12: 2060. https://0-doi-org.brum.beds.ac.uk/10.3390/rs12122060
Note that from the first issue of 2016, this journal uses article numbers instead of page numbers. See further details here.