Article

Cirrus Cloud Identification from Airborne Far-Infrared and Mid-Infrared Spectra

1
Department of Physics and Astronomy, University of Bologna, 40126 Bologna, Italy
2
Physics Department, Imperial College London, London SW7 2BU, UK
3
National Centre for Earth Observation, Leicester LE1 7RH, UK
4
Met Office, FitzRoy Road, Exeter EX1 3PB, UK
5
European Space Agency, ESTEC, 2201 AZ Noordwijk, The Netherlands
*
Author to whom correspondence should be addressed.
These authors contributed equally to this work.
Remote Sens. 2020, 12(13), 2097; https://0-doi-org.brum.beds.ac.uk/10.3390/rs12132097
Submission received: 25 May 2020 / Revised: 24 June 2020 / Accepted: 25 June 2020 / Published: 30 June 2020
(This article belongs to the Special Issue Remote Sensing of Clouds)

Abstract

:
Airborne interferometric data, obtained from the Cirrus Coupled Cloud-Radiation Experiment (CIRCCREX) and from the PiknMix-F field campaign, are used to test the ability of a machine learning cloud identification and classification algorithm (CIC). Data comprise a set of spectral radiances measured by the Tropospheric Airborne Fourier Transform Spectrometer (TAFTS) and the Airborne Research Interferometer Evaluation System (ARIES). Co-located measurements of the two sensors allow observations of the upwelling radiance for clear and cloudy conditions across the far- and mid-infrared part of the spectrum. Theoretical sensitivity studies show that the performance of the CIC algorithm improves with cloud altitude. These tests also suggest that, for conditions encompassing those sampled by the flight campaigns, the additional information contained within the far-infrared improves the algorithm’s performance compared to using mid-infrared data only. When the CIC is applied to the airborne radiance measurements, the classification performance of the algorithm is very high. However, in this case, the limited temporal and spatial variability in the measured spectra results in a less obvious advantage being apparent when using both mid- and far-infrared radiances compared to using mid-infrared information only. These results suggest that the CIC algorithm will be a useful addition to existing cloud classification tools but that further analyses of nadir radiance observations spanning the infrared and sampling a wider range of atmospheric and cloud conditions are required to fully probe its capabilities. This will be realised with the launch of the Far-infrared Outgoing Radiation Understanding and Monitoring (FORUM) mission, ESA’s 9th Earth Explorer.

Graphical Abstract

1. Introduction

The Far-Infrared (FIR), spanning the spectral interval 100–667 cm 1 , represents an important fraction of the Earth’s outgoing long wave radiation, which makes a considerable contribution to the planetary energy balance [1]. Radiance at FIR wavenumbers is remarkably sensitive to the upper troposphere water vapor concentration and temperature profile (e.g., [2,3]) and to physical properties of high-level clouds (see [4] among others). Moreover, in very dry, clear conditions, such as those often seen in the Arctic and Antarctic interiors, some FIR channels between 350 and 600 cm 1 become very transparent, potentially allowing the retrieval of the surface properties of these regions.
New focus on the FIR has been developed due to the selection, in September 2019, of the FORUM [5] mission as the ESA’s 9th Earth Explorer. Earth Explorer missions are devoted to innovative measurement techniques to explore and understand different aspects of the Earth system, addressing questions that have a direct bearing on scientific and societal issues, such as the availability of food, water, energy and resources, public health and climate change [5]. FORUM has the objective to evaluate the role of the far-infrared in shaping the current climate and thus reduce uncertainty in predictions of future climate change by:
  • building a highly accurate global dataset of far-infrared radiances for validation of the present-day state as captured by Earth system models,
  • using these measurements to understand and constrain the processes that control far-infrared radiative transfer and hence the Earth’s Greenhouse Effect,
  • updating the parameterizations of these processes for implementation in radiative transfer codes, and ultimately in Earth system models,
  • characterising critical feedback mechanisms.
The main instrumental component of the FORUM mission is an infrared spectrometer devoted to spectrally resolved measurements from 100 to 1600 cm 1 , thus including the FIR region. The satellite will also be equipped with a high spatial resolution imager collecting radiance from a single channel located in the Mid-Infrared (MIR) window.
The importance of cirrus clouds in shaping the Earth’s outgoing long wave spectral radiation and the total energy balance has been highlighted by many authors [6,7,8]. Despite this, their role for cloud feedback is not yet completely understood [9]. Recently, simulations have been used to show that FIR can contribute to improve the detection of thin cirrus cloud [4,10] and that FIR and MIR measurements can be combined to efficiently retrieve the cloud properties and the atmospheric state (water vapor and temperature profiles) [11,12]. The detection of thin cirrus clouds and the derivation of some of their features have been improved by using active satellite sensors [13,14,15]. Nevertheless, the application of a cloud identification methodology directly to punctual infrared hyperspectral radiance measurements and the subsequent derivation of the main geometrical (i.e., altitude), microphysical (i.e., effective dimension), and radiative (i.e., optical depth) cloud properties from a single spectrum allow us to avoid spatial and temporal colocation and biases due to the use of multiple and heterogeneous instrumentation.
Currently, very few instruments can observe spectrally resolved radiances in the FIR part of the spectrum and none of them is flying on satellite. Those that do exist include the Radiation Explorer in the Far-Infrared—Prototype of Applications and Development (REFIR-PAD) [16], the Far-Infrared Radiation Mobile Observation System (FIRMOS) developed, built, tested, and successfully deployed in a field experiment during the FORUM Phase A studies [5], the Far-Infrared Spectroscopy of the Troposphere (FIRST) [17], and the Tropospheric Airborne Fourier Transform Spectrometer (TAFTS) [18]. The majority of spectrally resolved radiance datasets spanning the FIR consist of downwelling spectra collected from ground-based sites. Therefore, airborne data such as those obtained from TAFTS during the Cirrus Coupled Cloud-Radiation Experiment (CIRCCREX) [19] and in the PiknMix-F field campaign [20], onboard the Facility for Airborne Atmospheric Measurements (FAAM) are extremely important, since they allow the investigation of radiative properties of the atmosphere and of cirrus clouds from above, with a viewing geometry that is similar to that of a nadir viewing satellite mission such as FORUM. In the context of the FORUM preparatory studies, these kinds of measurements, apart from constituting a unique dataset, provide the opportunity to test innovative algorithms, evaluate their performances and set-up the future operational and data analysis methodologies.
The FAAM flights realized high spectral resolution measurements in the FIR, by using TAFTS, and in the MIR, by using the Airborne Research Interferometer Evaluation System (ARIES) [21]. The synergistic exploitation of the two co-located measurements allows, for the first time, the application of a cloud identification and classification machine learning algorithm (CIC, developed by [4] in the context of the FORUM project) to measured upwelling radiances. The main advantage of the CIC algorithm is that it is based only on the spectral analysis of the radiance signal and does not rely on any ancillary information or model output. Therefore, it can potentially be applied to any spectral sensor in the infrared on ground-based, airborne, or satellite platforms, and it is able to work, with the same performances, on daytime or nighttime. Machine learning techniques based on principal component analysis, artificial neural networks, or support vector machines, among others, have been extensively applied to identify clouds from high resolution satellite imagers [22], however, it is less common to find cloud detection algorithms based on hyperspectral infrared sounders. The existing ones are generally applied by selecting specific spectral channels and/or evaluating brightness temperature thresholds and brightness temperature differences [23,24,25,26], which can limit their applicability and require elaborate preliminary calibrations. Commonly, they are employed in conjunction with high spatial resolution imagers [24,27], which implies a relatively high computational cost due to the necessity to combine two different types of measurements. On the contrary, CIC is computationally vary fast and requires a limited number of spectra as training sets. All these features make the algorithm very flexible and easy to adapt to different types of sensors.
The full procedure can be easily applied to the study of satellite spectra and specifically to the case of the future FORUM mission with the only difference that the a priori knowledge of the training set spectra will be likely derived from dedicated field campaigns and co-located measurements from other satellite sensors, i.e., those on the Second Generation Meteorological Operational satellite programme (MetOp-SG) that will fly in loose formation with FORUM.
The goals of the present work are to evaluate the performance of the cloud identification algorithm when applied to real upwelling radiance data and to test the additional information content that the FIR part of the spectrum can provide, as suggested by [4]. TAFTS and ARIES simulations, accounting for measurement noise, are also used in the analysis.
This paper is organised as follows. In Section 2 the FAAM flights are described along with the relevant instrumentation, measurements, and details of the selection of data to be classified by the identification and classification algorithm. Section 3 describes the synthetic dataset simulated to train the machine learning code, whose algorithm is highlighted in Section 4. Section 5 discusses the results obtained from the CIC application. The conclusions of the study are summarised in Section 6.

2. Instruments and Data Sample

2.1. TAFTS

TAFTS is a Martin–Puplett polarising interferometer designed to optimise sensitivity in the spectral range 80–600 cm 1 and has been deployed in numerous field campaigns on board aircraft and on the ground (e.g., [8,28,29,30]). This four-port system has two input ports, associated with the zenith and nadir views and two output ports. The inputs are superposed using a polarising grid, positioned in the optical chain, on the input side of the polarising beam-splitter. One input port in reflection from the combining polariser, is associated with the zenith view, and the other, in transmission, is the nadir view. The two output ports are separated using a polarising analyser. Pairs of detectors at each output measure the interferograms associated with each of the two input ports: these modulated signals are in anti-phase and the resultant spectral signal is therefore a difference of the two inputs. To alleviate microphonic induced vibrations on the optics the interferometer is operated under a vacuum.
The optical efficiency of the two TAFTS input ports is not identical and each requires separate calibration. Each input port therefore consists of separate pairs of calibration blackbodies at hot and ambient temperature, with separate steering mirrors enabling switching of the view between the blackbodies and the scene in a predefined sequence. These calibration optics are open to the ambient air and are external to the evacuated interferometer section. To derive calibrated radiances a series of calibration measurements are made viewing the zenith and nadir calibration targets, usually on a 5–6 min repeat cycle during which between 1–4 min may be allocated to zenith and nadir observations.
To enhance detectivity, minimise acquisition time and hence enhance spatial sampling TAFTS employs liquid helium cooled photoconductive detectors. GeGa (Gallium doped Germanium) detectors cover 80 to 300 cm 1 and SiSb (Antimony doped Silicon) detectors cover 320 to 600 cm 1 . In each output the two waveband regions covered by the detectors are separated using a dichroic filter with a cut-off at about 330 cm 1 . TAFTS is usually operated at a spectral resolution of 0.12 cm 1 , but for these flights this was reduced to 0.24 cm 1 . For CIRCCREX, this was achieved by spectral averaging. For PiknMix-F the maximum optical path of the interferometer scan mirror was reduced to improve signal-to-noise and increase the acquisition rate, from about 1 scan every 2.5 s to one scan every 1.5 s.
To calibrate TAFTS spectra, the instrument gain and offsets over the range of calibration cycles associated with the nadir observations under consideration are compared. Over the flight periods analysed here no significant change in the gain or offsets were identified. The random noise level of the calibration runs was reduced by averaging and then combined with the uncertainties associated with knowledge of the black-body temperatures to give the overall calibration error.
For both campaigns, TAFTS covered the spectral range 80–300 cm 1 and 320–540 cm 1 .

2.2. ARIES

ARIES [21] is based around a rugged commercial interferometer fabricated by BOMEM of Canada, and was specifically designed for aircraft deployment as an airborne demonstrator and for future validation studies for the then proposed MIR satellite sounders such as IASI [31] and AIRS [32]. The MIR spectral coverage of ARIES allows the employment of solid optical components that minimise sensitivity to vibration effects from the environment.
ARIES, also a four-port system, utilises a KBr (potassium bromide) beam-splitter acting as a division of amplitude device and is sensitive over the spectral range from approximately 550 cm 1 to 3000 cm 1 . For ARIES, the two input and two output ports are physically off-set. An internal reference blackbody of known temperature is positioned at one input. The other input port views the external scene via a window and steering mirror in the pointing head. This pointing mirror allows alternate views of calibration targets, used to derive the instrument spectral gain and offsets. This gain and offset are applied to the external nadir and zenith scene measurements to derive calibrated radiances referenced to the internal blackbody. The calibration-view scene cycle for ARIES can be changed during flight and was set to nadir for above cloud periods during the CIRCCREX flight. TAFTS was set to a fixed observation cycle and acquired fewer above cloud nadir measurements. There was no synchronisation between the two instruments resulting in poor temporal co-location of measurements. For PiknMix-F a greater proportion of TAFTS observations were dedicated to the nadir with improved co-temporal measurements between TAFTS and ARIES.
ARIES uses two detectors to cover the MIR. In this case, the detectors are Mercury Cadmium Telluride (MCT) covering 550 to 1800 cm 1 and Indium Antimonide (InSb) covering 1700 to 3000 cm 1 . These detectors are mounted in a sandwich and are cooled to approximately 80 K by a Stirling cooler. Only a single output is used for the acquisition of spectra with the second unused output directed towards the interferometer input window. ARIES was operated at its maximum resolution of 1.0 cm 1 for both flights considered here, with individual scans acquired every 0.25 s.
Each ARIES nadir observation is calibrated using a set of calibration views made at the closest time to that observation. Calibration drift during a nadir observation cycle is established using information from the calibration views before and after the nadir observations. The random noise in individual views can be estimated from the standard deviation in the calibration views which consist of 120 spectra over a 30 s period. The calibration drift and random noise are treated separately and then combined to derive the overall uncertainty.
For both campaigns, ARIES covered the spectral range 600–2800 cm 1 .

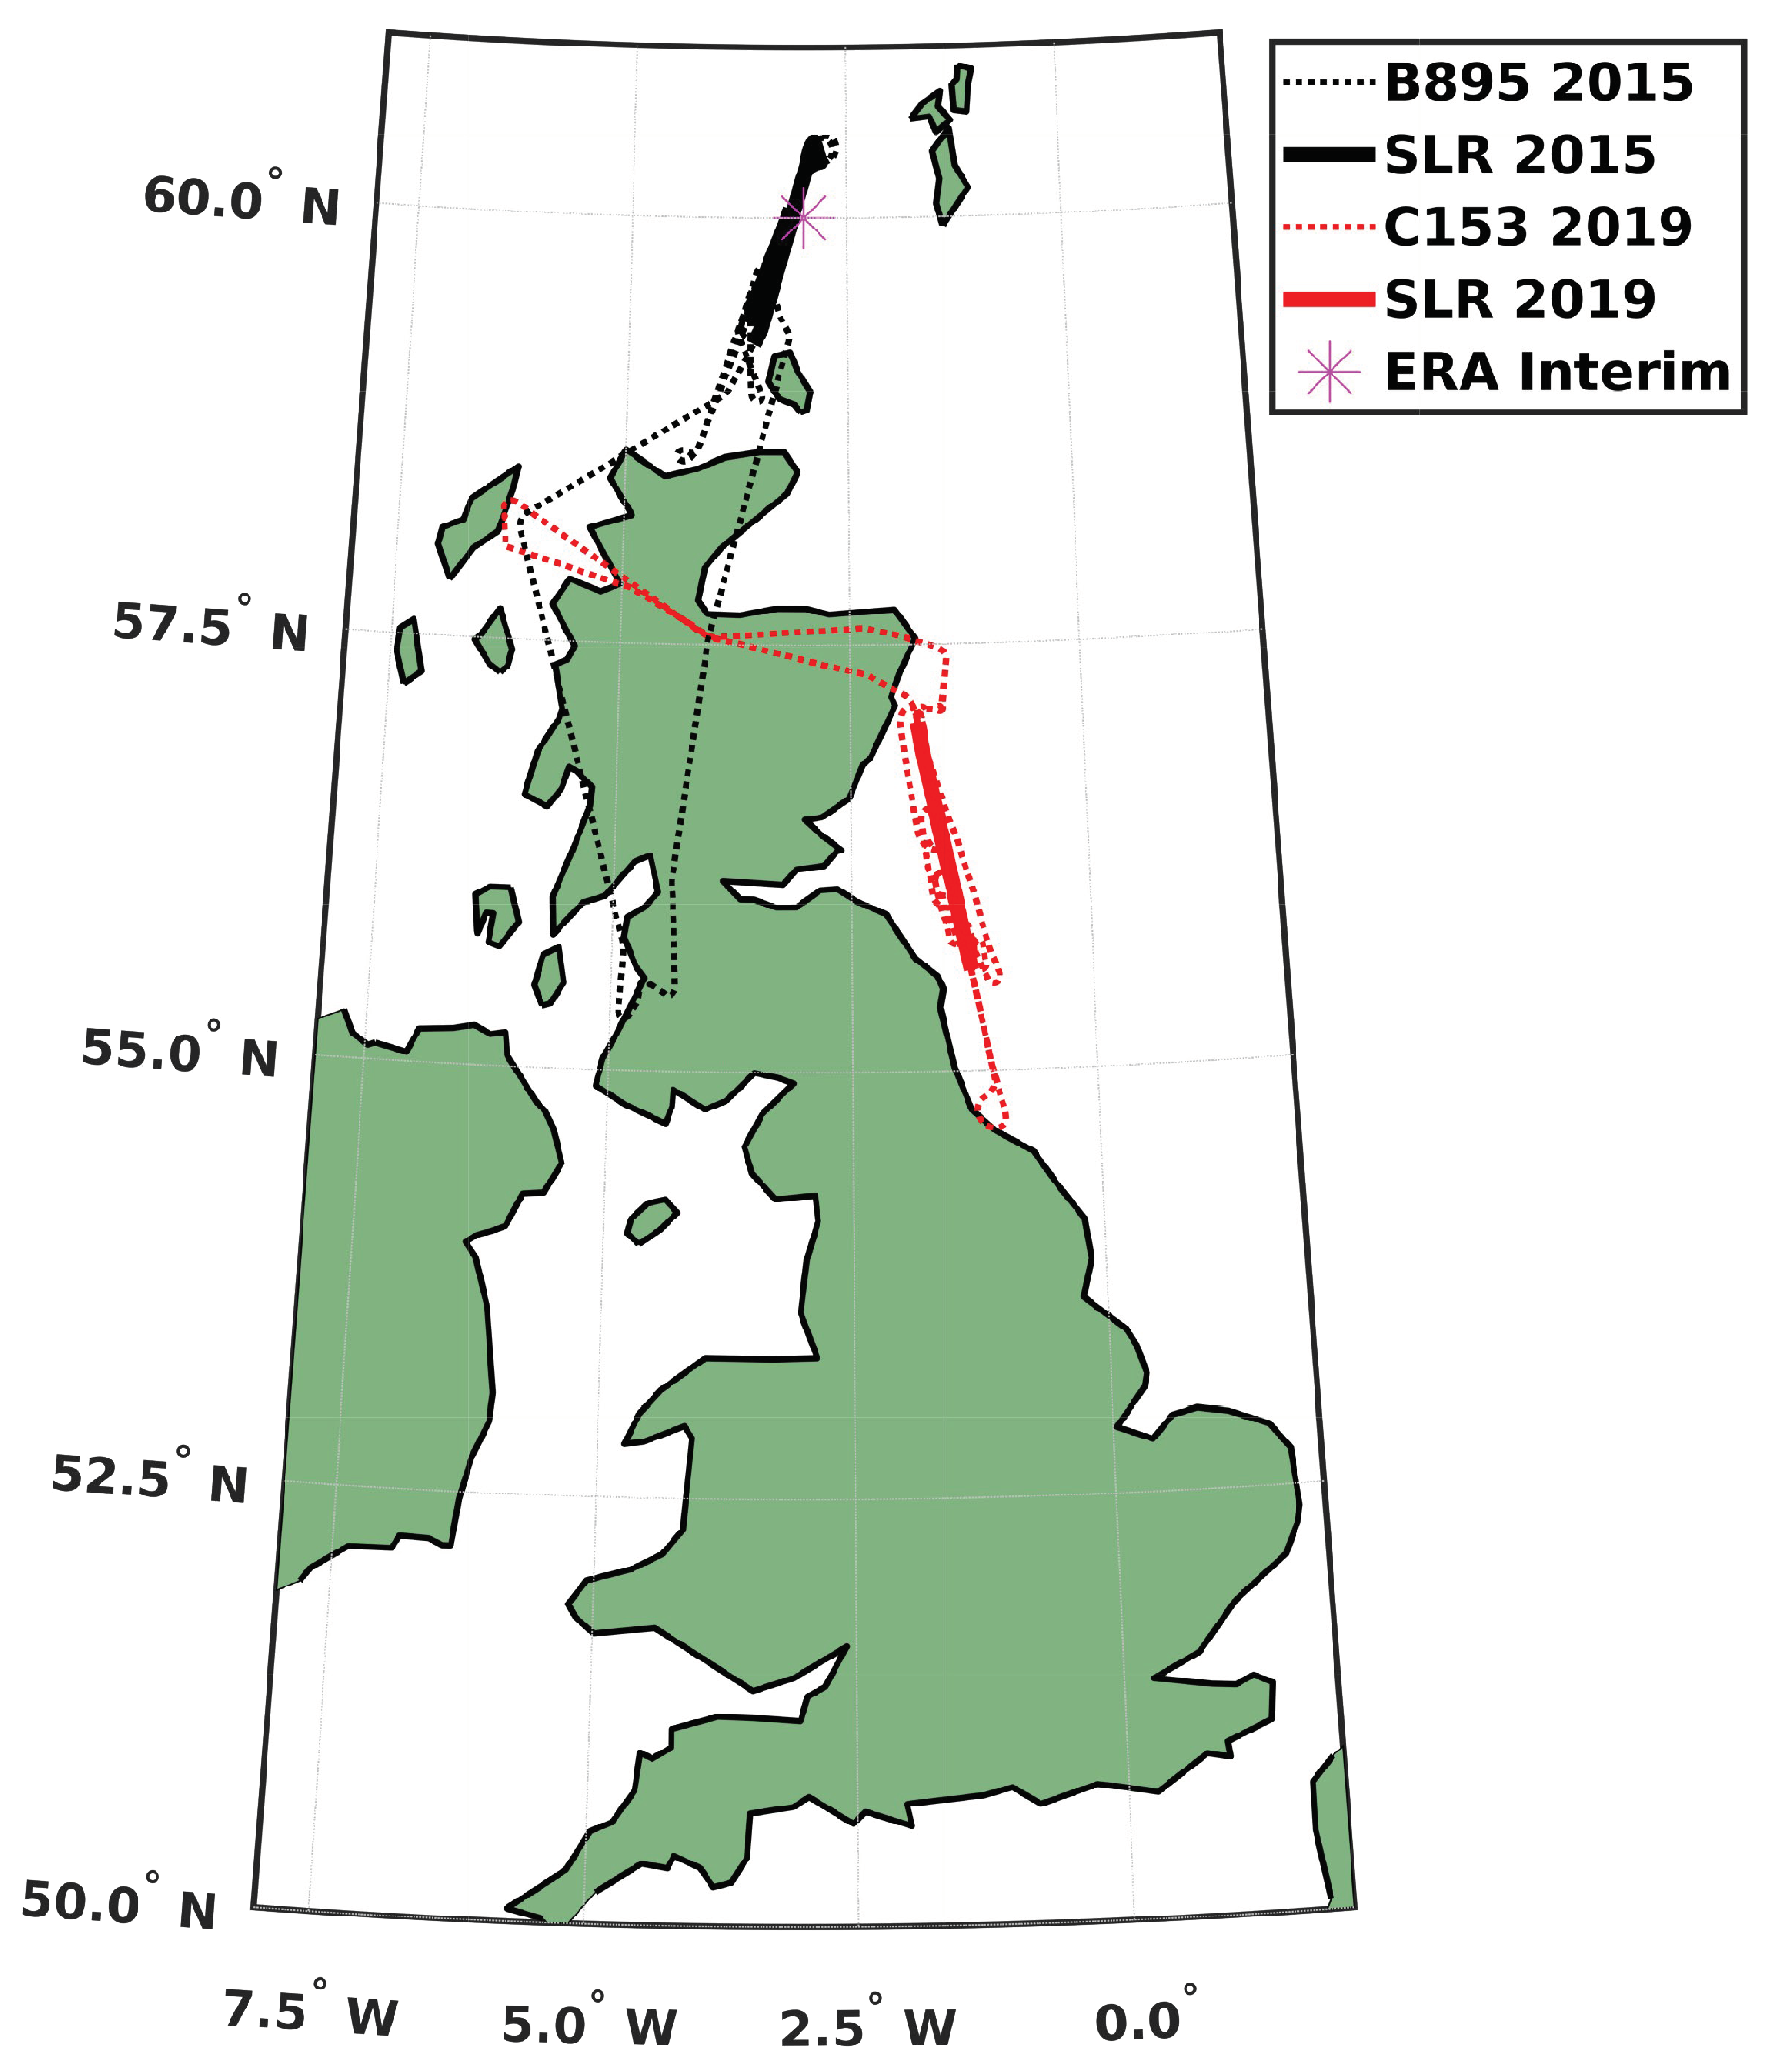
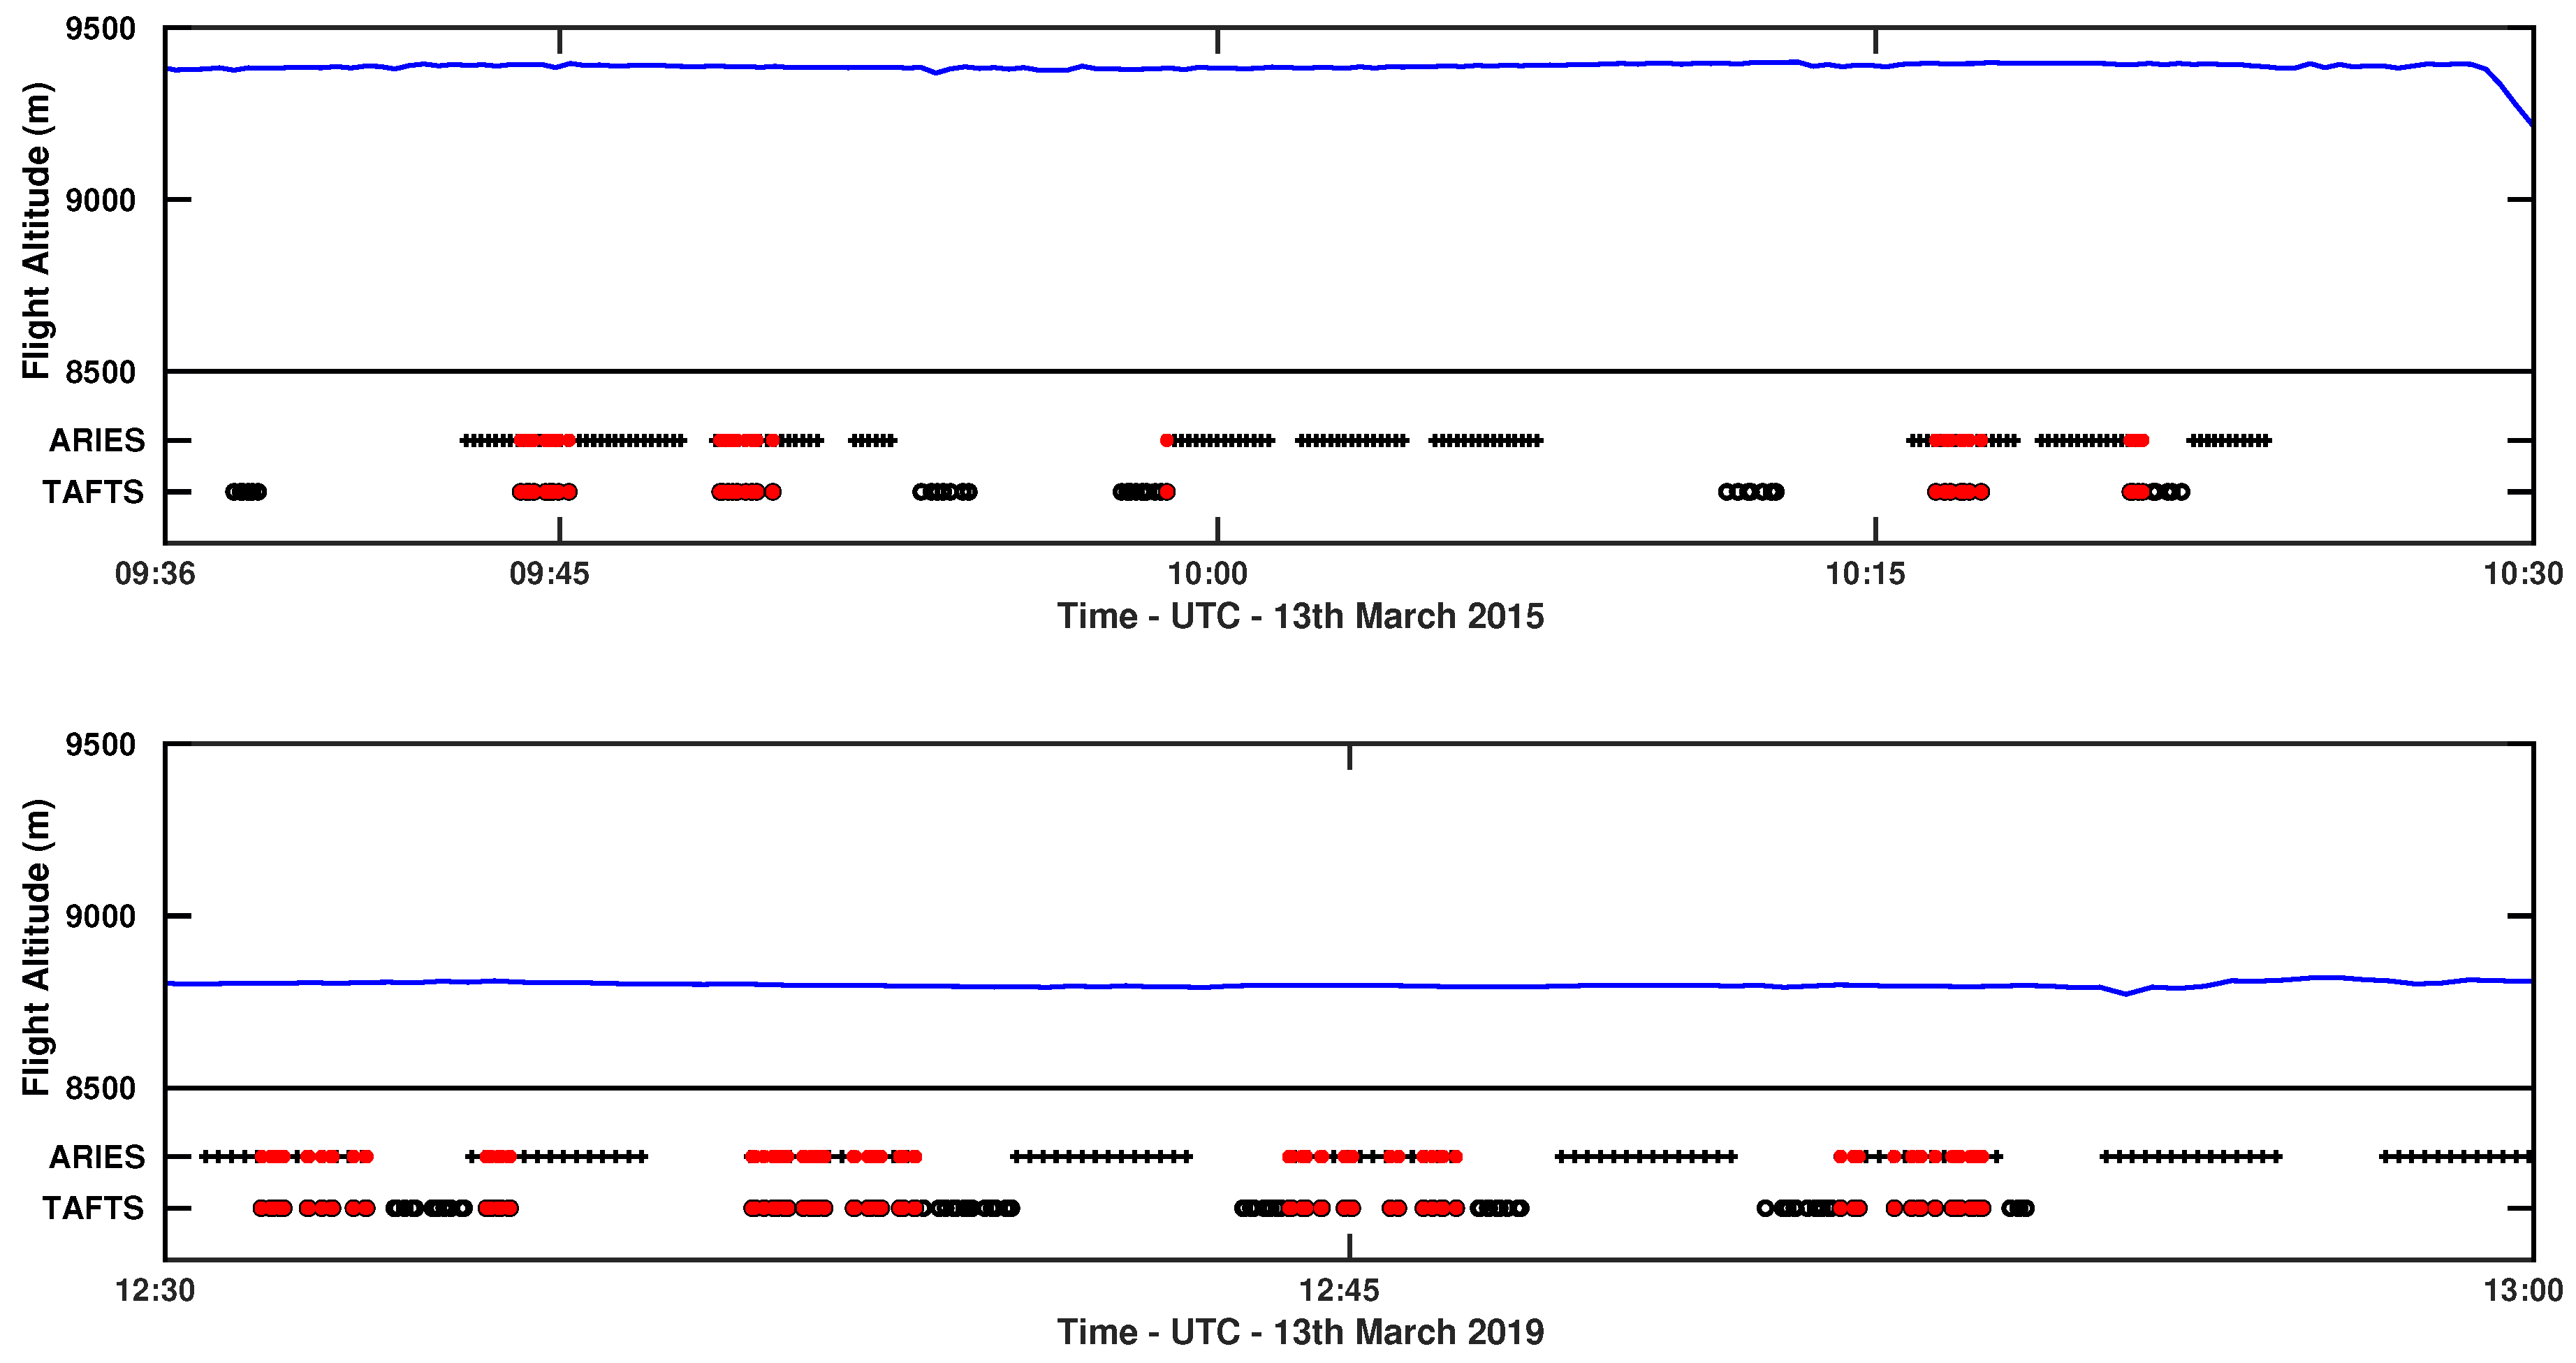
2.3. FAAM Flights and Data Selection

Two sets of airborne measurements were collected, for both ARIES and TAFTS, during two independent experimental campaigns in 2015 and 2019.
Firstly, we make use of the CIRrus Coupled Cloud-Radiation Experiment (CIRCCREX) [19,29] that comprises of several field campaigns. Here we focus on a single flight, B895, from March 13th 2015, that overflew a decaying band of cirrus clouds associated with an occluded front over the North Sea, off northern Scotland. 63 TAFTS spectra and 2729 ARIES spectra were collected during three straight and level runs (SLRs) above the cloud deck, at about 9.4 km altitude, between 09:33 and 10:28 UTC. Six dropsondes were dropped to characterize the atmospheric column below the aircraft, and a LIDAR Leosphere ALS450 onboard the aircraft provided backscatter data, allowing the vertical extent and the optical depth at 355 nm of the observed cirrus clouds to be characterised.
The PiknMix field campaigns have been on-going for a number of years with the most recent, PiknMix-F, occurring in March 2019. These cloud physics and radiation campaigns are aimed at a variety of atmospheric states, providing measurements to improve numerical weather prediction and climate models. Here we make use of a single flight, C153, from PiknMix-F on 13th March 2019. The FAAM aircraft overflew the North Sea in clear sky conditions, off eastern Scotland. 162 TAFTS spectra and 2399 ARIES spectra were collected during two SLRs at about 8.8 km altitude, between 12:30 and 12:55 UTC. Eight dropsondes were dropped during the flight. Figure 1 shows the tracks of flight B895 (black) and of flight C153 (red) and the corresponding SLRs.
The timing of each spectrum is recorded as part of the instrument house-keeping for both TAFTS and ARIES and this information is used to co-locate TAFTS and ARIES observations. Our selection criterion requires that TAFTS and ARIES spectra are collected within few tenths of a second of each other to be ascribed to a given scene, corresponding to an average distance of the centre of the sensors’ field of view on the ground of about 10 m, and never higher than 100 m. This constraint limits the final samples to 30 cloudy cases from flight B895 and to 90 clear sky cases from flight C153. As a result, a dataset of radiances spanning the IR spectrum from FIR to MIR is available and thus we are able to apply the classification algorithm in different configurations, accounting for multiple spectral intervals. Figure 2 shows the temporal coverage of the observations for the two instruments (black marks). The red symbols mark TAFTS and ARIES simultaneous measurements. The aircraft altitude during the measurements is also highlighted with the blue track in the upper part of the panels.

3. The Synthetic Datasets

The number of TAFTS and ARIES colocated observations is limited to a total of 120 cases. In addition, 60 simulated cases are computed to expand the dataset in order to generate more robust statistics when testing the classification approach. Synthetic spectra in cloudy or clear sky conditions are produced to encompass a wider range of atmospheric states than those encountered during the two days of measurements of the field campaigns. These represent our best estimate of the upwelling radiance in clear sky conditions or in the presence of thin cirrus clouds for the time of the year and locations of the CIRCCREX and PiknMix-F experiments. We aim to define a synthetic dataset that is consistent with the field campaign data and, at the same time, representative of the natural variability of the experimental area. Thus, we focus on the European Centre for Medium-Range Weather Forecasts (ECMWF) Re-Analysis (ERA) dataset ERA-Interim for a grid point over the sea, at 60°N–3°W (magenta asterisk in Figure 1), and we select 30 cases in clear sky conditions and 30 cases in cloudy conditions, spread over the months February–March–April of the years 2015 and 2019, at different synoptic hours (00:00, 06:00, 12:00, or 18:00 UTC).
The simulations are obtained by using a radiance generator code that runs two publicly available radiative transfer models. We used the line-by-line radiative transfer models LBLRTM (http://rtweb.aer.com/lblrtm_frame.html) v12.7 and references therein [33] and LBLDIS (https://www.nssl.noaa.gov/users/dturner/public_html/lbldis/index.html) v3.0 [34,35], the latter being a combination of LBLRTM and DISORT [36] for scattering atmospheres. The code employs a recently updated water vapor continuum parametrization (MT_CKD v3.2) [37] and a consistent line parameter database (AER (http://rtweb.aer.com/line_param_frame.html) v3.6) built from HITRAN 2012 [38].
The clear sky spectra are computed with LBLRTM to cover the TAFTS+ARIES spectral range, from 50 to 2850 cm 1 , with spectral resolution 0.01 cm 1 , fixing the observer altitude at 9.5 km, which is the maximum altitude of the flights. The cloudy sky spectra are computed with LBLDIS accounting for cloud layers with parameters characteristic of cirrus clouds [15]. A summary of the cloud properties is reported in Table 1.
To run the radiance generator, auxiliary information is needed to define the surface parameters, the atmospheric thermodynamic state, and the cloud properties. Specifically:
(a) Since the FAAM flights measurements are taken over the sea, the surface emissivity is assumed to be that of sea water. We account for sea water in calm wind conditions [39], in the range 10–3000 cm 1 at 5 cm 1 spectral resolution. The sea surface temperature is derived from the geolocated ERA-Interim archive [40], publicly available at 0.75° horizontal resolution.
(b) The ERA-Interim archive data are also used to define the vertical profiles of temperature, pressure, water vapor and ozone concentration on specific dates. However, since the dataset is limited to about 50 km altitude, the vertical profiles are completed with the climatological database IG2 v5.7 [41] up to 0.01 hPa. The IG2 is also used to define the entire volume mixing ratio profile of 10 more minor gases (CO 2 , N 2 O, CO, CH 4 , O 2 , NO, SO 2 , NO 2 , NH 3 , and HNO 3 ). The CO 2 mixing ratio, estimated by IG2 in 2013, is linearly corrected to the 2019 concentration level with a scaling factor. All the profiles are defined with a vertical resolution that gradually increases from ground (250 m) to top of the atmosphere (5000 m) placed at 60 km as usually done for satellite view simuations.
(c) The cloud microphysical properties are generated for aggregates of pristine columns with a smooth roughness by integrating, over a large set of gamma type size distributions, the database by [42], that contains single particle single scattering properties of randomly oriented non-spherical ice crystals.
The synthetic high spectral resolution radiance fields are convolved with the appropriate spectral response function associated with the respective instrument apodisation functions, a Kaiser and a top-hat function, to mimic the TAFTS and ARIES instrument response functions respectively.
Finally, a component related to the total measurement uncertainty for TAFTS and ARIES (see details in Section 2.1 and Section 2.2) is added to the spectra. The total uncertainty for each of the two instruments is computed, for any synthetic spectrum, as the sum of the calibration uncertainty (red line in Figure 3), assumed to be systematic for all the spectra, and a white Gaussian noise whose 1 σ corresponds to the tabulated noise equivalent spectral radiance (NESR) at each wavenumber (black line in Figure 3). In the same Figure the FORUM NESR (goal [5]) is also reported for comparison. The comparison shows that FORUM will have better performance, with respect to the analysed observations, in most of the FIR spectral range, in the CO 2 ν 2 band and above 1300 cm 1 . The measurement uncertainties (Figure 3) become sizeable at wavenumbers larger than 1300 cm 1 so these data are not used in the classification.

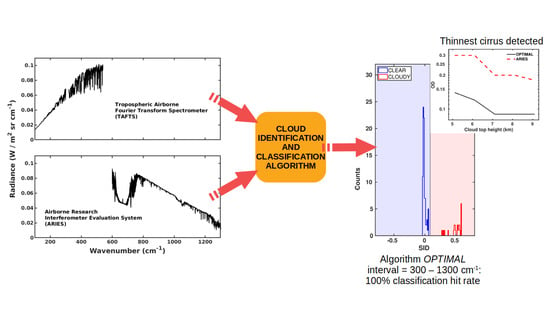
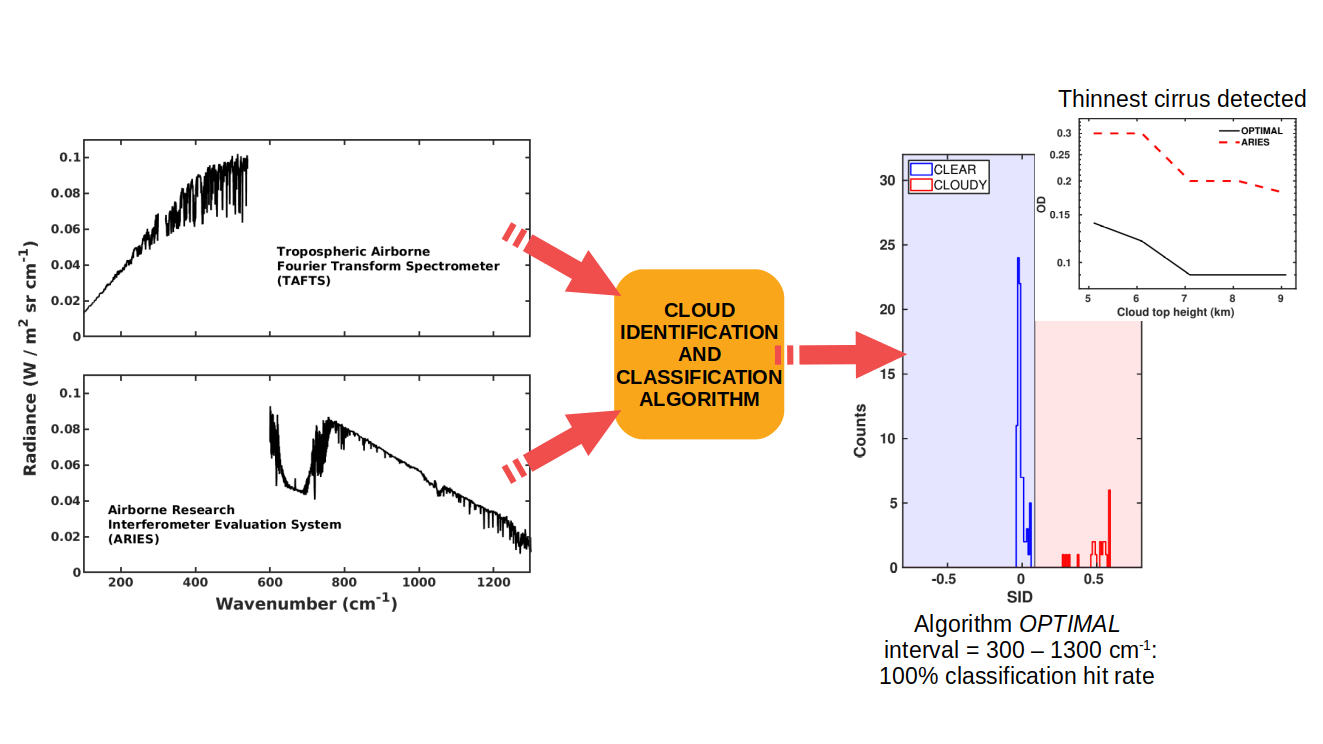
4. Cloud Identification and Classification Algorithm

The cloud identification and classification (CIC) is a machine learning algorithm [4], based on the analysis of brightness temperature (BT) spectra, able to classify an input spectrum (test case) as representative of a clear or a cloudy scene. The CIC performs a principal component analysis (PCA) by comparing the test case with a predefined training set (TS), that is a set of spectra representing the variability of clear or cloudy scenes.
T S X = T S X ( ν ˜ , j ) ,
where X refers to C L E A R or C L O U D Y spectra, ν ˜ is the wavenumber, and j = 1 , , J refers to the j t h TS spectrum. The information content of the TSs is evaluated by computing the eigenvalues ( λ ) and the eigenvectors ( ϵ T S , principal components) of the two TS covariance matrices
[ λ X , ϵ T S X ] = eig ( cov ( T S X ) )
and by removing the part of the signal related to spectral noise. This is performed by accounting only for a limited number of principal components, defined by [35] as the first P 0 eigenvalues that minimize the indicator function
I N D ( p ) = R E ( p ) ( P p ) 2 ,
where p = 1 , , P refers to the p t h principal component and the real error R E is defined as
R E ( p ) = i = p + 1 P λ X , i J ( P p ) .
The test case spectrum is then analysed by defining two extended training sets (ETS), that are the original TSs plus the test case spectrum
E T S X = [ T S X ( ν ˜ , j ) , t e s t c a s e ( ν ˜ ) ]
and by computing the eigenvectors ( ϵ E T S ) of the new ETS covariance matrices. Finally, the additional information introduced by the test case into the ETSs is evaluated by the similarity index (SI)
S I X = 1 1 2 P 0 p = 1 P 0 ν ˜ | ϵ E T S X ( ν ˜ , p ) 2 ϵ T S X ( ν ˜ , p ) 2 |
This normalized index represents how similar the test case is to each one of the two considered TSs (clear or cloudy). An SI value close to 1 means high similarity, whereas a value close to 0 means low similarity. Indeed, if the test case spectrum is representative of a clear sky scene, the ETS CLEAR would result similar to the original TS CLEAR , and so their eigenvectors, due to the low additional information content. On the contrary, a change in the ETS CLOUDY is expected with respect to the original TS CLOUDY , since a different class of spectrum (clear sky) is introduced into the TS representing cloudy scenes. By comparing the SI associated with the two TSs, we define the similarity index difference (SID) as
S I D = S I C L O U D Y S I C L E A R .
A value of the SID lower than zero identifies the test case as clear sky, whereas a value larger than zero identifies it as cloudy. This simple distinction between clear and cloudy cases is termed the elementary method and, in principle, it works well when spectral features in clear and cloudy cases are easily distinguishable and when the TSs are good representative of the variability of the considered scenarios. However, [4] suggested that better results can be obtained with an advanced methodology called the distributional method. The distributional approach implies that the CIC is first applied to the TSs, whose spectra are of known class. The SID values associated with all the TS spectra are then computed. The distribution of the results (the SID) allows the definition of an optimal SID delimiter value between clear and cloudy scenes. This delimiter, that can be different from zero, is set according to the classification results to optimize the algorithm performance. The delimiter value found with the distributional method is dependent on the characteristics of TS spectra and on the spectral range used for the classification.
Figure 4 compares the elementary and the distributional approaches when the CIC is applied to the TS spectra. The elementary method (left panel) classifies as clear sky (blue shaded area) all the spectra with SID ≤ 0 and as cloudy (red shaded area) all the spectra with SID > 0, misclassifying part of the clear sky TS spectra (blue histogram) as cloudy. The distributional method (right panel), by maximising the classification performance on the SIDs of the TS spectra, defines a new delimiter between clear and cloudy scenes. In the shown example, the new delimiter is set for SID = 0.15, so that all the spectra are correctly classified. Assuming that the TSs are good representatives of the variability of the considered scenarios, we expect that the test cases are classified with similar performance, so the distributional method is preferred and applied in this study. Note that for this case the two TSs are completely separated and there is no overlap between clear and cloudy spectra in terms of SID values. This means that clear and cloudy TS spectra have separate spectral signatures. Moreover, the tighter distribution of SID values for the clear sky suggests a reduced variability in clear sky conditions.

The Training Set and the Test Set

The synthetic spectra, described in Section 3, are used to define the TSs needed by the CIC to perform the classification of the observed scenes. However, to improve the representativeness of the considered scenarios, we merged few observations provided by the FAAM flights B895 (cloudy) and C153 (clear) into the TSs. The TSs are thus composed of few observed spectra and of all the synthetic ones while the test set comprises the rest of the observations. See Table 2 for a summary.
Figure 5 shows the spectral BT of the clear (top panel) and cloudy (bottom panel) TS elements. Synthetic spectra are plotted in black while observations are blue (clear) or red (cloudy). The variability is larger across the cloudy spectra than for the clear sky cases for both observed and simulated data. However, the variability is markedly larger in the simulations compared to the observations in both scenarios. In particular, the largest variations in BT are encountered in the atmospheric window between about 800 and 1200 cm 1 and at FIR wavenumbers larger than 350 cm 1 .

5. Results

5.1. Classification Algorithm Set Up

The performance of the CIC algorithm depends on the TS characteristics and the spectral intervals of application. As previously noted, the clear and cloudy training sets have been set up by using a limited number of observations (6) and 30 synthetic spectra, in order to mimic the variability of atmospheric and sea surface conditions for the locations and times of year of the flights. Three different spectral intervals are considered in this study to evaluate the ability of TAFTS and ARIES to identify clear and cloudy scenes and to assess the advantages of using FIR and MIR spectral radiances synergistically. The wavenumber limits of the intervals considered are summarised in Table 3 and described in detail below.
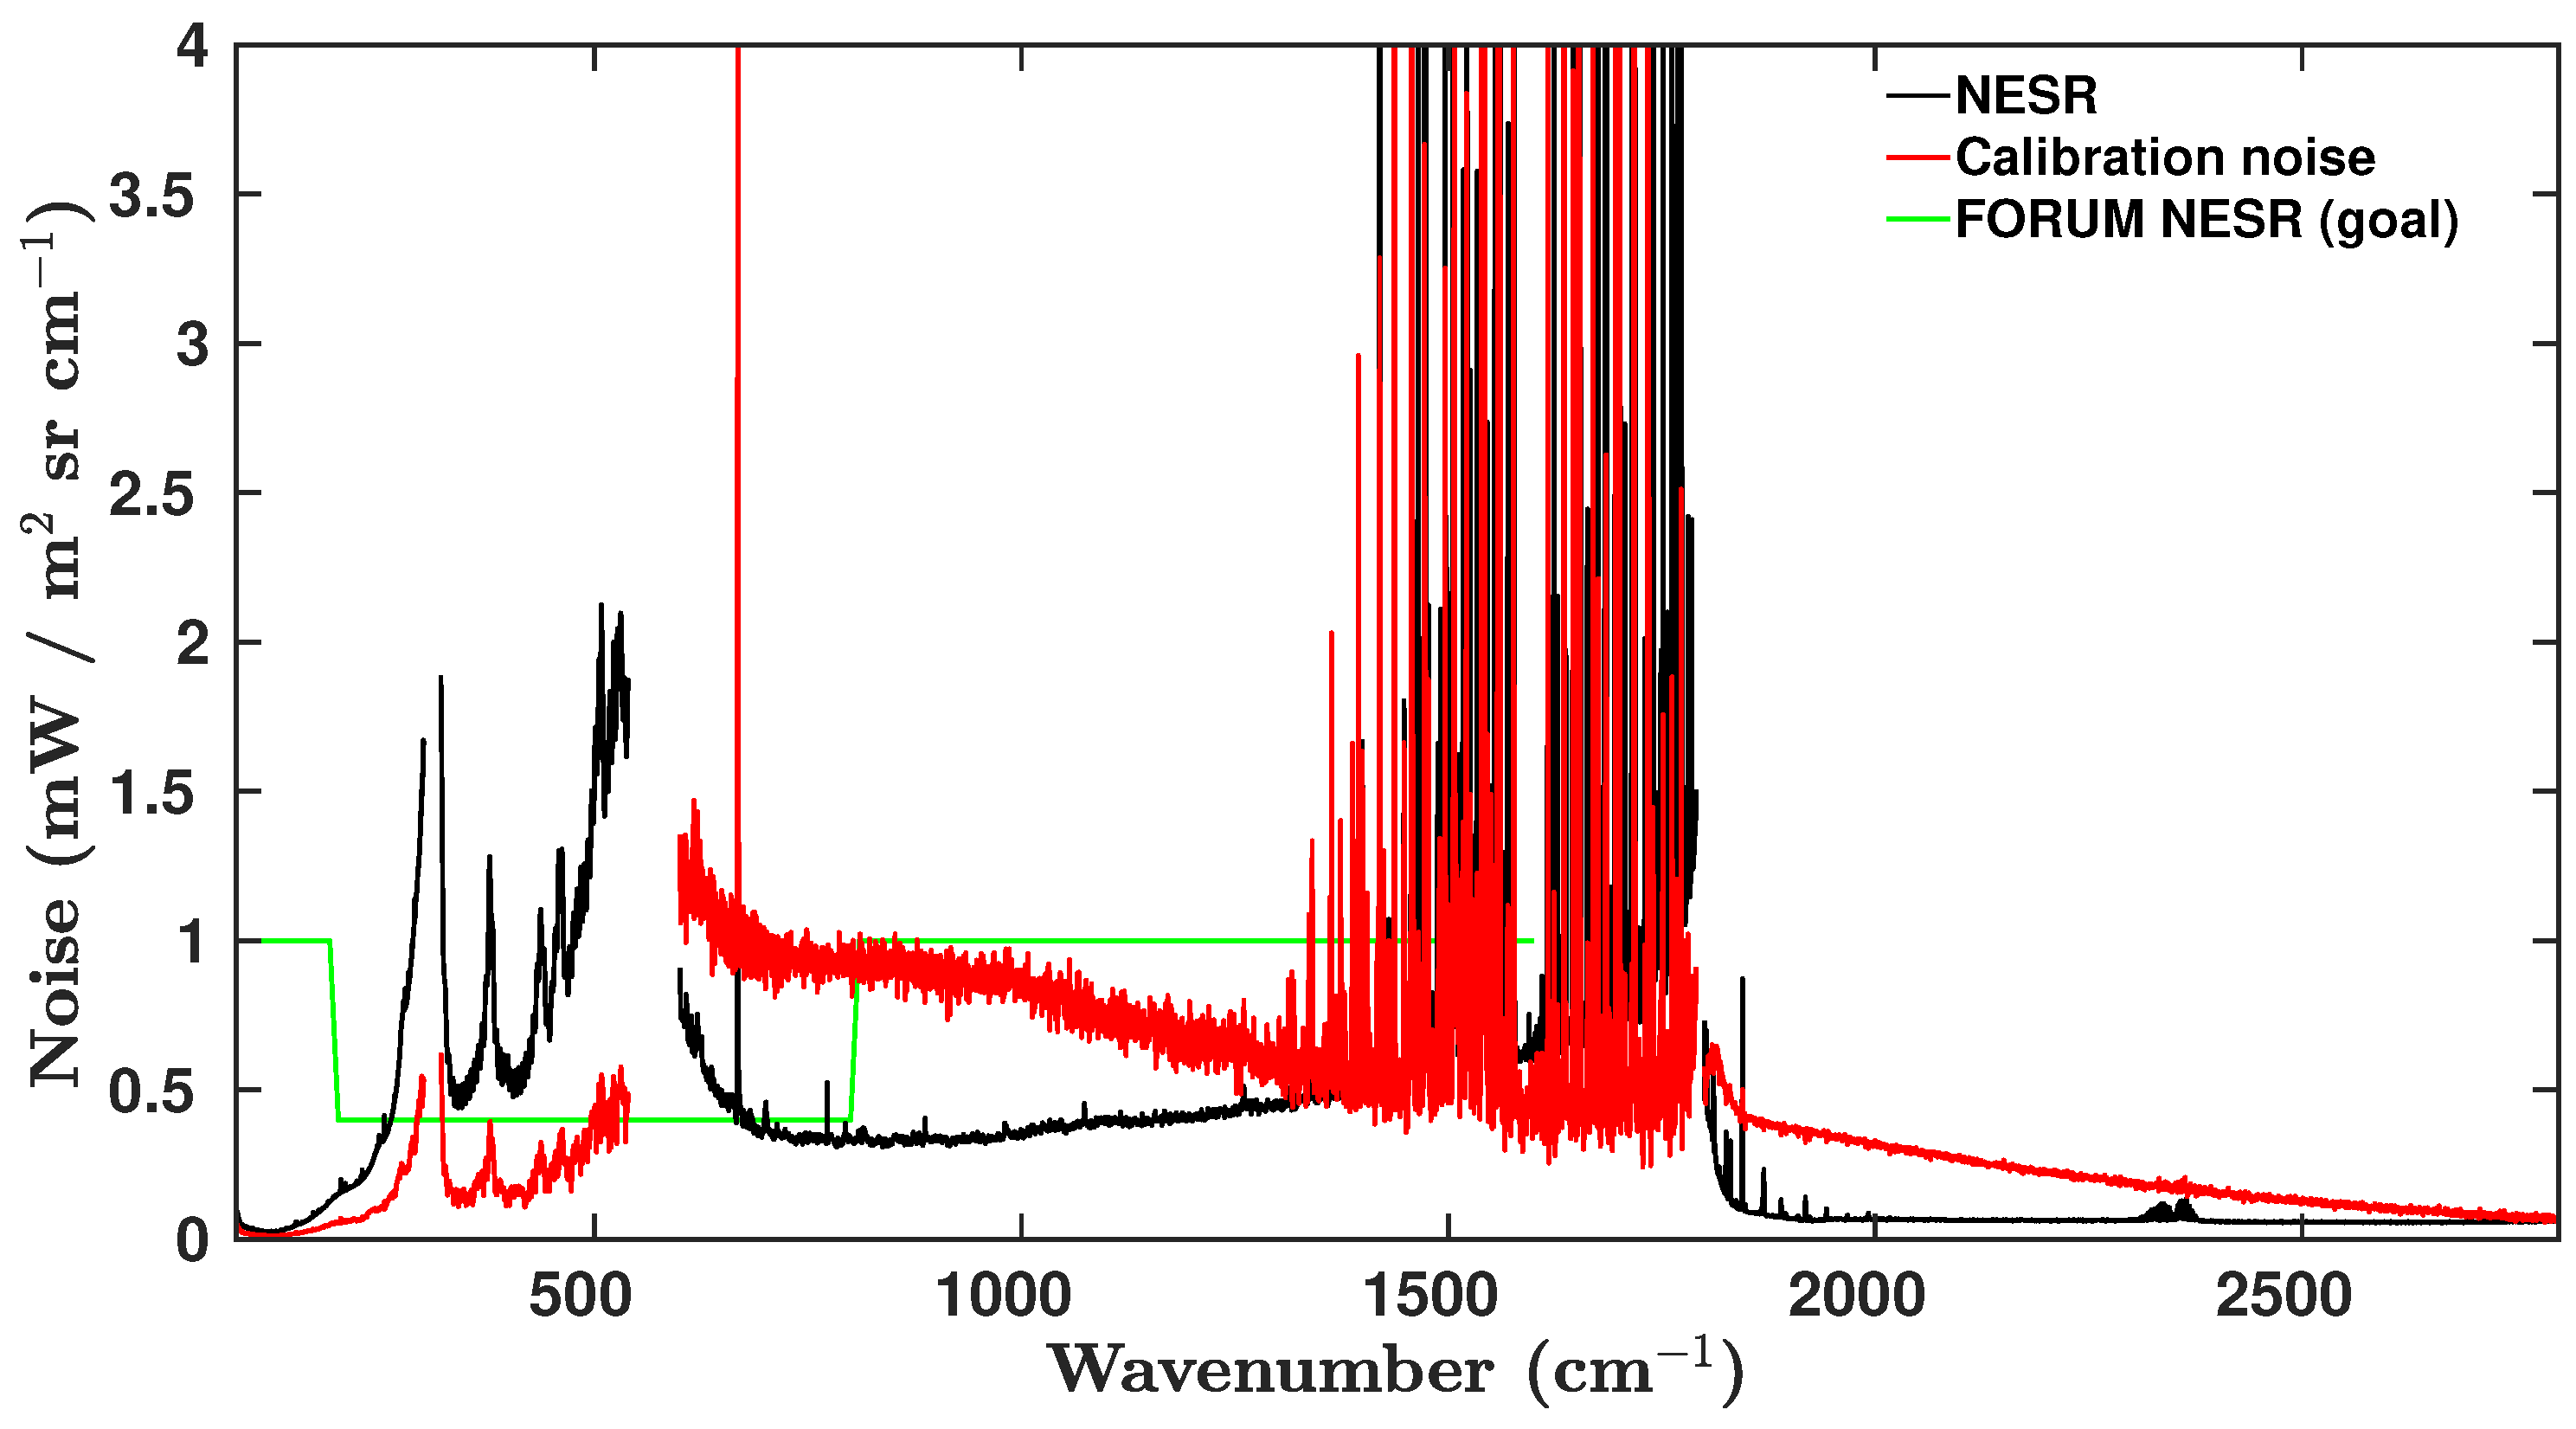
  • The TAFTS interval covers radiances in the 80–540 cm 1 band, with a gap between 300 and 320 cm 1 . It only includes the FIR spectral range, as observed by TAFTS.
  • The ARIES interval (600–1300 cm 1 ) covers a key band of the MIR spectral range. This is a commonly used spectral range, since most of the available infrared sounders sense the atmosphere in the MIR (e.g., AIRS: [32]; IASI: [43]; CrIS: [44]). As explained in Section 3, the ARIES sensor performed with a low signal to noise ratio in the 1300 cm 1 < ν ˜ < 2800 cm 1 band and therefore radiances in this part of the spectrum are discarded. Moreover, the strong 667 cm 1 CO 2 absorption band is limited to wavenumbers lower than 620 cm 1 and higher than 667 cm 1 ; this was observed by [4] to increase the CIC performance likely due to the removal of correlated information.
  • The OPTIMAL interval (320–1300 cm 1 ) is chosen to mimic as closely as possible the interval 300–1300 cm 1 selected by [4] as a very efficient infrared interval for the CIC application to spectral radiance fields simulating FORUM measurements over the globe that will span the 100–1600 cm 1 spectral band. However, since TAFTS measurements do not cover wavenumbers between 300 and 320 cm 1 or higher than 540 cm 1 , the range used here is 320–1300 cm 1 , with a gap between 540 and 600 cm 1 . Moreover, as in the previous ARIES case, the 620–667 cm 1 band is not considered. The OPTIMAL interval is considered to evaluate the advantage of fully exploiting the MIR and the FIR synergy, and to account for radiance coming from both sensors.

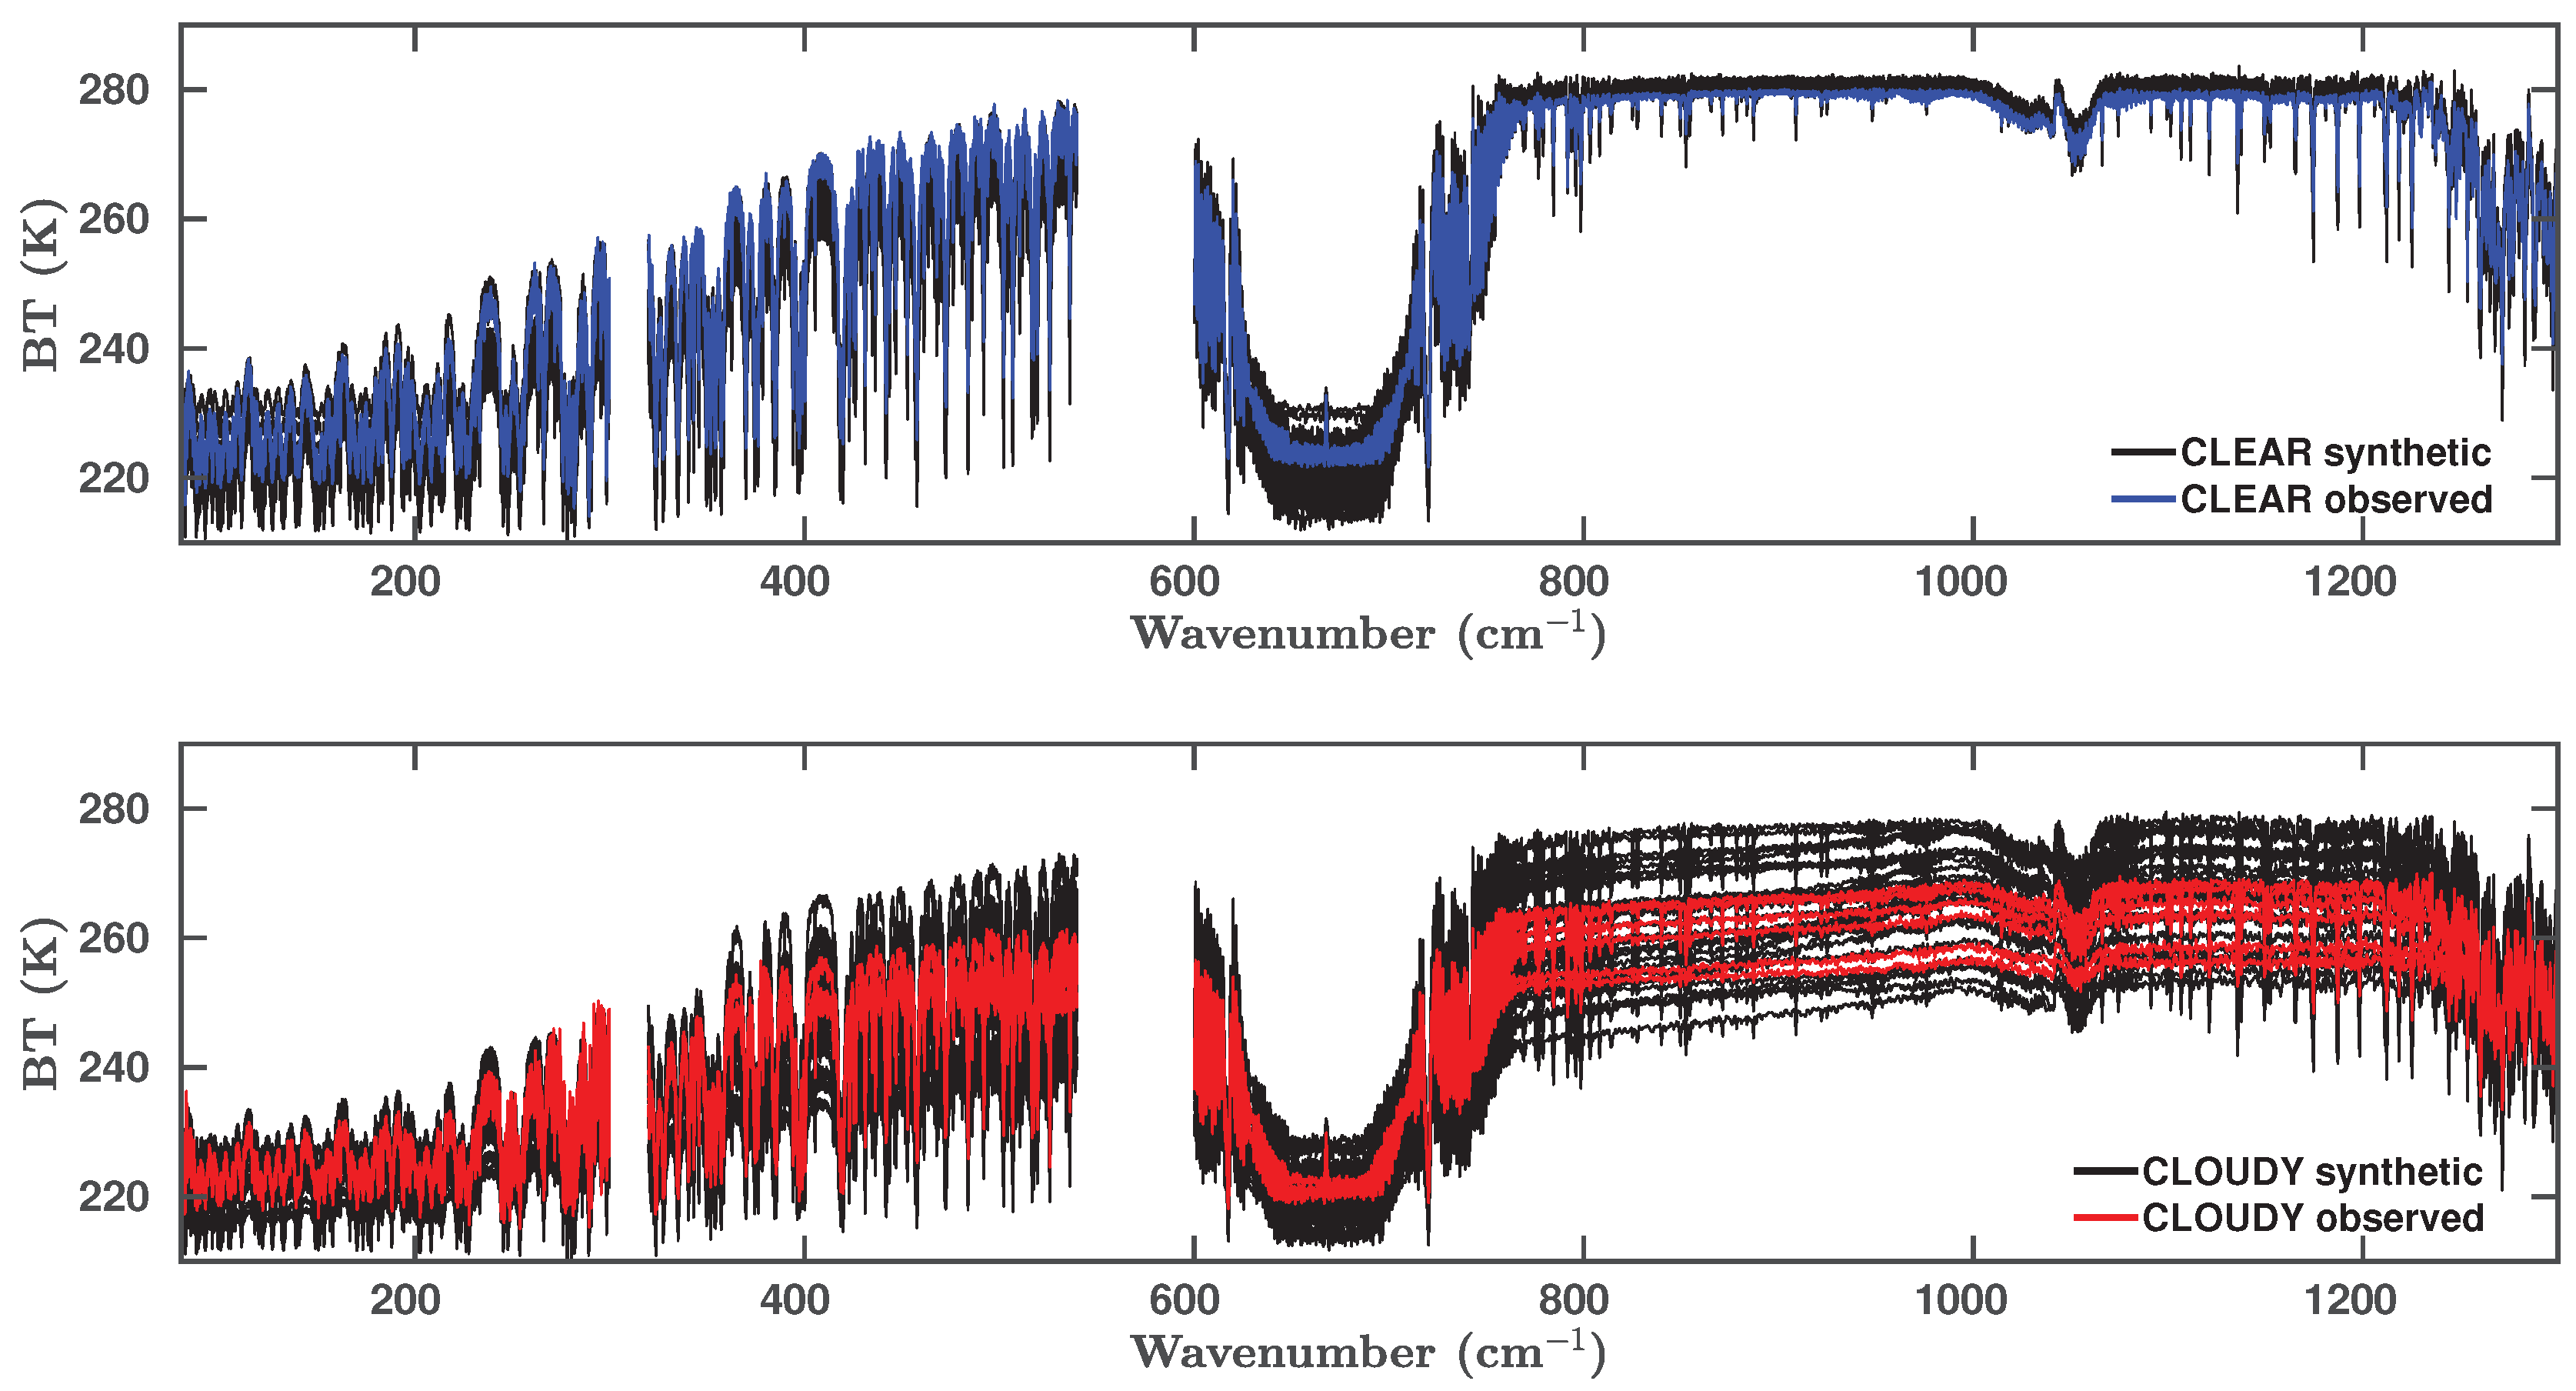
5.2. Clear and Clouds Identification

All classification results can be assessed by defining a quality flag for the CIC performance. The hit rate (HR) score is used in accordance with the following definition:
H R i = I D i / N i ,
where i is the identifier of the set (CLEAR, CLOUDY or TOTAL), N is the number of analysed scenes, I D is the number of correctly classified scenes, and TOTAL=CLEAR+CLOUDY. The results of the classification, for the three wavenumber intervals considered (TAFTS, ARIES, OPTIMAL), are listed in Table 4 and shown in Figure 6 in terms of the SID parameter, which allows a visual inspection of the classification outcomes.
When the FIR spectral interval (TAFTS) was used alone, the overall classification performance was poor, having a total HR limited to 58% (first panel of Figure 6). Part of the clear sky spectra were misclassified, and the clear and cloudy spectra partially overlap in terms of the SID values. This interval was not expected to provide an accurate classification of the scenes due to the limited amount of information coming from the surface and the lowest atmospheric levels in the FIR. In fact, the upwelling radiance in this spectral region shows large sensitivity to water vapor (especially in the highest tropospheric levels) and to cirrus clouds properties.
The MIR spectral interval (ARIES) alone had greater information content in terms of cloud classification than the FIR alone, and, in the present case, the entire set of observed spectra was correctly classified (HR = 100%). The second panel of Figure 6 shows that the clear sky dataset (blue histogram) was classified with very similar SID values for the different spectra; this is expected since the observations were collected in clear sky over the same marine area within less than 30 min, and the spectra are all representative of very similar conditions. On the other hand, the cloudy dataset (red histogram) has higher, even if limited, variability due to the clouds’ characteristics, that affect the classification results producing slight variations in the SID values and displaying as two distinct histogram elements. The first group of four cloudy spectra, corresponding to the lower SID values, refers to the last four measured spectra, in chronological order, of the analysed dataset. This suggests that different features, present within the cloud layer during the time of observation, are identified in the classification results.
Finally, the synergy between MIR and FIR data was evaluated by applying the CIC over the OPTIMAL interval. Despite the limited information content from the FIR alone, [4] showed that its contribution is significant when used in combination with the MIR. Unfortunately, due to the limited variability of the observed dataset, it is not possible to appreciate significant differences between the OPTIMAL and the ARIES interval, since both have a HR equal to 100%. However, the last panel of Figure 6 shows that the SID values for the clear sky spectra are slightly lower than in the ARIES case and spread over a slightly larger interval of SID values, indicating that the CIC is capable of detecting greater variability among the clear spectra analyzed. The cloudy spectra provide almost the same SID values as in the ARIES case but again with a wider distribution over SID values, suggesting the greater sensitivity of the OPTIMAL interval. The distribution of the SID values reflects the variability within the cloud layer: the first group of spectra corresponding to the lowest SID values refers to the last spectra of the dataset, in chronological order; the six spectra with the highest SID values refer to the first collected spectra during the observation. Despite the limited sample, this highlights that the use of the FIR part of the spectrum enhances the sensitivity of the CIC algorithm.

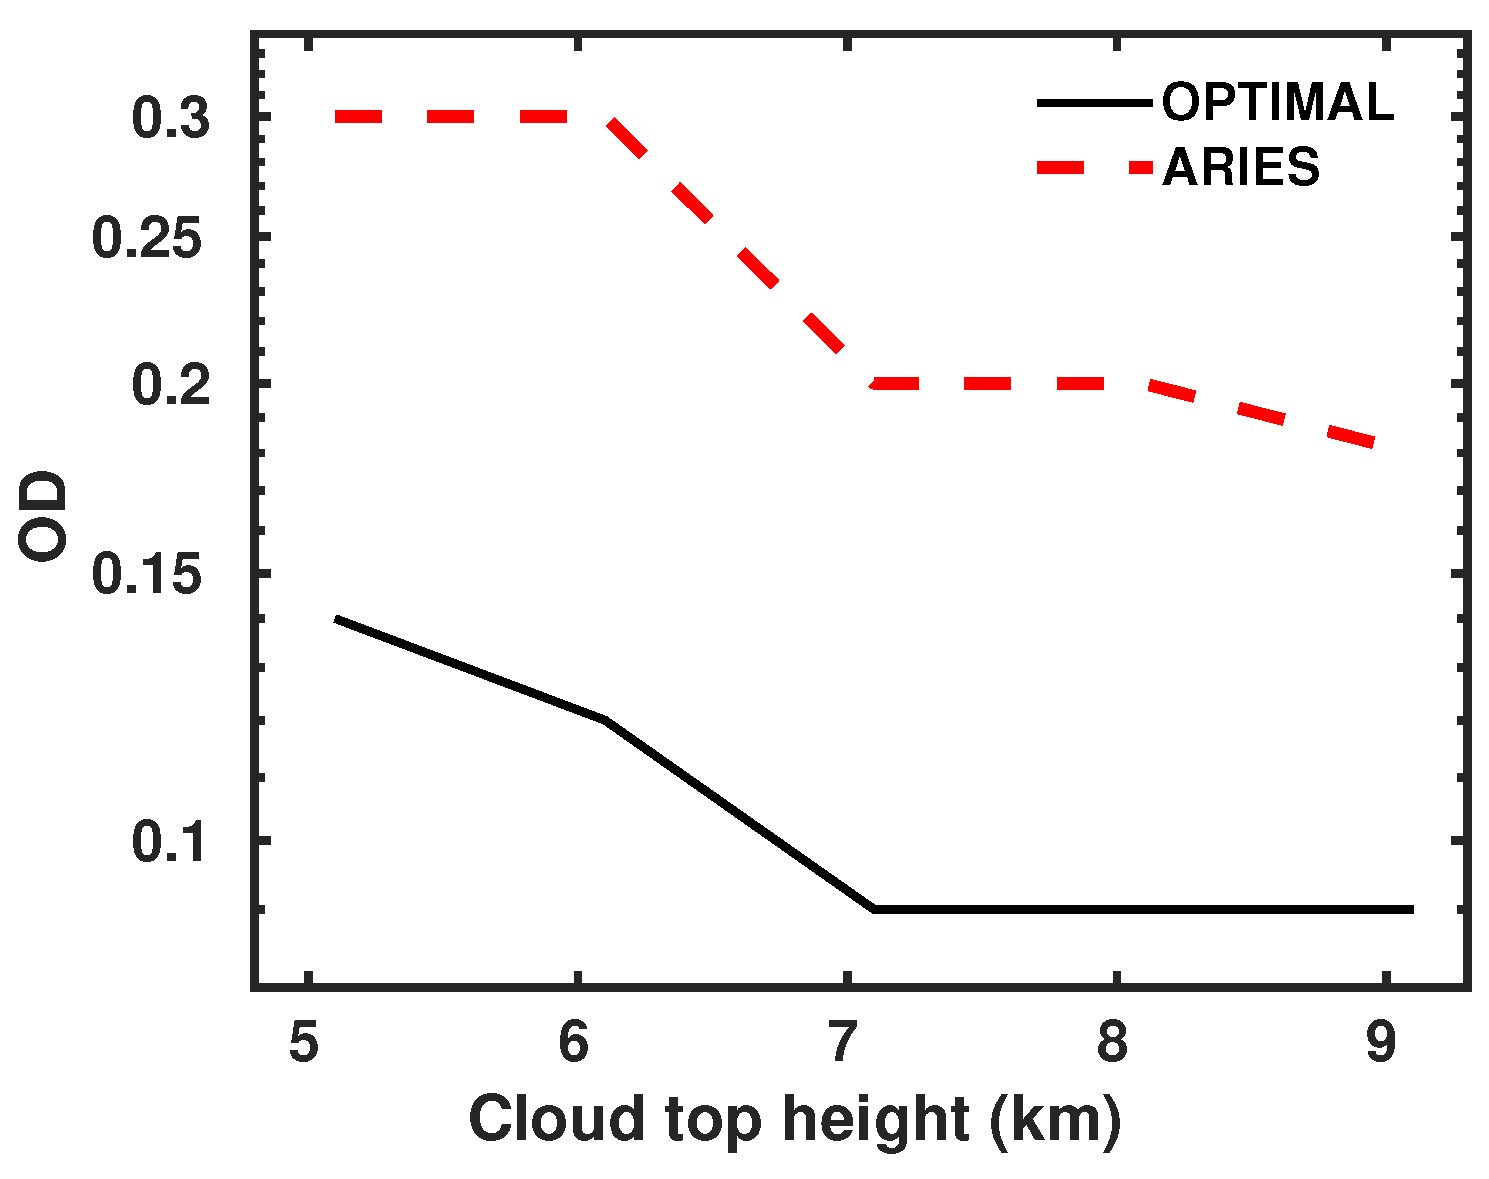
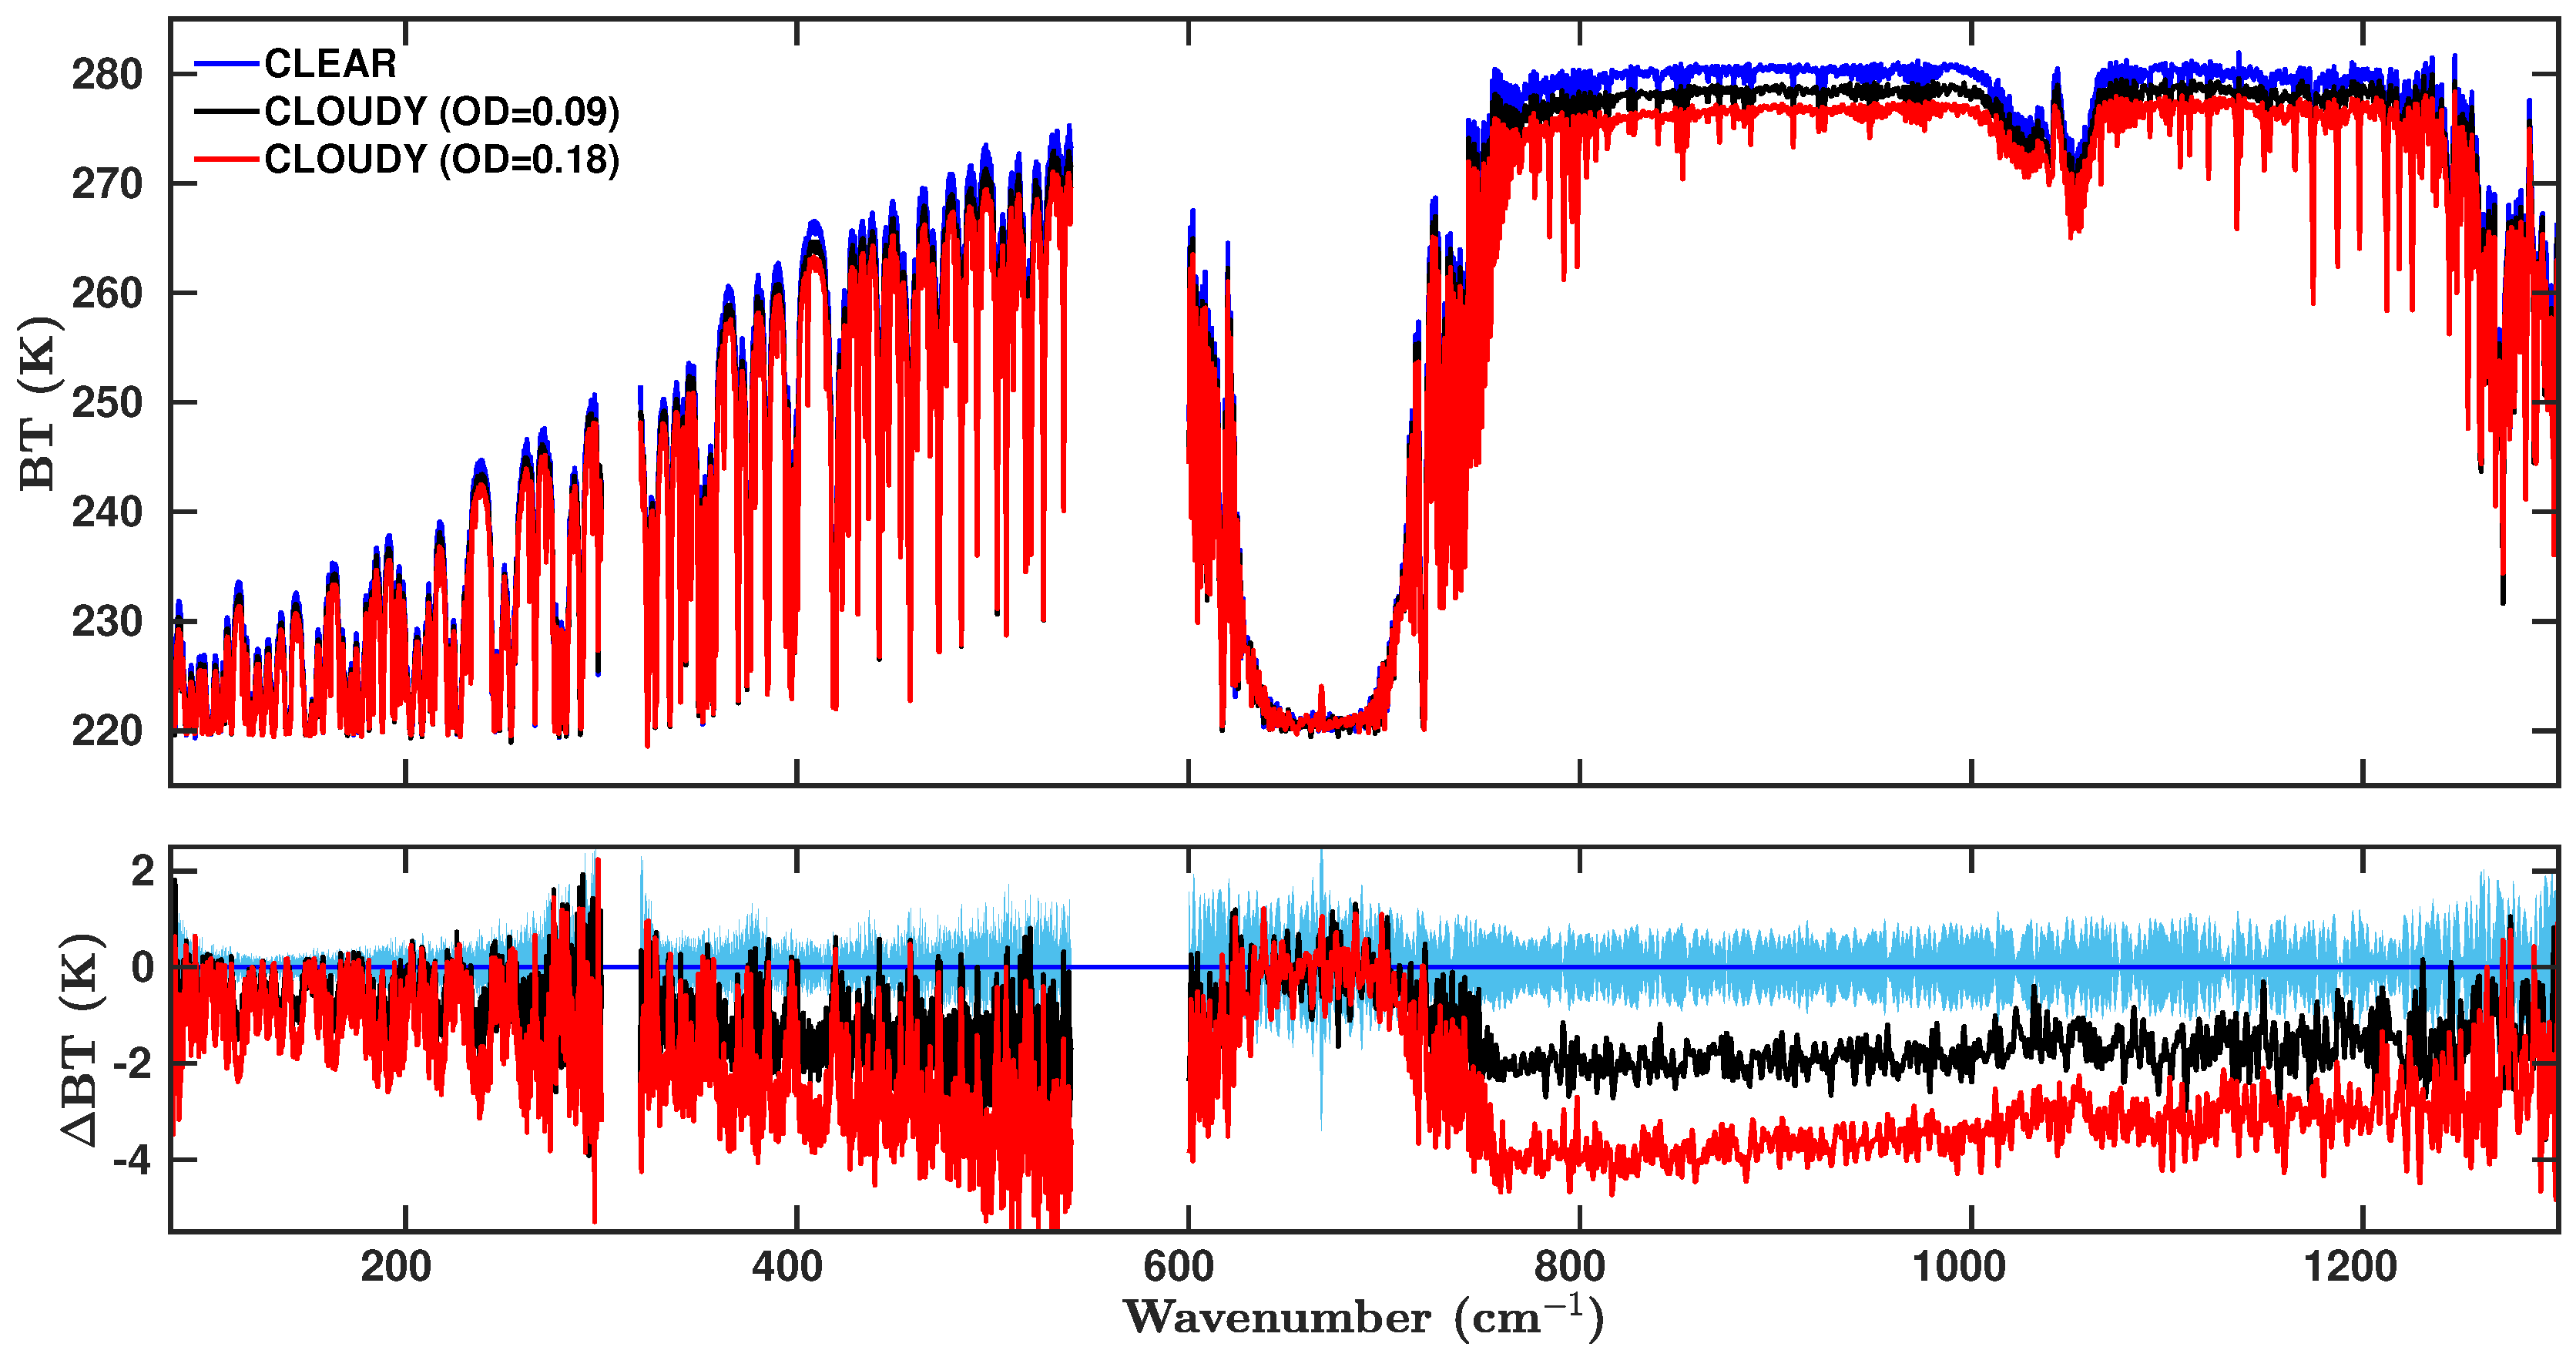
5.3. Thin Clouds Detectability

An analysis is performed to investigate the capability of the algorithm to detect very thin cirrus clouds when the same experimental conditions are considered. To facilitate this, a set of synthetic spectra were generated for a cirrus cloud layer 400 m thick, with cloud top at different heights between 5.1 and 9.1 km, and varying the optical depth (OD) at 900 cm 1 in the range 0.03–1. The ice particle effective dimension is 40 µm. All simulations account for the TAFTS and ARIES noise as previously described. The results are summarized in Figure 7 that shows the minimum OD value allowing cloud detection using the CIC algorithm, as a function of cloud top height.
All spectra obtained from clouds with similar features (i.e., altitude, geometrical thickness, effective particle dimensions, etc.) but larger OD than the cloud OD limit shown in Figure 7 were well classified. Thinner clouds are misclassified and the corresponding spectra are incorrectly tagged as clear sky. The result that defines a lower limit of OD detectability as a function of cloud altitude, cannot be assumed as general since it only applies to the specific atmospheric and cloud properties considered here.
The OPTIMAL range (black solid line) performs better than the ARIES range (MIR only, red dashed line), allowing the detection of 50–60% thinner clouds, in the present conditions. The thinnest clouds detected by exploiting the OPTIMAL and the ARIES spectral ranges have OD = 0.09 and OD = 0.18 respectively. This result suggests that the FIR contains useful information to improve upon the detection of a thin cloud. The result also confirms the findings of [4] regarding simulations of the future FORUM mission. This aspect is not fully appreciated in the analysis of the observed airborne dataset since the estimated ODs of the detected clouds are all higher than about 0.3 (internal communication). For such OD values the CIC correctly classifies cloud spectra either using the ARIES or the OPTIMAL spectral range. Nevertheless, the exploitation of a spectral interval from FIR to MIR is expected to be of great value in view of the global observations that will be performed by the FORUM sensor.
As expected, the cloud detection limit increases (OD decreases) with increasing cloud altitude. This is because, for the same cloud OD, an increase in cloud altitude implies a decrease of the cloud temperature (and thus an increase of the contrast with respect to a clear sky spectrum) and an increase of the transmissivity of the atmospheric layers between the cloud and the sensor (due to a decrease in water vapor content), increasing the radiance sensitivity to cloud properties.
To highlight the impact of the improvement in the scene classification performed by the OPTIMAL interval, Figure 8 compares three synthetic spectra used in the sensitivity test: the spectrum computed in clear sky conditions (blue line); the cloudy spectrum, with cloud top at 9.1 km, corresponding to the thinnest detected cloud in the OPTIMAL (OD = 0.09, black line) and ARIES (OD = 0.18, red line) interval. BT differences with respect to the clear sky spectrum are shown in the bottom panel of the same figure where the spectral noise associated with the simulations is also plotted (in light blue). The importance of using the OPTIMAL interval, instead of the MIR interval only, for improving the cirrus clouds identification, can be demonstrated by a simple example on the estimate of the error produced by a misclassification on retrieved quantities such as the sea surface temperature that is usually retrieved from radiances in the 800–1200 cm 1 spectral range. For the analysed conditions, the classification using the ARIES interval misclassifies spectra with clouds with OD ≤ 0.18, represented by a BT difference, in the 800–1200 cm 1 range, of up to 3.5 K with respect to the clear sky. When the OPTIMAL interval is used the misclassification occurs in presence of thin cirri with OD ≤ 0.09, limiting the BT error to less than 2 K in the same spectral interval.

6. Summary and Conclusions

A machine learning algorithm (CIC) is applied, for the first time, to a dataset of airborne high spectral resolution infrared measurements in order to evaluate the capability of the algorithm to identify clear and cloudy sky spectra. Previous studies by [4], as well as the FORUM project development phase, tested the algorithm only on synthetic datasets, therefore, the CIC results on real data are a fundamental step forward the algorithm exploitation in operating environment. Data are collected by two different sensors (TAFTS and ARIES) that measured up-welling radiances in the far- and mid-infrared part of the spectrum. Two training sets are built by using a set of synthetic spectra that account for instrument noise (calibration and NESR) and capture the atmospheric conditions associated with the locations and times of the airborne measurements. A small number of observations are also added to the training sets.
The classification results show that employing only the FIR spectral region in the CIC algorithm yields low overall hit rates, a measure of classification success. In contrast, when the MIR spectral region is used all the spectra are correctly classified. The same perfect hit score is obtained for a combination of far- and mid-infrared channels. However, detailed analysis of the classification parameter SID shows that the use of both the far- and the mid-infrared part of the spectrum provides a wider sensitivity to the variability of the observed spectra.
Previous work by [4] suggests that the benefit of exploiting FIR radiances for cirrus cloud detection may be particularly marked for optically thin cases. The analysed airborne measurements dataset does not include very thin clouds. Nevertheless, simulations show that the use of a combination of TAFTS and ARIES data would provide better classification scores with respect to using only one of the sensors. Specifically, it is shown that the synergistic use of far- and mid-infrared radiances increases the detectability of thin cirri (with respect to using the mid-infrared part of the spectrum only) and, for the specific observational conditions considered, the OD detection improves from about 0.2 to about 0.09 for cirri with cloud top altitude above 7 km. The simulation results also show that the ability to detect thin clouds increases with cloud altitude due to a lesser impact of the atmospheric gases (i.e., water vapor) on the spectra and to an increase in contrast with background radiation from sea surface.
Note that the methodology used (the CIC algorithm) only relies on the information contained in the spectra that are selected for the training sets. This makes its applicability very easy and adaptable to other types of sensors since no further ancillary or model data are required. Moreover, the CIC analyses the spectral variation of the radiance in key intervals of the spectrum instead of relying on methods accounting for brightness temperature differences (thresholds) at specific wavenumbers that again require accurate knowledge of the surface and lower atmosphere when applied to detect cirrus clouds. For the present case, only two training sets were required (clear and cirrus clouds) but others accounting for mid-level ice clouds, water clouds and aerosol layers can be considered for application to global observation as those foreseen from the FORUM mission.
The CIC, in an extended form, is part of the FORUM simulator. This software tool provides simulations for the full detection chain including the retrieval of geophysical products such as water vapour profiles. The CIC sits at the centre of the decision tree for retrieving clear-sky atmospheric products or cloud properties from the FORUM spectra.To prepare for launch, the FORUM simulator will be successively tested when representative data become available in order to be ready for the first FORUM measurements, expected in 2026. The study presented here is a first important step towards this goal.

Author Contributions

Conceptualization, D.M., W.C., T.M., and H.O.; methodology, D.M., W.C., T.M., H.O., and H.B.; software, D.M., W.C., T.M., S.F. and J.M.; validation, D.M., W.C. and T.M., and R.B.; formal analysis, D.M., W.C. and T.M.; investigation, D.M., W.C., T.M., S.F., C.H., J.M. and J.P.; resources, D.M, W.C., T.M., S.F. and J.M.; data curation, D.M., W.C., R.B. and L.W.; writing—original draft preparation, D.M., W.C., T.M., R.B., H.B., S.F., J.M. and H.O.; writing—review and editing, D.M., W.C., T.M., R.B., H.B., S.F., J.M., J.P. and H.O.; visualization, D.M., W.C. and T.M.; supervision, T.M.; project administration, T.M., H.B. and H.O.; funding acquisition, T.M., S.F., C.H., H.B. and J.P. All authors have read and agreed to the published version of the manuscript.

Funding

The CIRCCREX and PiknMix-F campaigns were funded by the Natural Environment Research Council of the UK, the Met Office, and the European Space Agency.

Acknowledgments

The BAe-146 research aircraft is operated by Airtask and Avalon and managed by the Facility for Airborne Atmospheric Measurements (FAAM). The authors thank the crew and personnel involved in the CIRCCREX and PiknMix-F campaigns.

Conflicts of Interest

The authors declare no conflict of interest.

Abbreviations

The following abbreviations are used in this manuscript:
ARIESAirborne Research Interferometer Evaluation System
BTBrightness Temperature
CICCirrus identification and Classification
CIRCCREXCirrus Coupled Cloud-Radiation Experiment
ECMWFEuropean Centre for Medium-Range Weather Forecasts
ERAECMWF Re-Analysis
ESAEuropean Space Agency
FAAMFacility for Airborne Atmospheric Measurements
FIRFar-Infrared
FORUMFar-infrared Outgoing Radiation Understanding and Monitoring
HRHit Rate
IG2Initial Guess database No. 2
LBLRTMLine-by-Line Radiative Transfer Model
MIRMid-Infrared
MetOpMeteorological Operational satellite programme - Second Generation
NESRNoise Equivalent Spectral Radiance
ODOptical Depth
PCAPrincipal Component Analysis
SISimilarity Index
SIDSimilarity Index Difference
SLRStraight and Level Run
TAFTSTropospheric Airborne Fourier Transform Spectrometer
TSTraining Set
UTCCoordinated Universal Time

References

  1. Harries, J.; Carli, B.; Rizzi, R.; Serio, C.; Mlynczak, M.; Palchetti, L.; Maestri, T.; Brindley, H.; Masiello, G. The Far-infrared Earth. Rev. Geophys. 2008, 46, RG4004. [Google Scholar] [CrossRef]
  2. Brindley, H.; Harries, J. The impact of far i.r. absorption on clear sky greenhouse forcing: Sensitivity studies at high spectral resolution. J. Quant. Spectrosc. Radiat. Transf. 1998, 60, 151–180. [Google Scholar] [CrossRef]
  3. Allan, R.P.; Shine, K.P.; Slingo, A.; Pamment, J.A. The dependence of clear-sky outgoing long-wave radiation on surface temperature and relative humidity. Q. J. R. Meteorol. Soc. 1999, 125, 2103–2126. [Google Scholar] [CrossRef]
  4. Maestri, T.; Cossich, W.; Sbrolli, I. Cloud identification and classification from high spectral resolution data in the far infrared and mid-infrared. Atmos. Meas. Tech. 2019, 12, 3521–3540. [Google Scholar] [CrossRef] [Green Version]
  5. ESA. Report for Mission Selection: FORUM; Technical Report ESA-EOPSM-FORM-RP-3549; European Space Agency: Noordwijk, The Netherlands, 2019; p. 263. Available online: https://esamultimedia.esa.int/docs/EarthObservation/EE9-FORUM-RfMS-ESA-v1.0-FINAL.pdf (accessed on 29 June 2020).
  6. Kiehl, J.T.; Trenberth, K.E. Earth’s Annual Global Mean Energy Budget. Bull. Am. Meteorol. Soc. 1997, 78, 197. [Google Scholar] [CrossRef] [Green Version]
  7. Liou, K. An Introduction to Atmospheric Radiation; Academic Press: Amsterdam, The Netherlands; Boston, MA, USA, 2002. [Google Scholar]
  8. Cox, C.V.; Harries, J.E.; Taylor, J.P.; Green, P.D.; Baran, A.J.; Pickering, J.C.; Last, A.E.; Murray, J. Measurement and simulation of mid- and far-infrared spectra in the presence of cirrus. Q. J. R. Meteorol. Soc. 2010, 136, 718–739. [Google Scholar] [CrossRef]
  9. IPCC. Climate Change 2013: The Physical Science Basis: Working Group I Contribution to the Fifth Assessment Report of the Intergovernmental Panel on Climate Change; Cambridge University Press: New York, NY, USA, 2013. [Google Scholar]
  10. Maestri, T.; Arosio, C.; Rizzi, R.; Palchetti, L.; Bianchini, G.; Del Guasta, M. Antarctic Ice Cloud Identification and Properties Using Downwelling Spectral Radiance from 100 to 1400 cm-1. J. Geophys. Res. (Atmos.) 2019, 124, 4761–4781. [Google Scholar] [CrossRef]
  11. Palchetti, L.; Di Natale, G.; Bianchini, G. Remote sensing of cirrus cloud microphysical properties using spectral measurements over the full range of their thermal emission. J. Geophys. Res. (Atmos.) 2016, 121, 10804–10819. [Google Scholar] [CrossRef]
  12. Di Natale, G.; Palchetti, L.; Bianchini, G.; Del Guasta, M. Simultaneous retrieval of water vapour, temperature and cirrus clouds properties from measurements of far infrared spectral radiance over the Antarctic Plateau. Atmos. Meas. Tech. 2017, 10, 825–837. [Google Scholar] [CrossRef] [Green Version]
  13. Nazaryan, H.; McCormick, M.P.; Menzel, W.P. Global characterization of cirrus clouds using CALIPSO data. J. Geophys. Res. (Atmos.) 2008, 113, D16211. [Google Scholar] [CrossRef]
  14. Sassen, K.; Wang, Z.; Liu, D. Global distribution of cirrus clouds from CloudSat/Cloud-Aerosol Lidar and Infrared Pathfinder Satellite Observations (CALIPSO) measurements. J. Geophys. Res. (Atmos.) 2008, 113, D00A12. [Google Scholar] [CrossRef]
  15. Veglio, P.; Maestri, T. Statistics of vertical backscatter profiles of cirrus clouds. Atmos. Chem. Phys. 2011, 11, 12925–12943. [Google Scholar] [CrossRef] [Green Version]
  16. Bianchini, G.; Palchetti, L.; Carli, B. A wide-band nadir-sounding spectroradiometer for the characterization of the Earth’s outgoing long-wave radiation. In Sensors, Systems, and Next-Generation Satellites X; Meynart, R., Neeck, S.P., Shimoda, H., Eds.; Society of Photo-Optical Instrumentation Engineers (SPIE) Conference Series; International Society for Optics and Photonics: Bellingham, WA, USA; Cardiff, UK, 2006; Volume 6361, p. 63610A. [Google Scholar] [CrossRef]
  17. Mlynczak, M.G.; Johnson, D.G.; Latvakoski, H.; Jucks, K.; Watson, M.; Kratz, D.P.; Bingham, G.; Traub, W.A.; Wellard, S.J.; Hyde, C.R.; et al. First light from the Far-Infrared Spectroscopy of the Troposphere (FIRST) instrument. Geophys. Res. Lett. 2006, 33, L07704. [Google Scholar] [CrossRef] [Green Version]
  18. Canas, T.A.; Murray, J.E.; Harries, J.E. Tropospheric airborne Fourier transform spectrometer (TAFTS). In Satellite Remote Sensing of Clouds and the Atmosphere II; Society of Photo-Optical Instrumentation Engineers (SPIE) Conference Series; International Society for Optics and Photonics: Bellingham, WA, USA; Cardiff, UK, 1997; Volume 3220, pp. 91–102. [Google Scholar] [CrossRef]
  19. Pickering, J.C.; Fox, C.; Murray, J.E.; Last, A. The Cirrus Coupled Cloud-Radiation Experiment: CIRCCREX. In Fourier Transform Spectroscopy and Hyperspectral Imaging and Sounding of the Environment; Optical Society of America: Washington, DC, USA, 2015; p. JM3A.14. [Google Scholar] [CrossRef]
  20. Met Office; Facility for Airborne Atmospheric Measurements; Natural Environment Research Council. Met Office (2019): FAAM C153 PIKNMIX-F Flight: Airborne Atmospheric Measurements from Core and Non-Core Instrument Suites on Board the BAE-146 Aircraft. Centre for Environmental Data Analysis. January 2019. Available online: https://catalogue.ceda.ac.uk/uuid/6a2bc7a1edc34650bd41e0f958cbd50a (accessed on 29 June 2020).
  21. Wilson, S.H.S.; Atkinson, N.C.; Smith, J.A. The Development of an Airborne Infrared Interferometer for Meteorological Sounding Studies. J. Atmos. Ocean. Technol. 1999, 16, 1912. [Google Scholar] [CrossRef]
  22. Mahajan, S.; Fataniya, B. Cloud detection methodologies: Variants and development—A review. Complex Intell. Syst. 2019. [Google Scholar] [CrossRef] [Green Version]
  23. McNally, A.P.; Watts, P.D. A cloud detection algorithm for high-spectral-resolution infrared sounders. Q. J. R. Meteorol. Soc. 2003, 129, 3411–3423. [Google Scholar] [CrossRef]
  24. Lavanant, L.; Fourrié, N.; Gambacorta, A.; Grieco, G.; Heilliette, S.; Hilton, F.I.; Kim, M.J.; McNally, A.P.; Nishihata, H.; Pavelin, E.G.; et al. Comparison of cloud products within IASI footprints for the assimilation of cloudy radiances. Q. J. R. Meteorol. Soc. 2011, 137, 1988–2003. [Google Scholar] [CrossRef]
  25. Luo, T.; Zhang, W.; Yu, Y.; Feng, M.; Duan, B.; Xing, D. Cloud detection using infrared atmospheric sounding interferometer observations by logistic regression. Int. J. Remote Sens. 2019, 40, 6530–6541. [Google Scholar] [CrossRef]
  26. Wang, L.; Zheng, Y.; Liu, C.; Niu, Z.; Xu, J.; Chen, W.; Jiang, R. Combination of AIRS Dual CO2 Absorption Bands to Develop an Ice Clouds Detection Algorithm in Different Atmospheric Layers. Remote Sens. 2019, 12, 6. [Google Scholar] [CrossRef] [Green Version]
  27. Eresmaa, R. Imager-assisted cloud detection for assimilation of Infrared Atmospheric Sounding Interferometer radiances. Q. J. R. Meteorol. Soc. 2014, 140, 2342–2352. [Google Scholar] [CrossRef]
  28. Green, P.D.; Newman, S.M.; Beeby, R.J.; Murray, J.E.; Pickering, J.C.; Harries, J.E. Recent advances in measurement of the water vapour continuum in the far-infrared spectral region. Philos. Trans. R. Soc. Lond. Ser. A 2012, 370, 2637–2655. [Google Scholar] [CrossRef] [PubMed] [Green Version]
  29. Fox, C.; Green, P.D.; Pickering, J.C.; Humpage, N. Analysis of far-infrared spectral radiance observations of the water vapor continuum in the Arctic. J. Quant. Spectrosc. Radiat. Transf. 2015, 155, 57–65. [Google Scholar] [CrossRef] [Green Version]
  30. Bellisario, C.; Brindley, H.E.; Murray, J.E.; Last, A.; Pickering, J.; Harlow, R.C.; Fox, S.; Fox, C.; Newman, S.M.; Smith, M.; et al. Retrievals of the Far Infrared Surface Emissivity Over the Greenland Plateau Using the Tropospheric Airborne Fourier Transform Spectrometer (TAFTS). J. Geophys. Res. (Atmos.) 2017, 122, 12152–12166. [Google Scholar] [CrossRef] [Green Version]
  31. Klaes, K.D.; Cohen, M.; Buhler, Y.; Schlüssel, P.; Munro, R.; Luntama, J.P.; Engeln, A.V.; Clérigh, E.Ó.; Bonekamp, H.; Ackermann, J.; et al. An Introduction to the EUMETSAT Polar system. Bull. Am. Meteorol. Soc. 2007, 88, 1085. [Google Scholar] [CrossRef]
  32. Chahine, M.T.; Pagano, T.S.; Aumann, H.H.; Atlas, R.; Barnet, C.; Blaisdell, J.; Chen, L.; Divakarla, M.; Fetzer, E.J.; Goldberg, M.; et al. AIRS: Improving Weather Forecasting and Providing New Data on Greenhouse Gases. Bull. Am. Meteorol. Soc. 2006, 87, 911–926. [Google Scholar] [CrossRef] [Green Version]
  33. Clough, S.A.; Shephard, M.W.; Mlawer, E.J.; Delamere, J.S.; Iacono, M.J.; Cady-Pereira, K.; Boukabara, S.; Brown, P.D. Atmospheric radiative transfer modeling: A summary of the AER codes. J. Quant. Spectrosc. Radiat. Transf. 2005, 91, 233–244. [Google Scholar] [CrossRef]
  34. Turner, D.D.; Ackerman, S.A.; Baum, B.A.; Revercomb, H.E.; Yang, P. Cloud Phase Determination Using Ground-Based AERI Observations at SHEBA. J. Appl. Meteorol. 2003, 42, 701–715. [Google Scholar] [CrossRef] [Green Version]
  35. Turner, D.D.; Knuteson, R.O.; Revercomb, H.E.; Lo, C.; Dedecker, R.G. Noise Reduction of Atmospheric Emitted Radiance Interferometer (AERI) Observations Using Principal Component Analysis. J. Atmos. Ocean. Technol. 2006, 23, 1223. [Google Scholar] [CrossRef]
  36. Stamnes, K.; Tsay, S.C.; Jayaweera, K.; Wiscombe, W. Numerically stable algorithm for discrete-ordinate-method radiative transfer in multiple scattering and emitting layered media. Appl. Opt. 1988, 27, 2502–2509. [Google Scholar] [CrossRef]
  37. Mlawer, E.J.; Payne, V.H.; Moncet, J.L.; Delamere, J.S.; Alvarado, M.J.; Tobin, D.C. Development and recent evaluation of the MT_CKD model of continuum absorption. Philos. Trans. R. Soc. Lond. Ser. A 2012, 370, 2520–2556. [Google Scholar] [CrossRef] [PubMed] [Green Version]
  38. Rothman, L.S.; Gordon, I.E.; Babikov, Y.; Barbe, A.; Chris Benner, D.; Bernath, P.F.; Birk, M.; Bizzocchi, L.; Boudon, V.; Brown, L.R.; et al. The HITRAN2012 molecular spectroscopic database. J. Quant. Spectrosc. Radiat. Transf. 2013, 130, 4–50. [Google Scholar] [CrossRef]
  39. Masuda, K.; Takashima, T.; Takayama, Y. Emissivity of pure and sea waters for the model sea surface in the infrared window regions. Remote Sens. Environ. 1988, 24, 313–329. [Google Scholar] [CrossRef]
  40. Dee, D.P.; Uppala, S.M.; Simmons, A.J.; Berrisford, P.; Poli, P.; Kobayashi, S.; Andrae, U.; Balmaseda, M.A.; Balsamo, G.; Bauer, P.; et al. The ERA-Interim reanalysis: Configuration and performance of the data assimilation system. Q. J. R. Meteorol. Soc. 2011, 137, 553–597. [Google Scholar] [CrossRef]
  41. Remedios, J.J.; Leigh, R.J.; Waterfall, A.M.; Moore, D.P.; Sembhi, H.; Parkes, I.; Greenhough, J.; Chipperfield, M.P.; Hauglustaine, D. MIPAS reference atmospheres and comparisons to V4.61/V4.62 MIPAS level 2 geophysical data sets. Atmos. Chem. Phys. Discuss. 2007, 7, 9973–10017. [Google Scholar] [CrossRef] [Green Version]
  42. Yang, P.; Bi, L.; Baum, B.A.; Liou, K.N.; Kattawar, G.W.; Mishchenko, M.I.; Cole, B. Spectrally Consistent Scattering, Absorption, and Polarization Properties of Atmospheric Ice Crystals at Wavelengths from 0.2 to 100 µm. J. Atmos. Sci. 2013, 70, 330–347. [Google Scholar] [CrossRef]
  43. Lerner, J.A.; Weisz, E.; Kirchengast, G. Temperature and humidity retrieval from simulated Infrared Atmospheric Sounding Interferometer (IASI) measurements. J. Geophys. Res. (Atmos.) 2002, 107, 4189. [Google Scholar] [CrossRef] [Green Version]
  44. Bloom, H.J. The Cross-track Infrared Sounder (CrIS): A sensor for operational meteorological remote sensing. In Proceedings of the IGARSS 2001, Scanning the Present and Resolving the Future, IEEE 2001 International Geoscience and Remote Sensing Symposium (Cat. No.01CH37217), Sydney, NSW, Australia, 9–13 July 2001; Volume 3, pp. 1341–1343. [Google Scholar] [CrossRef]
Figure 1. Flight tracks (dotted lines) and straight level runs (solid lines) of the two experimental campaigns described in the text. Cirrus cloud data have been collected during flight B895 (black) while clear sky data have been collected during flight C153 (red). Synthetic spectra are computed from reanalysis data referred to the location marked by the magenta asterisk.
Remotesensing 12 02097 g001
Figure 2. Tropospheric Airborne Fourier Transform Spectrometer (TAFTS) and Airborne Research Interferometer Evaluation System (ARIES) observation timestamps (black marks) for the Facility for Airborne Atmospheric Measurements (FAAM) flights B895 (top panel) and C153 (bottom panel). The red asterisks mark TAFTS and ARIES simultaneous measurements. Blue solid lines show the flights altitude during data collection.
Remotesensing 12 02097 g002
Figure 3. Calibration noise (red) and noise equivalent spectral radiance (NESR) (black) associated to the TAFTS and ARIES observations. The Far-infrared Outgoing Radiation Understanding and Monitoring (FORUM) NESR (in light green) is also reported for reference.
Remotesensing 12 02097 g003
Figure 4. Left panel: example of the cloud identification and classification algorithm (CIC) elementary method applied to the training set elements. The clear (blue histogram) and the cloudy (red histogram) training set (TS) elements are classified according to the SID as clear (blue shaded area) or cloudy (red shaded area) scenes. Only 79% of the spectra are correctly classified using the elementary method. Right panel: same as left panel but for the CIC distributional method. All the training set spectra are correctly classified in this example case.
Remotesensing 12 02097 g004
Figure 5. Synthetic (black) and observed (color blue or red) brightness temperature (BT) spectra in the TSs for clear (top) and cloudy (bottom) sky. The gaps in the spectra separate, from left to right, TAFTS long wave, TAFTS short wave, and ARIES long wave spectral ranges.
Remotesensing 12 02097 g005
Figure 6. CIC classification results on the observed FAAM flights spectra. CIC is run, from left to right, over the intervals TAFTS (80–540 cm 1 ), ARIES (600–1300 cm 1 ), and OPTIMAL (320–1300 cm 1 ). Histogram elements within the blue/red shaded area are classified as clear/cloudy respectively.
Remotesensing 12 02097 g006
Figure 7. Minimum cloud optical depth for which the CIC, applied using different wavenumber intervals, classifies the scene as cloudy. The cloud is computed with a fixed geometrical thickness of 400 m and cloud ice particle effective dimensions of 40 µm. Cloud top altitude is varied as reported on the x-axis.
Remotesensing 12 02097 g007
Figure 8. Upper panel: BT synthetic spectra of a clear sky (blue) and two cloudy skies (black/red) in the same atmospheric conditions. The clouds are placed at 9.1 km altitude, are 400 m thick, with an effective particle dimension of 40 µm, for two different optical depths (ODs) that are representative of the detection limits of CIC using the MIR and FIR (OD = 0.09, black line) or the MIR only (OD = 0.18, red line). Bottom panel: BT differences with respect to the clear sky spectrum for the two ODs. The noise level associated with the simulated spectra is also plotted in light blue around the zero line.
Remotesensing 12 02097 g008
Table 1. Cloud parameter ranges used to define the cirrus cloud layers for the synthetic spectra.
ParameterMinMaxUnits
Top Height5.19.5km
Geometric Thickness0.22.8km
Optical Depth (900 cm 1 )0.22.0
Effective Dimension240µm
Table 2. Number of synthetic and observed spectra in the training and test sets.
SyntheticObservedTotal
TS CLEAR30636
TS CLOUD30636
TEST SET CLEAR/CLOUD0/084/24108
Table 3. Spectral intervals of application of the CIC algorithm.
Interval NameInitial Wavenumber (cm 1 )Final Wavenumber (cm 1 )
TAFTS80540
ARIES6001300
OPTIMAL3201300
Table 4. Hit rate scores of the CIC algorithm.
Interval Range * (cm 1 )SceneHR
TAFTSCLEAR0.46
(80–540)CLOUDY1.00
TOTAL0.58
ARIESCLEAR1.00
(600–1300)CLOUDY1.00
TOTAL1.00
OPTIMALCLEAR1.00
(320–1300)CLOUDY1.00
TOTAL1.00
* See text for gaps in the intervals.

