Deep Learning Based Multi-Modal Fusion Architectures for Maritime Vessel Detection


Department of Future Technologies, University of Turku, 20500 Turku, Finland
*
Author to whom correspondence should be addressed.
†
Current address: Department of Future Technologies, FI-20014 Turun yliopisto, Finland.
Remote Sens. 2020, 12(16), 2509; https://0-doi-org.brum.beds.ac.uk/10.3390/rs12162509
Submission received: 20 July 2020
/
Revised: 31 July 2020
/
Accepted: 2 August 2020
/
Published: 5 August 2020
(This article belongs to the Special Issue Application of Multi-Sensor Fusion Technology in Target Detection and Recognition)
Abstract
:Object detection is a fundamental computer vision task for many real-world applications. In the maritime environment, this task is challenging due to varying light, view distances, weather conditions, and sea waves. In addition, light reflection, camera motion and illumination changes may cause to false detections. To address this challenge, we present three fusion architectures to fuse two imaging modalities: visible and infrared. These architectures can provide complementary information from two modalities in different levels: pixel-level, feature-level, and decision-level. They employed deep learning for performing fusion and detection. We investigate the performance of the proposed architectures conducting a real marine image dataset, which is captured by color and infrared cameras on-board a vessel in the Finnish archipelago. The cameras are employed for developing autonomous ships, and collect data in a range of operation and climatic conditions. Experiments show that feature-level fusion architecture outperforms the state-of-the-art other fusion level architectures.
1. Introduction
Object detection is a crucial problem for autonomous vehicles and has been studied for years to make it efficient and faster. A reliable autonomous driving system relies on accurate object detection for providing robust perception of the environment. In addition, the performance of subsequent tasks such as object classification and tracking depend strongly on the object detection. In marine environment, object detection is a challenging problem due to varying light, view distances, weather conditions, and dynamic sea nature. In addition, light reflection, camera motion and illumination changes may cause false detections [1].
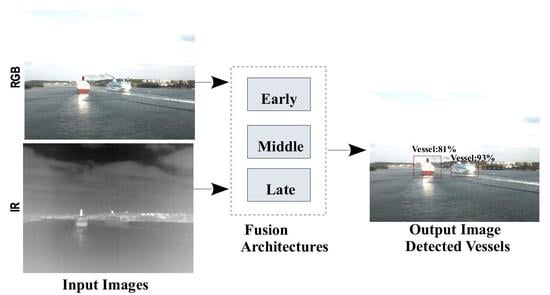
Multi-sensor fusion technology is a promising solution for achieving accurate object detection by obtaining the complementary properties of objects based on multiple sensors. The multi-sensor fusion architectures are generally classified into three groups that are based on the level of data abstraction used for fusion [2]. (1) Early fusion, also called pixel-level fusion, combines raw data from the sensors before applying any information extraction strategies. (2) Middle fusion, also called feature-level fusion, fuses the extracted features from each raw sensor data and then performs detection on the fused data. (3) Late fusion, also called decision-level fusion, independently performs detection from each sensor and the outputs of each sensor are fused at the decision level for final detection.
Among the combination of sensor types, InfRared (IR) and visible (RGB) image fusion is superior in many aspects [3]. Firstly, image sensors are cheap when compared in other sensors, such as radar and LiDAR (Light Detection And Ranging). Secondly, collecting and annotating image data is much easier than LiDAR point clouds. Thirdly, IR and RGB images share complementary properties, thus producing robust and informative fused images. Finally, RGB images typically have high spatial resolution and considerable detail when compared to the images that obtained from other sensors. However, these images can be easily influenced by severe conditions, such as poor illumination, fog, and other effects of bad weather. Meanwhile, the thermal IR cameras capture relative temperature, which allows for distinguishing warm objects, like person from cold objects, like navigation buoy or the island. Moreover, IR cameras can improve navigation safety at night/day time and all-weather conditions by determining interest objects based on radiation difference [1,2,3].
Convolutional Neural Networks (CNNs) or ConvNet allowed for a significant improvement in the performance of computer vision tasks, such as object classification [4], detection [5,6], and segmentation [7]. Moreover, various fusion approaches have been employed CNN in autonomous vehicles [1,8,9]. While the majority of these approaches has focused on RGB images, some of them have also been directed using infrared images for object detection. We use CNN for addressing the object detection problem in marine environment to fill this gap and by the fact that CNN is a very powerful model for computer vision tasks.
In this work, we present three early, middle and late fusion CNN architectures to carry out vessel detection in marine environment. These architectures can fuse the images from the visible and thermal infrared cameras at the different levels of data abstraction. In addition, these architectures employed a deep CNN as a detector to generate bounding box proposals for interest vessels in marine environment. We did not take into consideration any semantic segmentation algorithms in this study. The CNN is trained on data from a single sensor or two used sensors according to the proposed fusion strategies. On the other hand, we investigate the training of uni-modal architectures as well as multi-modal architectures. We also evaluated the proposed fusion architectures on a real marine dataset that was collected by a vessel in the Finnish archipelago. The data represents images which are captured by RGB and IR cameras in different marine environmental conditions (i.e., weather conditions, light conditions, daytime/nighttime). To the best of our knowledge, no work has been done on studying the effectiveness of three different levels of fusion in marine environment. To summarize, the main contributions of this paper are in three-fold:
- We collect two carefully annotated maritime datasests in diverse environmental conditions and dynamic ranges.
- We present three multi-modal CNN-based architectures to fuse RGB and IR images for achieving robust vessel detection in marine environments.
- We investigate the effect of three deep learning-based and four traditional image fusion methods in the proposed middle fusion architecture.
- We evaluate the performance of the proposed architectures. The effectiveness of the fusing of two modalities against one modality is investigated.
The remainder of the work is organized, as follows. Section 2 discusses some of the most important related works. The proposed architectures are presented in Section 3, Section 4 and Section 5. Section 6 and Section 7 show the experimental setup and results of our implementations, respectively. Finally, we present our conclusions in Section 8.
2. Related Work
In this section, we briefly review the related work on infrared and visible image fusion and object detection using CNN. In addition, the vessel detection for maritime is also discussed.
CNNs for fusion: many image fusion techniques have been developed in recent years. The main idea of these techniques is obtaining salient features from input images and then combining them for generating a fused image [10]. Deep Learning (DL) is one of the widely-used approaches that has recently been used by theses techniques, since it can explore the features from the data efficiently [8]. It is able to obtain features from input images and then reconstruct a fused images with more details.
Multi-Scale CNN (MS-CNN) is one of these techniques that uses DL for performing pixel-level image fusion. It uses a proposal sub-network to perform target detection at multiple output layers, so that receptive fields match objects of different scales. These complementary scale-specific detectors are combined in order to create a strong multi-scale object detector. In [9], a middle fusion approach is proposed for fusing LiDAR and RGB data in order to classify objects in autonomous vehicle application. This approach first converts LiDAR point cloud data into depth map and then fed the data to a CNN for object classification. In a similar work [11], the dense depth map from LiDAR data and color imagery are fused for pedestrian detection while using CNN. Their results show that fusing LiDAR can improve the detection results. In another work, a DL-based fusion method [10] is presented to generate a fused image containing whole features from two sources IR and RGB images. We will describe the details of this method in Section 4.1.
DenseFuse [8] is another well-known DL-based fusion architecture for extracting and preserving most of the deep features of both RGB and IR images in a middle fusion fashion. In [1], a late fusion method is proposed based on the Probabilistic Data Association (PDA) [12] in order to produce object region proposals by fusing detection results from RGB, IR, radar and LiDAR. Then, a CNN is applied on the top of region proposals for classifying the interest objects within the regions. DyFusion [13] is a decision level fusion for maritime vessel classification. It first uses a CNN to generate the probabilities over maritime vessel classes for each input sensor. Subsequently, a fusion part updates the sensor probabilities by considering the contextual data.
PointFusion [14] leverages both image and three-dimensional (3D) point cloud data based on a late fusion architecture to perform target detection. The image data and point cloud data are independently processed by a CNN and then their results are combined to estimate object bounding boxes from image and point cloud data. The main contribution of PointFusion is using using heterogeneous network architectures. Moreover, the raw point cloud data is directly handled using a PointNet model, which avoids time consuming input pre-process such as quantization or projection.
CNNs for object detection: CNN were recently used in the development of object detection, as they are capable exploiting unknown structures in training data for discovering good representations [15]. The CNN-based object detectors are divided into two categories: two-stage detectors and one-stage detectors. Two-stage detectors employ an external module for generating interest object region proposals and their speed usually slower than one-stage detectors. In contrast, one-stage object detectors integrate region proposition and classification into one single stage. However, two-stage detectors usually have higher detection accuracy when compared to the one-stage detectors. Popular two-stage detectors include R-CNN [16], Fast/Faster R-CNN [17,18], and R-FCN [19]. Between one-stage detectors, SSD [20] and YOLO [21] are most common.
Region-based Convolutional Neural Network (R-CNN) [16], which leads to substantial gains in object detection accuracy. R-CNN first identifies region proposals and then classifies these regions into object categories or background using a CNN. One disadvantage of R-CNN is that it performs exhaustive search and proposes large number of regions from an image. Therefore, RCNN leads to time-consuming and energy-inefficient computation. The extension version of R-CNN is Fast R-CNN [17] which uses CNN to generate feature map straight from the input image instead of regions. Both R-CNN and Fast R-CNN use selective search for obtaining the region proposals. In order to reduce running time of Fast R-CNN, Faster R-CNN [18] omits the selective search method for generating object region proposals. Instead of using selective search, Faster R-CNN identifies the regions by using a separate network.
Maritime vessel detection: A few studies utilized object detection algorithms from waterborne images beyond maritime vessel detection from spaceborne imagery [22]. Some of these works have focused on classifying the interest objects from the background [23], others employed the Histogram of Oriented Gradients (HOG) approach using sliding-windows [24]. Recently, CNNs have been used for seaborne vessel detection. However, developing more new dataset and applications are necessary for autonomous maritime navigation. For instance, the Singapore Maritime Dataset is used in [25] for ship detection under a new proposed model, YOLO [21]. In [26], a contextual region-based convolutional neural network with multi-layer fusion is proposed for ship detection. It consists of a region proposal network (RPN) and an object detection network with contextual features. Their results show that the additional contextual features provide more information for detection. However, this method can not detect small objects efficiently. In [27], an approach based on selective search is presented in order to extract the initial region proposals from RGB images. Subsequently, the initial proposals are filtered using the information from other sensors in order to find more dense proposals. Finally, a CNN is employed to identify the class of objects within the final proposals. The results are collected based on the marine data that were collected for the Advanced Autonomous Waterborne Applications Initiative (AAWA) project [28].
In [29], another novel dataset, SeaShips, consisting of a collection of in-shore and offshore ship images is introduced. Moreover, they used three object detectors (Faster R-CNN [18], SSD [20], and YOLO [21]) for detecting maritime vessels. In [30], a maritime vessel image dataset from a Vessel Tracking System (VST) is collected. This dataset contains authentic situations from traffic management operators. In addition, they proposed a SSD detector in order to identify vessels.
3. The Proposed Early Fusion Architecture
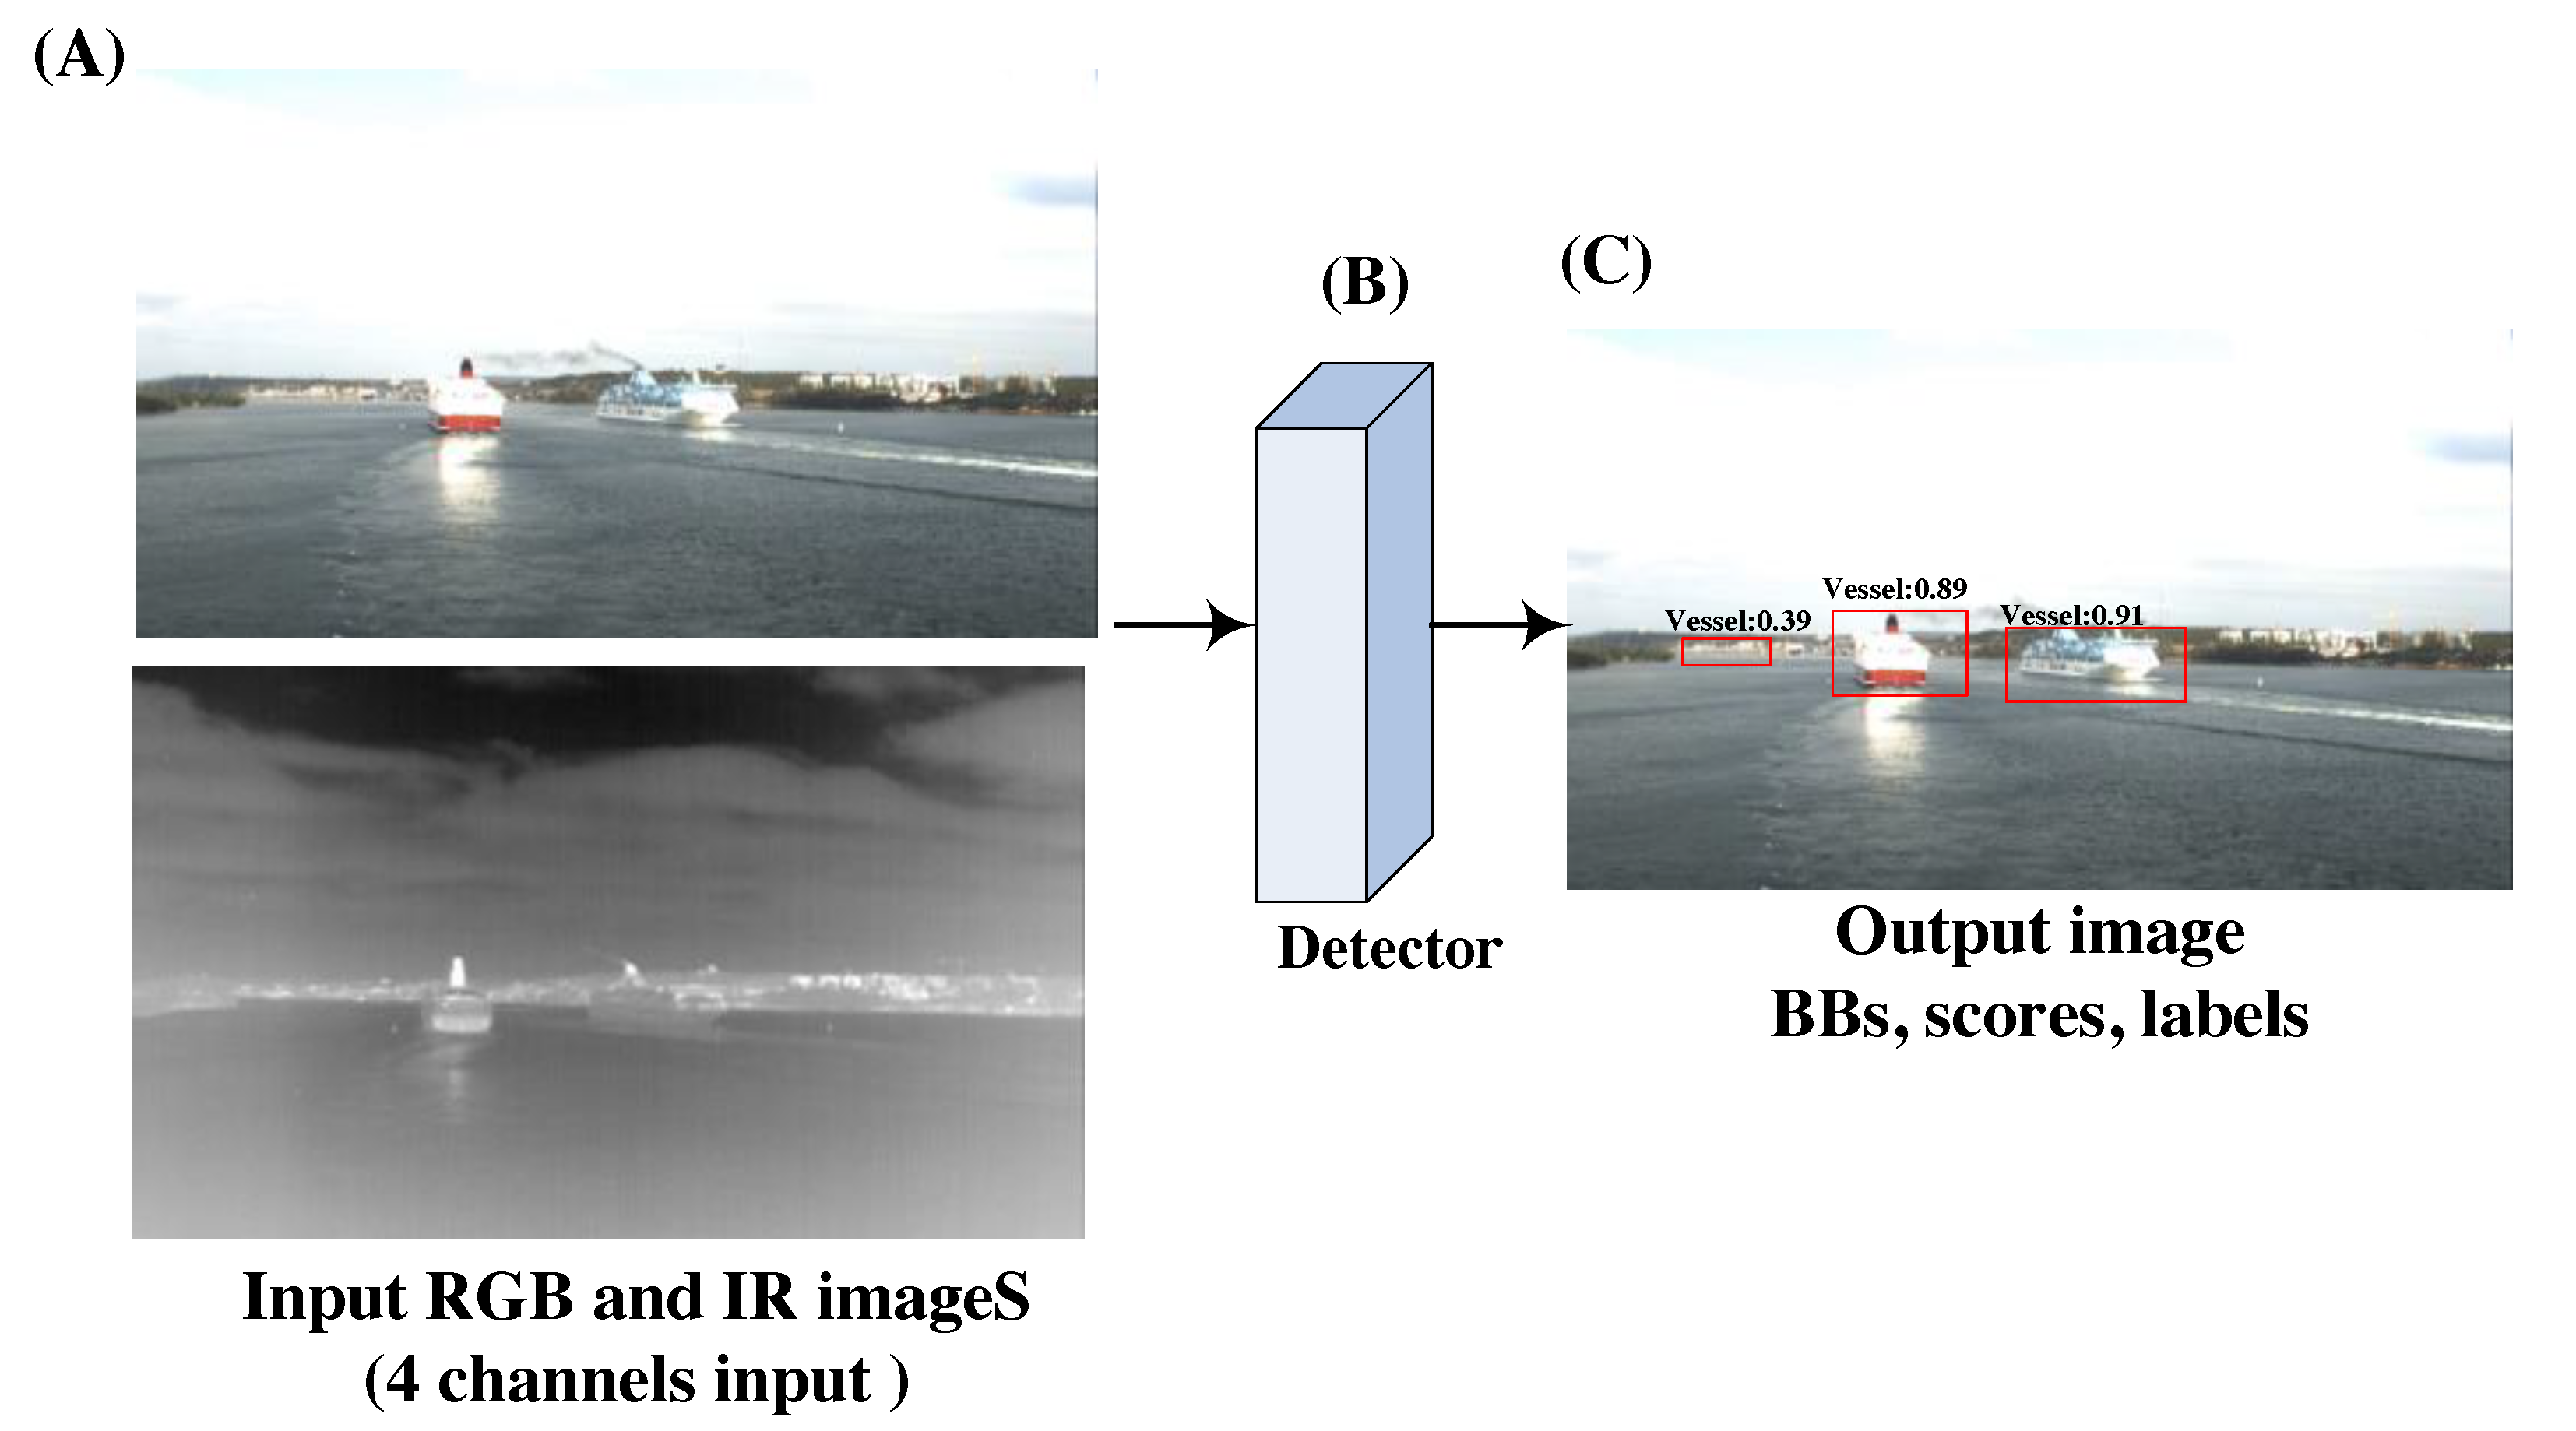
In this architecture, fusion happens at a very low abstraction level. As shown in Figure 1, the early fusion architecture concatenates RGB and IR images and produces a tensor with four channels (three channels from RGB and one channel from IR). This four-channel tensor is used as an input for a detector network. The intuition behind this is simple, since the features of the concatenated image should contain both information from RGB and IR. The detector produces Bounding Boxes (BBs) from the feature maps to localize the vessels. The localization is determined with a box that the top-left corner’s coordinate and bottom-right corner’s coordinate . Moreover, each bounding box is associated with a confidence score s, which indicates how likely does the bounding box contain a vessel. The bounding boxes with the highest confidence are kept in order to filter by a Non-Maximum Suppression (NMS). NMS is a popular post-processing method in object detection methods [5,18] for filtering redundant bounding boxes and obtaining final detections.
4. The Proposed Middle Fusion Architecture
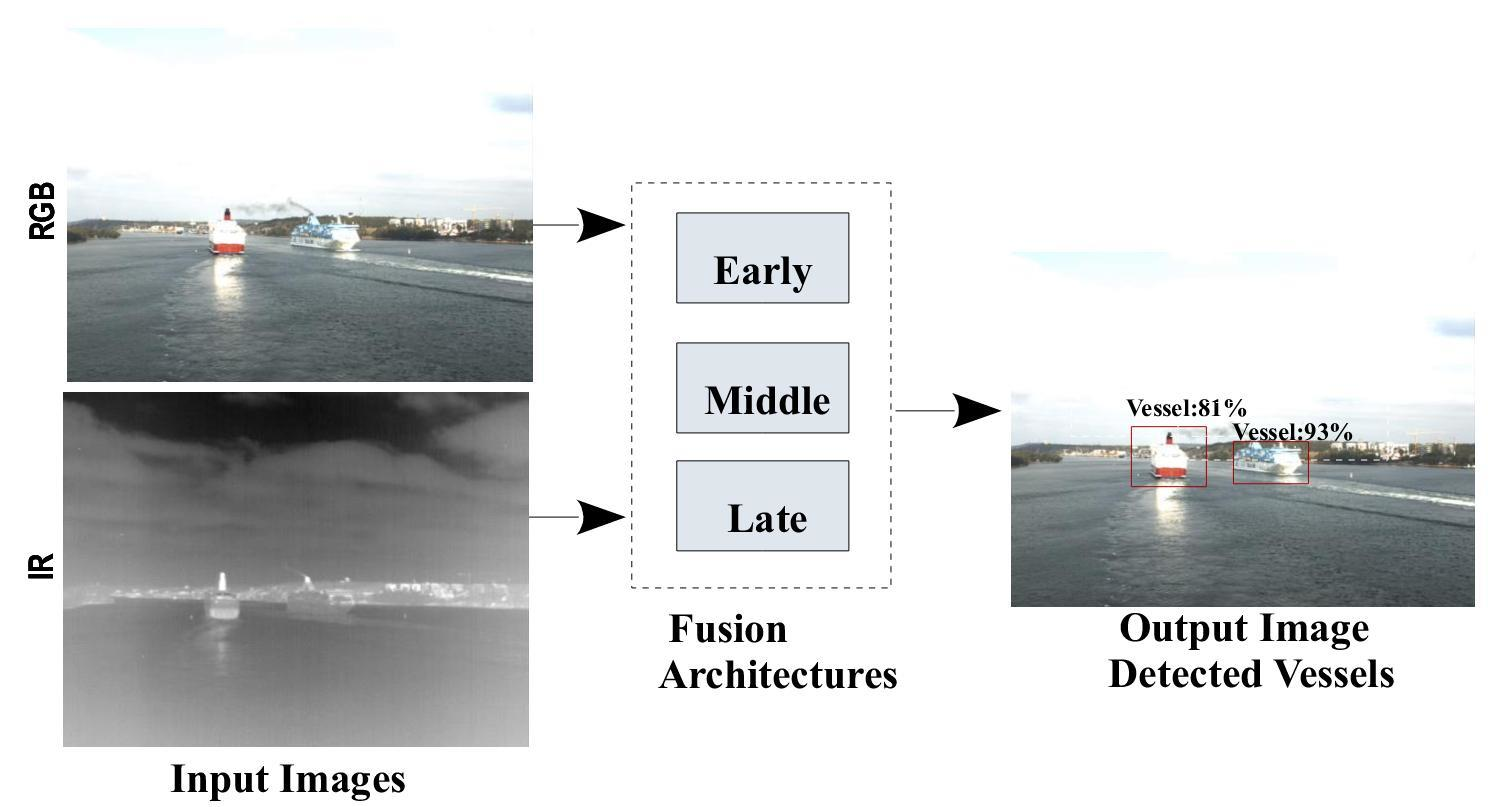
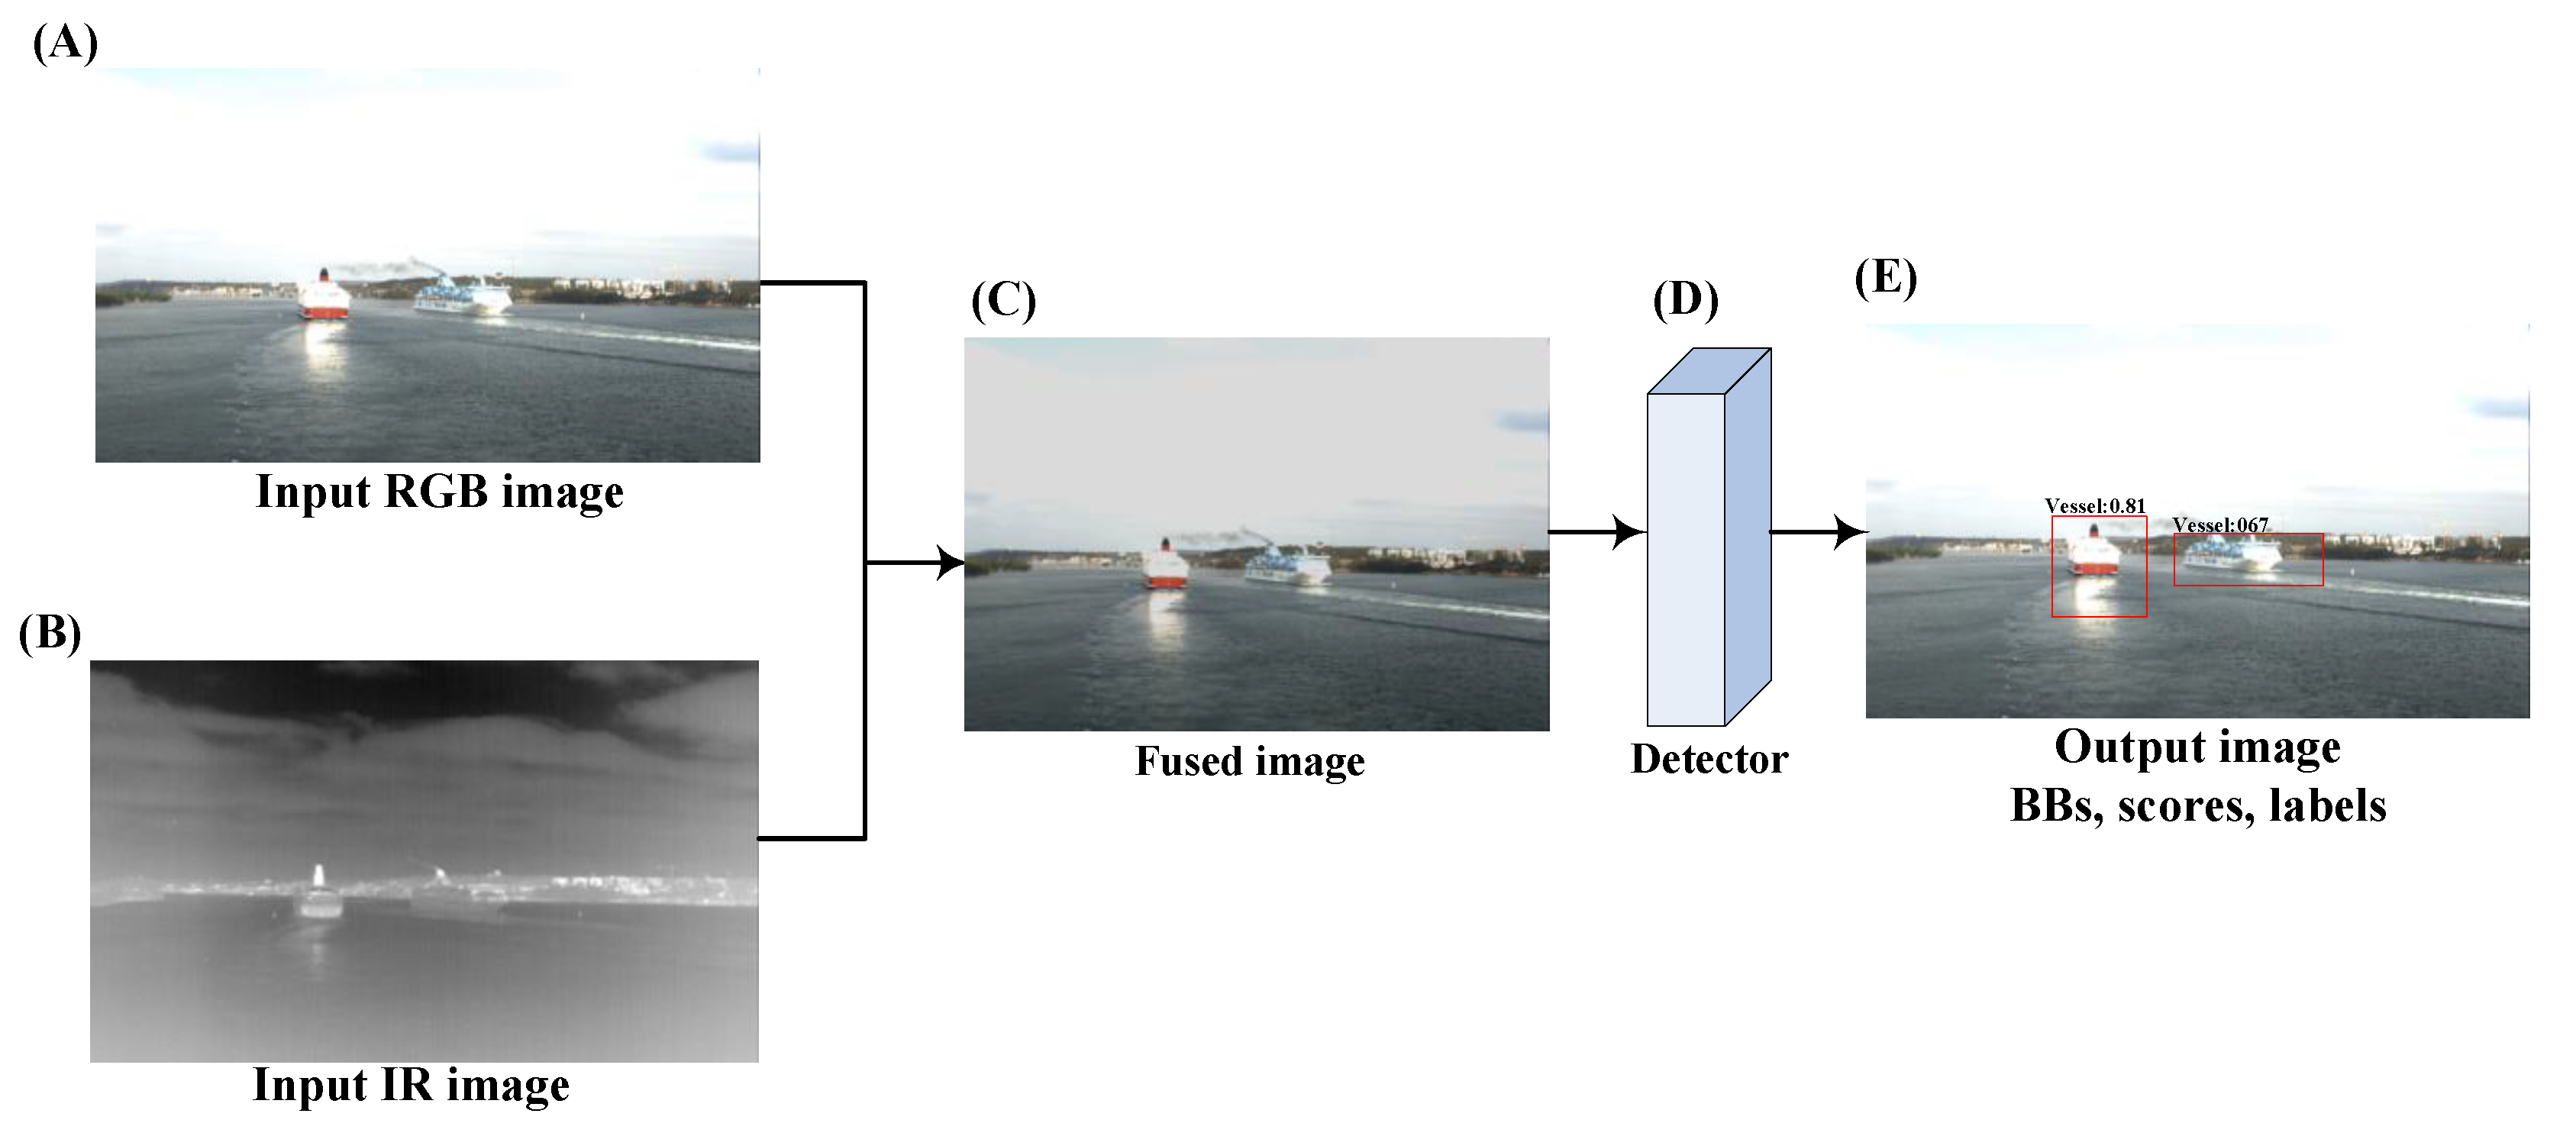
The middle fusion architecture consists of two layers, as illustrated in Figure 2. The first layer is a fuse layer that combines the information given by two RGB and IR cameras and constructs a fused image (Figure 2C). The fused image represents the thermal radiation information in infrared images and detailed texture information in visible images. Afterwards, a detector layer (Figure 2D) performs detection on the fused image in order to generate the object bounding box proposals.
To generate the fused image in the fuse layer, we employed three DL-based image fusion methods (see Section 4.1, Section 4.2 and Section 4.3) and four traditional image fusion methods (see Section 4.4, Section 4.5, Section 4.6 and Section 4.7). Here, we briefly review the tested image fusion methods, three DL and four traditional, which were evaluated in this work. The DL-based methods include: deep learning framework based on VGG19 and Multi-Layer (VGG-ML) [10], DenseFuse [8], and ResNet and Zero-phase Component Analysis-based method (ResNet-ZCA) [31]. The traditional fusion algorithms are categorized into two main groups: Multi-Scale Decomposition (MSD)-based methods [32] and Sparse Representation (SR)-based methods [33,34] according to the the fusion strategies. The MSD-based methods usually use different transform functions: pyramidal and discrete wavelet. The SR-based methods calculate the activity level of input images in a sparse domain. In this work, we utilized the weighted least square [32] as a MSD-based method and convolutional sparse representation [35] as a common SR-based method.
4.1. Deep Learning Framework Based on VGG19 and Multi-Layers
Deep learning framework based on VGG19 and Multi-layer (VGG-ML) [10] can combine the features from two source IR and RGB images and generate a fused image. For this purpose, the source images are firstly decomposed into base and details parts using the image decomposition method [36]. The base part of each source image contains the common features and redundant information and obtains it by the average filter. The details part represents the detail contents of source images and it produces by subtracting the base part from the source image. The base parts of both images are then fused by a weighted average strategy. For the detail parts, a pre-trained VGG19 network [37] obtains deep features from source images. Finally, the base and detail parts are added for creating a final output fused image.
4.2. DenseFuse
DenseFuse [8] is a deep network including three elements: encoder, fusion, and decoder. For testing the network, the encoder first extracts and preserves most deep features of both input RGB and IR images using DenseBlock [38] architecture. DenseBlock contains three cascaded convolutional layers. Subsequently, the fusion layer uses either additional fusion [38] or l1-norm fusion strategy for fusing the extracted features maps from both source images. Finally, the three convolutional-layered decoders receive the fused feature maps in order to create a fused image. For training the network, only encoder and decoder are employed to reconstruct the training images and fix weights of the network. In order to reconstruct the images, DenseFuse aims to reduce the λ weighted combination of pixel and structural similarity losses.
4.3. ResNet and Zero-Phase Component Analysis-Based Fusion
ResNet and Zero-Phase Component Analysis-based (ResNet-ZCA) method [31] has shown to be an efficient method for image fusion. Firstly, it employs ResNet [39] for extracting deep features from source images. Subsequently, ZCA [40] and l1-norm are used in order to project deep features into sparse domain. The initial weight maps are obtained by l1-norm. Finally, a bicubic interpolation is used to resize the initial weight maps to source image size. The final weight maps are generated by soft-max and the fusion image is reconstructed by final weight maps and source images.
4.4. Visual Saliency Map and Weighted Least Square
Visual Saliency Map and Weighted Least Square (VSM-WLS) [32] is a multi-scale fusion method that is based on WLS optimization and VSM. To perform Multi-Scale Decomposition (MSD), it first employs the rolling guidance filter [41] and Gaussian filter and decomposes both source IR and RGB images into base and detail parts. Afterwards, the fusion of base parts is carried by using a weighted average technique in order to enhance the fused image contrast. For fusing the detail parts, WLS optimization is used. Finally, inverse MSD is employed on the fused base and details parts to construct the output fused image.
4.5. Cross Bilateral Filter
Cross Bilateral Filtering (CBF) [42] is a non-iterative and local nonlinear method that combines an edge-stopping function with a low-pass filter for reducing the filter effect wherever the intensity between neighbouring pixels is large. It can filter the images while preserving the edges. Initially, CBF is applied to both RGB and IR source images to extract the base images. Subsequently, the detailed images are obtained by subtracting the base images from the original IR and RGB images. Finally, the fused image is obtained by multiplying the weights with input images, followed by a weight normalization.
4.6. Convolutional Sparse Representation
Convolutional Sparse Representation (ConvSR) [35] address the problem of SR-based image fusion methods by considering a global approach that aims the SR-based image fusion of the whole image rather than of local image patch windows. The global approach enhances the detail preservation and model sensitivity regarding mis-registration. ConvSR consists of hierarchical layers, where each layer includes an image decomposition to divide the input images into base and detail parts. The detail parts are combined using a choose-max strategy. An averaging strategy is applied in order to fuse the base parts and built the fused coefficient maps. The output fused image is built by combining the base and detailed layers.
4.7. Guided Filtering Based Fusion Method
Guided Filtering based Fusion (GFF) [36] method can generate a highly informative fused image based on a two-scale decomposition strategy. This strategy produces base and detail layers containing large scale variations in intensity and small scale details, respectively. Finally, a guided filtering-based weighted average technique is employed in order to make full use of spatial consistency for fusion of the base and detail layers.
5. The Proposed Late Fusion Architecture
Figure 3 demonstrates the proposed late fusion architecture. The late fusion architecture first combines the detection results from two detectors. These two detectors have similar architecture. One detector takes a RGB image as input and the other one takes the corresponding IR image as input. To be more specific, a separate detector is utilized in order to process each input camera image independently and extracts feature from the image. This process involves the estimation of the bounding box proposals, which indicate the objects’ localization in the image. Subsequently, the output bounding boxes of two detectors (,) are concatenated to explicitly capture complementary information of RGB and IR. In this case, fusion happens at the decision level. After that, the following steps are applied on the all boxes ( + ) in order to generate final boxes and remove redundant detections, as follows:
- It first discards all those predicted boxes which the score value is lower than 0.6. Subsequently, it assumes the box with the largest score value among the remaining candidate as the accurate predicted box (Figure 4A).
- Finally, it removes any remaining boxes that the Intersection over Union (IoU) is lower than with (Figure 4B). Each box is assumed as a final box if it is overlapped by the , according to the following function:where is Intersection of Unit (IoU) threshold between two bounding boxes and it is determined experimentally. Based on a series of preliminary experiments, we got the best performance with . IoU is intersection of two boxes divided by their union.where represents the area of bounding box b.
6. Experimental Setup
6.1. Datasets
We collect a real marine dataset by a vessel in Finnish archipelago for evaluating our proposed fusion architectures. The dataset is recorded by two sensors continuously, providing data from various environmental and geographical scenarios. This sensor system includes RGB (visible spectrum) and IR (thermal) camera arrays, providing output that can be synchronized and stitched to form panoramic images. The individual visible cameras have full HD resolution while the thermal cameras have VGA resolution. Both camera types have a horizontal field of view of approximately 35 degrees. For image alignment in this sensor set, the registration parameters are manually determined by finding corresponding features in calibration images and minimizing alignment mismatch. Therefore, our dataset contains well-aligned IR/RGB images. The images were sampled one frame per second in and stored in MPEG format. The images show maritime scenarios under different illumination conditions with various marine vessels. We manually annotated all vessels (passenger vessel, motorboat, sailboat, or docked vessel) within each RGB sequence with a bounding box as accurately as possible. However, all of the vessels have a general label “Vessel” in our datatset. The bounding box should contain all pixels that belong to that object and, at the same time, be as tight as possible. In addition, two different scenarios are proposed in order to evaluate the proposed architectures in different light condition, time imaging and location.
Scenario1: the training dataset is collected by two visible and infrared cameras at daytime. In this scenario, the training dataset consists of 7250 pairs of well-aligned multispectral images captured by cameras. For evaluation, a separate test dataset is gathered in the same light and weather condition contains 1750 RGB/IR pair images. Figure 5a demonstrates a sample of RGB images and corresponding IR in this scenario. The number of vessels in the training and test datasets is determined in Table 1.
Scenario2: RGB and IR images are collected by a vessel operating near the harbour at nigh time. This data represent a challenging data (dark and oversaturated areas) in marine environment. The source videos for generating training and test images are different. The training and test datasets consist of 2250 and 1000 pair RGB/IR images, respectively. Table 1 shows the number of vessels in each dataset. Furthermore, Figure 5b illustrates an IR/RGB pair of a sample of our data in this scenario.
The original size of all images is 3240 × 944 pixels for both scenarios. To reduce the computation time, we re-sized the original images into 1200 × 400 pixels.
6.2. Implementation Details
Here, we give more information regarding the method parameters. The parameter setting of the proposed (1) image fusion methods in the middle architecture and (2) CNN-based detector in all architectures are as follows:
Image fusion methods: we selected all parameters of the image fusion methods based on the existing works which are described in Section 4. VGG-ML fuses the detailes parts by using VGG-19 [37] with four relu layers. The weight values for pixel in two base part images and in VGG-ML. DenseFuse is pre-trained on MS-COCO [43] and utilizes two methodologies for fusion: addition and l1-norm. DenseFuse achieves the minimum pixel and structural similarity losses when is 100. For ResNet-ZCA, we used ResNet50 with l1-norm. ResNet50 is pre-trained by ImageNet [44]. In VSM-WLS, the initial spatial weight, , is 2. The number of decomposition levels N is 4 and . CBF uses the neighborhood kernel with size, as it can achieve good enough fusion results [42]. The value of and are 1.8 and 25, respectively. Moreover, the parameter is fixed at 0.01 in ConvSR. In the GFF experiment, the parameters of the guided filter are set as , , and . All of the image fusion methods require the grayscale images transformed from the input RGB images except DenseFuse and VSM-WLS.
CNN-based detectors: we use Faster R-CNN as a detector in all proposed architectures. The CNN parameter are chosen based on several experimental results. Faster R-CNN is trained for 900 k iterations with a learning rate of 0.0003 and then 1200 k iterarions with a learning rate of 0.000003. We use 4 sub-octave scales (0.25, 0.5, 1.0, 2.0) and three aspect ratios [0.5, 1.0, 2.0] mainly motivated by handling small objects on this dataset.
Since Microsoft COCO dataset [43] consists of 3146 images of marine vessels, the Faster R-CNN is pre-trained on it to learn more good feature representation. Subsequently, the model is fine-tuned on our data. We utilize different source videos to train and test architectures. These fixed parameter setting can obtain good results for our experiments done in this work.
7. Experimental Results
In this work, three multi-modal architectures were considered for vessel detection: early fusion, middle fusion, and late fusion. In addition, two uni-modal architectures are proposed, which utilized RGB or IR camera images. We have done three experiments: (1) evaluation of seven image fusion methods in the middle fusion architecture, (2) evaluation of all fusion architectures, and (3) a visual comparison between all architectures in each scenario.
7.1. Comparison of Image Fusion Methods
In the propose middle fusion architecture, an image fusion method is first employed to combine source RGB and IR images and produce a fused image (see Section 4.1, Section 4.2, Section 4.3, Section 4.4, Section 4.5, Section 4.6 and
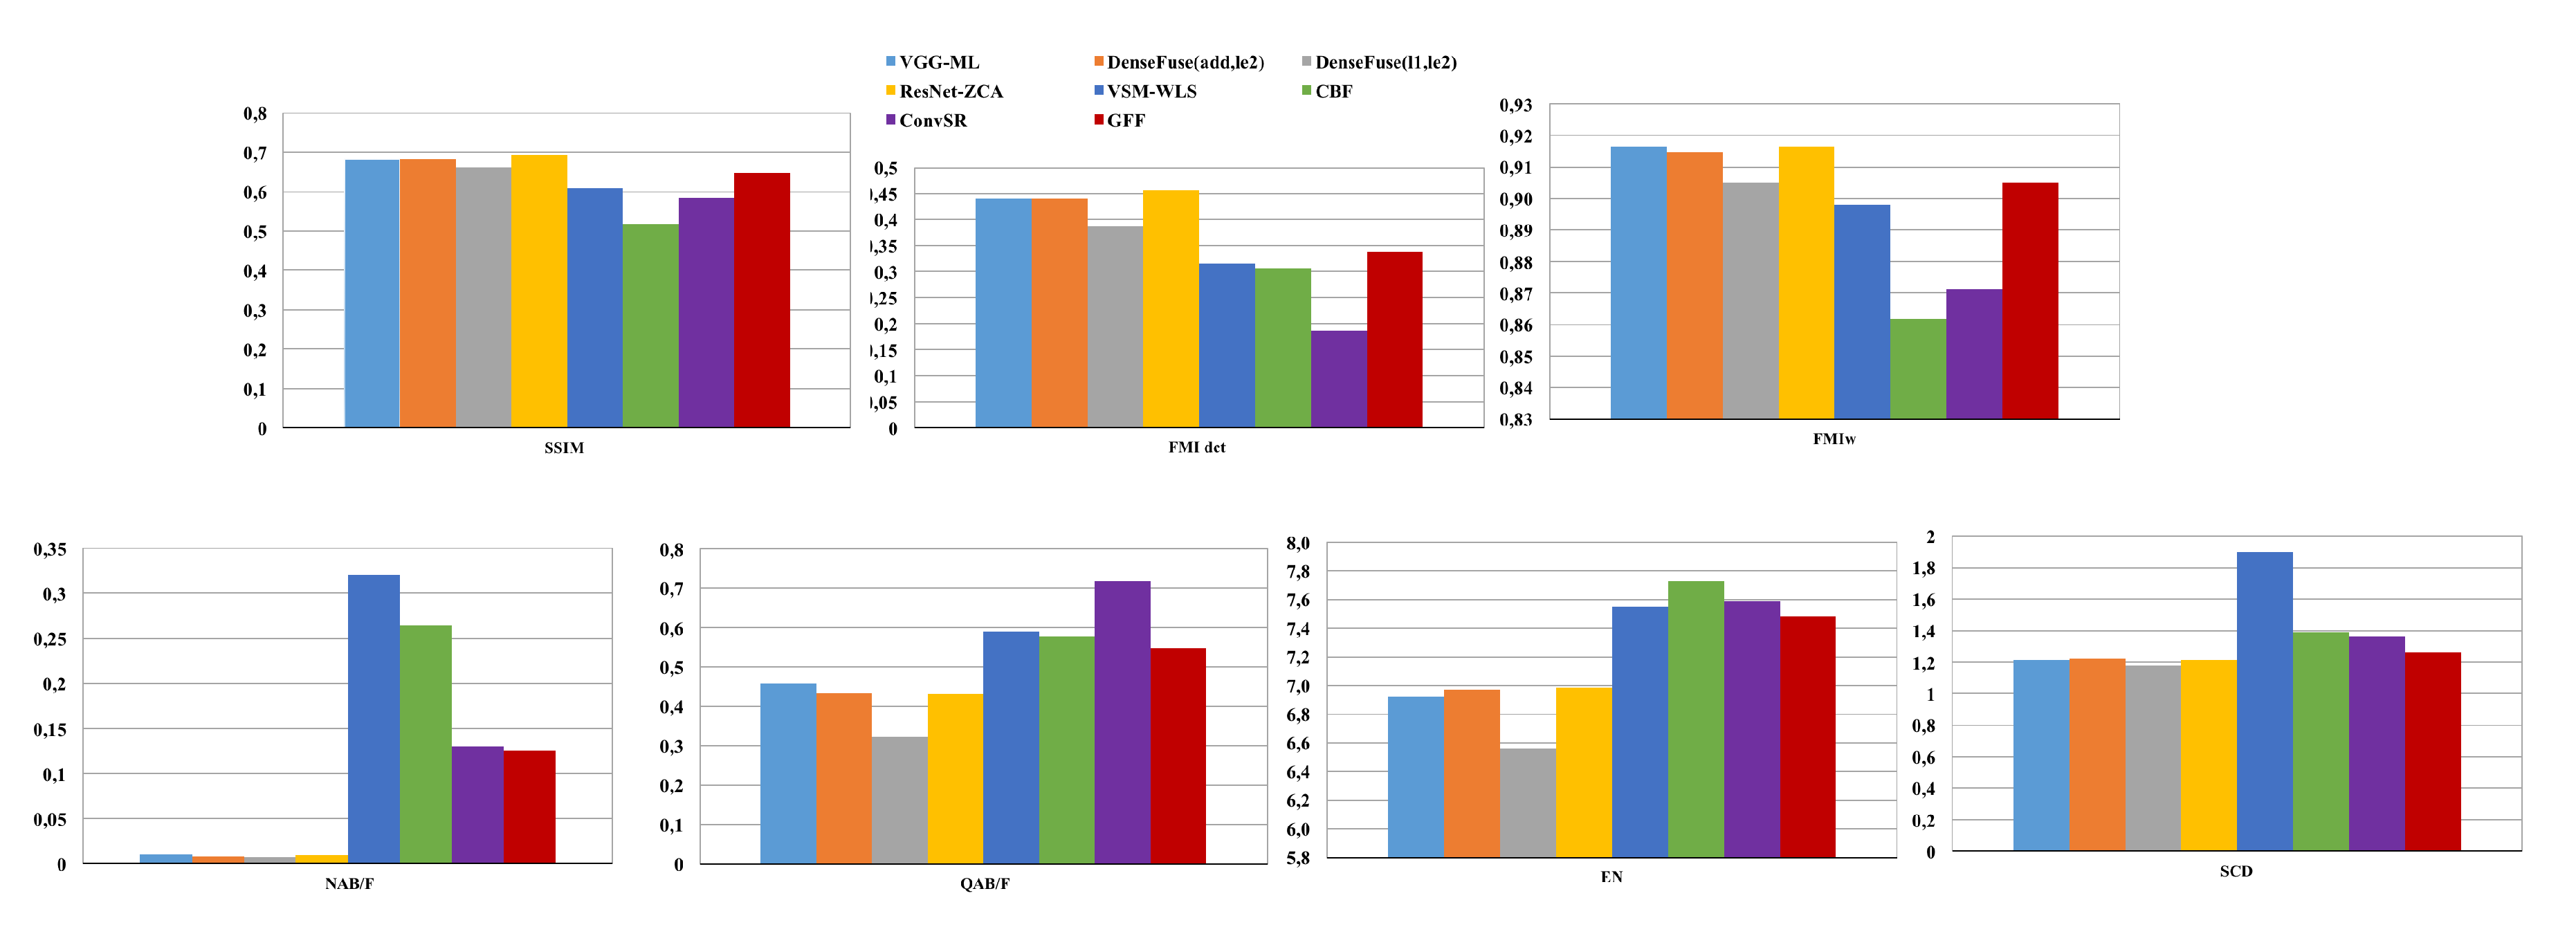
Section 4.7). Subsequently, a CNN is applied on the obtained fused image for detection. Therefore, the image fusion method provides an essential functionality in our proposed middle fusion architecture. For this reason, we first evaluated the performance of three DL-based image fusion methods and four traditional methods. The details of our experiment are introduced in Section 6.2. These methods are compared with six common assessment metrics to conduct qualitative and quantitative experiments. These metrics include:
- Structural SIMilarity () [45] is an objective image quality metric to obtain contrast, structure, and illuminates between the source image and fused image.
- Feature Mutual Information () [46] is a quality metric for calculating the mutual information between source and fused images. Here, wavelet () and discrete cosine () features are used for measuring the amount of information conducted from source images to fused image.
- measures the amount of information presented in the fused image on the basis of information theory [47]. The better fusion results have minimum entropy value.
- Quality () [48] metric represents the visual information that is associated with the edge information. It computes the amount of edge preservation from input images (A and B) to the fused image (F) using edge strength and orientation.
- Noise () is a fusion artifacts metric introduced by [49] which calculates the amount of added noise or artifacts in the fused image (F) from two input images (A and B).
- Sum of the Correlations of Differences () metric [50] measures the complementary information transferred from the input images to the fused image.
Figure 6 and Figure 7 demonstrate the average values of performance metrics for whole test dataset in two scenarios. In Scenario1 (Figure 6), the results show that DL-based fusion methods perform better than traditional methods with the larger values of , , and . The reason is these methods (VGG-ML, DenseFuse, and ResNet-ZCA) can extract more structural and rich features that are based on their DL architectures. Between these DL-based methods, ResNet-ZCA has the highest value of , , and . However, DenseFuse provide more natural results and contain less artificial noise as it has the minimum values of , , and . Between traditional methods, GFF can achieve more complementary information in the fused image, since it has the maximum value of , , and .
Figure 7 shows the average values of six quality metrics for Scenario2. We can observe that DL-based method is roughly more natural and less noise than other traditional methods. Furthermore, the results represent DenseFuse can generate the fused image with less artificial information and noise as the value of is low. However, ResNet-ZCA provide more structural information and features, as it has the highest value of , , and . GFF performs betters than other traditional image fusion methods in terms of , , and . This is because GFF can effectively keep the contrast in the fused image.
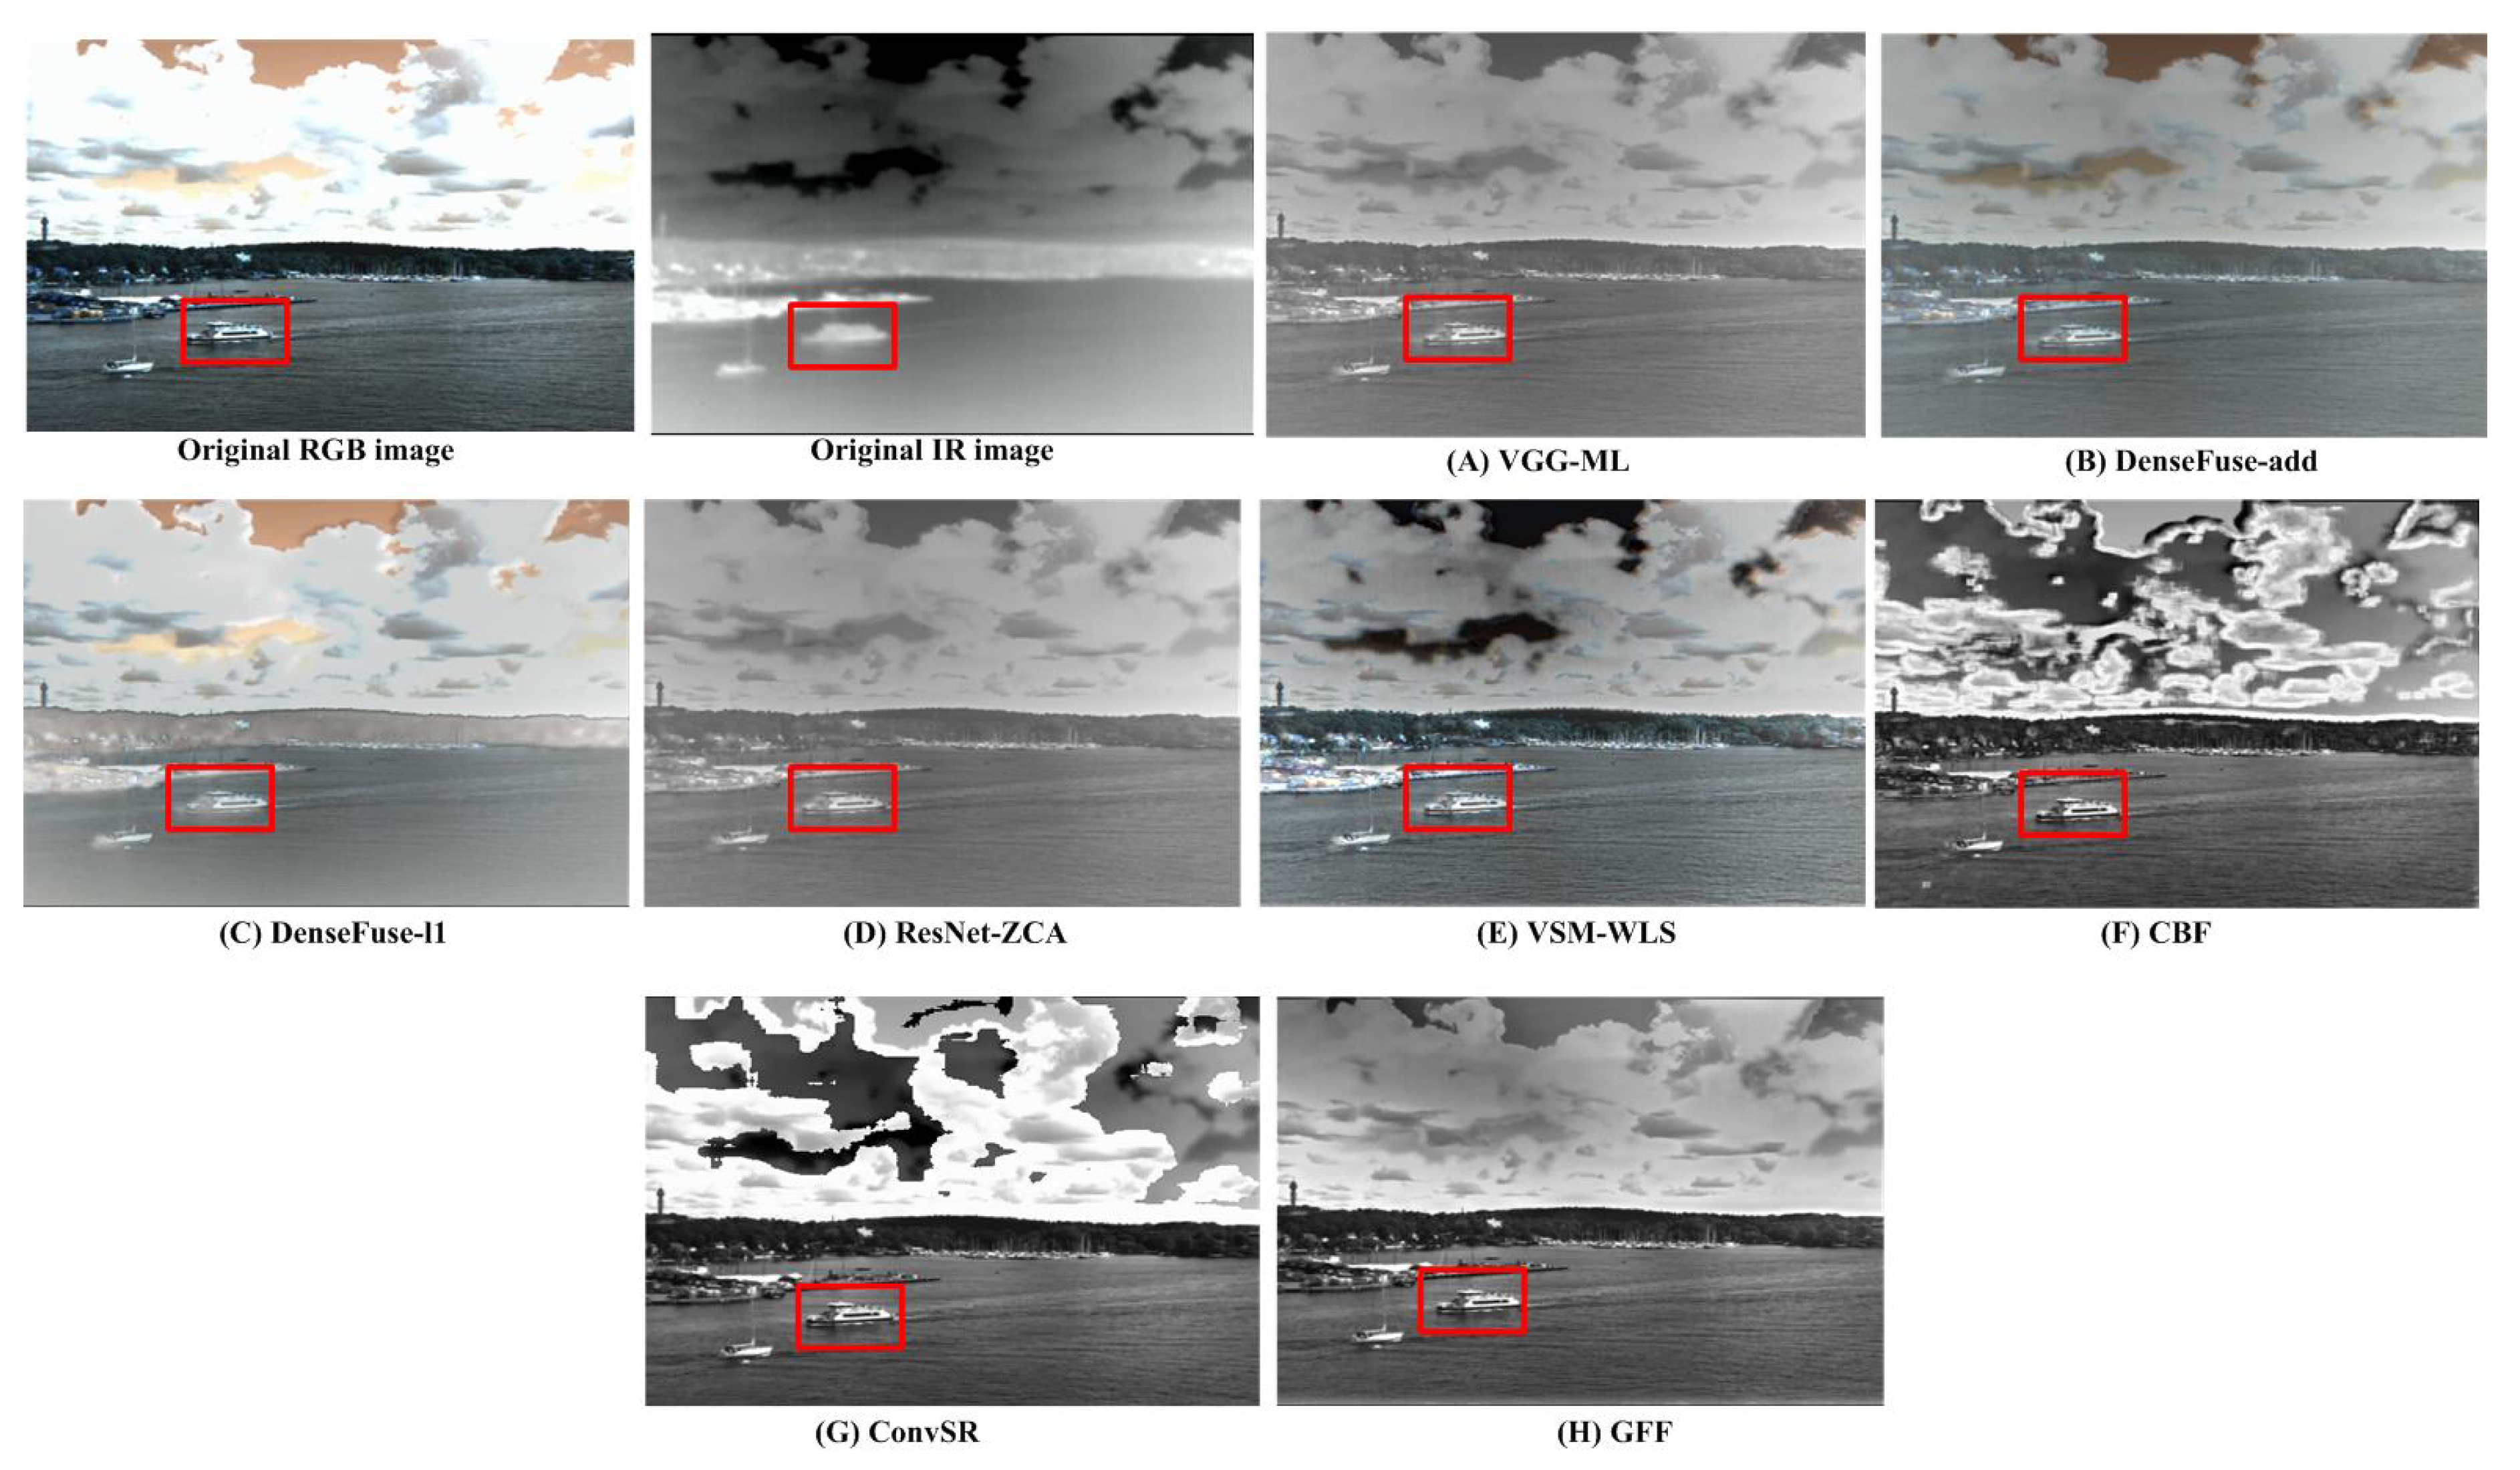
Moreover, we performed a visual comparison between all image fusion methods for an example test image in each scenario. In the scenario1, the obtained fused image by DL-based method contains more frequency details and edge preservation (Figure 8A–D). The fused image that is generated by VSM-WLS, CBF, ConvSR, and GFF includes more artificial noise and their saliency features are not clear. CBF and ConvSR produce the fused images with more artifacts as well. On the contrary, the fused images obtained by VGG-Ml, DenseFuse, ResNet-ZCA and VSM-WLS look more natural and less noise. Generally, the obtained results of these DL-based methods are roughly more clear than other traditional methods in Scenario1.
Figure 9 shows the fused image obtained by DL and traditional image fusion methods in the Scenario2. From the Figure 9A–E, it is observed that VGG-Ml, DenseFuse, ResNet-ZCA, and VSM-WLS provide a more pleasing image with clear texture details. From the red box (part of a land), it is observed the fused image by VGG-Ml contains less noise, and details are more clearer than other image fusion methods. In contrast, CBF, ConvSR, and GFF (Figure 9F–H) produce results with more noise, color distortion and contrast loss.
Processing Time:Table 2 shows the running time (second) of all image fusion methods for one image. The tested system specification is: Intel(R) Core(TM) i7-4702MQ CPU @ 2.20 GHz × 8 CPU with 15.4 GB RAM. The running time for obtaining the fused image by ResNet-ZCA is 4.9 s per image. ResNet-ZCA has the minimum time between DL-based methods. In addition, GFF can generate a fused image in 0.4 s that is lower than ResNet-ZCA.
7.2. Multi-Modal Architectures vs. Vni-Modal Architectures
We compared the fusion architectures for the test dataset in terms of Average Precision (AP) as a main detection accuracy metrics. For this purpose, we measured the IoU of detected bounding boxes and matching those from ground truth annotations. A detected bounding box result is counted as a true positive if the IoU with a ground truth one exceeds 50%. Unmatched detected bounding boxes are counted as false positives and unmatched ground truth ones are counted as false negatives.
Table 3 shows that AP for the proposed architectures in each scenario. The best results are highlighted in bold. This results show the effect of the fusion on the object detection performance, as we compared uni-modal and multi-modal architectures. It is observed from the result, the multi-modal middle architecture generates reliable detection results (bold font in Table 3) for both scenarios (scenario1: 79.1% and scenario2: 61.6%), as it can provide complementary information when compared with the uni-modal architectures. However, the performance can be improved when the dataset contains more bigger targets. Our dataset consists of large amount of small targets which occupying areas lower than 16 by 16 pixels. Detecting very small objects with a few pixels is still challenging because of less information being associated with them.
In addition, the results show that uni-modal RGB-based architecture can provide higher accuracy in comparison with uni-modal IR-based architecture. For instance, the accuracy of uni-modal RGB-based architecture is 9.0% and 9.7% more than the uni-modal IR-based architecture for scenario1 and 2, respectively. This is because it can learn richer features from color images than infrared images. Moreover, the results show that DenseFuse totally have higher accuracy in comparison with other middle-fusion architectures.
7.3. Qualitative Results
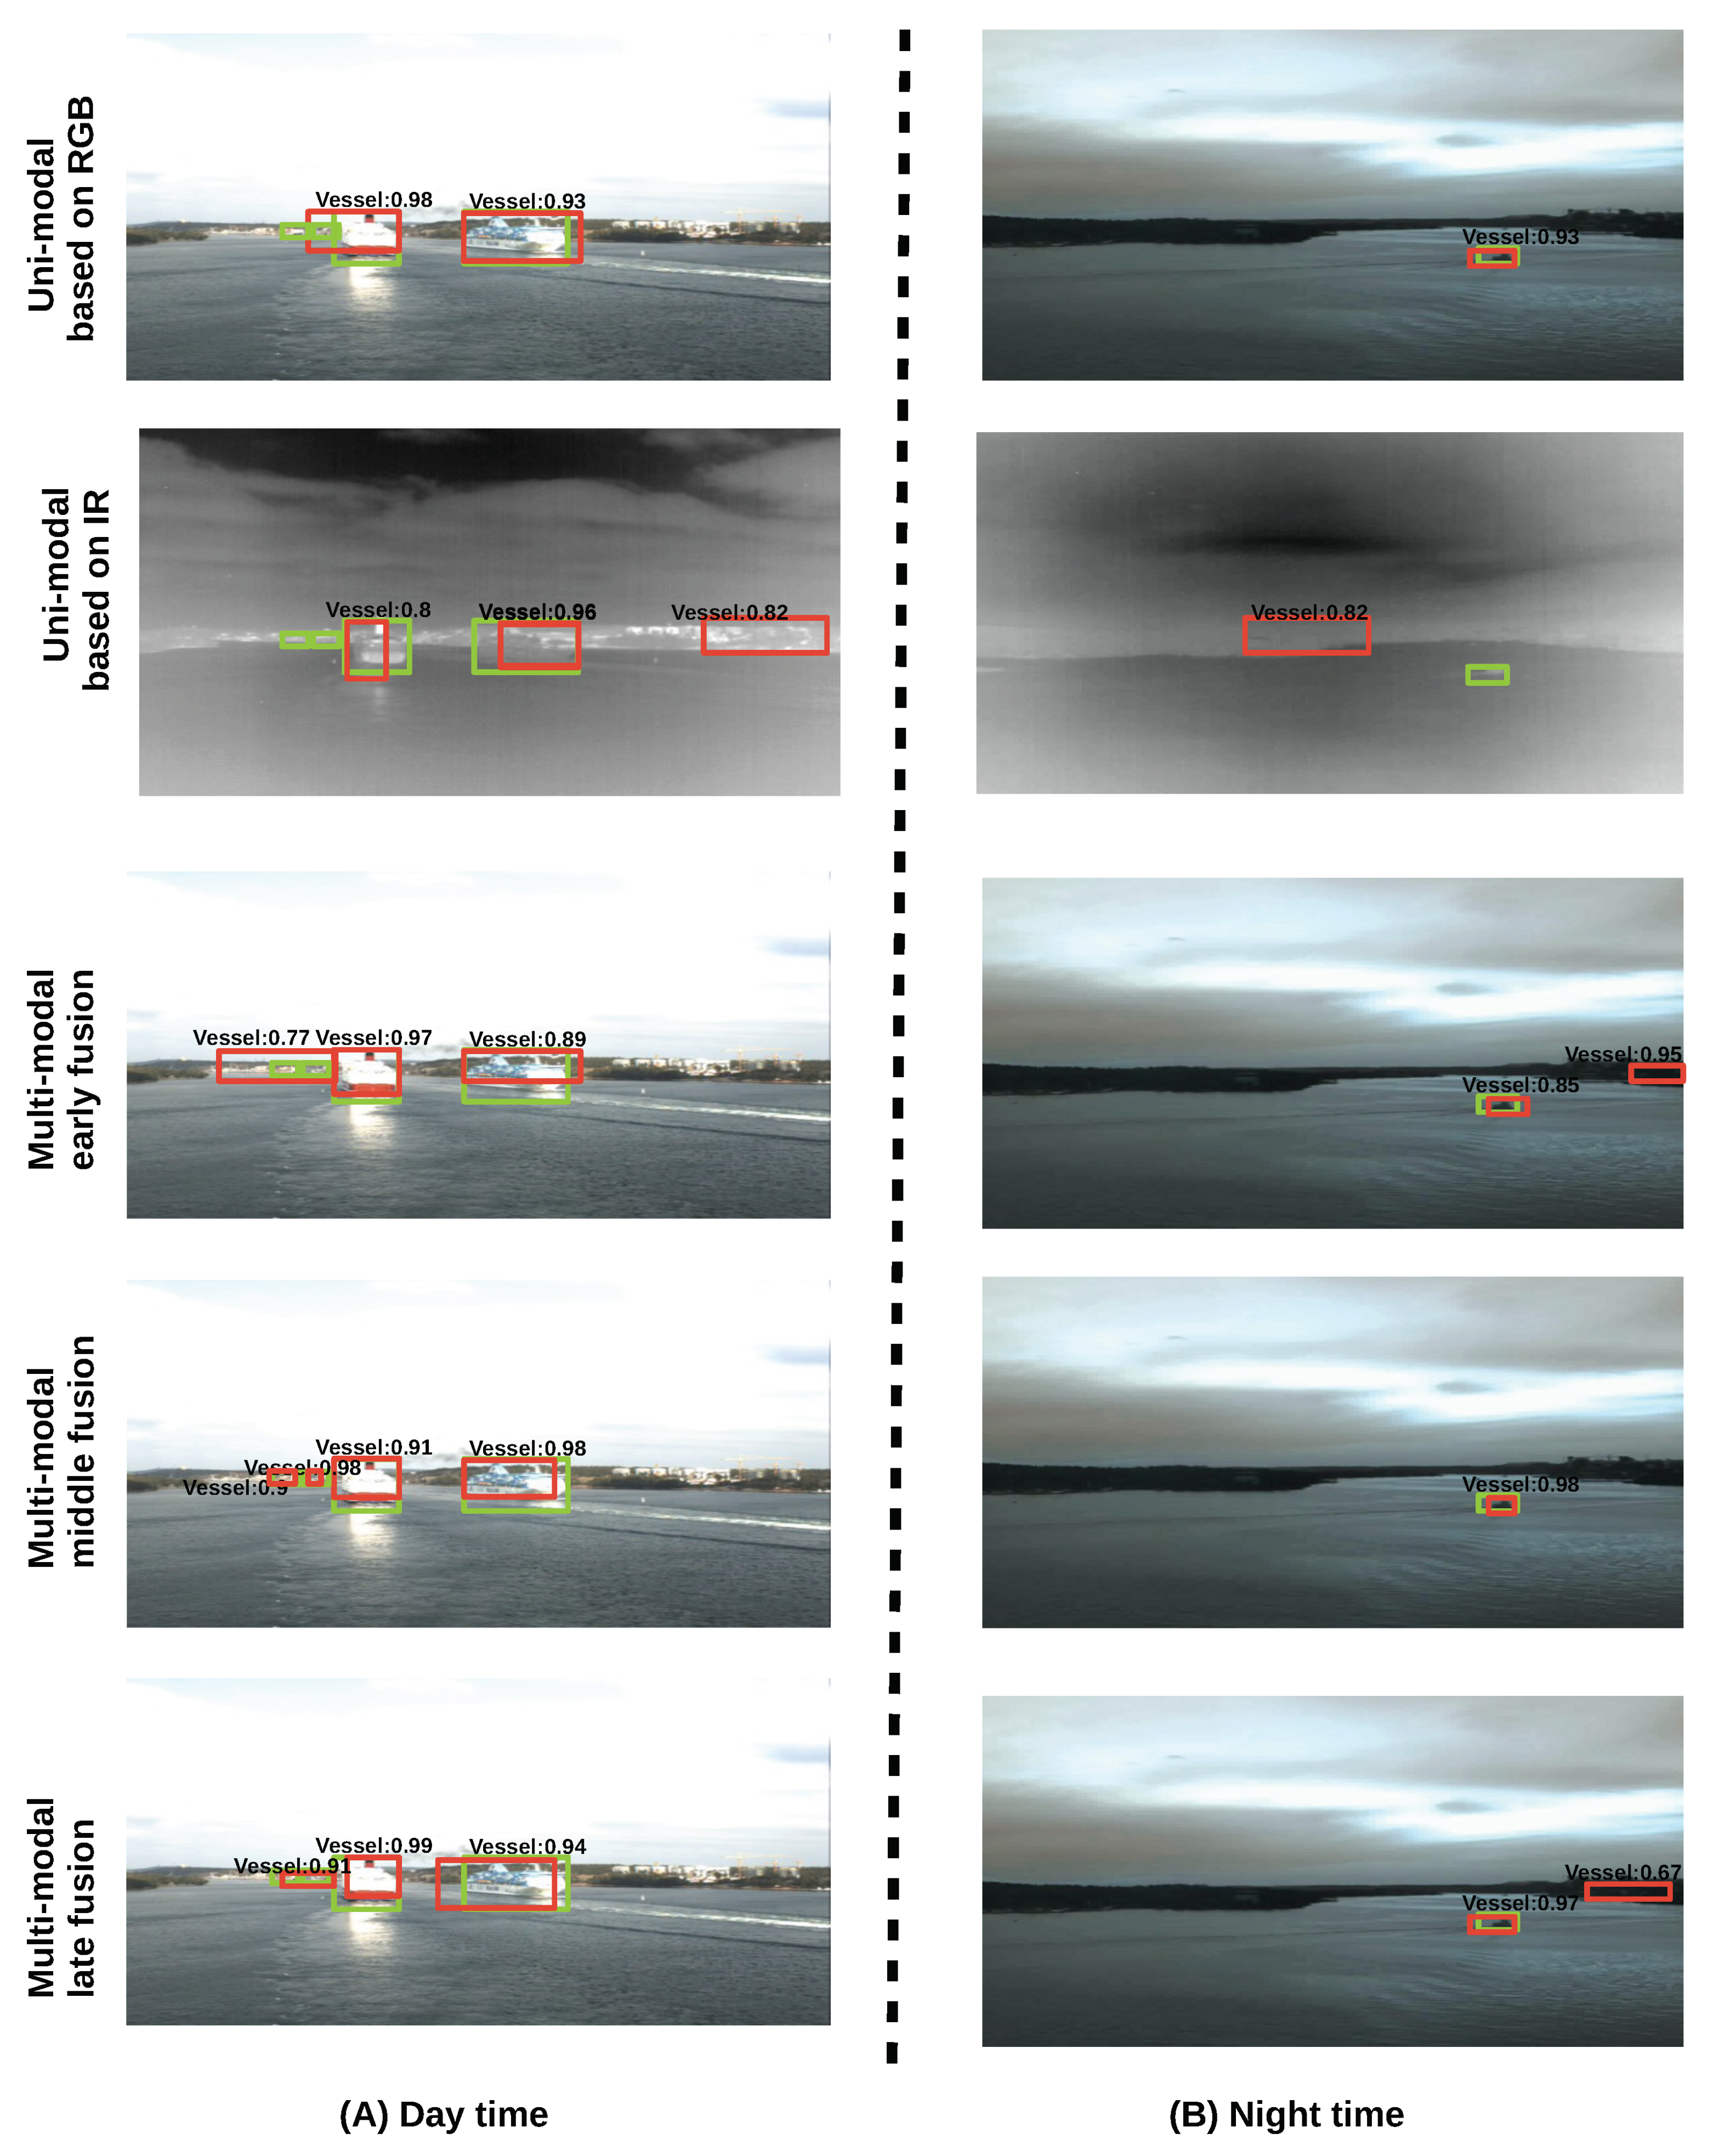
Figure 10 demonstrates an examples of the detection results from the visible-only architecture, infrared-only architecture and multi-modal architectures in each scenario (day-time and night-time). We observe that the proposed fusion architectures is better at the detection of objects than the uni-modal architectures. Note that, because the fusion architectures can integrate information from both color and infrared images. The fusion architectures successfully detected the size/location of the bounding boxes. In the third row, our middle- fusion architecture has detected marine vessels that other architectures have missed. Moreover, the middle-fusion architecture is able to detect small objects with a few pixels as shown in Figure 10 and many of them are detected by our framework. It shows the generalisation capability of the proposed middle-fusion architecture and indicates its potentials in executing two-dimensional (2D) object detection in real situations beyond a pre-designed dataset.
8. Conclusions
In this paper, we proposed three image fusion architectures for vessel detection in marine environments. The architectures can combine the thermal radiation information on infrared images and the texture detail information on visible images. They also utilized a simple fast CNN, Faster R-CNN, in order to carry out the final detection task. The evaluation on our real marine dataset show that the proposed middle-fusion architecture is able to detect the vessel at the state of the art accuracy.
For future work, we plan to improve the detection network of these architectures in order to address the detection problem of very small objects (less than 16 by 16 pixels) in our data. We will investigate the effect of using transfer learning and domain-specific data on the detection performance. We also plan to extend our fusion framework by considering other common sensors in autonomous vessels, such as LiDAR and radar, besides IR and RGB cameras.
Author Contributions
F.F. conceived and designed the methodology; performed the experiments; analyzed the data; wrote the paper. J.H. supervised the study and reviewed this paper. All authors have read and agreed to the published version of the manuscript.
Funding
This work is funded by the Tekes (Finnish Funding Agency for Technology and Innovation) as a part of autonomous Ships and Machines project at Turku university.
Acknowledgments
Computational resources were provided by CSC-IT Center for Science Ltd., Espoo, Finland.
Conflicts of Interest
The authors declare no conflict of interest.
References
- Haghbayan, M.; Farahnakian, F.; Poikonen, J.; Laurinen, M.; Nevalainen, P.; Plosila, J.; Heikkonen, J. An Efficient Multi-sensor Fusion Approach for Object Detection in Maritime Environments. In Proceedings of the 2018 21st International Conference on Intelligent Transportation Systems (ITSC), Maui, HI, USA, 4–7 November 2018; pp. 2163–2170. [Google Scholar] [CrossRef]
- Farahnakian, F.; Movahedi, P.; Poikonen, J.; Lehtonen, E.; Makris, D.; Heikkonen, J. Comparative Analysis of Image Fusion Methods in Marine Environment. In Proceedings of the 2019 IEEE International Symposium on Robotic and Sensors Environments (ROSE), Ottawa, ON, Canada, 17–18 June 2019; pp. 1–8. [Google Scholar] [CrossRef]
- Ma, J.; Ma, Y.; Li, C. Infrared and visible image fusion methods and applications: A survey. Inf. Fusion 2019, 45, 153–178. [Google Scholar] [CrossRef]
- Lin, T.; Goyal, P.; Girshick, R.; He, K.; Dollár, P. Focal Loss for Dense Object Detection. In Proceedings of the IEEE International Conference on Computer Vision (ICCV), Venice, Italy, 22–29 October 2017; pp. 2999–3007. [Google Scholar]
- Girshick, R.; Donahue, J.; Darrell, T.; Malik, J. Rich Feature Hierarchies for Accurate Object Detection and Semantic Segmentation. In Proceedings of the 2014 IEEE Conference on Computer Vision and Pattern Recognition (CVPR ’14), Washington, DC, USA, 24–27 June 2014; pp. 580–587. [Google Scholar] [CrossRef] [Green Version]
- Sermanet, P.; Eigen, D.; Zhang, X.; Mathieu, M.; Fergus, R.; LeCun, Y. OverFeat: Integrated Recognition, Localization and Detection using Convolutional Networks. arXiv 2013, arXiv:1312.6229. [Google Scholar]
- He, K.; Gkioxari, G.; Dollár, P.; Girshick, R.B. Mask R-CNN. arXiv 2017, arXiv:1703.06870. [Google Scholar]
- Li, H.; Wu, X. DenseFuse: A Fusion Approach to Infrared and Visible Images. arXiv 2018, arXiv:1804.08361. [Google Scholar] [CrossRef] [PubMed] [Green Version]
- Hongbo, G.; Cheng, B.; Wang, J.; Li, K.; Zhao, J.; Li, D. Object Classification using CNN-Based Fusion of Vision and LIDAR in Autonomous Vehicle Environment. IEEE Trans. Ind. Inform. 2018. [Google Scholar] [CrossRef]
- Li, H.; Wu, X.; Kittler, J. Infrared and Visible Image Fusion using a Deep Learning Framework. arXiv 2018, arXiv:1804.06992. [Google Scholar]
- Schlosser, J.; Chow, C.K.; Kira, Z. Fusing LIDAR and images for pedestrian detection using convolutional neural networks. In Proceedings of the 2016 IEEE International Conference on Robotics and Automation (ICRA), Stockholm, Sweden, 16–21 May 2016; pp. 2198–2205. [Google Scholar] [CrossRef]
- Bar-Shalom, Y.; Li, X. Multitarget-Multisensor Tracking: Principles and Techniques; Yaakov Bar-Shalom. 1995. Available online: https://0-ieeexplore-ieee-org.brum.beds.ac.uk/stamp/stamp.jsp?arnumber=484305 (accessed on 2 August 2020).
- Santos, C.E.; Bhanu, B. Dyfusion: Dynamic IR/RGB Fusion for Maritime Vessel Recognition. In Proceedings of the 2018 IEEE International Conference on Image Processing (ICIP 2018), Athens, Greece, 7–10 October 2018; pp. 1328–1332. [Google Scholar] [CrossRef]
- Xu, D.; Anguelov, D.; Jain, A. PointFusion: Deep Sensor Fusion for 3D Bounding Box Estimation. arXiv 2018, arXiv:1711.10871. [Google Scholar]
- Bengio, Y. Learning Deep Architectures for AI. Found. Trends Mach. Learn. 2009, 2, 1–127. [Google Scholar] [CrossRef]
- Girshick, R.B.; Donahue, J.; Darrell, T.; Malik, J. Rich feature hierarchies for accurate object detection and semantic segmentation. arXiv 2014, arXiv:1311.2524. [Google Scholar]
- Girshick, R. Fast r-cnn. In Proceedings of the IEEE International Conference on Computer Vision (ICCV), Santiago, Chile, 13–16 December 2015; pp. 1440–1448. [Google Scholar]
- Ren, S.; He, K.; Girshick, R.; Sun, J. Faster R-CNN: Towards Real-Time Object Detection with Region Proposal Networks. IEEE Trans. Pattern Anal. Mach. Intell. 2017, 39, 1137–1149. [Google Scholar] [CrossRef] [Green Version]
- Dai, J.; Li, Y.; He, K.; Sun, J. R-fcn: Object detection via region-based fully convolutional networks. In Proceedings of the Advances in Neural Information Processing Systems (NIPS), Barcelona, Spain, 5–10 December 2016; pp. 379–387. [Google Scholar]
- Liu, W.; Anguelov, D.; Erhan, D.; Szegedy, C.; Reed, S.; Fu, C.Y.; Berg, A. Ssd: Single shot multibox detector. In European Conference on Computer Vision; Springer: Berlin/Heidelberg, Germany, 2016; pp. 21–37. [Google Scholar]
- Redmon, J.; Divvala, S.; Girshick, R.; Farhadi, A. You only look once: Unified, real-time object detection. In Proceedings of the IEEE Conference on Computer Vision and Pattern Recognition (CVPR), Las Vegas, NV, USA, 26 June–1 July 2016; pp. 779–788. [Google Scholar]
- Kanjir, U.; Greidanus, H.; Oštir, K. Vessel detection and classification from spaceborne optical images: A literature survey. Remote Sens. Environ. 2018, 207, 1–26. [Google Scholar] [CrossRef] [PubMed]
- Arshad, N.; Moon, K.S.; Kim, J.N. Multiple ship detection and tracking using background registration and morphological operations. In Signal Processing and Multimedia; Springer: Berlin/Heidelberg, Germany, 2010; pp. 121–126. [Google Scholar]
- Wijnhoven, R.; van Rens, K.; Jaspers, E.; de With, P.H.N. Online learning for ship detection in maritime surveillance. In Proceedings of the 31th Symposium on Information Theory in the Benelux, Rotterdam, The Netherlands, 1–12 May 2010; pp. 73–80. [Google Scholar]
- Lee, S.J.; Roh, M.I.; Lee, H.W.; Ha, J.S.; Woo, I.G. Image-Based Ship Detection and Classification for Unmanned Surface Vehicle Using Real-Time Object Detection Neural Networks. In Proceedings of the 28th International Ocean and Polar Engineering Conference; International Society of Offshore and Polar Engineers, Sapporo, Japan, 10–15 June 2018. [Google Scholar]
- Kang, M.; Ji, K.; Leng, X.; Lin, Z. Contextual Region-Based Convolutional Neural Network with Multilayer Fusion for SAR Ship Detection. Remote Sens. 2017, 9, 860. [Google Scholar] [CrossRef] [Green Version]
- Farahnakian, F.; Haghbayan, M.; Poikonen, J.; Laurinen, M.; Nevalainen, P.; Heikkonen, J. Object Detection Based on Multi-sensor Proposal Fusion in Maritime Environment. In Proceedings of the 17th IEEE International Conference on Machine Learning and Applications (ICMLA), Orlando, FL, USA, 17–20 December 2018; pp. 971–976. [Google Scholar] [CrossRef]
- Jokioinen, S.; Poikonen, J.; Hyvönen, M.; Kolu, A.; Jokela, T.; Tissari, J.; Paasio, A.; Ringbom, H.; Collin, F.; Viljanen, M.; et al. Remote and Autonomous Ships—The Next Steps; AAWA Position Paper; Rolls Royce plc: London, UK, 2016. [Google Scholar]
- Shao, Z.; Wu, W.; Wang, Z.; Du, W.; Li, C. SeaShips: A large-scale precisely annotated dataset for ship detection. IEEE Trans. Multimed. 2018, 20, 2593–2604. [Google Scholar] [CrossRef]
- Zwemer, M.H.; Wijnhoven, R.G.J.; de With, P.H.N. Ship Detection in Harbour Surveillance based on Large-Scale Data and CNNs. In Proceedings of the VISIGRAPP (5: VISAPP), Funchal, Portugal, 27–29 January 2018; pp. 153–160. [Google Scholar]
- Li, H.; Wu, X. Infrared and Visible Image Fusion with ResNet and zero-phase component analysis. arXiv 2018, arXiv:1806.07119. [Google Scholar] [CrossRef] [Green Version]
- Ma, J.; Zhou, Z.; Wang, B.; Zong, H. Infrared and visible image fusion based on visual saliency map and weighted least square optimization. Infrared Phys. Technol. 2017, 82. [Google Scholar] [CrossRef]
- Zhang, Q.; Fu, Y.; Li, H.; Zou, J. Dictionary learning method for joint sparse representation-based image fusion. Opt. Eng. 2013, 52, 057006. [Google Scholar] [CrossRef]
- Liu, C.; Qi, Y.; Ding, W. Regular article. Infrared Phys. Technol. 2017, 83, 94–102. [Google Scholar] [CrossRef]
- Liu, Y.; Chen, X.; Ward, R.K.; Wang, Z.J. Image Fusion With Convolutional Sparse Representation. IEEE Signal Process. Lett. 2016, 23, 1882–1886. [Google Scholar] [CrossRef]
- Li, S.; Kang, X.; Hu, J. Image Fusion With Guided Filtering. IEEE Trans. Image Process. 2013, 22, 2864–2875. [Google Scholar] [CrossRef]
- Simonyan, K.; Zisserman, A. Very Deep Convolutional Networks for Large-Scale Image Recognition. In Proceedings of the International Conference on Learning Representations, San Diego, CA, USA, 7–9 May 2015. [Google Scholar]
- Huang, G.; Liu, Z.; Van Der Maaten, L.; Weinberger, K.Q. Densely connected convolutional networks. In Proceedings of the 2017 IEEE Conference on Computer Vision and Pattern Recognition (CVPR), Honolulu, HI, USA, 22–25 July 2017; pp. 2261–2269. [Google Scholar]
- He, K.; Zhang, X.; Ren, S.; Sun, J. Deep Residual Learning for Image Recognition. Comput. Vis. Pattern Recognit. 2016, 770–778. [Google Scholar]
- Kessy, A.; Lewin, A.; Strimmer, K. Optimal whitening and decorrelation. arXiv 2015, arXiv:1512.00809. [Google Scholar] [CrossRef]
- Zhang, Q.; Shen, X.; Xu, L.; Jia, J. Rolling Guidance Filter. In Computer Vision—ECCV 2014; Fleet, D., Pajdla, T., Schiele, B., Tuytelaars, T., Eds.; Springer International Publishing: Cham, Switzerland, 2014; pp. 815–830. [Google Scholar]
- Shreyamsha Kumar, B.K. Image fusion based on pixel significance using cross bilateral filter. Signal Image Video Process. 2015, 9, 1193–1204. [Google Scholar] [CrossRef]
- Lin, T.Y.; Maire, M.; Belongie, S.; Hays, J.; Perona, P.; Ramanan, D.; Dollár, P.; Zitnick, C.L. Microsoft COCO: Common Objects in Context. In Computer Vision—ECCV 2014; Fleet, D., Pajdla, T., Schiele, B., Tuytelaars, T., Eds.; Springer International Publishing: Cham, Switzerland, 2014; pp. 740–755. [Google Scholar]
- Deng, J.; Dong, W.; Socher, R.; Li, L.J.; Li, K.; Li, F.-F. ImageNet: A Large-Scale Hierarchical Image Database. In Proceedings of the 2009 IEEE Conference on Computer Vision and Pattern Recognition (CVPR09), Miami, FL, USA, 20–25 June 2009. [Google Scholar]
- Wang, Z.; Bovik, A.C.; Sheikh, H.R.; Simoncelli, E.P. Image Quality Assessment: From Error Visibility to Structural Similarity. IEEE Trans. Image Process. 2004, 13, 600–612. [Google Scholar] [CrossRef] [PubMed] [Green Version]
- Haghighat, M.; Razian, M.A. Fast-FMI: Non-reference image fusion metric. In Proceedings of the 2014 IEEE 8th International Conference on Application of Information and Communication Technologies (AICT), Kazakhstan, Astana, 15–17 October 2014; pp. 1–3. [Google Scholar] [CrossRef]
- Roberts, J.W.; van Aardt, J.A.; Ahmed, F.B. Assessment of image fusion procedures using entropy, image quality, and multispectral classification. J. Appl. Remote Sens. 2008, 2, 023522. [Google Scholar] [CrossRef]
- Xydeas, C.S.; Petrovic, V. Objective image fusion performance measure. Electron. Lett. 2000, 36, 308–309. [Google Scholar] [CrossRef] [Green Version]
- Shreyamsha Kumar, B.K. Multifocus and multispectral image fusion based on pixel significance using discrete cosine harmonic wavelet transform. Signal Image Video Process. 2012, 7, 1125–1143. [Google Scholar] [CrossRef]
- Aslantas, V.; Bendes, E. A new image quality metric for image fusion: The sum of the correlations of differences. AEU Int. J. Electron. Commun. 2015, 69, 1890–1896. [Google Scholar] [CrossRef]
Figure 1.
An overview of the proposed early fusion architecture. (A) The 3-channel RGB input image and 1-channel IR image are concatenated. (B) Subsequently, the produced four-channel input data is processed by a detector in order to robustly detect vessels. (C) The output image consists of the predicted BBs and corresponding scores and labels.

Figure 2.
An overview of the proposed middle fusion architecture. The original input images (A,B) are fused using by an image fusion method in order to provide complementary information for object detection. (C) The image fusion method can be one of the mentioned method in Section 4.1, Section 4.2, Section 4.3, Section 4.4, Section 4.5, Section 4.6 and Section 4.7. (D) Subsequently, the fused image is processed by a detector in order to detect and localize marine vessels. (E) The output image localizes the detected vessels with the corresponded scores and labels.

Figure 3.
An overview of the proposed late fusion architecture. (A) The input RGB image and (B) IR image are feed into the Detector1 and Detector2, respectively. (C) These detectors independently extract features from the corresponding input image. (D) The architecture concatenates outputs of detectors (,), and then a final set of object proposals is obtained after none-maximum suppression. (E) The final output containing predicted BBs, which are associated with a category label and a confidence score.

Figure 4.
An example of applying NMS in the proposed late fusion architecture: (A) the predicted BBs which their score is lower than 0.6 are removed and then (B) each box between the remaining boxes is assumed as an output box if IoU between ground truth BB and predicted BB is more or equal than 0.5.

Figure 5.
Example of RGB and InfRared (IR) pair images in the real maritime dataset at (a) Scenario1 and (b) Scenario2.
Figure 5.
Example of RGB and InfRared (IR) pair images in the real maritime dataset at (a) Scenario1 and (b) Scenario2.

Figure 6.
The average values of six quality metrics for test images obtained by the deep and traditional methods in Scenario1.
Figure 6.
The average values of six quality metrics for test images obtained by the deep and traditional methods in Scenario1.

Figure 7.
The average values of six quality metrics for test fused images obtained by the deep and traditional methods in Scenario2.
Figure 7.
The average values of six quality metrics for test fused images obtained by the deep and traditional methods in Scenario2.

Figure 8.
Qualitative results of the fused image in Scenario1 by (A) VGG-ML, (B) DenseFuse-add, (C) DenseFuse-l1, (D) ResNet-ZCA, (E) VSM-WLS, (F) CBF, (G) ConvSR, and (H) GFF on the original RGB and IR images.
Figure 8.
Qualitative results of the fused image in Scenario1 by (A) VGG-ML, (B) DenseFuse-add, (C) DenseFuse-l1, (D) ResNet-ZCA, (E) VSM-WLS, (F) CBF, (G) ConvSR, and (H) GFF on the original RGB and IR images.

Figure 9.
Qualitative results of the fused image in Scenario2 by (A) VGG-ML, (B) DenseFuse-add, (C) DenseFuse-l1, (D) ResNet-ZCA, (E) VSM-WLS, (F) CBF, (G) ConvSR, and (H) GFF on the original RGB and IR images.
Figure 9.
Qualitative results of the fused image in Scenario2 by (A) VGG-ML, (B) DenseFuse-add, (C) DenseFuse-l1, (D) ResNet-ZCA, (E) VSM-WLS, (F) CBF, (G) ConvSR, and (H) GFF on the original RGB and IR images.

Figure 10.
Qualitative vessel detection results for (A) Scenario1 and (B) Scenario2 based on uni-modal based on RGB, uni-modal based on IR, multi-modal early fusion, multi-modal middle fusion, and multi-modal late fusion architectures. The ground truth bounding boxes are shown as green rectangles. Predicted boxes by the architectures are depicted as red bounding boxes. Each output box is associated with a category label and a score value in [0, 1].


Table 1.
Number of vessels in our training and testing marine datasets for each Scenario.
| Scenario | Dataset | Number of Vessel |
|---|---|---|
| 1 (daytime) | Training | 46,890 |
| Test | 15,312 | |
| 2 (nightime) | Training | 5000 |
| Test | 3500 |
Table 2.
The running time (seconds) of the deep and traditional image fusion methods for one image.
| VGG-ML | DenseFuse(add,le2) | DenseFuse(l1,le2) | ResNet-ZCA | VSM-WLS | CBF | ConvSR | GFF |
|---|---|---|---|---|---|---|---|
| 10.1 | 12.4 | 13.1 | 4.9 | 6.6 | 38.7 | 175.35 | 0.4 |
Table 3.
Average Precision (AP) (in %) on the test dataset of two scenarios.
| Architecture | Input Images | Fusion | Scenario1 | Scenario2 |
|---|---|---|---|---|
| Uni-modal | RGB | - | 63.8 | 51.5 |
| Uni-modal | IR | - | 54.5 | 41.8 |
| Multi-modal early fusion | RGB + IR | 4 channels | 66.7 | 58.4 |
| Multi-modal middle fusion | RGB + IR | VGG-ML | 75.4 | 55.9 |
| DenseFuse (add,le2) | 77.3 | 57.8 | ||
| DenseFuse (l1,le2) | 79.1 | 61.6 | ||
| ResNet-ZCA | 73.1 | 59.6 | ||
| VSM-WLS | 67.3 | 55.4 | ||
| CBF | 63.9 | 49.8 | ||
| ConvSR | 62.7 | 49.5 | ||
| GFF | 68.4 | 60.7 | ||
| Multi-modal late fusion | RGB + IR | NMS | 60.7 | 57.2 |
© 2020 by the authors. Licensee MDPI, Basel, Switzerland. This article is an open access article distributed under the terms and conditions of the Creative Commons Attribution (CC BY) license (http://creativecommons.org/licenses/by/4.0/).
Share and Cite
MDPI and ACS Style
Farahnakian, F.; Heikkonen, J. Deep Learning Based Multi-Modal Fusion Architectures for Maritime Vessel Detection. Remote Sens. 2020, 12, 2509. https://0-doi-org.brum.beds.ac.uk/10.3390/rs12162509
AMA Style
Farahnakian F, Heikkonen J. Deep Learning Based Multi-Modal Fusion Architectures for Maritime Vessel Detection. Remote Sensing. 2020; 12(16):2509. https://0-doi-org.brum.beds.ac.uk/10.3390/rs12162509
Chicago/Turabian StyleFarahnakian, Fahimeh, and Jukka Heikkonen. 2020. "Deep Learning Based Multi-Modal Fusion Architectures for Maritime Vessel Detection" Remote Sensing 12, no. 16: 2509. https://0-doi-org.brum.beds.ac.uk/10.3390/rs12162509
Note that from the first issue of 2016, this journal uses article numbers instead of page numbers. See further details here.