1. Introduction
There are many active volcanoes in the world and many volcano-related disasters have been reported. In order to reduce these natural disasters, monitoring of volcanic activity is essential. However, it is very difficult to monitor all volcanoes on the ground because of topological, geographical and economic difficulties. However, we can efficiently monitor global volcanic activities using satellite remote sensing techniques because a volcanic activity will cause an increase in surface temperature and satellite (whose sensor can observe the surface temperature) remote sensing can cover a large area on the surface at high frequency with continuity.
Therefore, various approaches (e.g., [
1,
2,
3,
4,
5,
6,
7,
8,
9,
10,
11,
12,
13,
14,
15,
16,
17]) have been suggested to monitor volcanic activities using remote-sensing data collected in the Medium InfraRed (MIR) and Thermal InfraRed (TIR) spectral range, also by the new sensors, such as Advanced Himawari Imager (AHI) onboard HIMAWARI-8 satellite (e.g., [
11]). For example, MODVOLC [
2] and MIROVA [
12] exploit data acquired by MODerate resolution Imaging Spectroradiometer (MODIS) to monitor active volcanoes at the global scale in an operative way, releasing products few hours after the MODIS acquisition. RST
VOLC (Robust Satellite Technique to identify volcanic thermal anomalies) [
13] by analyzing time series of satellite imagery collected by polar sensors like Advanced Very High Resolution Radiometer (AVHRR) and MODIS, as well as the geostationary sensor Spinning Enhanced Visible and InfraRed Imager (SEVIRI), has provided useful information on ongoing thermal activities of many active volcanoes around the world. HOTSAT [
15], HOTVOLC [
16] and AVHotRR [
17], which also exploit the data collected by the MODIS sensor, are other approaches/systems currently used for the volcanoes activity investigations.
On the other hand, medium-high spatial resolution satellite sensors, such as Thematic Mapper (TM), Advanced Spaceborne Thermal Emission and Reflection Radiometer (ASTER), Operational Land Imager (OLI) and Multi-Spectral Instrument (MSI), which provide imagery also in the ShortWave InfraRed (SWIR) spectral range, have been demonstrated good ability to map lava flows (see for example [
18,
19,
20]). To understand eruptive precursors and eruptive dynamics of volcanoes, the integration of multiparametric datasets of satellite and ground data can help better monitor volcanic hazards.
Regarding volcanic activity, considerable damage to human life is often associated with pyroclastic flows. Therefore, it is crucial to detect the possibility of pyroclastic flow in advance and contribute to disaster prevention and mitigation by identifying reliable heat sources of the lava dome and lava flow. Therefore, the satellite remote sensing is the key to accurately detect temperature anomalies (temperature increase) or hotspots associated with volcanic activity and lava eruption. Obstacles to this realization are the spatial and temporal resolution of the satellite’s orbit, the cloud coverage over the targets and contamination by sunlight effects. Nighttime data are often used to detect temperature anomalies to avoid sunlight influences accurately, but nighttime cloud discrimination is generally difficult. Various attempts have been performed for cloud discrimination [
9,
10,
11,
12,
13,
14,
15,
16,
18,
19,
20,
21,
22,
23,
24]. However, most of them are available to daytime data for which visible images can be used for verification, and nighttime data are not universally reported.
It is reported that volcanic eruption activity in Indonesia can be detected using the infrared sensor (MODIS) onboard satellite Aqua [
9]. In their approach, cloud discrimination is an essential factor in monitoring the lava condition accurately. For example, in Indonesia in the tropics, the convection is rather simple, and the generated clouds are uniform (cumulonimbus). As a result, there is no seasonal change, such as the rainy season or the dry season, and it is simple. Using MODIS band 31 (11 µm) and band 32 (12 µm), cloud discrimination is available and established.
On the other hand, in Mt. Asama in Japan, the accuracy of lava activity monitoring is found to be inadequate because their cloud discrimination algorithm is too simple to be applied successfully in Japan. Therefore, the purpose of this study is to remove the cloud accurately and to develop an adequate algorithm continuously to detect thermal anomalies related to volcanic activities, especially lava activity in Japan. In this paper, the cloud discrimination algorithm is improved to investigate the spatiotemporal changes of MODIS data based on the singularity developed by Noguchi et al. [
9]. In their approach, to detect only hotspots related to lava activities without faints, the developed algorithm investigates the difference temperature behavior between a target point and reference points, and we get the spatial difference of brightness temperature (S). The presence of clouds causes a large value of S, and this does not relate to volcanic activities. Therefore, removing clouds is essential. To remove clouds, we use some Brightness Temperature Difference (BTD), which is sensitive to the cloud. Moreover, we verified the technique of cloud removal as compared with LiDAR data.
In this study, we apply the developed lava activity monitoring algorithm to the 2011 Shinmoedake eruptive activity with magma effusion, Japan. Moreover, the accuracy of the improved cloud discrimination algorithm and the effectiveness of lava activity monitoring by spatiotemporal changes of the singularity of brightness temperature are investigated.
2. Shinmoedake Volcano
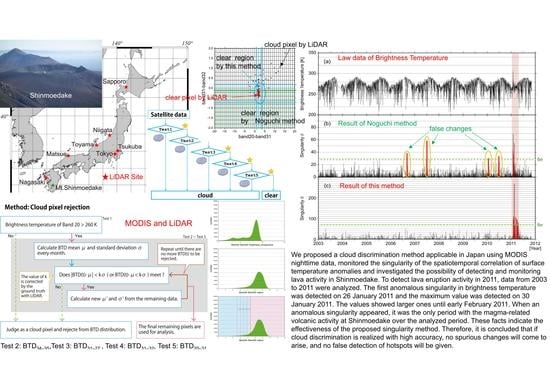
Shinmoedake in the Kirishima volcano group is located at 31.931°N, 130.864°E, the boundary of Kagoshima prefecture and Miyazaki prefecture in Kyushu, Japan (See
Figure 1). It is an active andesitic stratovolcano. The history of Shinmoedake in 1700–2010 can be characterized in the following. It is a major activity in 1716–1717, with phreatic explosions and magma eruptions and phreatic explosions in 1822, 1959, 1991 and 2008 [
25,
26,
27,
28].
After these small phreatic events, the Shinmoedake volcano began a new phase of activity on 19 January 2011. The eruption commenced with a small phreatomagmatic event followed by subplinian events on 26 and 27 January 2011 [
27,
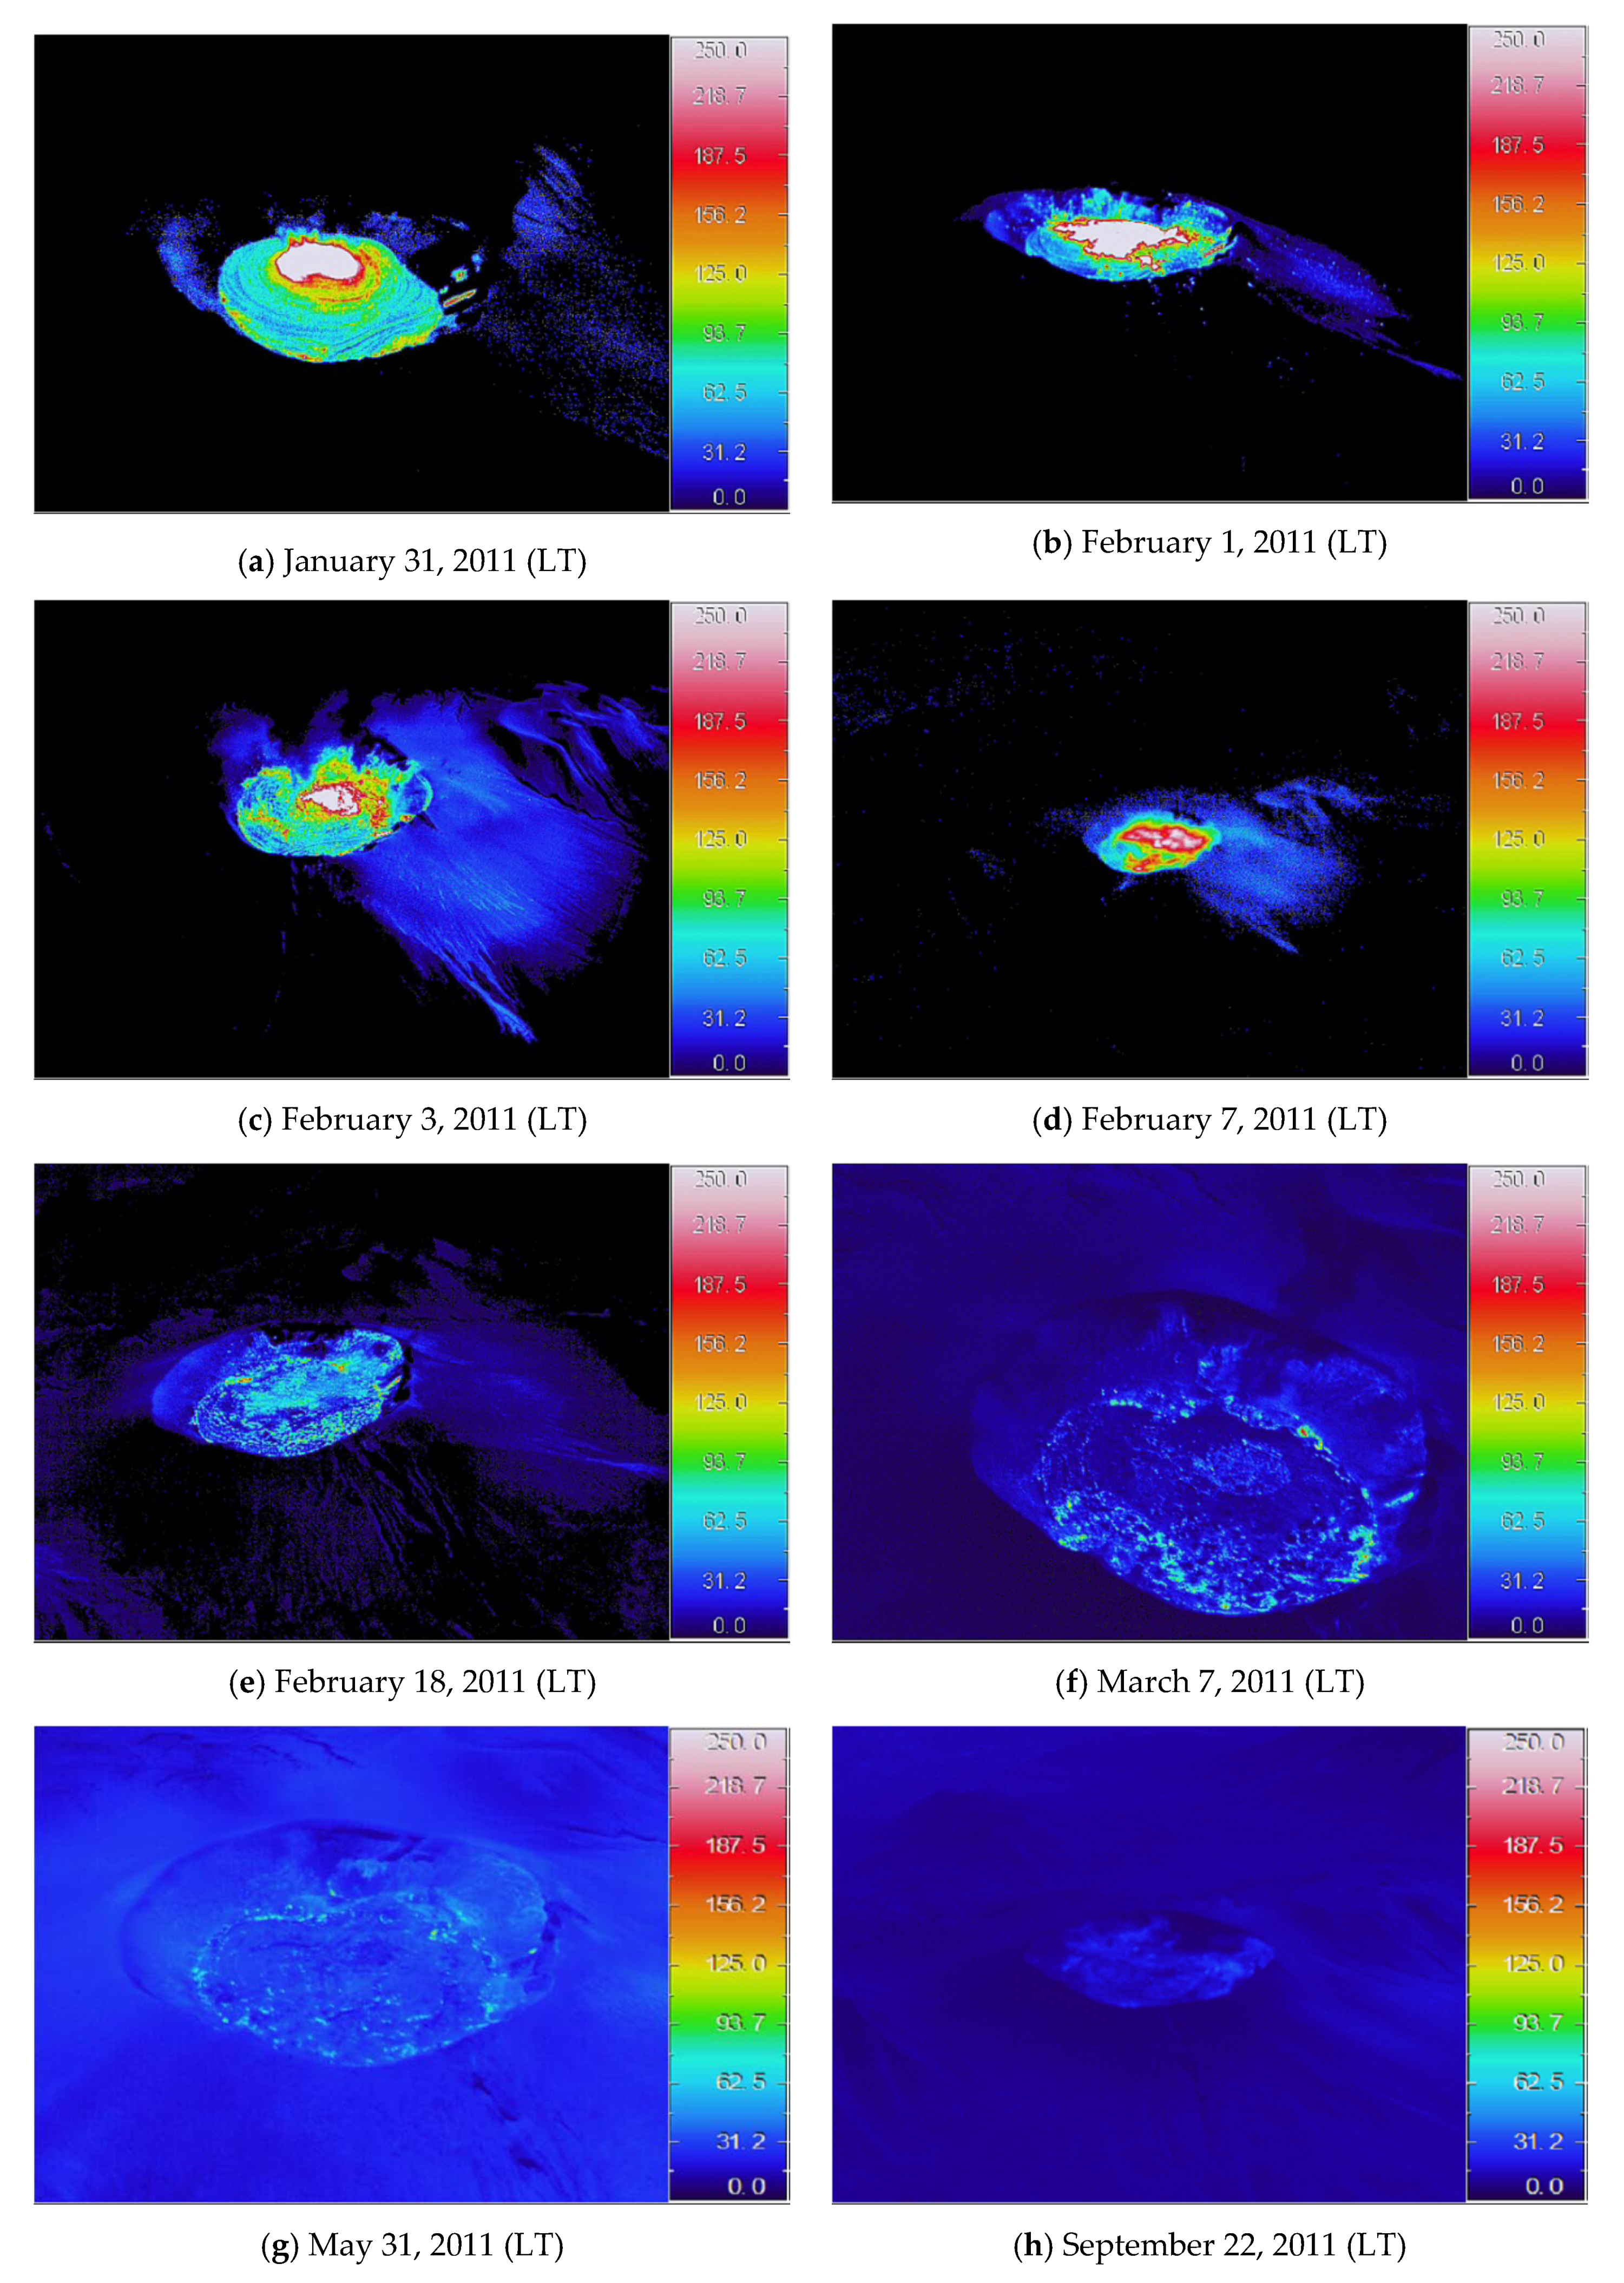
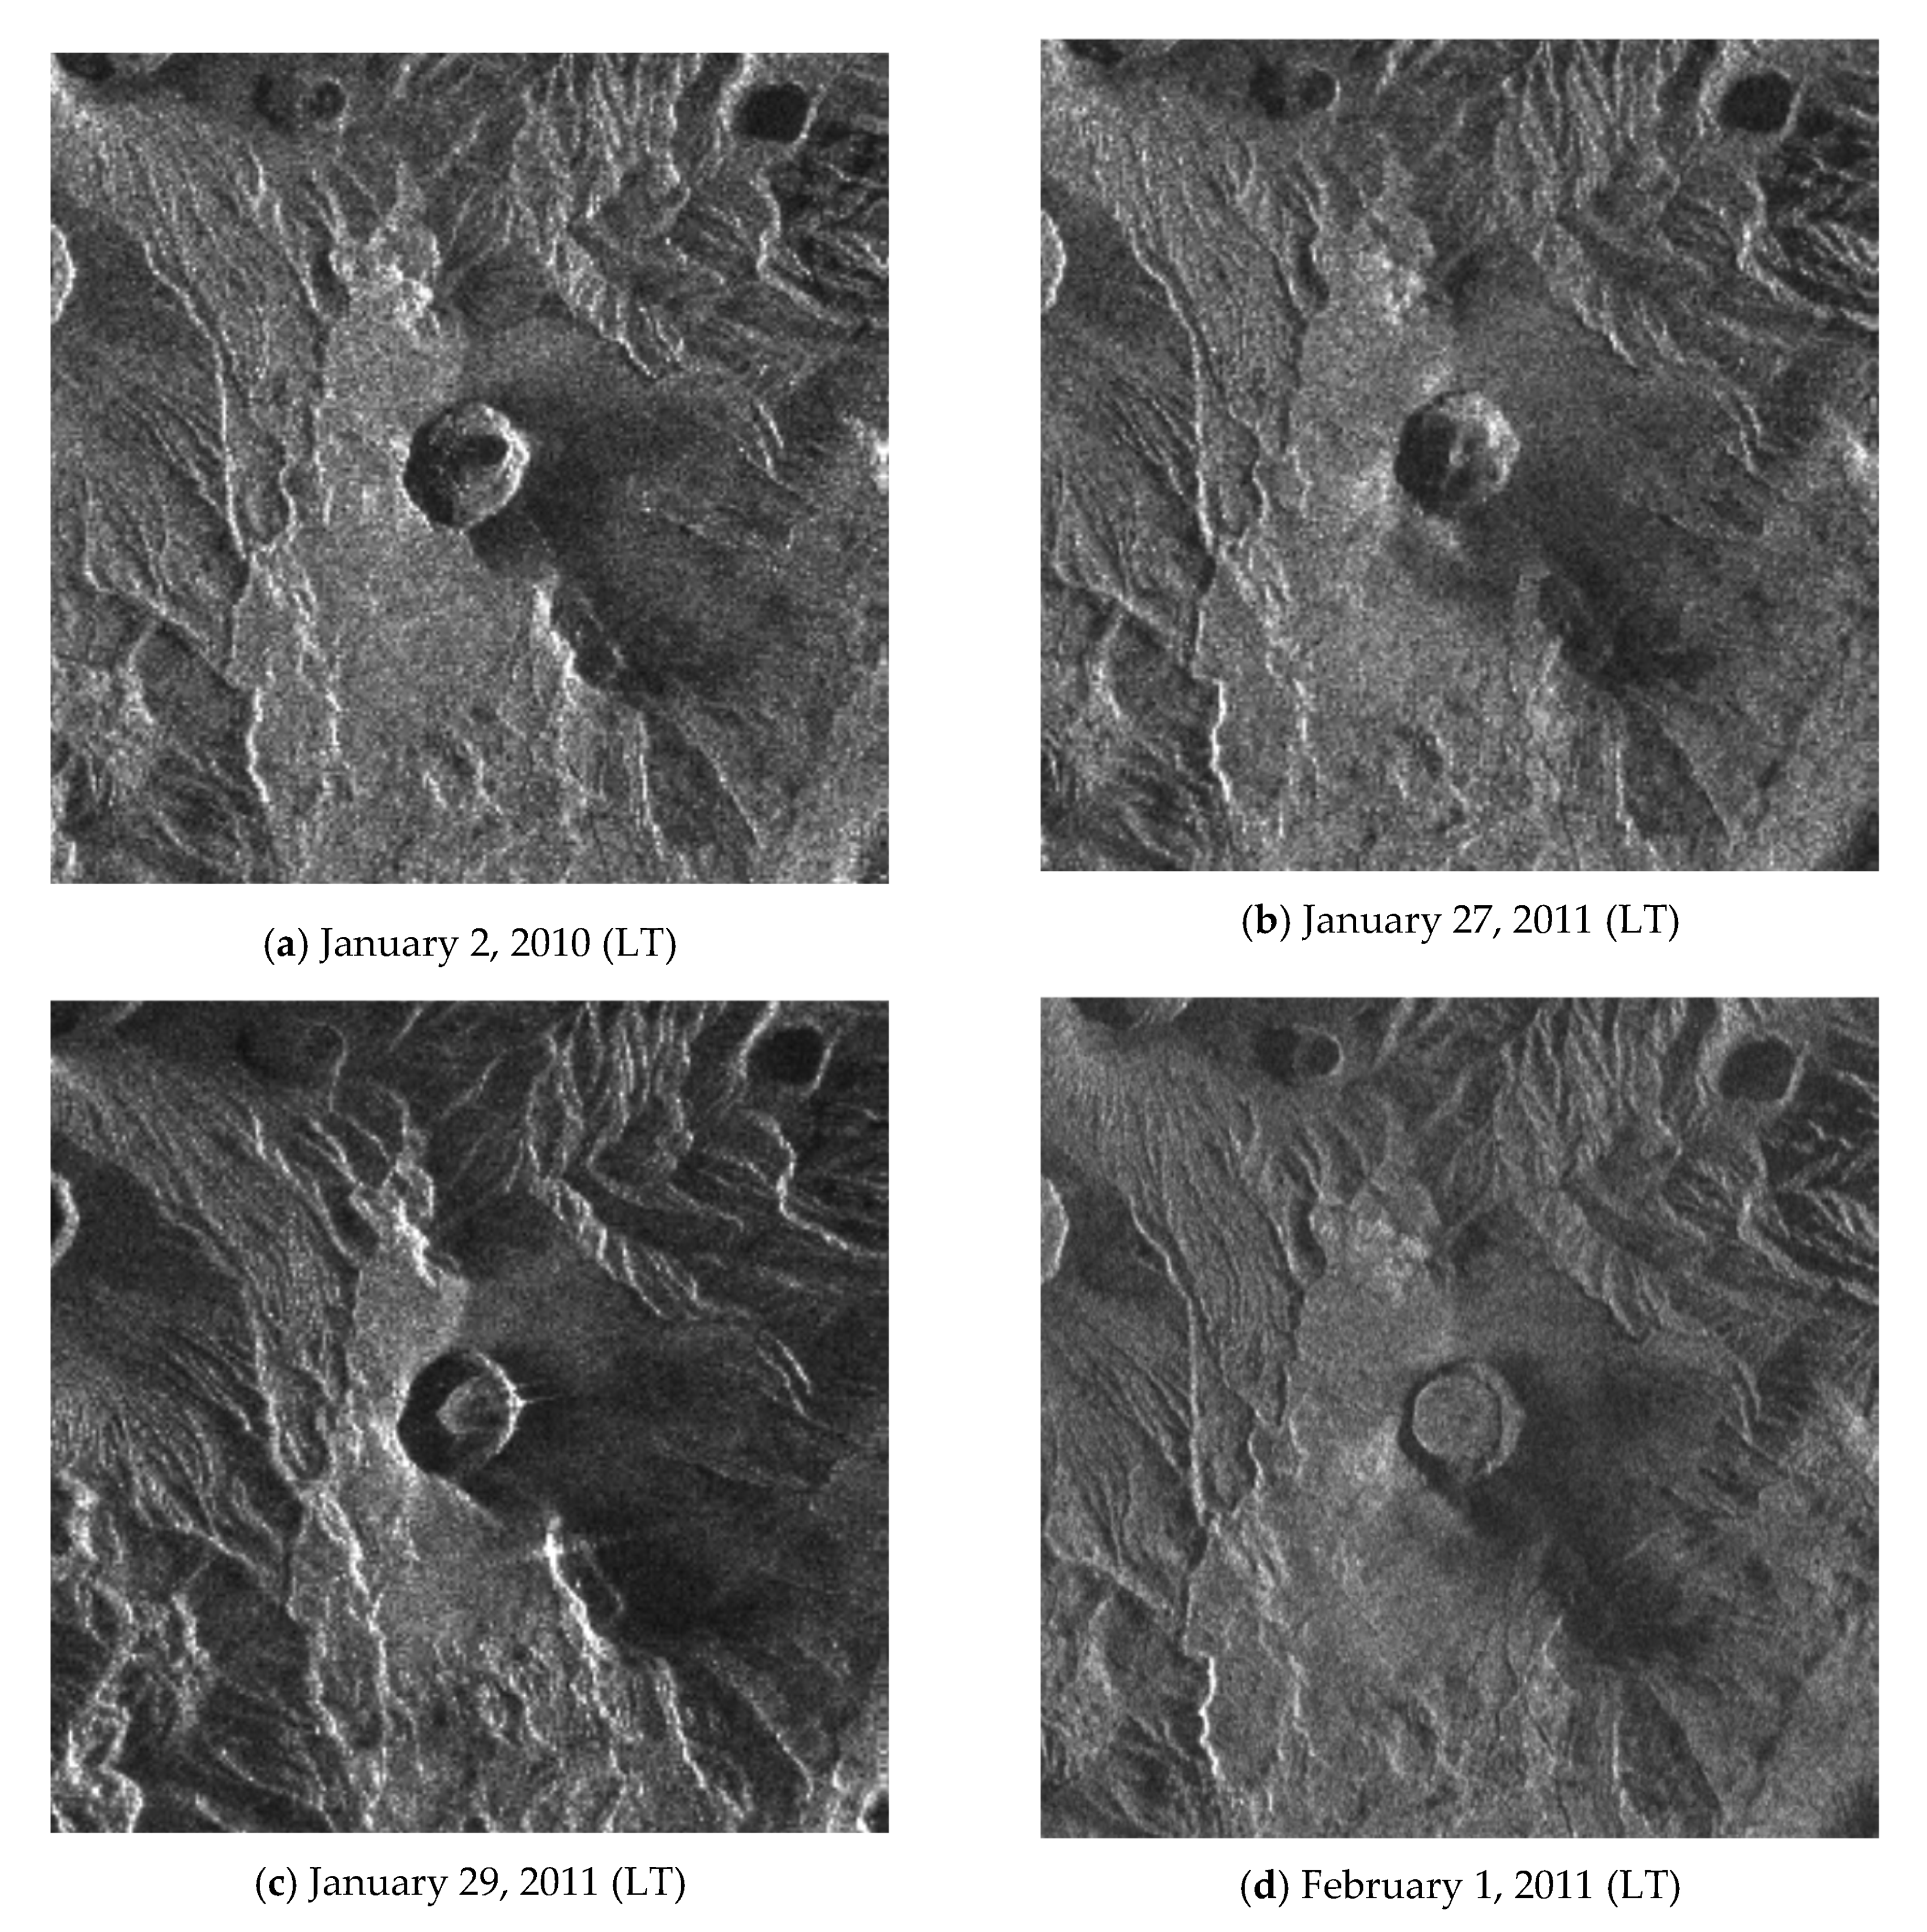
28,
29]. Lava emerged as a dome in the summit crater on 27 January 2011, observed by SAR [
30,
31,
32], and a small mound of lava was confirmed by aerial observation [
33]. The mound is developed by a 500-m radius on 29 January. The lava filled the crater, and the development stopped at the beginning of February, and the maximum diameter is about 600 m, and the volume is estimated by 10 million m
3 [
27,
28,
29,
30,
31,
32,
33]. During the subplinian events and lava dome growth, deflation of the deep magma chamber was observed by tiltmeters and GPS [
27,
28,
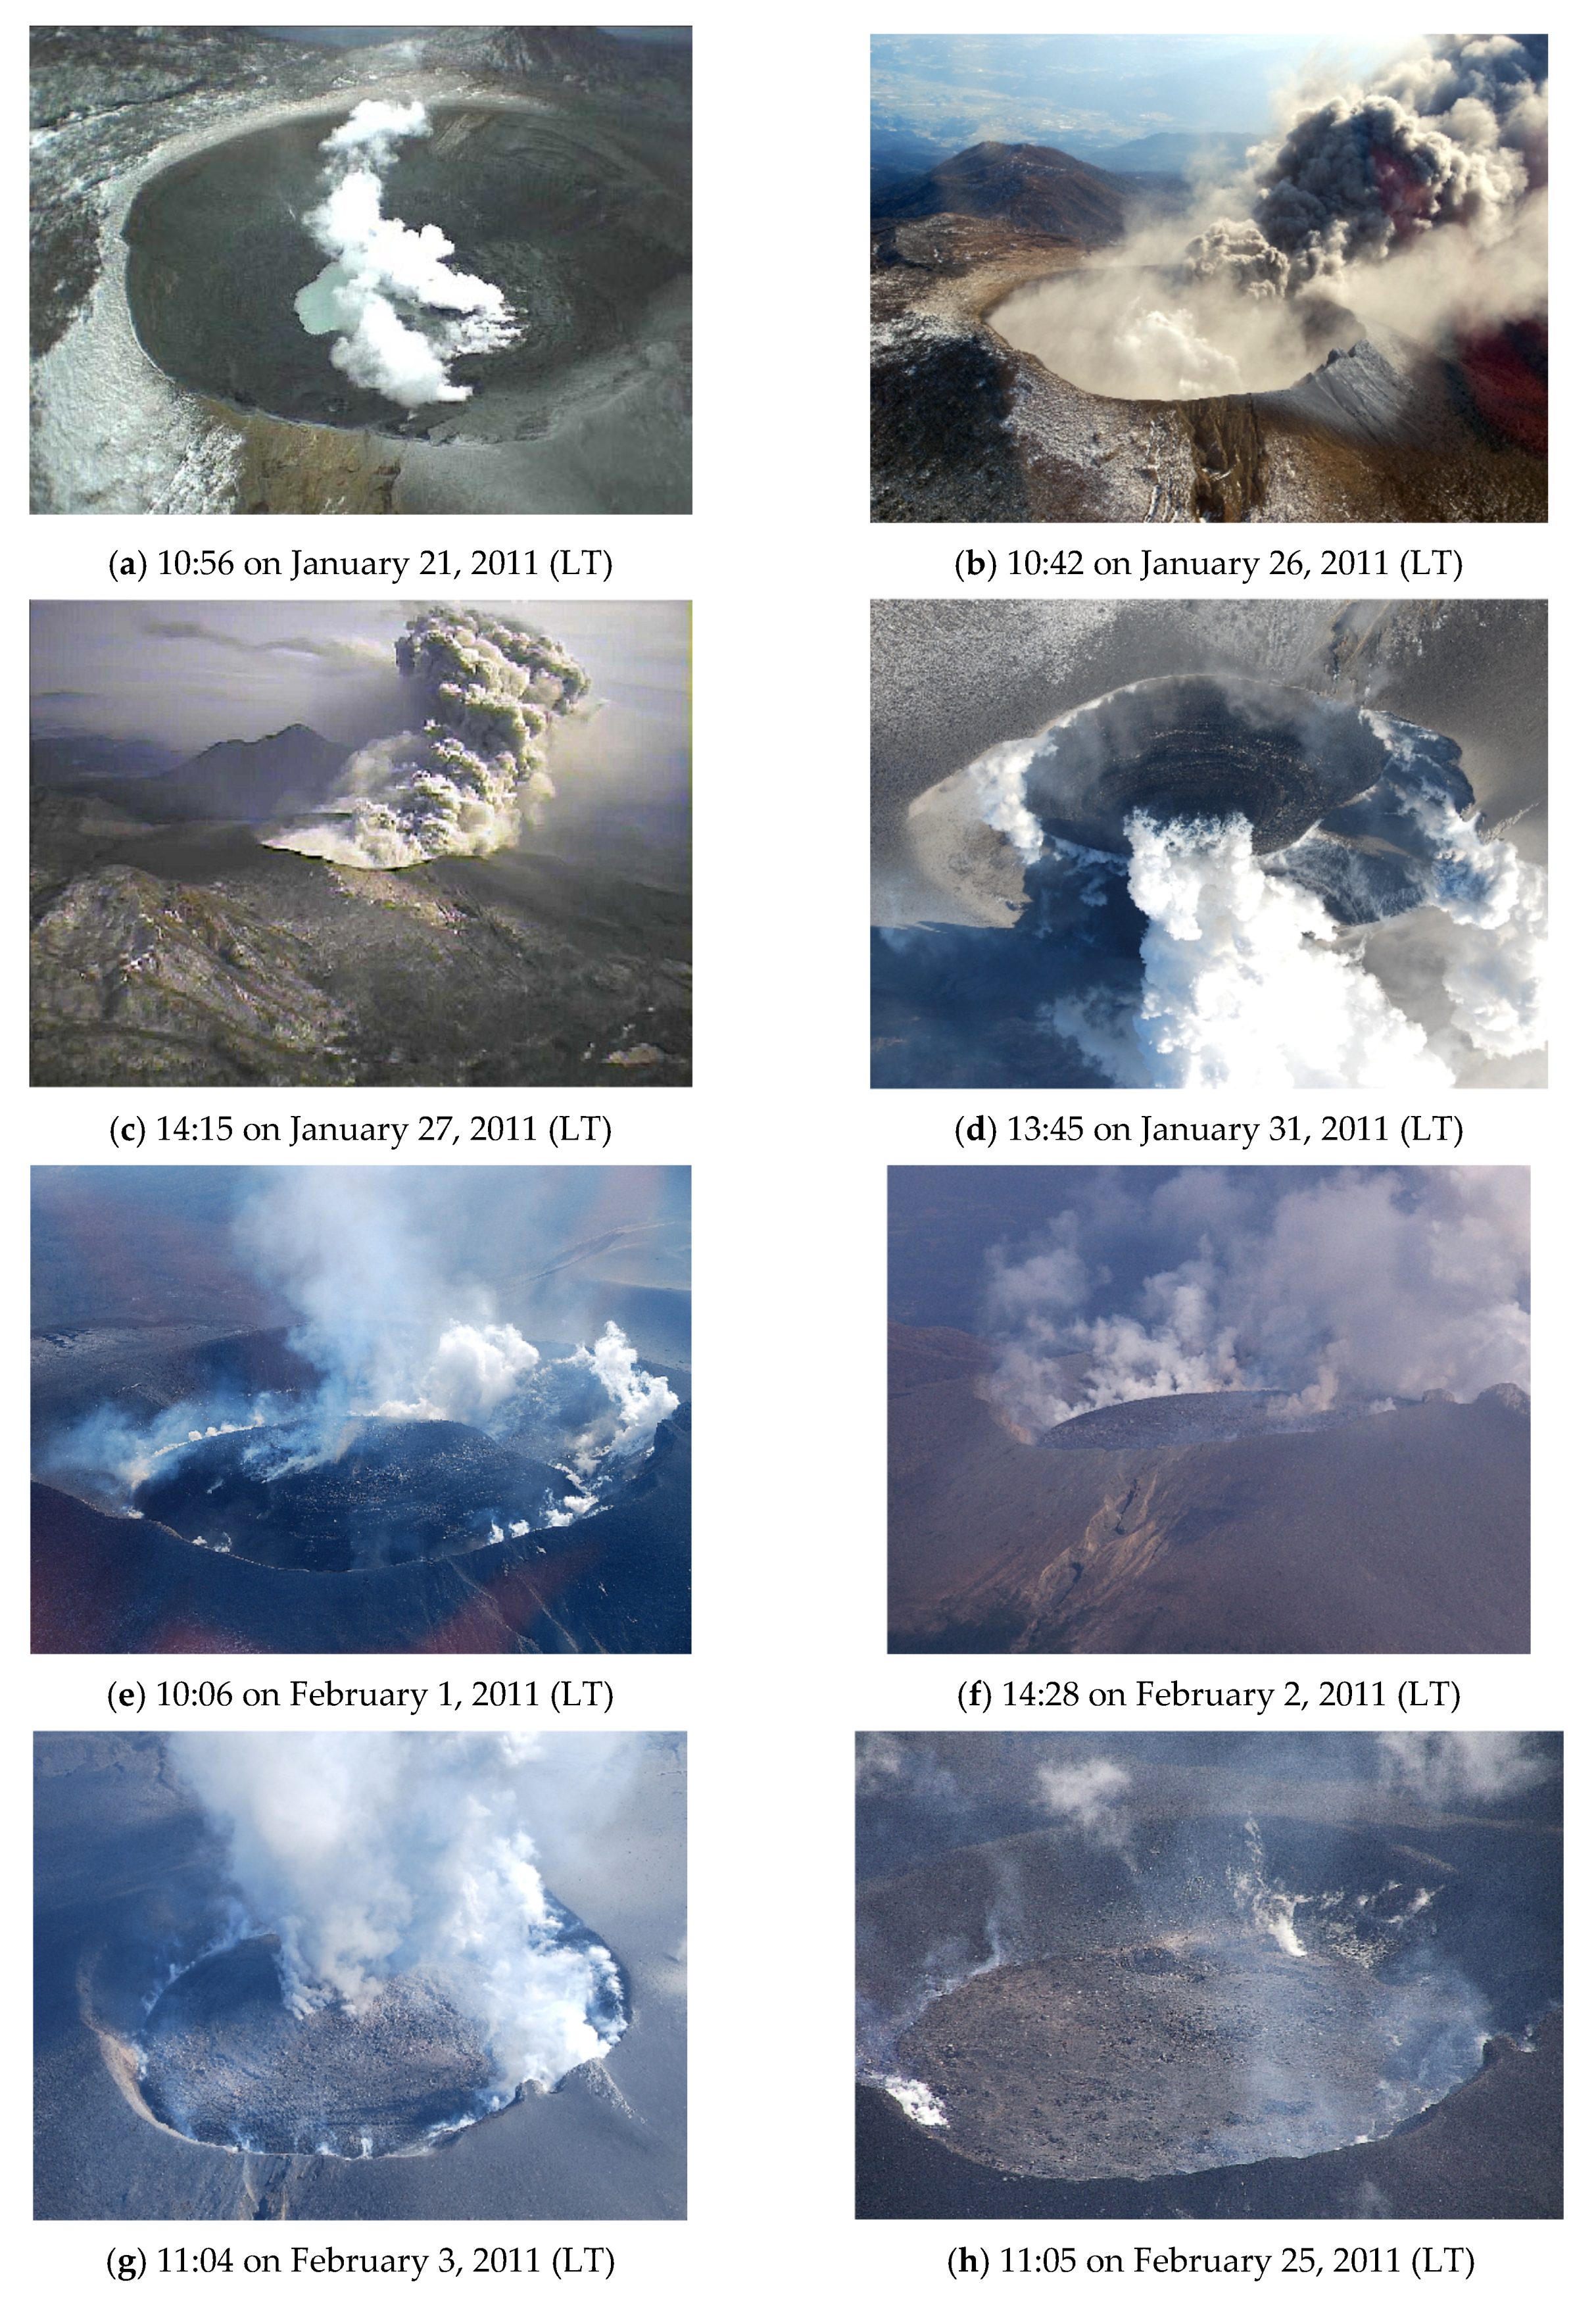
29]. Some aerial pictures and figures during the 2011 activity are given in
Appendix A [
29].
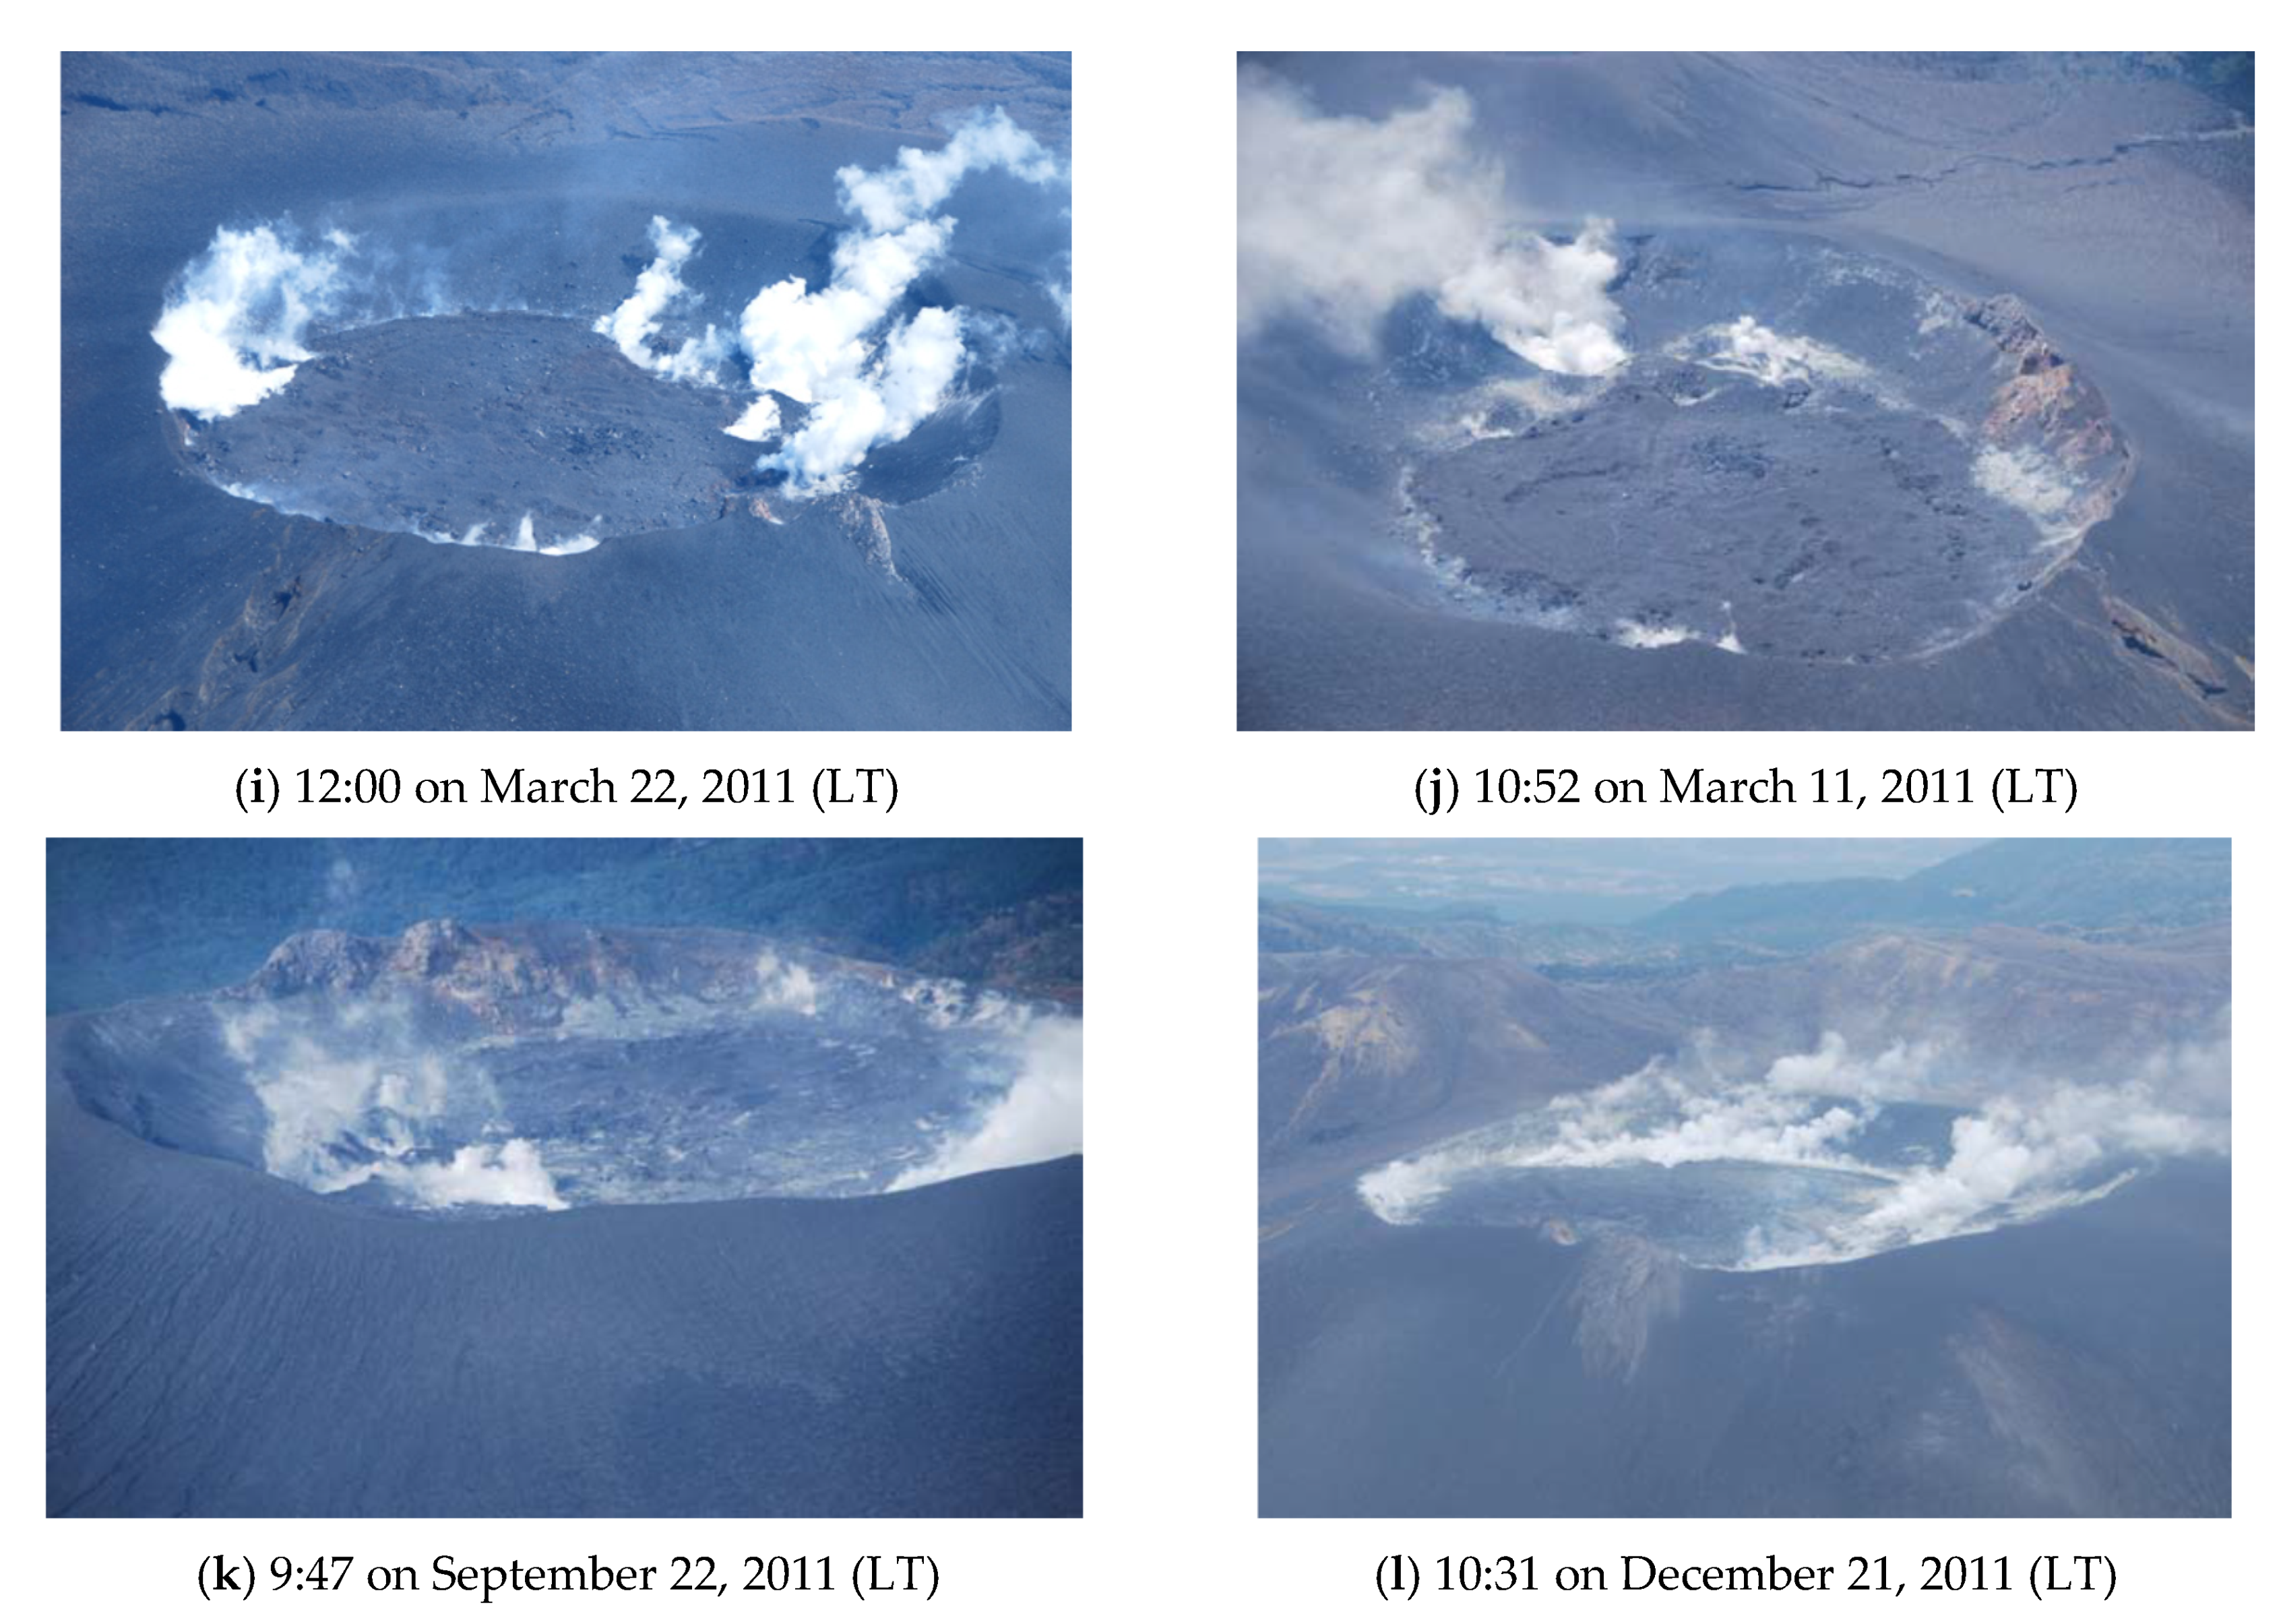
Figure A1 and
Figure A2 indicate aerial photos of the summit crater and aerial thermal infrared images of the crater, respectively.
Figure A3 show satellite SAR images.
The first explosive eruption occurred at 15:41 on 27 January. Explosive eruptions occurred 13 times by 1 March, most of them concentrated between 30 January and early February. The largest outbreak in 2011 was at 7:54 on 1 February. Eruptions have become intermittent since the beginning of February, and explosive eruptions occurred on 11, 14, 18 February and 1 March. Then, eruptive activity began to decrease in March. Their frequency and scale gradually declined. The number of eruptions after 2 March was five times in March, three times in April, one time in August and in September. No eruptive event occurred after the 2011 September 7 event [
27,
28,
29]. In addition, swarming of low-frequency earthquakes was confirmed from 28 January to early February. There will be no doubt that magma will be supplied into the Shinmoedake Crater by early February.
4. Data Processing
4.1. Bright Temperature Analysis of MODIS Data
Nighttime MODIS binary data (AM 0:30–2:30 in local time) are converted into brightness temperature and result in the daily map of the brightness temperature, which has an area of 1° × 1° study area centered at target pixel of the summit or the crater. The analyzed period is from 1 January 2003, to 31 December 2011, for Shinmoedake.
The temporal variation of brightness temperature for all pixels is investigated. Brightness temperature changes according to the emission are derived from the physical temperature of the surface and various factors such as climate conditions. The attempt to compare the spatial variation of brightness temperatures at one point to that of the reference points is considered. It is found that as the distance between these two points decreases, there is a tendency that their correlation is high. Conversely, when the distance increases, gradually, the correlation decreases. It means the factor to affect brightness temperature has its own scale. Therefore, if an appropriate reference distance is determined, a specific factor can be removed from the original fluctuation.
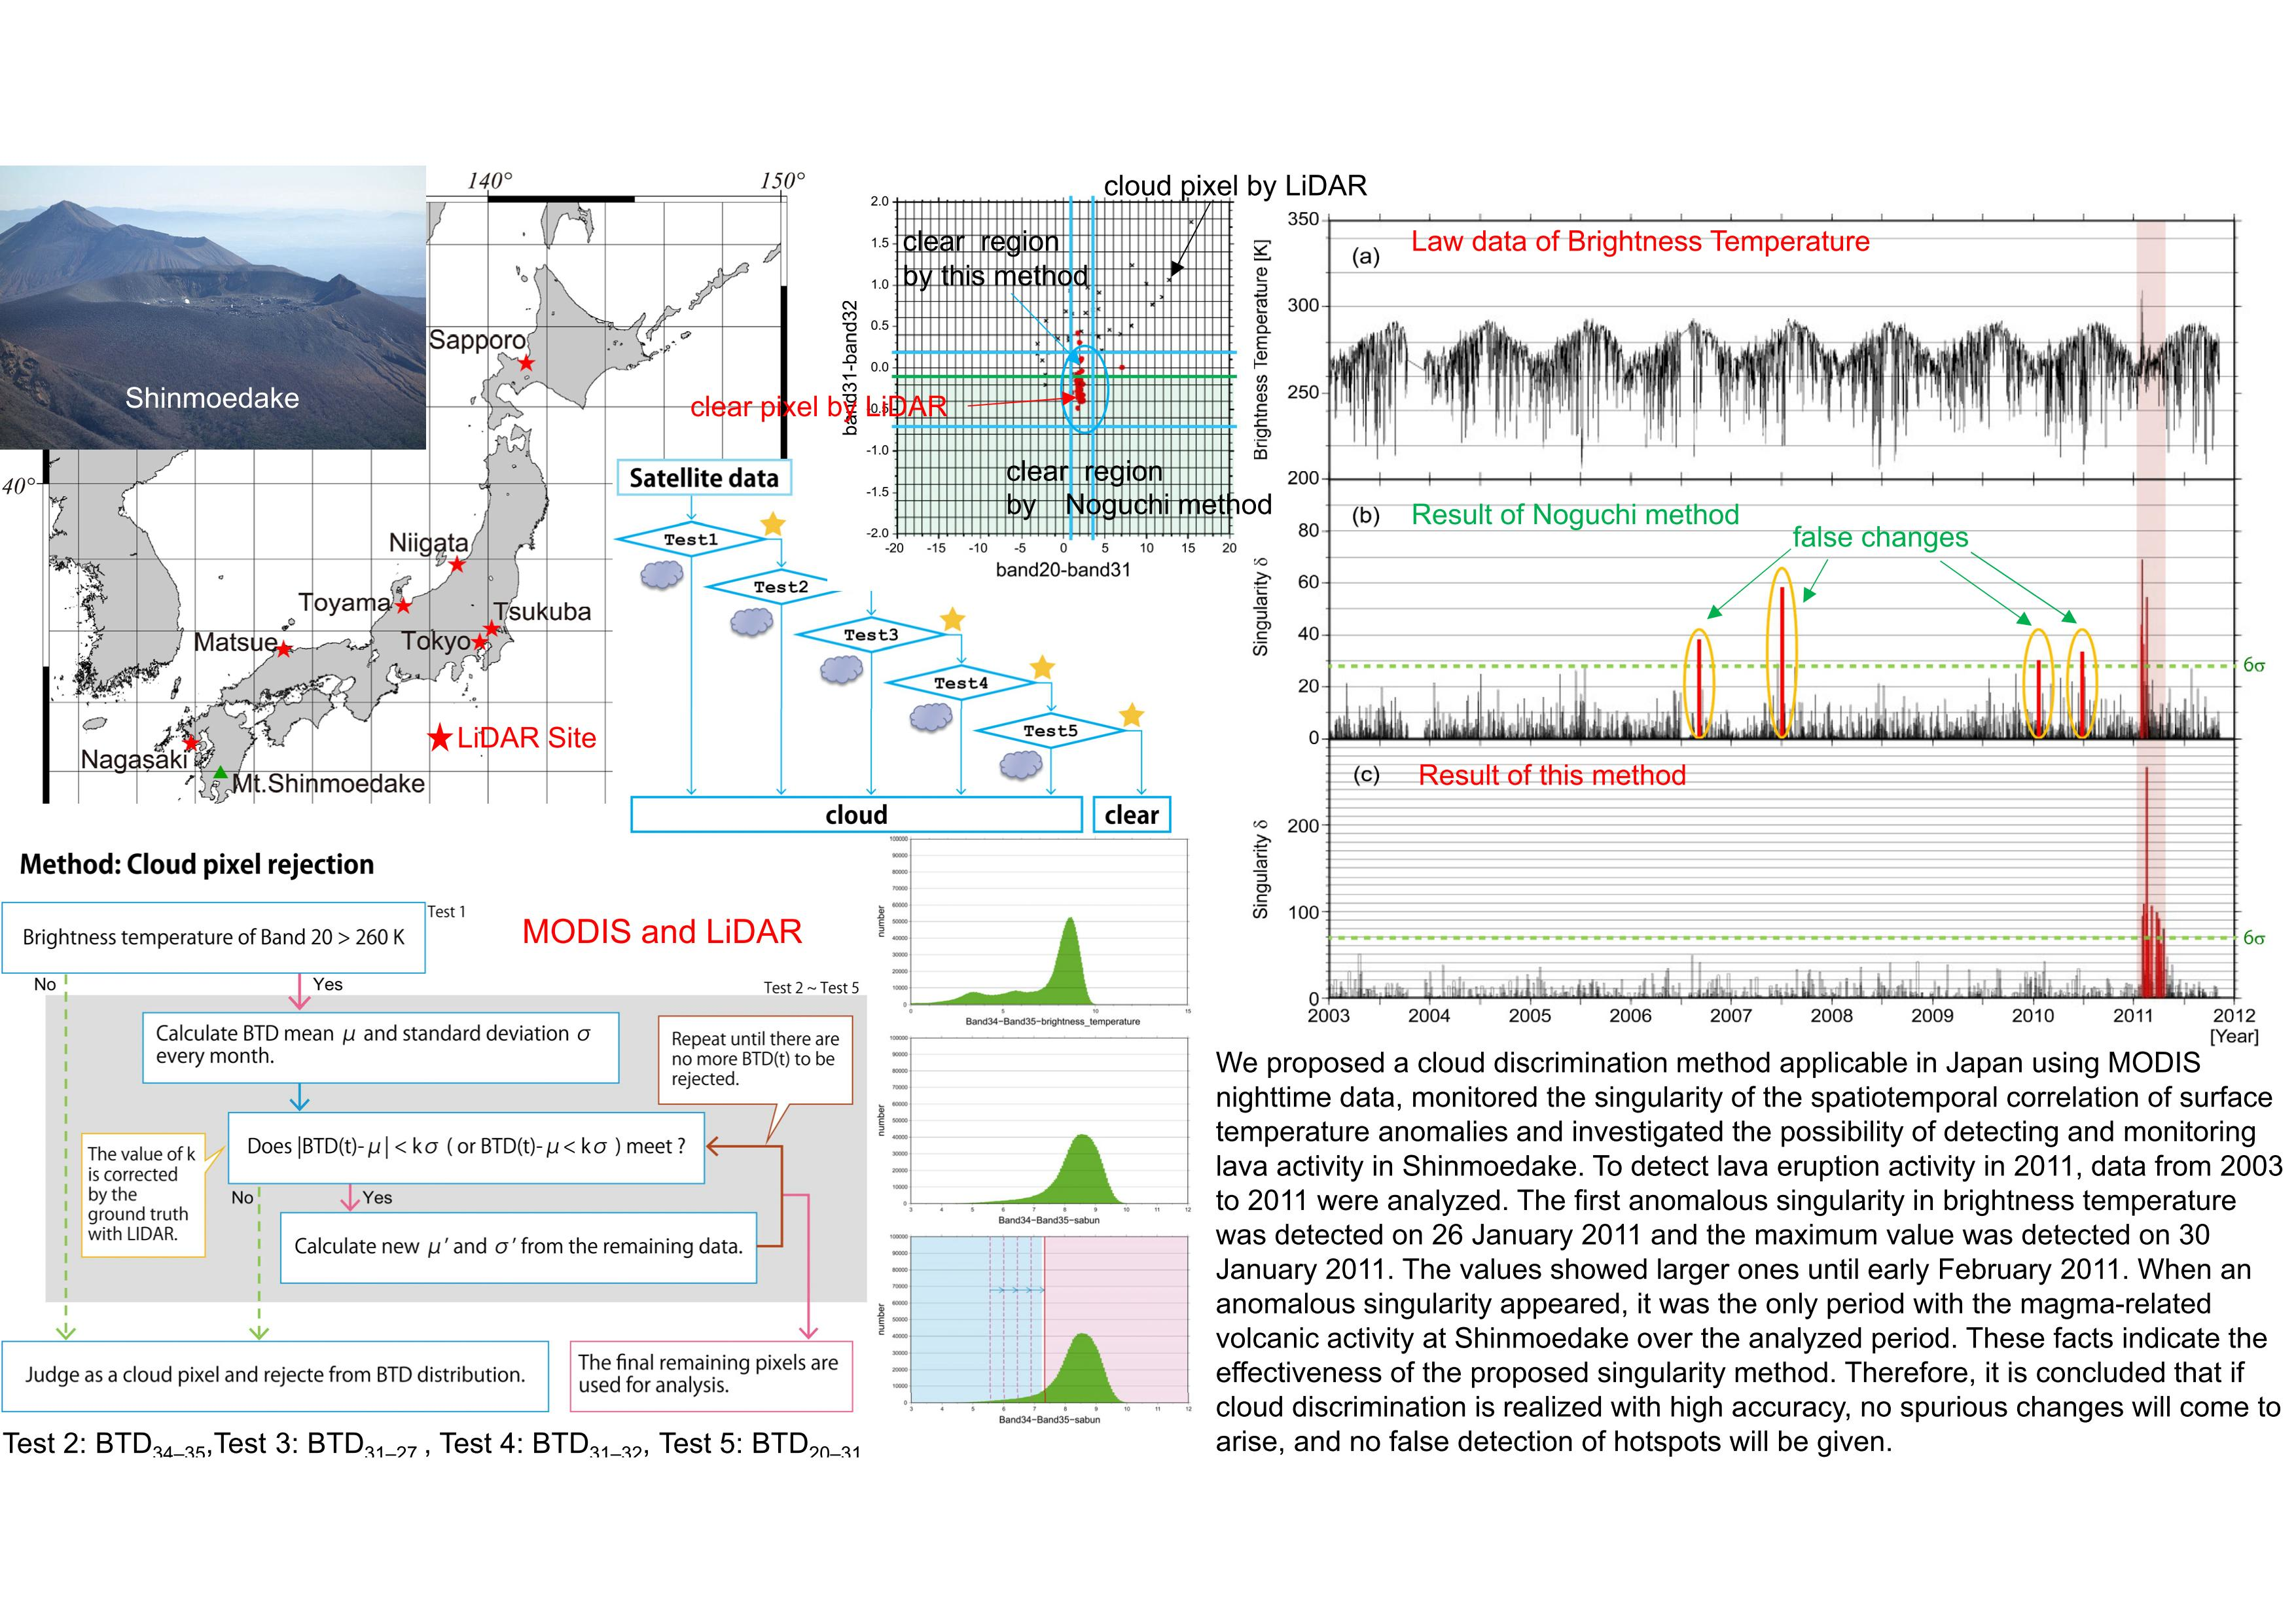
The spatial difference of brightness temperature is defined by the brightness temperature at the focused point (FP) and the four reference points (RP) with a certain distance to the north, east, south and west directions from the FP [
9,
36].
Here, S
FP, BT
FP and BT
RP are spatial differences of brightness temperatures, brightness temperatures at the focused point and the reference point, respectively. S
FP is computed for all pixels in one scene. Then, the time variation of S
FP is investigated for all pixels from the start of the analysis; and the time for which S
FP becomes a maximum value in the series is registered for each FP. The procedure is illustrated in
Figure 2.
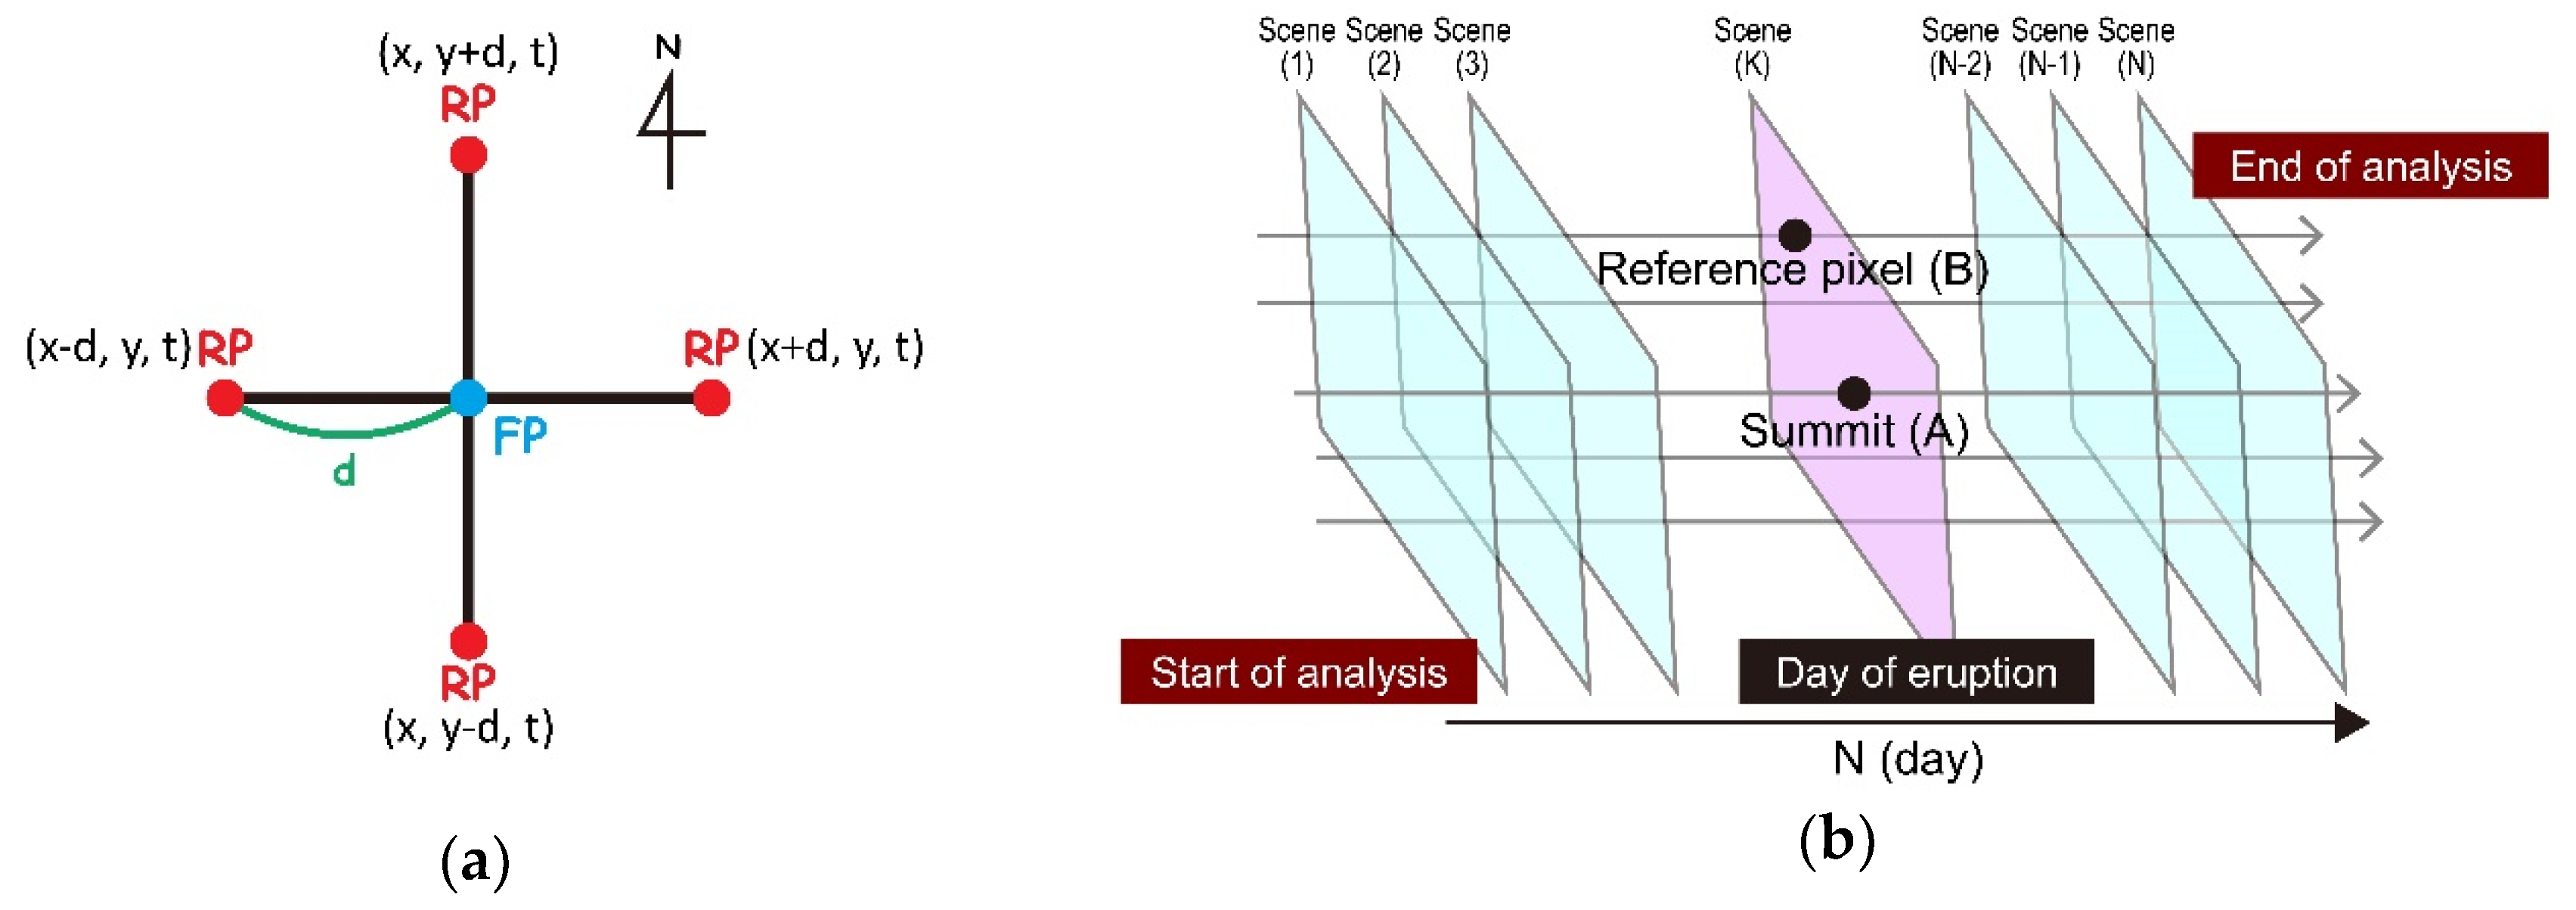
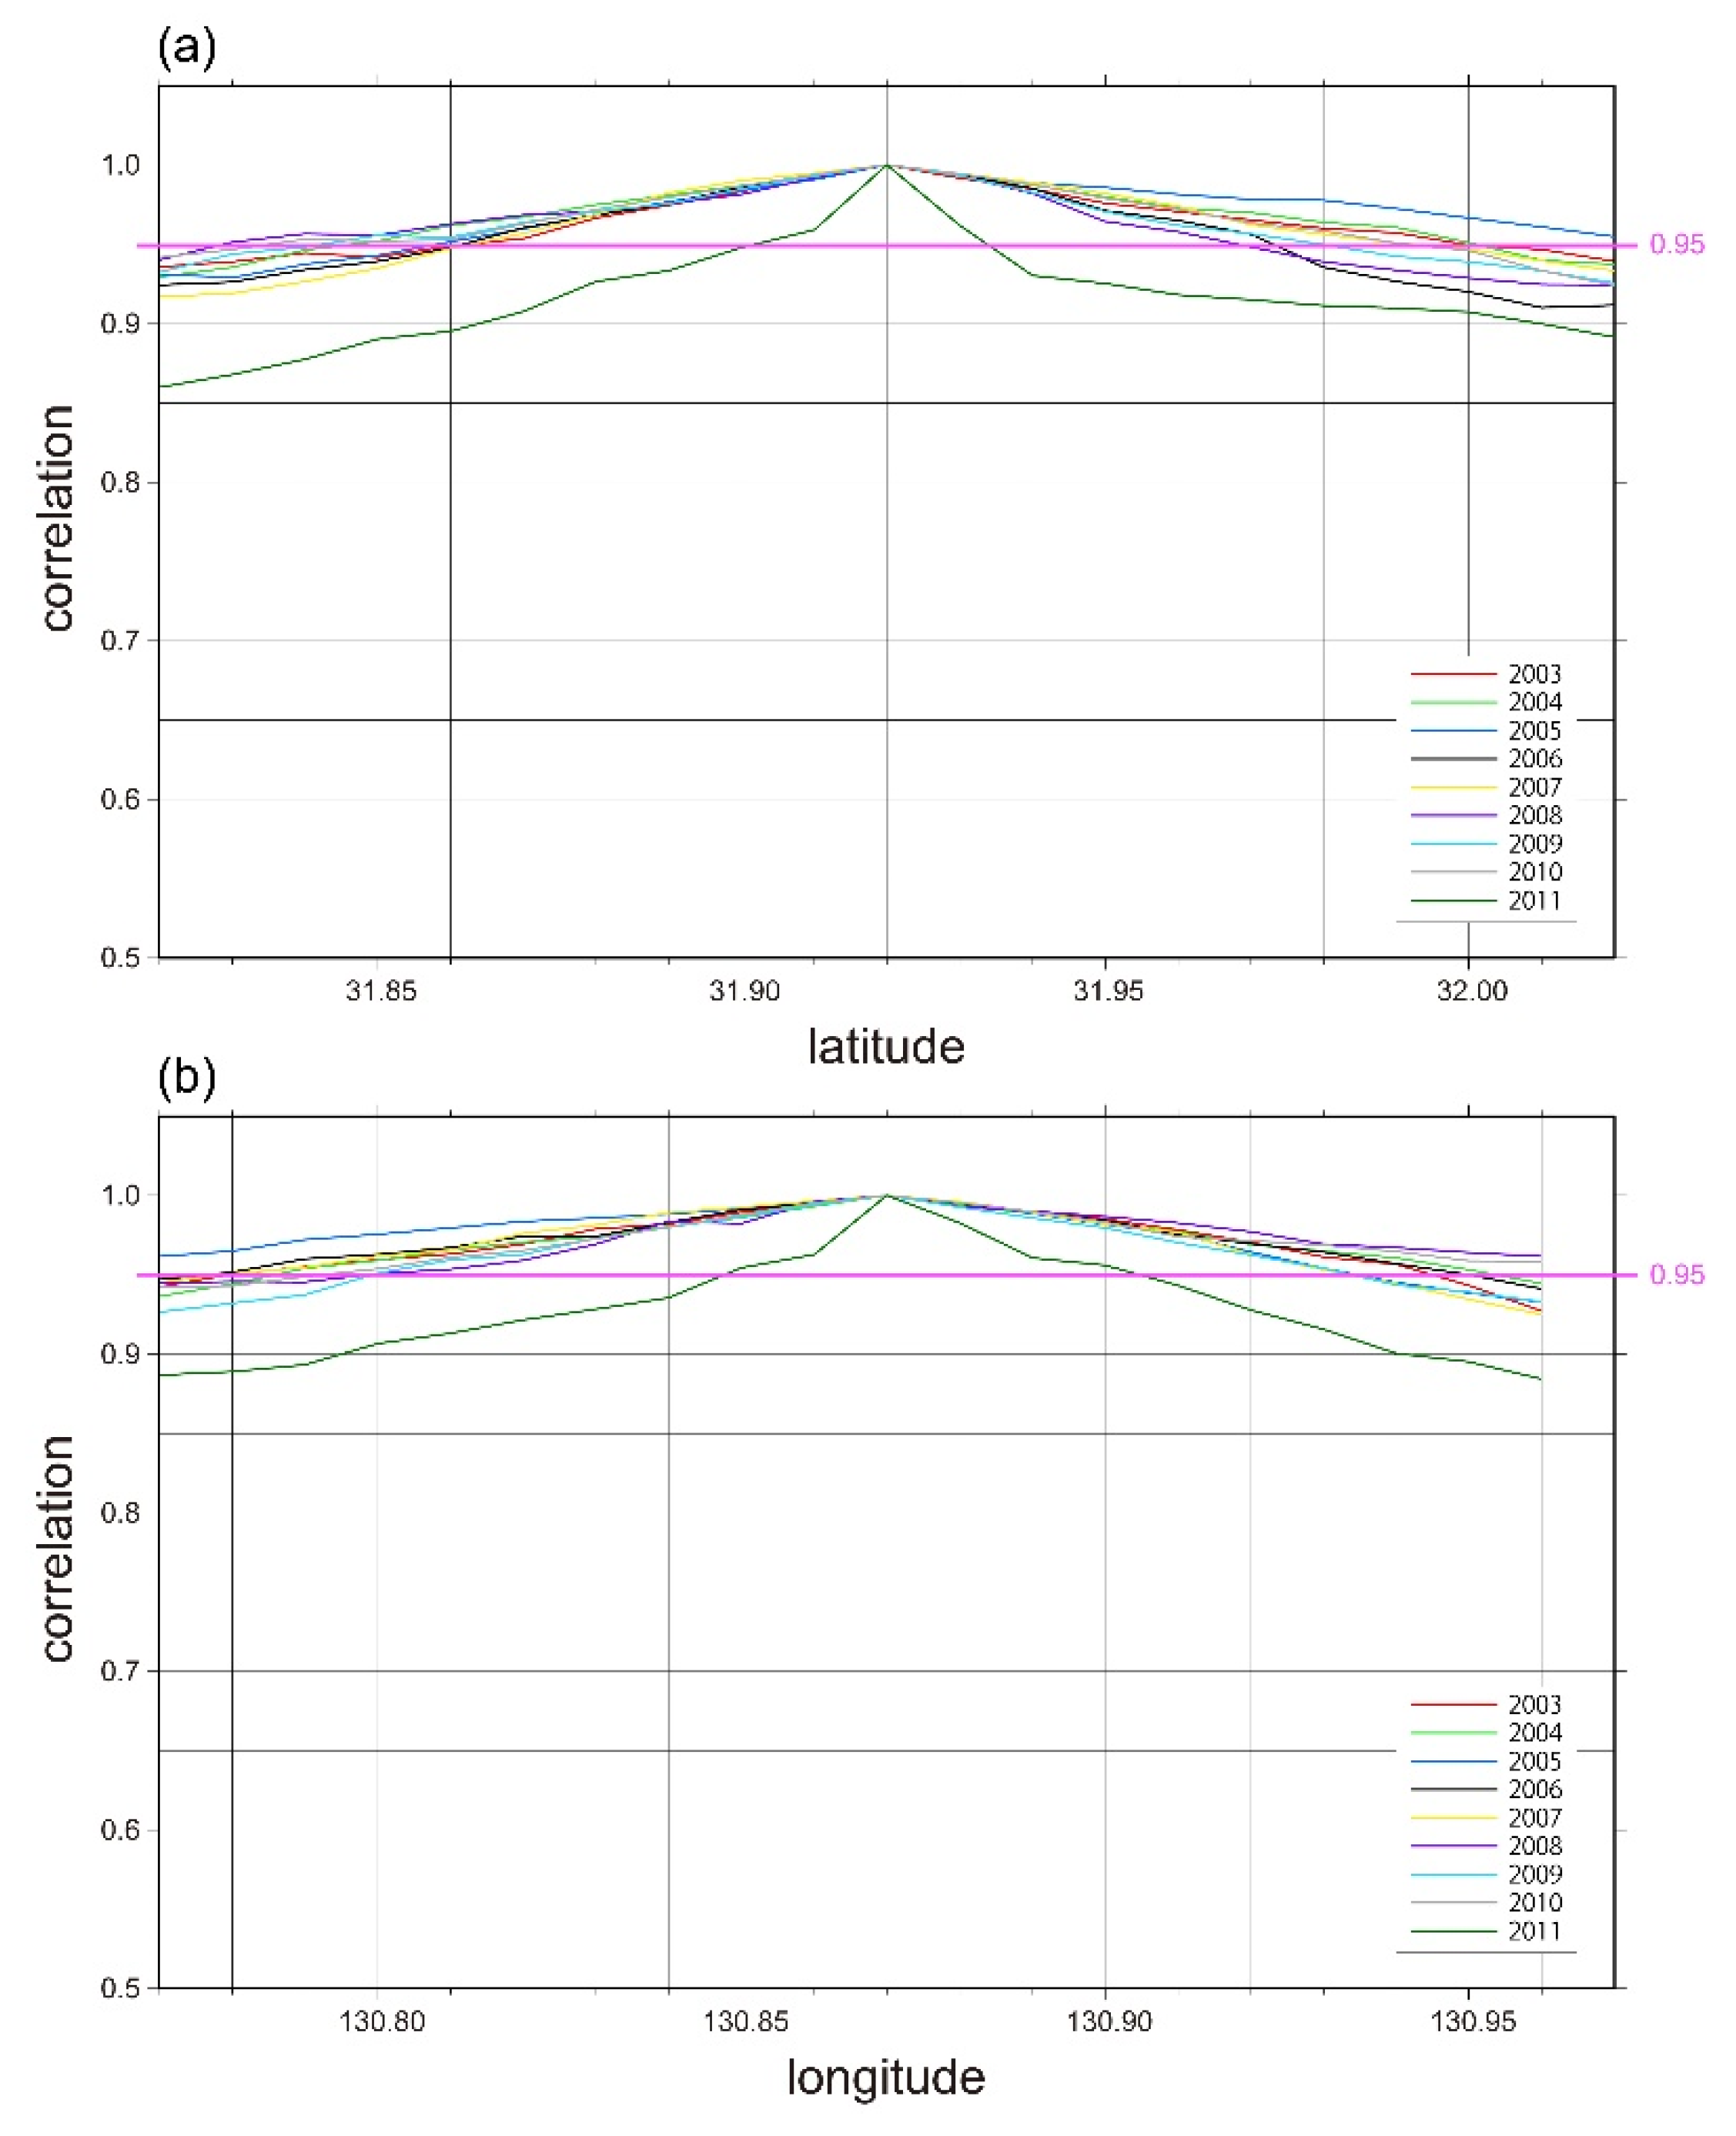
We calculate the range correlation from the summit of each volcano as follows;
where ρ is the correlation factor,
and
are average of BT
FP and BT
RP,
and
indicates standard deviations of BT
FP and BT
RP, respectively.
Figure 3 shows the variation of the correlation factor for Shinmoedake for each year. Because eruption occurred in 2011, the correlation of 2011 is much lower than for other years. We adjust the threshold of high correlation level (=0.95) to detect minute thermal anomalies, and the distance between FP and RP is 0.05° (5 km) in this study.
4.2. Cloud Effect Reduction
If we subtract brightness temperatures at the RP with that of clouds from the FP, an inaccurate S
FP value is obtained, because the brightness temperature of the cloud pixel is lower than that of the surface pixels. Therefore, the removal of cloud effects is crucial. To remove cloud effects with MODIS data, Noguchi et al. use radiances collected at bands 31 and 32. Noguchi et al. adopt a similar approach (i.e., RST-based) applied by Pergola et al. on AVHRR data (i.e., bands 4 and 5, at ~11 µm and ~12 µm, respectively) to recognize meteorological clouds [
3,
9]. Noguchi et al. follows their approach and apply to detect thermal changes possibly associated with volcanic activity in Mt. Merapi. Indonesia and Mt. Asama, Japan [
9]. Regarding the case of Mt. Merapi, the results show the effectiveness of the cloud detection, but in the case of Mt. Asama, the removal of clouds effects is found insufficient. In this study, a different approach to remove cloud effects is adopted In the Noguchi method, if BTD is lower than the monthly average of BTD-1σ, then that pixel is classified as a cloud pixel [
9]. Here, σ is a standard deviation over one month. This method can remove clouds in tropical areas such as Indonesia. However, it cannot remove cloud in temperate zones such as Japan. This is because, in tropical regions, almost all clouds are cumulonimbus. However, in temperate zones, there are many kinds of clouds. Therefore, in this study, we use not only BTD between bands 31 and 32, but also other BTDs (bands 20–31, bands 34–35, bands 31–27, where the wavelength of band 20, 27, 34 and 35 are 3.7, 3.9, 13.7 and 13.9 µm, respectively.
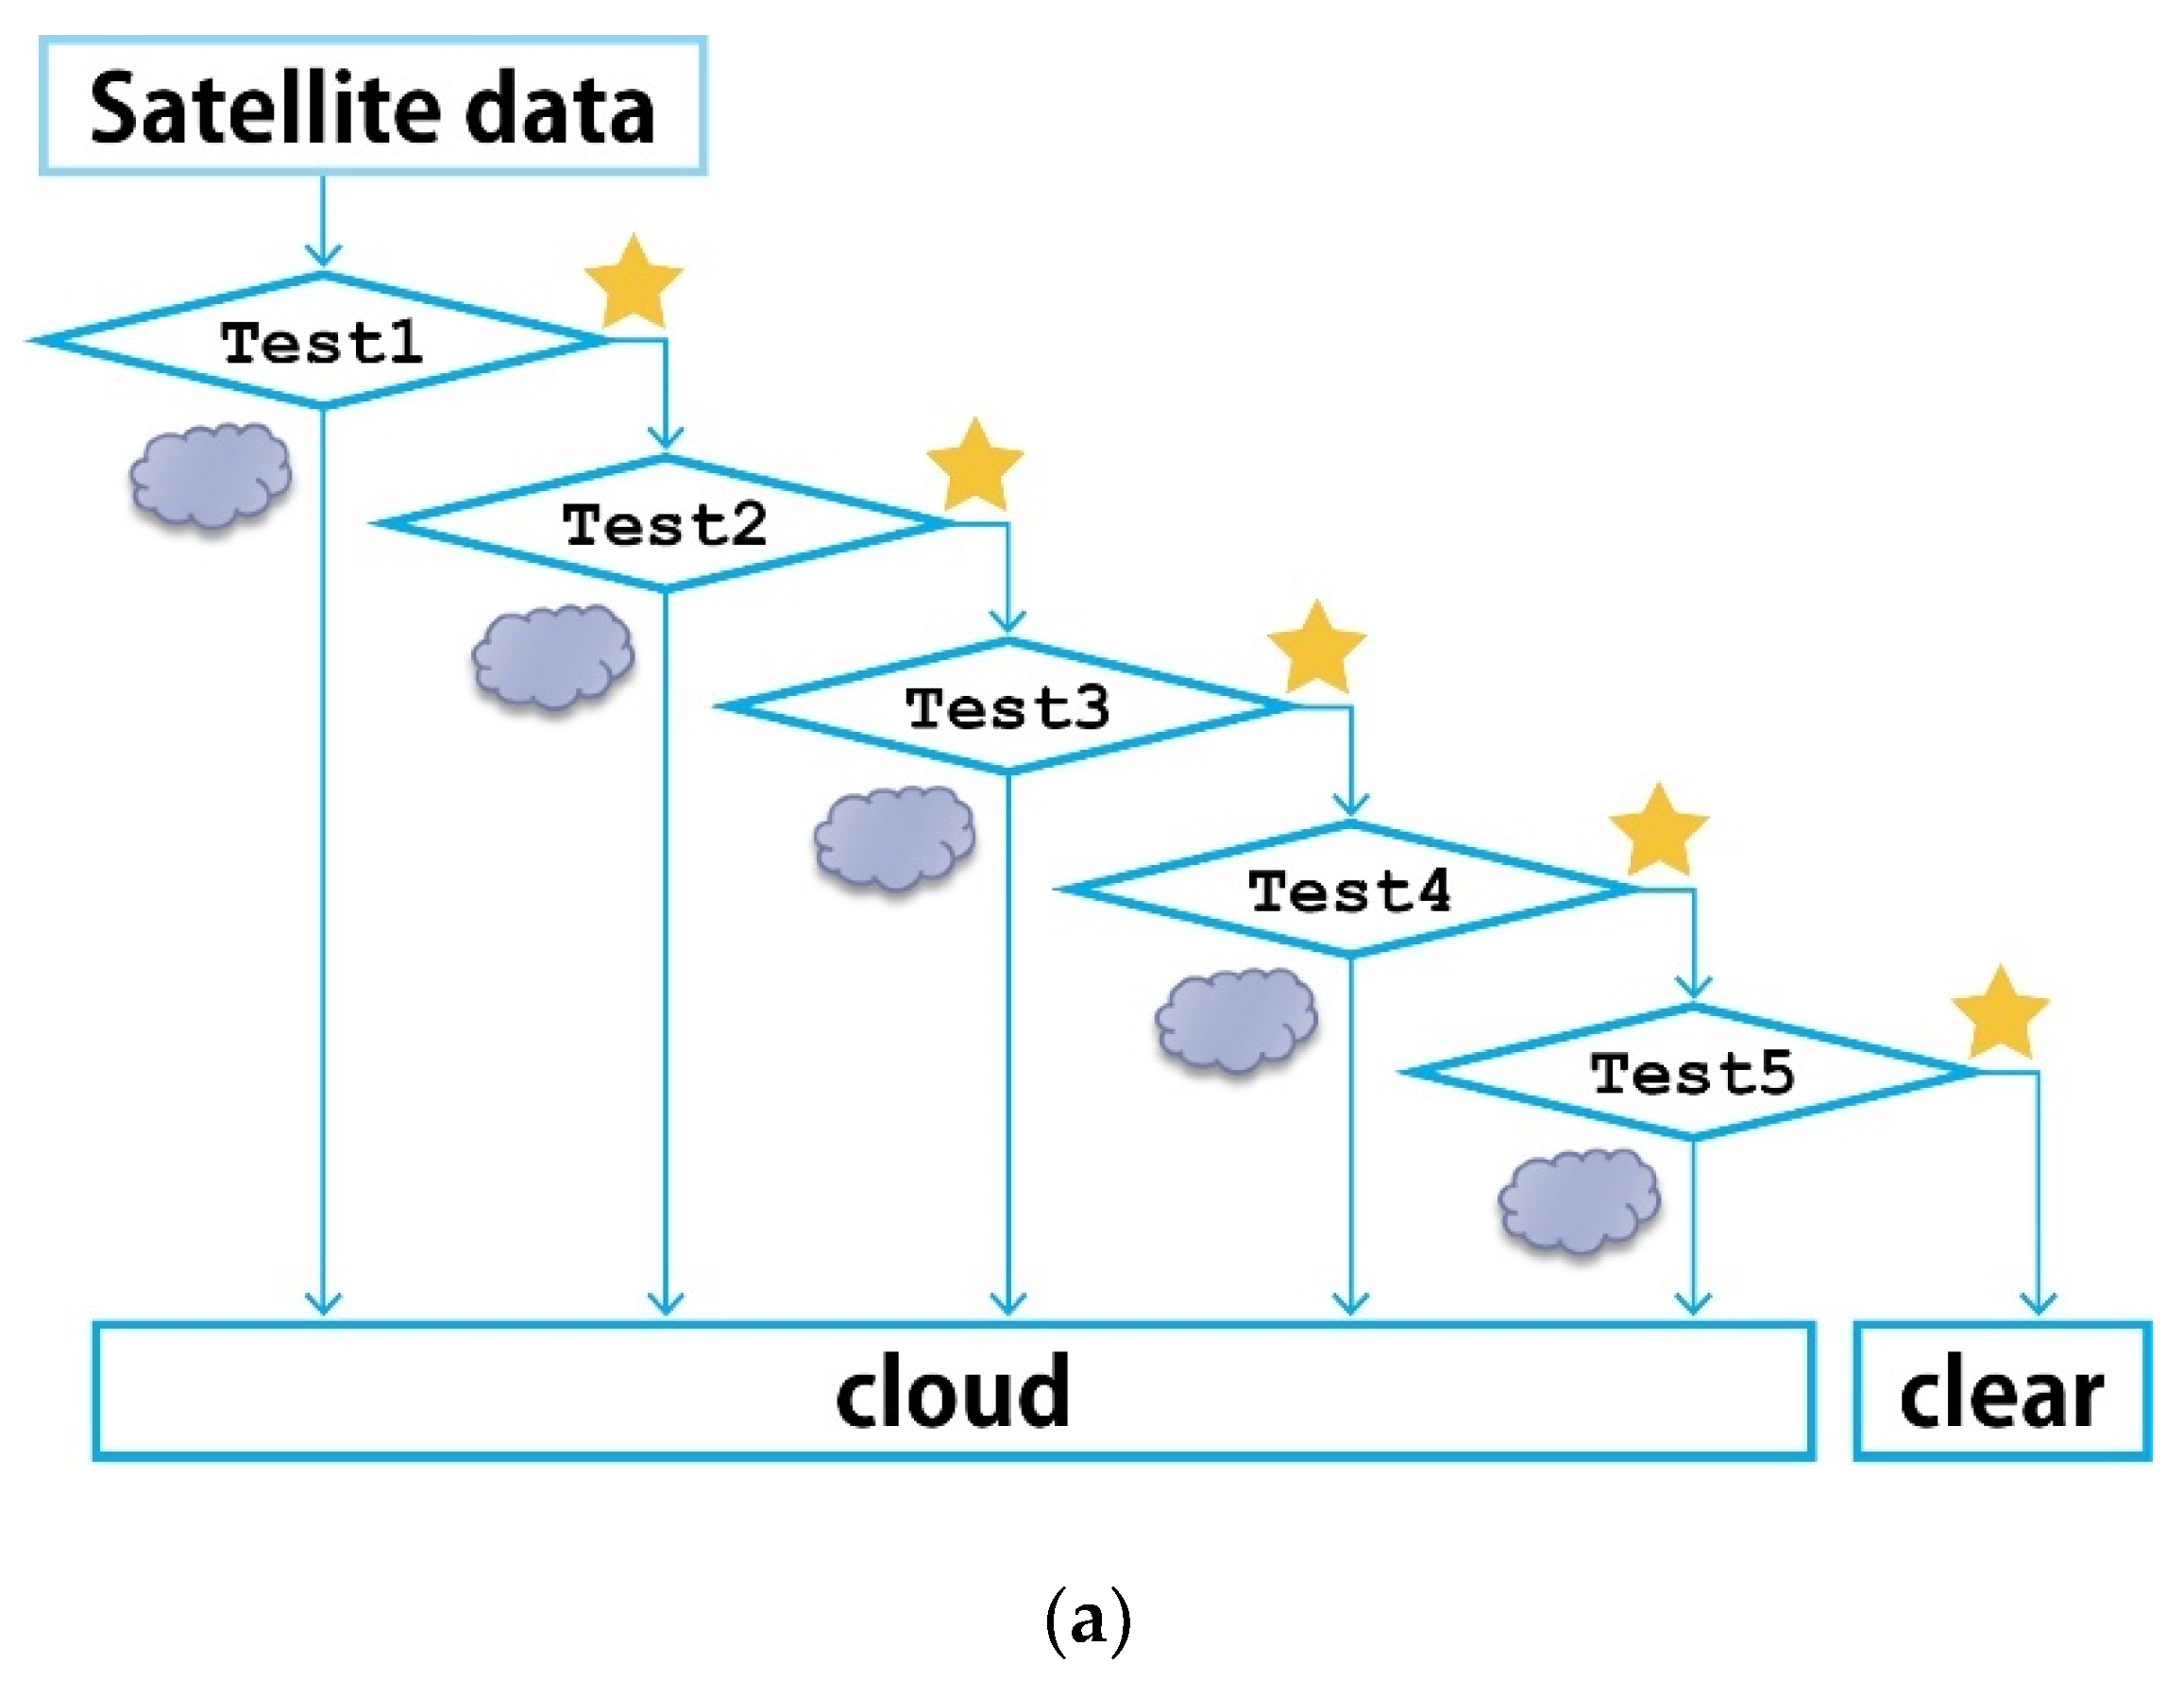
Regarding cloud detection, five tests are examined for all satellite data. If a pixel passes the Test 1, it can proceed to Test 2; if the pixel passes the Test 2, then it can proceed to Test 3, etc. Finally, only the pixel that passed all five tests can be regarded as a clear pixel that is not a cloud pixel and is used to further analysis.
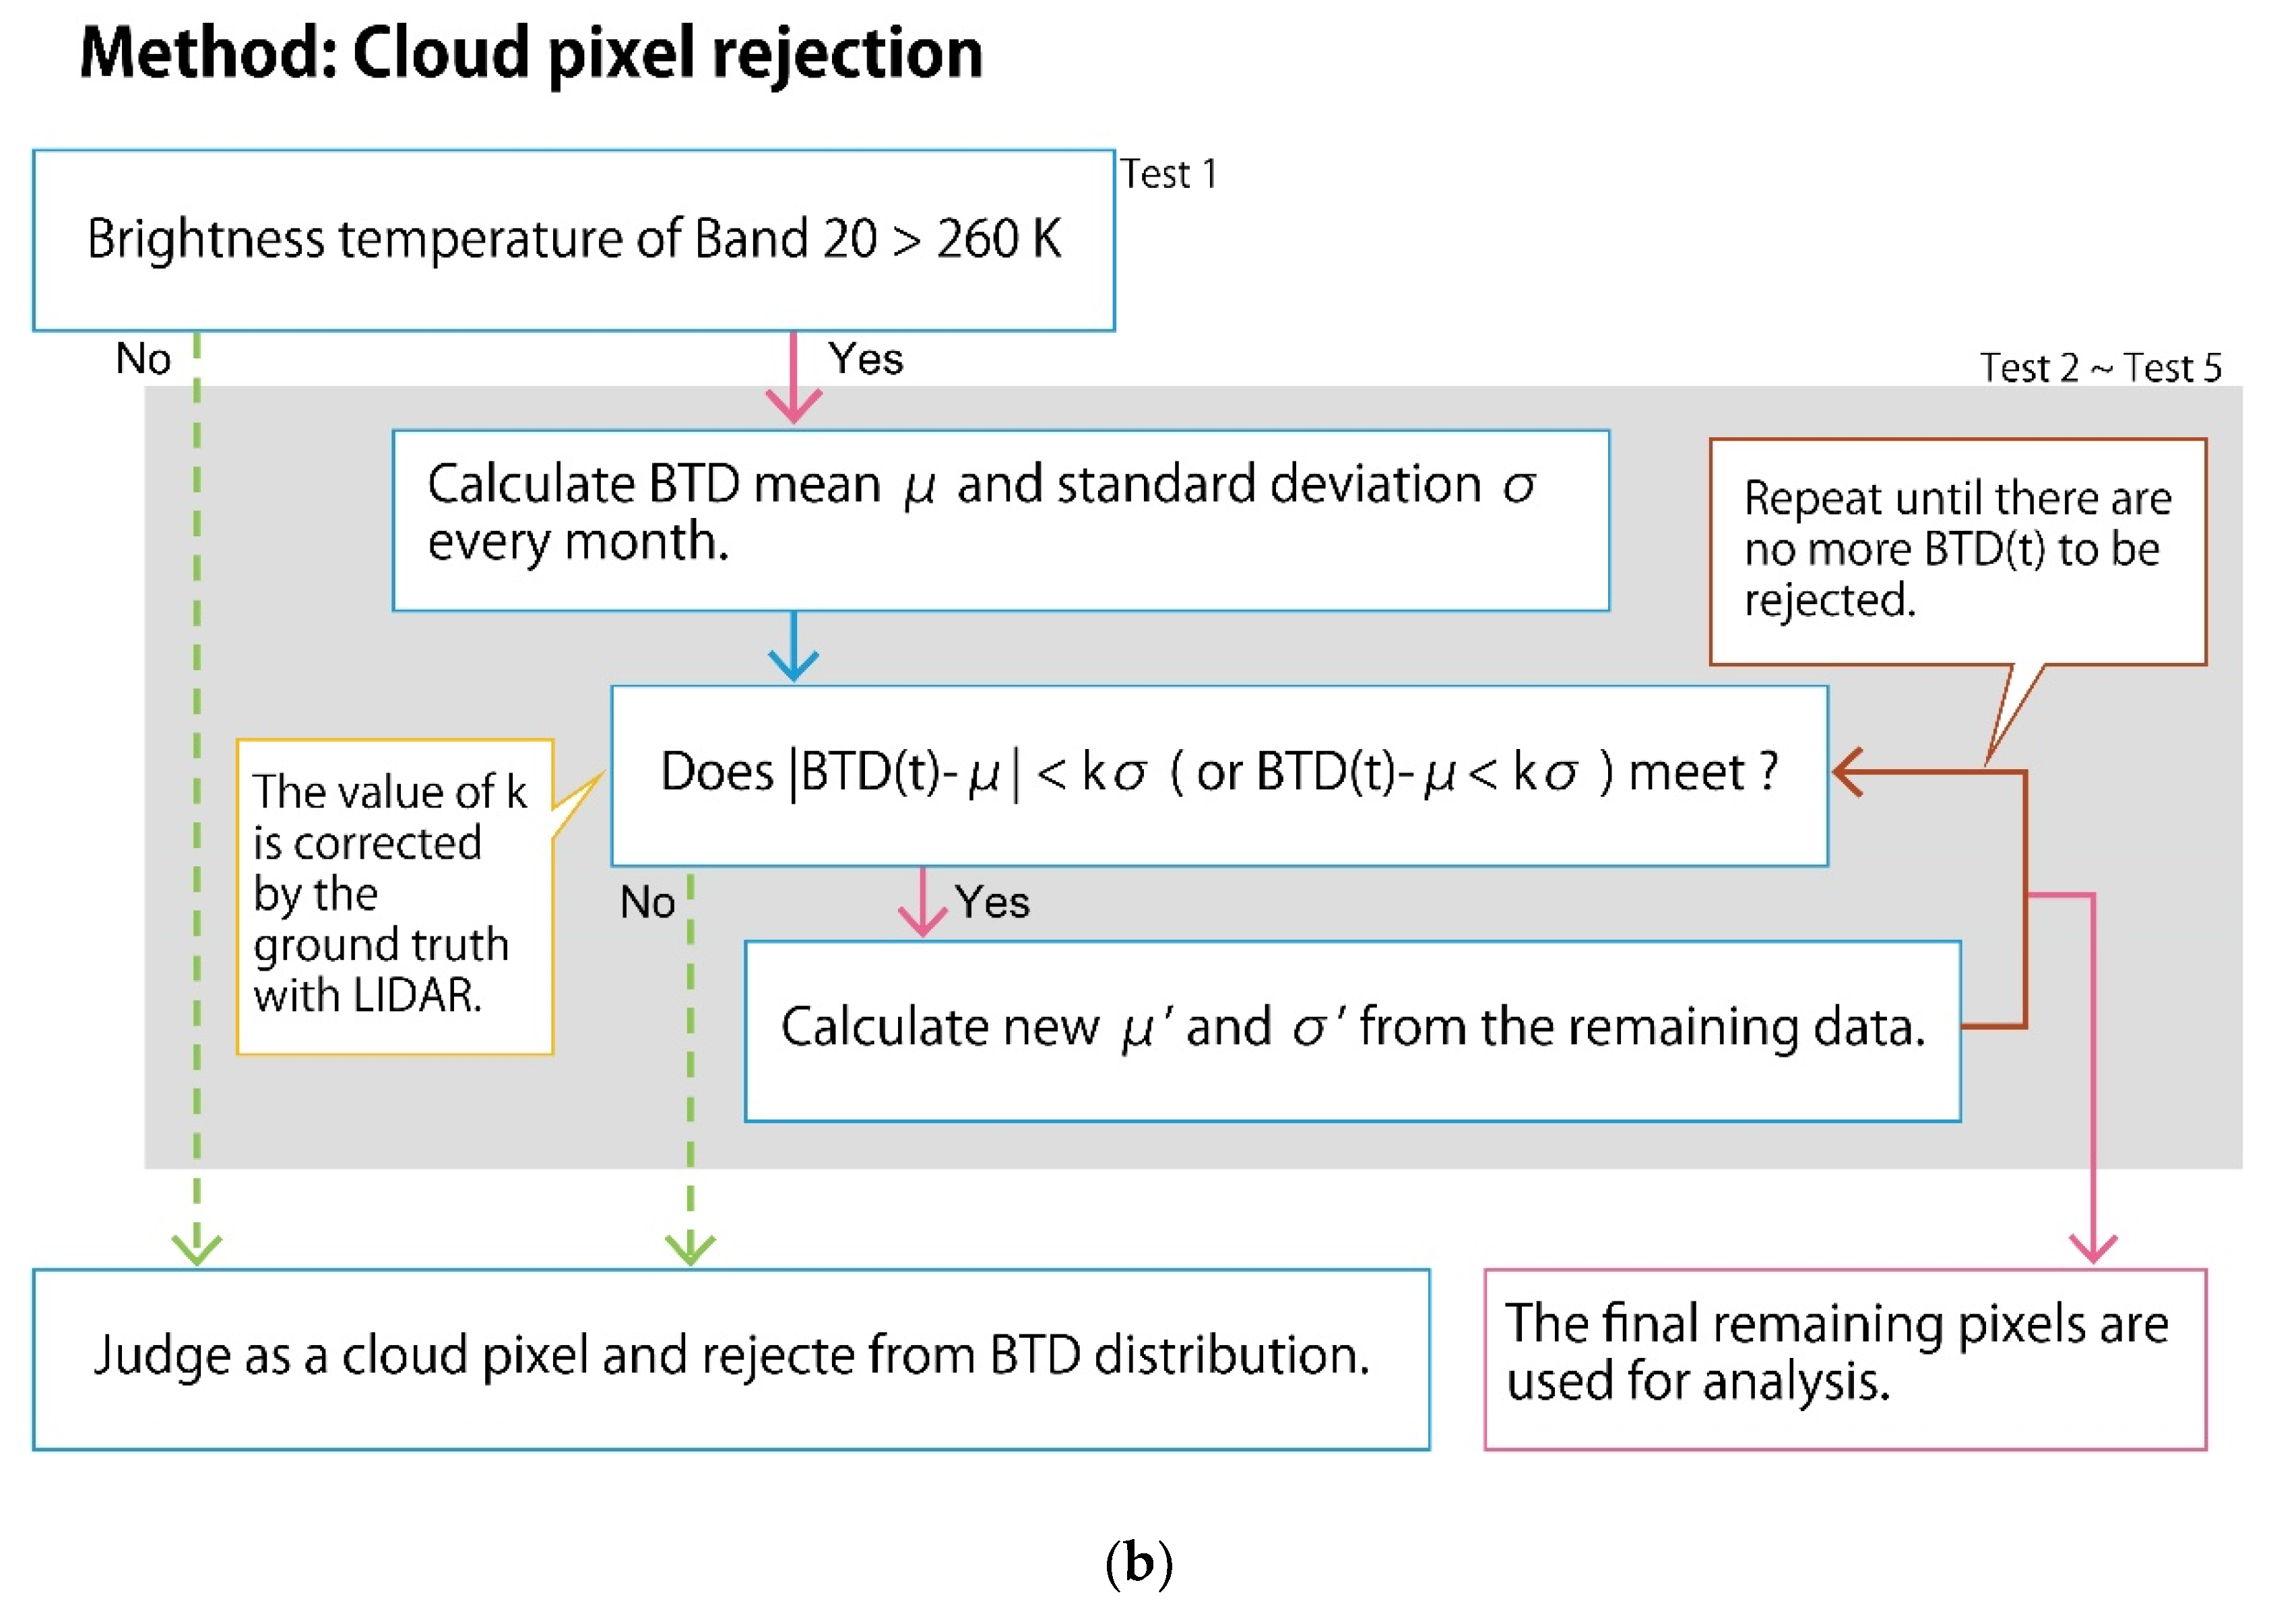
Figure 4 illustrates the general concept of the proposed cloud discrimination procedure and detailed procedures in the tests.
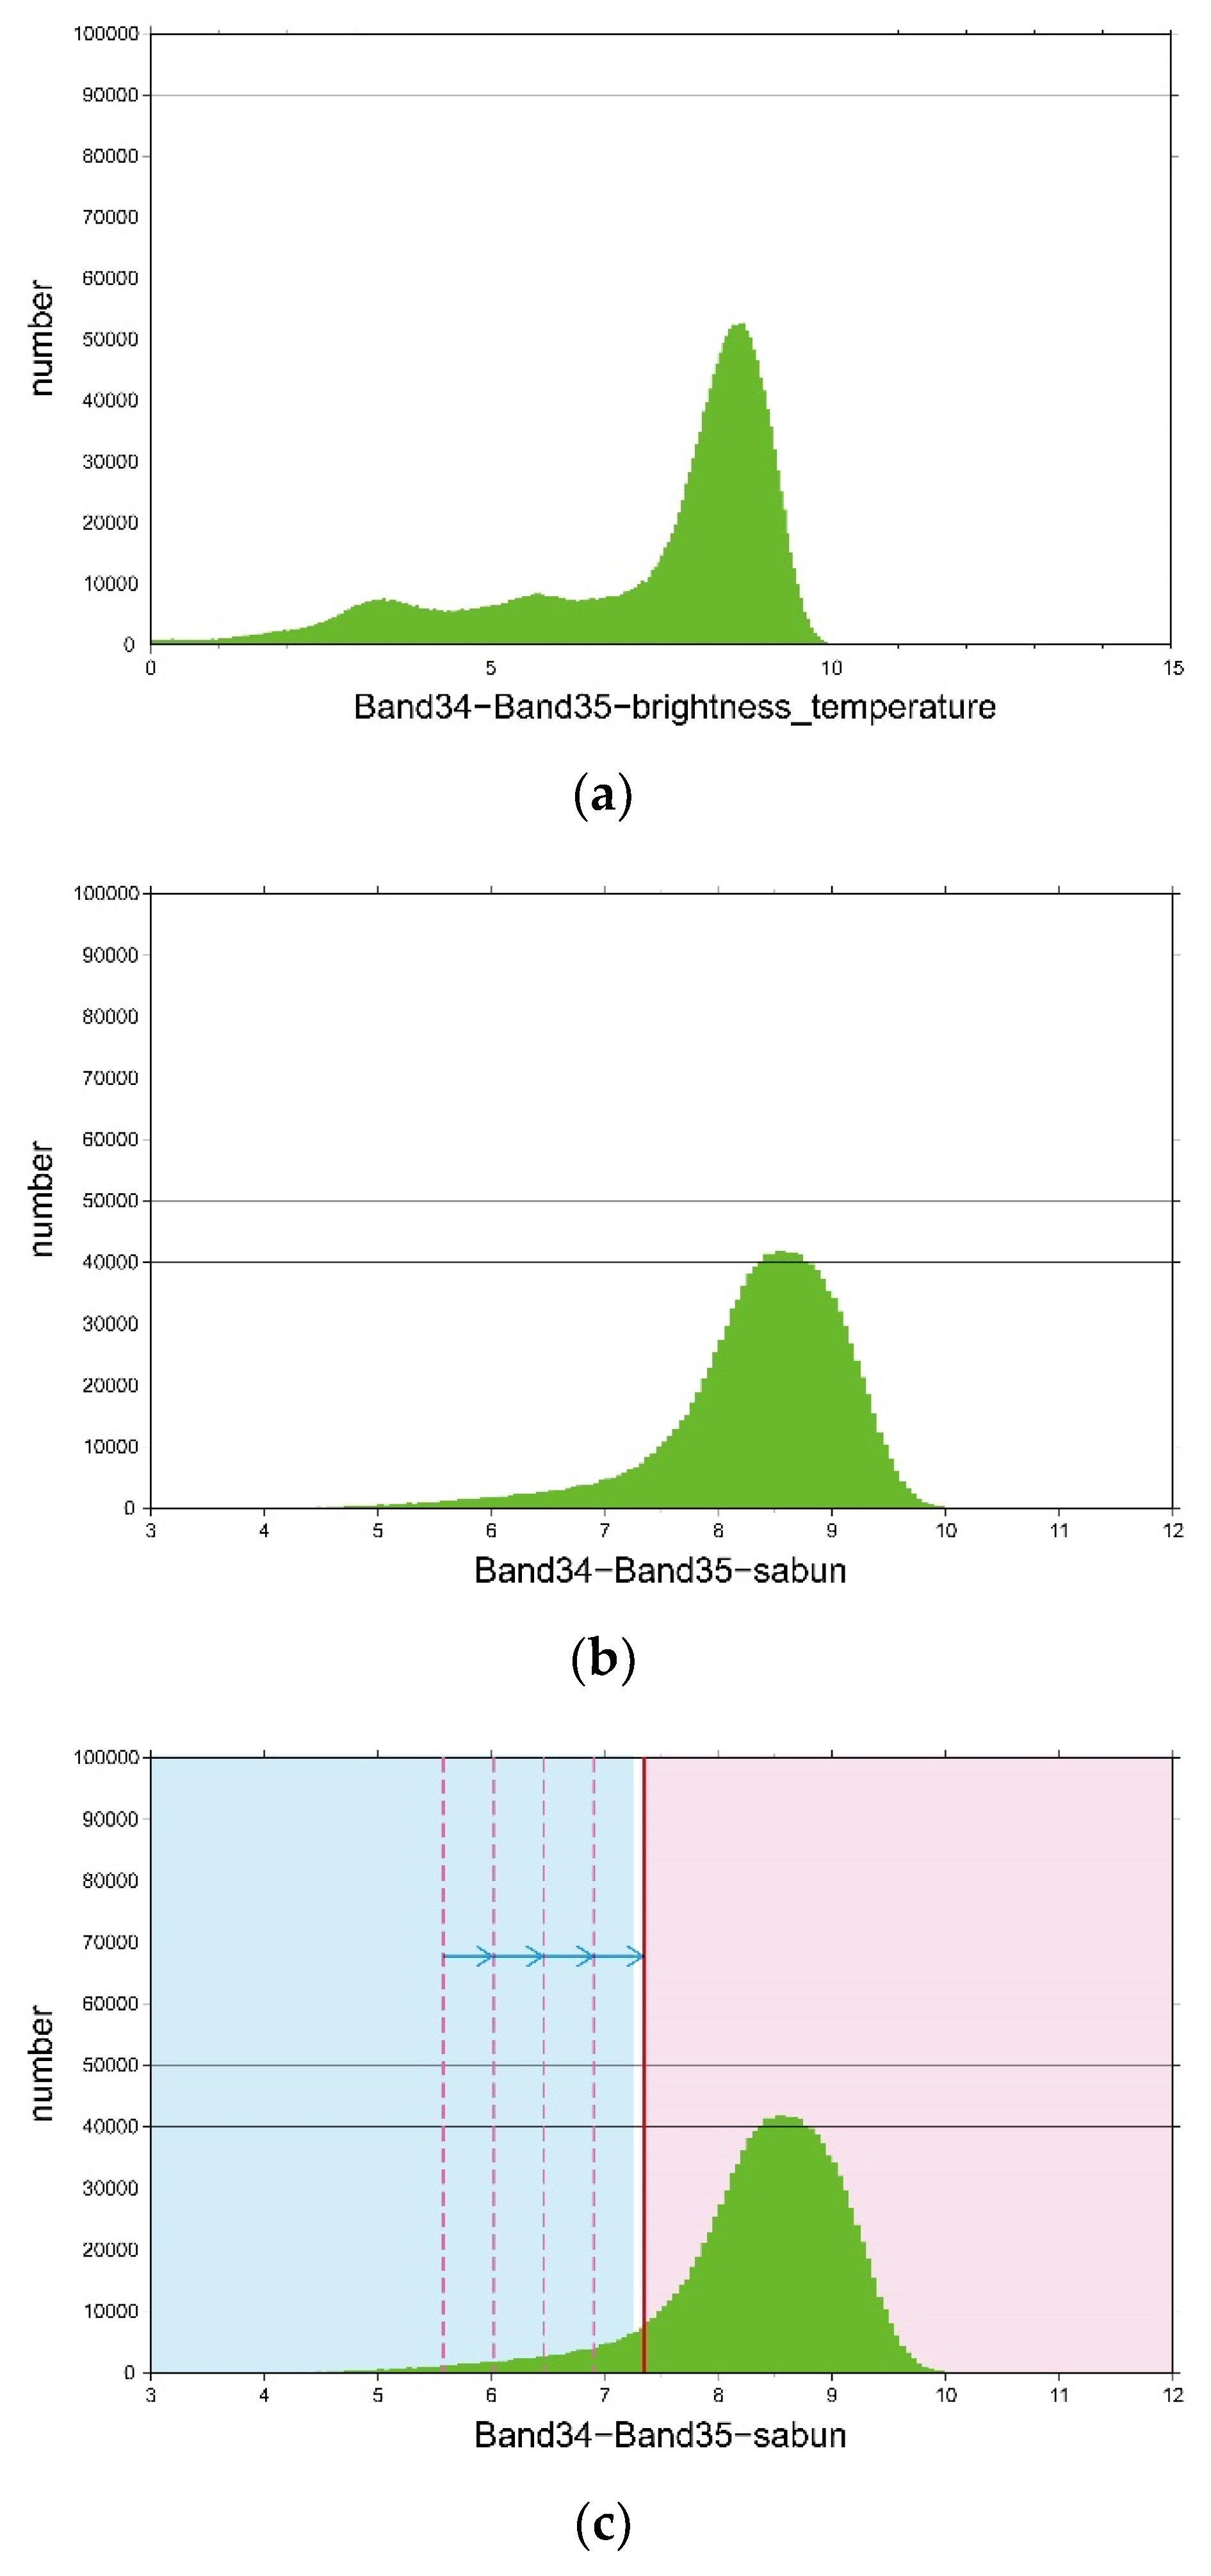
At first, we select the pixel whose brightness temperature of band 20 is higher than 260 K. Then, we calculate the temporal average µ and standard deviation σ of the BTDs for each month. All pixels whose distance from the mean value is larger than a prescribed value (µ + kσ) are rejected. As Test 2, BTD of band 34–band 35 is investigated. If the BTD is small, the pixel is likely a cloud. The BTD histogram is considered to be a mixture of many normal distributions.
Specifically, since the purpose of this study is to distinguish between the cloud region and the clear region, the pixels in which the brightness temperature of band 20 is less than 260 K are rejected as clouds in Test 1. A histogram is created using the pixels, the average value µ and standard deviation σ of the BTD is computed, and pixels that do not satisfy the following formula are rejected,
where k is the coefficient, which is determined by comparison with LiDAR data and described later. A new average value µ′ and standard deviation σ′ are calculated from the remaining data, and pixels that do not satisfy the formula are rejected. This procedure is repeated until there are no more pixels to be rejected, and the final remaining pixels are set as candidates for the clear sky area, and the next test is performed.
Figure 5 shows the results of cloud discrimination with Tests 1 and 2, as described in
Figure 4b. Pixels in the red colored area in
Figure 5c correspond to the clear region.
A similar cloud discrimination procedure is performed on the BTD
31–27 between bands 31 and 27, as Test 3.
Regarding the BTD
31–32 of bands 31 and 32, Test 4, the difference in this value corresponds to the amount of water vapor in the atmosphere, which is negative for lower clouds and smaller for thick upper clouds (cumulonimbus). This value becomes large when there is a thin upper cloud. Then, the criterion of the cloud is as follows;
where k is a coefficient, which is determined by comparison with LiDAR data.
As for Test 5 of BTD
20–31 between band 20 and band 31, lower clouds show negative values and upper clouds indicate higher values. Therefore, the definition of cloud pixel is
where k is a coefficient, which is determined by comparison with LiDAR data. In this test, we must pay attention to the result of Test 4 because BTD
31–32 (t) shows high values in the case of volcanic activity. Based on the evaluation by LiDAR in the following subsection, k values are experimentally given by 1.8, 2.2, 2.0 and 1.2 for Tests 2–5, respectively.
4.3. Evaluation of Cloud Discrimination by Ground LiDAR
In this study, MODIS nighttime values are used. Therefore, the evaluation of cloud discrimination described above cannot be performed using a satellite visible image. Therefore, we decide to verify using ground LiDAR data. In this study, we use LiDAR continuous observation data operated by NIES, Japan. The data are obtained through the website of AD-Net, Asian dust and aerosol lidar observation network, NIES, Japan [
37]. Details of the LiDAR network are given in [
34,
35]. Data from 1 January 2005 to 31 December 2008 are used. Since there was no LiDAR data available near the Shinmoedake volcano, we compare the LiDAR data and MODIS data over eight sites that are not directly related to the volcano: Sapporo, Niigata, Tsukuba, Tokyo, Toyama, Nagasaki, Matsue and Hedo, Japan. The map and the detailed locations are provided in
Figure 1 and
Table 2, respectively [
34,
37]. In this paper, the results at Tsukuba station in December are shown as examples.
Figure 6 shows the results of the comparison between cloud discrimination results of MODIS and LiDAR data at the LiDAR site. These figures are scatter plots in which the ordinate and abscissa represent the BTD values used for cloud discrimination, Tests 2–5. In figures, the red circle corresponds to the BTD value of the day when it is determined that there is no cloud by LiDAR, and the black-cross indicates the BTD value of the day when it is determined that there is a cloud by LiDAR. The area surrounded by the blue lines represents the area determined to be cloudless by the cloud discrimination based on the BTD method of MODIS data proposed in this paper. The blue lines in
Figure 6a,b are criteria for eliminating cloud pixels in this study. The green line in
Figure 6a is the threshold between cloud and clear in a previous study [
9]. The pixel with BTD between band 31 and band 32 is lower than the green line (green area) is identified and dismissed as a cloud pixel in the previous study [
9]. From
Figure 6, it can be seen that the proposed BTD method succeeds in clustering the cloud and non-cloud regions. It is also well understood that the previous cloud discrimination method using only bands 31 and 32 is not sufficient in Japan. It is safe to say that the proposed method is one of the possible ways to discriminate cloud pixels in nighttime data in the temperate zone area more accurately. We got similar results regarding the other LiDAR sites.
Actually, in order to set the threshold value that can more accurately distinguish the cloud area from the clear zone, the values of the parameter k in Equations (3)–(6) (Tests 2–5) are adjusted while comparing with the scatter charts as shown in
Figure 6. In this procedure, a different value of k is set at each LiDAR site, practically. In this paper, the average value of 8 sites is adopted as the value of k to be used at Shinmoedake. It can be said to be the representative over the Japan region.
4.4. Spatiotemporal Singularity
In order to obtain the temporal singularity of the evaluation function S obtained in equation (1), the singularity, deviation rate, δ is defined as follows,
where
is the average of
SFP over the analyzed period (9 years). In this study, we investigate the relationship between the spatiotemporal variation of δ and the volcanic activity accompanied by lava activity.
In comparison with other systems that also exploit MODIS data, it should be noted that the applied method is a single channel approach. In fact, the detection of the volcanic hotspots is only based on radiances acquired in the MIR spectral range (i.e., band 20 of MODIS sensor). Instead, the other systems, e.g., RST
VOLC, MODVOLC, MIROVA, HOTVOLC, HOTSAT and AVHotRR, use also radiances acquired in the TIR wavelength (i.e., band 31 and/or band 32), and they can be classified as dual channel approaches. In particular, some of these systems use the MIR and TIR radiances to compute differential indices (i.e., HOTSAT) and normalized differential indices (i.e., MODVOLC, MIROVA, HOTVOLC) on analyzed scene. Hence, volcanic hotspots are detected by means of fixed threshold tests and/or contextual approaches. Regarding the AVHotRR method, it uses data recorded in the MIR and TIR bands to resolve numeric simulations (e.g., dual-band techniques) for hotspot detection and effusion rate estimation. Instead, a different approach is used in the RST
VOLC method. In this method, multiyear homogenous time–series of satellite records are exploited to characterize (in terms of expected value and its historical variability) each location of the analyzed portion of the satellite scene. Volcanic anomalies are identified by means of a local variation index. In [
38], it is possible to find a detailed description of the systems as mentioned above and the other methods devoted to the detection of volcanic anomalies, as well as their historical review.
The Noguchi singularity method can be considered as a hybrid method. Volcanic anomalies are identified on the base of a multitemporal analysis of a spatial differential variable (i.e.,
SFP), which was computed as in a contextual approach (see
Section 4.1).
It worth noting that by using a statistical approach of homogenous long time-series (as in RSTVOLC), it is expected a reduction of the false alarms (e.g., possible anomalies due to site effects). Nevertheless, the results of the analysis could be influenced by the not correct discrimination of clouds (over the summit and/or the reference pixels), that lead to a wrong estimation of the SFP.
Finally, even if the false negatives can be observed due to the use of the radiances not atmospherically correct, here the TOA radiances are taken in account to avoid that, the use of the not appropriate atmospheric models (i.e., standard models) could generate a wrong estimation of the reflectance and consequent proliferation of anomalies independent from volcanic activity.
5. Results
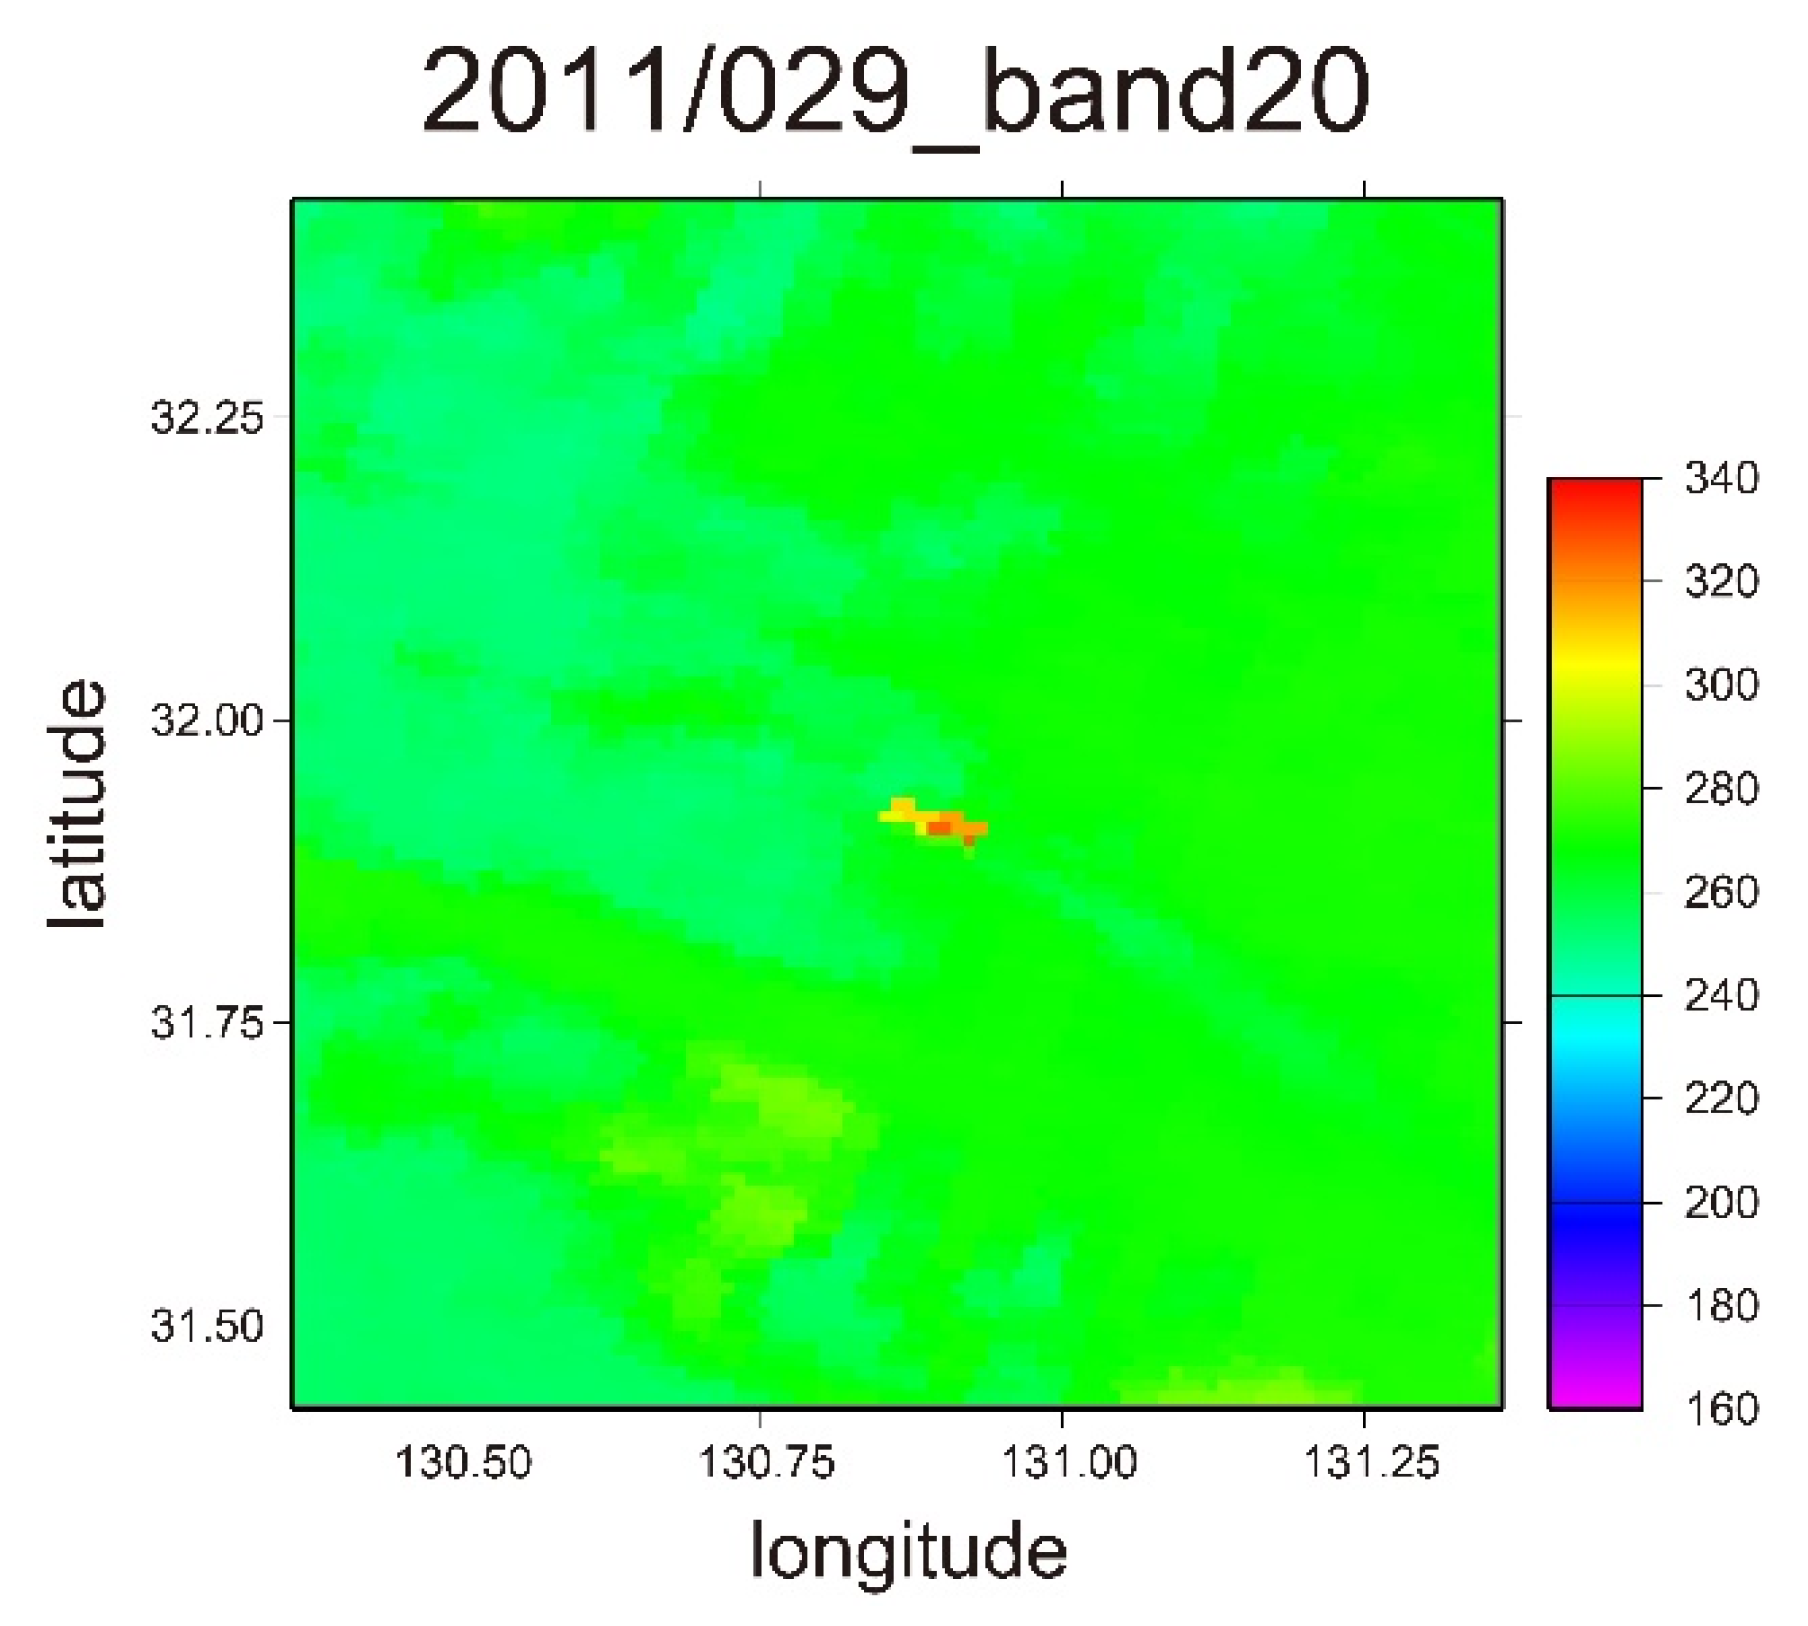
Figure 7 shows an example of the two-dimensional brightness temperature map of band 20 in the ±0.5° area centering on the summit crater of Shinmoedake, which was observed at UT (Universal Time) 17:10 on 29 January (LT (Local Time) 02:10 on 30 January), 2011. The brightness temperature is indicated by the color bar in figure. According to the report, lava effusion was confirmed in the crater lake on 27 January by SAR observation, and it had grown to a diameter of 500 m on 29 January [
27,
28,
29,
30,
31,
32,
33]. Moreover, hot volcanic products such as cinders were deposited in the southeast area from the crater. The hotspots in figure can be related to the volcanic activity of Shinmoedake. Therefore, we investigate the temporal changes of brightness temperature and singularity at each pixel.
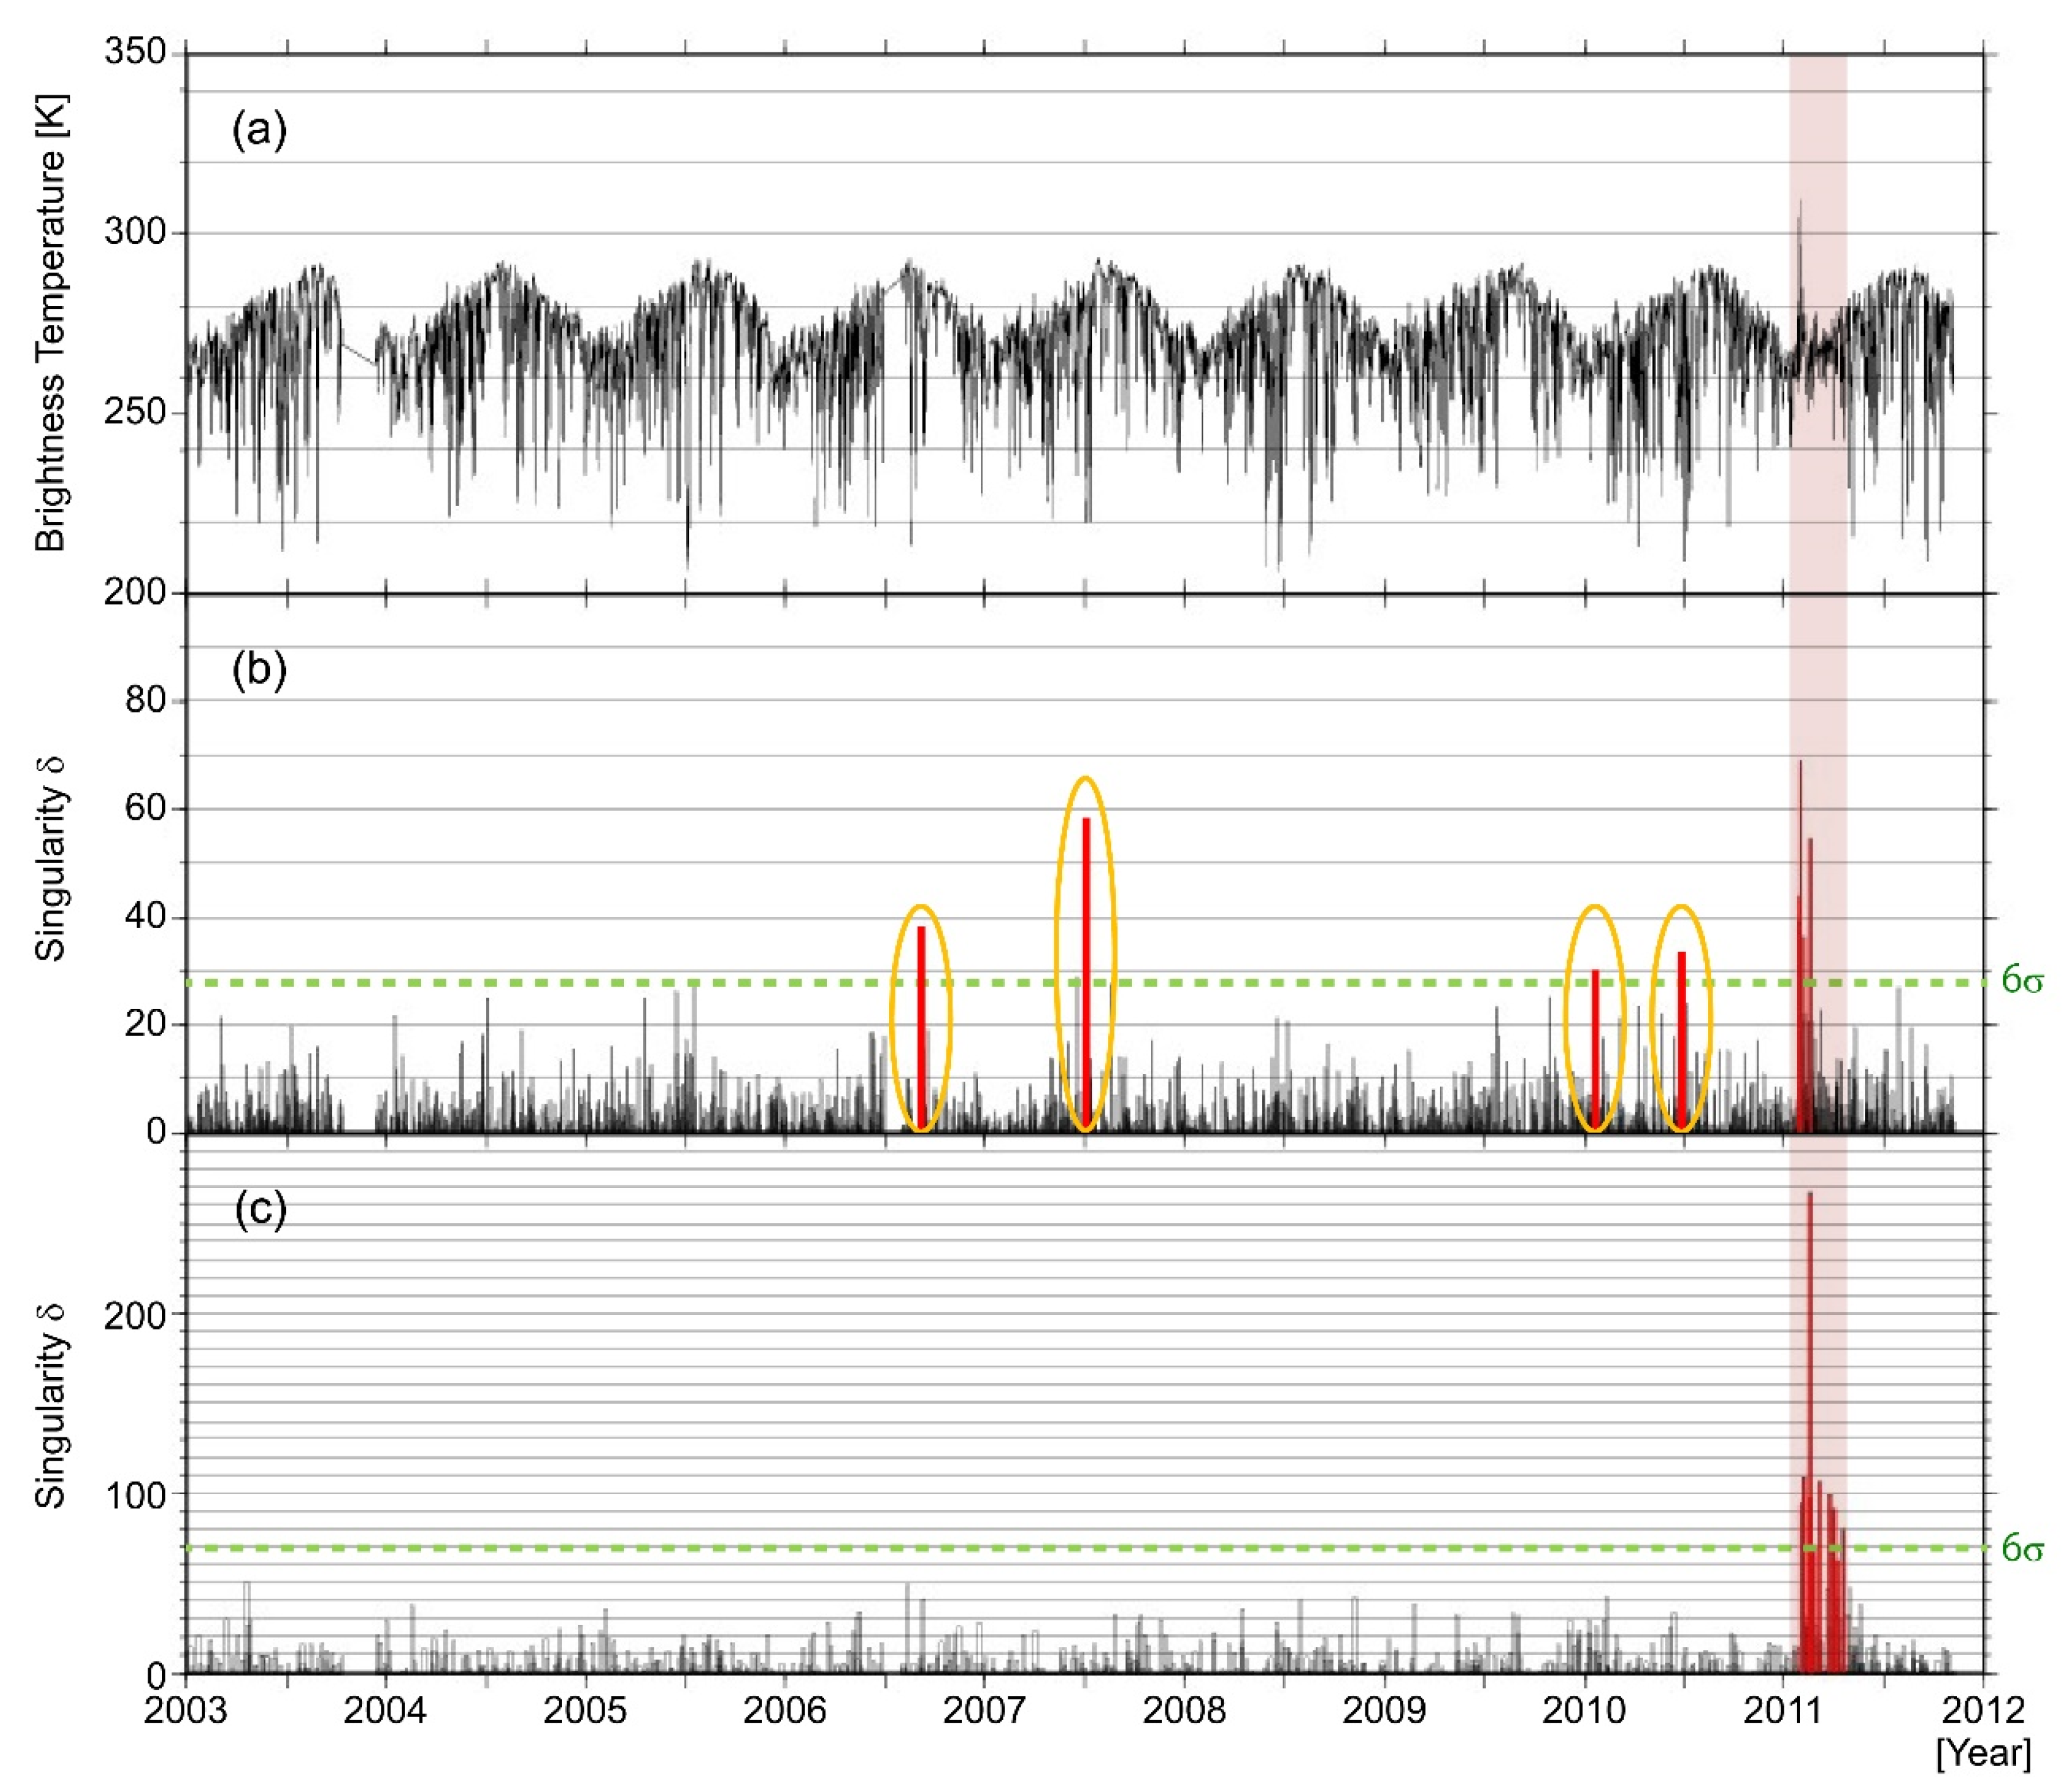
Figure 8 shows the temporal variations of brightness temperature and the singularity of S, δ, which provides a spatial difference of brightness temperature, at the summit of Shinmoedake, for all analyzed periods. In figure, the top panel (a) indicates the variation of brightness temperature of band 20, and the lower two panels (b, c) show the variation of δ. The panels (b, c) correspond to the result for the previous Noguchi method [
9] and the proposed method for cloud discrimination, respectively. In panels (b, c), anomalous δ is defined by the mean value of δ + 6 σ, which is given by a green line, and red vertical lines indicate the days when δ value exceeds the threshold. These anomalous days are concentrated in the volcanically highly active period, colored by pink in the panel (c). However, some anomalies are detected in volcanically inactive periods in the panel (b). These are errors caused by cloud pixels. It is highly suggestive that the new method can reduce faint changes due to clouds. From the distribution of singularity values over the analyzed period, the values in the case of the lava ejected to the surface are considerably large. These are confirmed through
Figure 8c and Figure 10a. The 6 σ threshold was also effective for monitoring volcanic activity with lava activity in Indonesia by the Noguchi method, which is the prototype in this study. In addition, even though there were spurious when the Noguchi method was applied to monitor Mt. Asama in Japan, the 6σ threshold seems to be useful because the activity with lava could successfully be detected [
9]. Taking account of these empirical facts, we have chosen the 6 σ threshold in this study.
6. Discussions
In
Figure 8c, the first specific anomaly was detected on 26 January. The maximum value is detected on 30 January. The second peak value is observed on 2 February. The remarkable singularity in d is continuously detected and terminates in March. This is the only period in which abnormal values appear at the summit (crater) over the analyzed nine years. The eruptive activity of Shinmoedake in 2011 began on 19 January and ended on 7 September. Considering from the records of GPS crustal deformation and earthquakes comprehensively, the 2011 activity of Shinmoedake shows that from around December 2009, magma supplied to a magma chamber about 6–10 km depth at several km northwest of Shinmoedake summit, and it is suggested that it erupted at Shinmoedake in 2011 [
27,
28,
29,
31,
32,
33,
39,
40,
41].
As for the lava effusion, the expansion beneath the summit of Shinmoedake was confirmed on 18 January 2011 from tiltmeter data [
27,
28,
29,
31,
32]. There was a small phreatomagmatic eruption at 1:27 on 19 January and a subplinian eruption on 26 January after a small eruption. The plume reached 3000–7000 m and at about 16:00 (LT), tiltmeter monitoring the magma chamber in the northwest of Shinmoedake recorded a fluctuation indicating underground contraction. A precursory fluctuation of tiltmeter showing expansion just under Shinmoedake was also recorded several hours before the subplinian eruption. In addition, satellite SAR image analysis confirmed the eruption of lava in the crater on 27 January (See
Figure A3 in
Appendix). On 28 January, Earthquake Research Institute, the University of Tokyo confirmed the appearance of lava with a diameter of several tens of meters in the crater. It is reported that the erupted lava expanded to a diameter of 500 m on 29 January and reached a diameter of 600 m in early February by aerial photos (See
Figure A1 in
Appendix). After that, there were no significant changes in the size and shape of the lava in the crater and the condition of ejecting fumarole gases around it [
27,
28,
29,
31,
32,
33,
39,
40,
41].
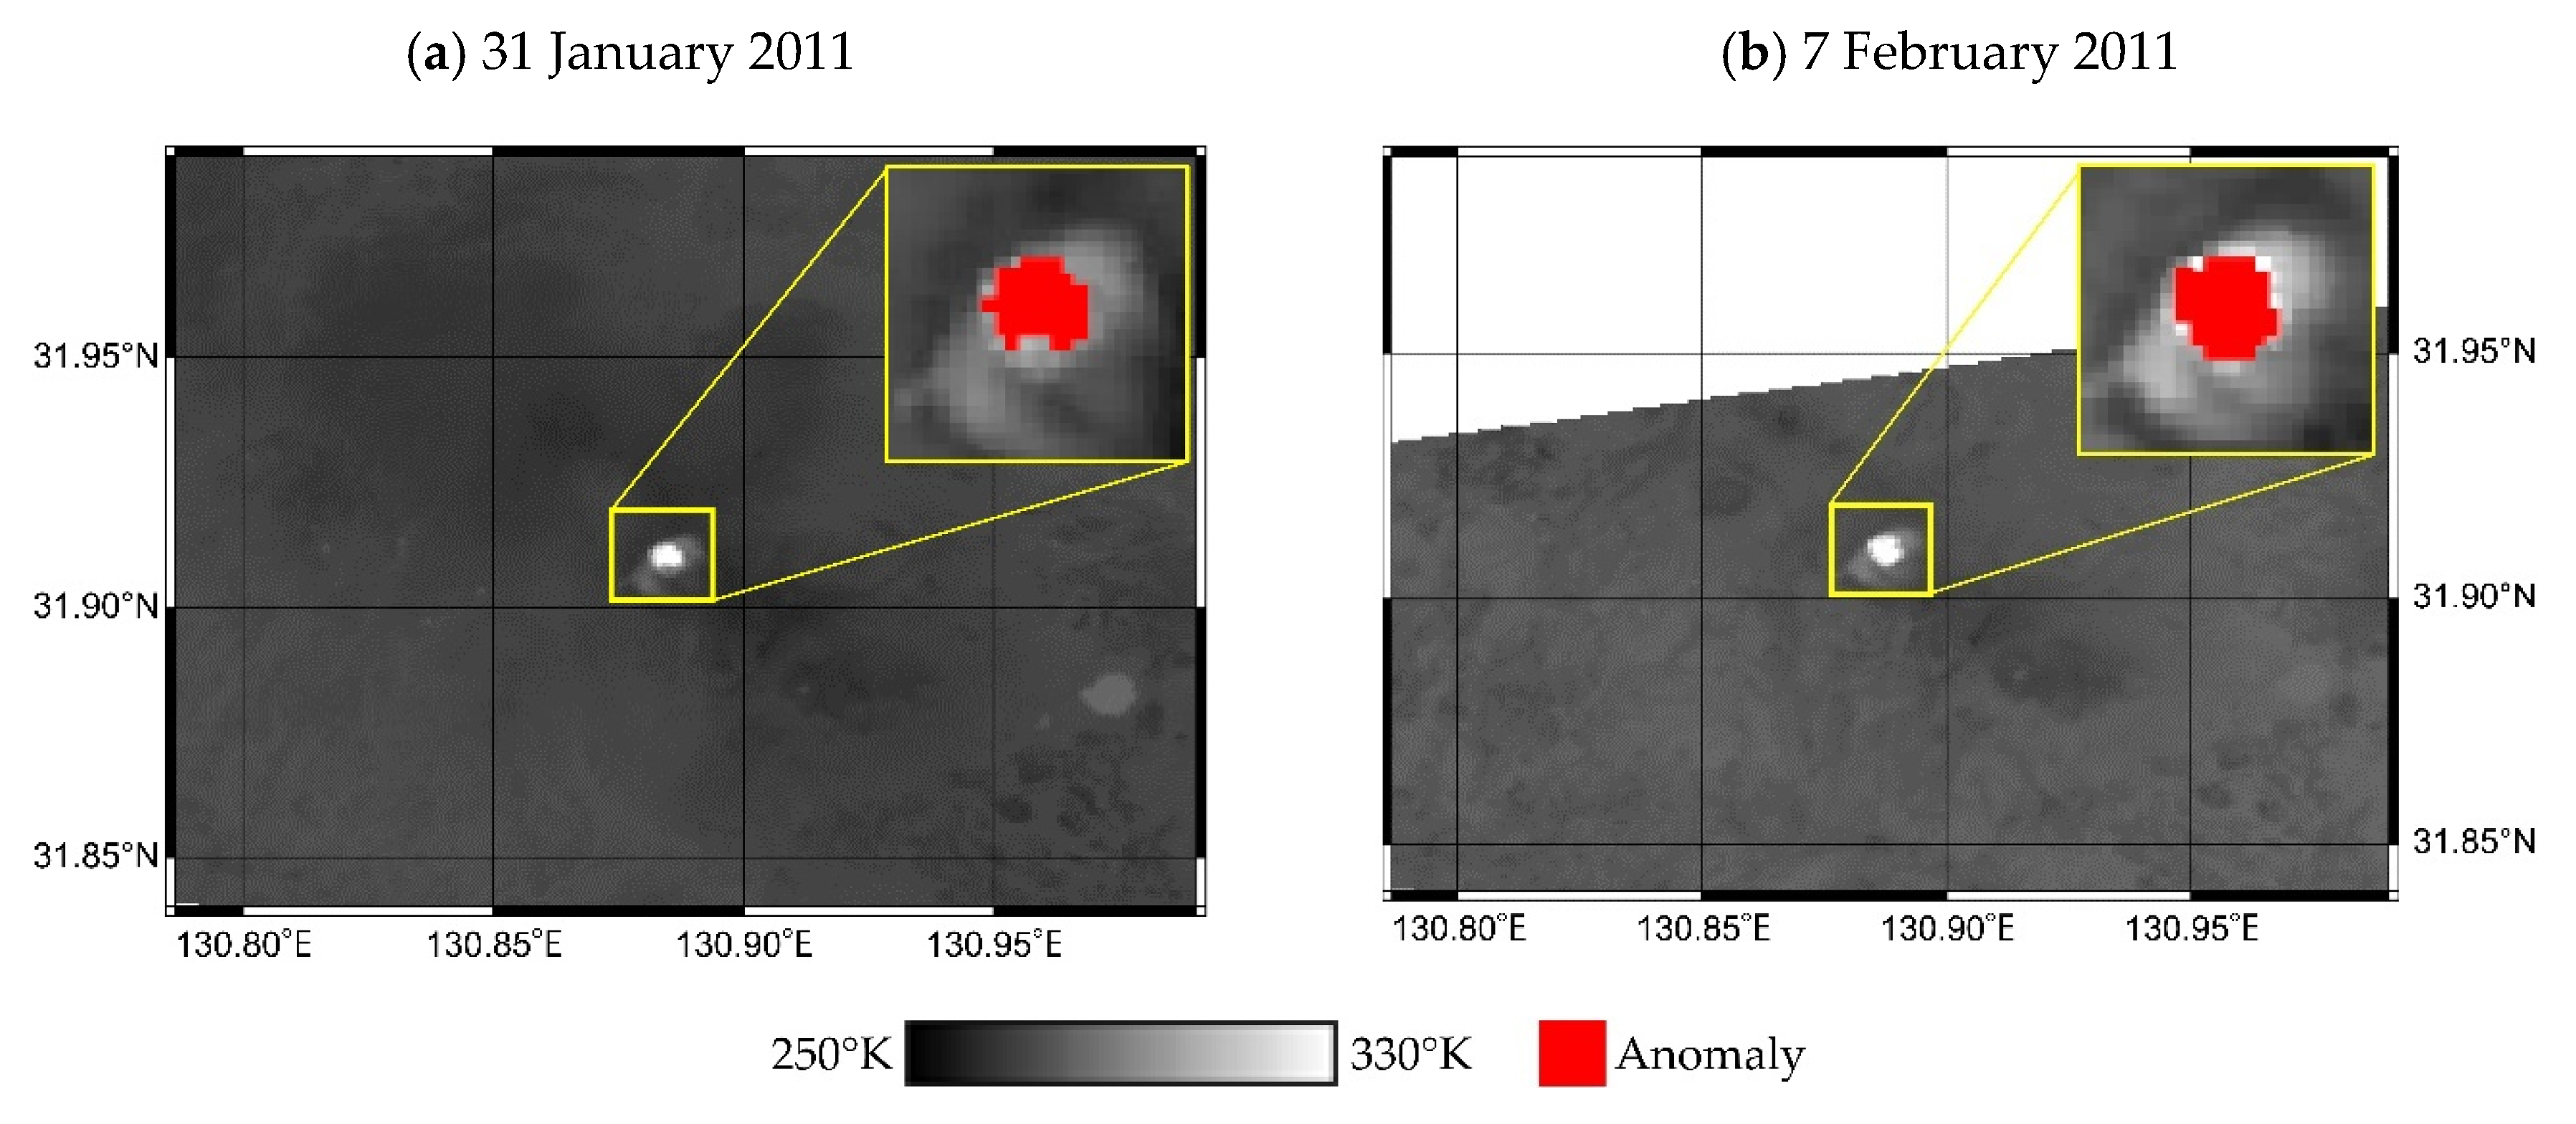
Moreover, preliminary results of the implementation of an RST-based [
42,
43] approach on ASTER TIR data also provide a certain certificate of the presence of lava in the summit crater of Shinmoedake.
Figure 9 shows anomalous values (i.e., pixels exceed three times higher than their historical variability) identified by ASTER scenes on 31 January and 7 February 2011.
According to the ground surface temperature distribution by aerial thermal infrared images (See
Figure A2 in
Appendix), the central part of the lava dome was very hot at the beginning of the magma eruption in January and early February [
27,
28,
29,
30,
31,
32,
33,
39,
40,
41]. However, when the supply from the underground stopped, the surface temperature of the lava gradually decreased. From March, the fumarole gases emitted from the center of the crater was only from the edge of the lava that filled the crater, and the relatively high temperature area was recorded only around the fumarole. Almost no hot part was detected in the crater in May, and surface temperature in the crater was below 50 °C in September [
28,
29].
Changes in lava size and temperature changes in the crater from aerial and satellite SAR observations strongly validate that our results are effective [
27,
28,
29,
30,
31,
32,
33]. In particular, aerial thermal infrared images and the formation of lava domes inside the crater are intermittent, but they suggest that the maximum heat release could be expected from the end of January to the beginning of February.
Earthquake, tilt and tephra data also indicate that magma supply into the crater from the underground is from around 28 January and terminated in early February [
27,
28,
29,
39,
40,
41]. Therefore, it is expected that the surface temperature of lava in the crater will gradually decrease thereafter and become undetectable in May.
Marchese et al. reported the eruptive activity of Shinmoedake on 26–27 January 2011 using sunflower MTSAT-2 [
44]. They report an increase in sensitivity at 3.5–4.0 µm on days 26 and 27 using the RST
VOLC algorithm [
3,
8,
10]. The singularity in
Figure 8 also took an abnormally large value for the first time on 26 January. Therefore, we compare the results of applying the RST
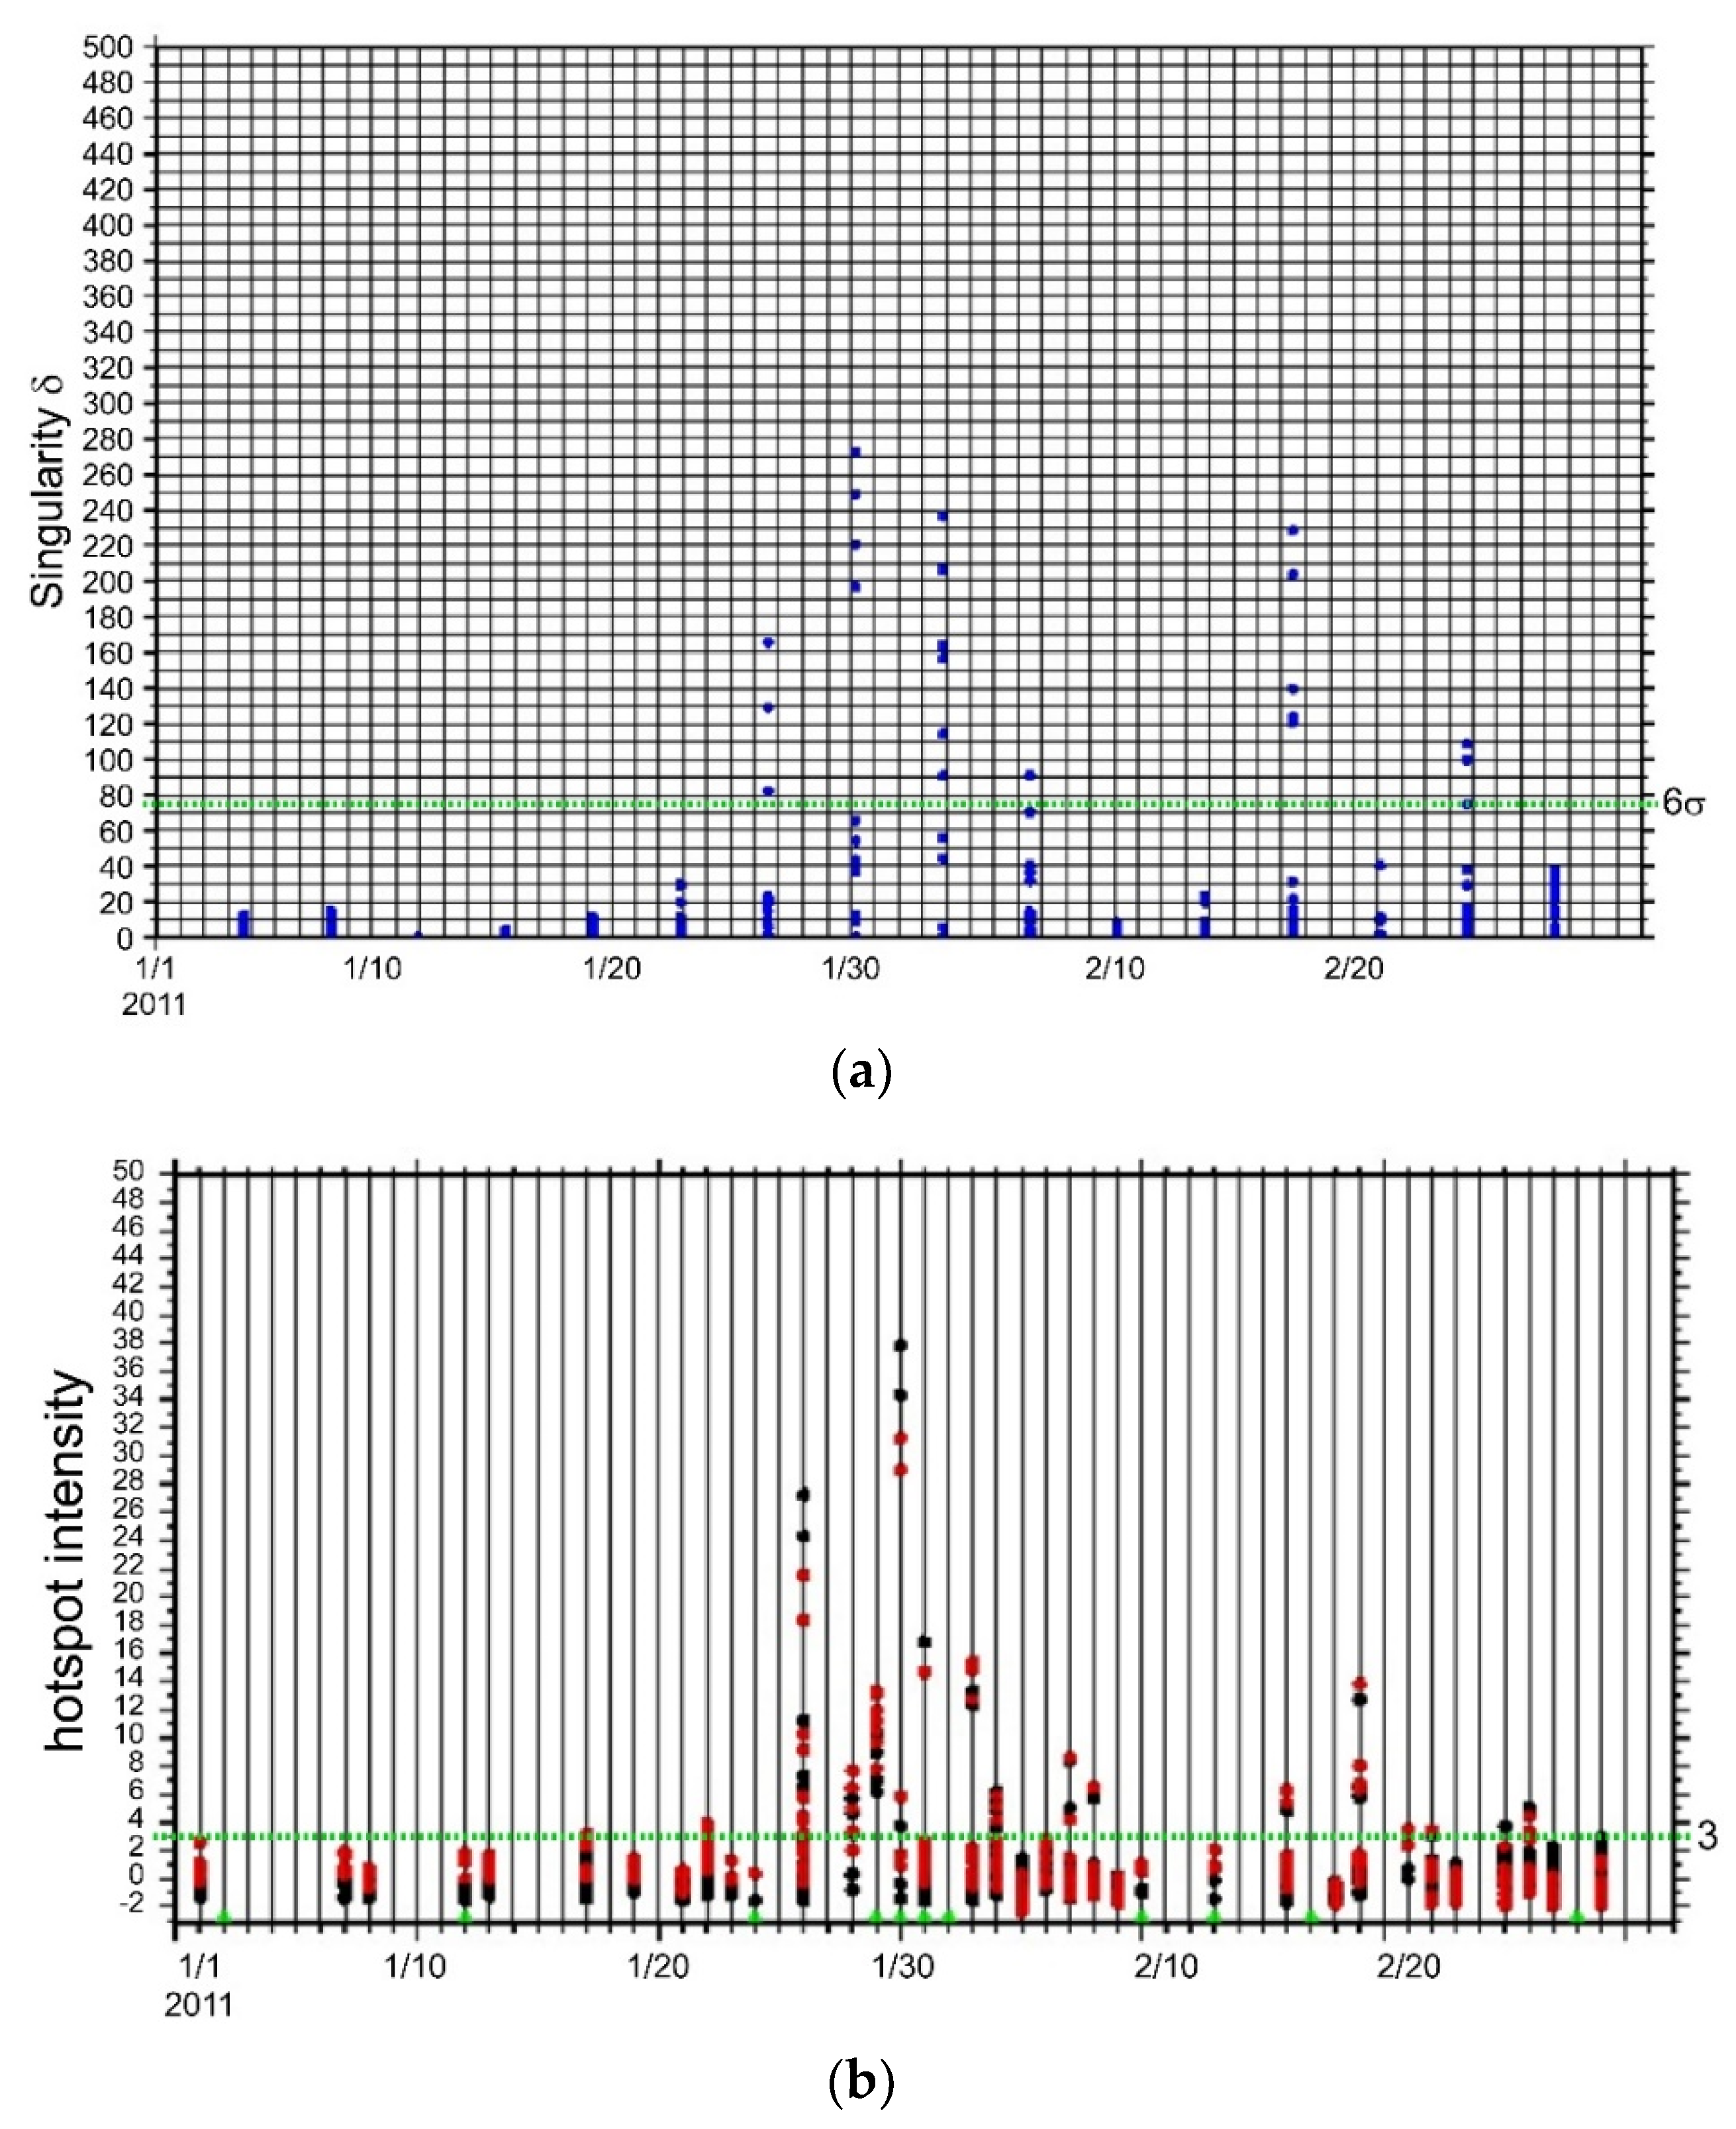
VOLC algorithm and the singularity algorithm proposed in this study to the MODIS data for the 2011 Shinmoedake volcanic activity. Here, since it is difficult to evaluate with only the summit pixel, it is difficult to evaluate, we use nine pixels near the summit (a total of nine pixels: the summit pixel + eight surrounding pixels). The results are shown in
Figure 10.
Figure 10a shows the temporal change of singularity proposed in this study (blue dot). Anomalous value in singularity near the summit is defined by greater than about 80 (See
Figure 8c).
Figure 10b indicates the variations of RST
VOLC calculated in the mid-infrared and thermal infrared bands (red dot) and that computed in the mid-infrared bands (black dot). The green symbol on the axis is the day when the area near the summit was covered with clouds and RST
VOLC could not be calculated. When the pixel has RST
VOLC values of greater than 3, that is both red and black dots exceed 3, the pixel is determined as the volcanic hotspot. You can see that the trends among these figures are mostly the same. That is, the first abnormal increase was recognized on 26 January, and the maximum increase was 30 January. Moreover, also, large values were found to be concentrated from 26 January to early February and the middle of February in UT.
To compare two methods, the method using singularity that we propose simplifies the concept of RSTVOLC in space and makes it complicated in cloud discrimination. It is important that the brightness temperature anomaly was detected near the crater on 26 January by two independent methods. It was one day before the eruption of lava at the crater confirmed by the SAR image on 27 January. This abnormal rise has also been confirmed by temperature analysis using Japanese MTSAT. A small eruption occurred at 1:19 on 26 January (LT) and at 14:49 (LT), the momentum of the volcanic plume increased and indicating a subplinian event. From around 16:00, inclinometer fluctuations indicating the contraction of magma chambers were recorded. There occurred three subplinian eruptions until 27 January (LT). Considering these facts, it can be said that it probably suggests that the magma effusion had started on the crater surface in the early morning of the 26 (around 01:00 LT), or that the precursor of magma effusion was detected.
In addition, the supply of magma to the crater from inclinometers, seismic records, and aerial observations is thought to have stopped in early February. From the aerial infrared photograph, the maximum period of heat from the crater is considered to be from the end of January to the beginning of February. This is consistent with the period of remarkable singularity. A dimple was confirmed in the center of the crater on 18 February, and it may be associated with increased thermal infrared activity in the middle of February. These results show the effectiveness of satellite infrared data for monitoring and predicting lava activity in volcanic lava activity.
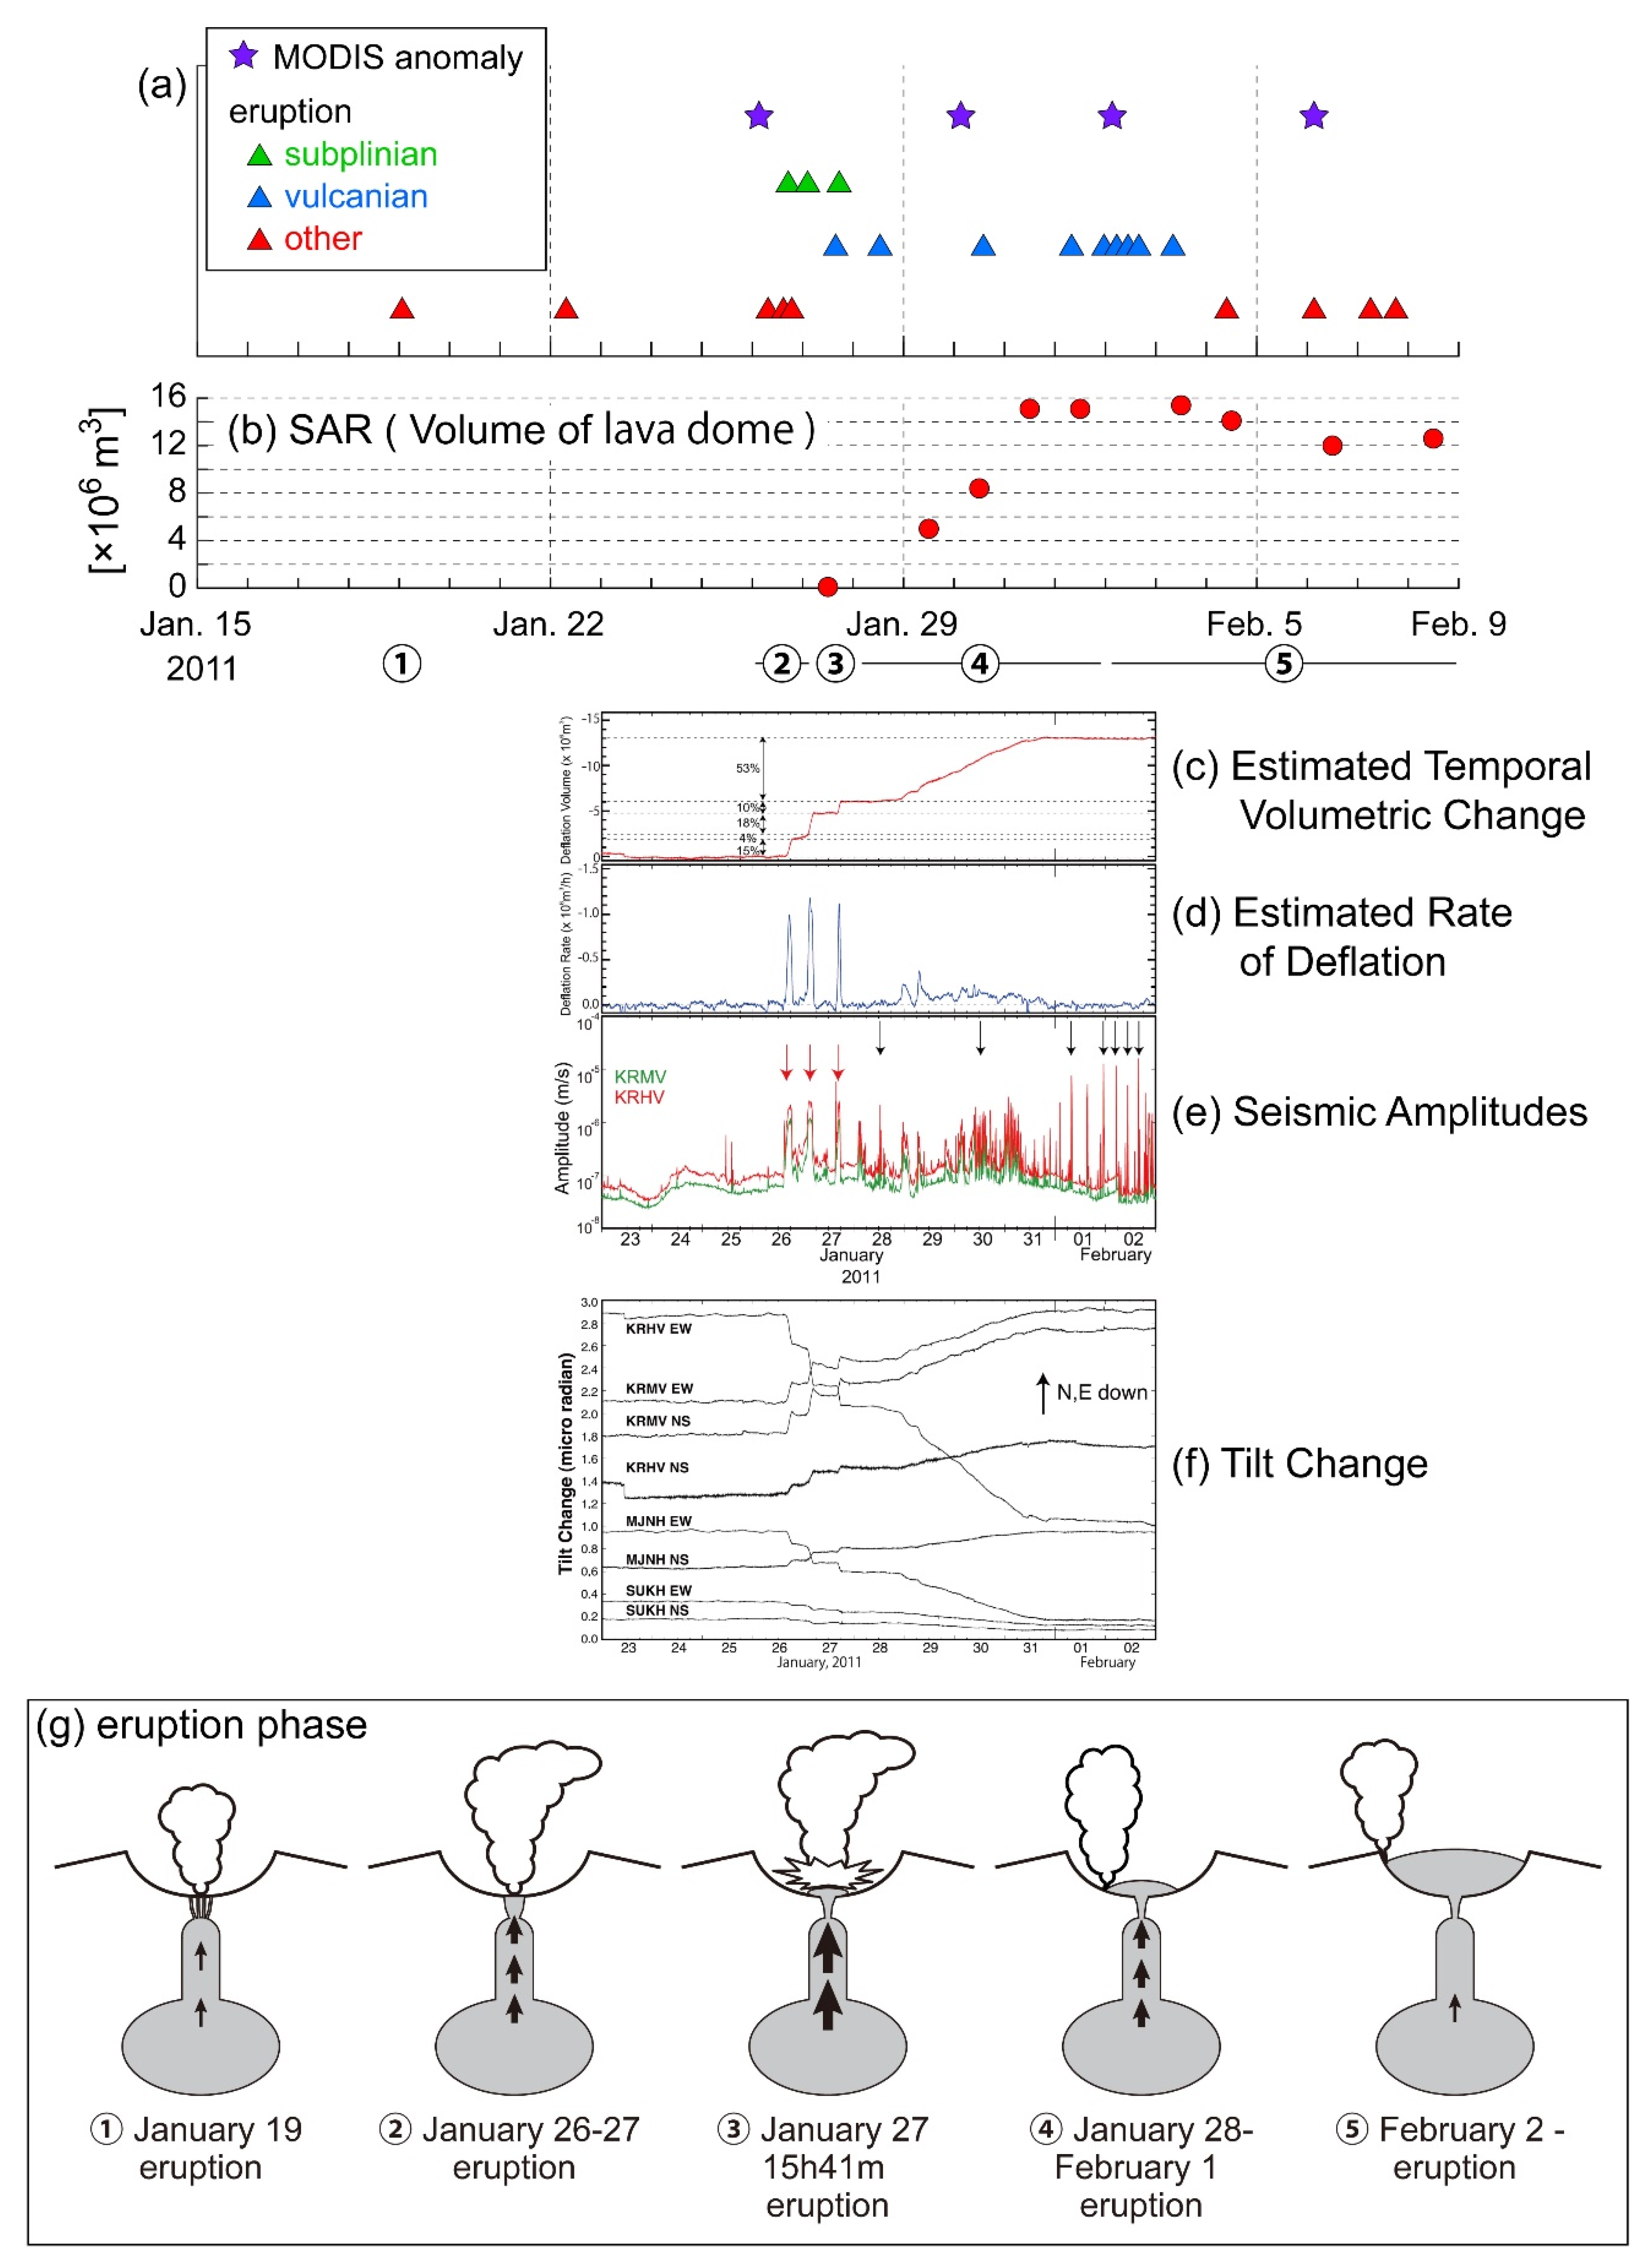
Figure 11 shows a compilation of various data on the activity of Shinmoedake from January to February 2011. (a) shows the timing when the MODIS anomaly appeared and the timing when the eruption occurred [
27,
28,
29]; (b) temporal change of lava dome volume obtained from satellite SAR image analysis [
30,
32]; (c) erupted lava volume estimated from tiltmeter data indicated in panel (f) [
31]; (d) deflation rate of lava [
31]; (e) variation of 10 min average value of the amplitude of seismometer [
31]; (f) tiltmeter data near the Shinmoedake [
31] and (g) schematic view of lava activity of the 2011 Shinmoedake activity [
27,
28,
29,
30,
31,
32,
33].
From the inclinometer and GPS deformation data, magma was supplied to the main magma reservoir about 10 km northwest of Shinmoedake and 6–8 km underground. In January 2011, it moved to a magma chamber right below the crater of Shinmoedake, and the first phreatomagmatic explosion occurred on 19 January (LT). A petrological investigation confirmed that the first phreatomagmatic explosion on 19 January involved fresh magma. Supply of magma into the secondary chamber just below the crater continues, which leads to phreatomagmatic eruptions on 26–27 January and a sub-Plinian eruption on 27 January in LT. The satellite SAR image confirmed the lava effusion into the crater on 27 January and by eyes onboard aircraft on 28 January. Based on the tiltmeter and satellite SAR data, lava effusion into the crater went on through three sub-Plinian eruptions and the following continuous eruptions from 28 January to around 1 February. Then, the original crater was filled by lava. Based on the tiltmeter and satellite SAR data, lava effusion into the crater went on through three sub-Plinian eruptions and the following continuous eruptions from 28 January to around 1 February. Then, the original crater was filled by lava. MODIS images provide the first brightness temperature anomaly on 26 January, when was the before the first sub-Plinian eruption.
Since the erupted magma was gradually and slowly ascending from the deep magma chamber toward the crater in the conduit, it is considered that there are no apparent precursory changes in mechanical parameters regarding the 2011 Shinmoedake activity (small imminent precursory changes were registered just before the sub-Plinian eruptions eruption). In such a situation, it is quite difficult to use tiltmeters and microearthquakes to predict volcanic eruptions. However, satellite infrared observation may have the advantage of capturing thermal anomaly because magma heat is likely to be easily transferred to the surface from the magma body under the ground if a volcanic vent (conduit) is established. Infrared monitoring from satellites, in addition to ground-based mechanical sensors, is likely to be useful for monitoring and forecasting the volcanic eruption related to lava activity.
7. Conclusions
We proposed a cloud discrimination method applicable in Japan using MODIS nighttime data, monitored the singularity of the spatiotemporal correlation of surface temperature anomalies and investigated the possibility of detecting and monitoring lava activity in Shinmoedake. With the aim to detect lava eruption activity in 2011, nine years of data from 2003 to 2011 were analyzed. As a result, the first anomalous singularity in brightness temperature was detected on 26 January 2011. Moreover, the maximum value was detected on 30 January 2011 and the values showed larger ones until early February 2011. When the anomalous singularity appeared was the only period with the magma-related volcanic activity for Shinmoedake over the analyzed period of nine years.
Comparing comprehensively with satellite SAR images, aerial infrared images, photos of lava dome photo in the crater, tiltmeter data, seismograph data, etc., the period of large singularity values is consistent with the active period of lava effusion at the crater. In addition, the magnitude of specificity corresponds to the surface temperature of the crater. There is no contradiction that the anomaly in singularity disappears as the surface cools after February 2011.
The above facts indicate the effectiveness of the proposed singularity method to monitor the lava activity for Shinmoedake. Therefore, it is concluded that if cloud discrimination is realized with high accuracy, no spurious changes will come to arise, and no false detection of hotspot will be given.
In the future, it is necessary to apply this method to other volcanoes in the temperate zone and investigate its universal effectiveness. It is also necessary to develop applications such as volcanic monitoring in cold latitudes where snow and ice are covered.
In order to understand eruptive precursors and eruptive dynamics of volcanoes, analysis of the integration of multiparametric data observed in space and on the ground can be required. Continuous monitoring with high sampling by satellite also helps better monitor volcanic hazards. Since MODIS has a problem with the regression rate and its time resolution is not proper, it is necessary to develop an algorithm using meteorological satellites such as MTSAT (HIMAWARI-8/9) in this sense. Since thermal infrared rays are affected by clouds, it is also essential to develop a method based on microwaves.


