Population Characteristics of Loess Gully System in the Loess Plateau of China


1
Key Laboratory of Virtual Geographic Environment (Nanjing Normal University), Ministry of Education, Nanjing 210023, China
2
State Key Laboratory Cultivation Base of Geographical Environment Evolution (Jiangsu Province), Nanjing 210023, China
3
School of Geography, Nanjing Normal University, Nanjing 210023, China
4
Jiangsu Center for Collaborative Innovation in Geographical Information Resource Development and Application, Nanjing 210023, China
5
Suide Station for Soil and Water Conservation Research, Management Committee of Yellow River Water Conservancy, Yulin 719000, China
6
Department of Geoinformatics–Z_GIS, University of Salzburg, Salzburg 5020, Austria
*
Author to whom correspondence should be addressed.
Remote Sens. 2020, 12(16), 2639; https://0-doi-org.brum.beds.ac.uk/10.3390/rs12162639
Submission received: 20 July 2020
/
Revised: 9 August 2020
/
Accepted: 14 August 2020
/
Published: 15 August 2020
(This article belongs to the Special Issue Monitoring and Modelling of Gully Erosion Using Remote Sensing Data and Spatial Modelling)
Abstract
:Gullies in the Loess Plateau of China vary in developmental stages and morphologic sizes. In this case study, in Linjialian watershed in the loess hilly region, we introduced some perspectives from population ecology to explore the population characteristics of the loess gully system. Different types of gullies were extracted based on the digital elevation model and imagery data. Population analysis was then carried out from three aspects, namely, quantity, structure, and distribution. Results showed that in terms of the quantity, hillslope ephemeral gullies (187 numbers/km2 in number density) and bank gullies (8.3 km/km2 in length density) are the most active gullies in this area with an exponential growth trend, and the hillslope ephemeral gully is the dominant type. Along with age structure analysis, the pyramid-shaped age structure indicated that the gully system is at its early or middle stages of development. The spatial distribution of hillslope ephemeral gullies has a clear aspect asymmetry pattern, and the bank gully distribution is symmetrical. A hierarchical structure (hillslope ephemeral gully–bank gully–valley gully in upslope–shoulder line–bottom area) in an elevation distribution is presented. These preliminary results are helpful for further understanding the organized, systematic development, and evolution of the gully system.

1. Introduction
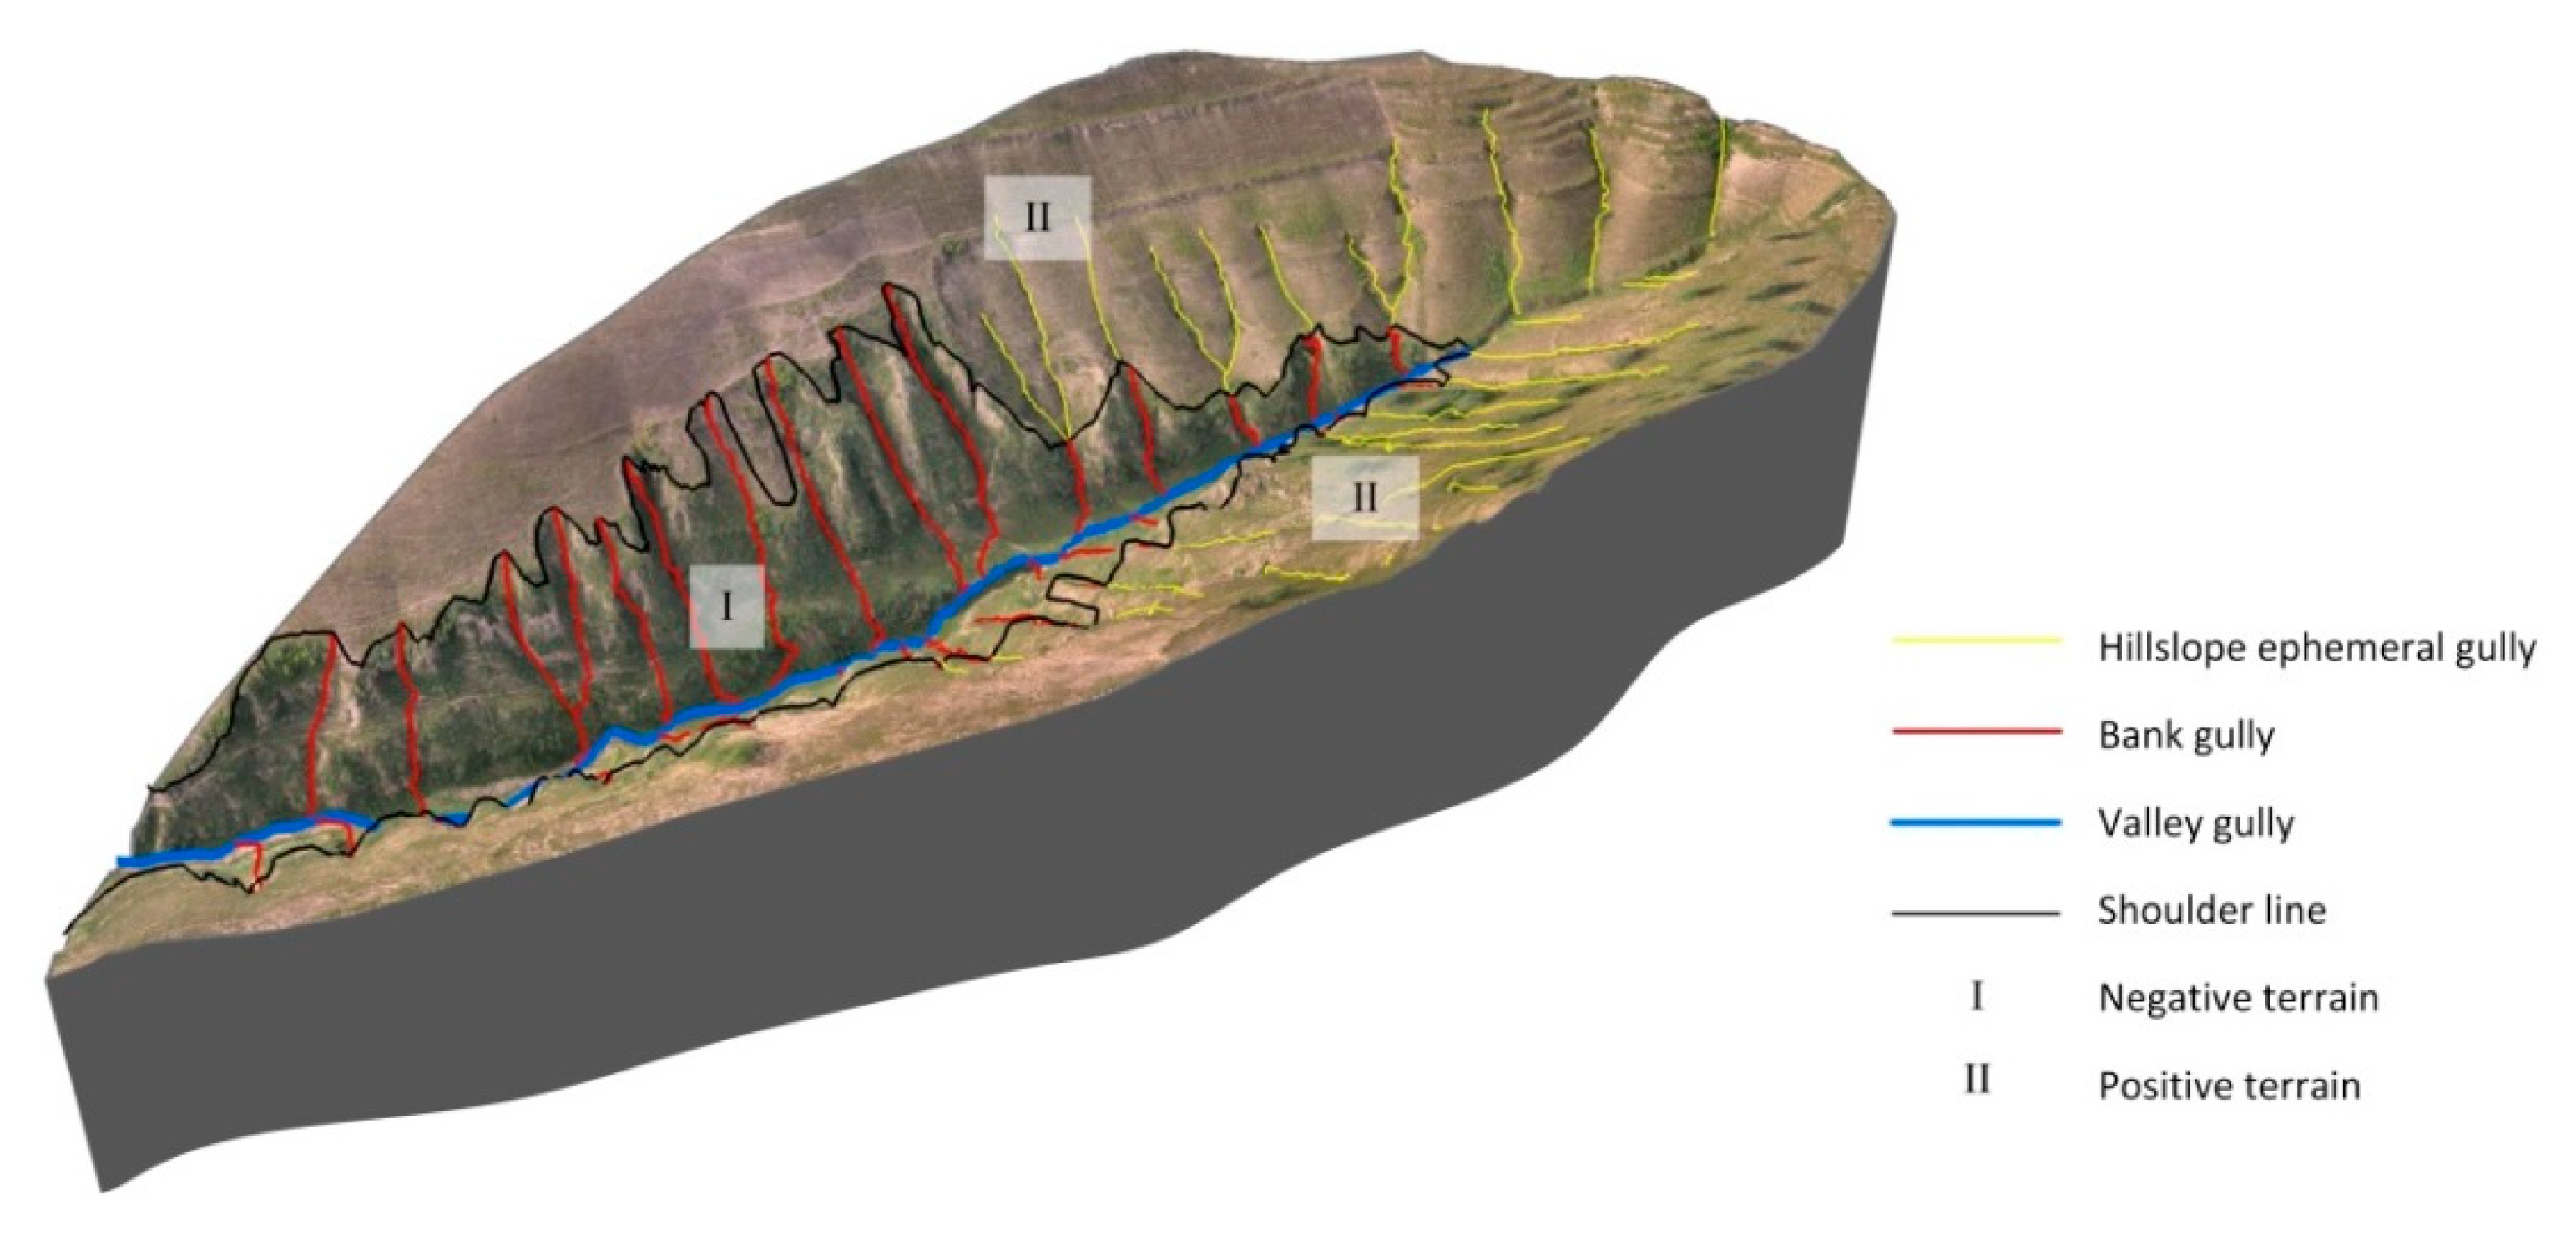
Numerous gullies developed in the Loess Plateau of China caused serious soil erosion, land degradation, and ecosystem instability [1,2,3]. Generally, gullies in the Loess Plateau of China can be classified into ephemeral gully (including rill and hillslope ephemeral gully) and permanent gully (including bank gully and valley gully), in accordance with their developmental stage and morphologic scale [4,5,6,7]. The sequence of these different types of gullies comprises a gully system with internal connection and interaction in a drainage area (Figure 1).
Previous studies of loess gullies always considered a gully network a river (stream) network, and group properties of rivers (streams) were explored. Horton (1932) proposed quantitative indices to express the composition of the stream system of a certain drainage basin [8]. These indices include the stream order, drainage density, bifurcation ratio, and stream–length ratio. Subsequent studies followed and developed Horton’s theory [9,10]. These works classified the river network into several levels, namely, stream order, in accordance with different principles, such as Horton [9], Strahler [11], Shreve [12], and Scheidagger [13]. These works provided ideas for the quantitative analysis of the loess gully system.
In the loess gully system, Horton’s theory was first introduced by Cheng and Jiang (1986) [14], and the gullies (or streams) were divided into several levels in accordance with their converging relationship. Therefore, the characteristics of a gully or river system mainly described confluence structure and relationship between streams, indicating one aspect of a gully (or river) system. In addition to hydrological studies on the loess gully system, some works attempted to consider other perspectives. Some quantitative methods were proposed to describe the systematic features of a gully system, such as stream information entropy based on confluence points of a gully network [15] and fractal properties [16]. However, they still did not break out from the hydrologic framework of converging relationships. Although some studies on one type of specific gully, such as rill, ephemeral gully, or bank gully, have obtained abundant achievements [17,18,19,20,21], the systematic knowledge of the composition and spatial pattern of the gully system is still far from being well understood.
In a watershed, different gullies develop with different developmental stages and scales and form a complex gully system. Therefore, the characteristics of a loess gully system on the aspect of morphology, composition, and distribution are greatly important for soil erosion [22,23] and geomorphology studies [24,25]. The different types of gully in an organized gully system occupy certain quantitative proportions, distributed in different locations, and shared a convergence relationship under a certain environment. Like river networks [26], Sidorchuk (2006) [27] also reported “the process of gully system at the active stage shows the characteristics of a self-organizing system that is close to crisis”. This finding indicates some intrinsic attributes of the gully system. For example, different types of gullies with different developmental stages and scales indicate the “age structure” of the gully system. The evolution of different gullies shows the “succession.” These intrinsic attributes are similar to population ecology theory proposed by Odum (1959) [28]. The evolution of the gully system from the hillslope ephemeral gully to bank gully then valley gully could be regarded as the different age classes in a specie (gully) population. The population characteristics such as age structure and dominance can reflect the population development. Inspired by this finding, the present work attempts to analyze the population characteristic of group gullies on the basis of population ecology theory. We do not regard the gully system as a biological population, but only introduce the methodology of population ecology theory. The main objectives of this study are: (1) to explore the possibility of introducing population ecology into loess landform studies; (2) to discover some systematic and intrinsic attributes of landform development of the loess gully system.
2. Materials and Methods
2.1. Gully System in the Loess Plateau of China
A typical loess gully system consists of a rill, ephemeral gully, bank gully, and valley gully (Table 1). Table 1 shows the description of each gully type according to an overview of previous studies. The four types of gullies represent different gully developmental stages according to the duration of gully formation and size of gully scale. They could be regarded as a sequence of gully developments from initial to young, mature, and well developed. However, rill is excluded from the analysis, because it could neither be identified in high-resolution satellite images, given its small size in width and depth, nor does it present a permanent morphology, it could be easily erased by normal cultivation. The depth and width of a hillslope ephemeral gully are much greater than those of rills and could be identified in the multitemporal high-resolution satellite images [29,30,31]. Since the project “Grain to Green” (returning farmland to forest or grassland) officially started from the year 1999, the hillslope ephemeral gullies in steep slope areas (the surface slopes are greater than 25°) maintained the nature and developed continuously. The bank gully is usually developed rapidly with a short–deep morphology and regarded as the most important and active source for the generation of sediment yield and the main threat to upland areas [32,33,34]. The valley gully is well developed and usually located at the bottom channel of the watershed, which can be divided into several levels based on the convergence [35,36]. These gullies form various scales (50–2000 m in length and 30–200 m in width) and represent different developmental stages.
2.2. Study Area and Data
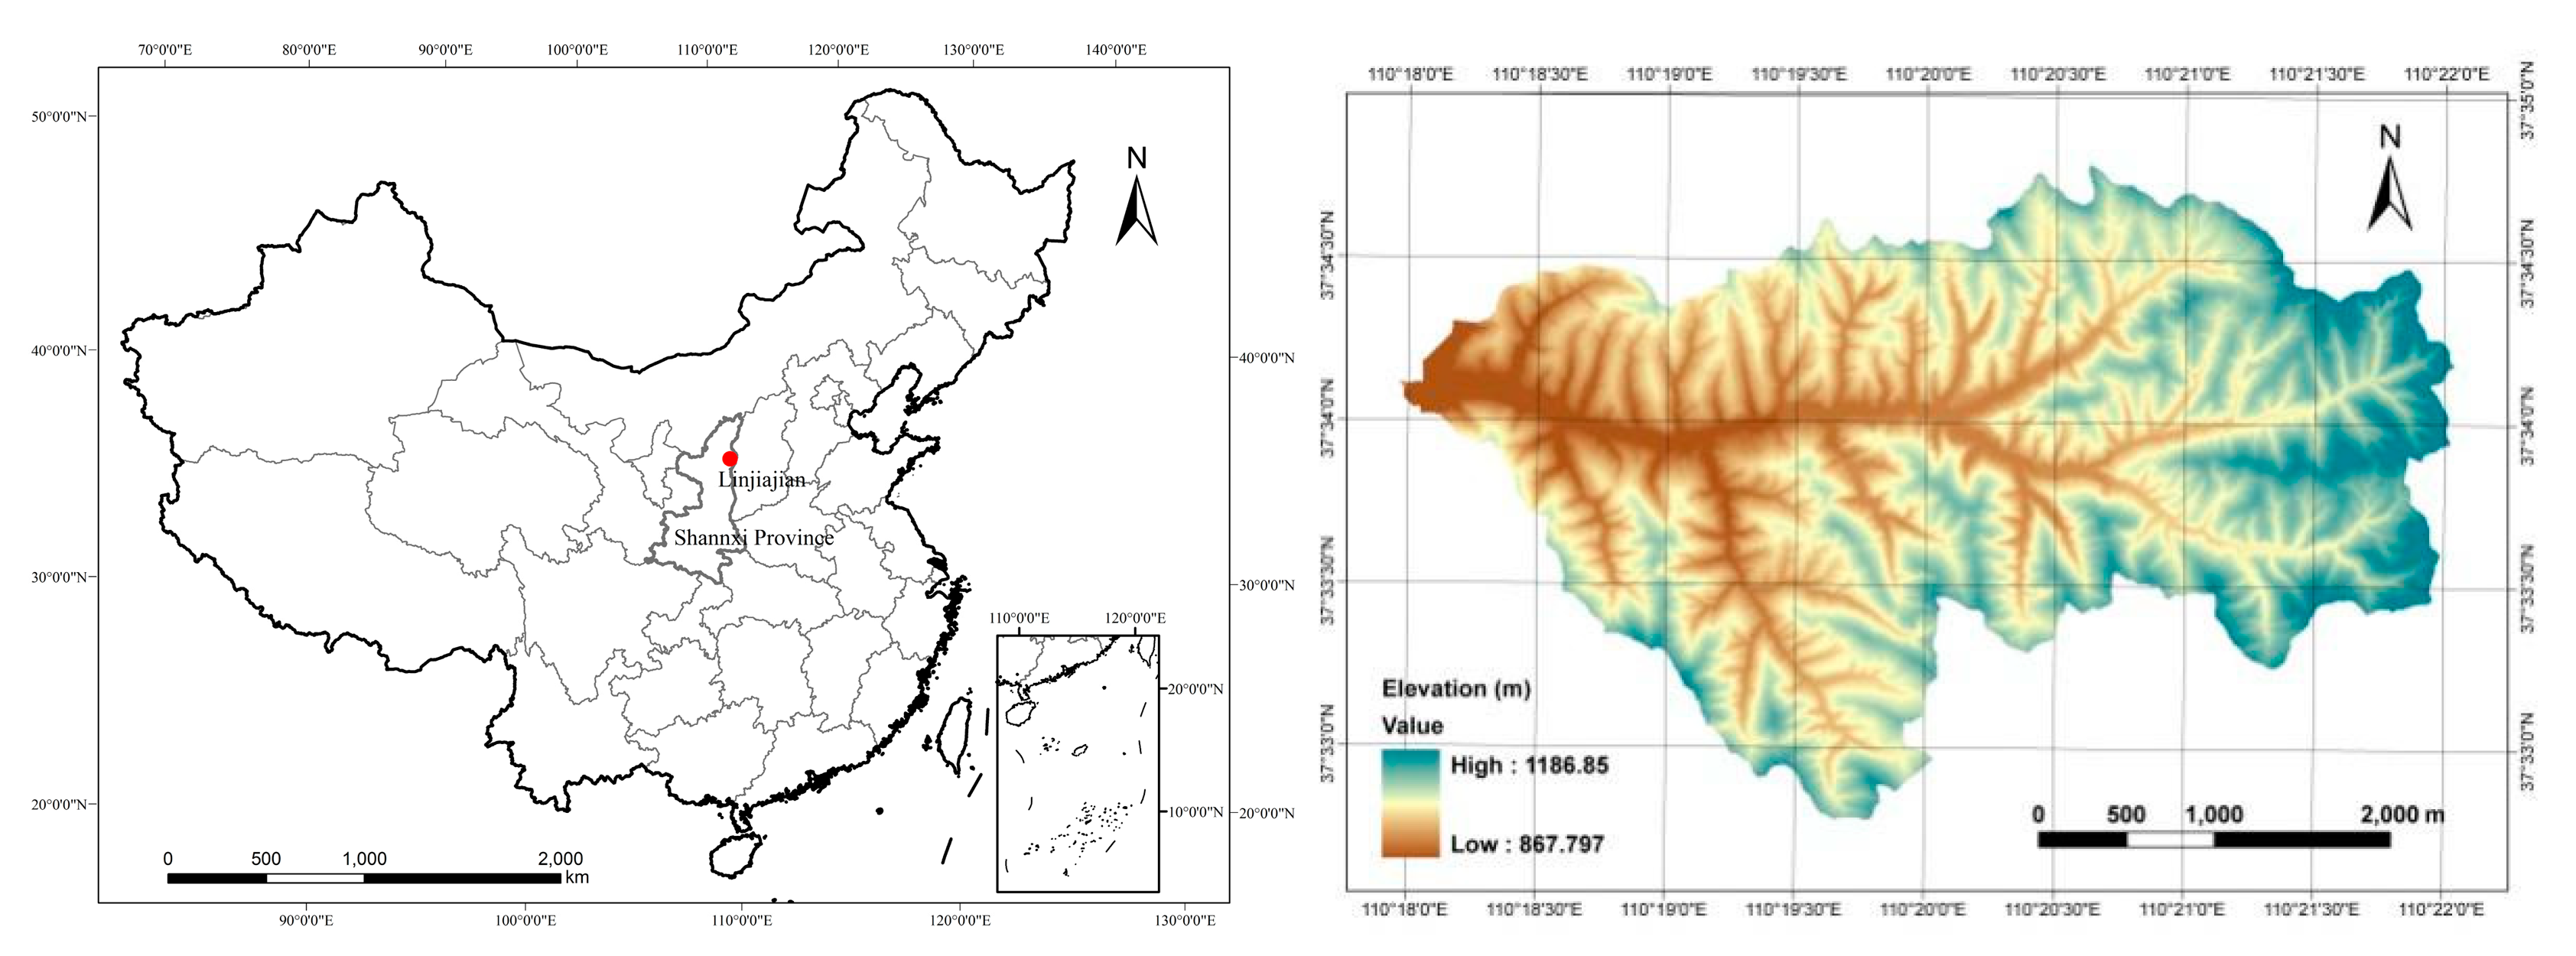
This study was carried out in a loess watershed Linjiajianin in the loess hilly area at the middle north of Shaanxi province in the Loess Plateau of China (Figure 2). Located in Suide County, the study area has a semi-arid continental climate. High-density and various loess gullies are some of the most distinguishing geomorphologic features of the study area. Land use was mainly terraced cropland, and then forest or grassland at present. The geography of the study area is shown in Table 2.
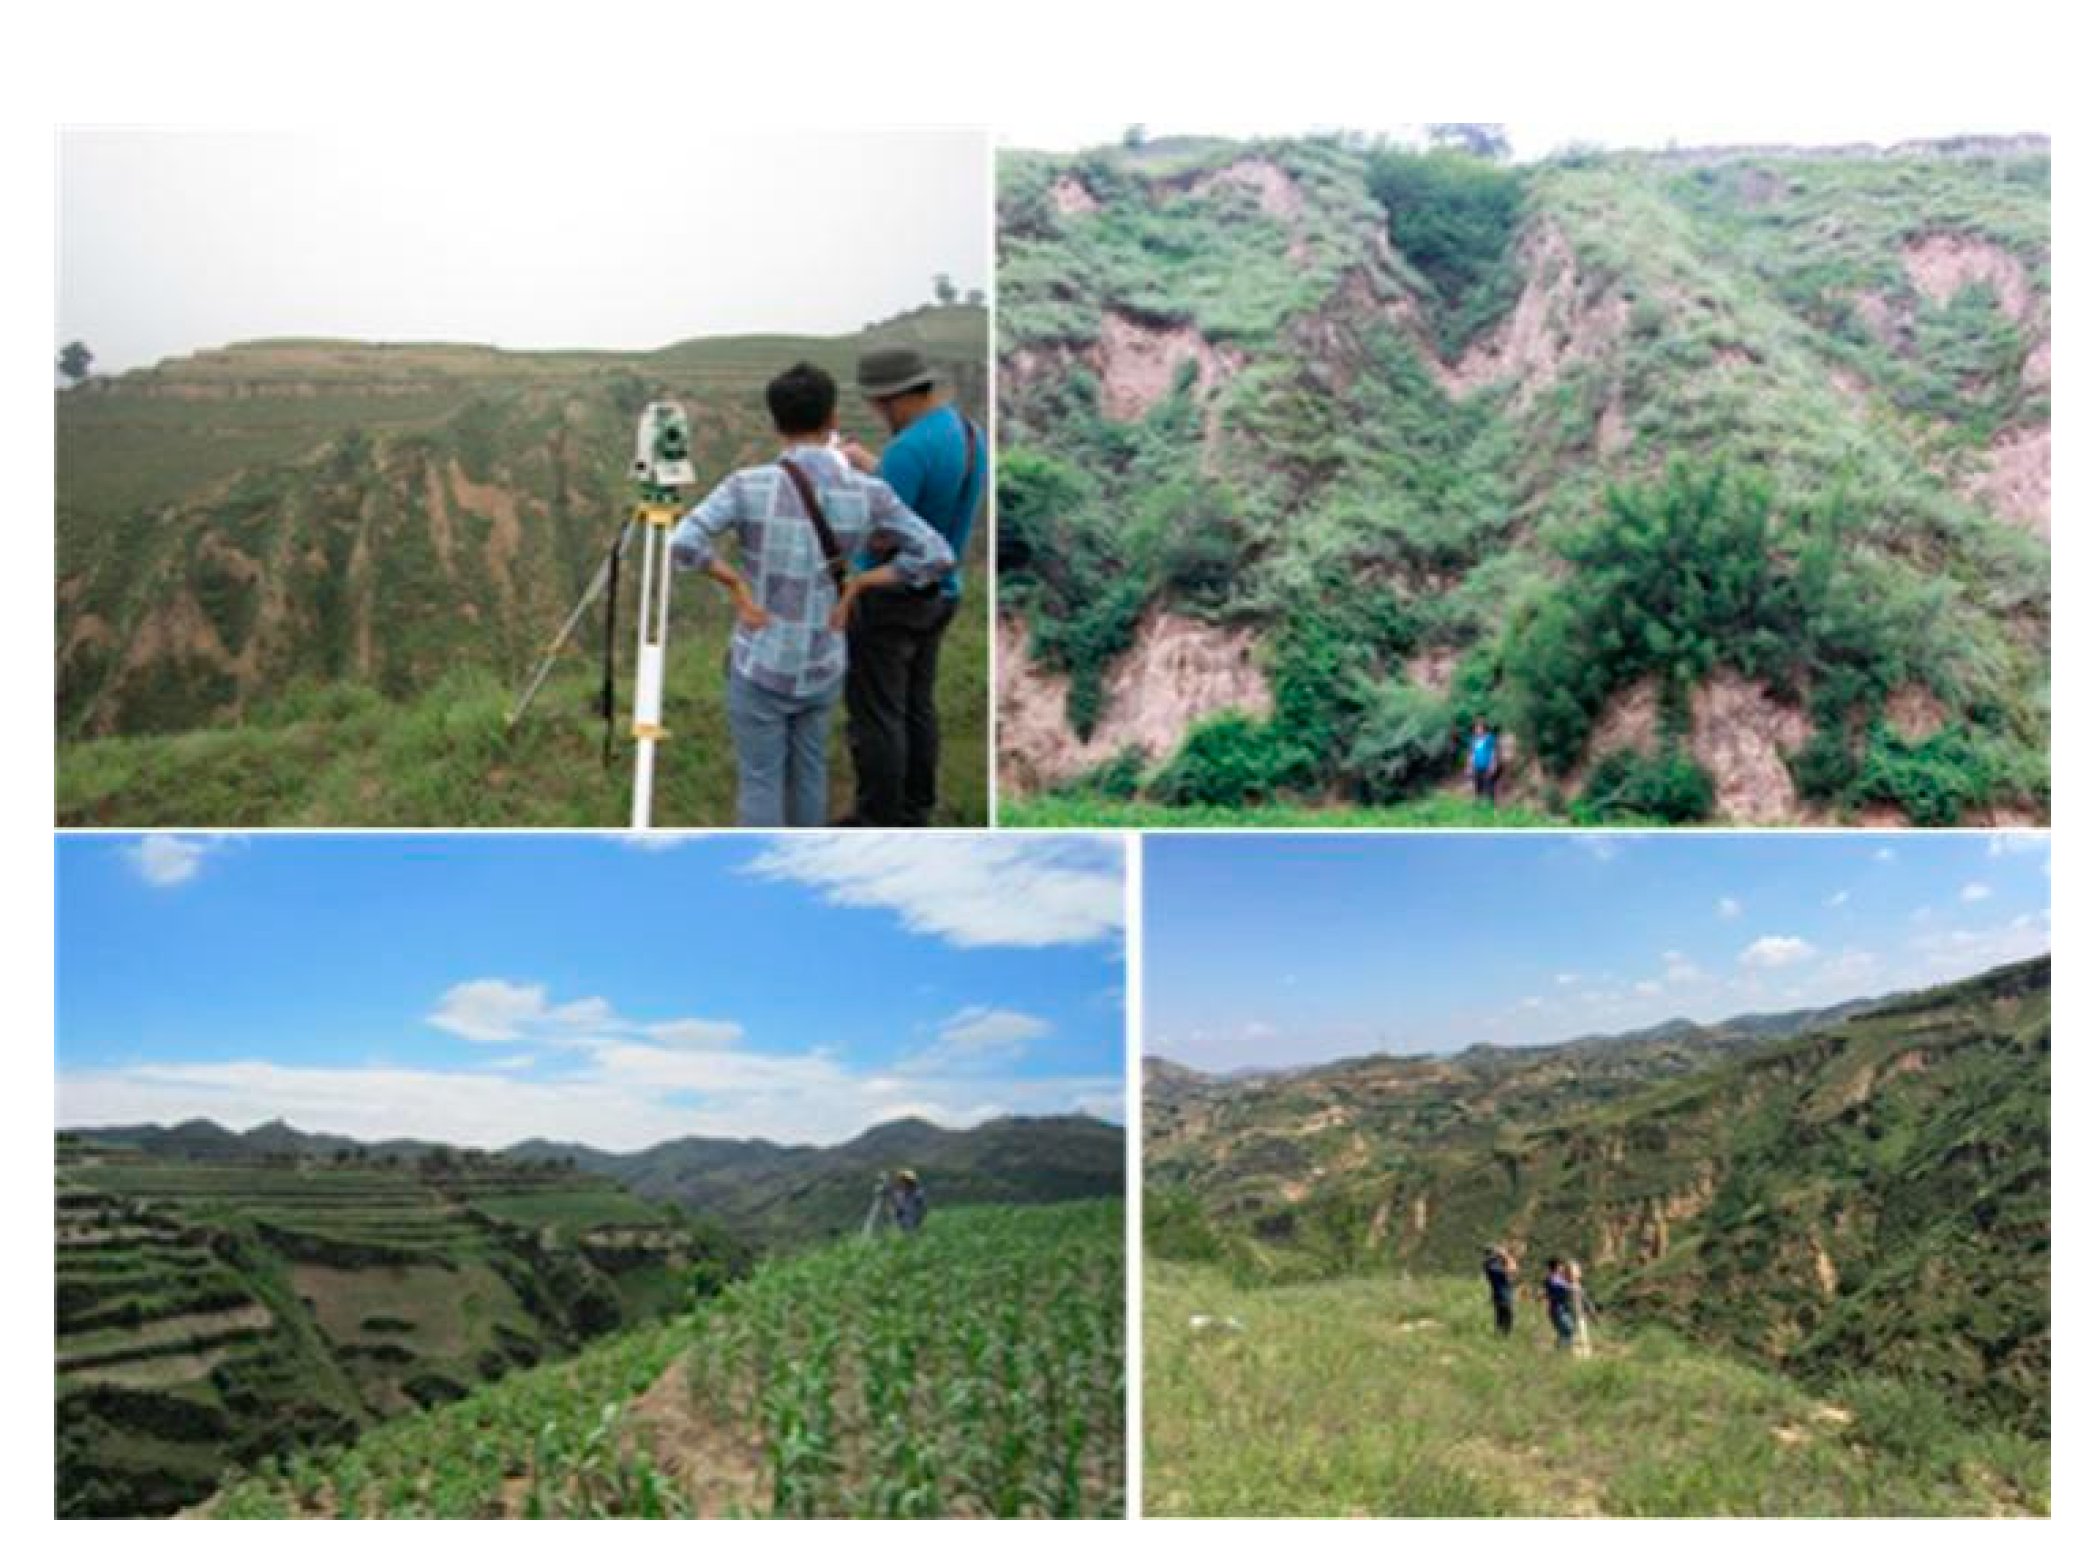
Digital elevation models (DEMs) with 5 m spatial resolution from the National Administration of Surveying, Mapping, and Geoinformation of China (NFGIS_DEM) were used for bank and valley gully extraction. They were generated by interpolating contours from a topographic map at a scale of 1:10,000. Orthophotos with 1 m resolution from aerial photogrammetry were used for hillslope ephemeral gully extraction. DEMs and Orthophotos were geo-referenced in the same coordinate system as CGCS2000 for geometric measurement. Field studies were also performed in June 2016 and June 2019 to obtain reference data (Figure 3). The bank gully heads were measured by Global Navigation Satellite System (GNSS) and total station in the selected sub-catchments of the study area in 2016, which provides the reference to assess the extraction accuracy. The artificial interpretation criteria for hillslope ephemeral gullies were obtained by the field works in 2019.
2.3. Methods
We introduce the population ecology method into landform analysis on the loess gully system. The accurate gully system was extracted from DEMs and Orthophotos. Then, population characteristics were calculated and analyzed on the basis of the extraction result.
2.3.1. Gully System Extraction
The gully system extraction was used for analysis. From the aspect of population characteristics, we focused on the composition of three types of gullies, namely, hillslope ephemeral gully, bank gully, and valley gully, rather than the detailed morphology of each individual gully. The total amount, length, and density were considered, and their information was acquired easily when each gully was abstracted into a linear object.
The fully automatic gully extraction was difficult to achieve. Generally, the two different ways of extraction are morphologic feature based and hydrologic relationship based. Morphologic features, such as length, width, and shape (transversal and longitudinal profiles) can be used to distinguish the different types of gullies given the positive relationship between the gully development stage and gully scale in the Loess Plateau of China [4,5,36]. However, these methods strongly depend on the prior expert knowledge. Thus, the quantitative standards are usually fuzzy and vague. Gully morphology is difficult to apply automatically in a certain area due to its diversity and complexity. Hydrologic relationship based extraction derives gullies based on their convergence. When a gully is formed, it becomes longer with headward erosion, wider with sidewall erosion, and deeper with channel erosion and transition. Then, branch gullies develop after a period of time. Gradually, new sub-branch gullies develop. Hence, the branch gullies are generally younger than the main gully, and the sub-branch gully is younger than the branched gully. This method can be easily achieved by the same type of analysis that is applied to river networks [9,10,11,12,13], but the results usually cannot match the classification of the gully system. Therefore, the extraction of the gully system should be a combination of morphologic features and hydrologic method.
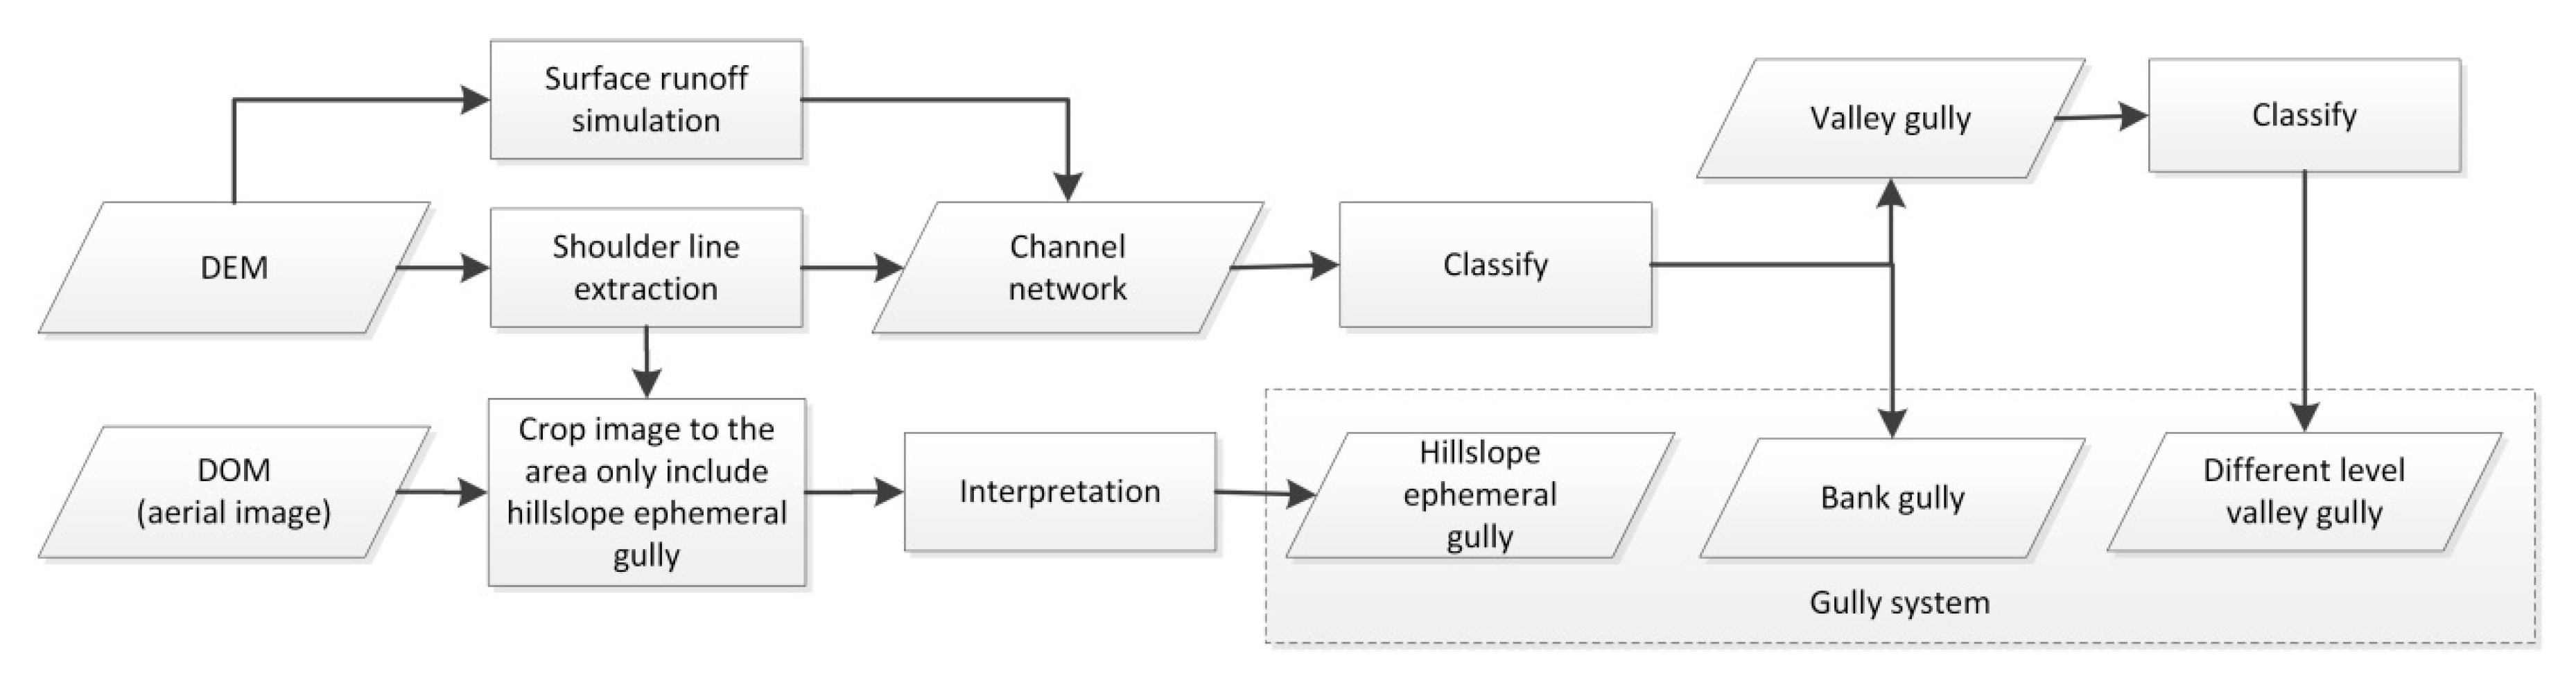
Figure 4 shows the overall workflow of the gully system extraction in this work. The loess shoulder line was extracted at first. The shoulder line (Figure 1) is the boundary between positive (excavated or interfluves) and negative (valley) terrains, which divides the area between the permanent gully (bank gully and valley gully) and ephemeral gully [37,38,39,40,41]. Then, the bank gully and valley gully could be extracted by our proposed method [33] based on hydrological analysis; morphological features were also considered. Hillslope ephemeral gullies could only be visible in high-resolution images. Thus, the visual image interpretation and field survey were applied to delineate the hillslope ephemeral gullies.
(a) Hillslope ephemeral gully mapping based on aerial image
Artificial interpretation was applied for hillslope ephemeral gully mapping. Hillslope ephemeral gully initially starts from upslope and always ends at the shoulder line in a loess hilly area. Thus, the shoulder line was extracted. Among the proposed methods [37,38,39,40,41], the P-N terrain segmentation algorithm [37] was selected because of its satisfactory performance on 5 m DEMs, both in accuracy and continuity. Then, the hillslope ephemeral gully was delineated using extracted shoulder line as a reference line. Some of the criteria used were as follows: (1) the hillslope ephemeral gully is generally parallel to the slope flow direction and shows an evidently long linear shape with certain spacing; (2) the brightness is relatively lighter than the surroundings.
(b) Bank gully extraction based on DEM
Bank gully was extracted automatically by simulating surface runoff [42,43,44] as part of the hydrological process and its morphologic features. When applying the hydrologic method, a smaller threshold for upstream catchment area should be determined given that bank gullies are relatively smaller in length and depth than valley gullies. The extraction result causes erroneous identification of some small valleys as bank gullies. Therefore, the proposed adaptive method [33] was performed to solve this problem. The morphological features were considered to distinguish the bank gully from the gully network extraction result.
(c) Valley gully extraction based on DEM
Valley gully was also automatically extracted by the hydrological channel network extraction method. Stream order proposed by Strahler [11] was used for valley gully, and the results were classified into five levels.
2.3.2. Population Characteristic Analysis of the Loess Gully System
When the different types of gullies in the loess gully system were regarded as different age classes within a population, the population ecology methods could be used to explore the gully system characteristics from the aspects of numbers, structure, and distribution. After the gully system extraction, the population characteristics were then analyzed.
The population characteristics of the gully system were analyzed in three aspects, namely, quantity, structure, and distribution. Each individual gully type was regarded as an age class in the gully “population.” In quantity, number density and length density were analyzed first. Then, the dominant gully type was analyzed by statistics. The hillslope ephemeral gully, bank gully, and valley gully were regarded as childhood, adolescence, and adulthood, respectively. In addition, the age [45] and convergence structures [46,47] better explain the landform evaluation process. Finally, the spatial distribution of the aspect difference and asymmetry [48,49] of the gully system was explored to understand the topographic control in the gully system. The detailed indices are shown in Table 3.
3. Results and Discussions
3.1. Gully System Extraction Results
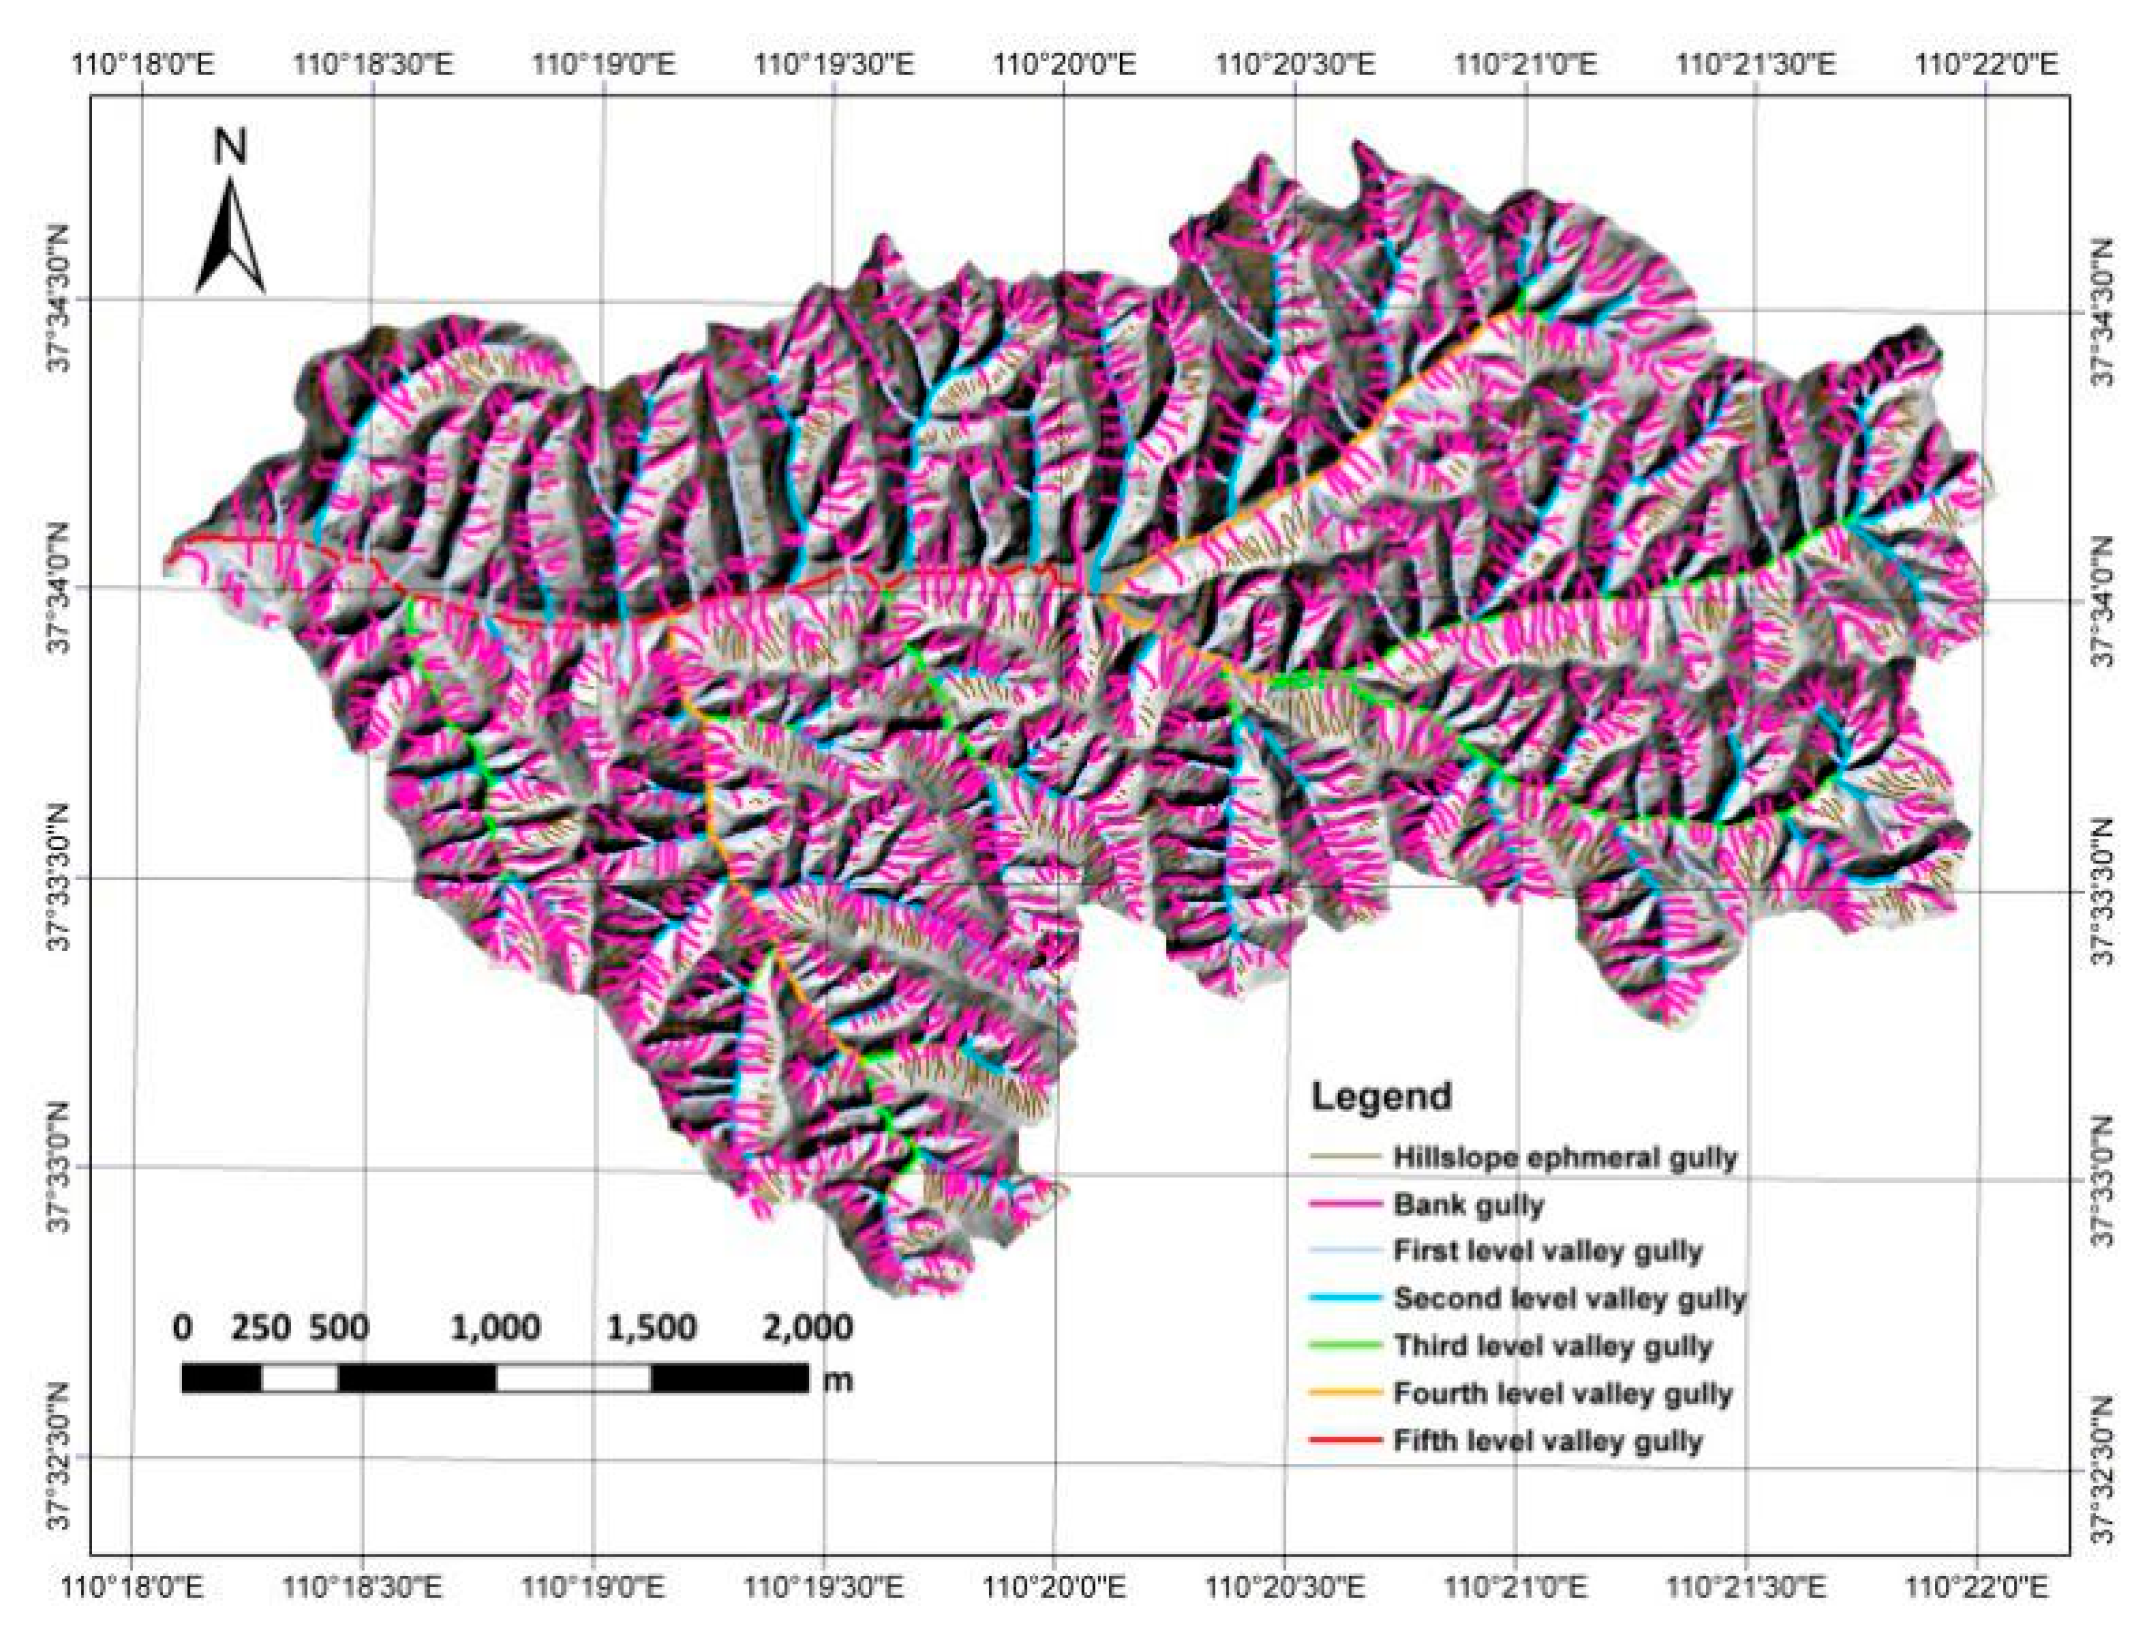
The extracted gully system in the study area is shown in Figure 5. The result shows that the entire gully system comprised 2307 hillslope ephemeral gullies, 1531 bank gullies, and 396 valley gullies. According to Strahler’s rule, the valley gullies were classified into five levels including 319 first level valley gullies, 61 second level valley gullies, 12 third level valley gullies, three fourth level valley gullies, and one fifth level valley gully. The visual comparison and quantitative analysis indicated the successful gully extraction result in the study area.
3.2. Quantitative Characteristics of the Gully System
3.2.1. Number Density
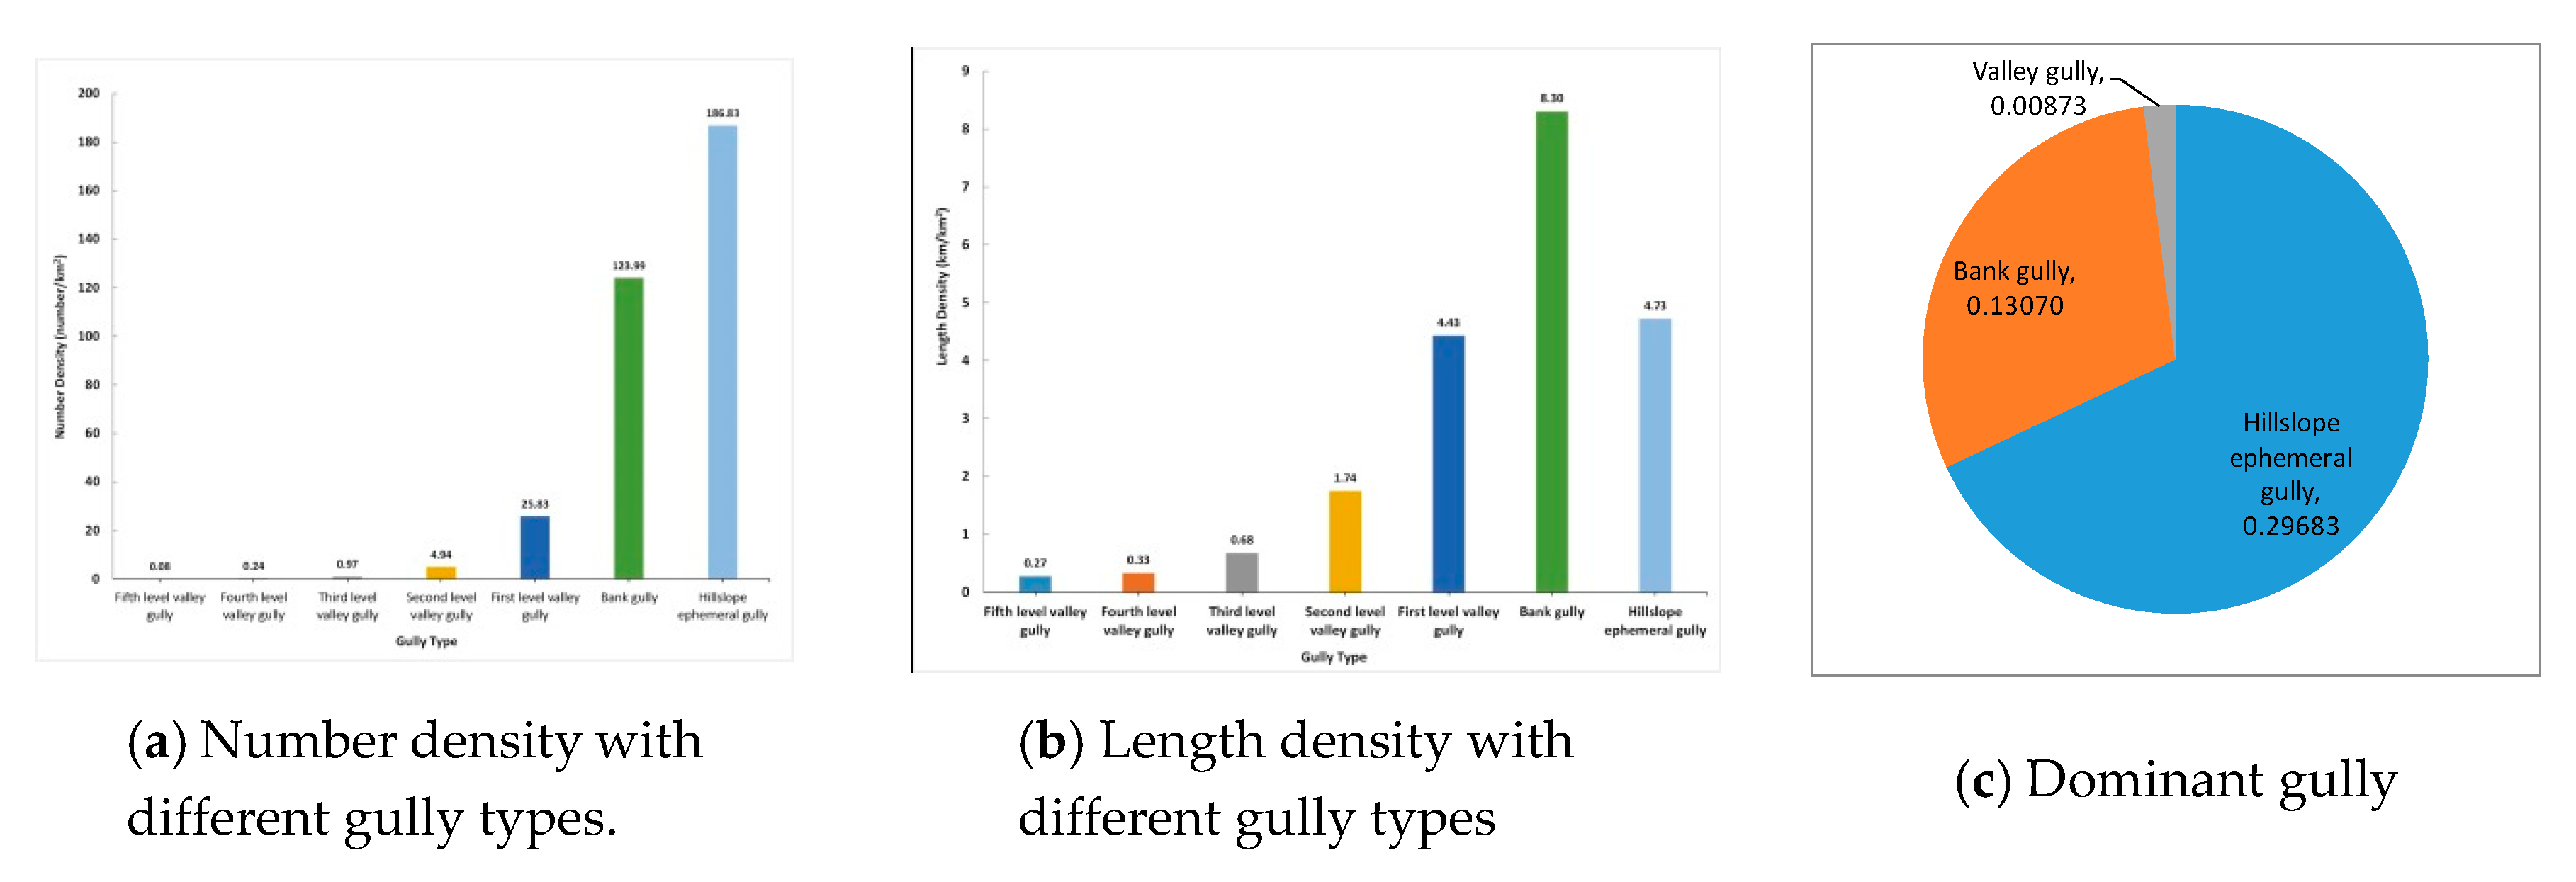
A clear increasing trend of the number density was found with decreasing gully size, fitting an exponential function (Figure 6a). The number density of hillslope ephemeral gullies was 187 numbers per km2, followed by the bank gully with 124 numbers per km2. The number density of all levels of valley gully was only 32 numbers per km2. The hillslope and bank gullies, representing the relatively young development stage, considered the majority of all gullies in this area. It reflected a relatively young and active stage of development of this gully system. With the development of the hillslope and bank gully, a large amount of soil loss was obtained under such a high density.
3.2.2. Length Density
The definition of length density is the same as gully density in the research of soil erosion. The higher length density indicates serious soil erosion within a watershed of the Loess Plateau of China. Length density showed a similar exponential trend with the gully types (Figure 6b). The bank gully had a maximum length density of 8.3 km/km2, followed by hillslope ephemeral gully with 4.7 km/km2. The length density of all levels of valley gullies was 7.47 km/Km2, which was much higher than in the previous research at 5.3 km/km2 [50], because some low-level valley gullies (small valley gullies) were extracted and calculated in this study. The gully density in the previous studies only calculated the length of valley gullies in the loess area of China. The bank gully in length and numbers amounts to a large proportion in the gully system; it should not be ignored in such a heavy gully density area. The gully density of the total valley gully and bank gully was 15.8 km/km2, which is almost three times that of the result of Qin and Li [50]. This finding reasonably represents the fragment terrain surface eroded by numerous gullies.
The number density of bank gully was not the largest; that is, it was slightly less than that of the hillslope ephemeral gully. However, the length density was the largest, thereby reflecting the development of the bank gully in this area. The positive relationship between gully density and soil erosion described more soil loss with a relatively high gully density. Therefore, the bank gully plays a dominant role in soil erosion in this area.
3.2.3. Dominant Type
Considering all types of gullies, namely, the hillslope ephemeral gully, bank gully, and valley gully, the hillslope ephemeral gully would be the dominant gully (Figure 6c). According to the dominant type equation in Table 3, the value of the hillslope ephemeral gully was 0.296, which was two times larger than that of the bank gully at 0.131; that of the valley gully was only 0.009. Therefore, the hillslope ephemeral gullies were the dominant in numbers, although they belong to ephemeral gullies with a small size. Such a large amount of hillslope ephemeral gullies would cause soil loss and land degradation with further development, which should be considered in soil and water source conservation.
3.3. Spatial Structure of the Gully System
3.3.1. Age Structure
Age structure, namely, age composition or age distribution, denotes the proportion of individuals in different age classes. Age pyramid is a snapshot of the age structure of a population, providing a picture of the relative sizes of different age groups in the population. The age pyramid reflects a product of age-specific patterns of mortality and reproduction. The three basic types are expansive pyramid—characteristics of large number of young groups with a high birth rate at the bottom; stationary pyramid—describing the percentages of population that remain constant over time; contractive pyramid—which has a narrowed bottom, generally older on average with a low death and low birth rate.
Gully development generally follows the order of the rill, hillslope ephemeral gully, bank gully, valley gully, and river gully, presented from the birth, young, and old series. Generally, rills could be formed by a rainstorm and regarded as the youngest gully and ephemeral gully. The hillslope ephemeral gully usually is formed by several rills through converging and developing in a certain short period. However, in a gully system, decades may form a bank gully and hundreds or thousands of years may develop a valley gully. Therefore, the gully type can reflect their age according to the development stage.
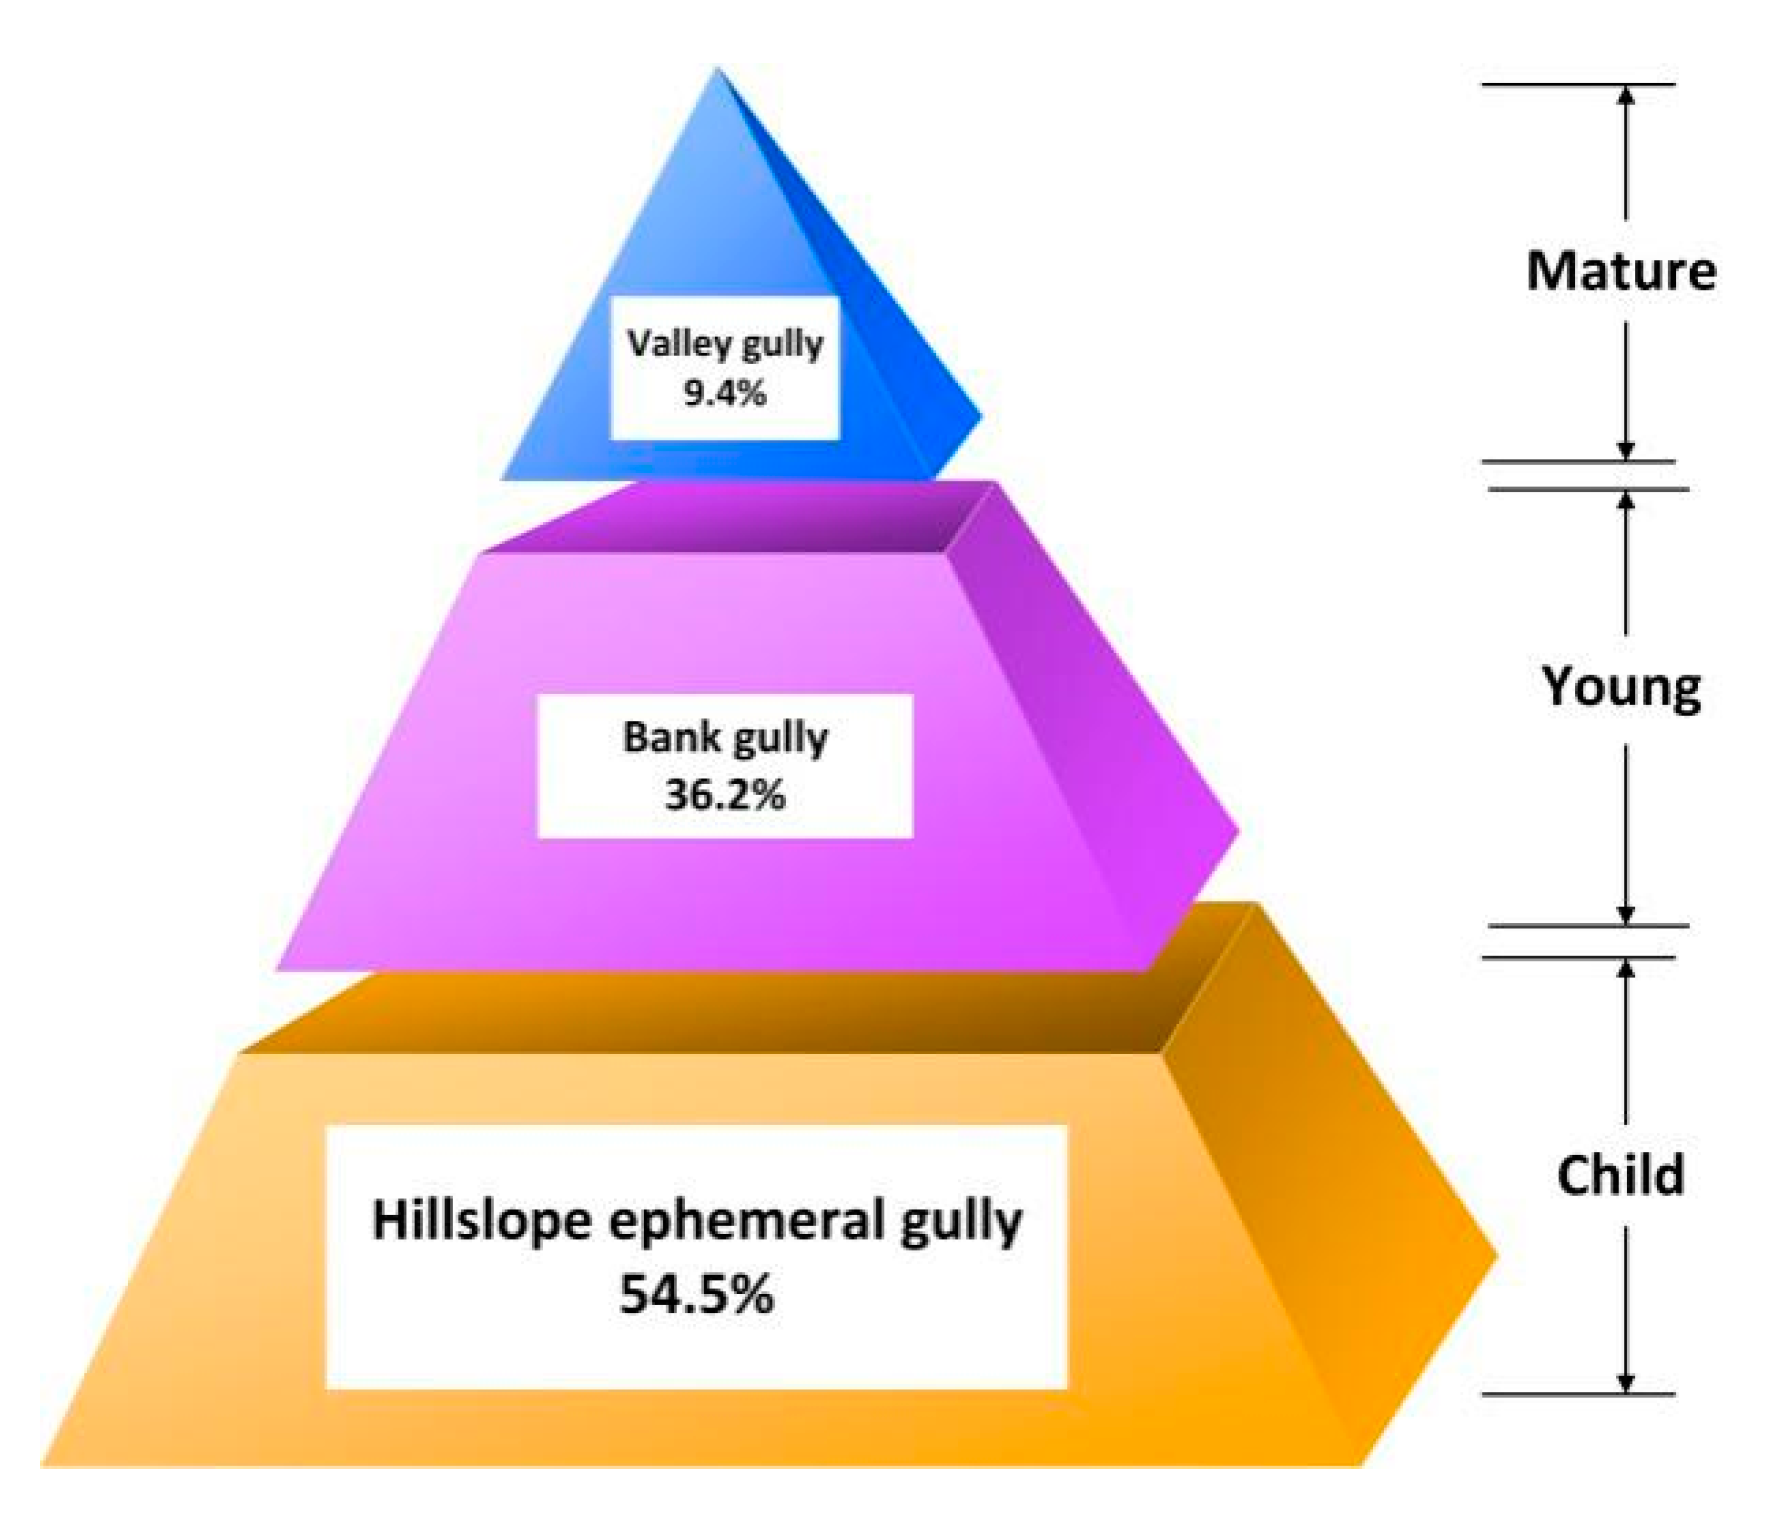
According to He’s research [51], the hillslope ephemeral gully, bank gully, and valley gully could be classified as child, youth, and mature, respectively. The age pyramid was then drawn by the statistics of the number and proportion of each age class. Figure 7 shows a typical expansive age pyramid, which reflects that the total number of gullies in this area increased because large amounts of young gullies appeared at present. In addition, the soil loess in the slope area may increase with the development of hillslope ephemeral gullies.
3.3.2. Convergent Relationship
All types of gullies within a watershed form an organic network system. The convergent relationship among gullies is the most representative of the organic system of a gully network. The convergent relationship reflects the internal contact among gullies, such as cooperation and transformation of materials and energy. Generally, the convergent relationships of a gully system are from the rill to hillslope ephemeral gully, from the hillslope ephemeral gully to bank gully, and from the bank gully to valley gully in the Loess Plateau of China. However, convergent relationships do not always follow the general pattern. Some hillslope ephemeral gullies may converge to the valley gully directly.
Table 4 shows the statistics of the convergent relationship of a gully system in the study area. Table shows that 75% hillslope ephemeral gullies converged to bank gullies, and the remaining hillslope ephemeral gullies converged to valley gullies. This finding indicates that three quarters of hillslope ephemeral gullies delivered the water and soil to bank gullies. In addition, the energy and materials contributing to the bank development were mainly from the hillslope ephemeral gully. Some of the ephemeral gullies may merge into bank gullies, and others will capture other hillslope ephemeral gullies, leading to the new bank gully. These processes usually happen in years. Therefore, the number of bank gullies will increase rapidly in the future given the dominant number of hillslope ephemeral gullies in this area. All bank gullies converged to valley gullies.
Table 5 shows that 63% of bank gullies converged to first-level valley gullies, and 22% of bank gullies to the second-level valley gullies. The higher the valley gully level, the fewer bank gullies converged. It shows the energy and materials from the bank gully mainly transformed to low-level valley gullies.
Table 6 shows that 69% of first-level valley gullies converged to second-level gullies, 67% of second-level gullies converged to third-level gullies, 83% of third-level gullies converged to fourth-level gullies, and all fourth-level gullies converged to fifth-level gullies. The overwhelming majority of materials and energy from lower-level valley gullies always converged to the next higher-level valley gullies.
The table shows that the convergent relationship was always from the low level to the higher level, whether from the aspect of gully types or gully levels. The energy and materials for the development of a high-level gully or large-scale gully were always from the lower level gully. In addition, the convergent proportions from bank gullies to different levels of gullies were rather dispersed when comparing different levels of gullies (Table 4 and Table 5). Therefore, the materials and energy from the bank gully were matched intensely by different levels of valley gullies.
3.4. Spatial Distribution of the Gully System
Different types of gullies occupy different horizontal and vertical spaces. To explore spatial distribution characteristics of the gully system, we studied the difference among three types of gullies from the aspects of elevation and slope.
3.4.1. Elevation Difference
We calculated individual gully elevation and found that the median elevation of three types of gullies decreased gradually from the hillslope ephemeral gully to valley gully. A hierarchical structure is presented, although the elevation range of the three types of gullies was the same (Figure 8). The hillslope ephemeral gully usually occupied the upslope area with a relatively high elevation. The bank gully usually occupied the area below the shoulder line with a median elevation. The valley gully developed in the bottom of the slope with a low elevation.
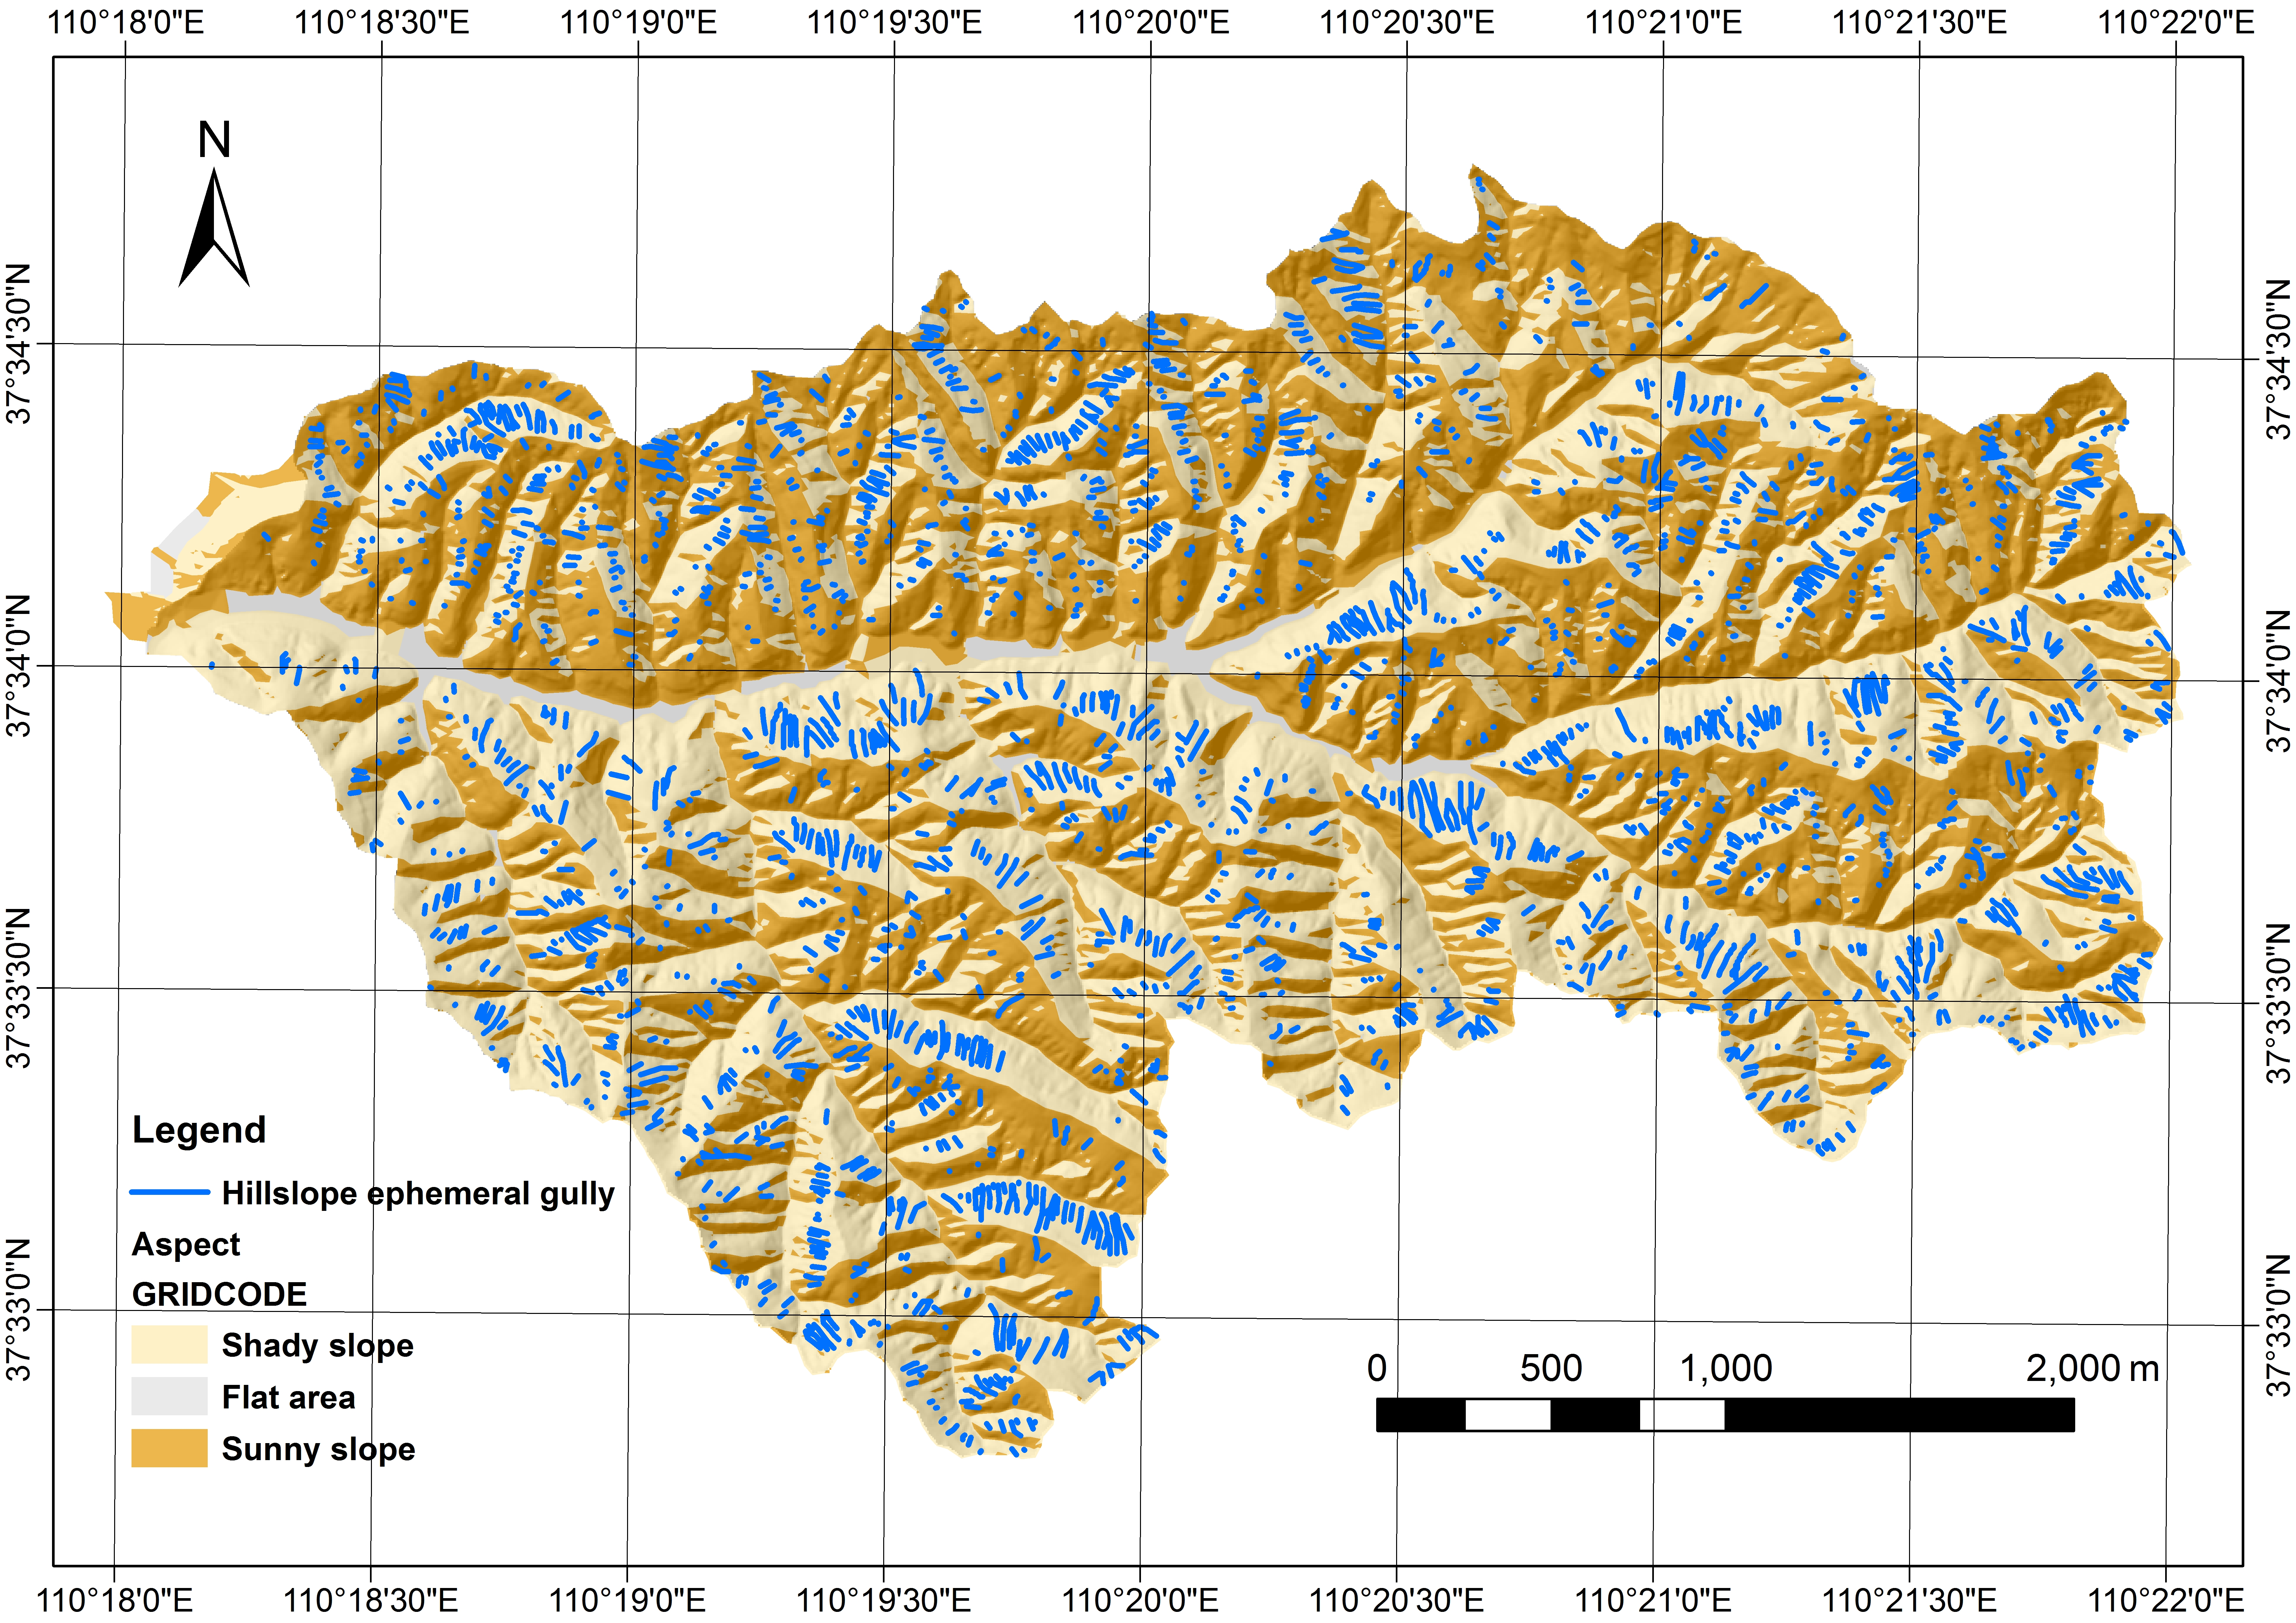
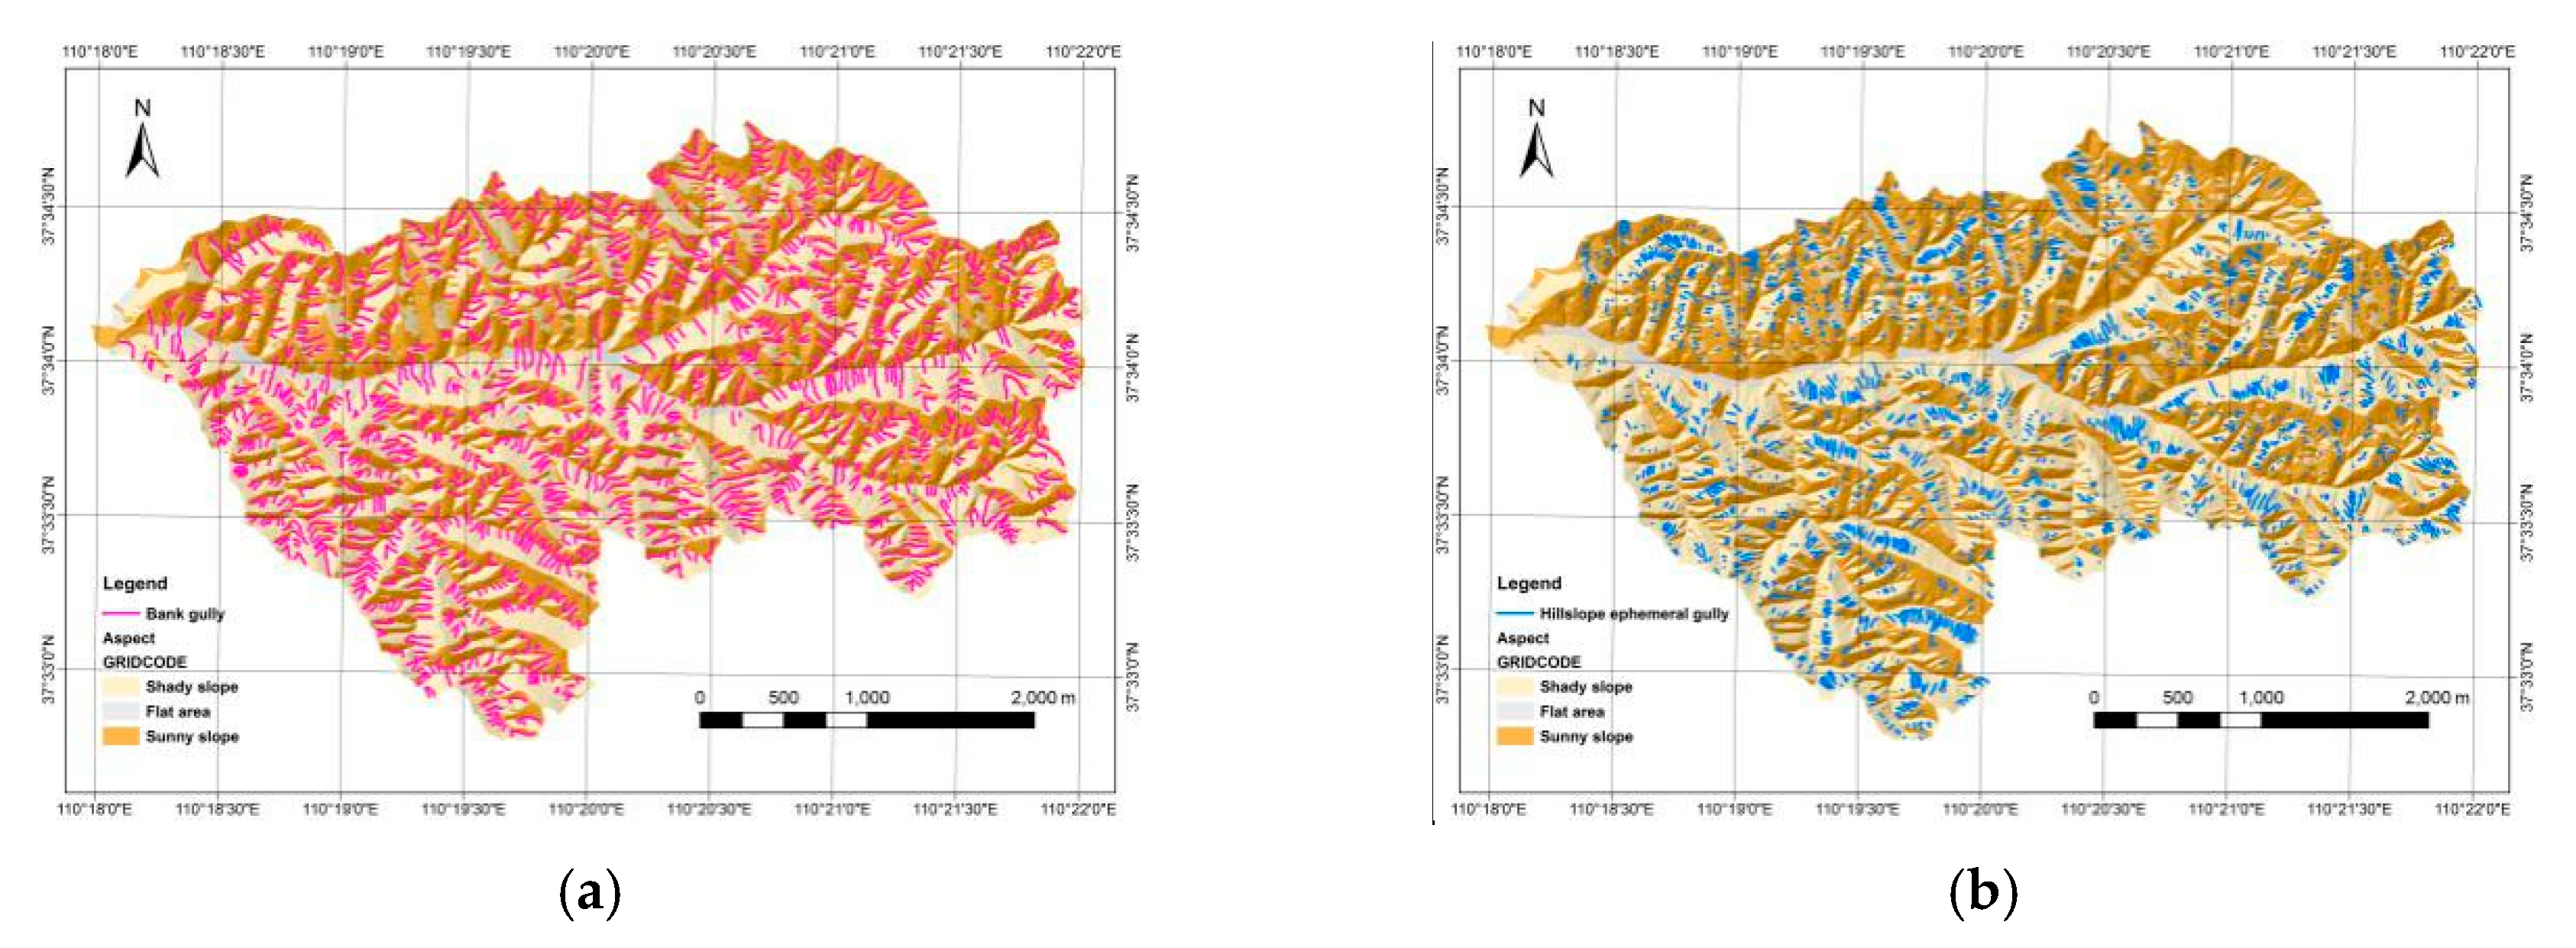
3.4.2. Aspect Difference
Aspect, as a key terrain parameter, influences gully development to a certain degree. The slope facing the sun is generally different from the slope opposite to the sun in soil moisture, vegetation density, and land surface erodibility. The difference is highly evident in arid or semi-arid areas. To explore the relationship of gully and aspect, we classified the aspect into two types, i.e., sunny slope (0–90° and 270–360° in aspect) and shady slope (90–270° in aspect). Then, we calculated the proportion of gullies in the sunny and shady slopes. The valley gullies were then excluded because they were located at the bottom of the valley, and they separated the terrain into different aspects, considering that only bank gullies and hillslope ephemeral gullies develop in slope areas.
An overview of Figure 9 shows that the number of hillslope ephemeral gullies was much greater in the shady slopes than that in the sunny slopes. However, no evident quantitative difference in the bank gully was found between the shady slope and sunny slope. Table 7 indicates that approximately 65% of hillslope ephemeral gullies were distributed in shady slopes, nearly two times that in sunny slopes. The bank gullies were located in shady slopes, nearly as much as those in sunny slopes.
The table shows that the influence of terrain aspect on gully distribution would be more significant on hillslope ephemeral gullies than on bank gullies. The study area belongs to intensive gully erosion areas of the Loess Plateau of China. A large amount of gullies develops in this area. Soil moisture and vegetation were relatively less on sunny slopes than on shady slopes. Therefore, the land surface was more easily eroded by gully than in shady slopes. Thus, the gullies developed rapidly in the sunny slopes. Many hillslope ephemeral gullies in the sunny slopes developed and converted into bank gullies, thereby resulting in a lower number of hillslope ephemeral gullies in sunny slopes. The average length of hillslope ephemeral gullies in the sunny slopes was 20.9 m, which was shorter than (29.5 m) in the shady slope. However, although the number of bank gullies in the shady slope was slightly greater than in the sunny slopes, the average length of bank gullies in the shady slope was slightly shorter than in the sunny slopes. This finding confirms that bank gullies develop faster with the headword erosion process in the sunny slopes, and bank gully erosion dominates the gully system.
4. Conclusions
The gullies in the Loess Plateau of China vary in scale with different developmental stages, resulting in a gully system. Some population characteristics from population ecology theory were introduced to analyze the systematic attributes of the loess gully system. The gully system is not literally a biological population, and our study did not consider the human influences on the gully system such as terracing. Nevertheless, the analysis based on the extraction results of the gully system from DEMs and imagery in the selected watershed has provided a new understanding of the loess gully system.
(1) Population quantity. The number density of hillslope ephemeral gullies is the largest, followed by bank gullies and valleys; the length density of bank gullies is the largest, followed by hillslope ephemeral gullies and valleys. The hillslope ephemeral gully is the dominant gully in the whole system. The number density and length density are in line with the exponential growth pattern.
(2) Spatial structure. All different types of gullies with different developmental stages show a typical dendritic pattern. The age structure of different types of gullies is consistent with the pyramidal structure of the biological population. This finding shows that the system is in the early and middle stages of development, in which more hillslope gullies are being created through time in the future. The convergent relationship indicates the “intra-specie” relationship, which shows that the material and energy exchange of the gully system is mainly manifested between the adjacent gully levels.
(3) Distribution. The spatial distribution of the “youngest” hillslope ephemeral gullies has a clear aspect asymmetry, and the bank gully distribution on both sides of the main valley is symmetrical. A hierarchical structure in elevation distribution is presented, indicating that the hillslope ephemeral gully, bank gully, and valley gully develop in the upslope, shoulder line, and bottom areas, respectively.
On the basis of this analysis, we believe that the loess gully system is a self-organized, orderly evolutionary process. Thus, we can draw on the methods from biological populations to explore the new features of the loess gully system. A preliminary exploration in this study of the gully system revealed some interesting population characteristics, which helps us to further understand the landforms and gully erosion, but it is far from enough. Further studies will focus on the comparative analysis among several different representative watersheds or the temporal dynamic change of some watersheds to deepen the comprehensive interpretation and understanding of the loess gully system.
Author Contributions
J.N. and X.Y. conceived and designed the methodology and performed the experiments; J.N. and X.Y wrote the paper; W.D. collected the data and contributed to the data analysis; G.T. and X.Y. provided the funding; J.S. reviewed the manuscript. All authors have read and agreed to the published version of the manuscript.
Funding
This research was funded by the National Natural Science Foundation China (Grant Nos. 41771415 and 41930102) and the Priority Academic Program Development of Jiangsu Higher Education Institutions (Grant No. 164320H116).
Acknowledgments
The authors would like to thank Dr. Jilong Li from the Institute of Geographic Sciences and Natural Resources Research, CAS, and Mr. Wen Dai from Nanjing Normal University for the assistance in the field works.
Conflicts of Interest
The authors declare no conflict of interest.
References
- Chen, Y. The classification of gully in hilly loess region in the middle reaches of the yellow river. Sci. Geogr. Sin. 1984, 4, 321–327. [Google Scholar]
- Burkard, M.B.; Kostaschuk, R.A. Initiation and evolution of gullies along the shoreline of Lake Huron. Geomorphology 1995, 14, 211–219. [Google Scholar] [CrossRef]
- Daba, S.; Rieger, W.; Strauss, P. Assessment of gully erosion in eastern Ethiopia using photogrammetric techniques. Catena 2003, 50, 273–291. [Google Scholar] [CrossRef]
- Luo, L.X. A tentative classification of landforms in the loess plateau. Acta Geogr. Sin. 1956, 22, 201–222, (in Chinese with English abstract). [Google Scholar]
- Jing, K. A study on gully erosion on the Loess Plateau. Sci. Geogr. Sin. 1986, 6, 340–347, (in Chinese with English abstract). [Google Scholar]
- Liu, Y.B.; Zhu, X.M.; Zhou, P.H.; Tang, K.L. The law of hillslope channel erosion occurrence and development on loess plateau. Res. Soil Water Conserv. 1988, 7, 9–18, (in Chinese with English abstract). [Google Scholar]
- Gan, Z.M. Geomorphology and Soil Erosion Research in Loess Plateau of China; People’s Publishing House: Xi’an, China, 1990; (in Chinese with English abstract). [Google Scholar]
- Horton, R.E. Drainage-basin characteristics. EOS Trans. Am. Geophys. Union 1932, 13, 350–361. [Google Scholar] [CrossRef]
- Horton, R.E. Erosional development of streams and their drainage basins; hydrophysical approach to quantitative morphology. Geol. Soc. Am. Bull. 1945, 56, 275–370. [Google Scholar] [CrossRef] [Green Version]
- Schumm, S.A. Evolution of drainage systems and slopes in badlands at Perth Amboy, New Jersey. Geol. Soc. Am. Bull. 1956, 67, 597–646. [Google Scholar] [CrossRef]
- Strahler, A.N. Dynamic basis of geomorphology. Geol. Soc. Am. Bull. 1952, 63, 923–938. [Google Scholar] [CrossRef]
- Shreve, R.L. Statistical law of stream numbers. J. Geol. 1966, 74, 17–37. [Google Scholar] [CrossRef]
- Scheidegger, A.E. The algebra of stream-order numbers. U. S. Geol. Surv. Prof. Pap. 1965, 525, 187–189. [Google Scholar]
- Cheng, J.; Jiang, M. Mathematical Model of Watershed Geomorphology; Science Press: Beijing, China, 1986. (In Chinese) [Google Scholar]
- Yi, H. A Research on Information Mining of the Loess Plateau Gully based on DEM. Master’s Thesis, Northeast University, Boston, MA, USA, 2004. [Google Scholar]
- Kabo-bah, K.; Tang, G.; Yang, X.; Na, J.; Xiong, L. Spatial fractal properties of loess plateau in the northern Shaanxi Province of China. J. Nanjing Norm. Univ. 2020, 43, 1–8. [Google Scholar]
- Wu, Y.; Zheng, Q.; Zhang, Y.; Liu, B.; Cheng, H.; Wang, Y. Development of gullies and sediment production in the black soil region of northeastern China. Geomorphology 2008, 101, 683–691. [Google Scholar] [CrossRef]
- Shen, H.; Zheng, F.; Wen, L.; Han, Y.; Hu, W. Impacts of rainfall intensity and slope gradient on rill erosion processes at loessial hillslope. Soil Tillage Res. 2016, 155, 429–436. [Google Scholar] [CrossRef]
- Wang, B.; Steiner, J.; Zheng, F.; Gowda, P. Impact of rainfall pattern on interrill erosion process. Earth Surf. Process. Landf. 2017, 42, 1833–1846. [Google Scholar] [CrossRef]
- Jiang, C.; Zhang, H.; Wang, X.; Feng, Y.; Labzovskii, L. Challenging the land degradation in China’s Loess Plateau: Benefits, limitations, sustainability, and adaptive strategies of soil and water conservation. Ecol. Eng. 2019, 127, 135–150. [Google Scholar] [CrossRef]
- Li, P.; Mu, X.; Holden, J.; Wu, Y.; Irvine, B.; Wang, F.; Gao, P.; Zhao, G.; Sun, W. Comparison of soil erosion models used to study the Chinese Loess Plateau. Earth-Sci. Rev. 2017, 170, 17–30. [Google Scholar] [CrossRef] [Green Version]
- Stolte, J.; Liu, B.; Ritsema, C.J.; Van Den Elsen HG, M.; Hessel, R. Modelling water flow and sediment processes in a small gully system on the Loess Plateau in China. Catena 2003, 54, 117–130. [Google Scholar] [CrossRef]
- Hessel, R.; van Asch, T. Modelling gully erosion for a small catchment on the Chinese Loess Plateau. Catena 2003, 54, 131–146. [Google Scholar] [CrossRef]
- Huang, C.C.; Pang, J.; Zha, X.; Su, H.; Zhou, Y. Development of gully systems under the combined impact of monsoonal climatic shift and neo-tectonic uplift over the Chinese Loess Plateau. Quat. Int. 2012, 263, 46–54. [Google Scholar] [CrossRef]
- Xia, W.; Zhanbin, L.; Xungui, L. Research progress on soil erosion of slope-gully systems in the Loess Plateau. Sci. Soil Water Conserv. 2012, 10, 108–113. [Google Scholar] [CrossRef]
- Rinaldo, A.; Rodriguez-Iturbe, I.; Rigon, R.; Ijjasz-Vasquez, E.; Bras, R.L. Self-organized fractal river networks. Phys. Rev. Lett. 1993, 70, 822. [Google Scholar] [CrossRef] [PubMed]
- Sidorchuk, A. Stages in gully evolution and self-organized criticality. Earth Surface Processes and Landforms. J. Br. Geomorphol. Res. Group 2006, 31, 1329–1344. [Google Scholar]
- Odum, E.P.; Smalley, A.E. Comparison of population energy flow of a herbivorous and a deposit-feeding invertebrate in a salt marsh ecosystem. Proc. Natl. Acad. Sci. USA 1959, 45, 617. [Google Scholar] [CrossRef] [PubMed] [Green Version]
- Vandaele, K.; Poesen, J.; Govers, G.; van Wesemael, B. Geomorphic threshold conditions for ephemeral gully incision. Geomorphology 1996, 16, 161–173. [Google Scholar] [CrossRef]
- Wilson, G.V.; Wells, R.R.; Dabney, S.M.; Zhang, T. Filling an ephemeral gully channel: Impacts on physical soil quality. Catena 2019, 174, 164–173. [Google Scholar] [CrossRef]
- Wu, T.; Pan, C.; Li, C.; Luo, M.; Wang, X. A field investigation on ephemeral gully erosion processes under different upslope inflow and sediment conditions. J. Hydrol. 2019, 572, 517–527. [Google Scholar] [CrossRef]
- Li, Z.; Zhang, Y.; Zhu, Q.; He, Y.; Yao, W. Assessment of bank gully development and vegetation coverage on the Chinese Loess Plateau. Geomorphology 2015, 228, 462–469. [Google Scholar] [CrossRef]
- Yang, X.; Na, J.; Tang, G.; Wang, T.; Zhu, A. Bank gully extraction from DEMs utilizing the geomorphologic features of a loess hilly area in China. Front. Earth Sci. 2019, 13, 151–168. [Google Scholar] [CrossRef]
- Ding, H.; Liu, K.; Chen, X.; Xiong, L.; Tang, G.; Qiu, F.; Strobl, J. Optimized Segmentation Based on the Weighted Aggregation Method for Loess Bank Gully Mapping. Remote Sens. 2020, 12, 793. [Google Scholar] [CrossRef] [Green Version]
- Rosen, A.M. The impact of environmental change and human land use on alluvial valleys in the Loess Plateau of China during the Middle Holocene. Geomorphology 2008, 101, 298–307. [Google Scholar] [CrossRef]
- Wu, Y.; Cheng, H. Monitoring of gully erosion on the Loess Plateau of China using a global positioning system. Catena 2005, 63, 154–166. [Google Scholar] [CrossRef]
- Zhou, Y.; Yang, X.; Xiao, C.; Zhang, Y.; Luo, M. Positive and negative terrains on northern Shaanxi Loess Plateau. J. Geogr. Sci. 2010, 20, 64–76. [Google Scholar] [CrossRef]
- Song, X.; Tang, G.; Li, F.; Jiang, L.; Zhou, Y.; Qian, K. Extraction of loess shoulder-line based on the parallel GVF snake model in the loess hilly area of China. Comput. Geosci. 2013, 52, 11–20. [Google Scholar] [CrossRef]
- Yan, S.; Tang, G.; Li, F.; Zhang, L. Snake model for the extraction of loess shoulder-line from DEMs. J. Mt. Sci. 2014, 11, 1552–1559. [Google Scholar] [CrossRef]
- Liu, H.; Deng, Q.; Zhang, B.; Li, X.; Wang, L.; Luo, M.; Qin, F. Influences of different surveying and mapping methods on fractal characteristics of gully-head shoulder lines. Phys. Geogr. 2016, 37, 387–408. [Google Scholar] [CrossRef]
- Na, J.; Yang, X.; Dai, W.; Li, M.; Xiong, L.; Zhu, R.; Tang, G. Bidirectional DEM relief shading method for extraction of gully shoulder line in loess tableland area. Phys. Geogr. 2018, 39, 368–386. [Google Scholar] [CrossRef]
- O’Callaghan, J.F.; Mark, D.M. The extraction of drainage networks from digital elevation data. Comput. Vis. Graph. Image Process. 1984, 28, 323–344. [Google Scholar] [CrossRef]
- Tarboton, D.G.; Bras, R.L.; Rodriguez-Iturbe, I. On the extraction of channel networks from digital elevation data. Hydrol. Process. 1991, 5, 81–100. [Google Scholar] [CrossRef]
- Lashermes, B.; Foufoula-Georgiou, E.; Dietrich, W.E. Channel network extraction from high resolution topography using wavelets. Geophys. Res. Lett. 2007, 34. [Google Scholar] [CrossRef] [Green Version]
- Tkadlec, E.M.I.L.; Zejda, J.A.N. Small rodent population fluctuations: The effects of age structure and seasonality. Evol. Ecol. 1998, 12, 191. [Google Scholar] [CrossRef]
- Koci, J.; Sidle, R.C.; Jarihani, B.; Cashman, M.J. Linking hydrological connectivity to gully erosion in savanna rangelands tributary to the Great Barrier Reef using structure-from-motion photogrammetry. Land Degrad. Dev. 2020, 31, 20–36. [Google Scholar] [CrossRef]
- Conoscenti, C.; Rotigliano, E. Predicting gully occurrence at watershed scale: Comparing topographic indices and multivariate statistical models. Geomorphology 2020, 359, 107123. [Google Scholar] [CrossRef]
- Islam, A.; Sarkar, B.; Das, B.C.; Barman, S.D. Assessing Gully Asymmetry Based on Cross-Sectional Morphology: A Case of Gangani Badland of West Bengal, India. In Gully Erosion Studies from India and Surrounding Regions; Springer: Cham, Switzerland, 2020; pp. 69–92. [Google Scholar]
- Real, L.S.C.; Crestana, S.; Ferreira, R.R.M.; Sígolo, J.B.; Rodrigues, V.G.S. Proposition for a new classification of gully erosion using multifractal and lacunarity analysis: A complex of gullies in the Palmital stream watershed, Minas Gerais (Brazil). CATENA 2020, 186, 104377. [Google Scholar] [CrossRef]
- Qin, X.; Li, Z. Study on relative stability and layout optimization of dam system in Jiuyuangou watershed. J. Northwest AF Univ. Nat. Sci. Ed. 2010, 8, 211–222, (in Chinese with English abstract). [Google Scholar]
- He, Y.; Jia, T.; Li, R. Development of gullies and evaluation on their stability in the loess hill region. Arid Land Geogr. 1999, 2, 64–70, (in Chinese with English abstract). [Google Scholar]
Figure 1.
Typical gully system in loess hilly area of China.

Figure 2.
Study Area and Data of Linjiajian.

Figure 3.
Field survey. Bank gully heads were measured by GNSS and total station in the study area.

Figure 4.
Workflow of gully system extraction.

Figure 5.
Result of gully system extraction in the study area. Gully system includes hillslope ephemeral gully, bank gully, and multilevel valley gully. The valley gullies were classified in five levels by the Strahler classification rule (1963).
Figure 5.
Result of gully system extraction in the study area. Gully system includes hillslope ephemeral gully, bank gully, and multilevel valley gully. The valley gullies were classified in five levels by the Strahler classification rule (1963).

Figure 6.
Quantitative characteristics of the gully system.

Figure 7.
Expansive age pyramid of the gully system.

Figure 8.
Elevation difference of three types of gullies.

Figure 9.
Distribution of hillslope ephemeral and bank gullies with topographic aspect. (a) hillslope ephemeral gullies; (b) bank gullies.
Figure 9.
Distribution of hillslope ephemeral and bank gullies with topographic aspect. (a) hillslope ephemeral gullies; (b) bank gullies.


Table 1.
Categories of a loess gully system.
| Category | Definition | Position and Distribution | Depth and Width | Geometry in Profiles | Characteristics |
|---|---|---|---|---|---|
| Rill | Narrow and shallow channels; eroded into unprotected soil initially by hillslope runoff | In the hillslope above gully shoulder line, especially in slope cropland. Generally, they form after rainstorm and distribute parallel on a straight side slope. | 2–15 cm depth; 5–20 cm width | Groove shape in transversal profile; the same as the slope it developed in the longitudinal profile. | Possible to be eliminated by tillage. |
| Hillslope ephemeral gully | Usually the results from the junction of rills; larger than a rill and smaller than a bank gully | Usually appears on a cultivated field during the planting or growing season and could be erased by cultivation. | 20–50 cm depth; 30–50 cm width | Shallow V shape in transversal profile; the same as the slope it developed in the longitudinal profile. | Usually occurs in the upper reaches of a drainage network; always recurs in the same area each time they form rather than randomly at different places on a slope |
| Bank gully | Formed upon the exceedance of a critical flow shear stress at the soil surface; developed by headward retreat in erodible hillslopes or further development of hillslope ephemeral gully | Developed at the boundary between the interfluves and the valleys; in the area with steepest slope. | 10–50 m depth 1–20 m width | V shape in transversal profile; different and larger than the slope it developed in the longitudinal profile. | Evident head cut; no branch gully developed; generally impossible to be erased by tillage |
| Valley gully | Well-developed gully; functions as the main drainage channel of a subcatchment; | Distributed in the bottom of a valley or formed a valley. | 10–100 m depth 50–200 m width | V or U shape in the transversal profile; totally different from the slope it developed in the longitudinal profile. | Formed a dendritic (branching or tree-like) pattern of channels; clear boundary of individual gullies |
Table 2.
Geography of Study Areas.
| Linjiajian | |
|---|---|
| Location | 110°18′04–110°22′04″E 37°32′47″–37°34′47″N |
| Area | 12.4 km2 |
| Elevation | 867–1186 m |
| Gully Density | 5.3 km/km2 |
Table 3.
Descriptive Indices for Population Characteristics of the Loess Gully System.
| Index | Equation or Expression | Description | |
|---|---|---|---|
| Quantity | Number density | Pni = ni/S | Ratio of ni (total amount of one gully type i) and S (area of the watershed). |
| Length density | Pli = Sum(Lengthi)/S | Ratio of sum (Lengthi) (total length of one gully type i) and S (area of the watershed). | |
| Dominant type | D = Max[(ni/N)2] | The probability of that two specie (gully) samples of nonreturn random sampling from the population (gully system) are in the same type. N is the total amount of the gullies in the gully system; ni is the the total amount of certain gully type. | |
| Structure | Age structure | Population pyramid. | Hillslope ephemeral gully, bank gully, and valley gully are regarded as childhood, adolescence, and adulthood, respectively. The proportion of each type of gully numbers in the total gully number is calculated and mapped for describing age structure of a gully system. |
| Convergen-ce structure | Numbers of gullies converging from low-level to high-level. | It reflects the relationship among different types of gullies, i.e., the competition and collaboration for material and energy from different levels of gullies. | |
| Distribution | Elevation difference | Median elevation of different types of gullies | It shows the proportion of gullies distributed in the elevation of the watershed. |
| Aspect difference | Numbers and average lengths of different types of gullies in sunny and shady slopes | It shows the proportion of gullies distributed in the sunny slope (aspect ranges from 90 to 270 degrees) and shady slope (the rest part). These indices are used to detect the distribution tendency on aspect of each gully type. | |
Table 4.
Convergent relationship of three types of gullies.
| Gully Type | Hillslope Ephemeral Gully | Bank Gully | Valley Gully | |
|---|---|---|---|---|
| Convergent relationship | hillslope→bank | hillslope→valley | bank→valley | |
| Numbers | 1725 | 582 | 1531 | 396 |
| Proportion | 75% | 25% | 100% | — |
| Total numbers | 2307 | 1531 | 396 | |
Table 5.
Convergent relationship from bank gullies to different levels of valley gullies.
| Convergent Relationship | Bank Gully to Valley Gully | ||||
|---|---|---|---|---|---|
| First Level | Second Level | Third Level | Fourth Level | Fifth Level | |
| Numbers | 969 | 331 | 133 | 70 | 36 |
| Proportion | 63% | 22% | 9% | 5% | 2% |
Table 6.
Convergent relationship among different levels of valley gullies.
| Level | Convergent Relationship | Numbers | Proportion | Total Number |
|---|---|---|---|---|
| First | 1st→2nd | 220 | 69% | 319 |
| 1st→3rd | 53 | 17% | ||
| 1st→4th | 20 | 6% | ||
| 1st→5th | 26 | 8% | ||
| Second | 2nd→3rd | 41 | 67% | 61 |
| 2nd→4th | 11 | 18% | ||
| 2nd→5th | 9 | 15% | ||
| Third | 3rd→4th | 10 | 83% | 12 |
| 3rd→5th | 2 | 17% | ||
| Fourth | 4th→5th | 3 | 100% | 3 |
Table 7.
Number of gullies in sunny and shady slopes.
| Aspect | Shady Slope | Sunny Slope | |
|---|---|---|---|
| Hillslope ephemeral gully | Number | 1514 (65%) | 793 (35%) |
| Average length(m) | 29.5 | 20.9 | |
| Bank gully | Number | 794 (52%) | 737 (48%) |
| Average length(m) | 48.1 | 50.5 | |
© 2020 by the authors. Licensee MDPI, Basel, Switzerland. This article is an open access article distributed under the terms and conditions of the Creative Commons Attribution (CC BY) license (http://creativecommons.org/licenses/by/4.0/).
Share and Cite
MDPI and ACS Style
Na, J.; Yang, X.; Tang, G.; Dang, W.; Strobl, J. Population Characteristics of Loess Gully System in the Loess Plateau of China. Remote Sens. 2020, 12, 2639. https://0-doi-org.brum.beds.ac.uk/10.3390/rs12162639
AMA Style
Na J, Yang X, Tang G, Dang W, Strobl J. Population Characteristics of Loess Gully System in the Loess Plateau of China. Remote Sensing. 2020; 12(16):2639. https://0-doi-org.brum.beds.ac.uk/10.3390/rs12162639
Chicago/Turabian StyleNa, Jiaming, Xin Yang, Guoan Tang, Weiqin Dang, and Josef Strobl. 2020. "Population Characteristics of Loess Gully System in the Loess Plateau of China" Remote Sensing 12, no. 16: 2639. https://0-doi-org.brum.beds.ac.uk/10.3390/rs12162639
Note that from the first issue of 2016, this journal uses article numbers instead of page numbers. See further details here.