Article

Novel Pole Photogrammetric System for Low-Cost Documentation of Archaeological Sites: The Case Study of “Cueva Pintada”

by
Susana Del Pozo
1,*,
Pablo Rodríguez-Gonzálvez
2,
David Hernández-López
3,
Jorge Onrubia-Pintado
3,
Diego Guerrero-Sevilla
1 and
Diego González-Aguilera
1
1
Department of Cartographic and Land Engineering, University of Salamanca, Hornos Caleros, 50, Ávila, 37008 Salamanca, Spain
2
Department of Mining Technology, Topography and Structures, Universidad de León, Avda. De Astorga, s/n, 24400 Ponferrada, Spain
3
IDR, Institute for Regional Development, University of Castilla La-Mancha, 13001 Albacete, Spain
*
Author to whom correspondence should be addressed.
Remote Sens. 2020, 12(16), 2644; https://0-doi-org.brum.beds.ac.uk/10.3390/rs12162644
Submission received: 16 June 2020 / Revised: 8 August 2020 / Accepted: 13 August 2020 / Published: 17 August 2020
(This article belongs to the Special Issue Sensors & Methods in Cultural Heritage)

Abstract

:
Close-range photogrammetry is a powerful and widely used technique for 3D reconstruction of archaeological environments, specifically when a high-level detail is required. This paper presents an innovative low-cost system that allows high quality and detailed reconstructions of indoor complex scenarios with unfavorable lighting conditions by means of close-range nadir and oblique images as an alternative to drone acquisitions for those places where the use of drones is limited or discouraged: (i) indoor scenarios in which both loss of GNSS signal and need of long exposure times occur, (ii) scenarios with risk of raising dust in suspension due to the proximity to the ground and (iii) complex scenarios with variability in the presence of nooks and vertical elements of different heights. The low-altitude aerial view reached with this system allows high-quality 3D documentation of complex scenarios helped by its ergonomic design, self-stability, lightness, and flexibility of handling. In addition, its interchangeable and remote-control support allows to board different sensors and perform both acquisitions that follow the ideal photogrammetric epipolar geometry but also acquisitions with geometry variations that favor a more complete and reliable reconstruction by avoiding occlusions. This versatile pole photogrammetry system has been successfully used to 3D reconstruct and document the “Cueva Pintada” archaeological site located in Gran Canaria (Spain), of approximately 5400 m2 with a Canon EOS 5D MARK II SLR digital camera. As final products: (i) a great quality photorealistic 3D model of 1.47 mm resolution and ±8.4 mm accuracy, (ii) detailed orthophotos of the main assets of the archaeological remains and (iii) a visor 3D with associated information on the structures, materials and plans of the site were obtained.

Graphical Abstract

1. Introduction

The 3D reconstructions of architectural elements or archaeological sites began to be carried out by measuring discrete points with classic topographic instruments [1]. With the popularization of terrestrial photogrammetry and thanks to advances in sensors, computing speed and new algorithms, it was possible to start proceeding with a massive documentation [2]. Still, there was a certain limitation when the object was elevated (towers, buildings) or was at ground level in areas of low relief (archaeological sites) where perspective deformations occurred [2,3]. For these reasons, photogrammetric acquisitions started being performed from adjacent buildings, cranes, scaffolding, ladders or even balloons and kites [4,5,6,7,8,9] to overcome this limitation of perspective and thus, achieve a nadiral or oblique point of view at different heights. Currently, drones have resolved most of these limitations being the most widely used close-range aerial photogrammetry solution. Drones offer an optimal point of view, either oblique or nadiral, and flexibility in the acquisition allowing adaptative proximity captures to the assets under study [10,11]. They can be also used to reconstruct remote places such as cliffs or gorges [12], impossible to be reconstructed from a terrestrial point of view. Proof of its worth is its widespread use in diverse fields such as agriculture [13] or cultural heritage (CH) [6,14] and even at institutional level for the creation of promotional videos or graphical documents of elements or places of cultural interest [15]. However, it is still a solution that offers restrictions in many cases. Among its most common limitations, can be cited [16,17]: (i) legal issues such as the drone pilot license requirement, (ii) administrative permissions for the flight, (iii) security risks and potential risks of damaging the objects under study, and (iv) technical constraints such as the payload (kind of sensor to be put onboard), autonomy (limited to 20 min on most platforms) and vibrations transmitted during the flight that can affect the quality of the images. All these without mentioning particular regulations of different countries [18], for example in Spain, where drones cannot be used in urban areas outdoors.
In the field of archeology, in addition to these limitations, there is the possibility of raising dust in suspension due to the presence of loose materials (sands, clays) in the deposits, which can affect both the data acquisition and the state of conservation of the assets [19]. This fact is of special importance in those deposits that, even when located outdoors, have protective covers and roofs. This fact limits both the height of the drone’s flight, increasing the chance of having dust in suspension, and the flight plan due to possible losses of Global Navigation Satellite Signal (GNSS). In addition, unfavorable lighting conditions that occur in indoor and semi-indoor scenarios [20,21], require long exposure times which greatly limit the acquisition with some drones’ solutions that lack camera stabilization sensors and have payload limitation resulting in blurry images.
With the present invention, many of the drone’s limitations have been solved. The designed pole-photogrammetry system [22] allows close-range aerial acquisitions at a maximum height of 5 m not only nadiral but also oblique that results in (i) a more faithful to reality reconstruction with walls and vertical elements, and (ii) more detailed cartographic products, although this results in longer data acquisitions. It is a low-cost device that allows not only to ship different type of heavy and quality sensors but also to ensure stability and sharp acquisitions even in unfavorable lighting conditions. This telescopic pole device offers flexibility and portability and therefore, allows pivoting, rotating, and tiling to document hard-to-access places. In this way, it is a photogrammetric solution that can be used in many fields where data acquired from different perspectives is required except for its maximum height of 5 m.
Although there are currently a wide variety of extensible devices that allow high height data acquisitions to improve the oblique point of view [7], none allow nadiral acquisitions and the vast majority lack of a support structure that provides stability which limits the use of a single sensor of low weight [23,24,25,26,27]. Tripod type systems offer great stability but cannot be used in tight spaces and prevents its dynamic use. Most existing devices allow the exclusive use of sensors with internal battery system, without allowing the control of the most suitable acquisition angle and without the availability of anti-vibration systems that guarantees sharp acquisitions.
The pole system presented here has been successfully used in [28], where the use of drones was discarded due to the existence of a roof protecting the archaeological site, the unavailability of GNSS signal and due to the risk of having dust in suspension. This work focuses on the description of this novel pole system and on its advantages as a photogrammetric acquisition platform, especially for complex scenarios such as archaeological settings. In this sense, it does not only guarantees high-quality nadiral and oblique acquisitions due to the greater proximity to the object, but an optimal acquisition geometry thanks to its extendable and adaptable structure in height, the sensor orientation control and the anti-vibration system that allows to capture sharp images even at high exposure times.
Thus, the paper is divided in 4 sections. Section 2 provides the details and specifications of the pole photogrammetric system and fully describes the data acquisition, processing protocol and accuracy assessment. Then, Section 3 describes the archaeological site and shows the main cartographic products obtained and accuracy results. And finally, Section 4 summarizes the main conclusions and findings drawn after the development of this work.

2. Materials and Methods

A terrestrial photogrammetric survey with a bird-eye point of view of the chosen archaeological area was challenging due to: the complex topographic geometry of the remains, the numerous limitations on access to certain areas that may be altered or modified, the large number of acquisitions to cover the entire area and the mandatory use of sufficient number of control and check points to assist in the registration. This section describes the instrumentation used for the photogrammetric survey (the acquisition system and a total station for georeferencing) as well as the process of data collection, processing to 3D reconstruct the remains and the accurate assessment.

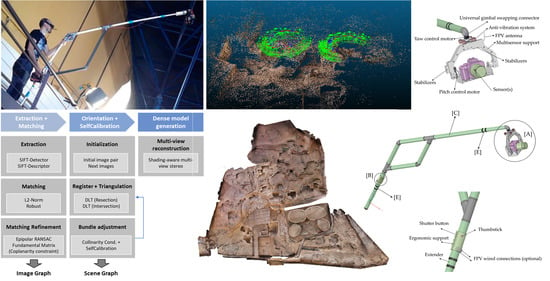
2.1. Pole Photogrammetric System

The pole photogrammetric system called SAMBA (from the Spanish acronym of Sistema de Adquisición aéreo Multisensor de Baja Altura which corresponds to the English acronym of Low Height Multi-sensor Aerial Acquisition System) has an appropriate design that allow to ship different kind of sensors and perform photogrammetric reconstructions of complex scenarios in which there are areas of limited access. The two main sections of the structure can be adapted in length, allowing more suitable points of view as much in height as in distance being able to overcome obstacles. In addition, its design allows pivoting around and making inclined acquisitions to get access to remote and complicated areas from the same point at the ground.
As Figure 1 shows, this innovative system consists on a reinforced double pole structure with a self-stabilizing platform that allows the sensor to be oriented in yaw and pitch to the most suitable framing thanks to a pair of servo motors. The gimbal type support has a snap-on system (Figure 1b) and an IMU that ensures the elimination of low frequency vibrations in the data capture. The latter, added to the dynamic counterbalance effect of the structure, guarantees to acquire sharp images. The platform is fixed by a universal connection to the lightweight (3.18 kg) and ergonomic main support made by aluminum and PVC which can be extended to acquire from the most suitable height and distance in up to a maximum of 5 m in height and 4 m in distance. Its hollow structure allows to carry wiring to power the acquisition sensor and all the devices, including the control that is centralized in the main support through which the servo motors can be controlled (Figure 2a). In addition, the device is equipped with a remote vision system which can be wired or wireless connected with FPV (First Person View) antenna that allows visualization in real time. The shutter button is also located in the main support to facilitate handling.
Below all the elements of the SAMBA system (Figure 1 and Figure 2) are described in detail per unit control:
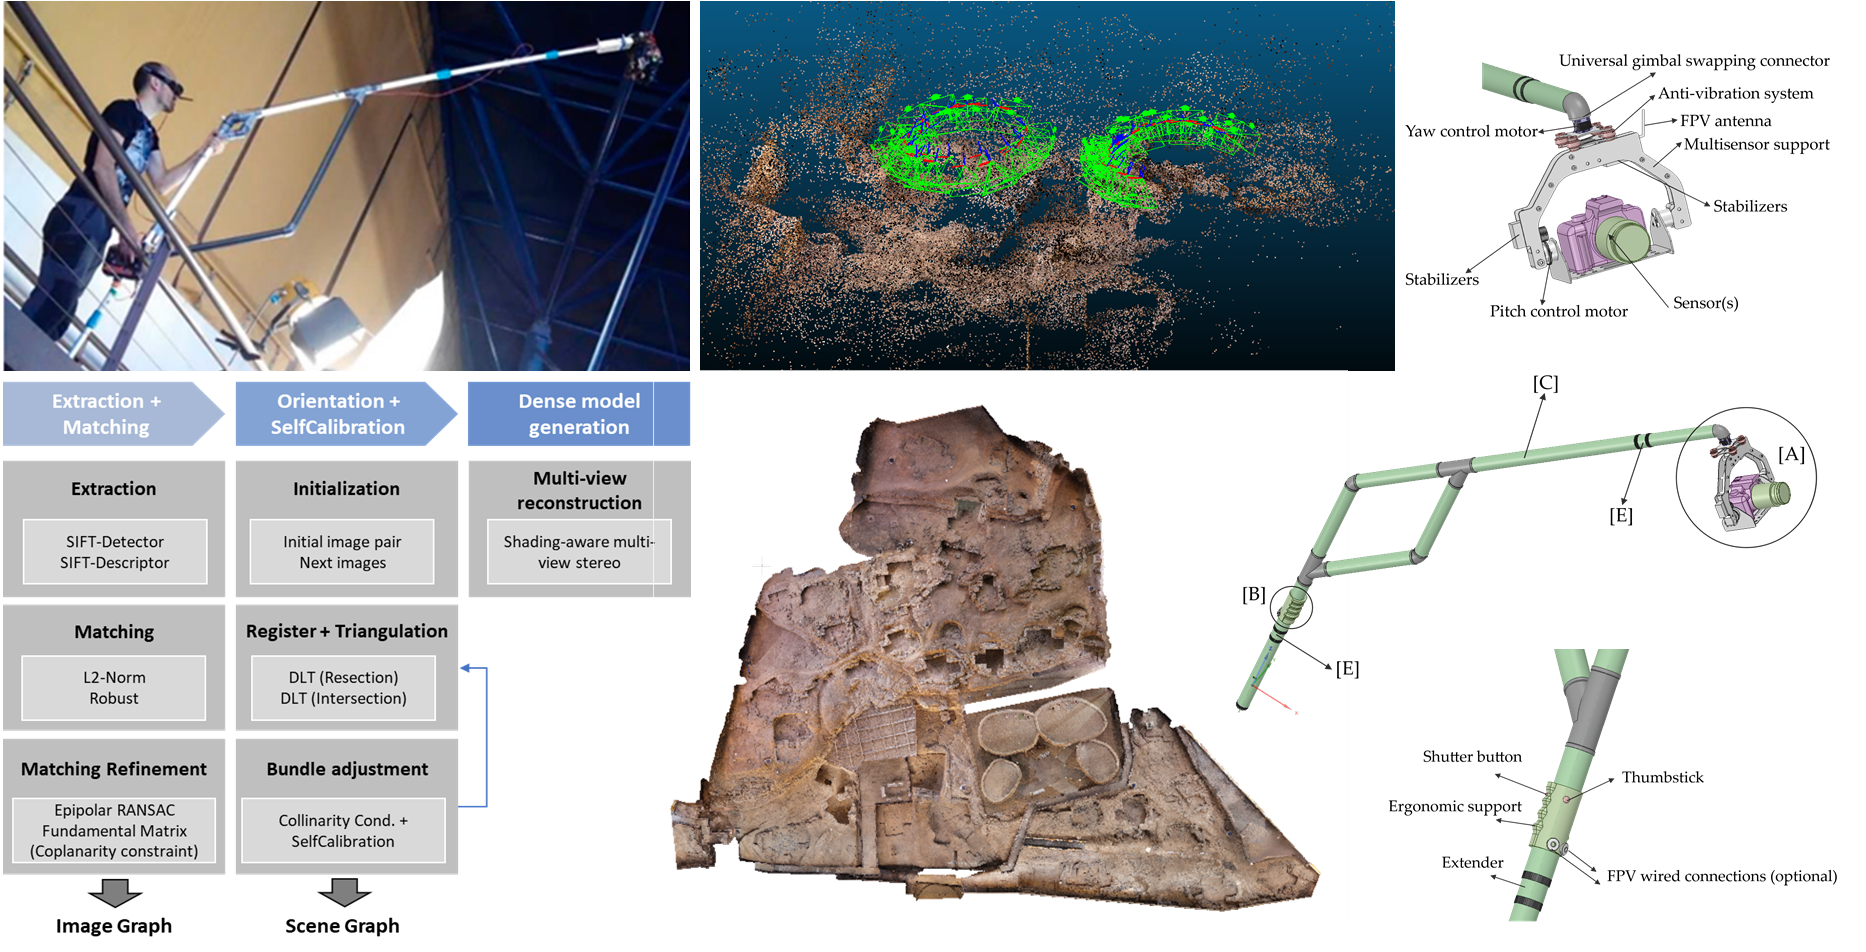
  • [A] Self-stabilizing platform (Figure 1b): It includes a universal gimbal swapping connector that allows the exchange of different types of platforms adapted to the type of sensor used in each case from visible, infrared to multispectral or hyperspectral cameras. The sensors are supplied by wire through the hollow structure towards the batteries by means of power cables with interchangeable pins. This platform has 2 degrees of freedom to guide the sensors according to yaw and pitch thanks to the two rotation motors and two servo-stabilizers that guarantee the position. In order to reduce vibrations that the motors could transmit to the sensors, the platform incorporates an anti-vibration system. To facilitate the manageability of the equipment and the transmission of the signal, the FPV antenna for the remote vision glasses [D] is in the sensor support to guarantee a better signal emission and not hinder the operator.
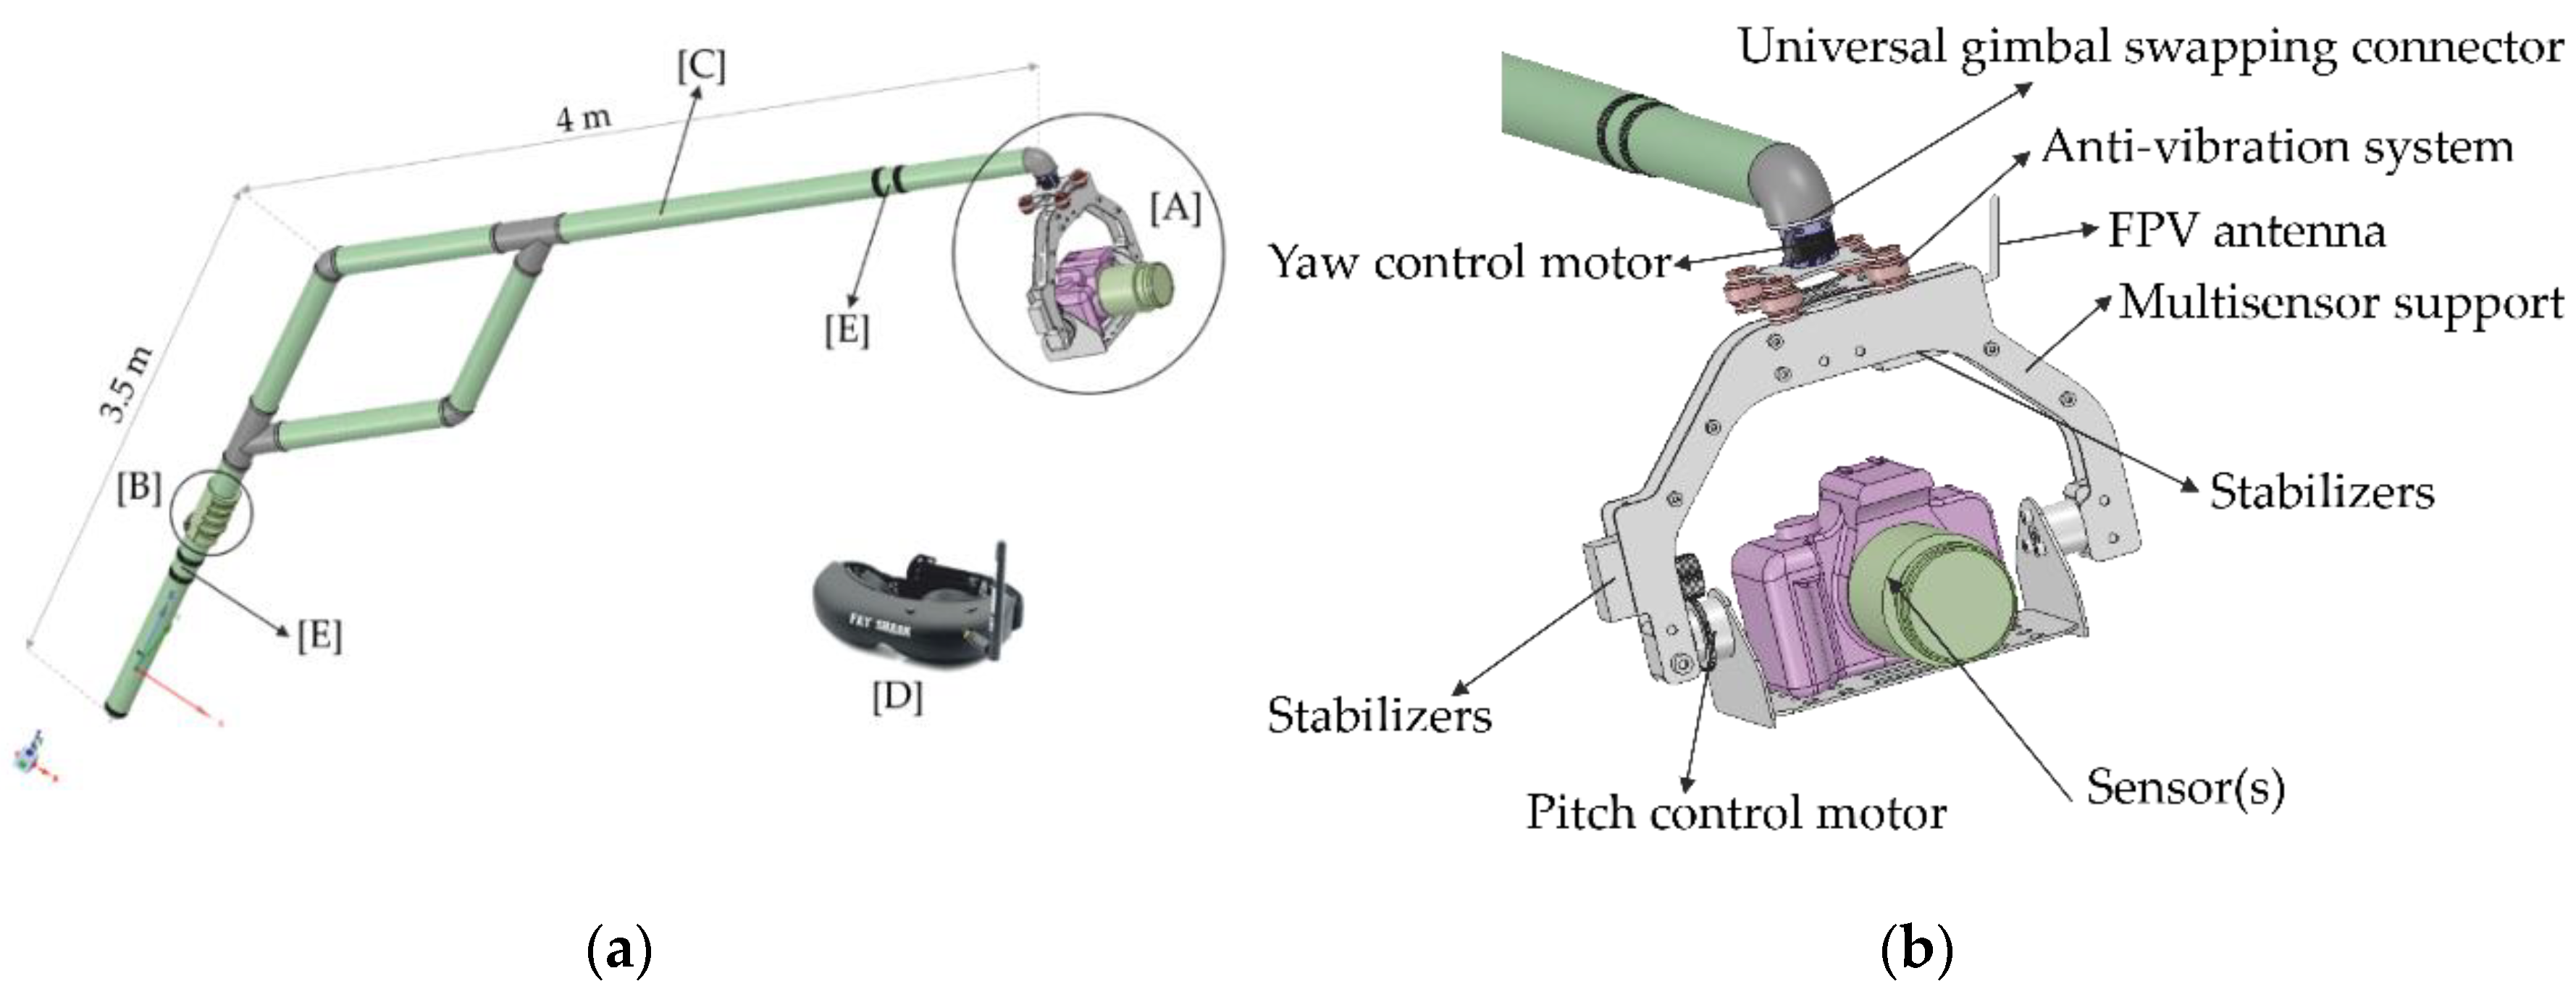
  • [B] Control System (Figure 2a): This unit is centralized in an ergonomic support through which the actuation of the platform motors can be controlled thanks to a thumbstick with potentiometers for both angles yaw and pitch. It is fixed but can be adapted to the characteristics of any operator thanks to the telescopic extenders of the structure. The shutter button is also located on the control unit to facilitate handling while using the SAMBA system and it connects to the sensor in a wired way. Depend on the type of sensor this may involve capturing individual images or starting/stopping video recordings. Finally, two optional wired connections are located for the remote vision system just in case the reception of the antenna signal is not enough.
  • [C] Structure (Figure 1a): The entire system is linked by a light hollow structure, designed in PVC and aluminum, which allows the power supply of all the devices involved: sensors, platform orientation, active stabilizers, remote vision system and shutter control. In the final part of the structure there is an exchangeable regaton that is the one in contact with the ground. It can be non-slip rubber type, for indoor or delicate scenarios, or tip type for outdoor.
  • [D] Remote vision system (Figure 1a): This system consists of a remote vision glasses, which allows both to visualize the point of view of the sensor and control its optimal orientation using the thumbstick and (ii) release both hands to be able to handle the structure. Yaw rotation is limited to prevent the damage of the wiring to the sensors. The video system connection is made, either wirelessly or wired when there is signal interference. It supports a conventional Analog AV video signal in standard NTSC or PAL format. Practically all cameras have a video output in one format or another, either Analog or HDMI, for which an HDMI to Analog signal converter would be required.
  • [E] Telescopic extenders (Figure 1a): The main structure can be contracted to facilitate its transport and can be adapted to the geometric characteristics of each scenario. The lower part unfolds up to 2.5 m, while the upper part can reach up to 4–4.5 m, in order to overcome obstacles and increase the vertical sensor-object distance. Due to the angle designed between the two main structures, it allows the camera to be raised to a maximum height of 3.5 m when using it supported on the ground.
  • Batteries (Figure 2b): LiPo type batteries are located at the bottom of the structure to stabilize its center of gravity. Their purpose is to provide power to all the electronic elements of the system as well as to the different sensors that can be embarked. To avoid having to remove them in each recharge cycle, a charging connection has been provided for them. The wiring is distributed inside the hollow structure with a margin to avoid tension when the extenders are fully deployed.
For the documentation of the “Cueva Pintada” archaeological site, the sensor embarked in the pole system was a 21.1 MP Canon EOS 5D MARK II SLR digital camera which was used with a fixed focal length of 24 mm (Figure 3). This camera is constituted by a CMOS (complementary metal-oxide-semiconductor) sensor which results in images of 5616 × 3744 pixels and 6.4 µm pixel size. It is capable to acquire 3.9 frames per second at 14-bits resolution.
The main advantages offered by this non-invasive pole system and which make it ideal for performing photogrammetric 3D reconstructions of complex scenarios at ground level and with a bird-eye point of view are:
  • Possibility to ship sensors of different nature to enrich and hybridize the 3D model using data acquired from infrared, thermal, multispectral or hyperspectral cameras that can provide relevant information for the investigations at the remains.
  • To serve as a close-range photogrammetric platform alternative to drones for places where their use is not allowed, is discouraged or is problematic due to the possibility of collision risk or of having hidden areas due to the presence of many vertical structures, columns, etc.
  • To allow to overcome obstacles and get into limited access areas thanks to its extendable structure and the possibility of pivoting and tilting the structure.
  • To be handled in a simple way thanks to its light and ergonomic design being able to visualize in real time the point of view of the camera and being able to control the most convenient framing in each case.
  • To ensure sharp images thanks to the dynamic counterbalance effect of its structure and the presence of an IMU and a snap-on system on the sensor platform.

2.2. Total Station

In order to verify that the established accuracy requirements were met, a Topcon Imaging Station IS-301 was used to measure the control and check points of the photogrammetric network designed (Section 2.3). This instrument with iSCAN technology certifies a distance accuracy of ± 2 mm (+ 2 ppm x distance) for prism mode and ± 5 mm (+5 ppm x distance) for non-prism mode. As for the angular precision, it certifies a precision of 1’’ (0.3 mgon) in both vertical and horizontal angles. In its non-prism mode, the IS-301 can measure distances of up to 250 m. This device works under the TOPSURV software capable of increasing measurement productivity thanks to its numerous functionalities.

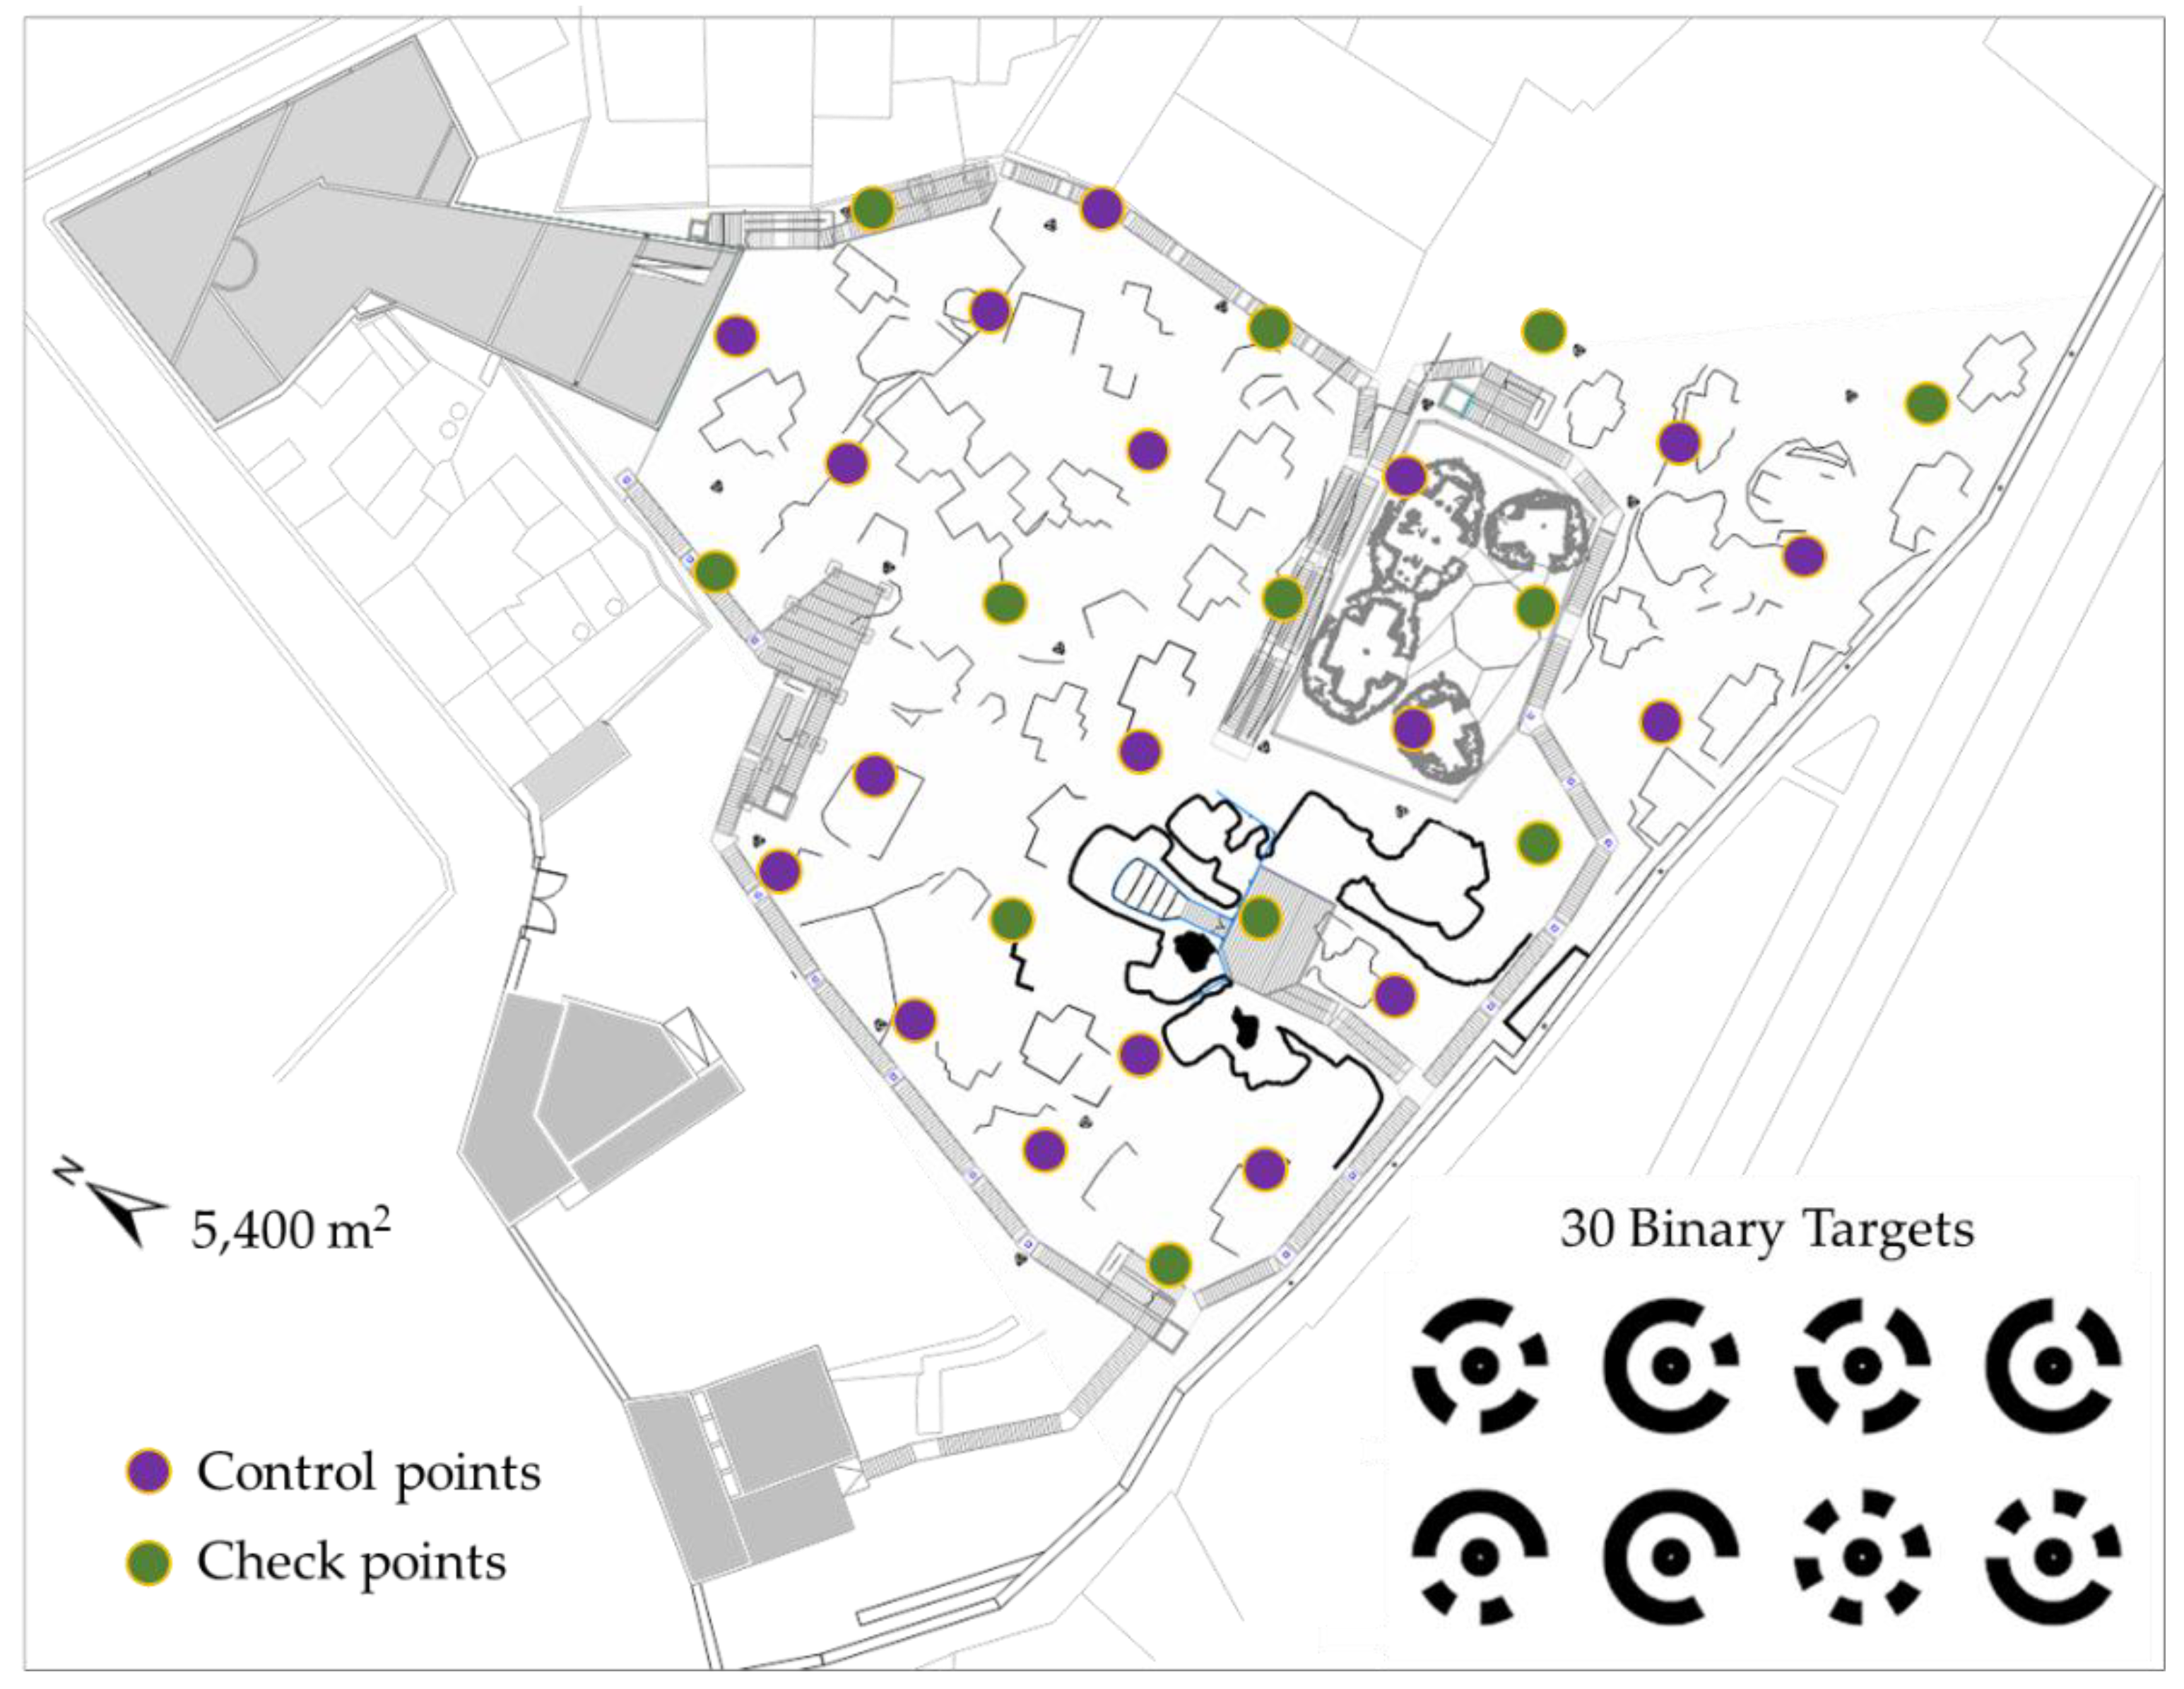
2.3. Network Design and Data Acquisition

In order to guarantee a correct photogrammetric survey, a reference network was designed consisting of a collection of ground control (60%) and check points (40%). The function of the control points is to define the reference system of the block of images acquired, i.e., they are used to determine the position (3 parameters), orientation (3 parameters) and scale (1 parameter). On the other hand, the use of independent check points provides an assessment of the block adjustment quality. This reference network consisted of a set of 30 binary photogrammetric targets of 10 cm diameter 12-bit encoded (Figure 4) that were evenly distributed to guarantee covering the entire archaeological site. These binary targets also helped to scale the photogrammetric model. Particularly, the center of these targets was extracted following the approach developed in [29]. This approach extracts accurately the centroid of each circular target using the Hough transform, a sub-pixel edge detector based on the partial area effect, and a non-linear square optimization strategy. Regarding data collection, it was designed in such a way as to guarantee the complete survey of the remains avoiding the capture of duplicate information. The objective was to determine the optimal number of data acquisition points in such a way that there was neither lack nor excess of information. Finally, the reference network was surveyed with the Topcon IS-301 total station.
Once the reference network was designed and surveyed with the Topcon IS-301, the photogrammetric data was acquired with the pole system as was previously planned. Data planning refers to the initial determination of imagery geometry, given the area of interest, the required end-product and thus the desired accuracy. In the case of classical nadir imagery, the scale (i.e., distance to the object) is maintained approximately constant, the optical axis of the camera is maintained vertical, the forward overlap between images is maintained constant around 70–80%, which ensures a 3-fold coverage for points; and the side overlap around 20–40% which provides enough strong geometry to tie the different strips together. Regarding oblique imagery, for vertical walls, the data planning is more flexible since the camera axis and scale can vary along the archeological site. Hence, the attention for data planning remained around nadir imagery while oblique imagery was acquired freely without any restrictions, except guaranteeing overlap between consecutive images. It should be note that, the idea around integration nadir and oblique images was focused on guarantee the best photogrammetric coverage of the archaeological site, also including information of the vertical walls and other important remains.

2.4. Data Processing

Since data acquisitions with the pole system were not only limited to nadiral but also oblique point of view, the processing of the images was carried out using an incremental Structure from Motion technique supported by GRAPHOS [30] and the ColMap library [31] as illustrated in Figure 5. This library helps to solve the orientation and self-calibration of those photogrammetric acquisition that move away from the ideal nadiral point of view that Semi Global Matching techniques already successfully solve.

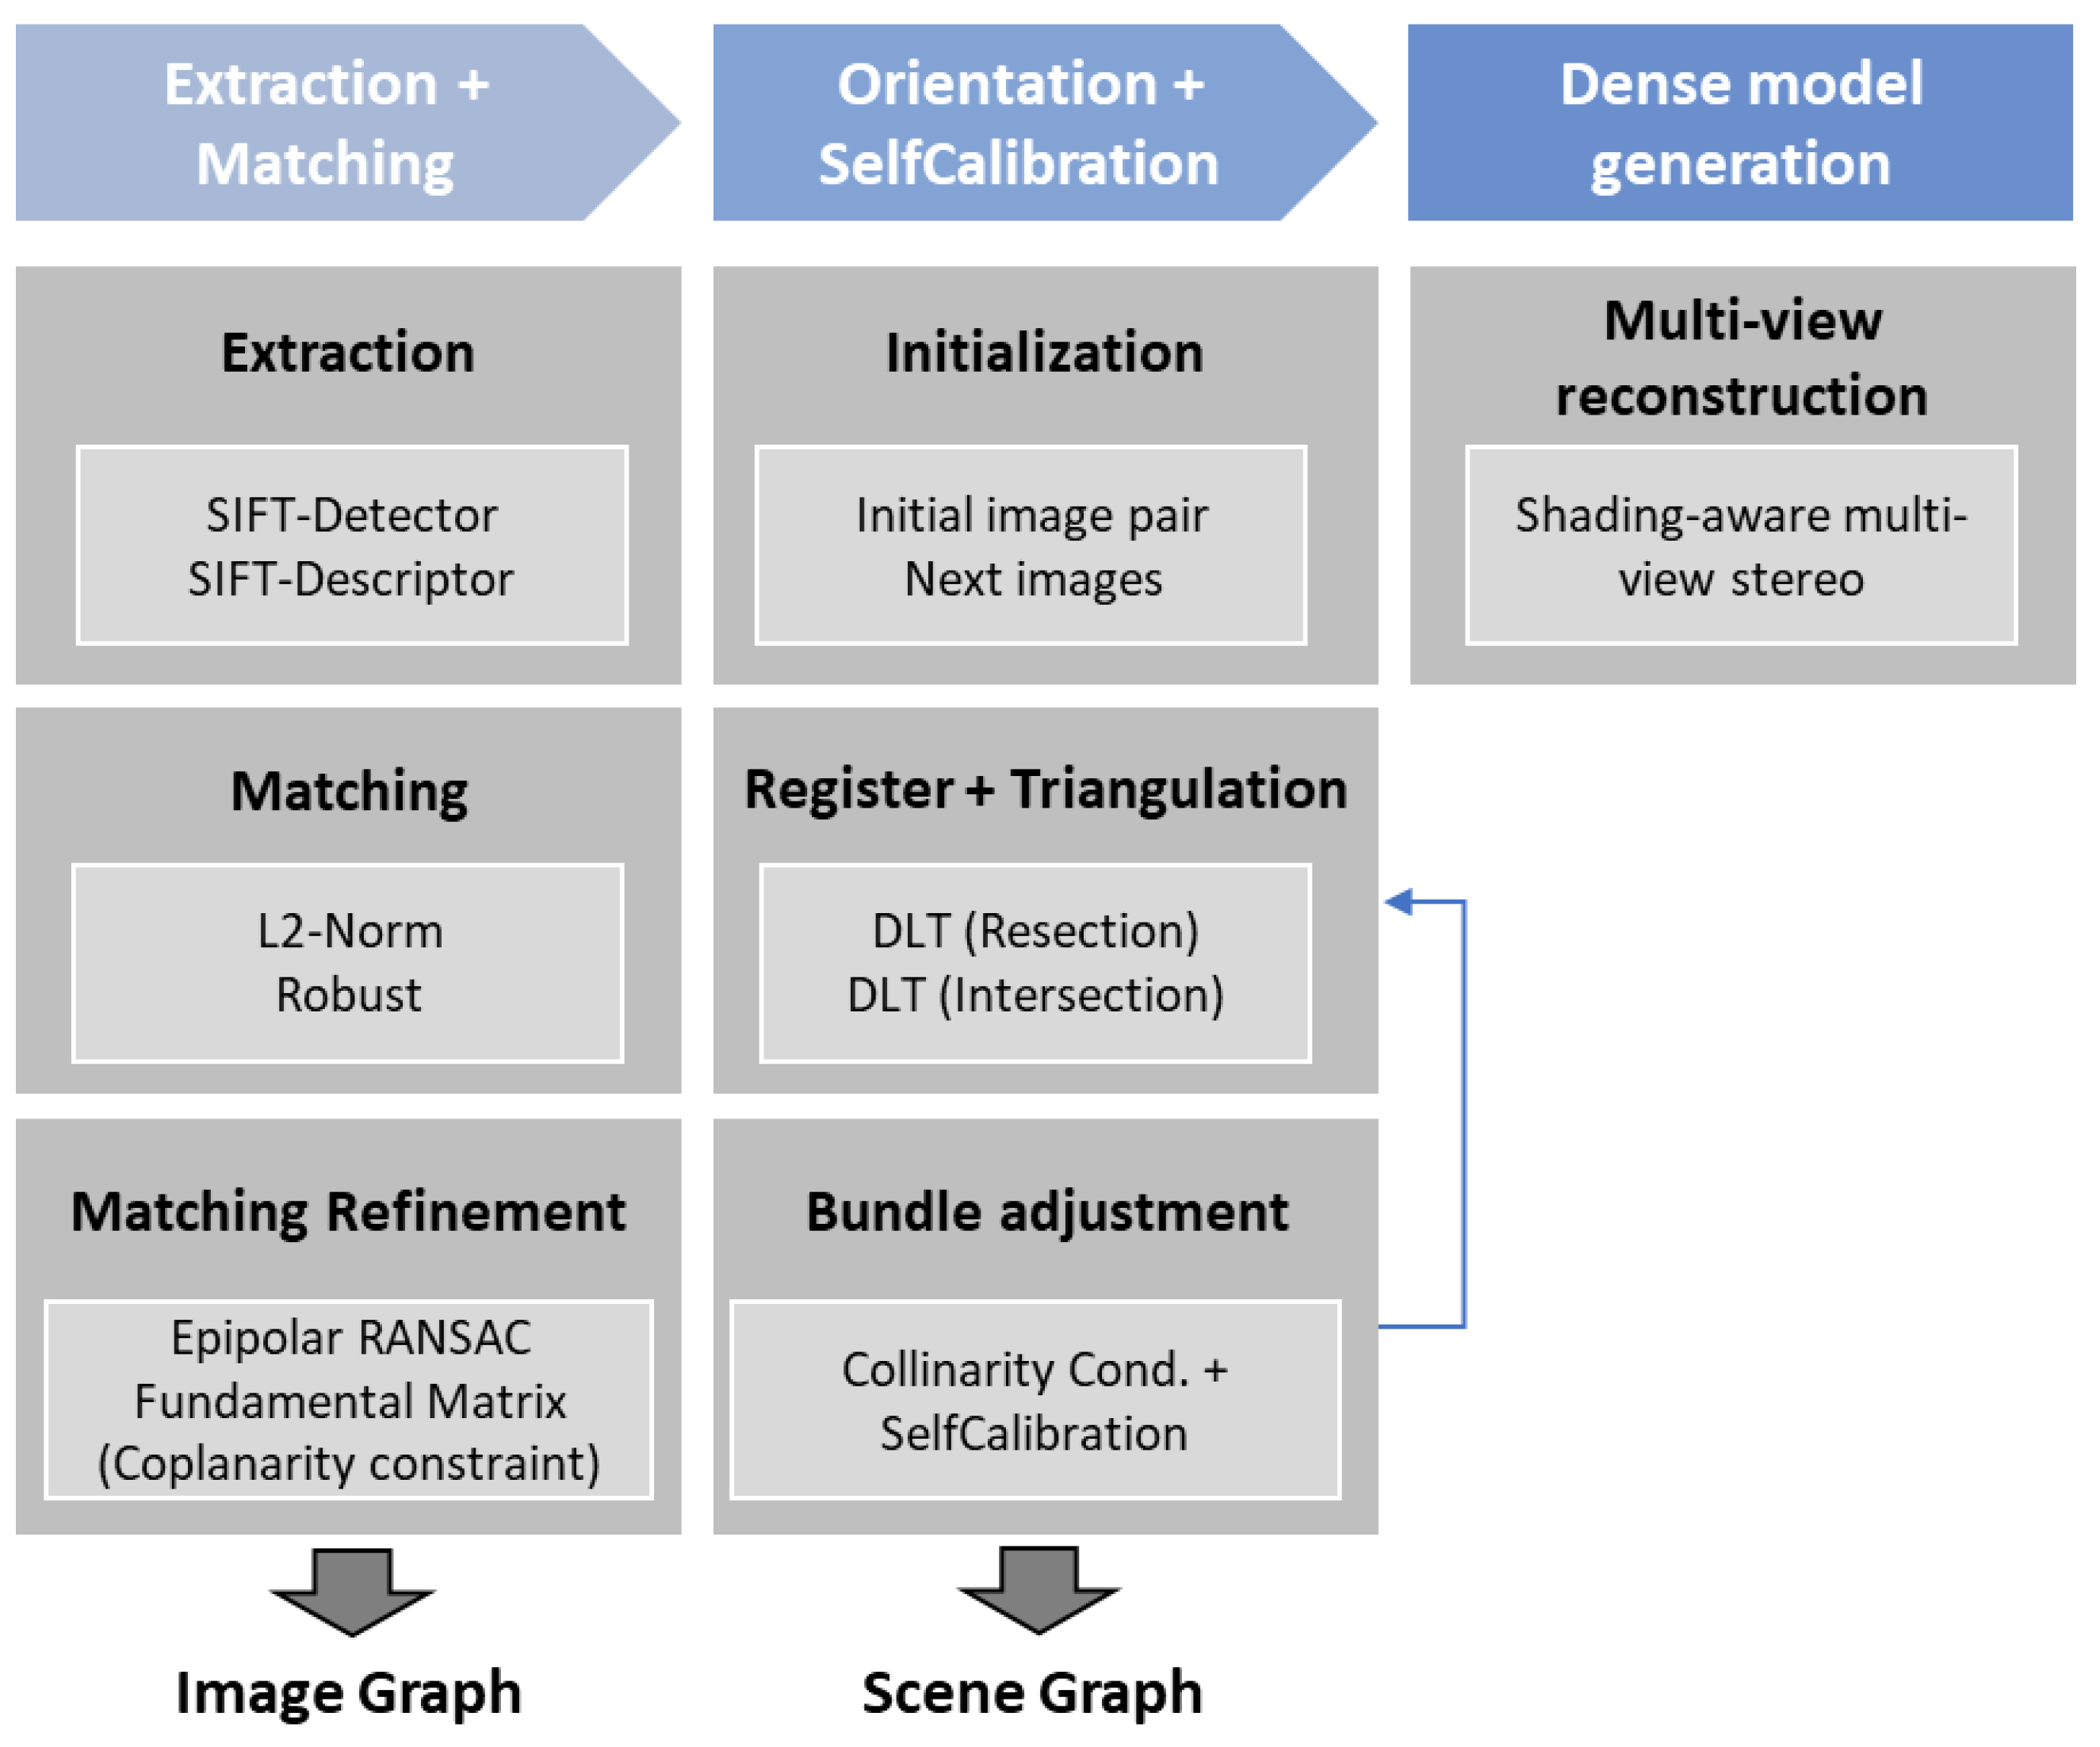
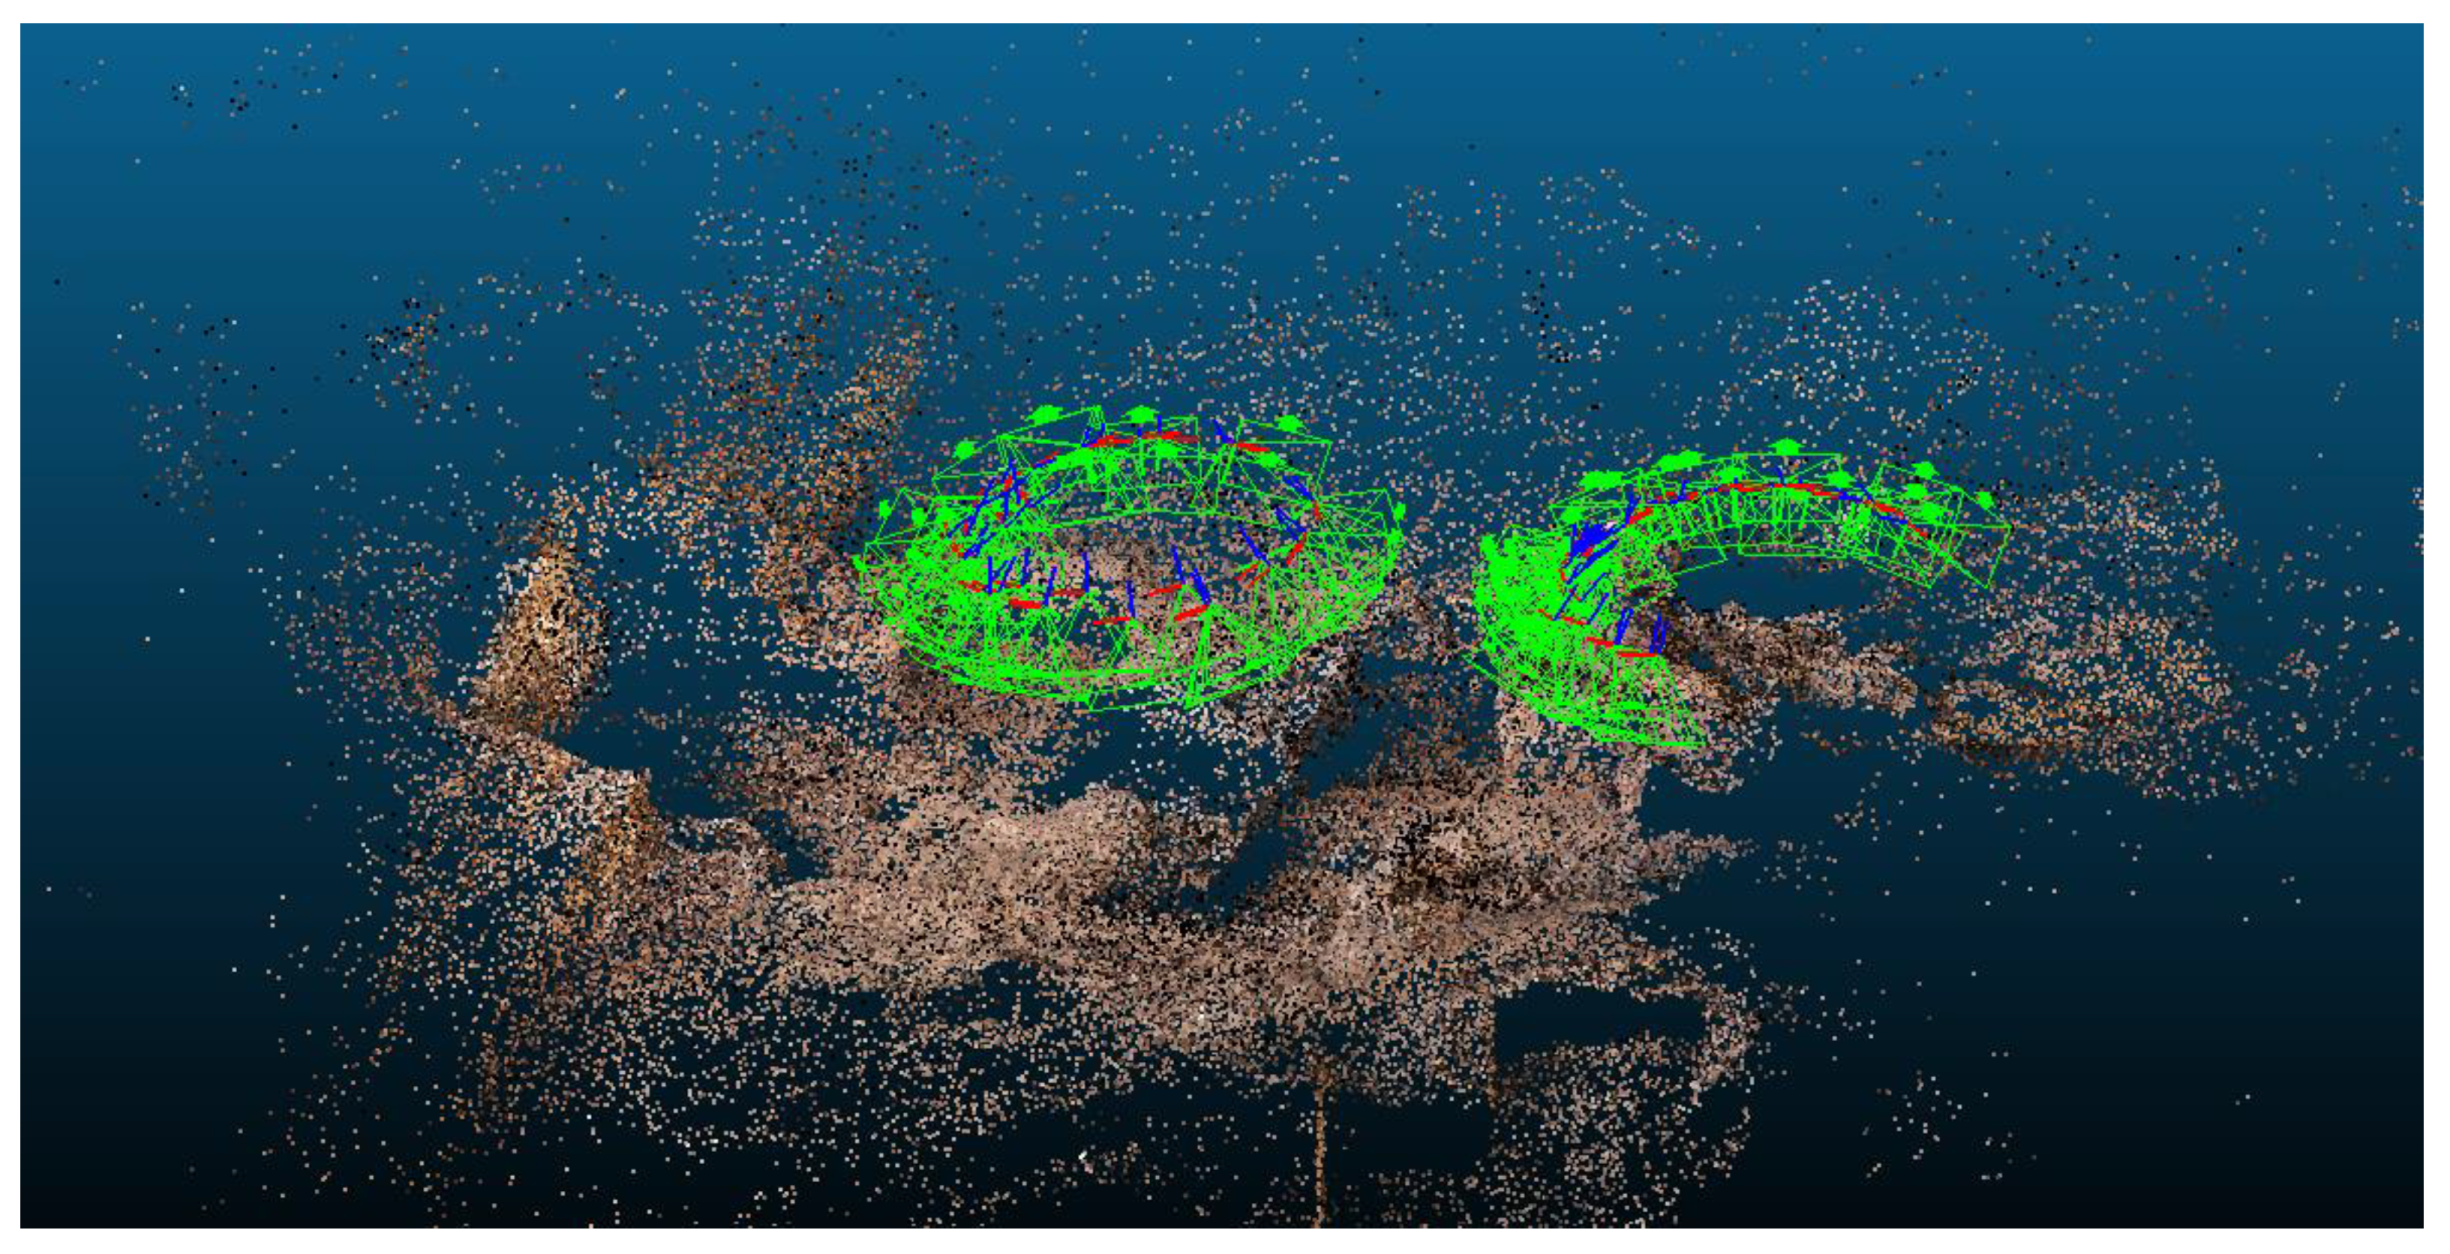
2.4.1. Extraction and Robust Matching of Features

A multi-view matching strategy was implemented based on the SIFT detector and descriptor [32]. For each image, the incremental SfM extracts keypoints based on local features which are invariant to geometric conditions (i.e., scale and rotation). SIFT was chosen among other detectors/descriptors due to its computational efficiency and its robustness with geometrical changes.
Once the keypoints were detected and described, a twofold robust matching approach was applied:
  • First, a robust matching approach based on brute force scheme and L2-Norm distance searches for feature correspondences which enclose the most similar features in the rest of the images. Particularly, for each extracted point the distance ratio between the two best candidates in the other image is compared with a threshold. If it is obtained a high distance ratio, the match could be ambiguous or incorrect. According to the probability distribution function, a threshold > 0.8 [33] provides a good separation among correct and incorrect matches. Those remaining pairs of candidates are then filtered by a threshold which expresses the discrepancy between descriptors. This threshold is established as a percent value in the range [0,1]. The computation is established as maximum descriptor distance (for the whole matches’ pairs) multiplied by K factor. The matches’ pairs whose distance is greater than that value are rejected. This is equivalent to sort all the matches in ascending order of their distances so that best matches (with low distance, or lower than 1-K) come to front. A K = 1 factor implies that not refinement is done (all matches are kept).
  • Second, a robust matching refinement was performed based on geometric constraints (fundamental matrix and epipolar geometry) combined with RANSAC robust estimator [34]. The idea is to improve the first robust matching strategy, which uses only radiometric criterions, with geometric constraints that allow us to verify if the matched points map the same object point. To this end, an approximation of the fundamental matrix was computed with the matchings of the first step, obtaining a first epipolar geometry of image pairs and thus an extra geometric constraint to refine the matchings. The fundamental matrix was solved with 8 parameters using, at least, n ≥ 8 correspondences. Particularly, the term f33 was constrained with the unit value. Due to the ambiguity of the matching process, we define a matching outlier as an incorrect corresponding point that does not coincide to the correct homologous point. Since the matchings are often contaminated by outliers, robust estimators’ techniques, such as RANSAC, are required. Specifically, RANSAC was implemented as a search engine following a voting process based on how closely a matched pair of points satisfies the epipolar geometry. Those matching points which overpass the threshold based on the orthogonal distance to the epipolar line were rejected.
As a result of this feature extraction and robust matching stage, an image graph was obtained with entails that all images are connected and related according with the keypoints extracted and matched.

2.4.2. Orientation and Self-Calibration

The orientation and self-calibration step were performed hierarchically in three steps following the pipeline of Figure 5 middle.
  • First, an initialization of the first image pair was carried out selecting the best pair of images. To this end a trifold criterion was established for selecting the initial image pair: (i) guarantee a good ray intersection; (ii) contain a considerable number of matching points; (iii) present a good matching points distribution along the image format. Note, that initialize with a good image pair usually results in a more reliable and accurate reconstruction.
  • Second, once the image pair was initialized, image triangulation was performed through the direct linear transformation (DLT) using 3 parameters corresponding to the object coordinates (X,Y,Z) [35] and taking the matchings points and the camera pose provided by the fundamental matrix, as input data. Afterwards and considering this initial image pair as reference, new images were first registered and then triangulated using again the DLT. The DLT allows us to estimate first the camera pose and then to triangulate matching points in a direct way, that is without initial approximations.
  • Third, although all the images were registered and triangulated based on DLT, this method suffers from limited accuracy and reliability which could drift quickly to a non-convergent state. To cope with this problem, a bundle adjustment based on collinearity condition [36] was applied with a threefold purpose: (i) compute registration and triangulation together and in a global way; (ii) consider the estimation of the inner parameters of the camera, self-calibration; (iii) get more accuracy and precision in the images orientation and self-calibration, using an non-linear iterative procedure supported by collinearity condition that minimizes the reprojection error.
As a result of this orientation and self-calibration stage, a scene graph is obtained with entails that all images are connected and related according with the camera pose (rotation matrix and translation vector), without forgetting the inner parameters of the camera (self-calibration).

2.4.3. Dense Model and Orthoimage Generation

Solved the orientation and self-calibration of the imagery dataset, a multi-view reconstruction approach [37] that combines stereo and shape-from-shading energies into a single optimization scheme was used. Particularly, this method uses image gradients to transition between stereo-matching (which is more accurate at large gradients) and Lambertian shape-from-shading (which is more robust). Furthermore, the dense model generation approach uses an energy function that can be optimized efficiently using a smooth surface representation based on bicubic patches [38] which allows to define a surface per view that has continuous depth and normals.
Last but not least, the final step is to generate a final product in the form of an orthoimage. In particular, the inverse method [39] was used to generate the orthoimage. In this case, the images with known camera pose and inner parameters are needed, as well as the 3D dense model generated previously. Subsequently, the size of the orthoimage (resolution) is defined according to the size of the pixel in ground units. The photogrammetric process called orthoprojection basically consists of rectifying the original image, which is a central projection, to eliminate the differences between this and the orthogonal projection. Specifically, a photogrammetric backward spatial intersection based on well-known collinearity equations was used. In practice, for each point of the orthophoto plane (X, Y), a point of coordinates (x, y) is computed in the original image by a photogrammetric backward process. In addition, the orthophoto generation considered the Z-Buffer algorithm [40] to minimize occlusions and shadows, computing the distances between the projection center and object points. The closest object point will be visible while others will be occluded considering collinearity model. As there was no perfect match between points and pixels, the final colour of the orthophoto pixels was generated based on a bilinear interpolation based on four neighbouring pixels (x, y).

2.5. Accuracy Assessment

The hypothesis that errors follow a Gaussian distribution sometimes is not verified in the case of photogrammetric data, due to the presence of residual systematics errors, but also unwanted objects not correctly filtered out from the data [41]. Therefore, the possible presence of bias, and/or outliers, may hinder the use of Gaussian statistics like the mean and the standard deviation [42] since they may not provide a suitable analysis [43]. Thus, the largely used mean and the standard deviation [42] are complemented with the following robust estimators: the median m, and the normalized median absolute deviation—NMAD [44] (1),
NMAD   = 1.4826 MAD
Being the median absolute deviation—MAD (2), i.e., the median (m) of the absolute deviations from the data’s median (mx):
MAD = m ( | x i m x | )
The robust statistical estimators are computed by a custom script as well as the in-house statistical software (STAR—Statistics Tests for Analyzing of Residuals) [45].

3. Results

The viability, performance and advantages of using the designed pole system for the 3D documentation of complex scenarios were proved in the remains of the “Cueva Pintada” archaeological site in Gáldar, Gran Canaria. Within a conservation and monitoring project funded by the Cabildo of Gran Canaria, a detailed documentation of these remains based on a photogrammetric survey was requested, establishing as minimum requirements of the final model a spatial resolution of 8 mm and an accuracy of 2 mm. Next, the archaeological remains and the cartographic products obtained are described and analyzed in detail.

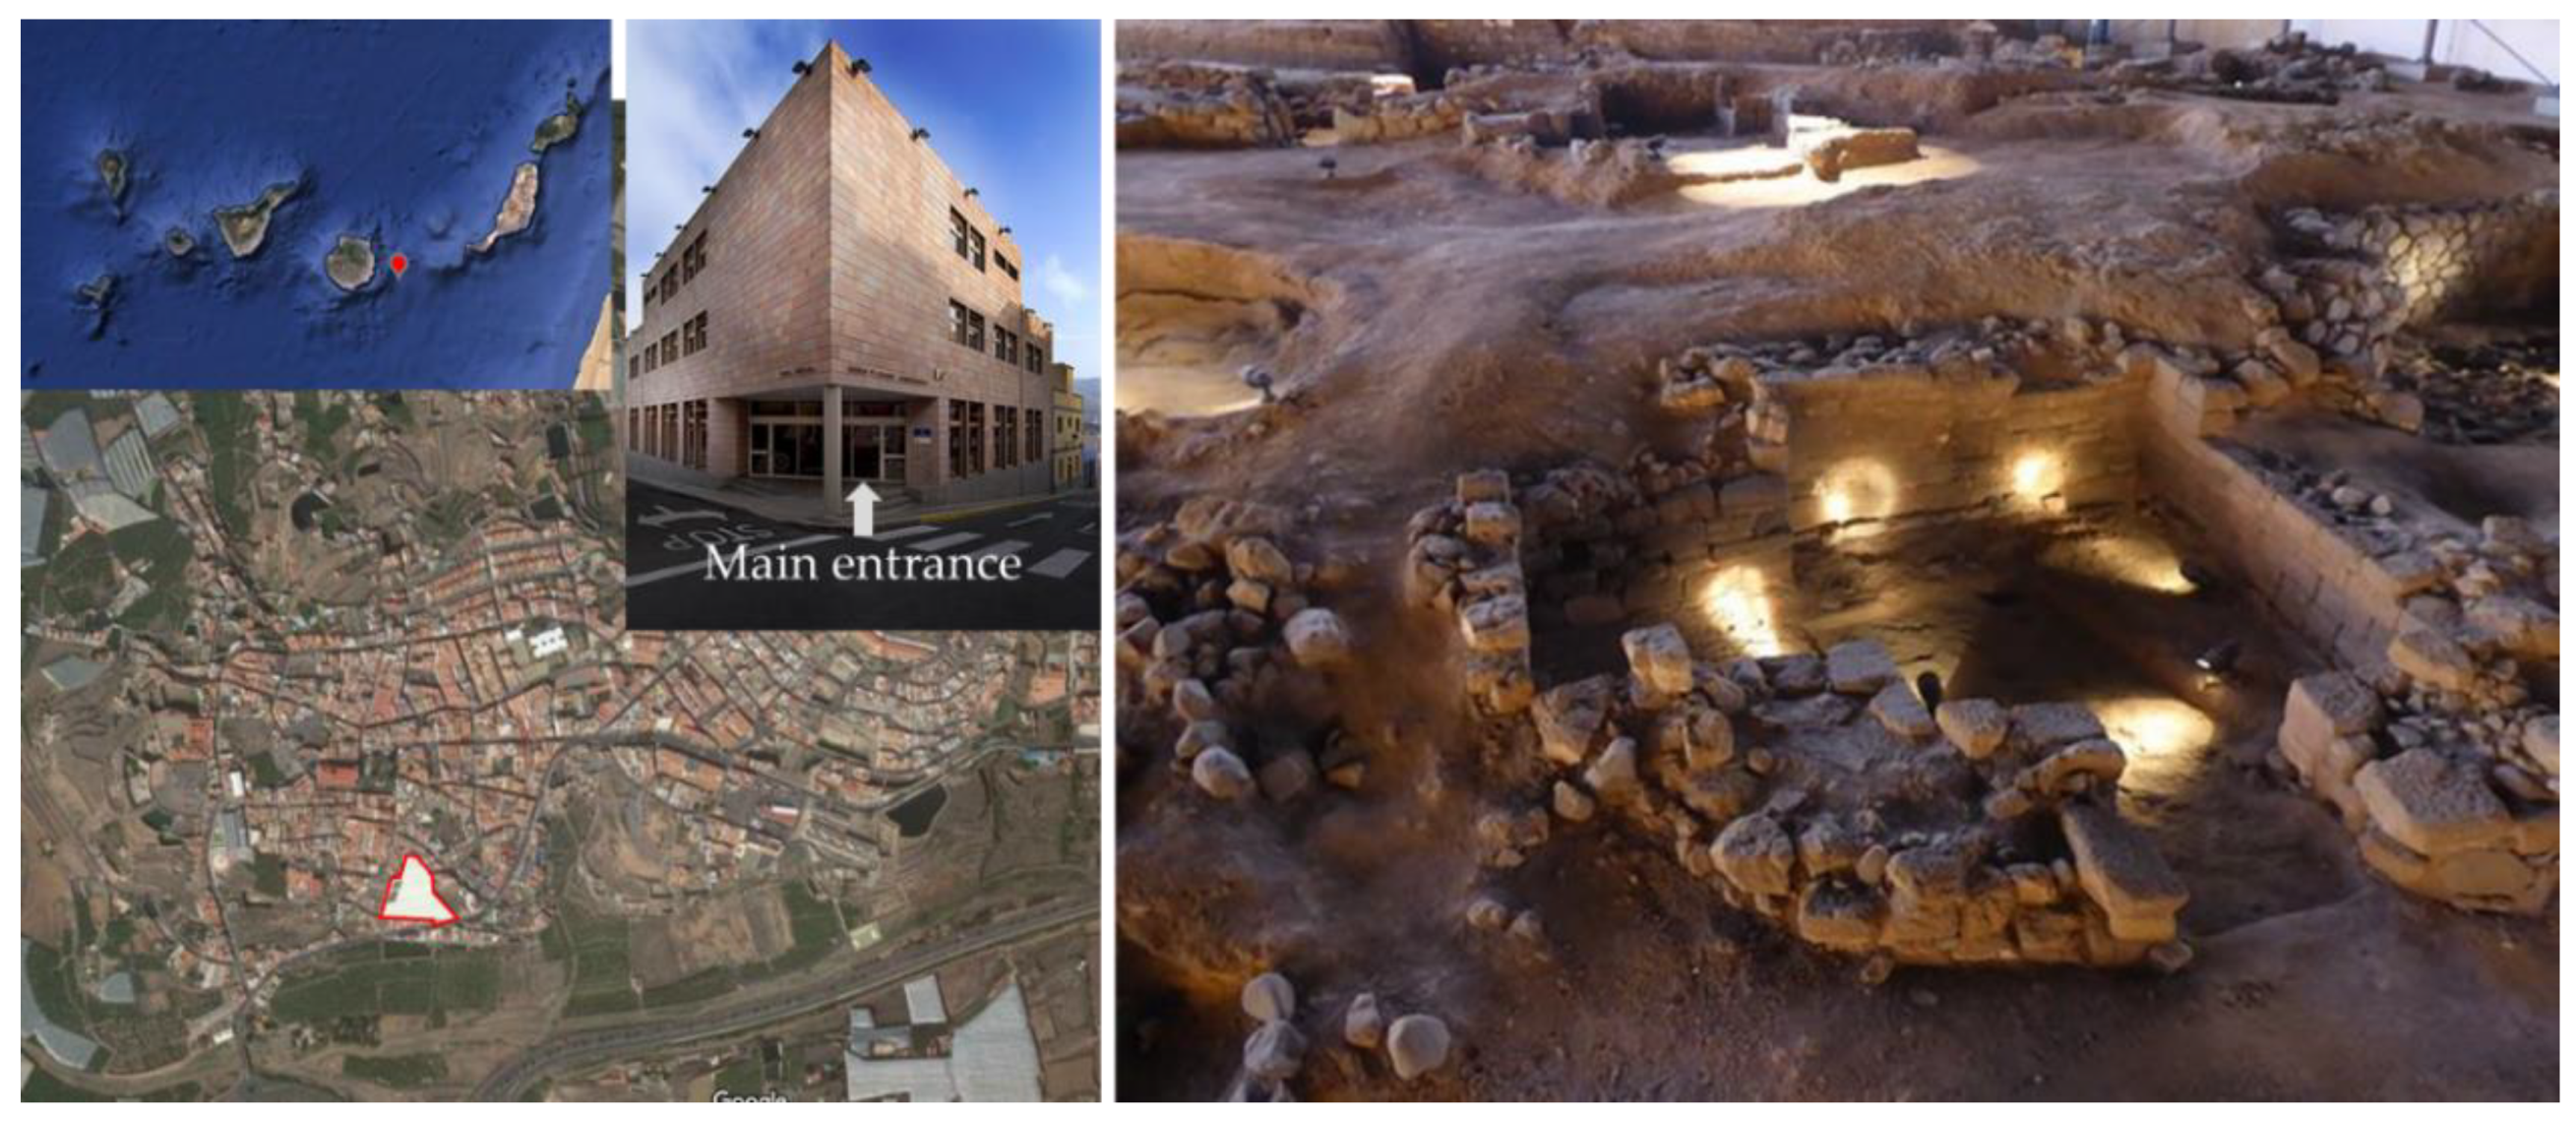
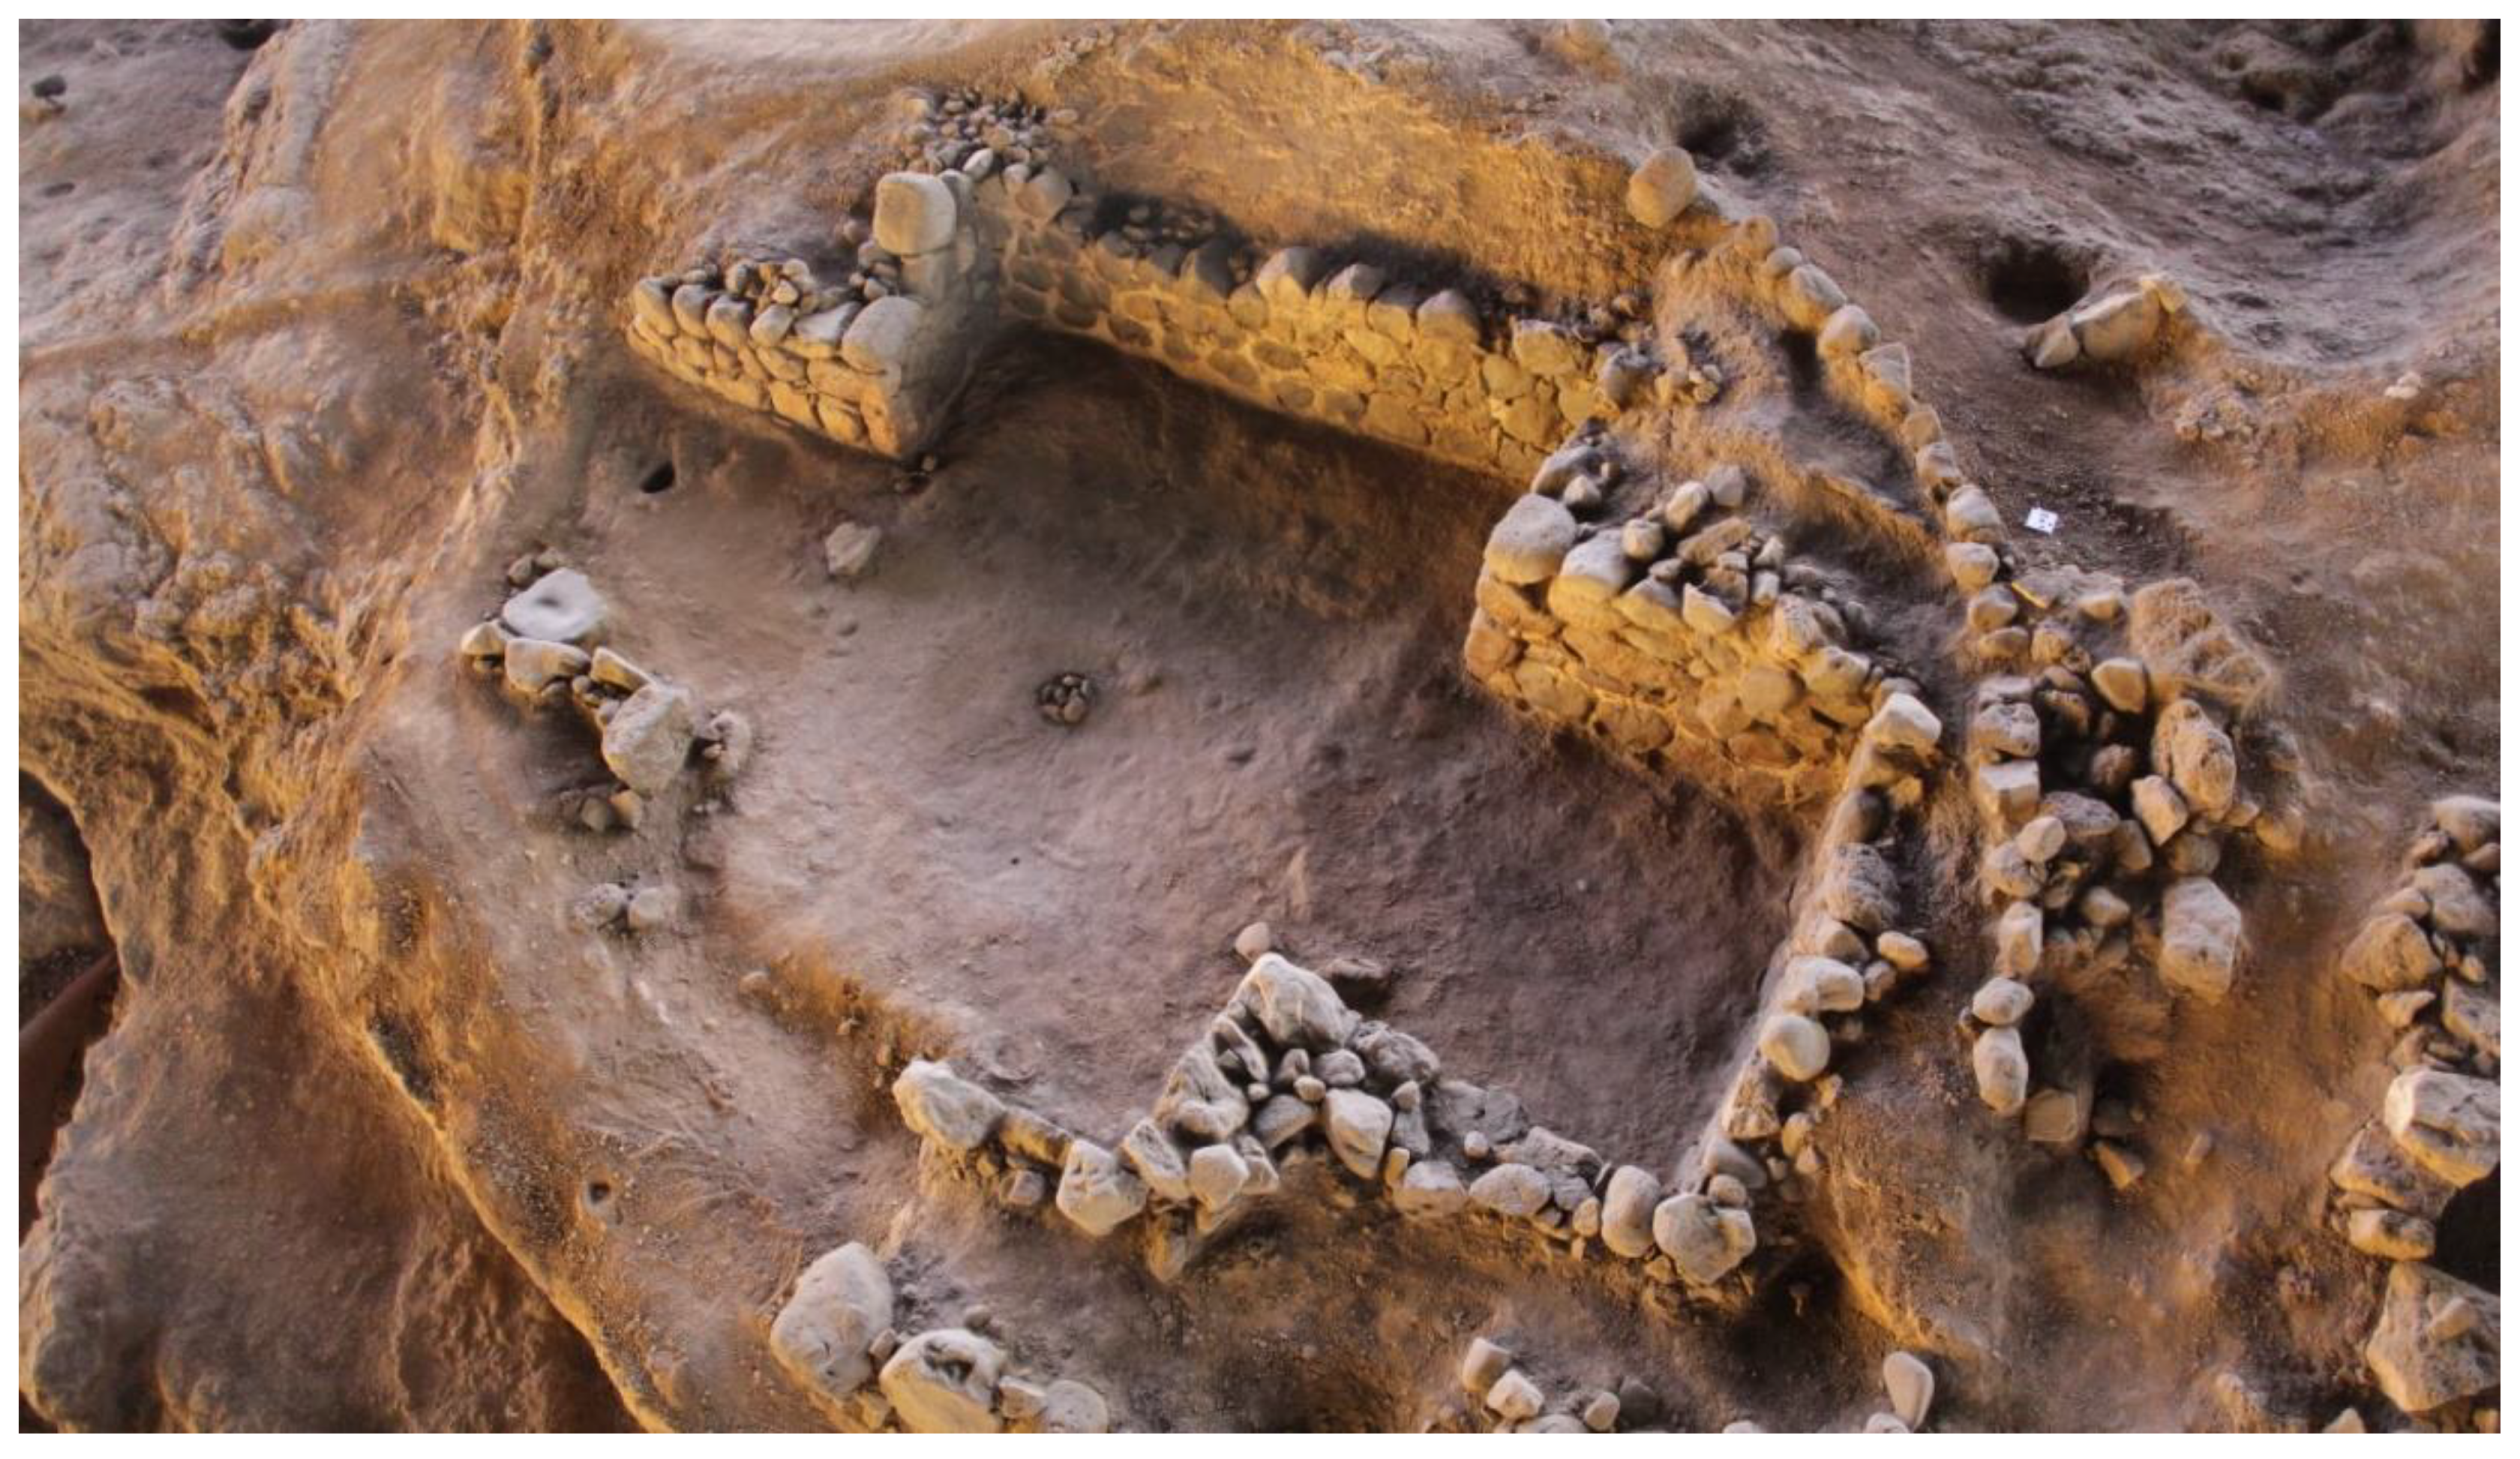
3.1. The Archaeological Site of “Cueva Pintada”

The monitoring and conservation status assessment of “Cueva Pintada” in Gáldar is the purpose of a research project of the Cabildo of Gran Canaria regarding CH conservation that started in 2015. In this place, different research and innovation tasks were developed with the aim of monitoring the degradation processes of the ruins as well as to aid in the decision making regarding the preservation and conservation of the heritage assets. The area of investigation is an archaeological settlement of 5400 m2 located in Gáldar (Figure 6), Canary Islands (Spain), that was discovered in 1862 due to some agricultural works in the area. More than twenty years of excavations have revealed an entire settlement close to the so-called “Cueva Pintada” [46]. This hamlet used to extend from the bottom of the valley to the center of the current city and was occupied from the 6th to the 11th centuries, and again from the 13th to the 16th centuries. It is an indoor archaeological site located at 99 m above sea level and with a large drop that is saved by 6 terraces in which there are 21 remains of houses around the decorated chamber “Cueva Pintada” [47]. The houses were quadrangular and surrounded by circular walls. They had one or two side rooms, which opened to the south through a small corridor (Figure 6). The tuff bedrock was used to support the walls against it and worked to form a flat floor in the houses. The floor was further covered with compacted sustrata or, in some cases, with ashlars of tuff sometimes colored with red ochre [48]. The walls were made of basalt or well-dressed tuff blocks. Almost all the houses have preserved remains of mortar and paintings of various colors that decorated the rooms.

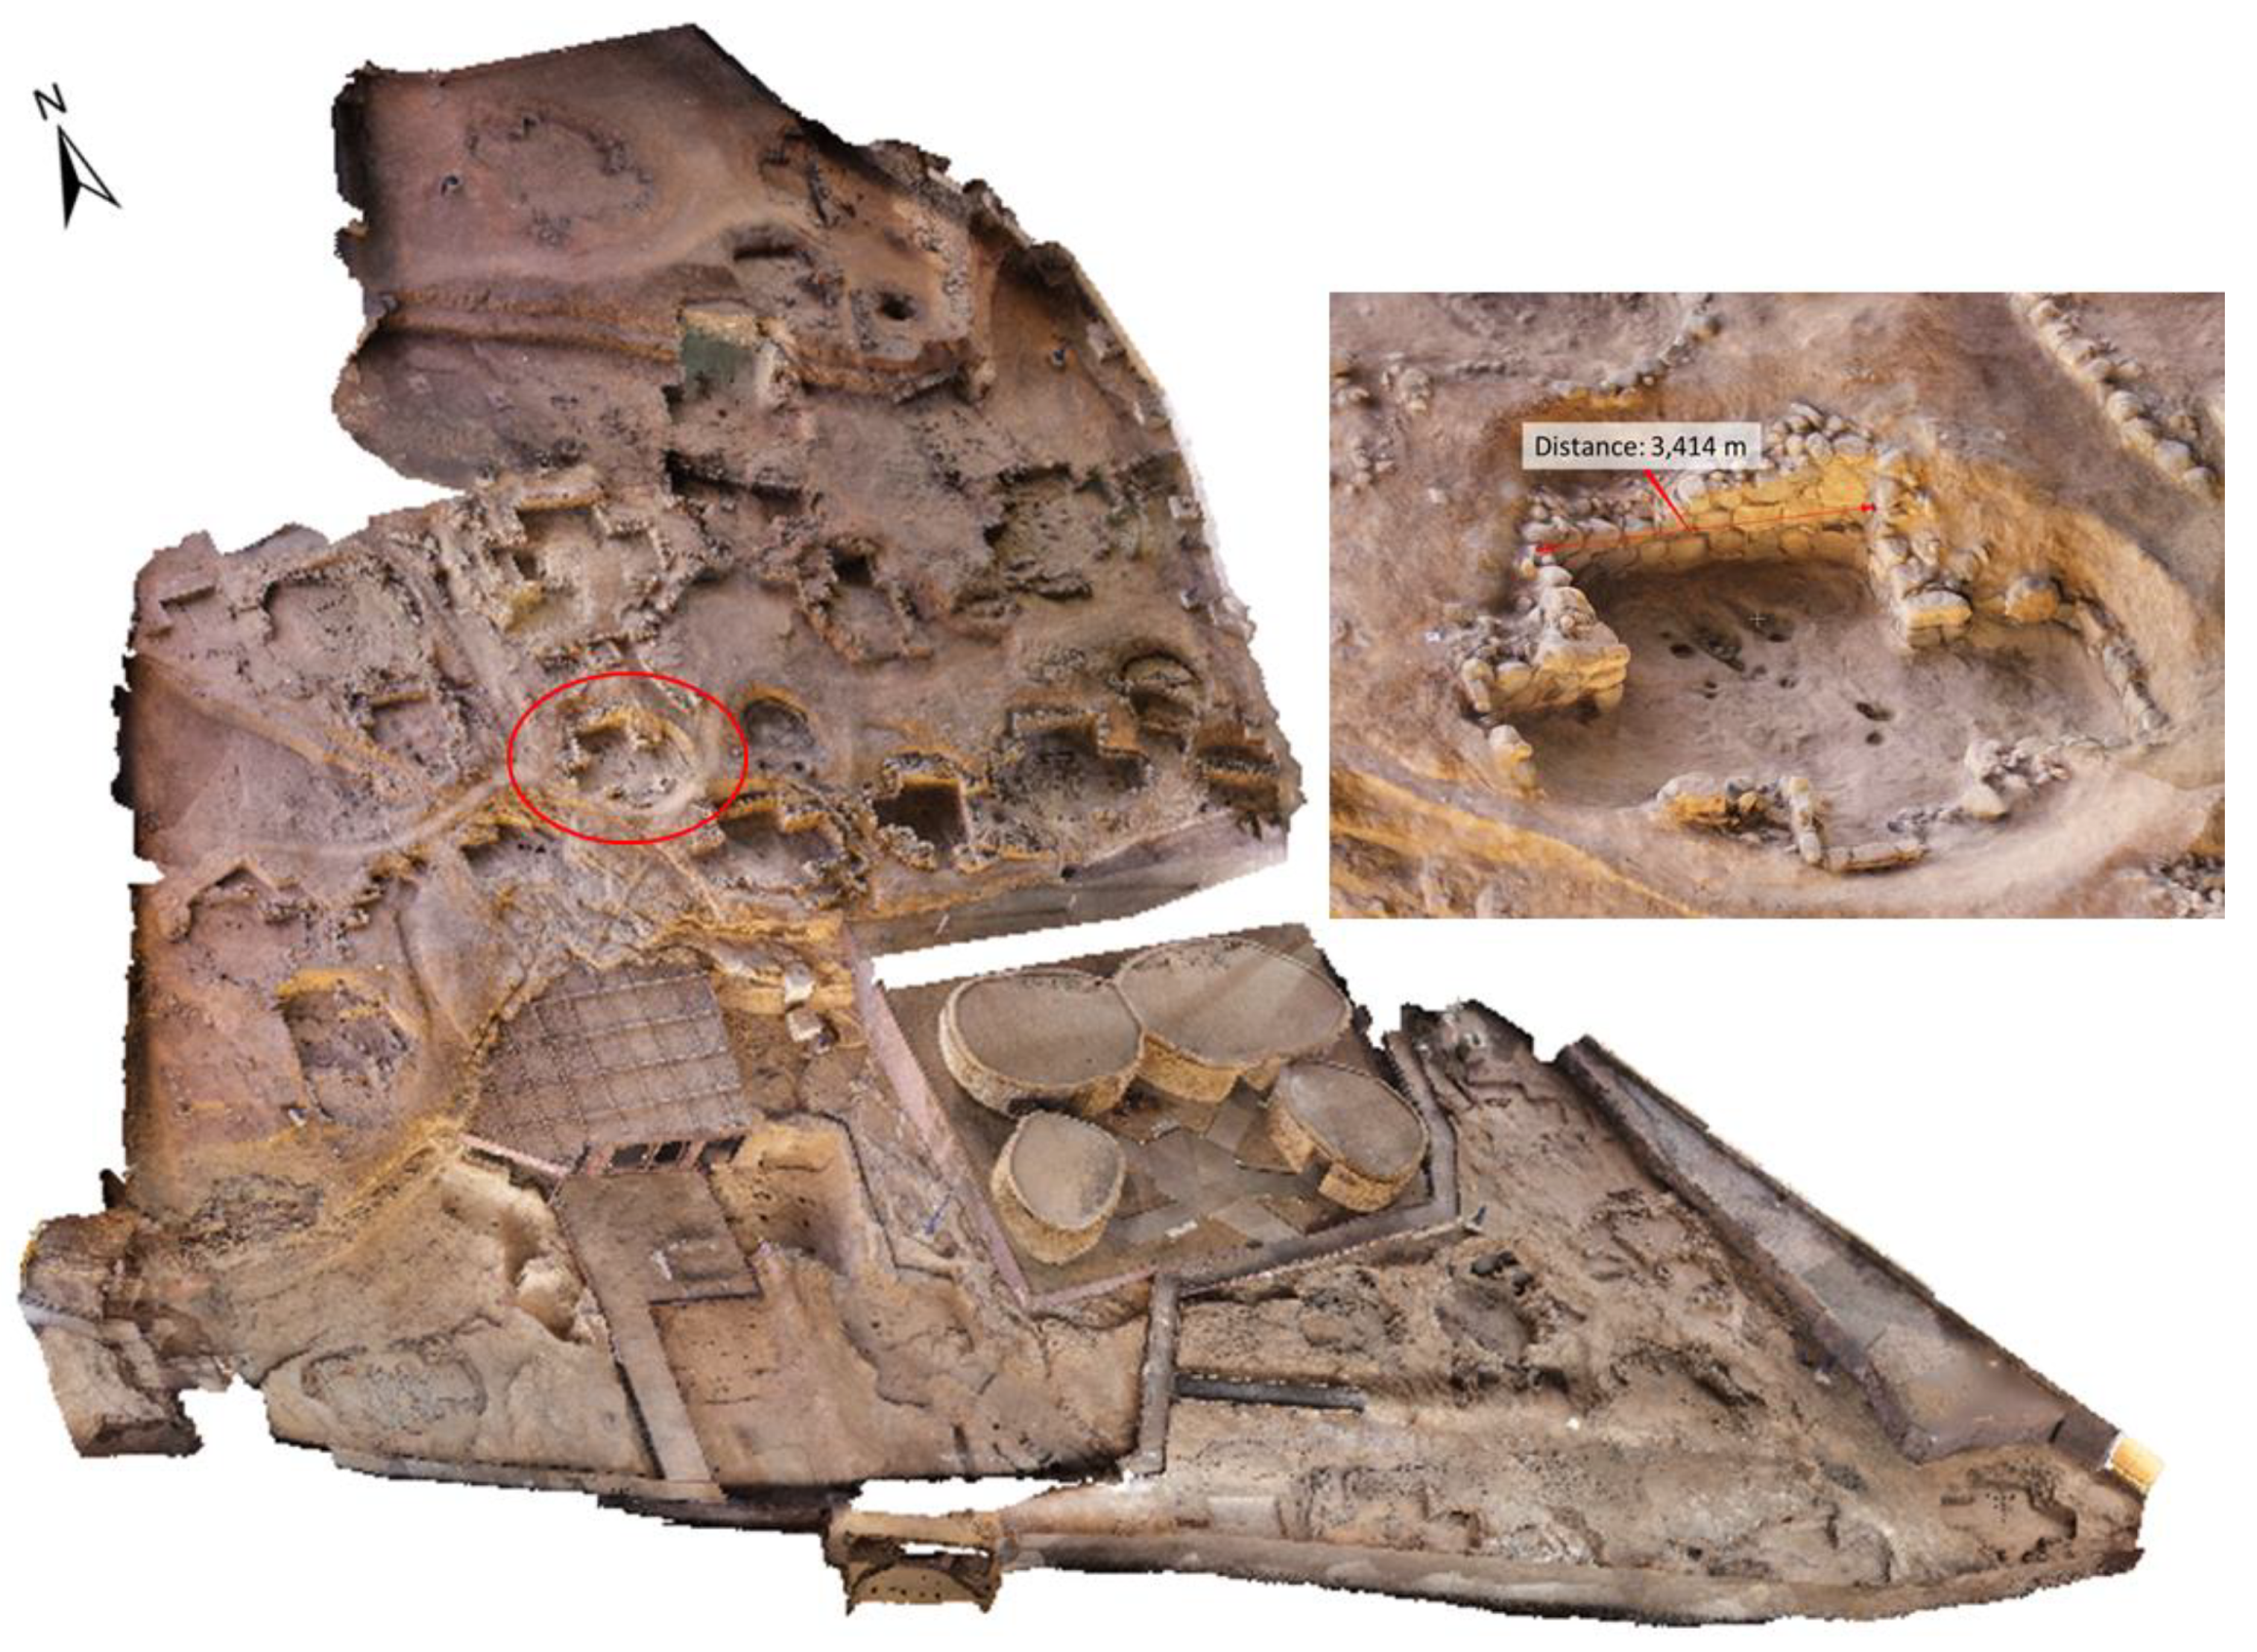
3.2. Data Acquisition and 3D Model Generation

This archaeological site represented a challenge for its photogrammetric documentation due to being an indoor scenario, with restricted access to many areas and morphological and dimensional complexity, which therefore required many photogrammetric acquisitions with the pole system. The novel pole system allowed solving the 3D reconstruction of this place, with photogrammetric quality and guaranteeing the acquisition of sharp images even in dark areas where high exposure times were required.
Specifically, the data acquisition consisted of 3500 images, both nadiral (Figure 7) and oblique (Figure 8) to reconstruct the walls and vertical areas, at a height between 2 and 4 m, ensuring a ground sample distance between 0.6 and 1.3 mm. Some acquisitions, like the one representing on Figure 7, were made at higher altitudes since some structures and stairs available at the site for visitor access were used for the acquisition. From this initial set of images, a pre-selection of 2800 was made based on the quality of the images in terms of focus, exposure and shooting angles. For the matching process, 18 of the 30 binary photogrammetric targets (control points) were used and the other 12 were used in the validation stage (check points). As a result, a 1.47 mm photogrammetric model resolution in terms of Ground Sample Distance (GSD) and 8.4 mm accuracy in terms of RMSE were obtained, meeting the requirements established by the restoration project (introduction of Section 3).
To simplify the 3D model generation, the 2800 pre-selected images were separated into three groups with enough overlap between them. Once the orientation of the images was performed (Figure 9), the point clouds were densified, the triangular meshes were generated and the textures were assigned to them. In these textured models, the reference targets surveyed with total station were identified and the coordinates from the Topcon IS-301 were assigned to them. After this georeferencing and with coordinates in the global system, the three dense point clouds and the definitive triangle meshes were generated by Poisson equation [49]. Then, the three triangular meshes groups were merged into one and the textures were regenerated for the final mesh model (Figure 10). Table 1 collects the details of the photogrammetric products generated among which a final photorealistic surface model of 3.69 million triangles was obtained after applying a simplification procedure of the mesh [50]. The aim was to reach the spatial resolution criteria established by the restoration project (see the introduction of Section 3) gaining manageability of the final model.

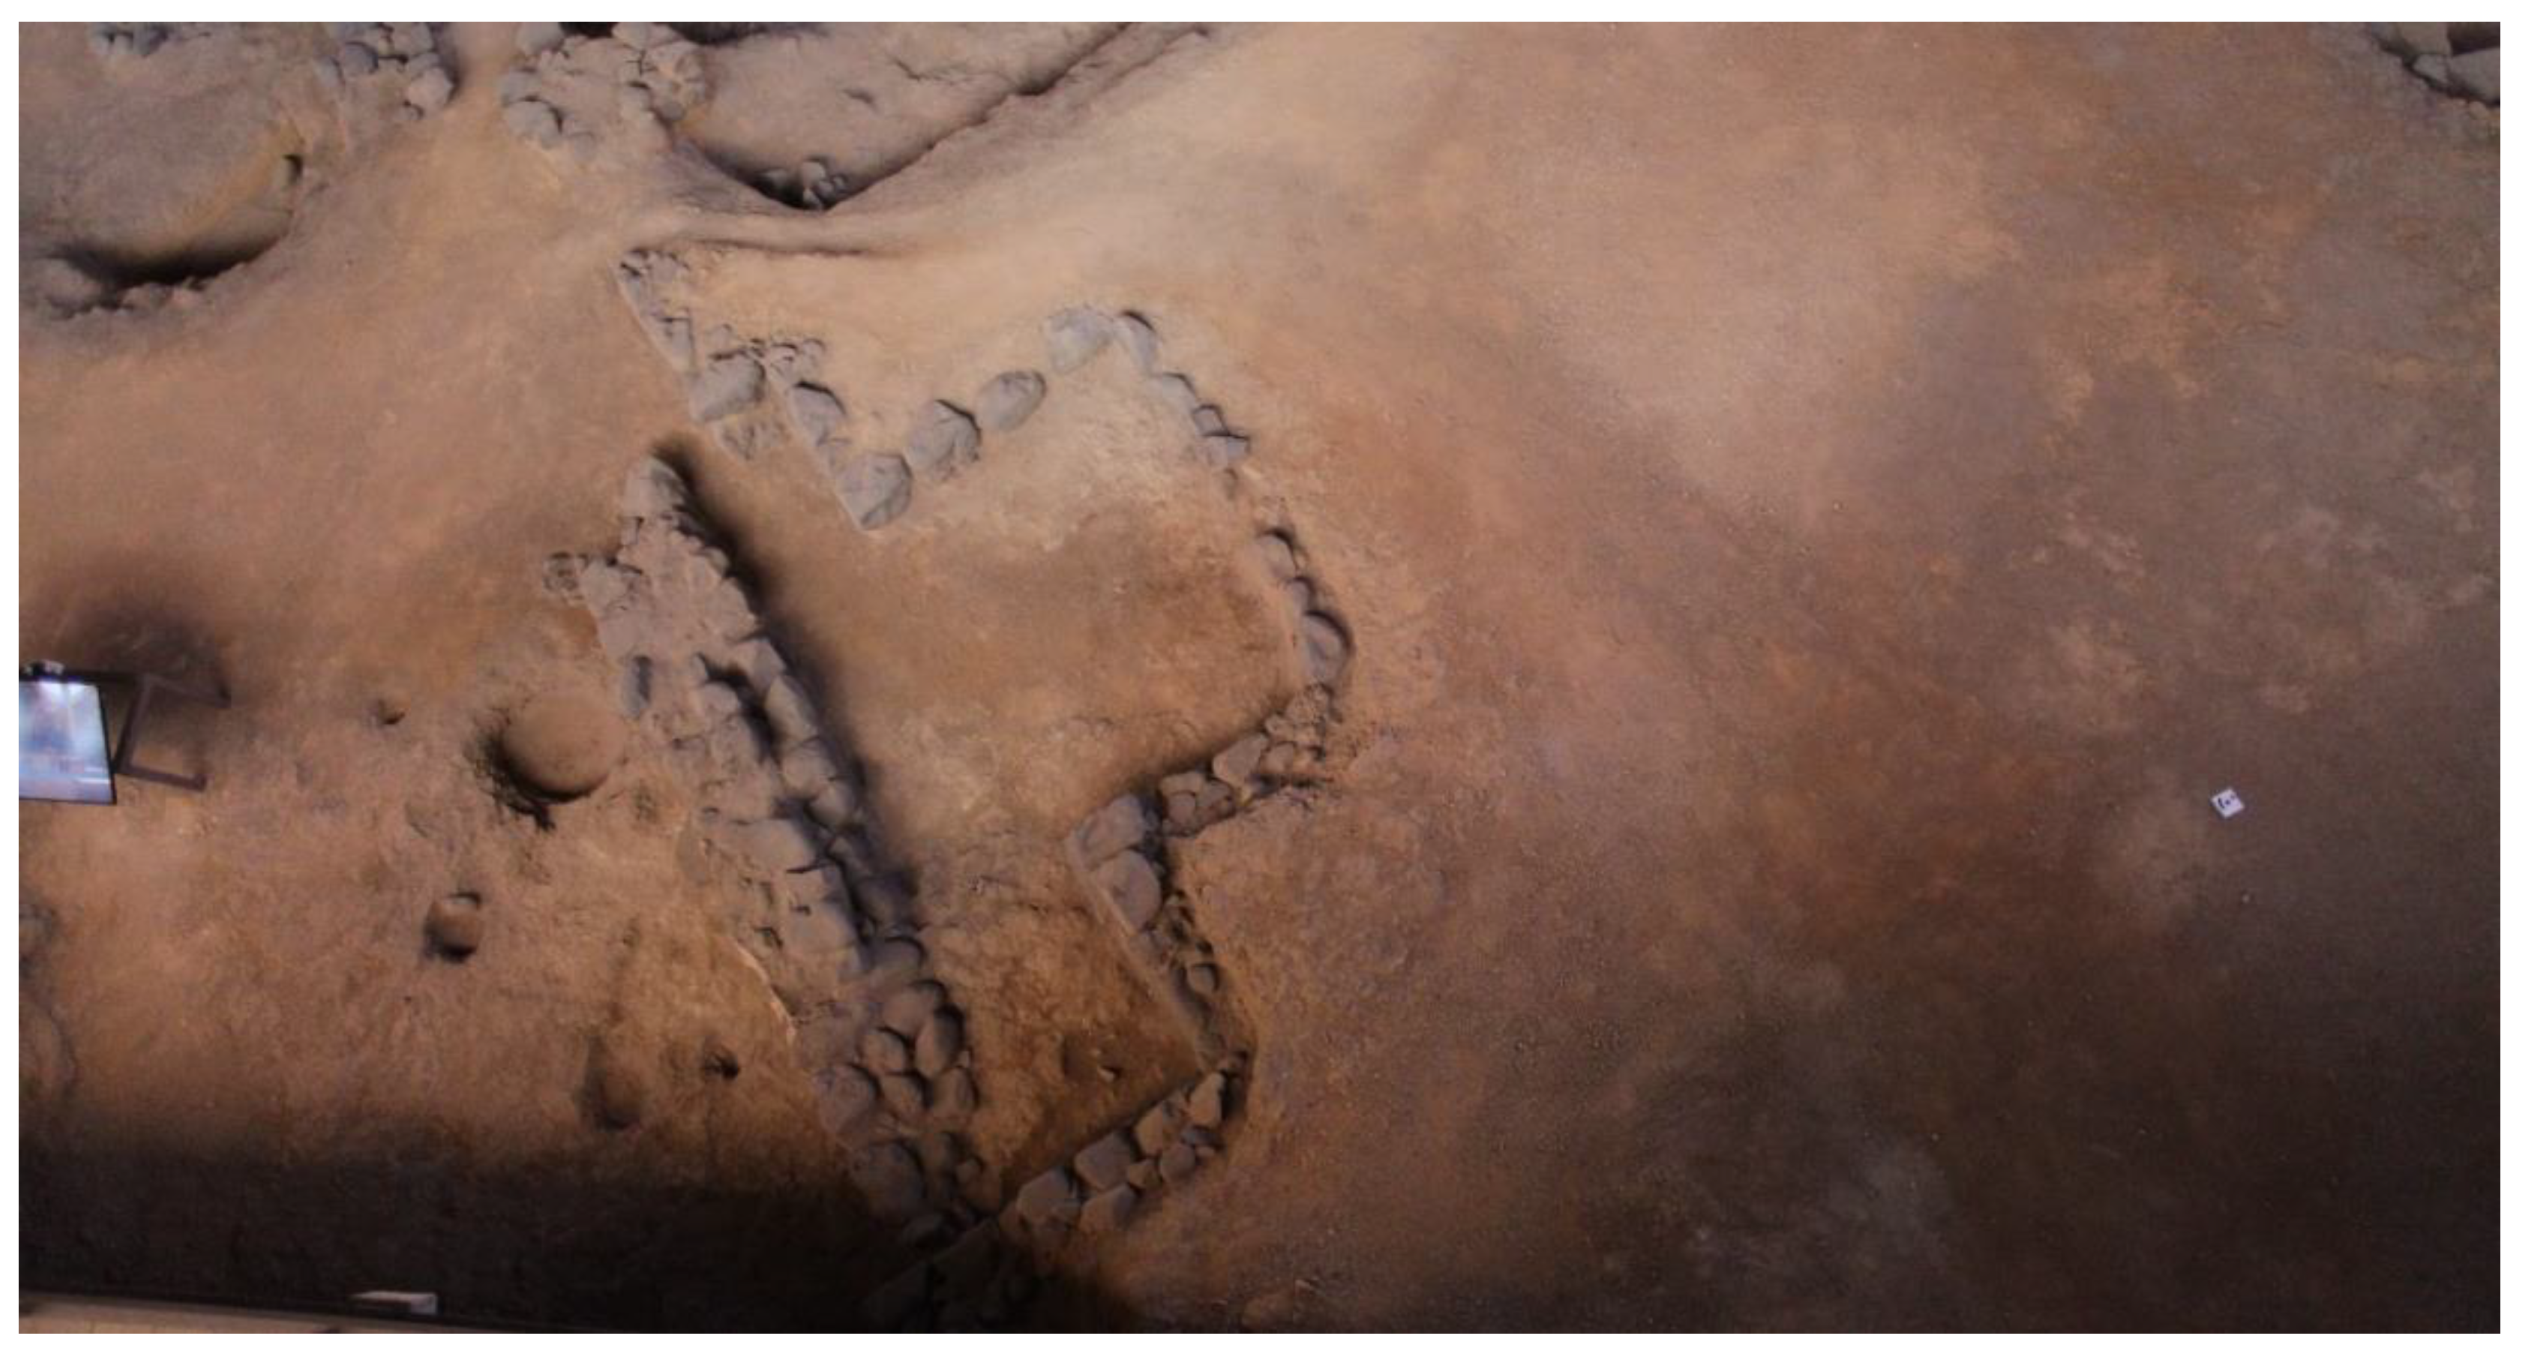
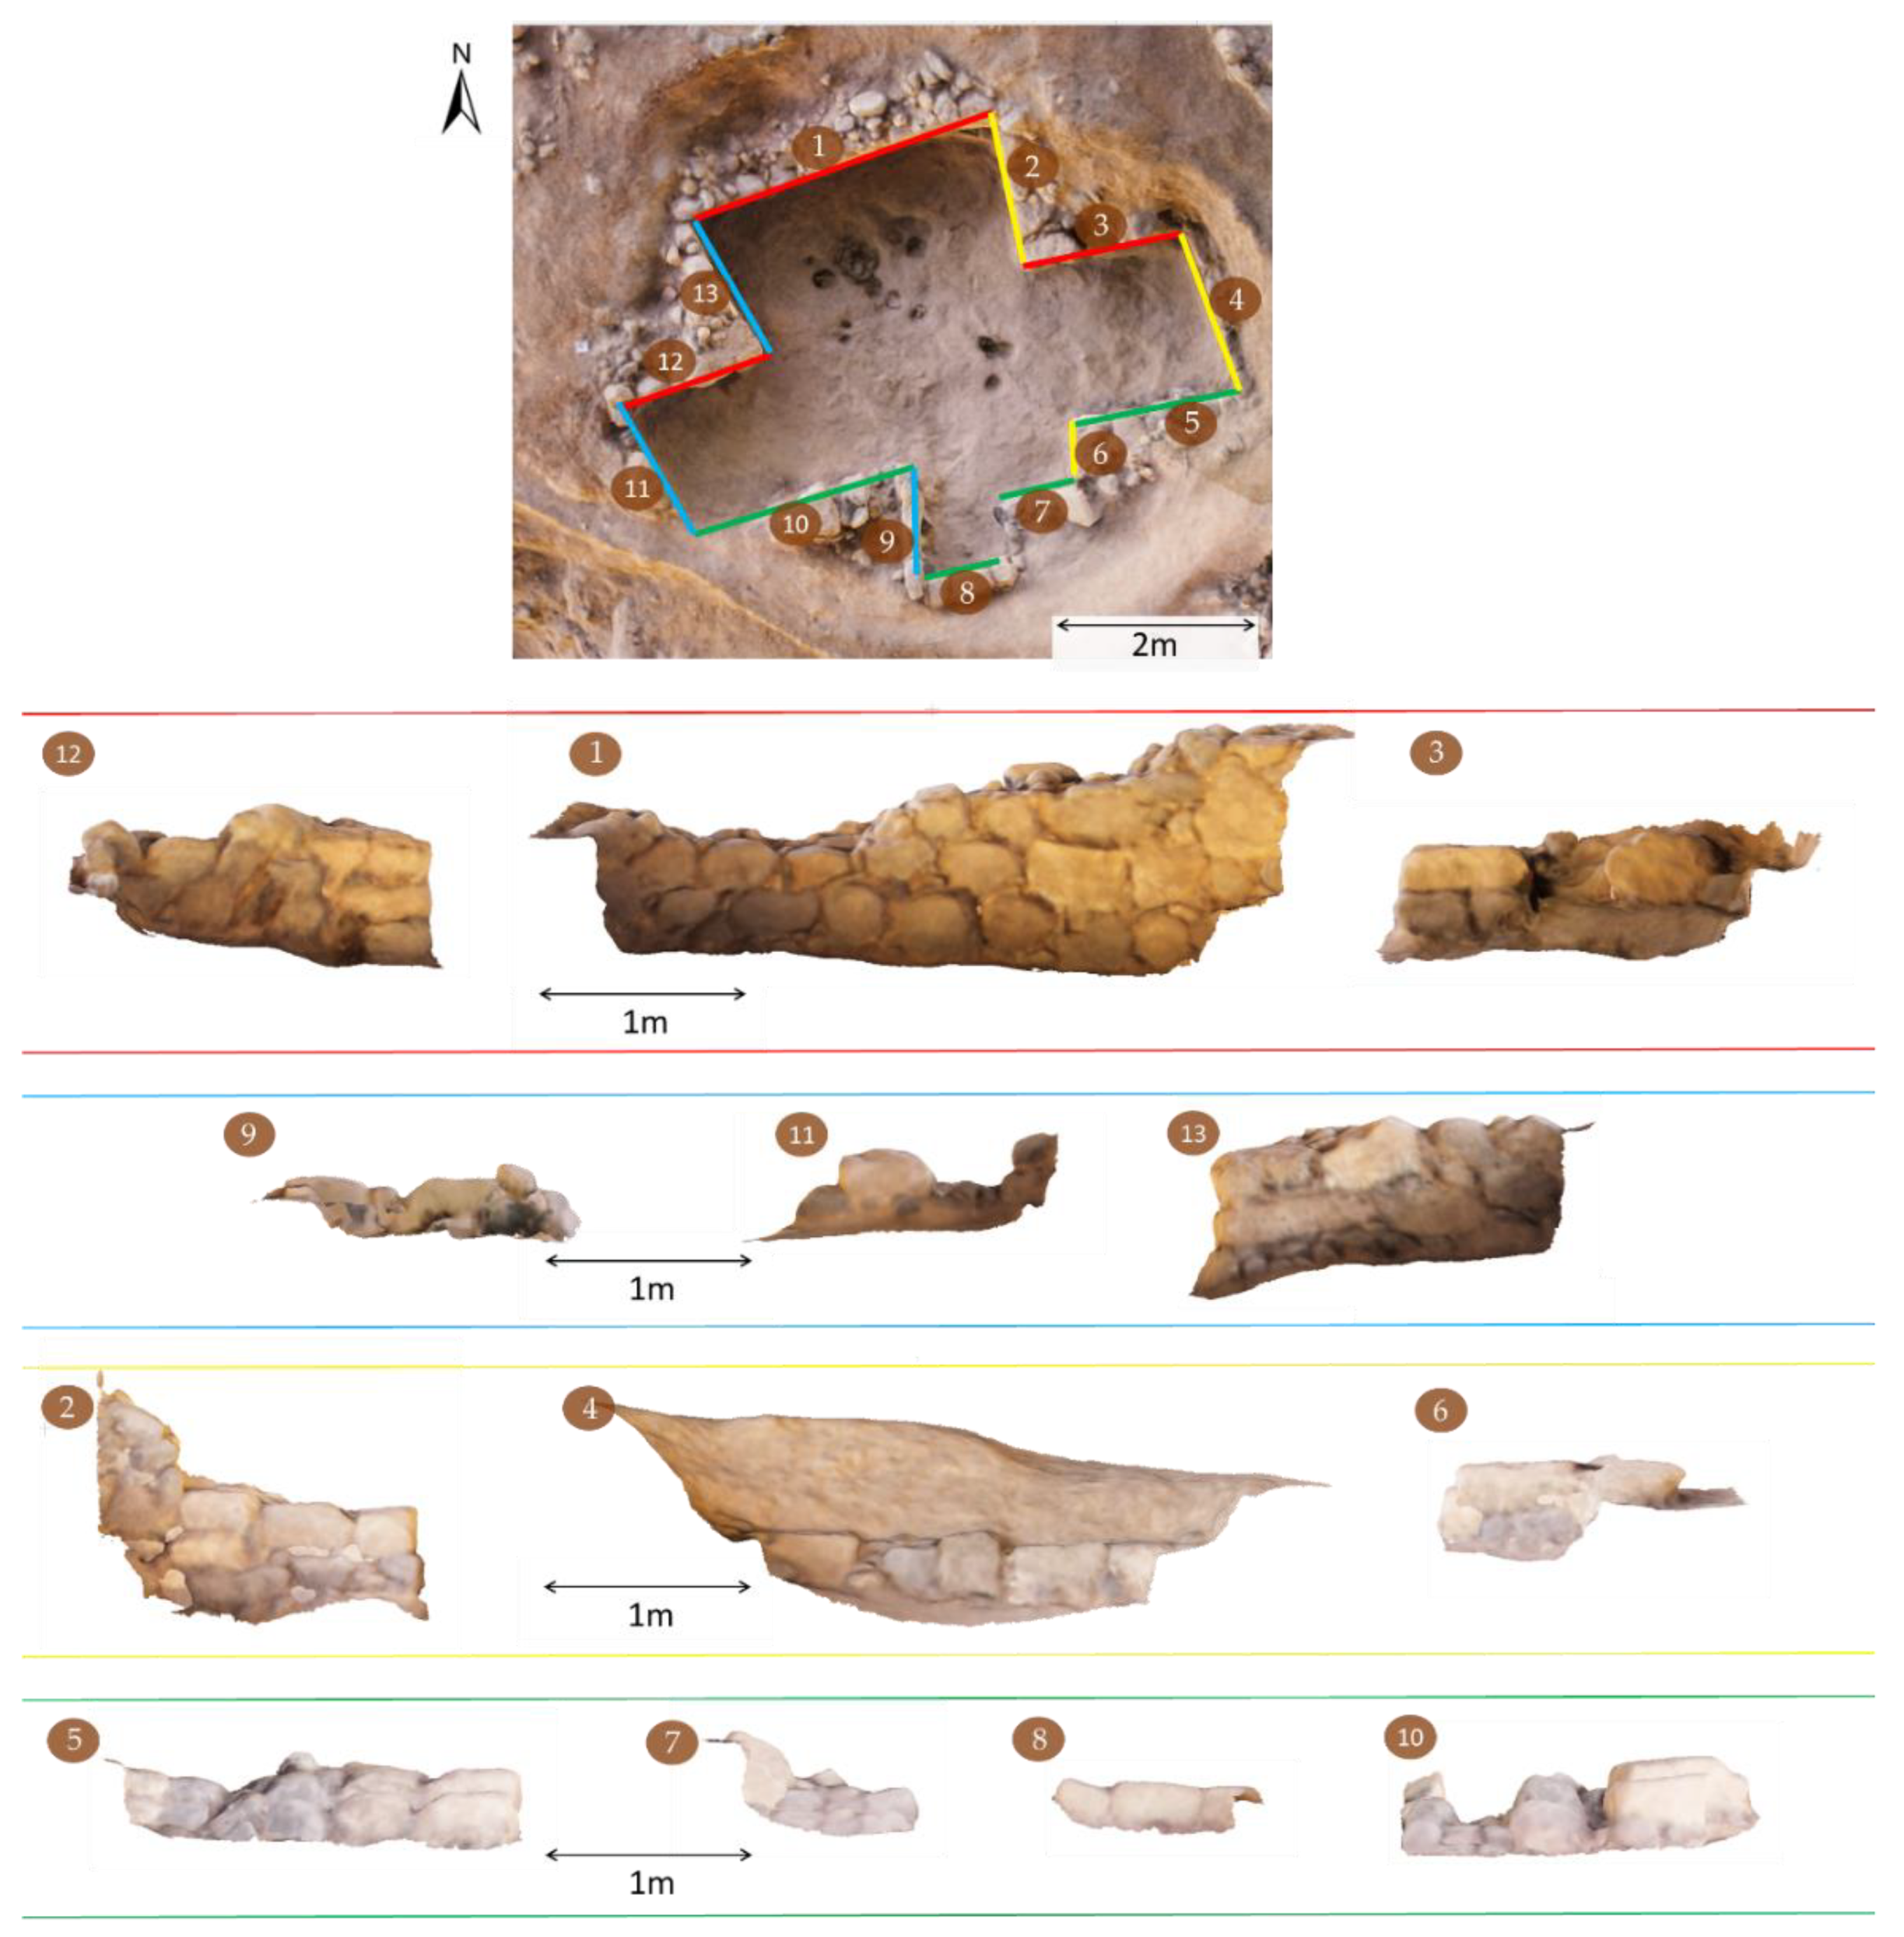
3.3. Photorealistic 3D Surface Model

In order to perform the accuracy assessment, the reference system of the 3D surface model was transformed to the geodetic reference system used in Canary Islands (REGCAN95), the map projection Universal Transverse Mercator (UTM 28N) and some points were contrasted to those previously measured in situ. The results of the transformation are shown in Table 2 from which an adjustment error of ± 1.7 mm, verifying that the error of the photogrammetric model met the requirements of the restauration project (minimum accuracy of 2 mm).
Next, the statistics of GCP are presented in Table 3. In order to realistically assess the accuracy, the robust and normal estimators of central tendency and dispersion of control and check points are disaggregated into the axis’s components, as well as the 3D module of residue vector. As Table 3 shows, the 3D module does not follow a Gaussian distribution. In this case, and despite having been calculated, the RMSE is not the most appropriate estimator. Therefore, it is considered more appropriate the interpretation of the results provided by the robust estimators median and NMAD.
Small differences between the normal and robust estimation are found, with the exception of the Z component of the control points that worsens the estimation by a factor of 2. In addition, with respect to the check points residuals, it is appreciated that the Y-Coordinate is the component that most contributes to error. This component is directly related to the unevenness of the study area (Figure 4), which has abrupt changes in elevation.

3.4. Orthoimages and Other Products

The quality of the orthoimages depends not only on the positional precision of the geometric fit but also on the radiometric continuity of the acquisitions. In this sense, although a very precise fit was achieved, the 3D surface model, and therefore the orthoimages generated, had some radiometric changes due to variations in lighting within the reservoir (Figure 11). This graphic aspect could be improved by adjusting the histogram (brightness and contrast) of the images based on one selected as a reference. It should be noted that the generated orthophotos offered a resolution of 5 mm based on the equivalent pixel size projection.
Finally, a 3D Spatial Data Infrastructure (SDI) was created in order to link information from all the experts involved in the archaeological research project to serve as the basis for the exploitation and management of the archaeological documentation of the site. Specifically, the information linked to the SDI was: the 3D model and orthophotos of the site (layer base), basic representations of the structures (red lines) and documentation plans previously available, the lighting infrastructure (blue lines) of the site, and some archaeological items and materials found at the exact marked locations (colored dots) among others (Figure 12 and Figure 13).
To conclude, it can be summarized that both a prior knowledge of the pole system operation and experience on planning, acquiring, and processing steps are required to success in the photogrammetric survey. Regarding the man-hours dedicated to these works, 215 h were used distributed as follows: 50 h for planning, 115 h for data acquisition and 50 h for photogrammetric processing.

4. Conclusions

The feasibility, performance and advantages of the designed pole system has been demonstrated after its use in the 3D documentation and reconstruction of the “Cueva Pintada” in Gáldar, Canary Islands (Spain). This close-range photogrammetric device has allowed the reconstruction of a complex environment of 5400 m2 as a low-cost alternative to drones that offers absolute control of acquisitions through a real time vision system. Thus, high-level detail products have been obtained such as (i) the 3D photorealistic model with a GSD of 1.47 mm and ± 8.4 mm accuracy, (ii) the 5 mm detailed orthoimages of the remains of the houses and (iii) the 3D SDI with extended linked data; very valuable for monitoring and as a basis for making decisions on the conservation and restoration of this protected archaeological site. Thanks to the low-altitude aerial point of view promoted by this system, it has been possible to faithfully document the remains, suitable not only for scientific purposes, but also to disseminate this site and allow the virtual visualization of some areas that may be momentarily or permanently with restricted access. Although a photogrammetric drone flight would have meant faster data collection, it is a technology that cannot be used in all archaeological scenarios, such as the particular case study in which due to the roof covering a very low drone flight would be required, which could have raised dust in suspension endangering not only the quality of the images but also the state of conservation of the remains. In this sense, this technology has been a solution that has not compromised the quality of the final results solving the constraints of drone flights: autonomy, payload, limitation of sensors to board, problems of GNSS signal, etc. This has been possible thanks to the absence of vertical elements of more than 5 m in height (e.g., walls). Due to the limits of the extenders, SAMBA could overcome vertical obstacles of up to 3.5 m when using it supported on the ground and of up to 5 m when using it sustained in elevation to overcome upper obstacles. Furthermore, the pole system allows horizontal acquisitions up to 4 m away from the objects. To summarize, the main advantages offered by SAMBA, apart from those already mentioned, are:
  • Point of view: Acquisition of close-range nadir and oblique images at a maximum height of up to 5 m.
  • Stability: Sharp images even in poor lighting conditions (long exposure times).
  • Flexibility: Adjustment to different heights thanks to its telescopic structure, even being able to save heights and ensuring blur problems.
  • Control: Ability to orient the on-board sensor towards the desired point of view.
  • Versatility: Ability to board any type of sensor on this system, mainly digital and multispectral cameras, and to be used both indoors and outdoors.
  • Portability: It allows to carry out large topographic surveys thanks to its light and ergonomic structure.
  • Robustness: Acquisition, control, display and power units are integrated in the same device.
  • Security: it allows to replicate a nadiral point of view avoiding the use of drones and therefore possible impacts due to failures, exceeding the autonomy time, and lifting of particles of loose materials from the ground.
  • Low-cost alternative to drones.
Future works will focus on the evaluation of the strength of the method purposed by (i) testing it over multiple scenarios, (ii) applying a higher percentage of control points (for example 67%/33% instead of the 60%/40% used) and (iii) choosing the control and check points either randomly or by applying certain restrictions that guarantee the correct design of the reference network.

Author Contributions

Conceptualization, J.O.-P. and D.H.-L.; methodology, D.H.-L., P.R.-G., D.G.-S. and D.G.-A.; software, P.R.-G., S.D.P. and D.G.-S.; validation, P.R.-G. and S.D.P.; formal analysis, D.H.-L. and D.G.-A.; writing-original draft preparation, S.D.P.; writing-review & editing, P.R.-G., D.G.-A., D.H.-L., D.G.-S. and J.O.-P.; visualization, S.D.P. and P.R.-G. All authors have read and agreed to the published version of the manuscript.

Funding

This research was partially funded by the Ministry of Economy and Competitiveness (MINECO) of the Spanish Government and by the European Regional Development Fund (FEDER) of the European Union (UE) through the project referenced as CGL2015-65913-P (MINECO/FEDER, UE).

Acknowledgments

Authors would like to thank Cabildo of Gran Canaria and the directors of the archaeological site of “Cueva Pintada” allowing us to access and facilitating the work developed there. Specially thank the University of Castilla-La Mancha for the support given and the facilities offered when lending their equipment as well as to Alberto Holgado-Barco who helped in the data collection.

Conflicts of Interest

The authors declare no conflict of interest.

References

  1. Bitelli, G.; Dubbini, M.; Zanutta, A. Terrestrial laser scanning and digital photogrammetry techniques to monitor landslide bodies. Int. Arch. Photogramm. Remote Sens. Spat. Inf. Sci. 2004, 35, 246–251. [Google Scholar]
  2. Pollefeys, M.; Van Gool, L.; Vergauwen, M.; Verbiest, F.; Cornelis, K.; Tops, J.; Koch, R. Visual modeling with a hand-held camera. Int. J. Comput. Vis. 2004, 59, 207–232. [Google Scholar] [CrossRef]
  3. Stumpf, A.; Malet, J.P.; Allemand, P.; Pierrot-Deseilligny, M.; Skupinski, G. Ground-based multi-view photogrammetry for the monitoring of landslide deformation and erosion. Geomorphology 2015, 231, 130–145. [Google Scholar] [CrossRef]
  4. Tuttas, S.; Braun, A.; Borrmann, A.; Stilla, U. Evaluation of acquisition strategies for image-based construction site monitoring. ISPRS-Int. Arch. Photogramm. Remote Sens. Spat. Inf. Sci. 2016, 41, 733–740. [Google Scholar] [CrossRef]
  5. Drewello, R.; Wetter, N.; Beckett, B.; Beckett, N. A New Crane System for Remote Inspection and NDT. In Nondestructive Testing of Materials and Structures; Springer: Dordrecht, The Netherlands, 2013; pp. 1253–1257. [Google Scholar]
  6. Jo, Y.H.; Hong, S. Three-dimensional digital documentation of cultural heritage site based on the convergence of terrestrial laser scanning and unmanned aerial vehicle photogrammetry. ISPRS Int. J. Geo-Inf. 2019, 8, 53. [Google Scholar]
  7. Verhoeven, G.J. Providing an archaeological bird’s-eye view–an overall picture of ground-based means to execute low-altitude aerial photography (LAAP) in Archaeology. Archaeol. Prospect. 2009, 16, 233–249. [Google Scholar] [CrossRef]
  8. Altan, M.O.; Celikoyan, T.M.; Kemper, G.; Toz, G. Balloon photogrammetry for cultural heritage. Int. Arch. Photogramm. Remote Sens. Spat. Inf. Sci. 2004, 35, 964–968. [Google Scholar]
  9. Bitelli, G.; Tini, M.A.; Vittuari, L. Low-height aerial photogrammetry for archaeological orthoimaging production. Int. Arch. Photogramm. Remote Sens. Spat. Inf. Sci. 2003, 34, 55–59. [Google Scholar]
  10. Cefalu, A.; Abdel-Wahab, M.; Peter, M.; Wenzel, K.; Fritsch, D. Image based 3D Reconstruction in Cultural Heritage Preservation. In ICINCO; SciTePress: Setúbal Municipality, Portugal, 2013; Volume 1, pp. 201–205. [Google Scholar]
  11. Dominici, D.; Alicandro, M.; Massimi, V. UAV photogrammetry in the post-earthquake scenario: Case studies in L’Aquila. Geomat. Nat. Hazards Risk 2017, 8, 87–103. [Google Scholar] [CrossRef] [Green Version]
  12. Jaud, M.; Letortu, P.; Théry, C.; Grandjean, P.; Costa, S.; Maquaire, O.; Le Dantec, N. UAV survey of a coastal cliff face–Selection of the best imaging angle. Measurement 2019, 139, 10–20. [Google Scholar] [CrossRef] [Green Version]
  13. Šedina, J.; Pavelka, K.; Raeva, P. UAV remote sensing capability for precision agriculture, forestry and small natural reservation monitoring. In Hyperspectral Imaging Sensors: Innovative Applications and Sensor Standards; International Society for Optics and Photonics: Bellingham, WA, USA, 2017; Volume 10213, p. 102130L. [Google Scholar]
  14. Luhmann, T.; Chizhova, M.; Gorkovchuk, D.; Hastedt, H.; Chachava, N.; Lekveishvili, N. Combination of terrestrial laserscanning, UAV and close-range photogrammetry for 3D reconstruction of complex churches in Georgia. Int. Arch. Photogramm. Remote Sens. Spat. Inf. Sci. 2019, XLII-2/W11, 753–761. [Google Scholar] [CrossRef] [Green Version]
  15. Dhonju, H.K.; Xiao, W.; Mills, J.P.; Sarhosis, V. Share Our Cultural Heritage (SOCH): Worldwide 3D heritage reconstruction and visualization via web and mobile GIS. ISPRS Int. J. Geo-Inf. 2018, 7, 360. [Google Scholar] [CrossRef] [Green Version]
  16. Pham, H.Q.; Camey, M.; Pham, K.D.; Pham, K.V.; Rilett, L.R. Review of Unmanned Aerial Vehicles (UAVs) Operation and Data Collection for Driving Behavior Analysis. In CIGOS 2019, Innovation for Sustainable Infrastructure; Springer: Singapore, 2020; pp. 1111–1116. [Google Scholar]
  17. Xie, T.; Zhu, J.; Jiang, C.; Jiang, Y.; Guo, W.; Wang, C.; Liu, R. Situation and prospect of light and miniature UAV-borne LiDAR. In XIV International Conference on Pulsed Lasers and Laser Applications; International Society for Optics and Photonics: Bellingham, WA, USA, 2019; Volume 11322, p. 1132210. [Google Scholar]
  18. Singh, V.; Bagavathiannan, M.; Chauhan, B.S.; Singh, S. Evaluation of current policies on the use of unmanned aerial vehicles in Indian agriculture. Curr. Sci. 2019, 117, 25. [Google Scholar] [CrossRef]
  19. Szabó, G.; Bertalan, L.; Barkóczi, N.; Kovács, Z.; Burai, P.; Lénárt, C. Zooming on aerial survey. In Small Flying Drones; Springer: Cham, Switzerland, 2018; pp. 91–126. [Google Scholar]
  20. Tonkin, T.N.; Midgley, N.G. Ground-control networks for image based surface reconstruction: An investigation of optimum survey designs using UAV derived imagery and structure-from-motion photogrammetry. Remote Sens. 2016, 8, 786. [Google Scholar] [CrossRef] [Green Version]
  21. Dallas, R.W.A. Architectural and archaeological photogrammetry. In Close Range Photogrammetry and Machine Vision; Atkinson, K.B., Ed.; Whittles Publishing: Scotland, UK, 1996; pp. 283–303. [Google Scholar]
  22. Rodríguez-Gonzálvez, P.; Holgado-Barco, A.; González-Aguilera, D.; Guerrero-Sevilla, D.; Hernández-López, D. Sistema de Adquisición de Imágenes Nadirales y Oblicuas2644168-B1. ES Patent 2644168-B1, 19 September 2018. [Google Scholar]
  23. Khalili, A. Pull Rod Type Digital Camera. WO Patent 2015192207-A1, January 2015. Available online: https://patents.google.com/patent/US9843708B2/en (accessed on 13 August 2020).
  24. Staudinger, R.J.; Chevere-Santos, M.; Zhou, R. Portable Remote Camera Control Device. US Patent 7706673-B1, April 2010. [Google Scholar]
  25. Winners Sun Plastic and Electronic Shenzhen CO LTD. WO Patent 2016050011-A1, 27 April 2016.
  26. Anari, F.A., III; Vosburg, R.P.; VanZIle, R., III. Camera Pole. US Patent 2015108777-A1, 23 April 2015. [Google Scholar]
  27. Gonçalves, J.A.; Moutinho, O.F.; Rodrigues, A.C. Pole photogrammetry with an action camera for fast and accurate surface mapping. Int. Arch. Photogramm. Remote Sens. Spat. Inf. Sci. 2016, 41, 571–575. [Google Scholar] [CrossRef]
  28. Del Pozo, S.; Rodríguez-Gonzálvez, P.; Hernández-López, D.; Onrubia-Pintado, J.; González-Aguilera, D. Sensor fusion for 3D archaeological documentation and reconstruction: Case study of “Cueva Pintada” in Galdar, Gran Canaria. Int. Arch. Photogramm. Remote Sens. Spat. Inf. Sci. 2019, XLII-2/W15, 373–379. [Google Scholar] [CrossRef] [Green Version]
  29. Sánchez-Aparicio, L.J.; Herrero-Huerta, M.; Esposito, R.; Roel Schipper, H.; González-Aguilera, D. Photogrammetric solution for analysis of out-of-plane movements of a masonry structure in a large-scale laboratory experiment. Remote Sens. 2019, 11, 1871. [Google Scholar]
  30. González-Aguilera, D.; López-Fernández, L.; Rodríguez-Gonzálvez, P.; Hernández-López, D.; Guerrero, D.; Remondino, F.; Menna, F.; Nocerino, E.; Toschi, I.; Ballabeni, A.; et al. GRAPHOS–open-source software for photogrammetric applications. Photogramm. Rec. 2018, 33, 11–29. [Google Scholar] [CrossRef] [Green Version]
  31. Schönberger, J.L.; Frahm, J. Structure-from-Motion Revisited. In Proceedings of the IEEE Conference on Computer Vision and Pattern Recognition (CVPR), Las Vegas, NV, USA, 27–30 June 2016; pp. 4104–4113. [Google Scholar]
  32. Lowe, D.G. Distinctive image features from scale-invariant keypoints. Int. J. Comput. Vis. 2004, 60, 91–110. [Google Scholar] [CrossRef]
  33. Gesto-Diaz, M.; Tombari, F.; Gonzalez-Aguilera, D.; Lopez-Fernandez, L.; Rodriguez-Gonzalvez, P. Feature matching evaluation for multimodal correspondence. ISPRS J. Photogramm. Remote Sens. 2017, 129, 179–188. [Google Scholar] [CrossRef]
  34. Fischler, M.A.; Bolles, R.C. Random sample consensus: A paradigm for model fitting with applications to image analysis and automated cartography. Commun. ACM 1981, 24, 381–395. [Google Scholar] [CrossRef]
  35. Abdel-Aziz, Y.I.; Karara, H.M.; Hauck, M. Direct linear transformation from comparator coordinates into object space coordinates in close-range photogrammetry. Photogramm. Eng. Remote Sens. 2015, 81, 103–107. [Google Scholar] [CrossRef]
  36. Triggs, B.; McLauchlan, P.F.; Hartley, R.I.; Fitzgibbon, A.W. Bundle Adjustment-A Modern Synthesis. Vis. Algorithms Theory Pract. 2000, 34099, 298–372. [Google Scholar]
  37. Langguth, F.; Sunkavalli, K.; Hadap, S.; Goesele, M. Shading-aware multi-view stereo. In European Conference on Computer Vision; Springer: Cham, Switzerland, 2016; pp. 469–485. [Google Scholar]
  38. Semerjian, B. A new variational framework for multiview surface reconstruction. In European Conference on Computer Vision; Springer: Cham, Switzerland, 2014; pp. 719–734. [Google Scholar]
  39. Kraus, K. Photogrammetry-Fundamentals and Standard Process. Dummler/Bonn 1993, 1, 397. [Google Scholar]
  40. Amhar, F.; Jansa, J.; Ries, C. The generation of true orthophotos using a 3D building model in conjunction with a conventional DTM. Int. Arch. Photogramm. Remote Sens. 1998, 32, 16–22. [Google Scholar]
  41. Rodríguez-Gonzálvez, P.; Garcia-Gago, J.; Gomez-Lahoz, J.; González-Aguilera, D. Confronting passive and active sensors with non-Gaussian statistics. Sensors 2014, 14, 13759–13777. [Google Scholar] [CrossRef] [Green Version]
  42. American Society for Photogrammetry and Remote Sensing (ASPRS). ASPRS positional accuracy standards for digital geospatial data. Photogramm. Eng. Remote Sens. 2015, 81, 1–26. [Google Scholar] [CrossRef]
  43. Nocerino, E.; Menna, F.; Remondino, F.; Toschi, I.; Rodríguez-Gonzálvez, P. Investigation of indoor and outdoor performance of two portable mobile mapping systems. In Proceedings of the Videometrics, Range Imaging, and Applications XIV, Munich, Germany, 26 June 2017; International Society for Optics and Photonics: Bellingham, WA, USA, 2017; Volume 10332, p. 103320I. [Google Scholar]
  44. Höhle, J.; Höhle, M. Accuracy assessment of digital elevation models by means of robust statistical methods. ISPRS J. Photogramm. Remote Sens. 2009, 64, 398–406. [Google Scholar] [CrossRef] [Green Version]
  45. Rodríguez-Gonzálvez, P.; González-Aguilera, D.; Hernández-López, D.; González-Jorge, H. Accuracy assessment of airborne laser scanner dataset by means of parametric and non-parametric statistical methods. IET Sci. Meas. Technol. 2015, 9, 505–513. [Google Scholar] [CrossRef]
  46. Caselles, J.O.; Clapés, J.; Sáenz Sagasti, J.I.; Pérez Gracia, V.; Rodríguez Santana, C.G. Integrated GPR and Laser Vibration Surveys to Preserve Prehistorical Painted Caves: Cueva Pintada Case Study. Int. J. Archit. Herit. 2019, 1–9. [Google Scholar] [CrossRef]
  47. De Guzmán, C.M.; Pintado, J.O.; Sagasti, J.S. Trabajos en el Parque Arqueológico de la Cueva Pintada de Gáldar, Gran Canaria. Avances de las intervenciones realizadas en 1993. Anuario de Estudios Atlánticos 1996, 42, 17–76. [Google Scholar]
  48. Sanchez-Moral, S.; Garcia-Guinea, J.; Sanz-Rubio, E.; Canaveras, J.C.; Onrubia-Pintado, J. Mortars, pigments and saline efflorescence from Canarian pre-Hispanic constructions (Galdar, Grand Canary Island). Constr. Build. Mater. 2002, 16, 241–250. [Google Scholar] [CrossRef]
  49. Kazhdan, M.; Bolitho, M.; Hoppe, H. Poisson surface reconstruction. In Proceedings of the Fourth Eurographics Symposium on Geometry Processing, Sardinia, Italy, 26–28 June 2006; Volume 7. [Google Scholar]
  50. Rodríguez-Gonzálvez, P.; Nocerino, E.; Menna, F.; Minto, S.; Remondino, F. 3D surveying and modeling of underground passages in WWI fortifications. Int. Arch. Photogramm. Remote Sens. 2015, 40, 17–24. [Google Scholar] [CrossRef] [Green Version]
Figure 1. (a) General arrangement of the close-range pole-photogrammetric system and its main units: [A] self-stabilizing platform, [B] control system, [C] structure, [D] remote vision system with wired and wireless connection and [E] telescopic extenders. (b) Detail and mechanisms of the self-stabilizing platform.
Remotesensing 12 02644 g001
Figure 2. Detail and mechanisms of (a) the control system and (b) the bottom of the device where the power system is located.
Remotesensing 12 02644 g002
Figure 3. Pole system with a Canon EOS 5D MARK II embarked on it for the photogrammetric survey of the “Cueva Pintada”.
Remotesensing 12 02644 g003
Figure 4. Photogrammetric network designed based on the 12-bit binary targets of 10 cm diameter.
Remotesensing 12 02644 g004
Figure 5. Incremental Structure-from-Motion pipeline developed in GRAPHOS.
Remotesensing 12 02644 g005
Figure 6. Geographic location of the “Cueva Pintada” archaeological site (Left) and a detailed image of a remains of houses (Right).
Remotesensing 12 02644 g006
Figure 7. Nadiral image acquired from the pole system. On the right, a binary photogrammetric target can be seen.
Remotesensing 12 02644 g007
Figure 8. Oblique image acquired from the pole system in order to reconstruct the walls of the remains.
Remotesensing 12 02644 g008
Figure 9. Part of the sparse model of the archaeological site of “Cueva Pintada” generated in GRAPHOS, showing each camera position during data acquisition in green.
Remotesensing 12 02644 g009
Figure 10. Photorealistic 3D model of the “Cueva Pintada” archaeological site and the remains of a house in detail.
Remotesensing 12 02644 g010
Figure 11. Orthoimage of the rest of the house detailed in Figure 9 and orthoimages of the walls that comprise it.
Remotesensing 12 02644 g011
Figure 12. 3D SDI in which the orthophoto of the “Cueva Pintada” (base layer), the delimitation of the different structures (in red) and the lighting infrastructure (in blue) are displayed.
Remotesensing 12 02644 g012
Figure 13. 3D SDI showing the orthophoto of the “Cueva Pintada” and points that link to information about the different assets and documentation plans found (right); and an example of the linked data (left): existing analog plan of the site with details of different elements found, the delimitation of the structure (in red) and the lighting infrastructure (in blue).
Remotesensing 12 02644 g013
Table 1. Summary of the partial products derived from the photogrammetric process.
Products-ParametersValue
Point cloud (MP 1)71.77
Mesh (MT 2)3.69
Size of the texturized model (pixels)16,384 × 16,384
GSD (mm)1.47
1 Million points, 2 Million triangles.
Table 2. Coordinate transformation parameters between the local and reference system and associated precision values.
ParametersValueAccuracy
Translation (m)X-Coordinate435,679.943±0.0011
Y-Coordinate3,113,299.081±0.0007
Z-Coordinate112.165±0.0016
Rotation (rad)X-Axis (ω)−0.00000176±0.00004035
Y-Axis (φ)+0.00017037±0.00005154
Z-Axis (κ)+0.42133813±0.00002850
Scale1-
Table 3. Gaussian and robust estimation of the residuals of the control and check points. Units: meters.
X-CoordinateY-CoordinateZ-Coordinate3D Module
ControlMedian0.00020.00000.00030.0017
NMAD±0.0017±0.0007±0.0004±0.0006
RMSE±0.0017±0.0006±0.0009±0.0005
CheckMedian0.0008−0.00400.00070.0042
NMAD±0.0006±0.0006±0.0004±0.0004
RMSE±0.0005±0.0006±0.0004±0.0004

