Article

Investigating Detection of Floating Plastic Litter from Space Using Sentinel-2 Imagery

by
Kyriacos Themistocleous
1,2,*,
Christiana Papoutsa
1,2,
Silas Michaelides
1,2 and
Diofantos Hadjimitsis
1,2
1
ERATOSTHENES Centre of Excellence, Saripolou 2-6, Achilleos 2 Building, Lemesos 3036, Cyprus
2
Department of Civil Engineering and Geomatics, Cyprus University of Technology, 30 Arch. Kyprianos Str., Lemesos 3036, Cyprus
*
Author to whom correspondence should be addressed.
Remote Sens. 2020, 12(16), 2648; https://0-doi-org.brum.beds.ac.uk/10.3390/rs12162648
Submission received: 10 July 2020 / Revised: 12 August 2020 / Accepted: 14 August 2020 / Published: 17 August 2020
(This article belongs to the Special Issue Remote Sensing in Applications of Geoinformation)

Abstract

:
Plastic litter floating in the ocean is a significant problem on a global scale. This study examines whether Sentinel-2 satellite images can be used to identify plastic litter on the sea surface for monitoring, collection and disposal. A pilot study was conducted to determine if plastic targets on the sea surface can be detected using remote sensing techniques with Sentinel-2 data. A target made up of plastic water bottles with a surface measuring 3 m × 10 m was created, which was subsequently placed in the sea near the Old Port in Limassol, Cyprus. An unmanned aerial vehicle (UAV) was used to acquire multispectral aerial images of the area of interest during the same time as the Sentinel-2 satellite overpass. Spectral signatures of the water and the plastic litter after it was placed in the water were taken with an SVC HR1024 spectroradiometer. The study found that the plastic litter target was easiest to detect in the NIR wavelengths. Seven established indices for satellite image processing were examined to determine whether they can identify plastic litter in the water. Further, the authors examined two new indices, the Plastics Index (PI) and the Reversed Normalized Difference Vegetation Index (RNDVI) to be used in the processing of the satellite image. The newly developed Plastic Index (PI) was able to identify plastic objects floating on the water surface and was the most effective index in identifying the plastic litter target in the sea.

1. Introduction

Marine litter refers to waste originating from human activities that has been discharged into coastal or marine environments. Such litter may result from activities on either land or at sea [1]. Currently, 60 to 80% of such marine litter consists of plastic, reaching 95% in some areas and has become a serious environmental hazard [2,3,4,5,6,7,8,9,10,11,12,13,14,15,16,17,18]. Based on its weight and shape, marine litter can be classified as floating litter and sinking litter [13]. It has been estimated that marine litter is split into 15% floating on the sea surface, another 15% remains in the water column and 70% subsides on the sea floor [19].
Although there is limited data on plastic inputs in the oceans [20], it is estimated that almost 8 million tons of plastic enter the oceanic ecosystem every year [21]. Other approximations estimate that the oceans may already contain more than 150 million tons of plastic [22]; around 250,000 tons of these contaminants is fragmented into 5 trillion plastic pieces, which may be floating on the oceans’ surface [23]. It has also been calculated that every year, between 4.8 and 12.7 million tons of plastic find their way into the ocean from coastal populations worldwide [16], while the Ellen Macarthur Foundation [24] estimates that approximately 25 million tons of plastic end up in the ocean. What is more alarming is the projection that the global quantity of plastic in the ocean will nearly double to 250 million tons by 2025 [16]. It is expected that by 2050, the ocean will contain more plastic by weight than fish [24].
Since plastics have low density, they float on the surface of water bodies, often accumulating into clusters which can be transported over long distances by the prevailing winds and oceanic currents before sinking [25,26,27,28,29,30,31,32,33,34]. A large portion of these plastic clusters enter ocean gyres and can result in clusters that are up to several kilometers in size, such as the Great Pacific Garbage Patch (GPGP) [35,36]. Plastic debris is mostly found in coastal areas, especially in front of river mouths and coastal cities [37]. Plastics break down into debris through a combination of several processes, among which are mechanical weathering, biodegradation and photo- and thermal-oxidative degradation by ultraviolet (UV) radiation. It is worth noting that complete mineralization of such plastic debris may not be possible or may take place after hundreds or thousands of years [38,39,40,41]. Plastic litter is harmful to marine life, as it results to deformation, suffocation and death [10,42,43,44] as well as allowing the spread of invasive species and the release of toxic chemicals into the environment [45,46,47]. Plastic litter tends to be more harmful near coastlines, where biological diversity and species abundance tend to be highest [48,49,50].
In order to address the issue of plastic marine litter, several programs and directives have been instituted. The European Union (EU) has issued several directives that are related to reducing plastic litter, primarily through the EU Marine Strategy Framework Directive (Directive 2008/56/EC) and the EU Water Framework Directive (Directive 2000/60/EC). The United Nations Environment Programme (UNEP): Regional Seas Programme is an action-oriented agenda that implements region-specific activities, bringing together stakeholders including governments, scientific communities and civil societies [51]. The mandate of the UNEP is to coordinate 18 Regional Seas Conventions and Action Plans, in which 146 countries participate. The UNEP Regional Seas Programme strives to maintain, restore and enhance marine and coastal resources to support human well-being through sustainable development [51]. The United Nations 2030 Agenda for Sustainable Development addresses the issue of plastic litter in water bodies through Sustainable Development Goals such as Goal 6 on “Clean Water and Sanitation” and Goal 12 on “Sustainable Consumption and Production”; these will also contribute to addressing the issue of marine plastic pollution, as the global nature of plastic supply chains dictates a cooperation between nations and across regions [52]. Therefore, it is necessary to establish harmonized definitions and share data and research on marine plastics and microplastics [52,53].
Although marine litter is a worldwide problem, it has not been adequately addressed in the Mediterranean area [54]. A high concentration of plastics is found within the Mediterranean Sea, with the highest amounts of municipal solid waste generated annually per person of 208–760 kg/year [55,56,57,58,59,60,61,62]. The Mediterranean Sea also ranks fourth in the list of oceans with the highest concentration of floating marine litter in the world, with 22,000 tons [62,63]. This is due to the interaction of a number of factors, including that the Mediterranean is essentially a closed basin with limited exchange of water with other oceanic bodies (this is primarily accomplished through the Straits of Gibraltar), combined with inadequate environmentally sound urban waste management systems, considerable marine vessel transportation in coastal waters, negligible tidal flow and heavily populated coastal areas [21,63,64]. According to Pasternak et al. [60], sites along the shores of the Mediterranean show the greatest densities of marine debris in the world. In particular, the Levantine sub-basin, in which Cyprus is situated, has very little interaction with the rest of the Mediterranean [65]. Plastics that enters the sub-basin from surrounding countries (Cyprus, Egypt, Israel, Lebanon, Syria and Turkey) are also washed up on the beaches of these countries [66,67].
Open-water and shoreline surveys that are designed to assess the distribution of plastic debris in oceans and lakes are time-consuming and costly; in addition, they provide only limited aerial coverage and temporal resolution [68]. Although research on how remote sensing can be used to monitor plastic debris in the sea is still in its early stages [29,67,69], several research studies have used various remote sensing methods to identify plastics in the sea [29,68,69,70,71,72,73]. Satellite images can be used to identify plastics in the water, such as Sentinel-1A and COSMO-Sky-Med Sar images [74], C-Band Radarsat-1 SAR images [75] as well as Landsat TM and EMT+ satellite images [76,77,78].
Several studies have been conducted to examine marine litter in the Mediterranean. Mansui et al. [63] simulated marine litter drift in the Mediterranean and noted permanent accumulations of plastics; their study found that the coastline between Tunisia and Syria had the highest amount of plastic accumulation, while the western Mediterranean demonstrated a rather low coastal impact [79]. The University of the Aegean [80] conducted a study to detect and track plastic targets on the sea surface using UAV and images from Sentinel satellites. Their study used a ‘target’ that was 100 m2 composed of 1.5 L water bottles, plastic bags and nylon fishing nets. The objective of the study by the University of the Aegean was to evaluate the ability of satellites to detect marine litter on the sea surface using image analysis, image-processing algorithms and satellite measurements [80]. Research has found that large plastic debris can be identified using unmanned aerial vehicles (UAVs) [81,82,83]. More recently, research has focused on the ability to detect plastic using spectroscopy and high spatial resolution multispectral imaging [84]. Research indicates that near to shortwave infrared (NIR−SWIR) imaging from UAV platforms can be used to detect plastic in the water [79,80].
The objective in this study is to examine whether Sentinel-2 satellite images were effective in identifying plastic clusters in the sea. As well, various indices used for satellite image processing were examined in order to determine whether they were able to identify plastic litter in the water. Spectroscopy was used in order to acquire and compare the spectral signature of the water and the plastic litter.

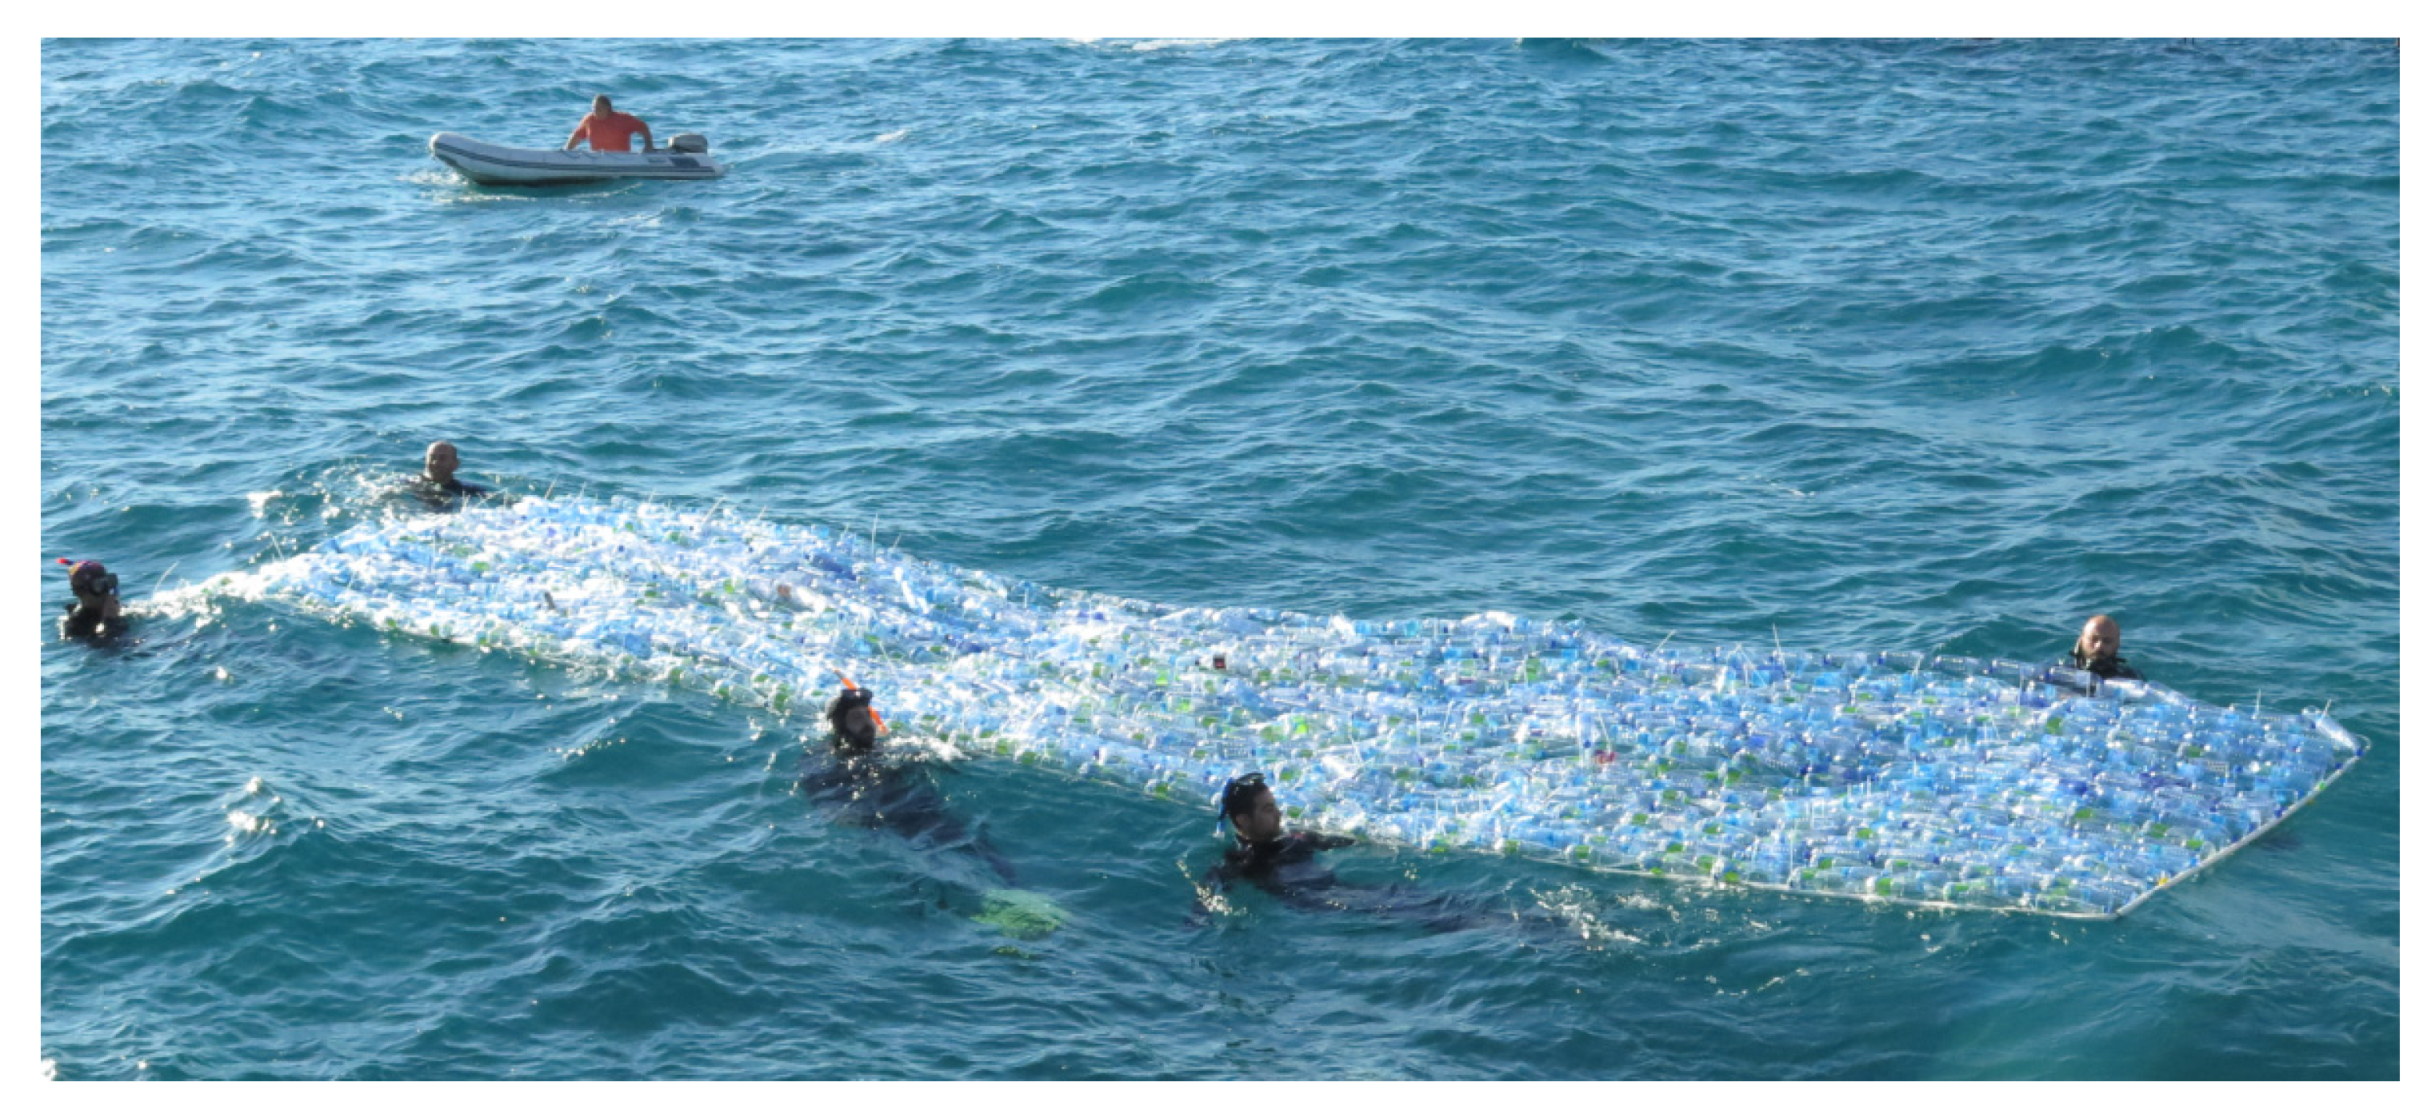
2. Materials and Methods
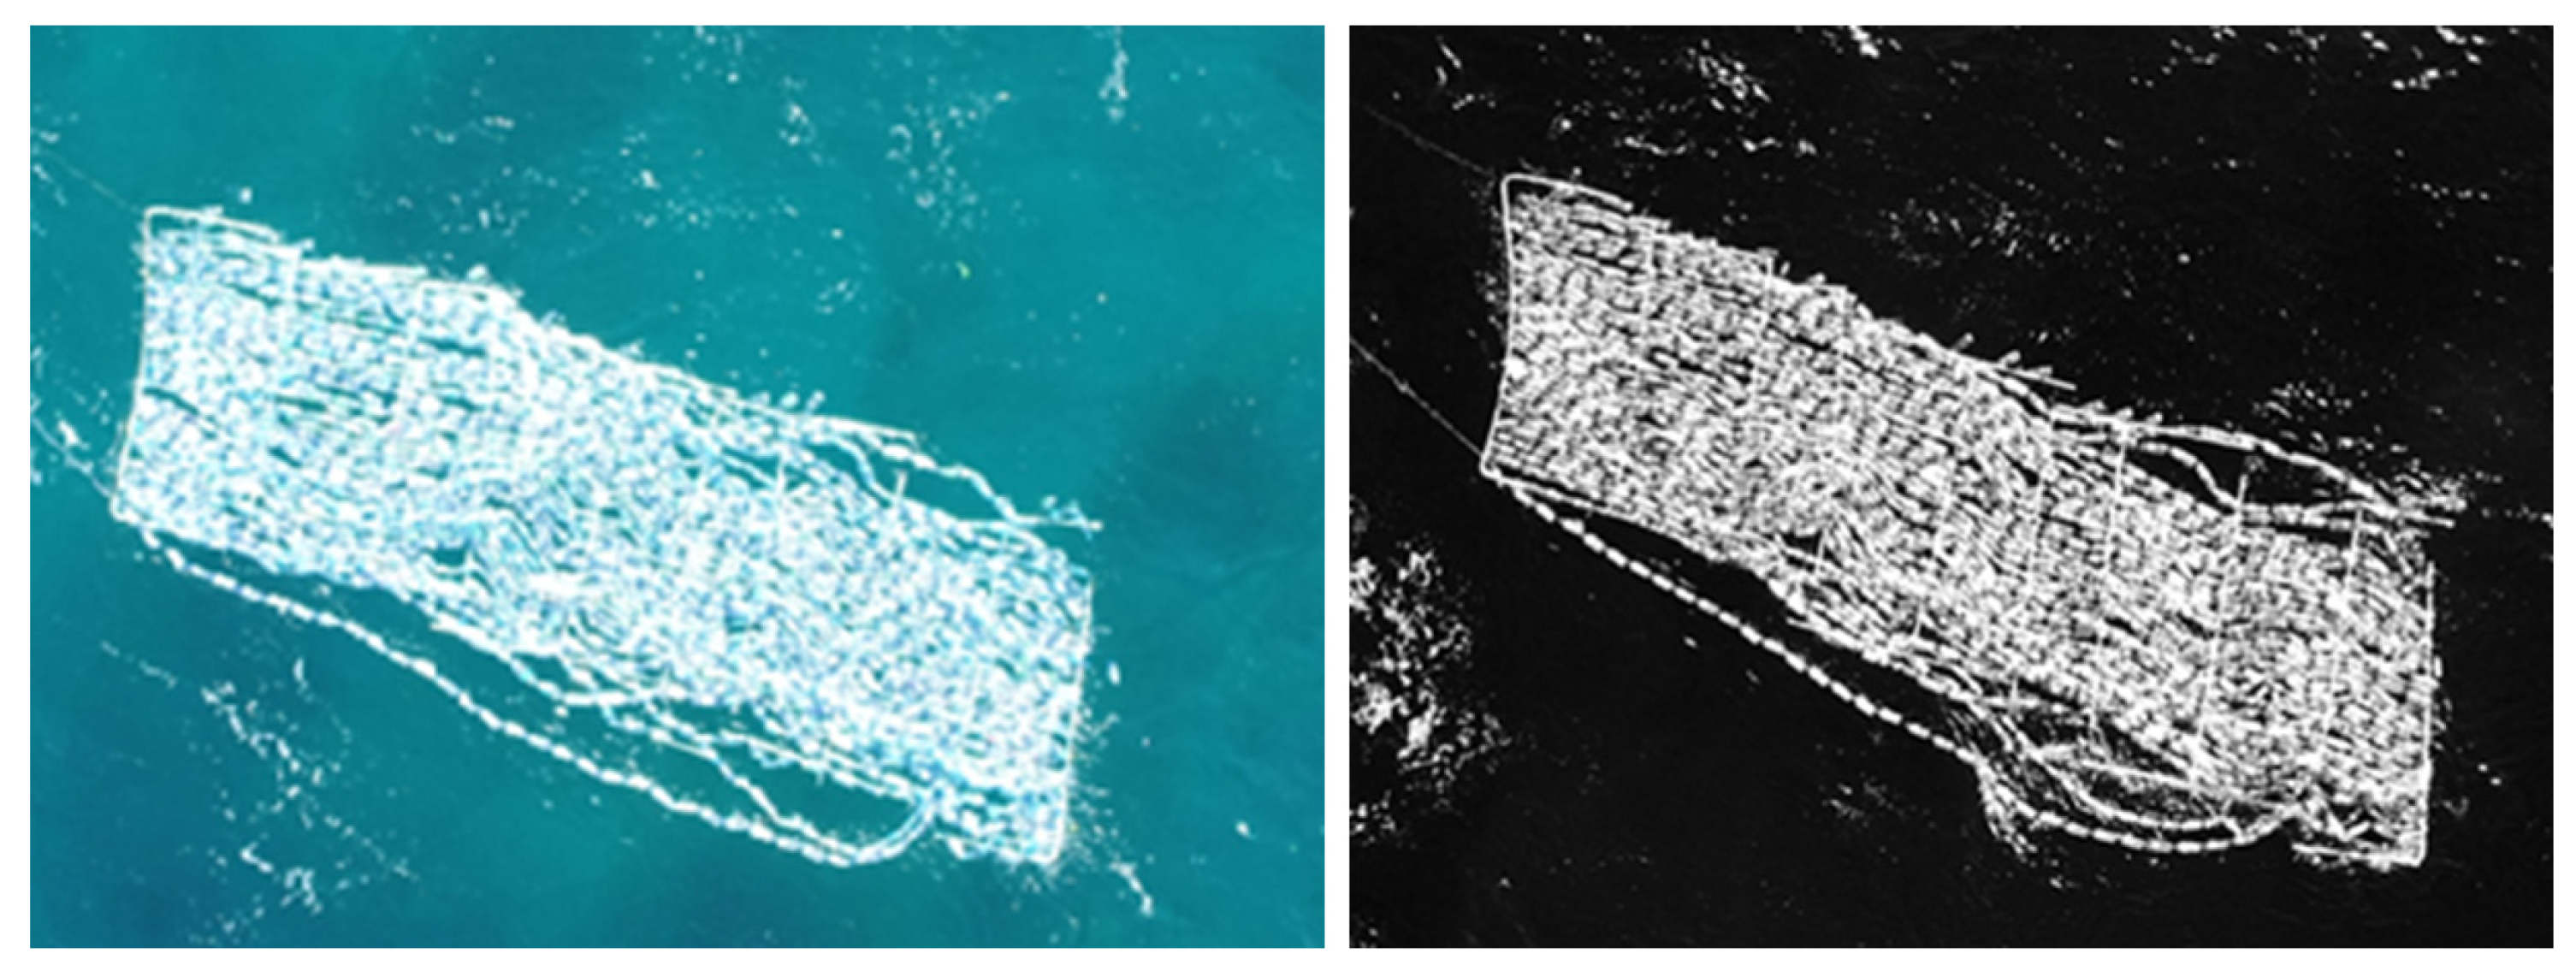
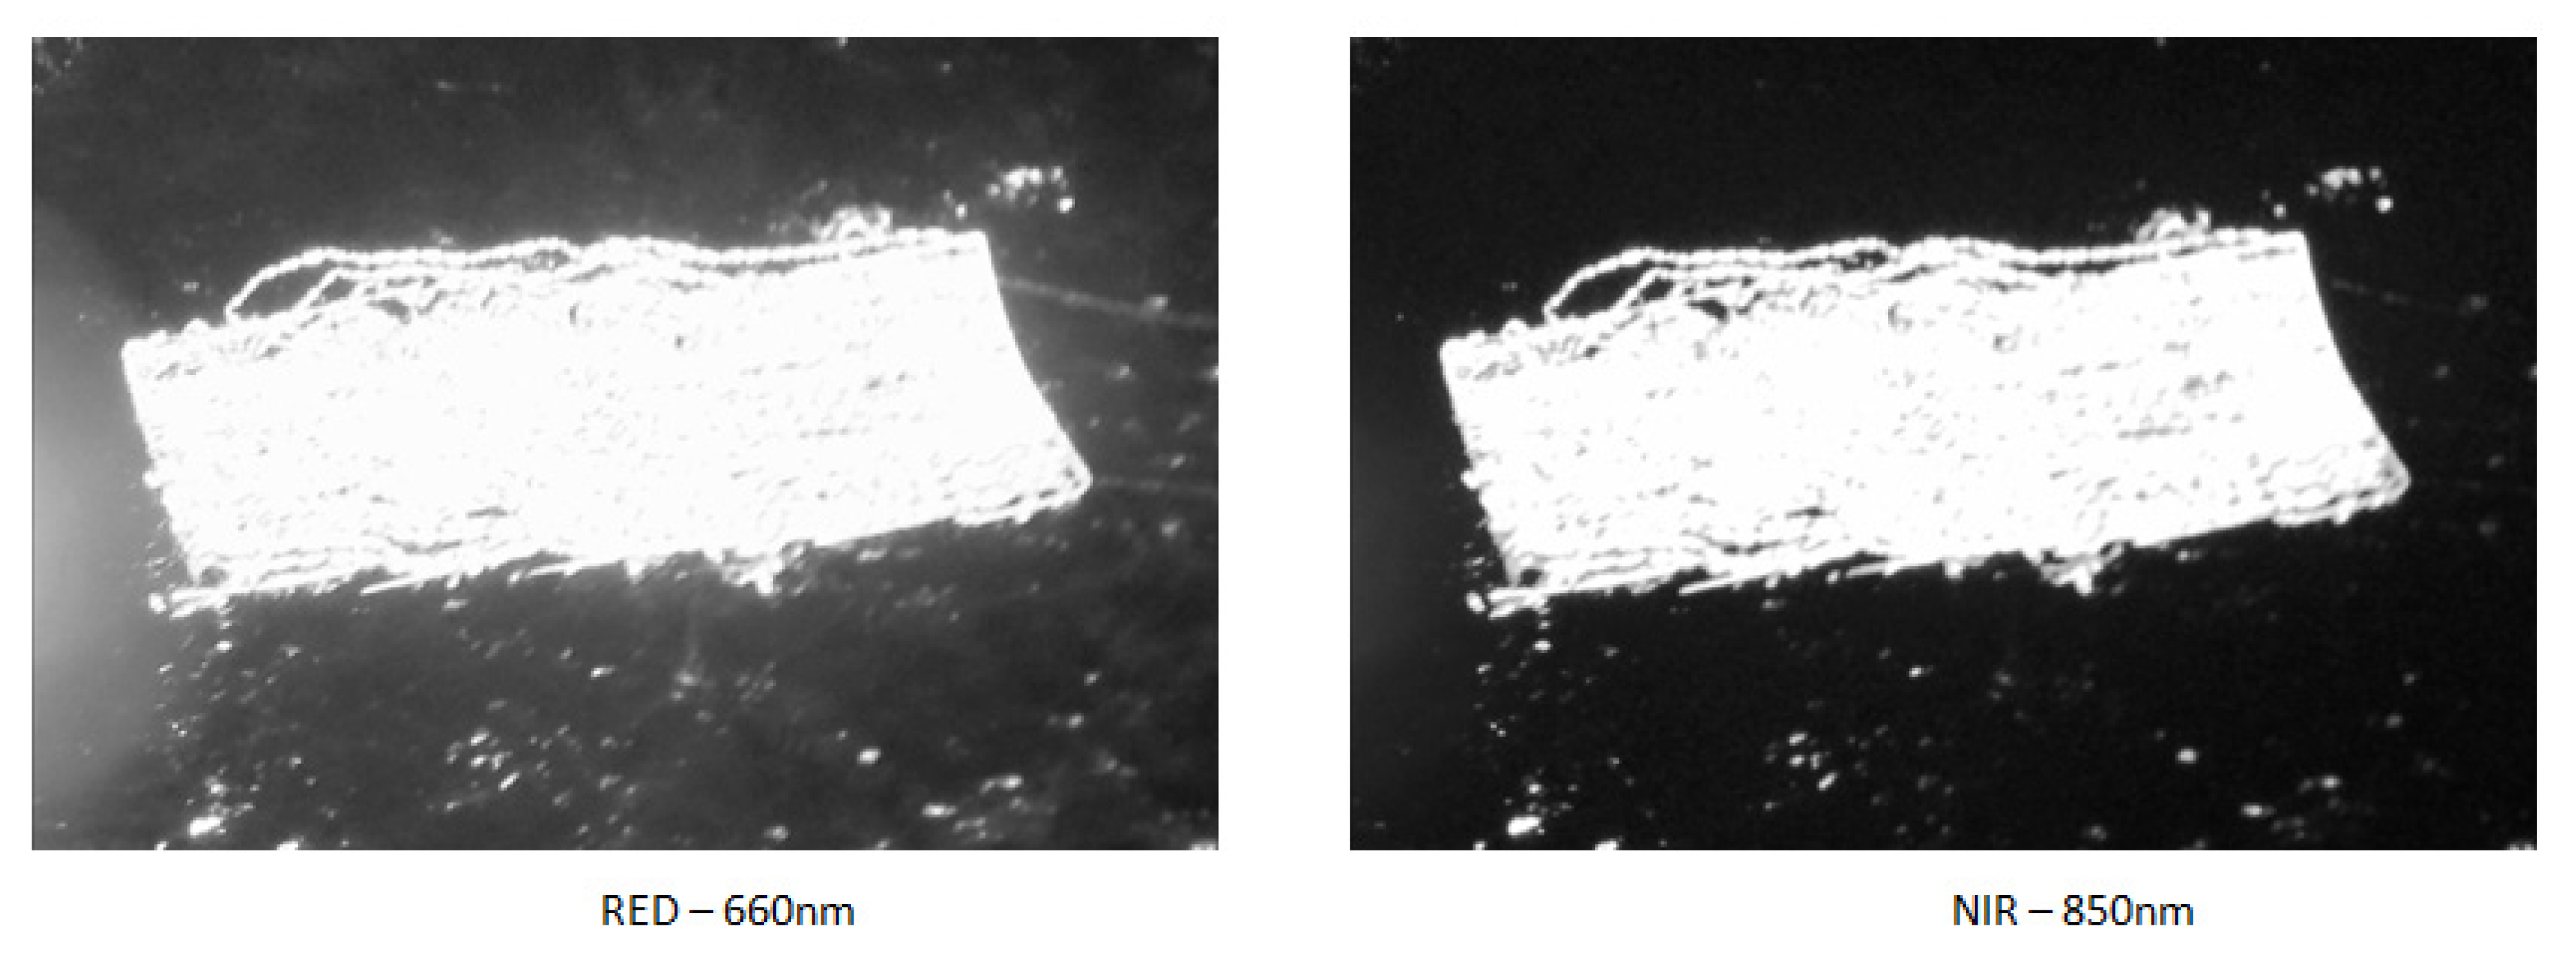
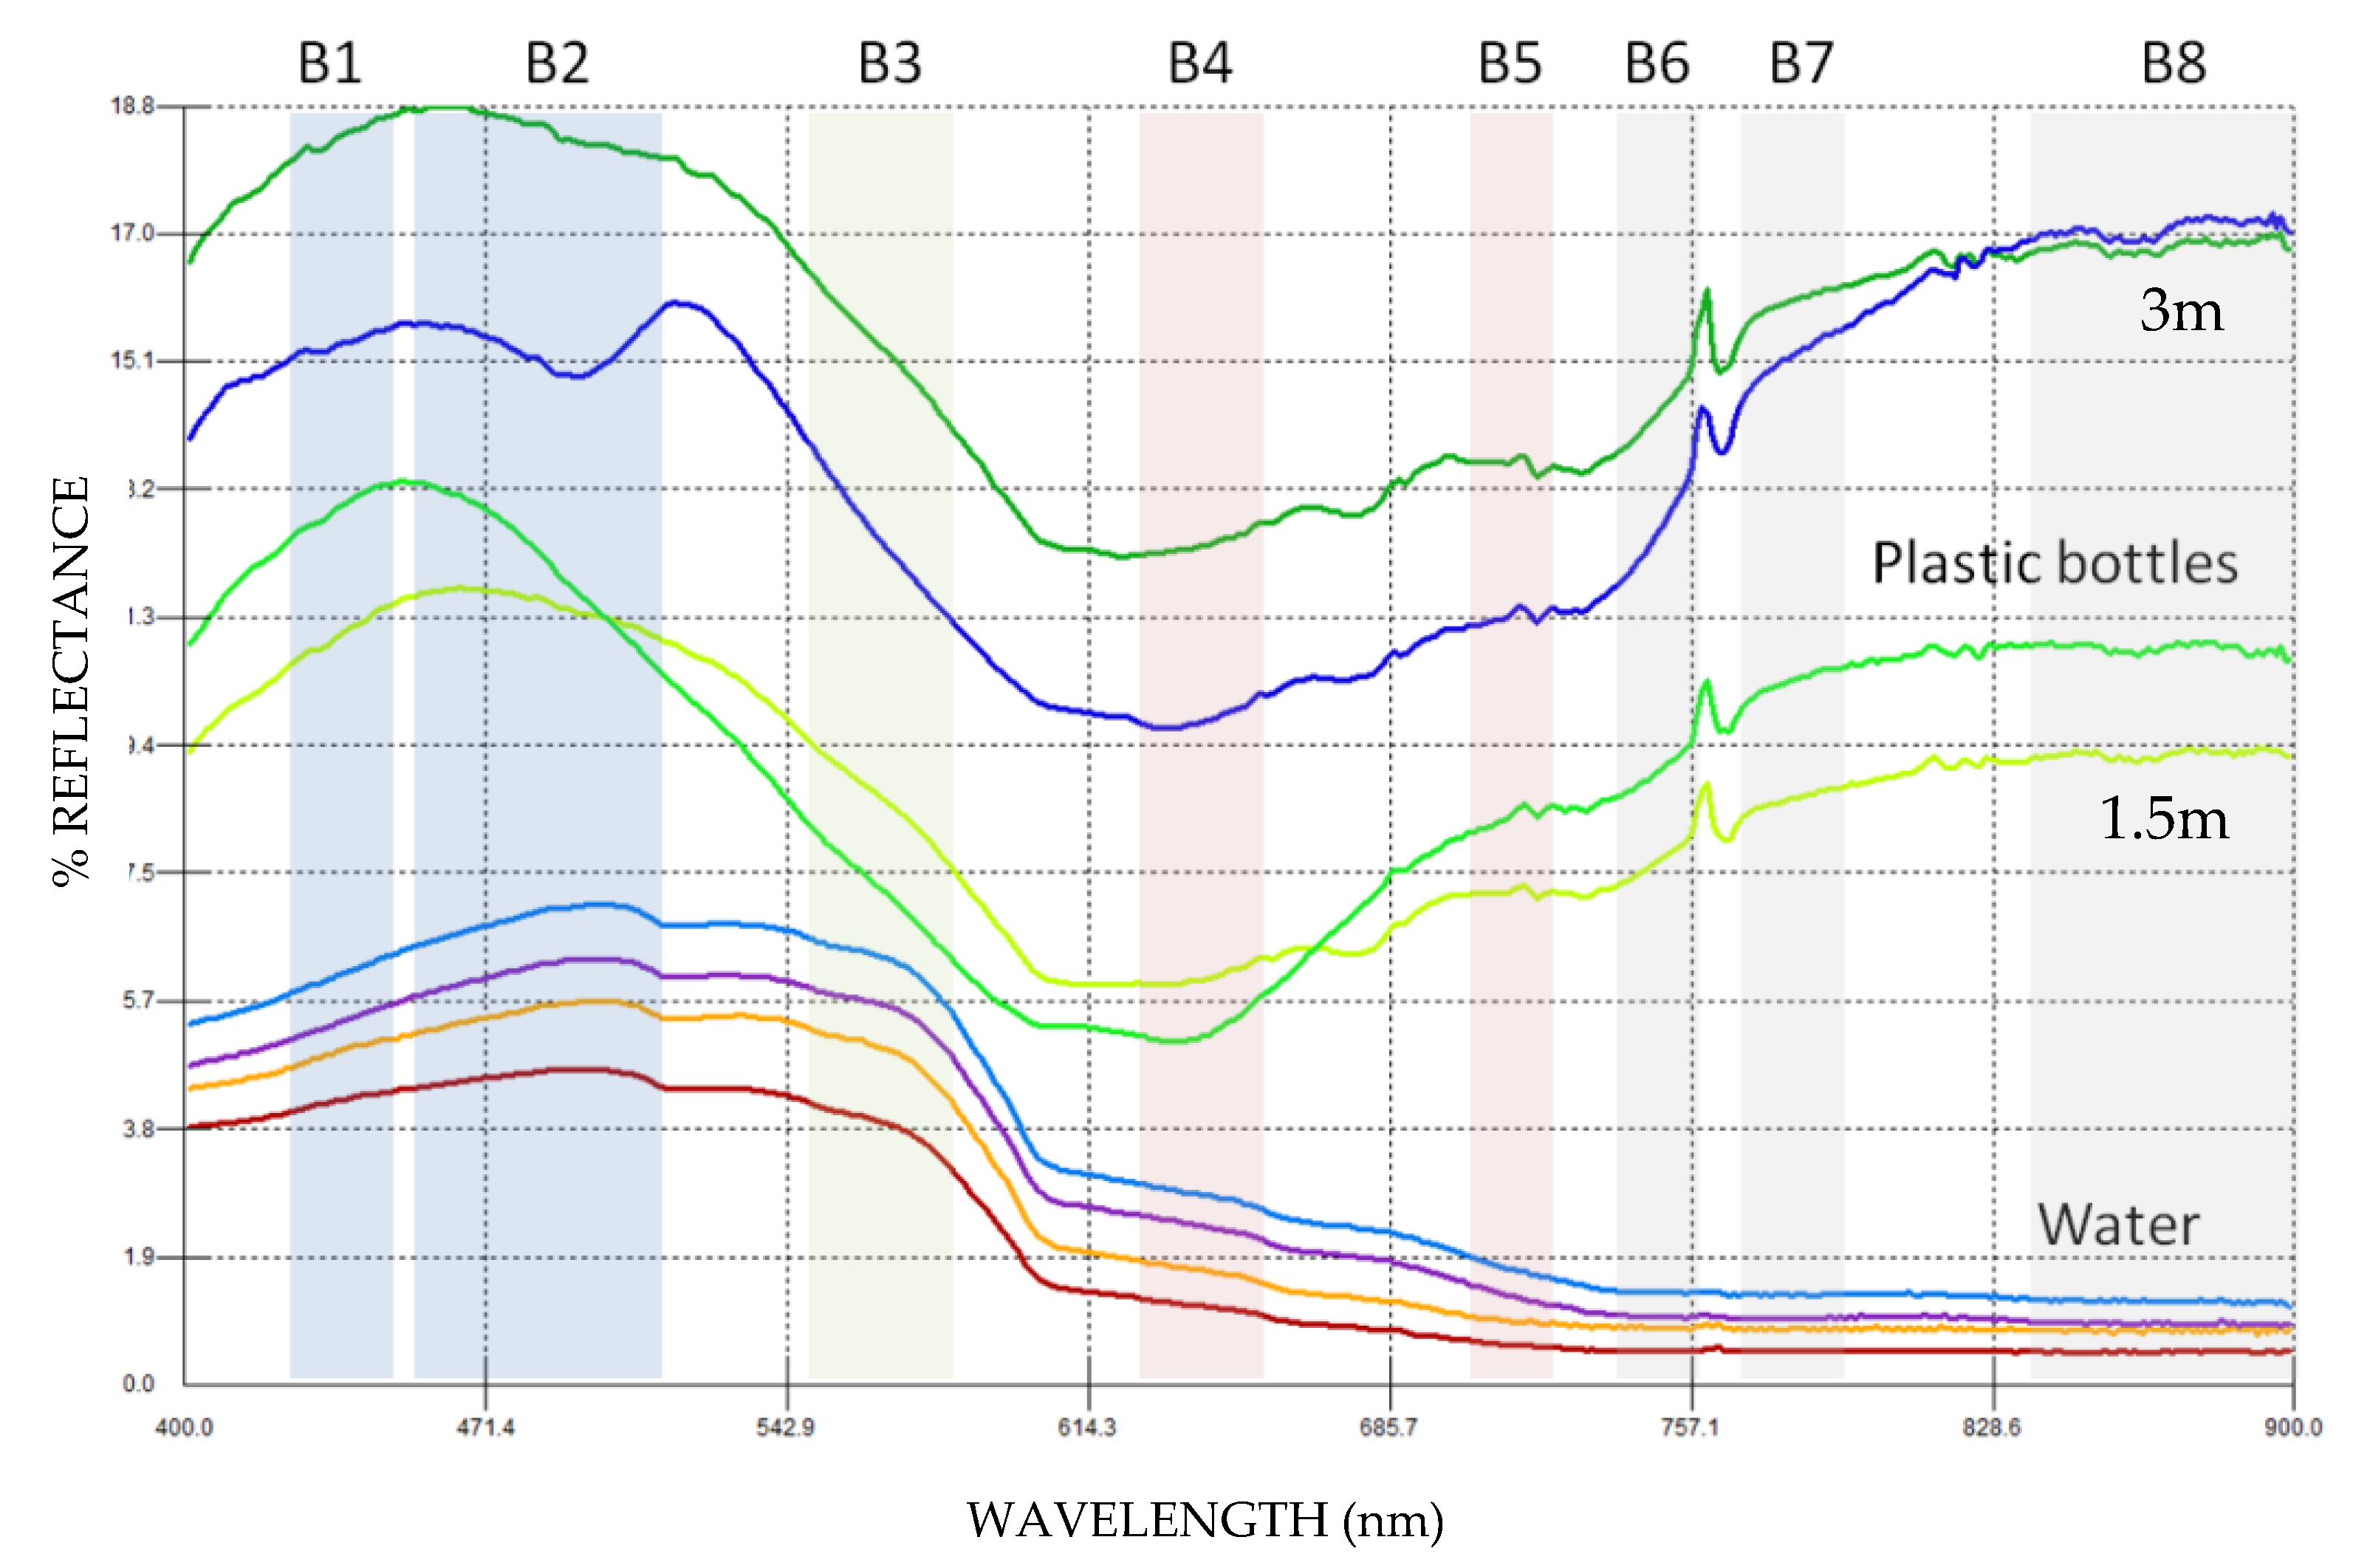
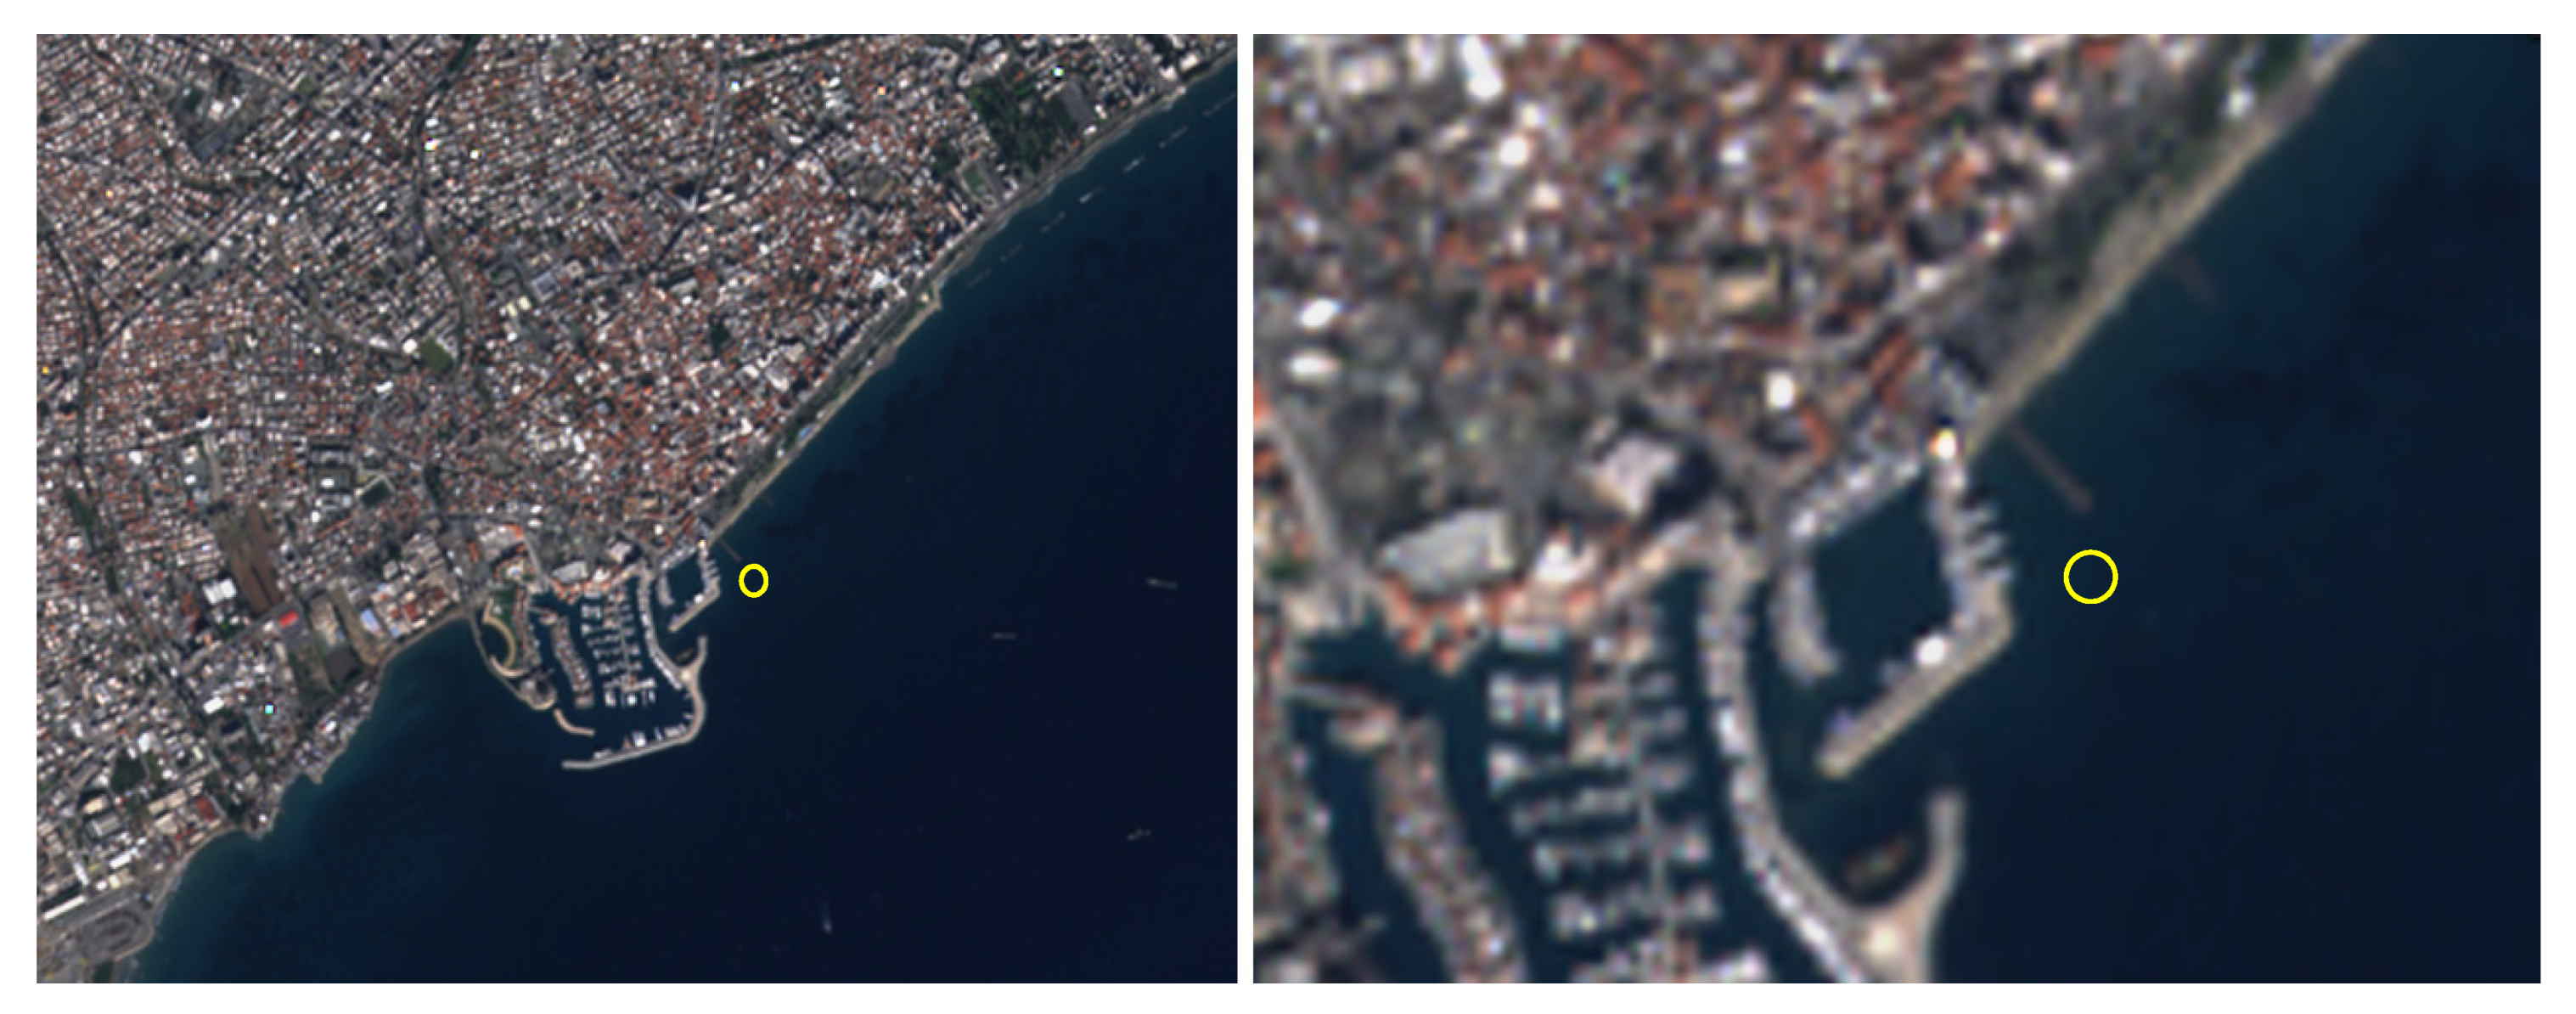
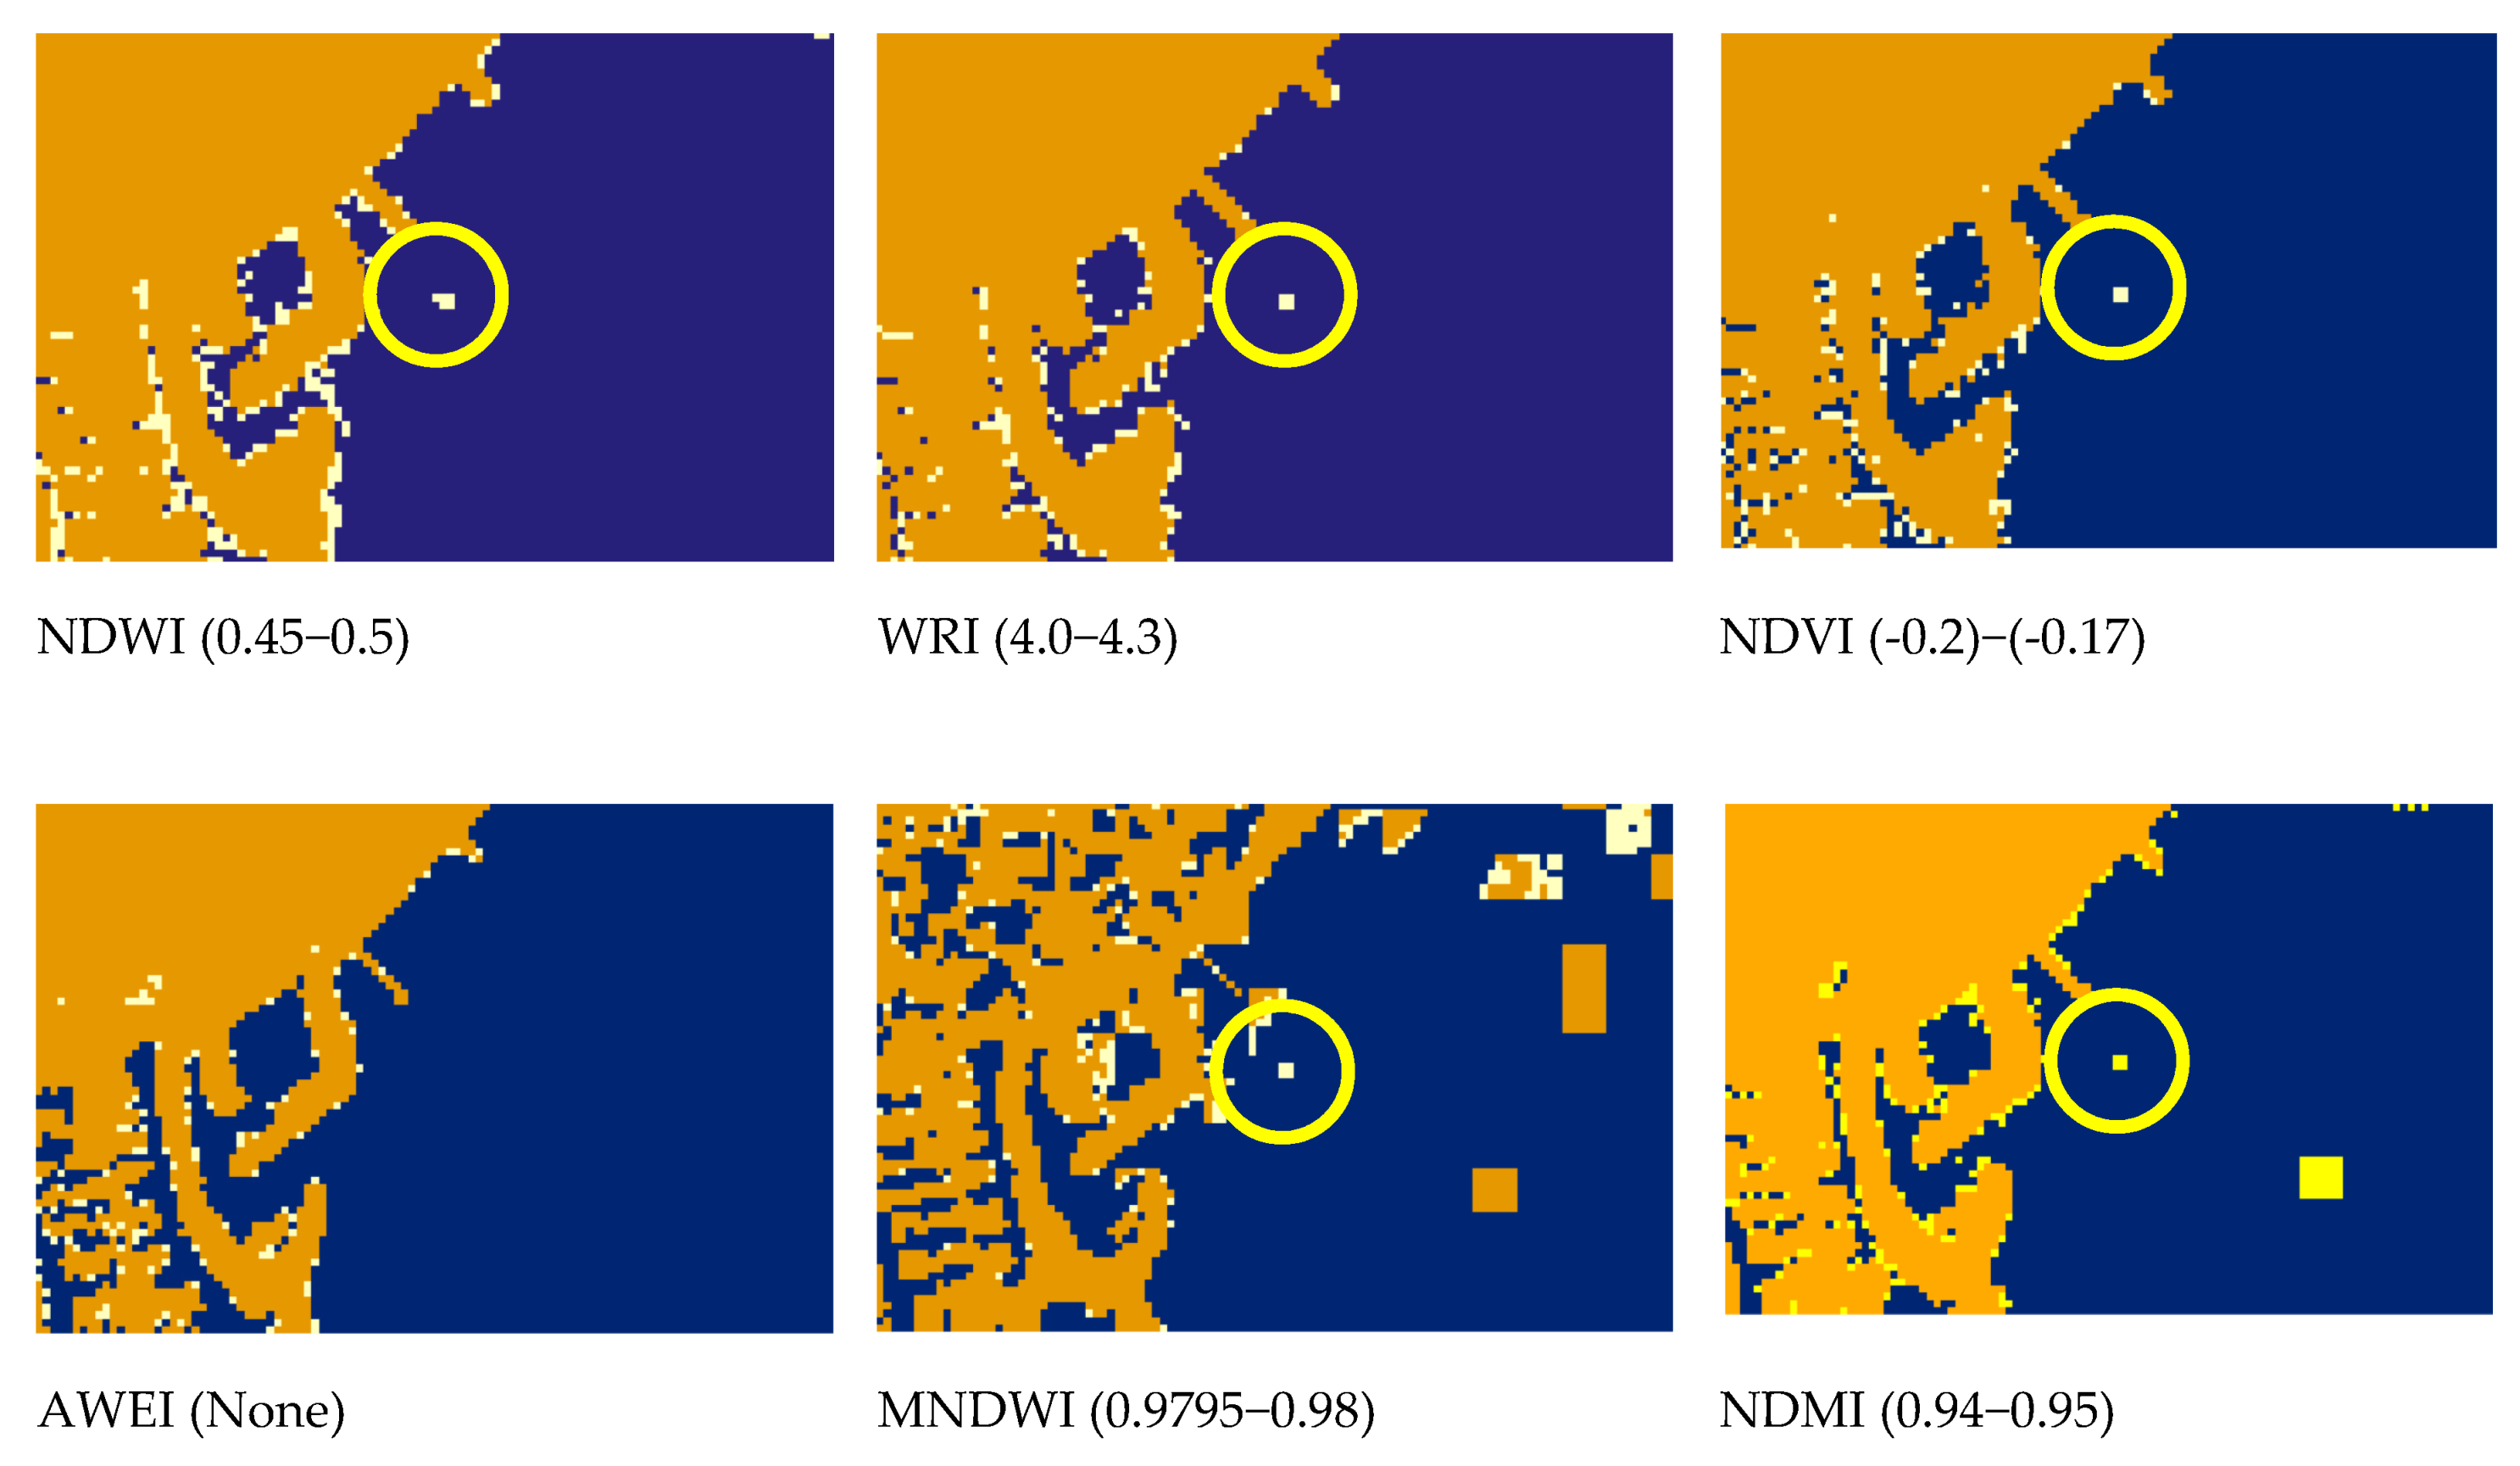
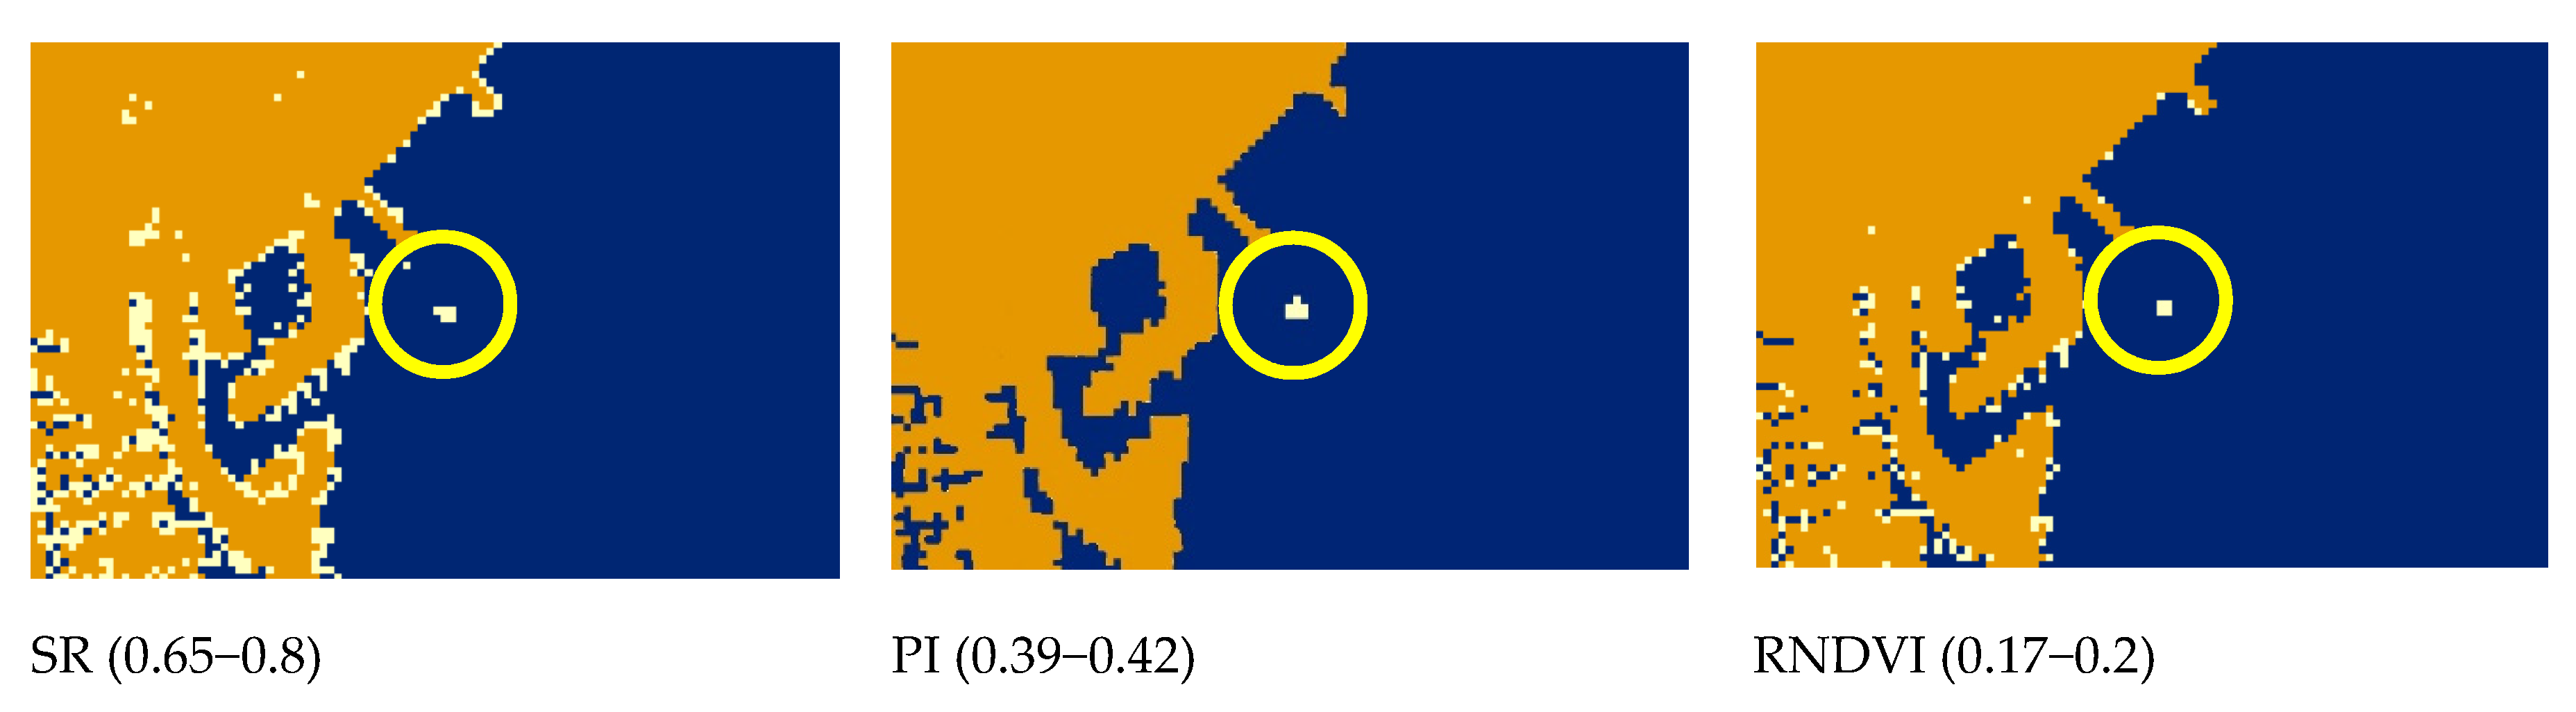
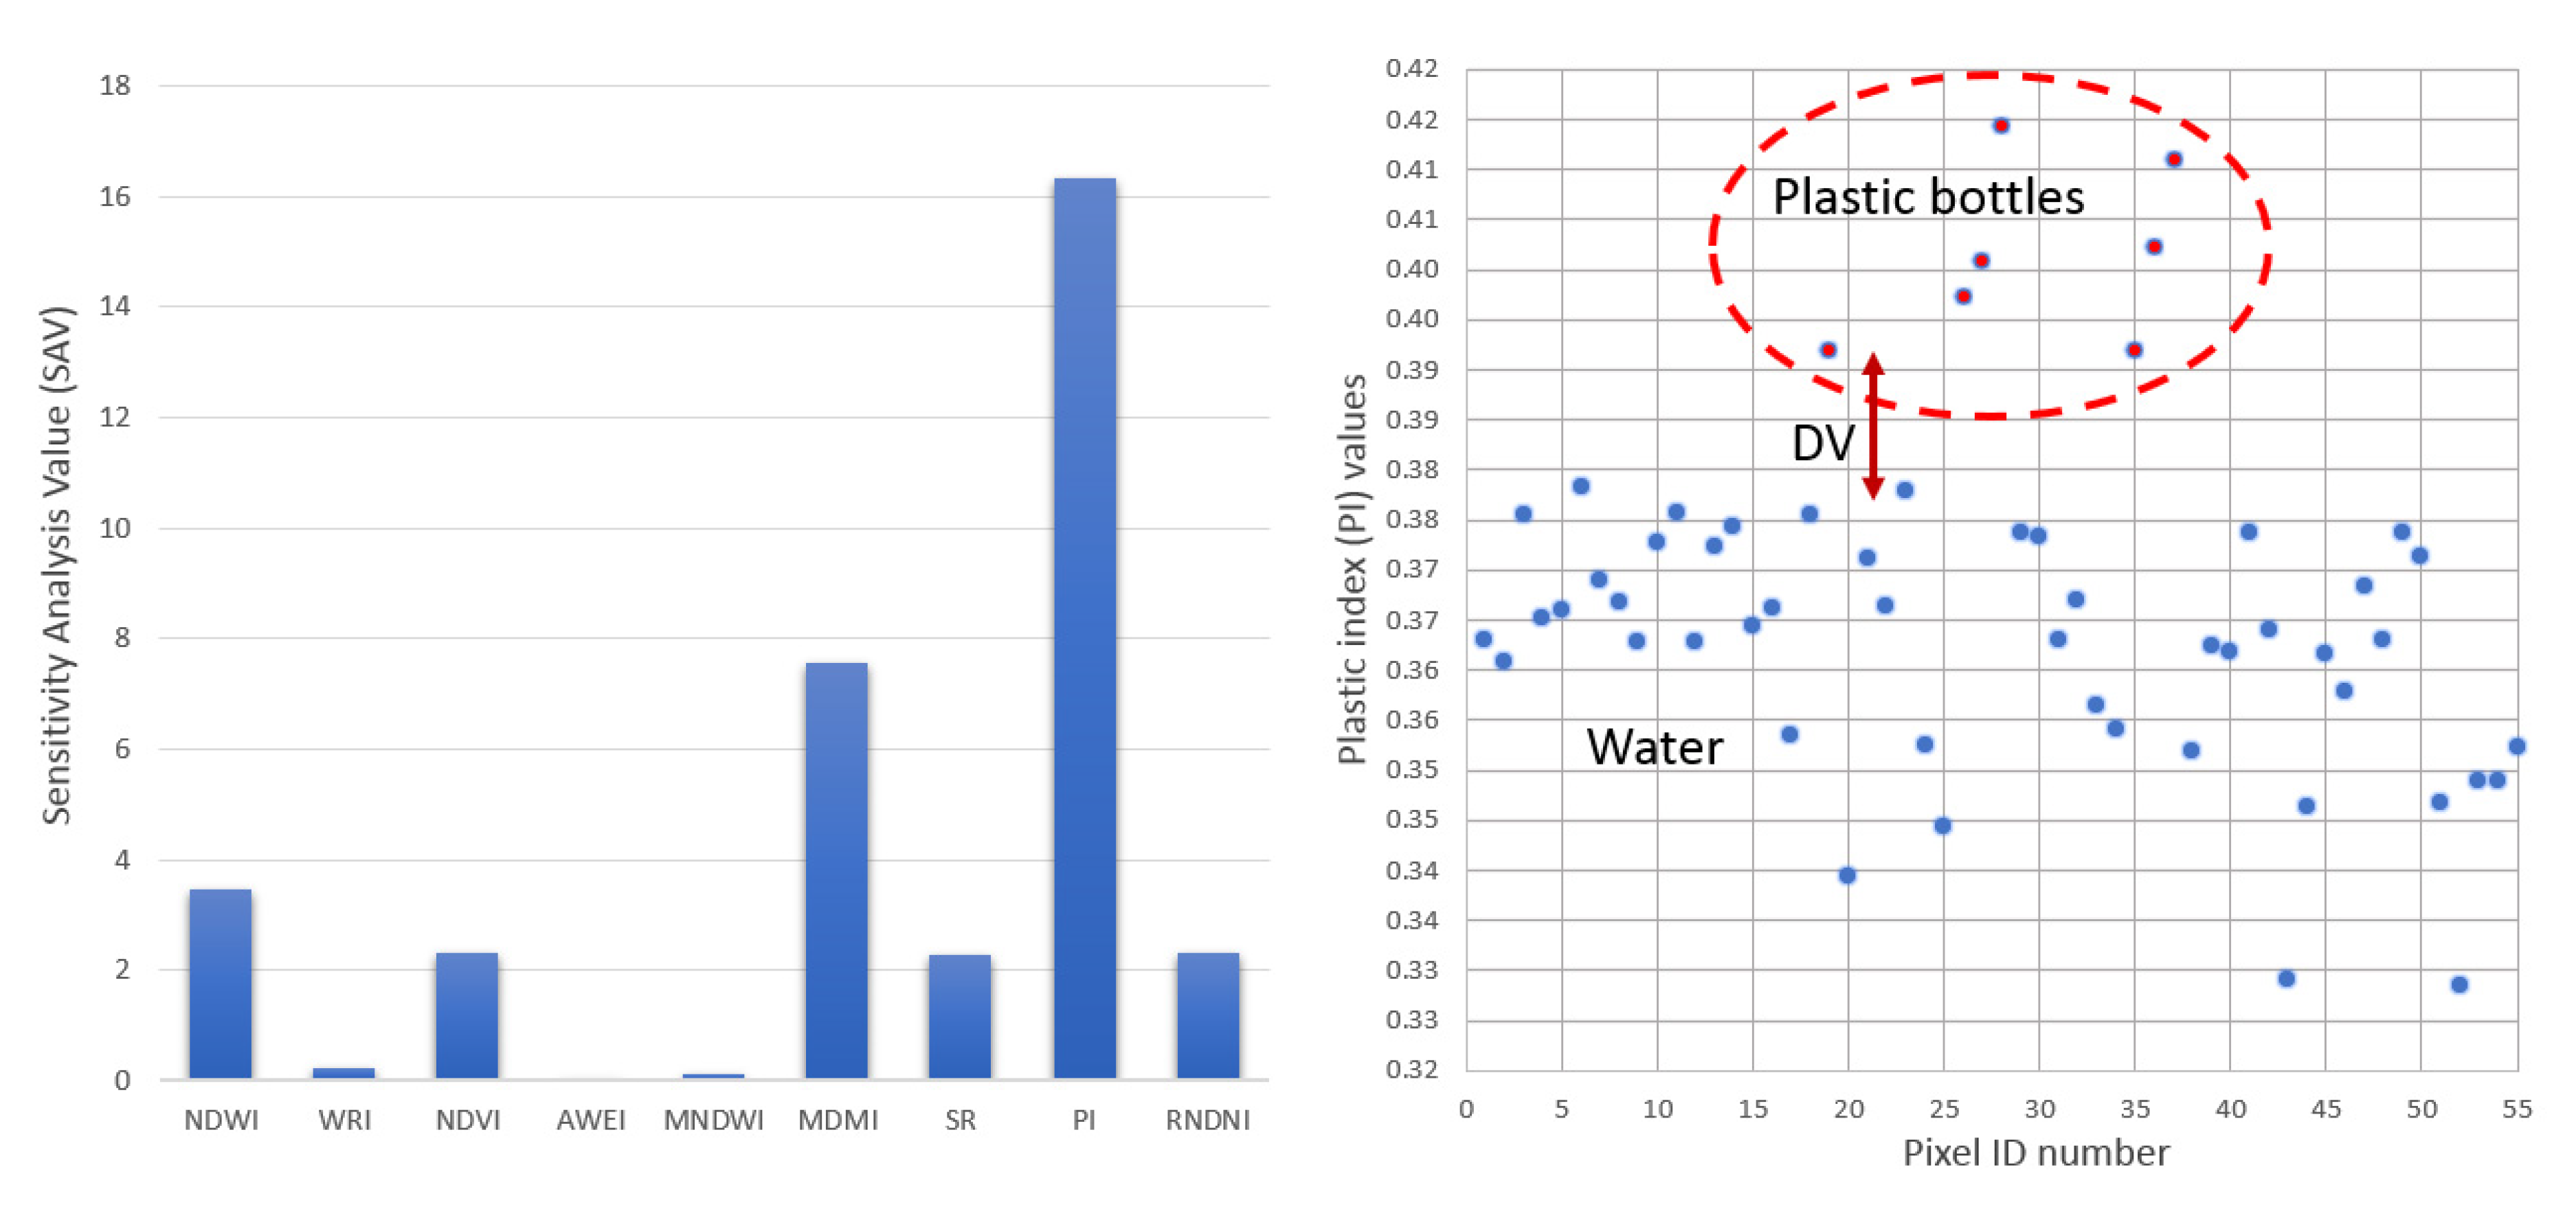
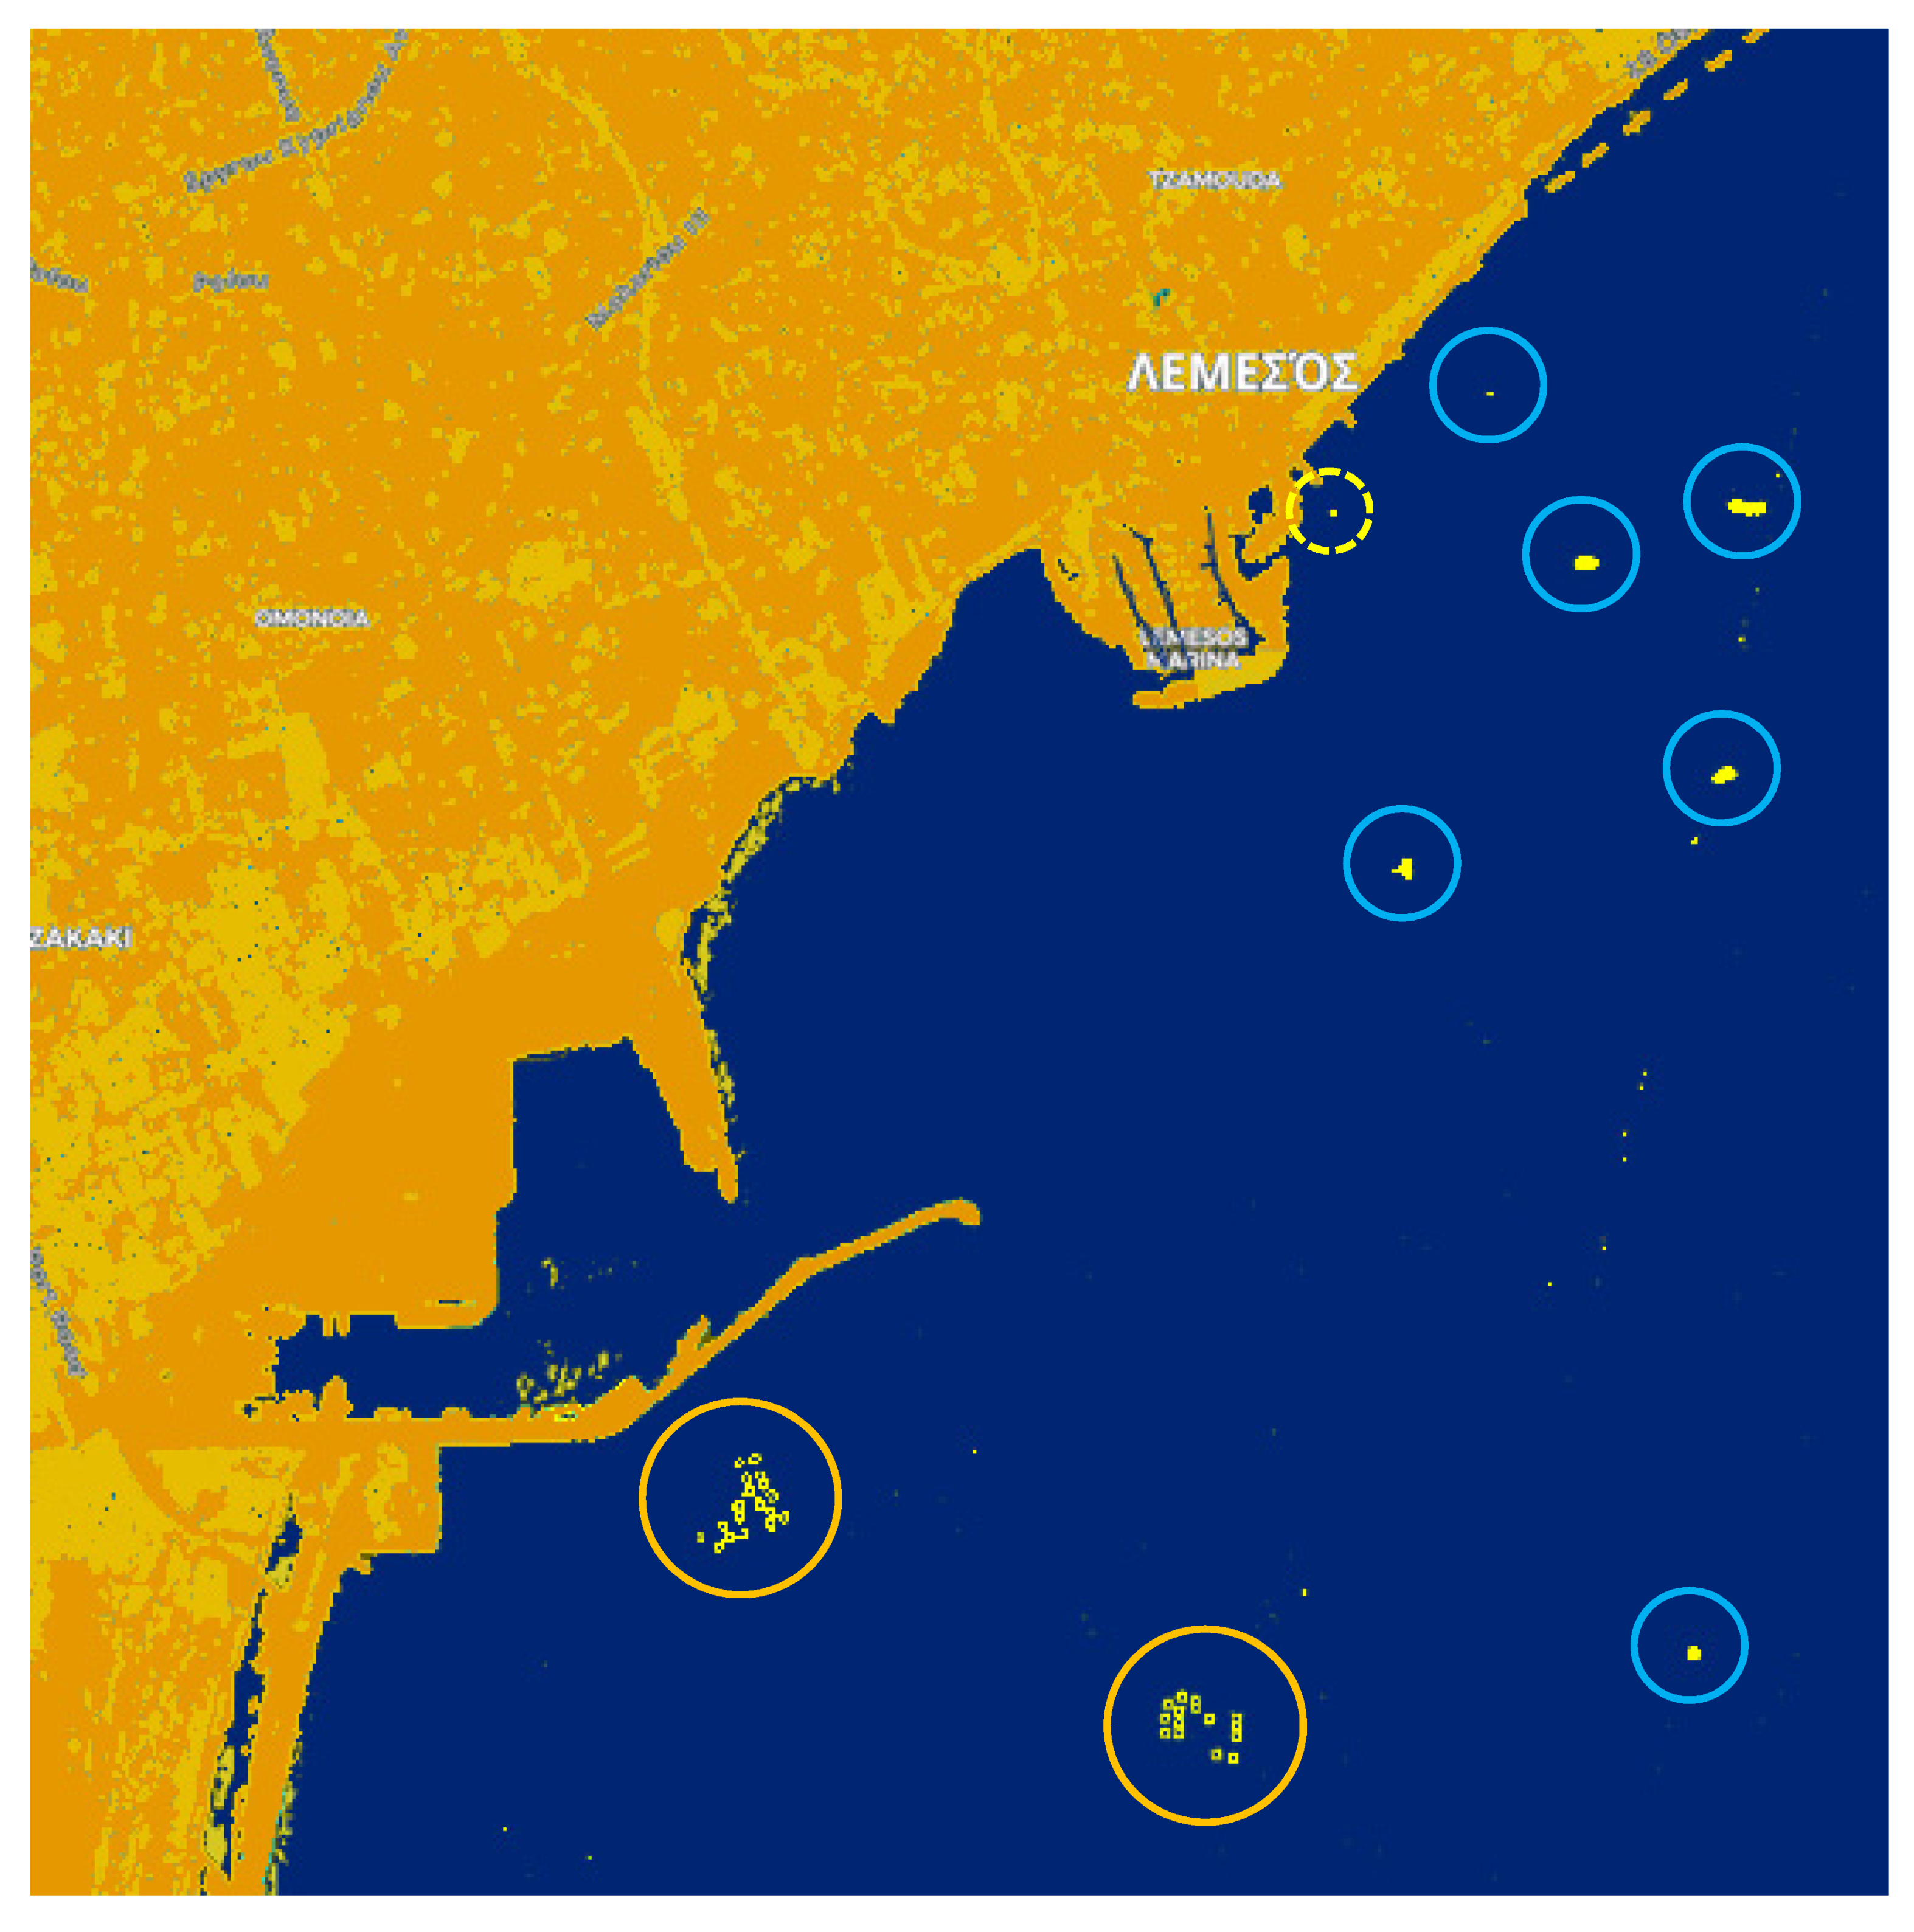
In this study, plastic bottles were employed in order to determine if plastic litter can be identified through Sentinel-2 satellite images. According to Biermann et al [29], the high spatial resolution for up to 10 m × 10 m is able to detect small features in the sea, such as plastic litter. In this study, the objective was to examine if a smaller target can be detected by the Sentinel-2 satellite images. Aerial and Sentinel-2 satellite images were used to identify plastic litter in the water. A UAV platform with multispectral cameras took photos of the plastic litter target at the same time as the Sentinel-2 satellite overpass in order to examine different wavelengths in which plastic could be detected in seawater.
The study was conducted in Limassol, Cyprus, south of the Limassol Old Port. The site was selected as this area accumulated a large amount of debris from the ships waiting to enter Limassol Port. Research indicates that plastic debris is often found in areas with high marine traffic [13,53,70,71]. Plastic bottles comprise most of the floating marine debris and accumulate on the bottom of the sea and wash up on the coastlines [62,84]. The International Coastal Cleanup (ICC) report [85] found that plastic bottles were the third most common type of beach litter, that 10% of the global marine debris is plastic bottles [86] and make up 14% of the Mediterranean debris [55]. In order to identify plastic litter in the water, a plastic litter ”target” measuring 3 m × 10 m was created from water bottles of 0.5-liter and 1.5-liter size (Figure 1), to emulate marine plastic litter clusters floating in the sea. Plastic bottles were utilized as they are considered to comprise one of the most common types of marine debris [62,85]. Pasternak’s study [60] on plastic bottles found that large bottles were 6.3 times more abundant than bottles smaller than 1.5 liter [87]. The plastic litter target used for this project consisted of 1500 plastic bottles that were held together by nylon string and framed by PVC pipes.
The study took place on 15 December 2018 at the Limassol Old Port, during the Sentinel-2 satellite overpass. The use of Sentinel-2 images was selected as the images are free and open to all users through the Copernicus Hub. The satellite acquires images every 5 days, so that the time series of satellite images can be easily acquired for operational time-series applications. During the Sentinel-2 satellite overpass, the plastic litter ‘target’ was placed into the sea near the Old Port in Limassol, Cyprus and moved 200 m from the coastline (Figure 2).
Divers moved the target to 200 m south of the Limassol shoreline over a depth of 20 m, in order to simulate plastic marine debris in the ocean (Figure 3). A GPS tracker was attached to the plastic litter target to monitor the location of the target during the Sentinel-2 MSIL1C satellite overpass, which occurred on 15 December 2018 at 08:58 UTC.
The SVC HR-1024 spectroradiometer was used to obtain the spectral signatures of the water surface and the plastic litter “target” after it was placed in the water by taking measurements from the top of the wharf. The spectral signatures were taken from 1.5 and 3 m height to check the spectral response at different heights. The spectral signatures were measured with 4 degrees field of view with a sample area of 10 cm and 20 cm. Approximately 20 sampling points at each height were taken at increments of 1 meter apart perpendicular to the target. The multiple spectra taken at each sampling point were averaged by height in spectral groups to account for the effect of wind, water movement, etc.
During the Sentinel-2 satellite overpass, two UAVs were flown over the plastic litter target to acquire aerial images of the target at a low altitude. The DJI Phantom 4 Pro with an integrated RGB (red, green, blue) 20MP camera (Figure 4, left) and the DJI Phantom 2 with a modified GoPro camera and a Sony Exmor IMX206 multispectral camera with 660 nm and 850 nm filters (Figure 4, right) were utilized. The aerial images from the UAVs were compared to the images from the Sentinel-2 satellite. A significant limitation for the detection of plastics in water through the adoption of NIR spectroscopy and multispectral sensors is the strong absorption of infrared radiation by water [88]. The plastic bottles were collected and disposed in a plastic recycling bin at the end of the study.
The Sentinel-2 satellite is able to generate multispectral data with 13 bands in the visible, near infrared and short-wave infrared part of the spectrum with a spatial resolution of 10 m, 20 m and 60 m, as shown in Table 1. It can detect patches of plastic litter of various sizes [29]. Several studies use SWIR imagery to detect plastics in the sea [70]; however, the spatial resolution of 60 m × 60 m would be too low in order to identify a target of 3 m × 10 m. The satellite overpass occurs every 5 days and provides a systematic coverage of the entire Mediterranean Sea. The Sentinel-2 satellite was employed because (a) it provides free and open data, (b) it provides a systematic overview at the same location since the overpass occurs every five days, which provides the ability to revisit a specific location, and (c), the pixel size of the Sentinel-2 satellite has better spatial resolution from other satellite with freely available data, especially in the visible and NIR bands. In this study, the images generated from the multispectral camera were compared with the corresponding wavelengths of the Sentinel-2 bands. Atmospheric correction was applied using the Sen2Cor processor but without any results for identifying the plastic litter target since plastic bottles are transparent and, by applying atmospheric correction, the values of water and floating plastic bottles are absorbed by the atmospheric correction algorithm; therefore, atmospheric correction was not applied. The 2 MSIL1C satellite was selected as atmospheric correction was not required.
Research by Rokni et al. [89] proposed several well-established indices for water features extraction. Therefore, equations 1−6 were applied to examine if plastics can be detected in water. The Simple Ratio equation employed blue and NIR bands to examine the bands that were identified in the field measurements from the spectral signatures. The Normalized Difference Water Index (NDWI) [90], Water Ratio Index (WRI) [91], Normalized Difference Vegetation Index (NDVI) [92], Automated Water Extraction Index (AWEI) [93], Modified Normalization Difference Water Index (MNDWI) [94] and Normalization Difference Moisture Index (NDMI) [95], as indicated in Equations (1)–(6) and the Simple Ratio (SR) was also used, delineated by Equation (7). In order to justify the potential of detection of the plastic target by introducing purpose-built relationships, the Plastic Index (PI) and Reversed Normalized Difference Vegetation Index (RNDVI), as expressed by Equations (8) and (9), respectively, were developed in this research effort in order to examine the use of the specific wavelength identified from the spectral signatures.
NDWI = (B03 − B08)/(B03 + B08)
WRI = (B03 + B04)/(B08 + B012)
NDVI = (B08 − B04)/(B08 + B04)
AWEI = 4 x (B03 − B012) − (0.25 × B08 + 2.75 × B011)
MNDWI = (B03 − B012)/(B04 + B012)
NDMI = (B03 − B08)/(B03 + B08)
SR = B08/B04
PI = B08/(B08 + B04)
RNDVI = (B04 − B08)/(B04 + B08)
Due to the innovative nature of the study, a sensitivity analysis was used to better understand the dynamics and emergent patterns of the indices and provide derivatives of model output parameters (observables) with respect to input parameters [96]. The sensitivity analysis was developed according to the parameters and carried out on the above indices to estimate the objective sensitivity measures in the form of partial derivatives of the model outcomes with respect to input parameters. Each index was examined based on the minimum and maximum values within the Area of Interest, the number of pixels detected for the plastic litter target and the discriminative value, which is the distinct separation that results from the maximum water values and the minimum plastic values for each index. These values were normalized by dividing the maximum value subtracted from the minimum value in the Area of Interest in order to determine the sensitivity parameters of each index. The Area of Interest was selected around the target with a buffer of 50 m radius, which was approximately an area of 8000 m2, as shown in Figure 9.

3. Results

After the plastic litter target was placed in the water and its location was fixed using anchors, the UAVs were flown over the target in order to acquire RGB and infrared (B08) images of the target at the same time as the Sentinel-2 satellite overpass. Both UAVs were flown over the target so that the images would be taken at the same time. Figure 5 features aerial images of the plastic litter target in both RGB 20MP and infrared (B08). The RGB image of the plastic litter target (Figure 5, left) is in natural color while the infrared image of the plastic litter target (Figure 5, right) is in black and white for visual comparison.
The multispectral image at 660 nm (Figure 6, left) indicates that the reflectance of the water and the reflectance of the plastic litter target have lesser variance than the multispectral image at 850 nm (Figure 6, right) which indicates the reflectance of the plastic litter target, which results from the water’s increased absorption of solar radiation.
Spectral signatures show high reflectance in plastics and no reflectance for water in the near-infrared (NIR) domain [29,85,97]. NIR spectroscopy is currently used in related applications, including the sorting of plastic debris in recycling facilities [66,67,78,84,98]. After placing the plastic litter target in the water, the spectral signatures of the sea water and the plastic bottles were taken and plotted according to the different channels of the Sentinel-2 satellite. The results of the study indicated that plastic bottles have high reflectance in the blue and NIR bands and the water has high reflectance in the blue and low reflectance in the NIR bands. Although, theoretically, the reflectance of water should be zero in the infrared wavelength, due to sediment and debris, there is a low reflectance for water at those wavelengths. In this study, the plastic litter detection was only examined between 400 –900 nm. Within this range, the reflectance of the plastic bottles is low in the red band, but increases in the infrared bands, where water absorbs all solar radiation and has almost no reflectance [68], as indicated in Figure 7. Therefore, plastic bottles can be identified using B06, B07 and B08 of Sentinel-2 satellite images. The 20 m spatial resolution in bands B06 and B07 makes it difficult to detect smaller targets, while B08 has a 10 m spatial resolution, which is able to detect the objects due to higher spatial resolution.
The above spectral signatures showed that the percentage reflectance at the infrared band was high for the plastic bottles, while that for the water was low. In the blue band, the percentage reflectance of both water and plastic bottles was high; hence, it was difficult to recognize the plastic bottles within the blue channel, as is evident in Figure 7. The plastic bottles had minimum reflectance value at B04 and maximum reflectance value at B08, which were also evident in the images taken with the infrared camera (Figure 6). Therefore, the images acquired from the Sentinel-2 satellite in the visible range did not detect the plastic litter target. In Figure 8, a yellow circle indicates where the plastic litter target should be visible.
Figure 9 presents the satellite images from the Sentinel-2 MSIL1C satellite overpass on 15 December 2018 as processed by the indices that were examined in order to identify the plastic litter target using the Sentinel-2 satellite images. In the results of the processed indices in Figure 9, all the above indices identified the plastic litter at the values featured in Figure 9, except for the AWEI. It was found that indices with B04 and B08 had better results since the spatial resolution was 10 m.
The authors used the proposed statistical method of objective sensitivity analysis [96] to validate which index has the best capability of detecting plastic litter in water using the selected indices. The sensitivity analysis (SAV) is calculated using the discriminative value (DV) multiplied by the number of pixels detected (NPD) in the area of interest around the target, which is divided by the maximum value (Dmax) minus the minimum value (Dmin) detected for each index. The equation to identify the Sensitivity Analysis Values is expressed as:
SAV = (DV ∗ NPD)/(Dmax − Dmin)
The sensitivity analysis values are shown in Table 2.
Figure 10 (left) features the values where the plastics were detected, as determined in the sensitivity analysis using all of the nine indices. The sensitivity analysis performed on the indices indicated that the most optimal index to identify the plastic litter target was the PI (Equation (8)).
The sensitivity analysis performed on the indices indicated that the most optimal index to identify the plastic litter target was the PI (Equation (8)). The scatterplot (Figure 10, right) shows the plastic index values (PIV) from the Plastic Index (PI) equation showing the water values clustered in the bottom and the plastic litter values at the top, providing a clear separation between them (DV). Figure 11 depicts the plastic litter target within the dotted yellow circle that was identified using the PI equation.
The PI equation was applied to the entire region of the Limassol coast, where the results identified the plastic litter target, as shown within the yellow dashed circle in Figure 12, as well as the fishing collars made of plastic and used in the floating fish farms off the coast of Limassol, which are encircled in orange. The yellow pixels encircled in blue in the upper right quadrant of the image give false positive values, as the Plastic Index identified them as plastic litter, although they were boats with plastic surfaces.

4. Discussion

The significance of this study is to identify whether plastic litter targets under 10 m can be detected with Sentinel-2 satellite images. This study examined the use of the Plastic Index (PI) and the Reversed Normalized Difference Vegetation Index (RNDVI) in order to identify plastic litter in water. In this study, a 3 m × 10 m plastic litter target was used to test if plastics could be detected. The study clearly shows that the 10 m spatial resolution bands (B04 and B08) can identify a plastic litter target below the Sentinel-2 pixel size. Our study used a smaller target, thereby differing from other research which used Sentinel-2 images to identify larger targets of 10 m [29,80]. The Plastic Index developed in this study can discriminate and identify plastic targets of 3 m × 10 m. The sensitivity analysis found that the Reversed Normalized Difference Vegetation Index produced low values and therefore was unable to identify plastic litter targets in water. The results of the PI were applied for the coast of Limassol. There is evidence that the PI may be used to discriminate smaller plastic targets. As seen in Figure 12, the fishing collars used in the floating fish farms off the coast of Limassol were identified by the PI. These collars are made of plastic and have a pipe diameter ranging from 50–110 cm; however, the collars themselves may have a diameter of 80 m. Future work may include smaller sizes of plastic targets as well as different types of plastic at different depths. This will provide the opportunity to validate and calibrate the PI accordingly.
The use of multispectral cameras mounted on a UAV provided the ability to check the reflectance of the plastic litter at different wavelengths, which was useful to visually identify the plastic reflectance response at these wavelengths. The acquisition of in situ spectral signatures of the plastic litter target within the water provided the ability to identify and compare with the spectral bands of Sentinel-2. The plastic litter detection was only examined between 400–900 nm. In this range, the reflectance of plastic bottles is low in the red band, but increases in the infrared bands, where water absorbs all the solar radiation and has almost no reflectance in the near infrared band, as indicated by Hafeez et al. [68]. The size of the plastic litter target was purposely used to emulate a plastic litter cluster and to find out if such a cluster can be identified from the Sentinel-2 satellite, as was conducted in other studies [29,62,80]. Plastic bottles have higher reflectance values in Bands 6, 7 and 8 of Sentinel-2 satellite images.
Based on the research featured in the Introduction, plastic can form clusters that may reach up to kilometers in size [35,36]. As a result, the intention of the study was not to identify individual plastic items but to focus on small clusters which had not been studied in previous research. Several indices were used to identify plastic litter targets in the study area. The evaluation of the images found that the Plastic Index using bands B04 and B08 of the Sentinel-2 MSIL1C sensor, developed and put forward by the authors, was the most effective in identifying the plastic litter as well as the pipe rings of floating fish farms that are located in the vicinity of the study area. One of the limitations of using smaller targets to detect plastic litter may be the satellite pixel size [66]. For this reason, future research can replicate this study by using high resolution satellite sensors (e.g., Planet Imagery, WorldView, GeoEye) to identify smaller plastic litter targets.

5. Conclusions

The results of this study indicate that plastic bottles in the sea can best be identified using the PI index at B04 and B08 using Sentinel-2 satellite images and the results assessed with spectral signatures and aerial images acquired from a UAV. The study found that Sentinel-2 satellite images were effective in identifying plastic clusters in the sea. As well, the study found that plastics in the sea can be identified by the high reflectance of solar radiation at NIR wavelengths. Two new indices, the Plastics Index (PI) and the Reversed Normalized Difference Vegetation Index (RNDVI) were formulated for processing the satellite images in the effort to identify plastic litter in the water. The methodology can only be used during cloud-free conditions using Sentinel-2 MSIL1C, without performing atmospheric correction due to the water spectral absorption. The findings of this study are significant, since, as indicated by various researchers, the south-east Mediterranean faces a significant problem with plastic debris. This study developed an index that can identify plastics in the sea, which will assist the process of monitoring plastics in the Mediterranean Sea. The newly developed Plastic Index may be applied to other types of plastic debris, such as plastic bags, marine debris from aquaculture and other material, which were used in other research studies. It is vital to note that future research will focus on using high resolution images to identify plastics.
The study lends itself to further research in several areas. In addition, along the lines of this study, further investigation can be conducted with various configurations of different materials, such as plastic bags, at different depths in the sea. Future research can also investigate the use of Sentinel-1 Synthetic Aperture Radar (SAR) images for the identification of plastic litter in the seas. Further research can examine different sized plastic litter to identify the sensitivity of Sentinel-2 images in detecting subpixel plastic clusters. One of the significant outcomes of the study is that smaller plastic targets under 10 m can be identified using the Sentinel-2 satellite images.

Author Contributions

Conceptualization, C.P. and K.T.; methodology, K.T. and C.P.; formal analysis, K.T.; writing—original draft preparation, K.T.; writing—review and editing, K.T. and S.M.; visualization, K.T.; supervision, C.P., K.T. and D.H.; project administration, C.P., K.T., S.M. and D.H. All authors have read and agreed to the published version of the manuscript.

Funding

This research received no external funding.

Acknowledgments

The methodology presented in this paper was developed within the activities of the ‘ERATOSTHENES: Excellence Research Centre for Earth Surveillance and Space-Based Monitoring of the Environment’—‘EXCELSIOR’ project, that has received funding from the European Union’s Horizon 2020 Research and Innovation program, under Grant Agreement No 857510 and from the Government of the Republic of Cyprus, through the Directorate General for the European Programmes, Coordination and Development (www.excelsior2020.eu). Through this project, the ERATOTHENES Research Centre of the Department of Civil Engineering and Geomatics at the Cyprus University of Technology is to be upgraded to ERATOSTHENES Centre of Excellence (ECoE). The authors acknowledge the contributions of the students and teachers of St. Peter and Paul Lyceum in Limassol, the Cyprus Diver’s Association, the Limassol and Germasogeia Municipalities. We would also like to thank their reviewers for their comments.

Conflicts of Interest

The authors declare no conflict of interest.

References

  1. UNEP—NOAA. Honolulu Strategy—A Global Framework for Prevention and Management of Marine Debris. 2011. Available online: https://repository.library.noaa.gov/view/noaa/10789 (accessed on 21 March 2019).
  2. Kershaw, P.J. Marine Plastic Debris and Microplastics—Global Lessons and Research to Inspire Action and Guide Policy Change; United Nations Environment Programme: Nairobi, Kenya, 2016; ISBN 978-92-807-3580-6. [Google Scholar]
  3. Thompson, R.C.; Swan, S.H.; Moore, C.J.; vom Saal, F.S. Our plastic age. Philos. Trans. R. Soc. B Biol. Sci. 2009, 364, 1973–1976. [Google Scholar] [CrossRef] [Green Version]
  4. Algalita Marine Research Foundation. Annual Report. 2008. Available online: https://algalita.org/ (accessed on 21 March 2019).
  5. Barnes, D.K.A.; Galgani, F.; Thompson, R.C.; Barlaz, M. Accumulation and fragmentation of plastic debris in global environments. Philos. Trans. R. Soc. Lond. Ser. B Biol. Sci. 2009, 364, 1985–1998. [Google Scholar] [CrossRef] [PubMed] [Green Version]
  6. Gall, S.C.; Thompson, R.C. The impact of debris on marine life. Mar. Pollut. Bull. 2015, 92, 170–179. [Google Scholar] [CrossRef] [PubMed]
  7. Thompson, R.C.; Olsen, Y.; Mitchell, R.P.; Davis, A.; Rowland, S.J.; John, A.W.G.; McGonigle, D.; Russell, E. Lost at sea: Where is all the plastic? Science 2004, 304, 838. [Google Scholar] [CrossRef] [PubMed]
  8. Walker, T.R.; Reid, K.; Arnould, J.P.Y.; Croxall, J.P. Marine debris surveys at Bird Island, South Georgia 1990–1995. Mar. Pollut. Bull. 1997, 34, 61–65. [Google Scholar] [CrossRef]
  9. Walker, T.R.; Grant, J.; Archambault, M.C. Accumulation of marine debris on an intertidal beach in an urban park (Halifax Harbour, Nova Scotia). Water Qual. Res. J. Can. 2006, 41, 256–262. [Google Scholar] [CrossRef]
  10. Derraik, J.G.B. The pollution of the marine environment by plastic debris: A review. Mar. Pollut. Bull. 2002, 44, 842–852. [Google Scholar] [CrossRef]
  11. Sánchez, P.; Mercedes, M.; Saez, R.; Juan, S.; Muntadas, A.; Demestre, A. Baseline study of the distribution of marine debris on soft-bottom habitats associated with trawling grounds in the northern Mediterranean. Sci. Mar. 2013, 77, 247–255. [Google Scholar] [CrossRef] [Green Version]
  12. Thompson, R.C. Plastic debris in the marine environment: Consequences and solutions. In Marine Nature Conservation in Europe; Krause, J.C., Nordheim, H., Bräger, S., Eds.; Federal Agency for Nature Conservation: Stralsund, Germany, 2006; pp. 107–115. [Google Scholar]
  13. Munari, C.; Corbau, C.; Simeoni, U.; Mistri, M. Marine litter on Mediterranean shores: Analysis of composition, spatial distribution and sources in north-western Adriatic beaches. Waste Manag. 2015, 49, 483–490. [Google Scholar] [CrossRef]
  14. Laist, D.W. Overview of the Biological Effects of Lost and Discarded Plastic Debris in the Marine Environment. Mar. Pollut. Bull. 1987, 18, 319–326. [Google Scholar] [CrossRef]
  15. Ivar Do Sul, J.A.; Costa, M.F. The present and future of microplastic pollution in the marine environment. Environ. Pollut. 2014, 185, 352–364. [Google Scholar] [CrossRef] [PubMed]
  16. Jambeck, J.R.; Geyer, R.; Wilcox, C.; Siegler, T.R.; Perryman, M.; Andrady, A.; Narayan, R.; Law, K.L. Plastic waste inputs from land into the ocean. Science 2015, 80, 768–771. [Google Scholar] [CrossRef] [PubMed]
  17. Nelms, S.E.; Duncan, E.M.; Broderick, A.C.; Galloway, T.S.; Godfrey, M.H.; Hamann, M.; Lindeque, P.K.; Godley, B.J. Plastic and marine turtles: A review and call for research. ICES J. Mar. Sci. 2016, 73, 165–181. [Google Scholar] [CrossRef]
  18. Pettipas, S.; Bernier, M.; Walker, T. A Canadian policy framework to mitigate plastic marine pollution. Mar. Policy 2016, 68, 117–122. [Google Scholar] [CrossRef]
  19. UNEP. Marine Litter: An Analytical Overview. Intergovernmental Oceanographic Commission of The United Nations Educational, Scientific and Cultural Organisation. 2005. Available online: http://wedocs.unep.org/bitstream/handle/20.500.11822/8348/-Marine%20Litter%2c%20an%20analytical%20overview-20053634.pdf?sequence=3&isAllowed=y (accessed on 1 March 2019).
  20. Law, K.L.; Moret-Ferguson, S.; Maximenko, N.A.; Proskurowski, G.; Peacock, E.E.; Hafner, J.; Reddy, C.M. Plastic accumulation in the North Atlantic Subtropical Gyre. Science 2010, 329, 1185–1188. [Google Scholar] [CrossRef] [Green Version]
  21. Gallo, F.; Fossi, C.; Weber, R.; Santillo, D.; Sousa, J.; Ingram, I.; Nadal, A.; Romano, D. Marine litter plastics and microplastics and their toxic chemicals components: The need for urgent preventive measures. Environ. Sci. Eur. 2018, 30, 13. [Google Scholar] [CrossRef]
  22. McKinsey Center for Business and Environment. Stemming the Tide: Land-Based Strategies for a Plastic-Free Ocean; McKinsey & Company and Ocean Conservancy: New York, NY, USA, 2015; Available online: https://oceanconservancy.org/wp-content/uploads/2017/04/full-report-stemming-the.pdf (accessed on 7 April 2019).
  23. Eriksen, M.; Lebreton, L.C.M.; Carson, H.S.; Thiel, M.; Moore, C.J.; Borerro, J.C.; Galgani, F.; Ryan, P.G.; Reisser, J. Plastic Pollution in the World’s Oceans: More than 5 Trillion Plastic Pieces Weighing over 250,000 Tons Afloat at Sea. PLoS ONE 2014, 9, e111913. [Google Scholar] [CrossRef] [Green Version]
  24. Ellen Macarthur Foundation. The new Plastics Economy: Rethinking the Future of Plastics. Ellen Macarthur Foundation, Cowes. 2016. Available online: https://www.ellenmacarthurfoundation.org/publications/the-new-plastics-economy-rethinking-the-future-of-plastics (accessed on 5 April 2019).
  25. Carlson, D.F.; Suaria, G.; Aliani, S.; Fredj, E.; Fortibuoni, T.; Griffa, A.; Russo, A.; Melli, V. Combining litter observations with a regional ocean model to identify sources and sinks of floating debris in a semi-enclosed basin: The Adriatic Sea. Front. Mar. Sci. 2017, 4, 78. [Google Scholar] [CrossRef] [Green Version]
  26. Corbin, C.J.; Singh, J.G. Marine debris contamination of beaches in St. Lucia and Dominica. Mar. Pollut. Bull. 1993, 26, 325–328. [Google Scholar] [CrossRef]
  27. Kubota, M. A mechanism for the accumulation of floating marine debris north of Hawaii. J. Phys. Oceanogr. 1994, 5, 1059–1064. [Google Scholar] [CrossRef]
  28. Kubota, M.; Takayama, K.; Namimoto, D. Pleading for the use of biodegradable polymers in favor of marine environments and to avoid an asbestos-like problem for the future. Appl. Microbiol. Biotechnol. 2005, 67, 469–476. [Google Scholar] [CrossRef] [PubMed]
  29. Biermann, L.; Clewley, D.; Martinez-Vicente, V.; Topouzelis, K. Finding plastic patches in coastal waters using optical satellite data. Sci. Rep. 2020, 10, 53–64. [Google Scholar] [CrossRef] [PubMed] [Green Version]
  30. Napper, I.E.; Thompson, R.C. Marine plastic pollution: Other than microplastic. In Waste; Elsevier: Amsterdam, The Netherlands, 2019; pp. 425–442. [Google Scholar] [CrossRef]
  31. D’Asaro, E.A.; Shcherbina, A.Y.; Klymak, J.M.; Molemaker, J.; Novelli, G.; Guigand, C.M.; Haza, A.C.; Haus, B.K.; Ryan, E.H.; Jacobs, G.A.; et al. Ocean convergence and the dispersion of flotsam. Proc. Natl. Acad. Sci. USA 2018, 115, 1162–1167. [Google Scholar] [CrossRef] [Green Version]
  32. Möhlenkamp, P.; Purser, A.; Thomsen, L. Plastic microbeads from cosmetic products: An experimental study of their hydrodynamic behaviour, vertical transport and resuspension in phytoplankton and sediment aggregates. Elem. Sci. Anth. 2018, 6, 61. [Google Scholar] [CrossRef] [Green Version]
  33. Brooks, M.T.; Coles, V.J.; Coles, W.C. Inertia influences pelagic sargassum advection and distribution. Geophys. Res. Lett. 2019, 46, 2610–2618. [Google Scholar] [CrossRef]
  34. Thiel, M.; Hinojosa, I.A.; Joschko, T.; Gutow, L. Spatio-temporal distribution of floating objects in the german bight (North Sea). J. Sea Res. 2011, 65, 368–379. [Google Scholar] [CrossRef] [Green Version]
  35. Lebreton, L.; Slat, B.; Ferrari, F.; Sainte-Rose, B.; Aitken, J.; Marthouse, R.; Hajbane, S.; Cunsolo, S.; Schwarz, A.; Levivier, A.; et al. Evidence that the Great Pacific Garbage Patch is rapidly accumulating plastic. Sci. Rep. 2018, 8, 4666. [Google Scholar] [CrossRef] [Green Version]
  36. Chu, S.; Wang, J.; Leong, G.; Woodward, L.A.; Letcher, R.J.; Li, Q.X. Perfluoroalkyl sulfonates and carboxylic acids in liver, muscle and adipose tissues of black-footed albatross (Phoebastria nigripes) from Midway Island, North Pacific Ocean. Chemosphere 2015, 138, 60–66. [Google Scholar] [CrossRef] [Green Version]
  37. Pasquini, G.; Ronchi, F.; Strafella, P.; Scarcella, G.; Fortibuoni, T. Seabed litter composition, distribution and sources in the Northern and Central Adriatic Sea (Mediterranean). Waste Manag. 2016, 58, 41–51. [Google Scholar] [CrossRef]
  38. Andrady, A.L. Microplastics in the Marine Environment. Mar. Pollut. Bull. 2011, 62, 1596–1605. [Google Scholar] [CrossRef]
  39. Corcoran, P.L.; Biesinger, M.C.; Grifi, M. Plastics and beaches: A degrading relationship. Mar. Pollut. Bull. 2009, 58, 80–84. [Google Scholar] [CrossRef] [PubMed]
  40. Gregory, M.R.; Andrady, A.L. Plastics in the marine environment. In Plastics and the Environment; John Wiley & Sons, Inc.: Hoboken, NJ, USA, 2003; pp. 379–402. [Google Scholar]
  41. Shah, A.A.; Hasan, F.; Hameed, A.; Ahmed, S. Biological degradation of plastics: A comprehensive review. Biotechnol. Adv. 2008, 26, 246–265. [Google Scholar] [CrossRef] [PubMed]
  42. Gregory, M.R. Environmental implications of plastic debris in marine settings entanglement, ingestion, smothering, hangers-on, hitch-hiking and alien invasions. Philos. Trans. R. Soc. B 2009, 364, 2013–2025. [Google Scholar] [CrossRef] [PubMed]
  43. Rochman, C.M.; Browne, M.A.; Underwood, A.J.; van Franeker, J.A.; Thompson, R.C. The ecological impacts of marine debris: Unraveling the demonstrated evidence from what is perceived. Ecology 2015, 97, 302–312. [Google Scholar] [CrossRef] [PubMed] [Green Version]
  44. Thompson, R.C.; Moore, C.J.; vom Saal, F.S.; Swan, S.H. Plastics, the environment and human health: Current consensus and future trends. Philos. Trans. R. Soc. B 2009, 364, 2153–2166. [Google Scholar] [CrossRef]
  45. Kwon, B.G.; Koizumi, K.; Chung, S.-Y.; Kodera, Y.; Kim, J.-O.; Saido, K. Global styrene oligomers monitoring as new chemical contamination from polystyrene plastic marine pollution. J. Hazard Mater. 2015, 300, 359–367. [Google Scholar] [CrossRef]
  46. Zettler, E.R.; Mincer, T.J.; Amaral-Zettler, L.A. Life in the “Plastisphere”: Microbial communities on plastic marine debris. Environ. Sci. Technol. 2013, 47, 7137–7146. [Google Scholar] [CrossRef]
  47. Wilcox, C.; van Sebille, E.; Hardesty, B.D. Threat of plastic pollution to seabirds is global, pervasive, and increasing. Proc. Natl. Acad. Sci. USA 2015, 112, 11899–11904. [Google Scholar] [CrossRef] [Green Version]
  48. Schuyler, Q.A.; Wilcox, C.; Townsend, K.A.; Wedemeyer-Strombel, K.R.; Balazs, G.; van Sebille, E.; Hardesty, B.D. Risk analysis reveals global hotspots for marine debris ingestion by sea turtles. Glob. Chang. Biol. 2016, 22, 567–576. [Google Scholar] [CrossRef]
  49. Sherman, P.; van Sebille, E. Modeling marine surface microplastic transport to assess optimal removal locations. Environ. Res. Lett. 2016, 11, 014006. [Google Scholar] [CrossRef]
  50. UN Environment (2016) Regional Seas Programme. Regional Seas Strategic Directions (2017–2020); Regional Seas Reports and Studies No.201; UN Environment Regional Seas Programme: Nairobi, Kenya, 2016; Available online: www.unep.org/regionalseas (accessed on 25 April 2019).
  51. Notten, P. Addressing Marine Plastics: A Systemic Approach; United Nations Environment Programme: Nairobi, Kenya, 2019; Available online: http://wedocs.unep.org/bitstream/handle/20.500.11822/26746/marine_plastics.pdf?sequence=1&isAllowed=y (accessed on 18 March 2019).
  52. GESAMP. Guidelines for the Monitoring and Assessment of Plastic Litter in the Ocean; Joint Group of Experts on the Scientific Aspects of Marine Environmental Protection: London, UK, 2019; Available online: http://www.gesamp.org/publications/guidelines-for-the-monitoring-and-assessment-of-plastic-litter-in-the-ocean (accessed on 18 March 2019).
  53. GESAMP. Sources, Fate and Effects of Microplastics in the Marine Environment—A Global Assessment (Part 1); Joint Group of Experts on the Scientific, Aspects of Marine Environmental Protection, 2015. Available online: http://www.gesamp.org/publications/reports-and-studies-no-90 (accessed on 1 April 2019).
  54. UNEP/MAP. Report Meeting of MED POL Focal Points Mediterranean Action Plan; MED POL, WG. 334/8; UNEP/MAP: Kalamata, Greece, 29 July 2009. [Google Scholar]
  55. Cozar, A.; Sanz-Martin, M.; Marti, E.; Gonzalez-Gordillo, J.I.; Ubeda, B.; Galvez, J.A.; Irigoien, X.; Duarte, C.M. Plastic accumulation in the Mediterranean Sea. PLoS ONE 2015, 10, e0121762. [Google Scholar] [CrossRef] [Green Version]
  56. Fossi, M.C.; Romeo, T.; Baini, M.; Panti, C.; Marsili, L.; Campani, T.; Canese, S.; Galgani, F.; Druon, J.N.; Airoldi, S.; et al. Plastic debris occurrence, convergence areas and Fin Whales feeding ground in the Mediterranean Marine Protected Area Pelagos Sanctuary: A modelling approach. Front. Mar. Sci. 2017, 4, 167. [Google Scholar] [CrossRef]
  57. van Sebille, E.; Wilcox, C.; Lebreton, L.C.M.; Maximenko, N.A.; Hardesty, B.D.; van Franeker, J.A.; Eriksen, M.; Siegel, D.; Galgani, F.; Law, K.L. A global inventory of small floating plastic debris. Environ. Res. Lett. 2015, 10, 124006. [Google Scholar] [CrossRef]
  58. Alomar, C.; Estarellas, F.; Deudero, S. Microplastics in the Mediterranean Sea: Deposition in coastal shallow sediments, spatial variation and preferential grain size. Mar. Environ. Res. 2016, 115, 1–10. [Google Scholar] [CrossRef]
  59. Suaria, G.; Avio, C.G.; Mineo, A.; Lattin, G.L.; Magaldi, M.G.; Belmonte, G.; Moore, C.J.; Regoli, F.; Aliani, S. The Mediterranean Plastic Soup: Synthetic polymers in Mediterranean surface waters. Sci. Rep. 2016, 6, 37551. [Google Scholar] [CrossRef] [PubMed]
  60. Pasternak, G.; Zviely, D.; Assaf, A.; Spanier, E.; Ribic, C. Message in a bottle—The story of floating plastic in the eastern Mediterranean Sea. Waste Manag. 2018, 77, 67–77. [Google Scholar] [CrossRef]
  61. Coll, M.; Piroddi, C.; Steenbeek, J.; Kaschner, K.; Ben Rais Lasram, F.; Aguzzi, J.; Ballesteros, E.; Bianchi, C.N.; Corbera, J.; Dailianis, T.; et al. The biodiversity of the Mediterranean Sea: Estimates, patterns, and threats. PLoS ONE 2010, 5, e11842. [Google Scholar] [CrossRef] [Green Version]
  62. Hecht, A.; Pinardi, N.; Robinson, A.R.; Hecht, A.; Pinardi, N.; Robinson, A.R. Currents, water masses, eddies and jets in the Mediterranean Levantine Basin. J. Phys. Oceanogr. 1988, 18, 1320–1353. [Google Scholar] [CrossRef] [Green Version]
  63. Mansui, J.; Molcard, A.; Ourmières, Y. Modelling the transport and accumulation of floating marine debris in the Mediterranean basin. Mar. Pollut. Bull. 2015, 91, 249–257. [Google Scholar] [CrossRef]
  64. Zambianchi, E.; Trani, M.; Falco, P. Lagrangian transport of marine litter in the Mediterranean Sea. Front. Environ. Sci. 2017, 5, 5. [Google Scholar] [CrossRef] [Green Version]
  65. Driedger, A.; Dürr, H.; Mitchell, K.; Van Cappellen, P. Plastic debris in the Laurentian Great Lakes: A review. J. Great Lakes Res. 2015, 41, 9–19. [Google Scholar] [CrossRef]
  66. Hafeez, S.; Wong, M.; Abbas, S.; Nichol, J.; Kwok, C. Detection and Monitoring of Marine Pollution Using Remote Sensing Technologies. In Monitoring of Marine Pollution; Fouzia, H.B., Ed.; IntechOpen: London, UK, 2018. [Google Scholar] [CrossRef] [Green Version]
  67. Aoyama, T. Extraction of marine debris in the Sea of Japan using high-spatial-resolution satellite images. In Remote Sensing of the Oceans and Inland Waters: Techniques, Applications, and Challenges; Frouin, R.J., Shenoi, S.C., Rao, K.H., Eds.; Proceedings of SPIE; SPIE: Bellingham, WA, USA, 2016; Volume 9878, p. 987817. [Google Scholar]
  68. Garaba, S.; Aitken, J.; Slat, B.; Dierssem, H.; Lebreton, L.; Zielinski, O.; Reisser, J. Sensing ocean plastics with an airborne hyperspectral shortwave infrared imager. Environ. Sci. Technol. 2018, 52, 11699–11707. [Google Scholar] [CrossRef] [PubMed]
  69. Goddijn-Murphy, L.; Peters, S.; Van Sebille, E.; James, N.A.; Gibb, S. Concept for a hyperspectral remote sensing algorithm for floating marine macro plastics. Mar. Pollut. Bull. 2018, 126, 255–262. [Google Scholar] [CrossRef] [PubMed] [Green Version]
  70. Maximenko, N.; Arvesen, J.; Asner, G.; Carlton, J.; Castrence, M.; Centurioni, L.; Chao, Y.; Chapman, J.; Chirayath, V.; Corradi, P.; et al. Remote Sensing of Marine Debris to Study Dynamics, Balances and Trends. In Community White Paper Produced at the Workshop on Mission Concepts for Marine Debris Sensing. 2016. Available online: https://pdfs.semanticscholar.org/fab0/8714d6f6b12bbd7645582f03b386b019cd14.pdf (accessed on 18 March 2019).
  71. Pichel, W.G.; Veenstra, T.S.; Churnside, J.H.; Arabini, E.; Friedman, K.S.; Foley, D.G.; Brainard, R.E.; Kiefer, D.; Ogle, S.; Clemente-Coloón, P.; et al. GhostNet marine debris survey in the Gulf of Alaska—Satellite guidance and aircraft observations. Mar. Pollut. Bull. 2012, 65, 28–41. [Google Scholar] [CrossRef] [PubMed]
  72. Davaasuren, N.; Marino, A.; Boardman, C.; Alparone, M.; Nunziata, F.; Ackermann, N.; Hajnsek, I. Detecting microplastics pollution in world oceans using SAR remote sensing. In Proceedings of the International Geoscience and Remote Sensing Symposium (IEEE), Valencia, Spain, 22–27 July 2018; IEEE: Piscataway, NJ, USA, 2018; pp. 938–941. [Google Scholar] [CrossRef]
  73. Howe, K.L.; Dean, C.W.; John Kluge, J.; Soloviev, A.V.; Tartar, A.; Shivji, M.; Lehner, S.; Shen, H.; Perrie, W. Relative abundance of Bacillus spp., surfactant-associated bacterium present in a natural sea slick observed by satellite SAR imagery over the Gulf of Mexico. Elem. Sci. Anth. 2018, 6, 8. [Google Scholar] [CrossRef] [Green Version]
  74. Nazeer, M.; Nichol, J.E. Combining landsat TM/ETM+ and HJ-1 A/B CCD sensors for monitoring coastal water quality in Hong Kong. IEEE Geosci. Remote Sens. Lett. 2015, 12, 1898–1902. [Google Scholar] [CrossRef]
  75. Khorram, S.; Cheshire, H.; Geraci, A.L.; La Rosa, G. Water quality mapping of Augusta Bay, Italy from Landsat-TM data. Int. J. Remote Sens. 1991, 12, 803–808. [Google Scholar] [CrossRef]
  76. Baban, S.M.J. Detecting water quality parameters in the Norfolk Broads, UK, using Landsat imagery. Int. J. Remote Sens. 1993, 14, 1247–1267. [Google Scholar] [CrossRef]
  77. Pattiaratchi, C.; Lavery, P.; Wyllie, A.; Hick, P. Estimates of water quality in coastal waters using multi-date Landsat Thematic Mapper data. Int. J. Remote Sens. 1994, 15, 1571–1584. [Google Scholar] [CrossRef]
  78. Lim, J.; Choi, M. Assessment of water quality based on Landsat 8 operational land imager associated with human activities in Korea. Environ. Monit. Assess. 2015, 187, 384. [Google Scholar] [CrossRef]
  79. Liubartseva, S.; Coppini, G.; Lecci, R.; Creti, S. Regional approach to modeling the transport of floating plastic debris in the Adriatic Sea. Mar. Pollut. Bull. 2016, 103, 115–127. [Google Scholar] [CrossRef] [PubMed]
  80. Topouzelis, K.; Papakonstantinou, A.; Graba, S. Detection of floating plastics from satellite and unmanned aerial systems (Plastic Litter Project 2018). Int. J. Appl. Earth Obs. Geoinf. 2019, 79, 175–183. [Google Scholar] [CrossRef]
  81. Hörig, B.; Kühn, F.; Oschütz, F.; Lehmann, F. HyMap hyperspectral remote sensing to detect hydrocarbons. Int. J. Remote Sens. 2001, 22, 1413–1422. [Google Scholar] [CrossRef]
  82. Martin, C.; Parkes, S.; Zhang, Q.; Zhang, X.; McCabe, M.F.; Duarte, C.M. Use of unmanned aerial vehicles for efficient beach litter monitoring. Mar. Pollut. Bull. 2018, 131, 662–673. [Google Scholar] [CrossRef] [PubMed] [Green Version]
  83. Moy, K.; Neilson, B.; Chung, A.; Meadows, A.; Castrence, M.; Ambagis, S.; Davidson, K. Mapping coastal marine debris using aerial imagery and spatial analysis. Mar. Pollut. Bull. 2017, 132, 52–59. [Google Scholar] [CrossRef] [PubMed]
  84. Martínez-Vicente, V.; Clark, J.R.; Corradi, P.; Aliani, S.; Arias, M.; Bochow, M.; Bonnery, G.; Cole, M.; Cózar, A.; Donnelly, R.; et al. Measuring Marine Plastic Debris from Space: Initial Assessment of Observation Requirements. Remote Sens. 2019, 11, 2443. [Google Scholar] [CrossRef] [Green Version]
  85. Ocean Conservancy. 30th Anniversary of International Coastal Cleanup; Annual Report; Ocean Conservancy: Washington, DC, USA, 2016; 24p, Available online: https://oceanconservancy.org/wp-content/uploads/2017/04/2016-Ocean-Conservancy-ICC-Report.pdf (accessed on 15 April 2019).
  86. Pasternak, G.; Zviely, D.; Ribic, C.; Assaf, A.; Spanier, E. Sources, composition and spatial distribution of marine debris along the Mediterranean coast of Israel. Mar. Pollut. Bull. 2017, 114, 1036–1045. [Google Scholar] [CrossRef]
  87. Galgani, F.; Hanke, G.; Maes, T. Global Distribution, Composition and Abundance of Marine Litter. In Marine Anthropogenic Litter; Bergmann, M., Gutow, L., Klages, M., Eds.; Springer: Berlin, Germany, 2015; pp. 29–56. [Google Scholar]
  88. García-Rivera, S.; Lizaso, J.L.S.; Bellido, J.M.B. Composition, spatial distribution and sources of macro-marine litter on the Gulf of Alicante seafloor (Spanish Mediterranean). Mar. Pollut. Bull. 2017, 121, 249–259. [Google Scholar] [CrossRef] [Green Version]
  89. Rokni, K.; Ahmad, A.; Selamat, A.; Hazini, S. Water Feature Extraction and Change Detection Using Multitemporal Landsat Imagery. Remote Sens. 2014, 6, 4173–4189. [Google Scholar] [CrossRef] [Green Version]
  90. McFeeters, S. The Use of Normalized Difference Water Index (NDWI) in the Delineation of Open Water Features. Int. J. Remote Sens. 1996, 17, 1425–1432. [Google Scholar] [CrossRef]
  91. Shen, L.; Li, C. Water body extraction from Landsat ETM+ imagery using adaboost algorithm. In Proceedings of the 18th International Conference on Geoinformatics, Beijing, China, 18–20 June 2010. [Google Scholar] [CrossRef]
  92. Rouse, J.W.; Haas, R.H.; Schell, J.A.; Deering, D.W. Monitoring vegetation systems in the Great Plains with ERTS. In Proceedings of the Third Earth Resources Technology Satellite—1 Symposium; NASA SP-351, Washington, DC, USA, 31 December 1973; pp. 309–317. [Google Scholar]
  93. Feyisa, G.L.; Meilby, H.; Fensholt, R.; Proud, S.R. Automated Water Extraction Index: A new technique for surface water mapping using Landsat imagery. Remote Sens. Environ. 2014, 140, 23–35. [Google Scholar] [CrossRef]
  94. Xu, H. Modification of normalised difference water index (NDWI) to enhance open water features in remotely sensed imagery. Int. J. Remote Sens. 2006, 27, 3025–3033. [Google Scholar] [CrossRef]
  95. Wilson, E.H.; Sader, S.A. Detection of forest harvest type using multiple dates of Landsat TM imagery. Remote Sens. Environ. 2002, 80, 385–396. [Google Scholar] [CrossRef]
  96. Ustinov, E.A. Sensitivity Analysis in Remote Sensing; Springer International Publishing: Berlin/Heidelberg, Germany, 2015; ISBN 978-3-319-15840-2. [Google Scholar] [CrossRef]
  97. Masoumi, H.; Safavi, S.M.; Khani, Z. Identification and classification of plastic resins using near infrared reflectance spectroscopy. Int. J. Mech. Ind. Eng. 2012, 6, 213–220. [Google Scholar]
  98. Hopewell, J.; Dvorak, R.; Kosior, E. Plastics recycling: Challenges and opportunities. Phil. Trans. R. Soc. B 2009, 364, 2115–2126. [Google Scholar] [CrossRef] [Green Version]
Figure 1. Plastic litter ‘target’ made from water bottles. Kyriacos Themistocleous.
Remotesensing 12 02648 g001
Figure 2. Plastic litter “target” being lowered into the sea at Limassol Old Port. Kyriacos Themistocleous.
Remotesensing 12 02648 g002
Figure 3. Divers moving target 200 meters from shoreline. Kyriacos Themistocleous.
Remotesensing 12 02648 g003
Figure 4. Left: Phantom 4 Pro with RGB integrated 20MP camera. Kyriacos Themistocleous. Right: Phantom 2 with Sony Exmor and modified GoPro camera. Kyriacos Themistocleous.
Remotesensing 12 02648 g004
Figure 5. Left: RGB image of plastic litter target. Right: infrared image of plastic litter target.
Remotesensing 12 02648 g005
Figure 6. Left: target as evident at 660 nm. Right: target as evident at 850 nm (Sony Exmor camera).
Remotesensing 12 02648 g006
Figure 7. Average spectral signatures plotted against the different channels of the Sentinel-2 satellite. The red, orange, purple and cyan lines indicate the spectral signatures for water, while the light green, green, blue and dark green lines indicate the spectral signatures for the plastic bottles in the water at different heights (1.5 m and 3 m).
Remotesensing 12 02648 g007
Figure 8. Sentinel-2 Satellite RGB image (15 December 2018). (Bands B04, B03, B02).
Remotesensing 12 02648 g008
Figure 9. Sentinel-2 Satellite image (15 December 2018) processed with the indices described in the text with the corresponding values for which the plastic was detected. Land is represented in orange, water is represented in blue and plastic is represented in yellow. The yellow square within the yellow circle is the plastic litter target during the satellite overpass which corresponds to the Plastic Index Values (PIV), which is in the parentheses for each index.
Remotesensing 12 02648 g009aRemotesensing 12 02648 g009b
Figure 10. Left: results of the sensitivity analysis in bar graph for each of the nine indices. Right: Plastic Index (PI) scatterplot showing the discriminating value (DV) between water and plastic bottles. The plastic bottles values are circled in red.
Remotesensing 12 02648 g010
Figure 11. Plastic Index (PI) was used to identify the target, which is circled in yellow.
Remotesensing 12 02648 g011
Figure 12. The PI applied to the coast of Limassol. The plastic litter target is in the dashed yellow circle, the floating fish farms are circled in orange and the false positives are circled in blue.
Remotesensing 12 02648 g012
Table 1. Wavelengths of Sentinel-2 bands.
Band NameSpatial Resolution (m)Central Wavelength (nm)Bandwidth (nm)
B016044320
B021049065
B031056035
B041066530
B052070515
B062074015
B072078320
B0810842115
B08A2086521
B96094520
B1060137530
B1120161090
B12202190180
Table 2. Values used for sensitivity analysis.
IndicesIndex MIN Value
(Dmin)
Index MAX Value
(Dmax)
Number of Plastic Pixels Detected
(NPD)
Plastic Index Value
(PIV)
Water Index Value
(WIV)
Discriminative Value
(DV)
Sensitivity Analysis Value
(SAV)
NDWI0.46120.604950.45–0.500.50–0.600.13.4795
WRI4.01355.74944.0–4.34.3–6.250.10.2305
NDVI−0.3428−0.17124−0.2–−0.17−0.37–−0.20.12.3310
AWEI124121600-1241–216000.0000
MNDWI0.97220.979740.97–0.980.96–0.970.00020.1067
MDMI0.8930.945940.86–0.940.94–0.950.17.5614
SR0.48940.707650.65–0.80.45–0.650.12.2915
PI0.32850.414370.39–0.420.31–0.370.216.3170
RNDVI0.17120.342840.17–0.20.2–0.350.12.3310

