Dynamic Influence Elimination and Chlorophyll Content Diagnosis of Maize Using UAV Spectral Imagery

1
Key Laboratory of Modern Precision Agriculture System Integration Research, Ministry of Education, China Agricultural University, Beijing 100083, China
2
Henan University of Animal Husbandry and Economy, Zhengzhou 450044, China
3
Dry-Land Farming Institute of Hebei Academy of Agricultural and Forestry Sciences, Hengshui 053000, China
*
Author to whom correspondence should be addressed.
Remote Sens. 2020, 12(16), 2650; https://0-doi-org.brum.beds.ac.uk/10.3390/rs12162650
Submission received: 28 June 2020
/
Revised: 12 August 2020
/
Accepted: 13 August 2020
/
Published: 17 August 2020
(This article belongs to the Special Issue UAVs for Vegetation Monitoring)
Abstract
:In order to improve the diagnosis accuracy of chlorophyll content in maize canopy, the remote sensing image of maize canopy with multiple growth stages was acquired by using an unmanned aerial vehicle (UAV) equipped with a spectral camera. The dynamic influencing factors of the canopy multispectral images of maize were removed by using different image segmentation methods. The chlorophyll content of maize in the field was diagnosed. The crop canopy spectral reflectance, coverage, and texture information are combined to discuss the different segmentation methods. A full-grown maize canopy chlorophyll content diagnostic model was created on the basis of the different segmentation methods. Results showed that different segmentation methods have variations in the extraction of maize canopy parameters. The wavelet segmentation method demonstrated better advantages than threshold and ExG index segmentation methods. This method segments the soil background, reduces the texture complexity of the image, and achieves satisfactory results. The maize canopy multispectral band reflectance and vegetation index were extracted on the basis of the different segmentation methods. A partial least square regression algorithm was used to construct a full-grown maize canopy chlorophyll content diagnostic model. The result showed that the model accuracy was low when the image background was not removed (Rc2 (the determination coefficient of calibration set) = 0.5431, RMSEF (the root mean squared error of forecast) = 4.2184, MAE (the mean absolute error) = 3.24; Rv2 (the determination coefficient of validation set) = 0.5894, RMSEP (the root mean squared error of prediction) = 4.6947, and MAE = 3.36). The diagnostic accuracy of the chlorophyll content could be improved by extracting the maize canopy through the segmentation method, which was based on the wavelet segmentation method. The maize canopy chlorophyll content diagnostic model had the highest accuracy (Rc2 = 0.6638, RMSEF = 3.6211, MAE = 2.89; Rv2 = 0.6923, RMSEP = 3.9067, and MAE = 3.19). The research can provide a feasible method for crop growth and nutrition monitoring on the basis of the UAV platform and has a guiding significance for crop cultivation management.
1. Introduction
Chlorophyll content is one of the important indicators that reflect the photosynthetic ability and nutrient status of maize plants [1,2,3]. The traditional crop chlorophyll diagnosis is mainly carried out by chemical analysis, which requires destructive sampling, takes a long time, and is costly. These conditions might not satisfy the requirements of rapid chlorophyll monitoring on field crops for making management decision. According to the principle of light absorption and reflectance, technologies of spectral analysis, imaging spectroscopy, and other nondestructive methods have been widely used in crop monitoring [4,5,6,7,8]. Combined with the development of airborne or unmanned aerial vehicle (UAV) platforms [9], imaging spectroscopy obtained with high spatial and temporal resolution has become a preferred method and research topic in farmland estimation owing to its advantages of high efficiency and non-invasion [10,11,12]. Thus, this article aims to use the multispectral sensor carried by the UAV to collect maize canopy spectral data in the field and conduct a rapid diagnosis of the chlorophyll content to estimate the growth status and guide the field management.
Most current studies on spectral image focus on the diagnosis of chlorophyll content [11,12,13]. The three directions of these studies include the analysis of spectral response [14,15,16], quantification and selection of sensitive parameters [17,18], and optimization of models [19,20,21,22] on the basis of the visible and near-infrared images. Yu et al. [23] found that the ratio of reflection difference indexes (RRDIs) can eliminate the influence of the crop canopy structure on the spectral reflection characteristics to improve the estimation of chlorophyll content. Gauray et al. [24] collected spectral data of maize canopy by multispectral camera and constructed a diagnostic model of chlorophyll content by machine learning. The optimal model determination coefficient (R2) was 0.904. The results showed that the combination of an airborne multispectral sensor and machine learning could effectively improve the detection accuracy of chlorophyll content. The above-mentioned studies outline the capability of chlorophyll content estimating by vegetation indices, especially collected on the basis of UAV in the visible, red edge, and near infrared bands, which has sensitive responses to the physiology and biochemistry of vegetation [14].
Many researches have attempted to improve vegetation indices for crop monitoring. Soil adjusted vegetation index (SAVI) used to reduce the influences from the soil back ground shows capability to improve the estimation accuracy [25]. Wu et al. [26] found that the integrated indexes, such as transformed chlorophyll absorption reflectance index (TCARI), modified the chlorophyll absorption ratio index (MCARI) and optimized the soil-adjusted vegetation index (OSAVI), are more suitable for chlorophyll estimation than the traditional vegetation indexes because many interference factors, such as shadow, soil background, and nonphotosynthetic materials, are considered. At the same time, Liu et al. [3] found that with the advance of maize growth period, crop spectrum had characteristic migration in different growth periods, but the vegetation index based on fixed wavelength calculation could not effectively reflect this dynamic migration phenomenon, which reduced its applicability in different growth periods. However, there is no unified mathematical expression that defines all vegetation indices due to the complexity of light spectra combinations, instruments and so on. For UAV applications, Xue et al. [27] investigated more than 100 vegetation indices and classified their specific applicability into basic vegetation indices, adjusted-soil vegetation indices, vegetation indices sensing in spectra regions, and so on. The survey showed that the amounts of vegetation indices, combining visible and near-infrared bands, had significantly improved the sensitivity of the detection of green vegetation.
The influencing factors and reducing methods for crop estimation via spectroscopy have been explored in many studies. During the processing of the canopy spectral image of field crops, Qian et al. [22] found that the factors of canopy structure, soil background, and weeds in the spectral image would interfere with the spectral reflection characteristics of crop canopy; thus, the methods for chlorophyll content estimation were proposed via precision image segmentation and multispectral calibration. Fei et al. [28] used the canopy spectrum to detect the nitrogen nutrition of maize. They found that the ability of the NDRE index to diagnose maize nitrogen gradually increased with the decrease of soil coverage. This finding indicated that the soil background would interfere with the diagnostic ability of the NDRE vegetation index. Roosjen et al. [29] found that the crop canopy structure and other external information had an effect on the crop spectral reflectance. The diagnostic ability of the leaf area index and chlorophyll content were improved when the PROSAIL model was used to retrieve multiple angle reflectance data of crop canopy and reduce external information interference. Several factors, such as soil coverage, vegetation canopy geometry, and weeds, will interfere with the spectral characteristics of plant canopy. Thus, the influencing factors on crop diagnosis are difficult to reduce on the basis of the spectral imaging in the field.
We address the primary concern with image segmentation in eliminating the influence from soil background to solve these problems that greatly limit the reliability of the spectral imaging technology for crop nutrition diagnosis. The several alternative methods of spectral image segmentation include spectral segmentation methods using vegetation indices [21,22], threshold segmentation methods based on spatial grey value distribution [30,31], and learning-based segmentation methods [32]. The method based on the vegetation index mainly distinguishes green plants from the background according to the reflectance differences between the crop and the background special. This method is greatly affected by outdoor ambient light; a strong or weak ambient light will reduce the image segmentation effect [17]. The threshold-based segmentation method classifies crops and background according to the grayscale characteristics of the image, and the calculation is simple; however, this method is sensitive to noise [33]. The segmentation methods based on learning mainly include supervised and unsupervised machine learning classification methods. These methods have high accuracy and strong adaptability to the changes of light environment; however, the calculation is complex, and the results rely on a large amount of data in the training stage [34,35].
The dynamic crop monitoring during different stages by UAV-based spectral images is more complex than the static data collected by manual or farm machinery devices. The growth developments of crop from the soil background are difficult to separate or estimate because of the changes of crops and environment, such as light spots and shadows. The noise removal methods, such as median filtering [36], Gaussian filtering [37], and wavelet transform filtering [38], are also involved to eliminate such influences caused by the light environment. Wavelets have good capability in UAV imaging processing due to their multiresolution and multiscale analytical property. Fang et al. [39] used wavelet transform to process a UAV image and decompose the image signals of different scales to eliminate noise. The research proved that wavelet transform could help eliminate the noise generated during image acquisition and transmission [39]. The wavelet segmentation algorithm has been recently proposed combined with wavelet transform and threshold segmentation methods. The mechanism is also combined with the advantages of the noise filtering and object classification [40].
These studies highlight the critical need for dynamic influence elimination during crop growth stages on the basis of UAV spectral imaging. Several methods could be selected to improve the UAV-based imaging spectrum. However, much uncertainty still exists about the effects of these methods and their influence on the results of the chlorophyll content estimation of maize canopy during growth stages. We aim to clarify several aspects of chlorophyll content diagnosis of maize at different stages by using UAV spectral imagery. It also aims to eliminate the dynamic influences and explore its effects on the results. Moreover, the proposed methods could improve the accuracy of chlorophyll content diagnosis of field maize.
In order to better remove the dynamic influencing factors of the canopy multispectral images of maize obtained by UAV, and to diagnose the chlorophyll content of maize in the field our specific objectives are as follows: (1) to study the effect of soil background noise on the spectral reflectance of maize canopy; (2) to evaluate the performance of different segmentation methods to eliminate the noise in a UAV image; and (3) to establish the diagnostic model of maize canopy chlorophyll content on the basis of the different segmentation methods. These tasks are conducted to improve the diagnostic accuracy of the maize canopy chlorophyll content and provide the basis for crop growth dynamic monitoring on the basis of UAV multispectral images.
2. Materials and Methods
2.1. Spectral Data Collection
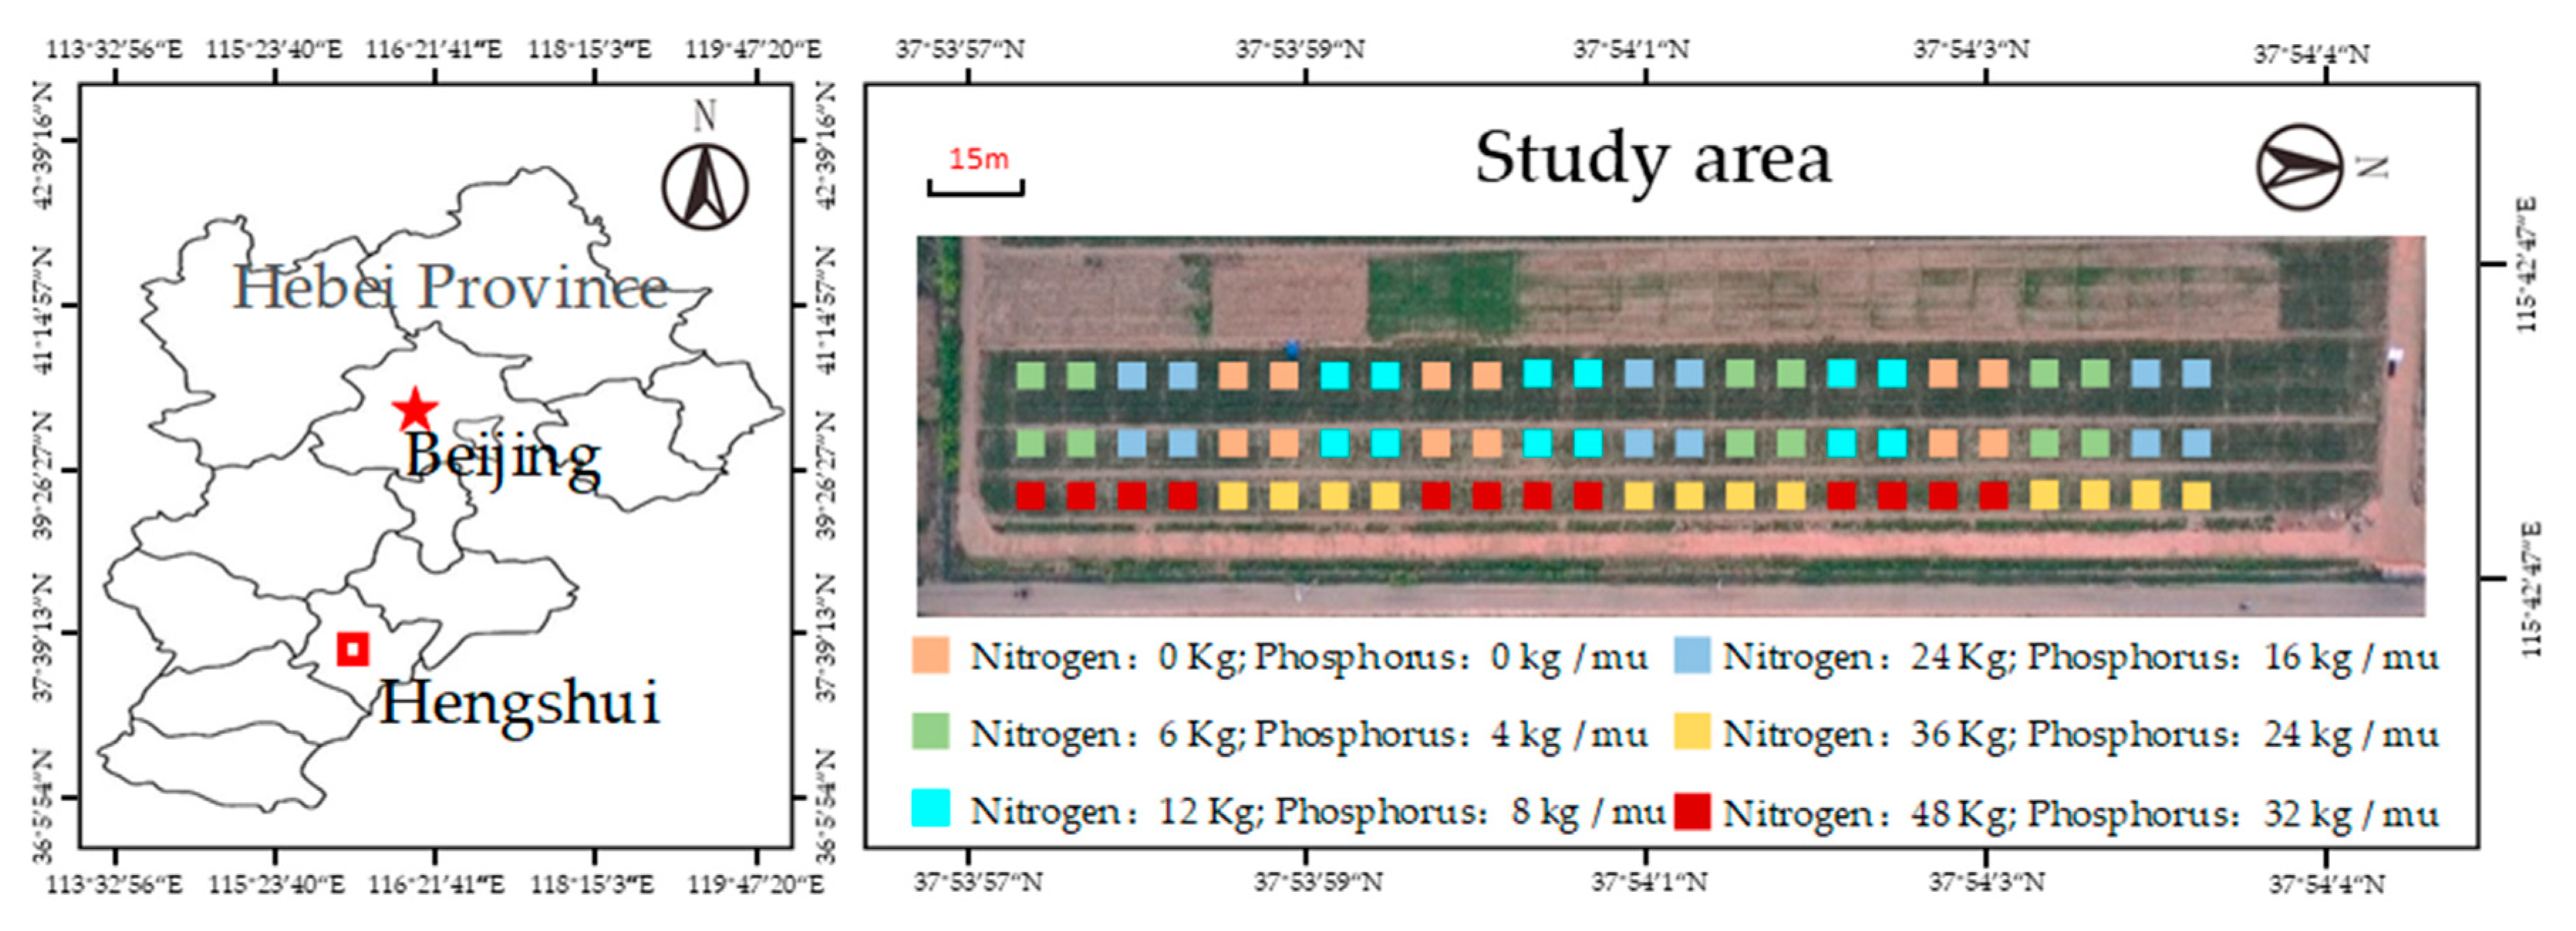
The experiment was conducted from June to August 2019, at the Dry Farming and Water-saving Agricultural Experimental Station in Hengshui, Hebei Academy of Agricultural Sciences, China. Figure 1 shows the location of the experimental station. The experimental station of Dry Farming and Water-saving Agriculture is located in Central China (latitude 37.9035011244, east longitude 115.7083898640), 22 m above sea level, and covers an area of 853 acres. The region belongs to the continental monsoon climate zone and is warm and semi-arid. The climate is characterized by four distinct seasons with large differences between warm, dry, and wet. The region has an average annual rainfall of 642.1 mm and dry winters.
Figure 1 shows the following six experimental gradients in this study: A1—(nitrogen 0 kg; phosphorus 0 kg)/mu, A2—(nitrogen 6 kg; phosphorus 4 kg)/mu, A3—(nitrogen 12 kg; phosphorus 8 kg)/mu, A4—(nitrogen 24 kg; phosphorus 16 kg)/mu, A5—(nitrogen 36 kg; phosphorus 24 kg)/mu, and A6—(nitrogen 48 kg; phosphorus 32 kg)/mu. Each gradient includes four straw levels: B1—no straw, B2—150 kg/mu, B3—300 kg/mu, and B4—600 kg/mu. The nitrogen test was combined with the straw test. There were 72 experimental areas in total, and 24 experimental areas were repeated for one time, 3 times in total. The UAV remote sensing data acquisition experiment was simultaneously carried out with the field data acquisition and sampling. The experiment was divided into seedling (July 15, 2019), jointing (July 25, 2019), and ear stages (August 1, 2019), according to the growing season of maize.
2.2. Data Collection
2.2.1. UAV Image Acquisition
The DJI M600 Pro UAV is used as the loading platform (10 kg UAV weight, 5 kg maximum load weight, 18 min flight time, and 30 m flight height) and equipped with a Red Edge MX multispectral camera for remote sensing data acquisition. The quality of the Red Edge MX multispectral camera is 232 g, and the resolution is 1280 × 960 pixels (the sensor size is 8.7 cm × 5.9 cm × 4.54 cm). This camera can collect spectral images of five bands, namely, blue(B), green(G), red(R), red edge (REG)e, and near infrared (NIR). The central wavelength in each band is at 475, 560, 668, 717, and 840 nm, with the bandwidth 32, 27, 14, 12, and 57 nm, respectively. The specific parameters are shown in Table 1. The time period from 12 noon to 13 noon is selected to stabilize the intensity of solar radiation and clear the sky without clouds for UAV data collection. Such initiative is carried out obtain a low remote sensing effect of noise. The flying height of the UAV is 30 m, the flying speed is 4 m/s, and the image overlap is set to 80%.
2.2.2. Ground Data Acquisition
After the UAV data collection was completed, the ground data collection, which mainly included the sampling point selection and GPS position information recording, was performed. A maize plant was selected as a sample point at the center of each sample area, and a part of the leaves was placed into a sealed bag and refrigerated, then taken back to the laboratory to determine the chlorophyll content via stoichiometry and with a spectrophotometer. First, a 4 cm × 4 cm (excluding veins) leaf tissue was cut out from the middle of each leaf. Second, the chopped leaves were submerged in 25 mL of a mixture of acetone and ethanol and then soak in the dark for 24 h. After chlorophyll extraction, absorbance was measured with a 752 UV spectrophotometer. The spectrophotometer requires internal thermal equilibrium of the instrument. The device needs to be preheated for 30 min. The sample solution was poured into three cuvettes. The absorbance was measured at the wavelengths of 645 and 663 nm [2]. The formulas for calculating the total chlorophyll content are as follows:
where A645 and A663 are the absorbance of 645 and 663 nm, respectively; Ca is chlorophyll a content (mg/L); Cb is chlorophyll b content (mg/L); and Ct is the total chlorophyll content (mg/L).
2.3. Data Processing
2.3.1. Data Processing Flow
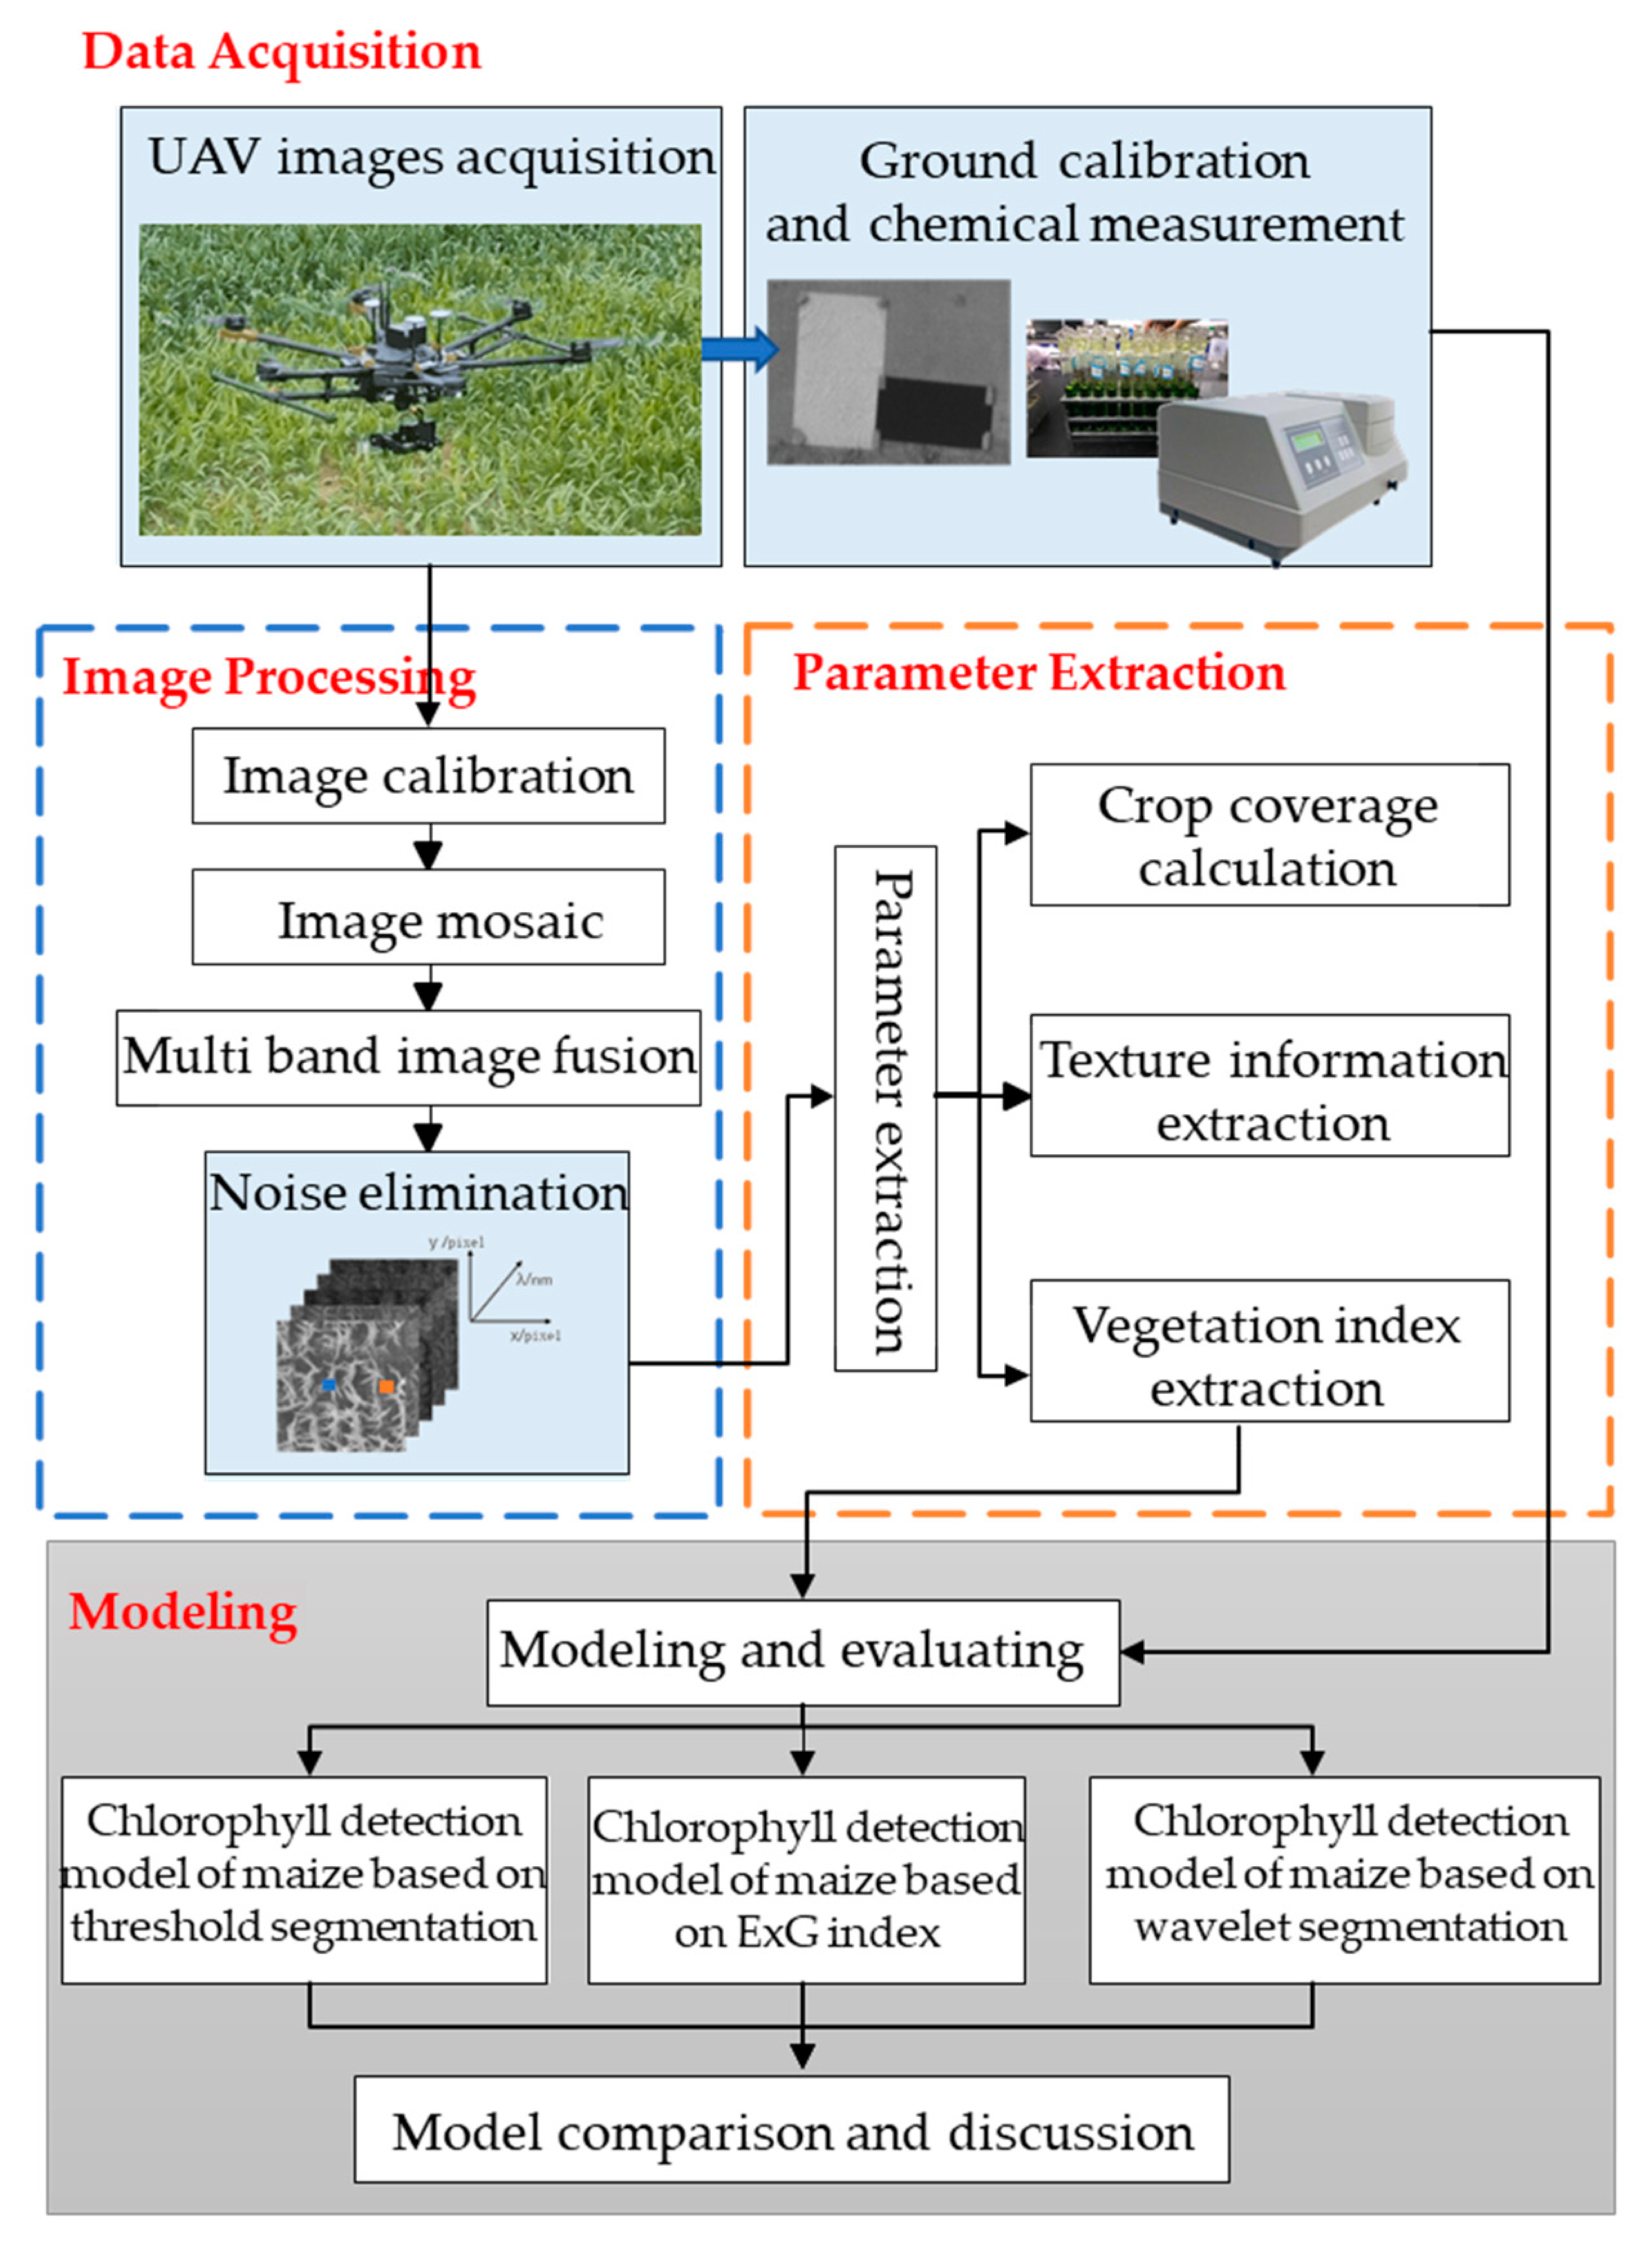
After the UAV flight was over, the acquired remote sensing and ground data was processed. The processing flow is shown in Figure 2. The preprocessing mainly includes image stitching and geometric correction, which are completed by Pix4dmapper software. The Red Edge MX sensor combines GPS data and light intensity values in the spectral image. The Pix4dmapper software can import the spectral image to complete the stitching. During stitching, a vector file of the ground control points determined in advance is imported to geometrically correct the stitched image to ensure that the geographic coordinates of the stitched image are consistent with the real coordinates. The stitched multiple band images are fused, and the regions of interest are extracted using ENVI 5.2 software.
Radiation calibration of spectral images is conducted by using black and white calibration boards. Radiation calibration refers to converting the gray values presented light intensity information of the maize multispectral image to reflectivity information. Radiation calibration boards are placed in the study area where the ground is flat and free of shadows. The UAV performs data collection. Equation (4) is used to complete the radiation calibration of the spectral image.
where DN, DN1, and DN2 are the digital numbers to show the light intensity values of the crop, black, and white calibration boards, respectively; ρ, ρ1, and ρ2 are the calculated reflectance values of the crop, black, and white calibration boards, respectively.
2.3.2. Extraction of Multispectral Vegetation Index
The multispectral image given by the UAV can provide spectral images in five bands with wavelengths of 475, 560, 668, 717, and 840 nm. After radiation calibration, the original image with the DN value was converted into a reflectance image, and the corresponding vegetation index image was calculated. Twenty types of vegetation indices were selected for construction of a chlorophyll content diagnostic model on the basis of the existing vegetation indices and combined with the characteristics of multispectral images. These selected vegetation indices are shown in Table 2.
2.3.3. Texture Information Extraction
Texture is an expression of image features. In a multispectral image of a crop canopy, texture can represent the structural characteristics of the maize canopy. In this study, the gray distribution statistical method was used to extract texture features from the UAV multispectral image. The standard deviation (), smoothness, and entropy were selected to characterize the texture features. They were calculated for input image following Equations (5)–(7), respectively. The standard deviation is a measure of the average contrast of the image. The smaller the value, the more uniform the value of adjacent pixels in the image. Smoothness is a relative smoothness measure of the brightness of the image. The value ranges from zero to one. The closer the value is to 0, the smoother the image is. The entropy is a measure of the randomness of the image. The smaller the value is, the lower the randomness of pixels in the image is, and the more uniform the image is.
2.3.4. Coverage Extraction
The soil background in the crop canopy multispectral image will interfere with the spectral characteristics of the crop canopy. Segmentation of the crop canopy with different segmentation methods will yield different results. Coverage indicates the proportion of the crop canopy in the multispectral image. The coverage can be used to characterize the segmentation results of different segmentation methods. The calculation method is shown in Equation (9), where Vc is the maize canopy coverage, Sc is the number of pixels in the maize canopy vector file area, and Sa is the total of the number of pixels in the multispectral image. For the convenience of calculation, we normalize the coverage value, and its value range is 0 to 1.
2.4. Segmentation Method
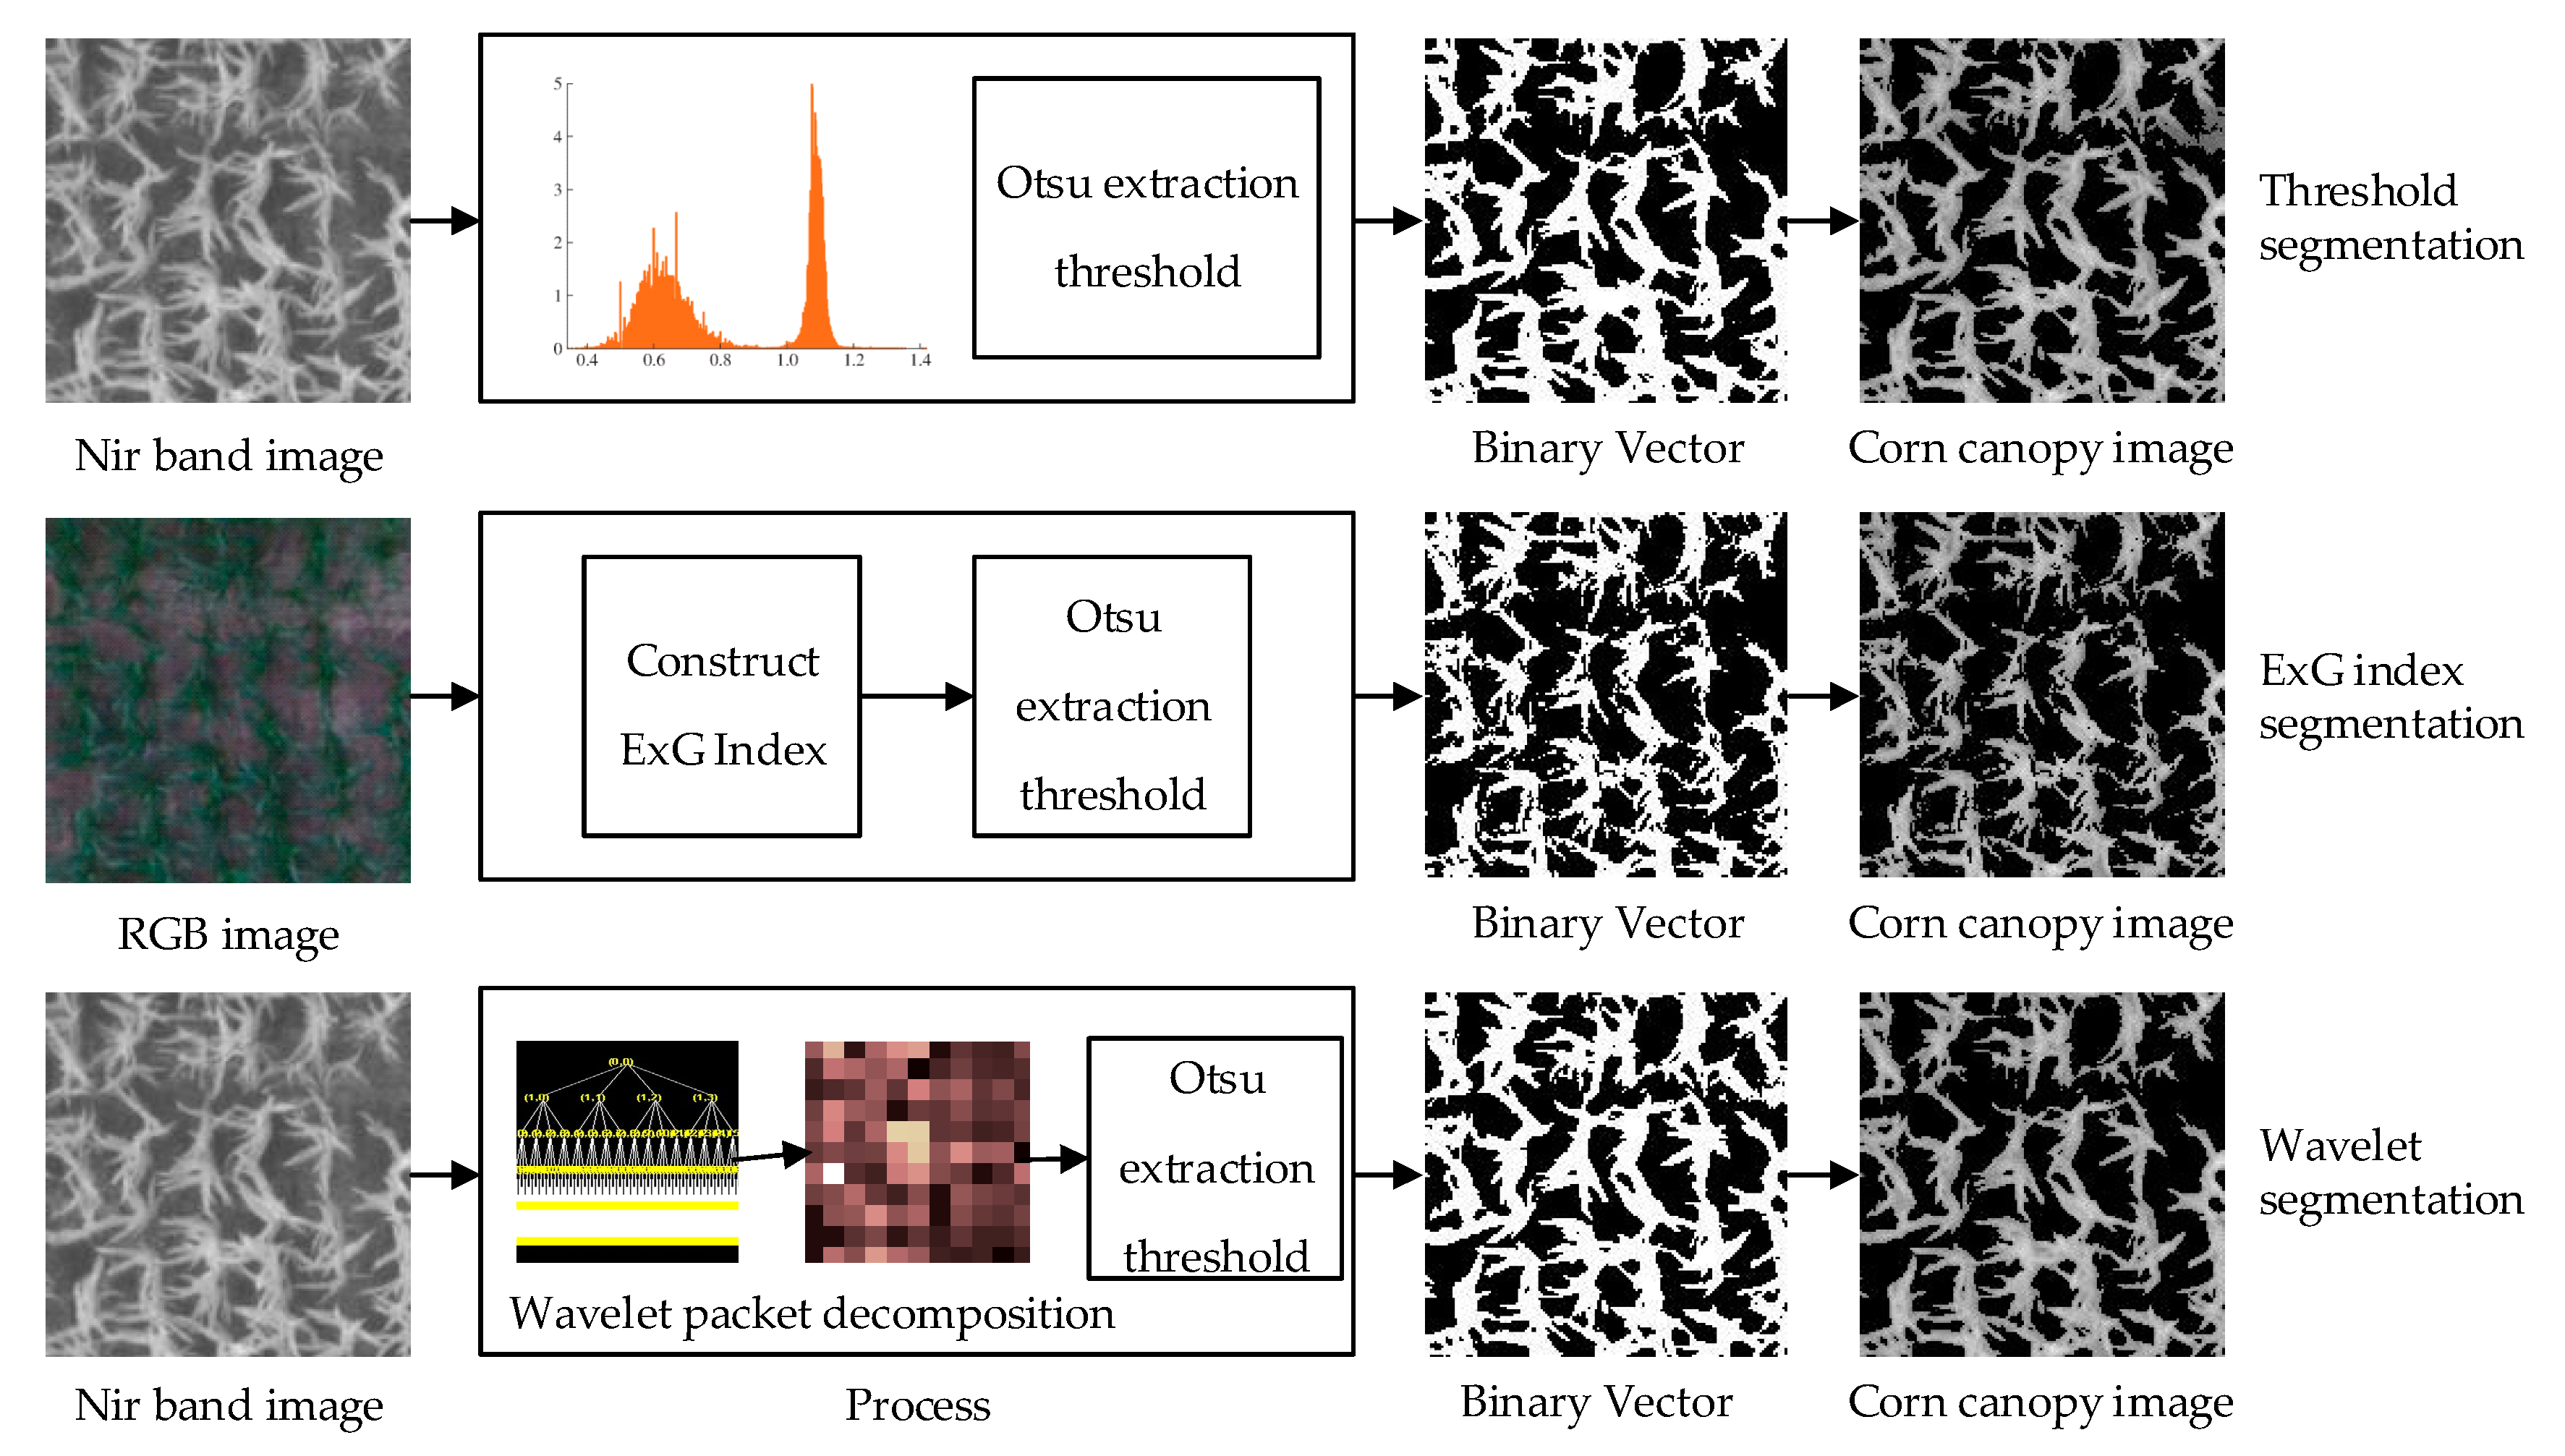
2.4.1. Threshold Segmentation
The premise of the threshold segmentation method is to obtain the segmentation interval of the grayscale image. In the multispectral image, the reflectance difference between the maize plant and the soil background in the near-infrared band reaches the maximum. The difference characteristic of the grayscale interval is significant; the near-infrared image is regarded as a segmented image. The segmentation threshold extracted by the maximum interclass method difference (Otsu) is used to binarize the near-infrared image to finally obtain a maize canopy vector file.
2.4.2. ExG Index Segmentation
Green plants have obvious spectral reflection characteristics in the visible light band. The green (g) band has a high reflectance, the chlorophyll has a strong absorption characteristic in the red (r) band, and the blue (b) band is sensitive to the chlorophyll concentration response. However, the soil does not have such spectral reflection characteristics. The plant can be effectively separated from the soil background by using this spectral difference characteristic. Ex-green vegetation index (ExG), as a typical visible light vegetation index, has been widely used in research.
2.4.3. Wavelet Segmentation
During the acquisition of multispectral images by UAV, the acquired images will have a certain degree of noise due to the influence of the external environment and equipment differences. Wavelet transform, as a signal processing tool, can multiply and scale the image space domain signals to obtain low-frequency and high-frequency wavelets through scaling and translation operations. Accordingly, noise signals are eliminated, and useful ones are retained. In this study, the near-infrared image is denoised by wavelet denoising on the basis of the threshold segmentation method. The noise is eliminated to achieve maize canopy image segmentation.
2.5. Model Establishment and Accuracy Evaluation
Partial least squares regression (PLS) is one of the multivariate statistical data analytical methods that integrates the advantages of principal component analysis, canonical correlation analysis, and linear regression analysis. This method has the advantage of handling multiple correlations between independent variables of small samples. In this study, the experimental data of PLS on July 15, 2019, July 25, 2019, and August 1, 2019 are used to establish a model of the relationship between maize canopy chlorophyll content and multispectral remote sensing images. Fifty-four validation set data are obtained.
The root mean square error (RMSE), determination coefficient (R2), and the mean absolute error (MAE) of the actual and detected values are used for evaluating the diagnostic capability of the model. Among the parameters, RMSE is used to measure the degree of dispersion of the experimental results, and the model effect is good when the value is small; the R2 represents the degree of fitting of the model, and the model diagnostic accuracy is high when the value is close to one; MAE can better reflect the actual situation of predicted value error, and the model effect is good when the value is small. In order to distinguish the precision of modeling set and validation set, Rc2 (the determination coefficient of calibration set) and RMSEF (the root mean squared error of forecast) are used to represent the precision of modeling set, and Rv2 (the determination coefficient of validation set) and RMSEP (the root mean squared error of prediction) are used to represent the precision of validation set.
3. Results
3.1. Ground Statistics
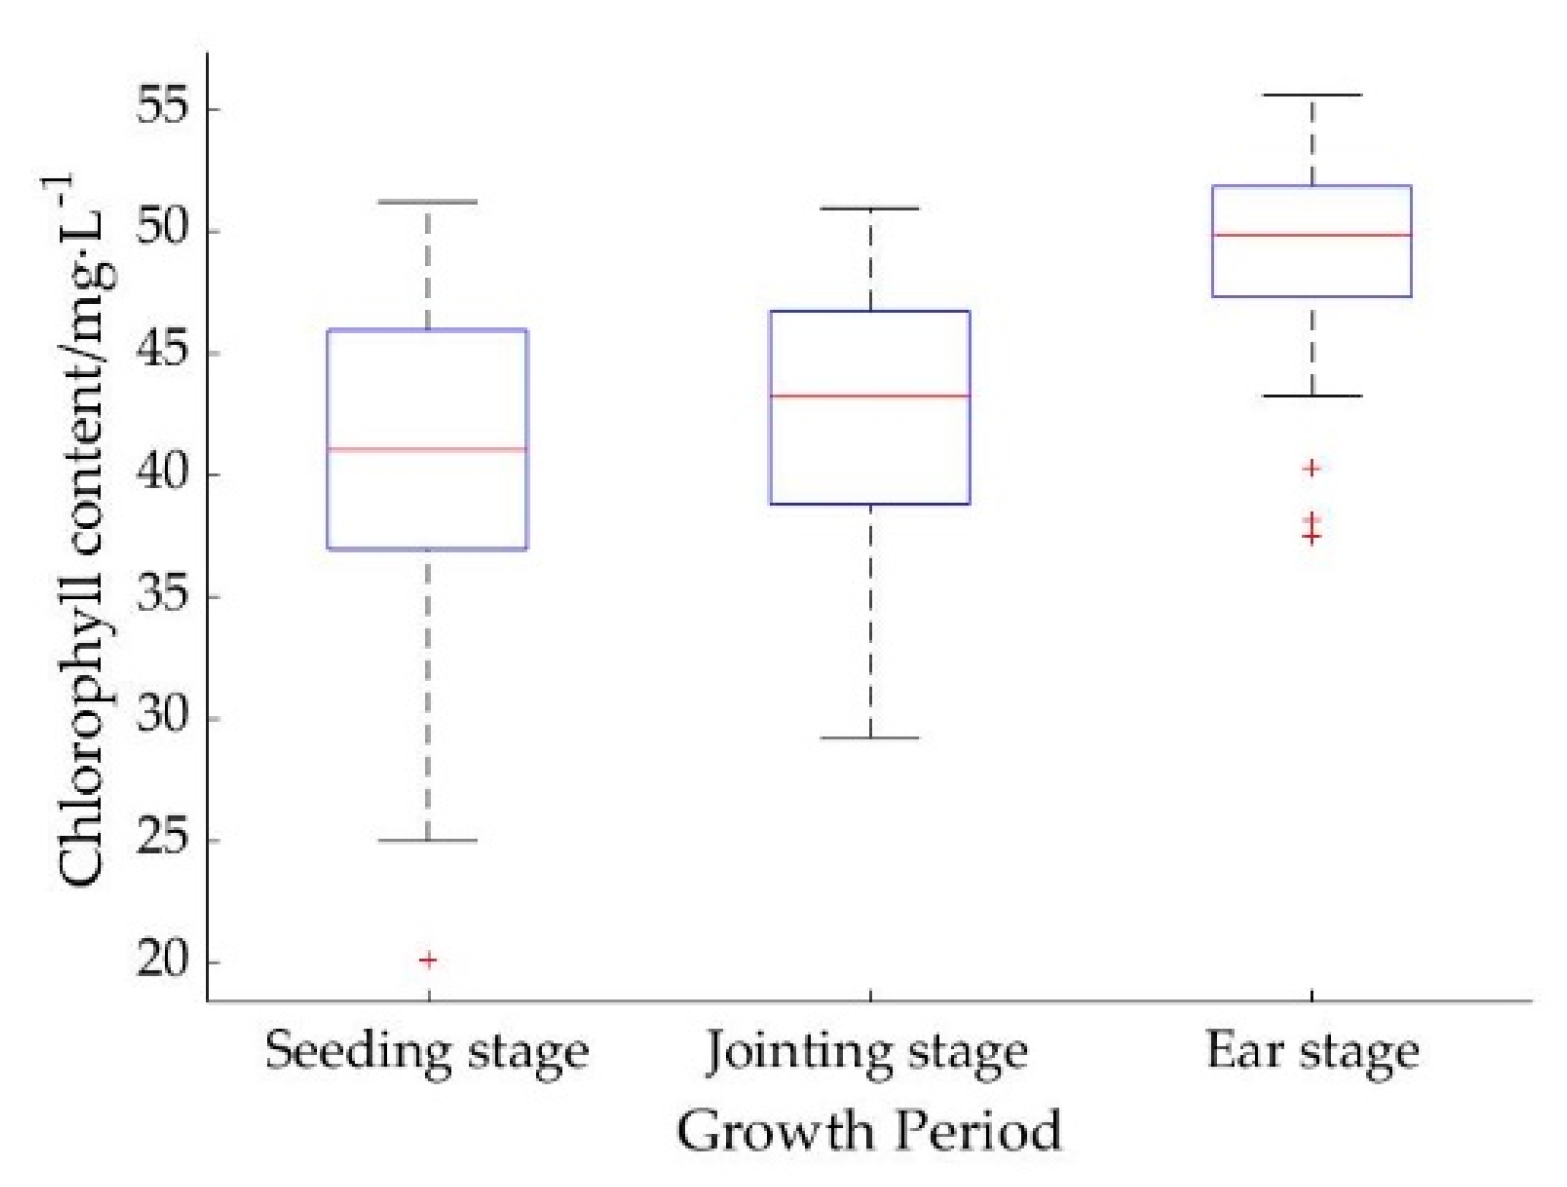
A total of three experiments were performed in this study. Seventy-two maize leaves were collected at the seedling, jointing, and ear stages for chlorophyll content extraction. A total of 216 samples were obtained during the three growth stages. The box plots of chlorophyll content in maize leaves at each growth stage are shown in Figure 3. The KS algorithm was used to divide the entire growth period samples according to different segmentation methods. The results are shown in Table 3. Table 3 illustrates that the training and validation sets contain a large number of chlorophyll content values for the total sample data.
3.2. Results of Spectral Image Segmentation by Different Segmentation Methods
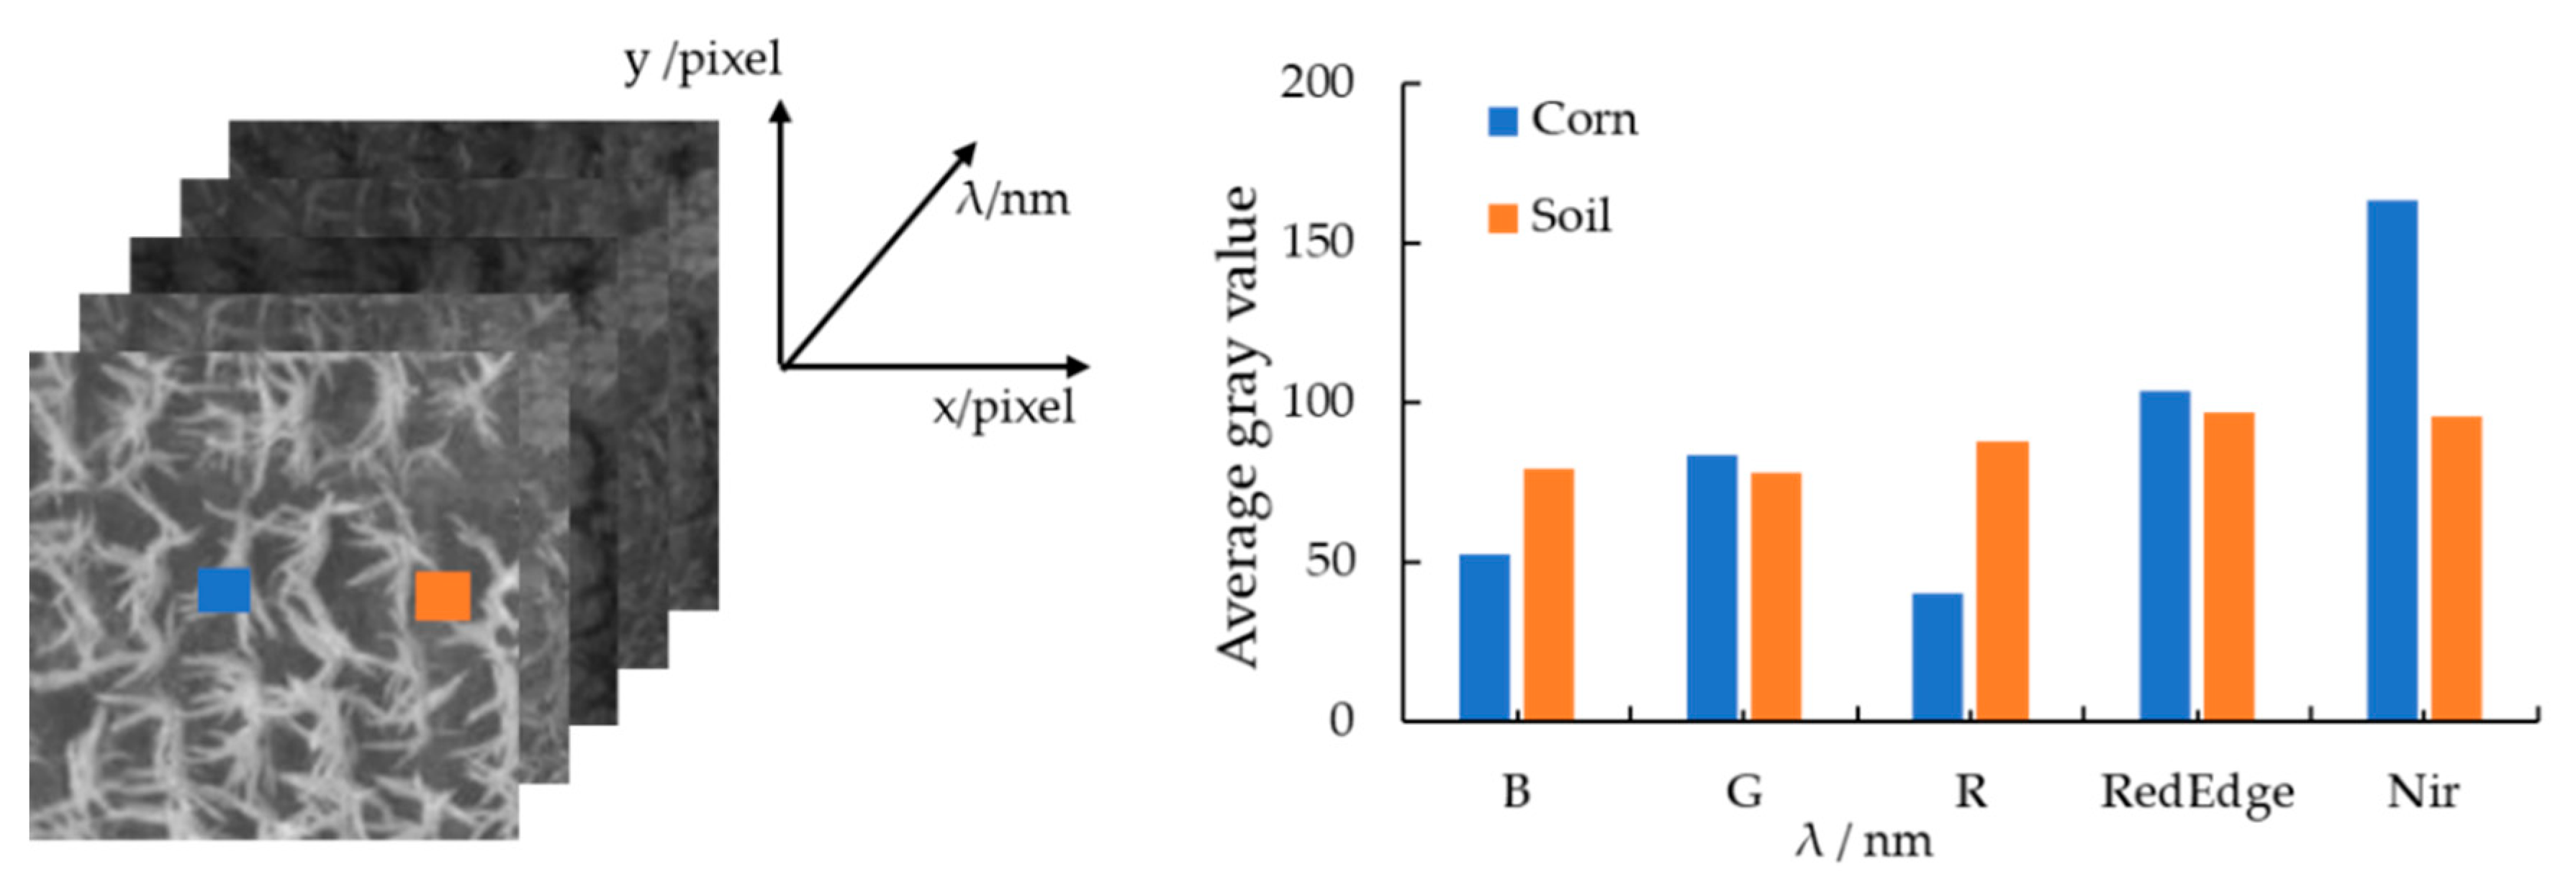
ENVI 5.2 software was used to draw the regions of interest of the maize canopy and the soil background in the multispectral image for exploring the effect of soil background on the reflectance of maize canopy in the multispectral image. The average gray value of the region of interest was extracted. The results are shown in Figure 4. The average gray values of the maize canopy and soil are different in five bands. The maize canopy gray values at the blue and red bands are lower than that of soil. The gray value of crop canopy in the green, red edge, and near-infrared bands is higher than that of soil, and the difference between the two reaches the maximum at near-infrared band. Therefore, accurate maize canopy spectral information can be obtained by removing the soil background from multispectral images.
The ExG index segmentation, threshold segmentation method, and wavelet segmentation method were used to remove the soil background in the multispectral image to obtain an accurate maize canopy spectrum. The segmentation results are shown in Figure 5. The maize canopy image shows that the ExG index segmentation will retain several noise points when removing the soil background, and the segmentation effect is poor. The reflectance of maize canopy and soil in the near infrared band has a large difference. On this basis, threshold segmentation method was used because it can efficiently remove the soil background. However, the background close to the maize leaves is retained. The wavelet segmentation method first removes the edges and noise points of the near-infrared image and then uses the maize canopy. The spectral difference characteristics of the soil are segmented; thus, better results can be obtained than the ExG index segmentation and threshold segmentation method.
3.3. Effects of Different Segmentation Methods on Maize Growth Dynamics
3.3.1. Spectral Reflectance Response
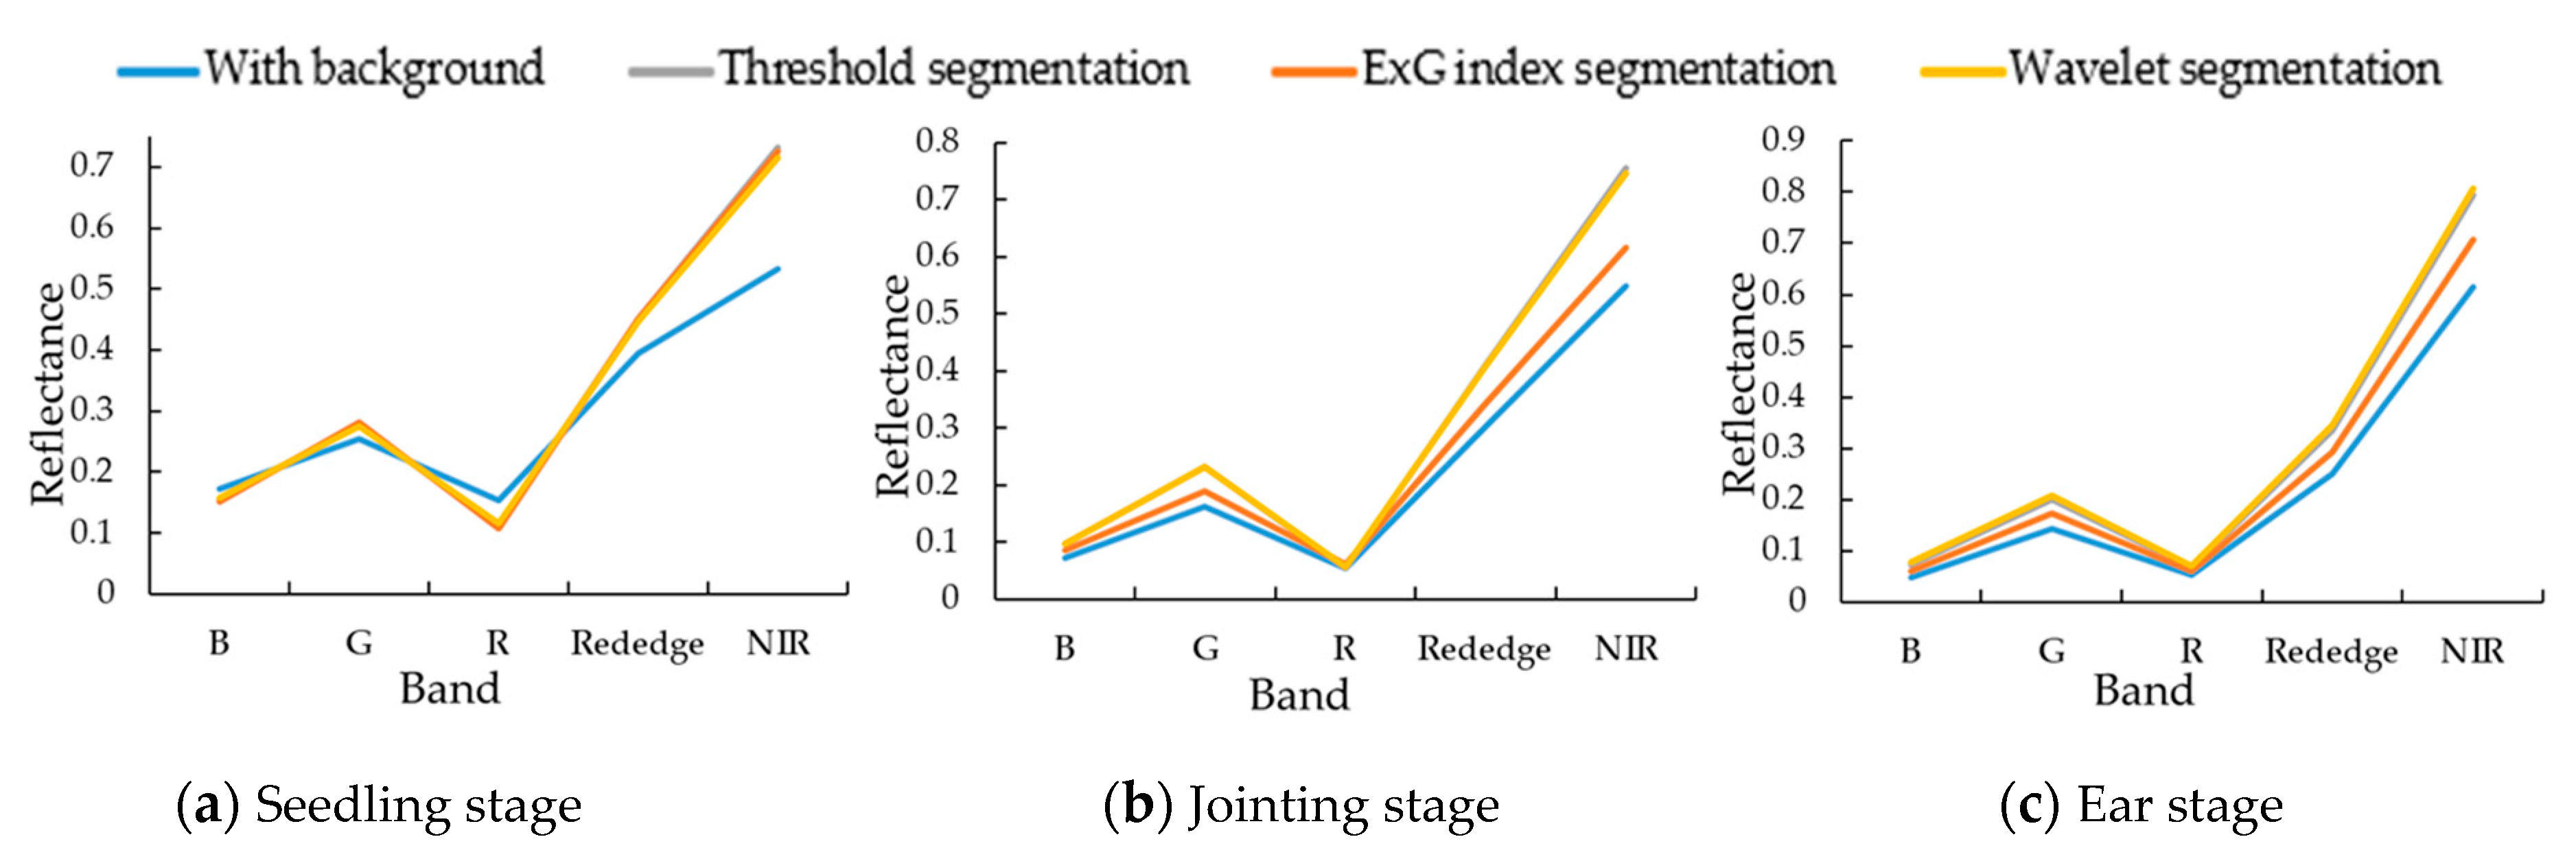
Figure 6 lists the maize canopy spectral reflectance trends extracted from the original spectral images and the three segmentation methods obtained during the three growth periods. In general, the spectral reflectance of the maize canopy decreases in the blue and red bands and increases in the green, red edge, and near-infrared bands after the multispectral image is segmented. This phenomenon presents the typical spectral feature of green vegetation with light absorption by chlorophyll and carotene pigment in blue and red bands, and relative higher light reflectance in green and NIR ranges. The effects of the three segmentation methods in different growth periods in Figure 6 vary. As shown in Figure 6a, the maize canopy coverage at the seedling stage is low, the soil background is highly visible, and the segmentation is easy; thus, the results obtained by the three segmentation methods are similar. The maize grows to the jointing and ear stages, and the maize canopy structure is complex, which is not conducive to background culling. Figure 6b,c show that the reflectance of ExG index segmented image is lower than image segmented by the wavelet or threshold methods. However, the performances of wavelet and threshold segmentation are very close in all three stages.
The segmentation results are difficult to evaluate by ideal images, which are without influence factors in the field. We therefore compared the segmented image with the original image to explore the differences between three methods. Table 4 shows results of RMSE operated by three segmentation methods. At the seeding stage, the RMSE values at NIR bands are higher than other band, and decrease following ExG, threshold and wavelet segmentation in blue, green, red, and red edge bands; the value of wavelet segmentation method is lowest in each band. At jointing and ear stage, RMSE values of threshold and wavelet segmentation are close and higher than ExG segmentation results, especially for green and NIR bands. Meanwhile, RMSE value of the wavelet method is higher than that of the threshold method in each band. Higher values show that changes and quality improvement between segmented image and original image in each band are more significant. Thus, the wavelet segmentation method shows a better performance for field difference enhancement and image quality improvement.
3.3.2. Texture Response
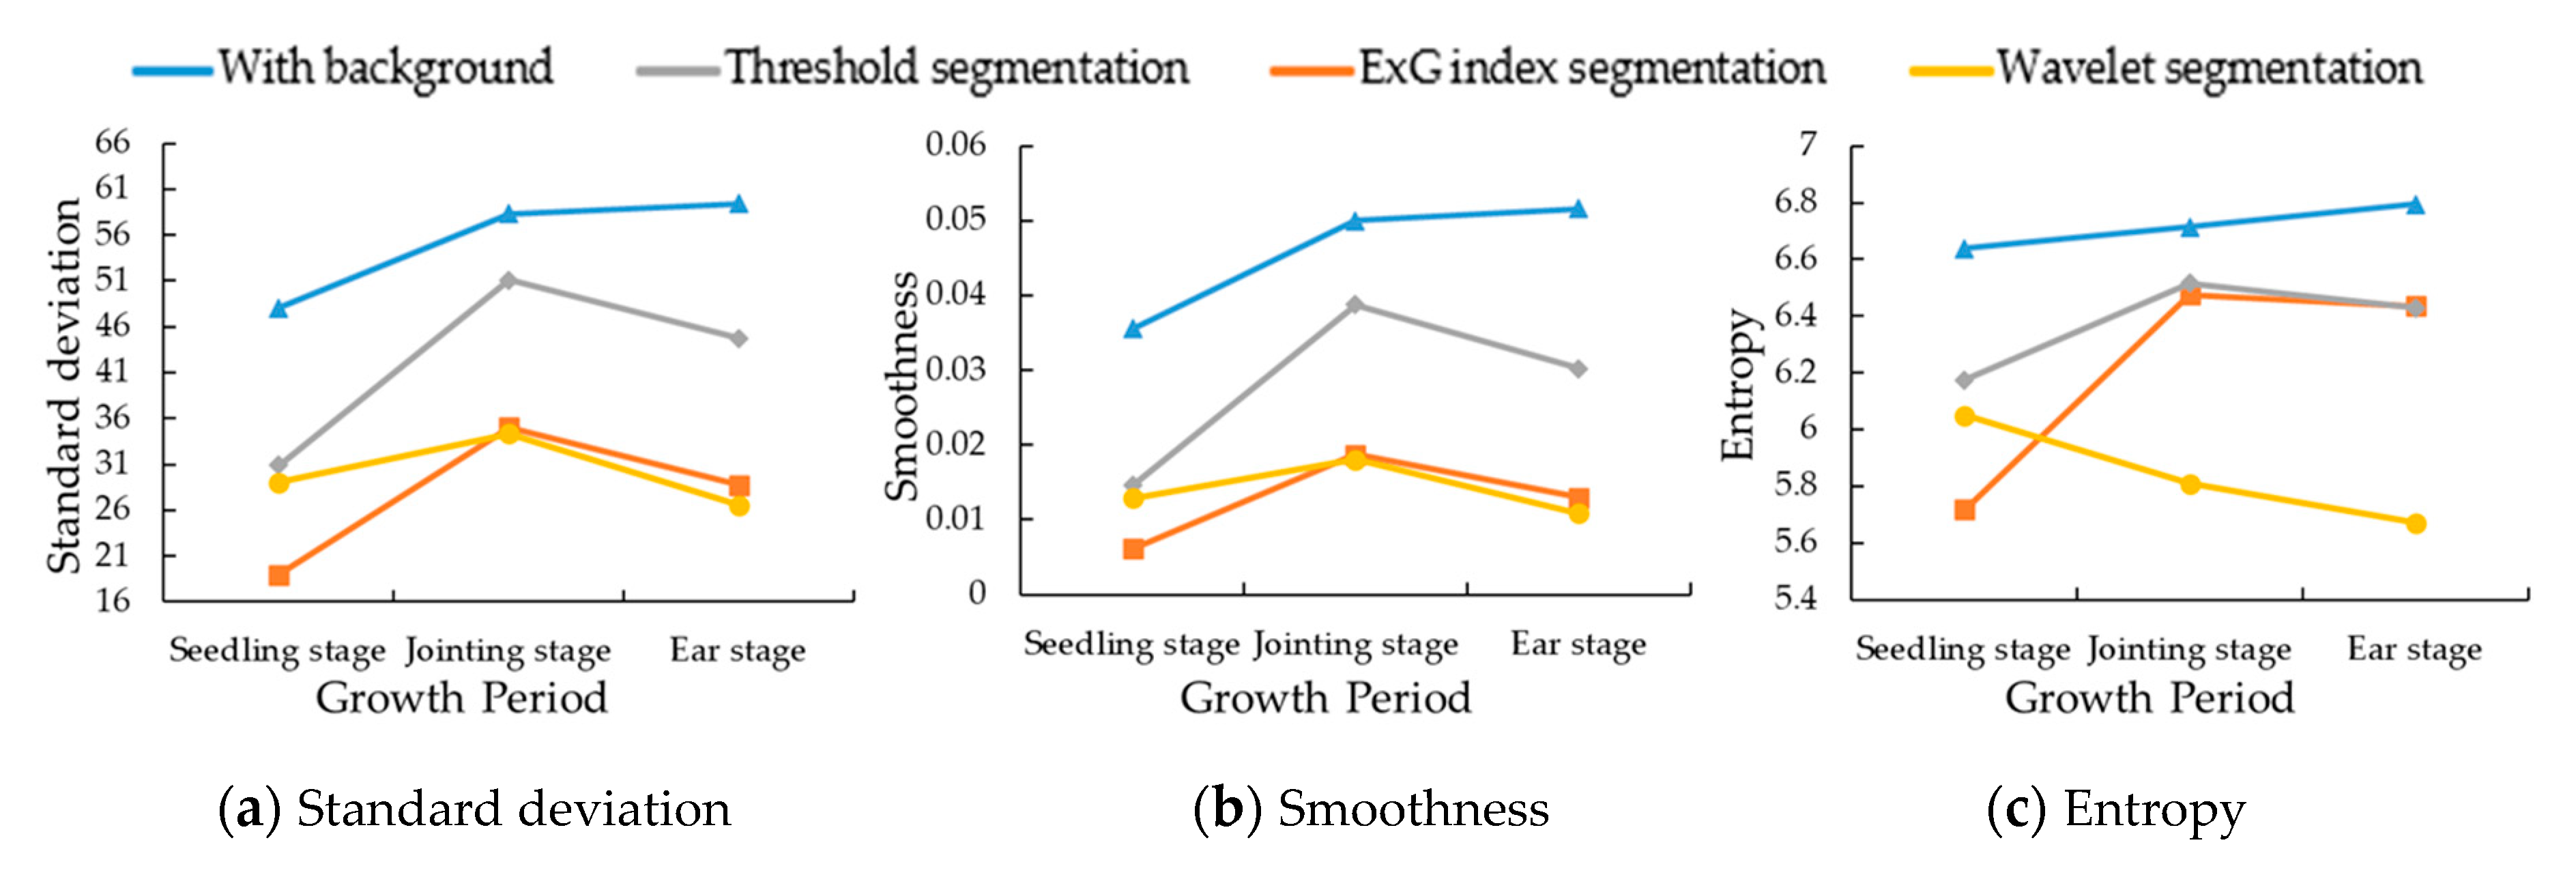
The maize canopy image in the multispectral image was extracted by background culling to generate a maize canopy vector file. We wanted to further discuss texture responses in processed images. The texture change trend of the maize canopy in different growth periods was extracted by various segmentation methods. Figure 7 demonstrates that the standard deviation, smoothness, and entropy of the near-infrared image of the maize canopy gradually increase with the growth of the maize when the maize canopy is not segmented. This phenomenon indicates that the canopy structure of the plant canopy became more and more complicated with the growth of the maize.
Three segmentation methods were used to eliminate influences form the soil background, all of which reduce the standard deviation, smoothness, and entropy of the image to a certain extent. Figure 7 shows that compared with ExG index segmentation method, threshold segmentation method and wavelet segmentation method can better reduce the standard deviation, smoothness, and entropy of the image. Firstly, the results of threshold segmentation method were higher than others. Even the standard deviation and entropy valued of the threshold segmented image are close to the image segmented by wavelet and ExG, respectively, its performances are not the best. Secondly, the standard deviation of ExG processed image is lowest at the seedling stage due to the soil background removal; the results of standard deviation and smoothing are close between ExG and wavelet segmentation methods at the jointing and the ear stage. When compared to the wavelet method, although the ExG method has lower values of standard deviation and smoothness, the entropy value of ExG segmented image is close to threshold segmentation and higher than wavelet segmentation at the jointing and the ear stage. It means that the randomness performances processed by threshold and ExG segmentation are higher than wavelet segmentation because of the limited elimination of canopy structure influences during these stages. Thus, the wavelet segmentation method has achieved stable results in the three growth stages.
3.3.3. Coverage Response
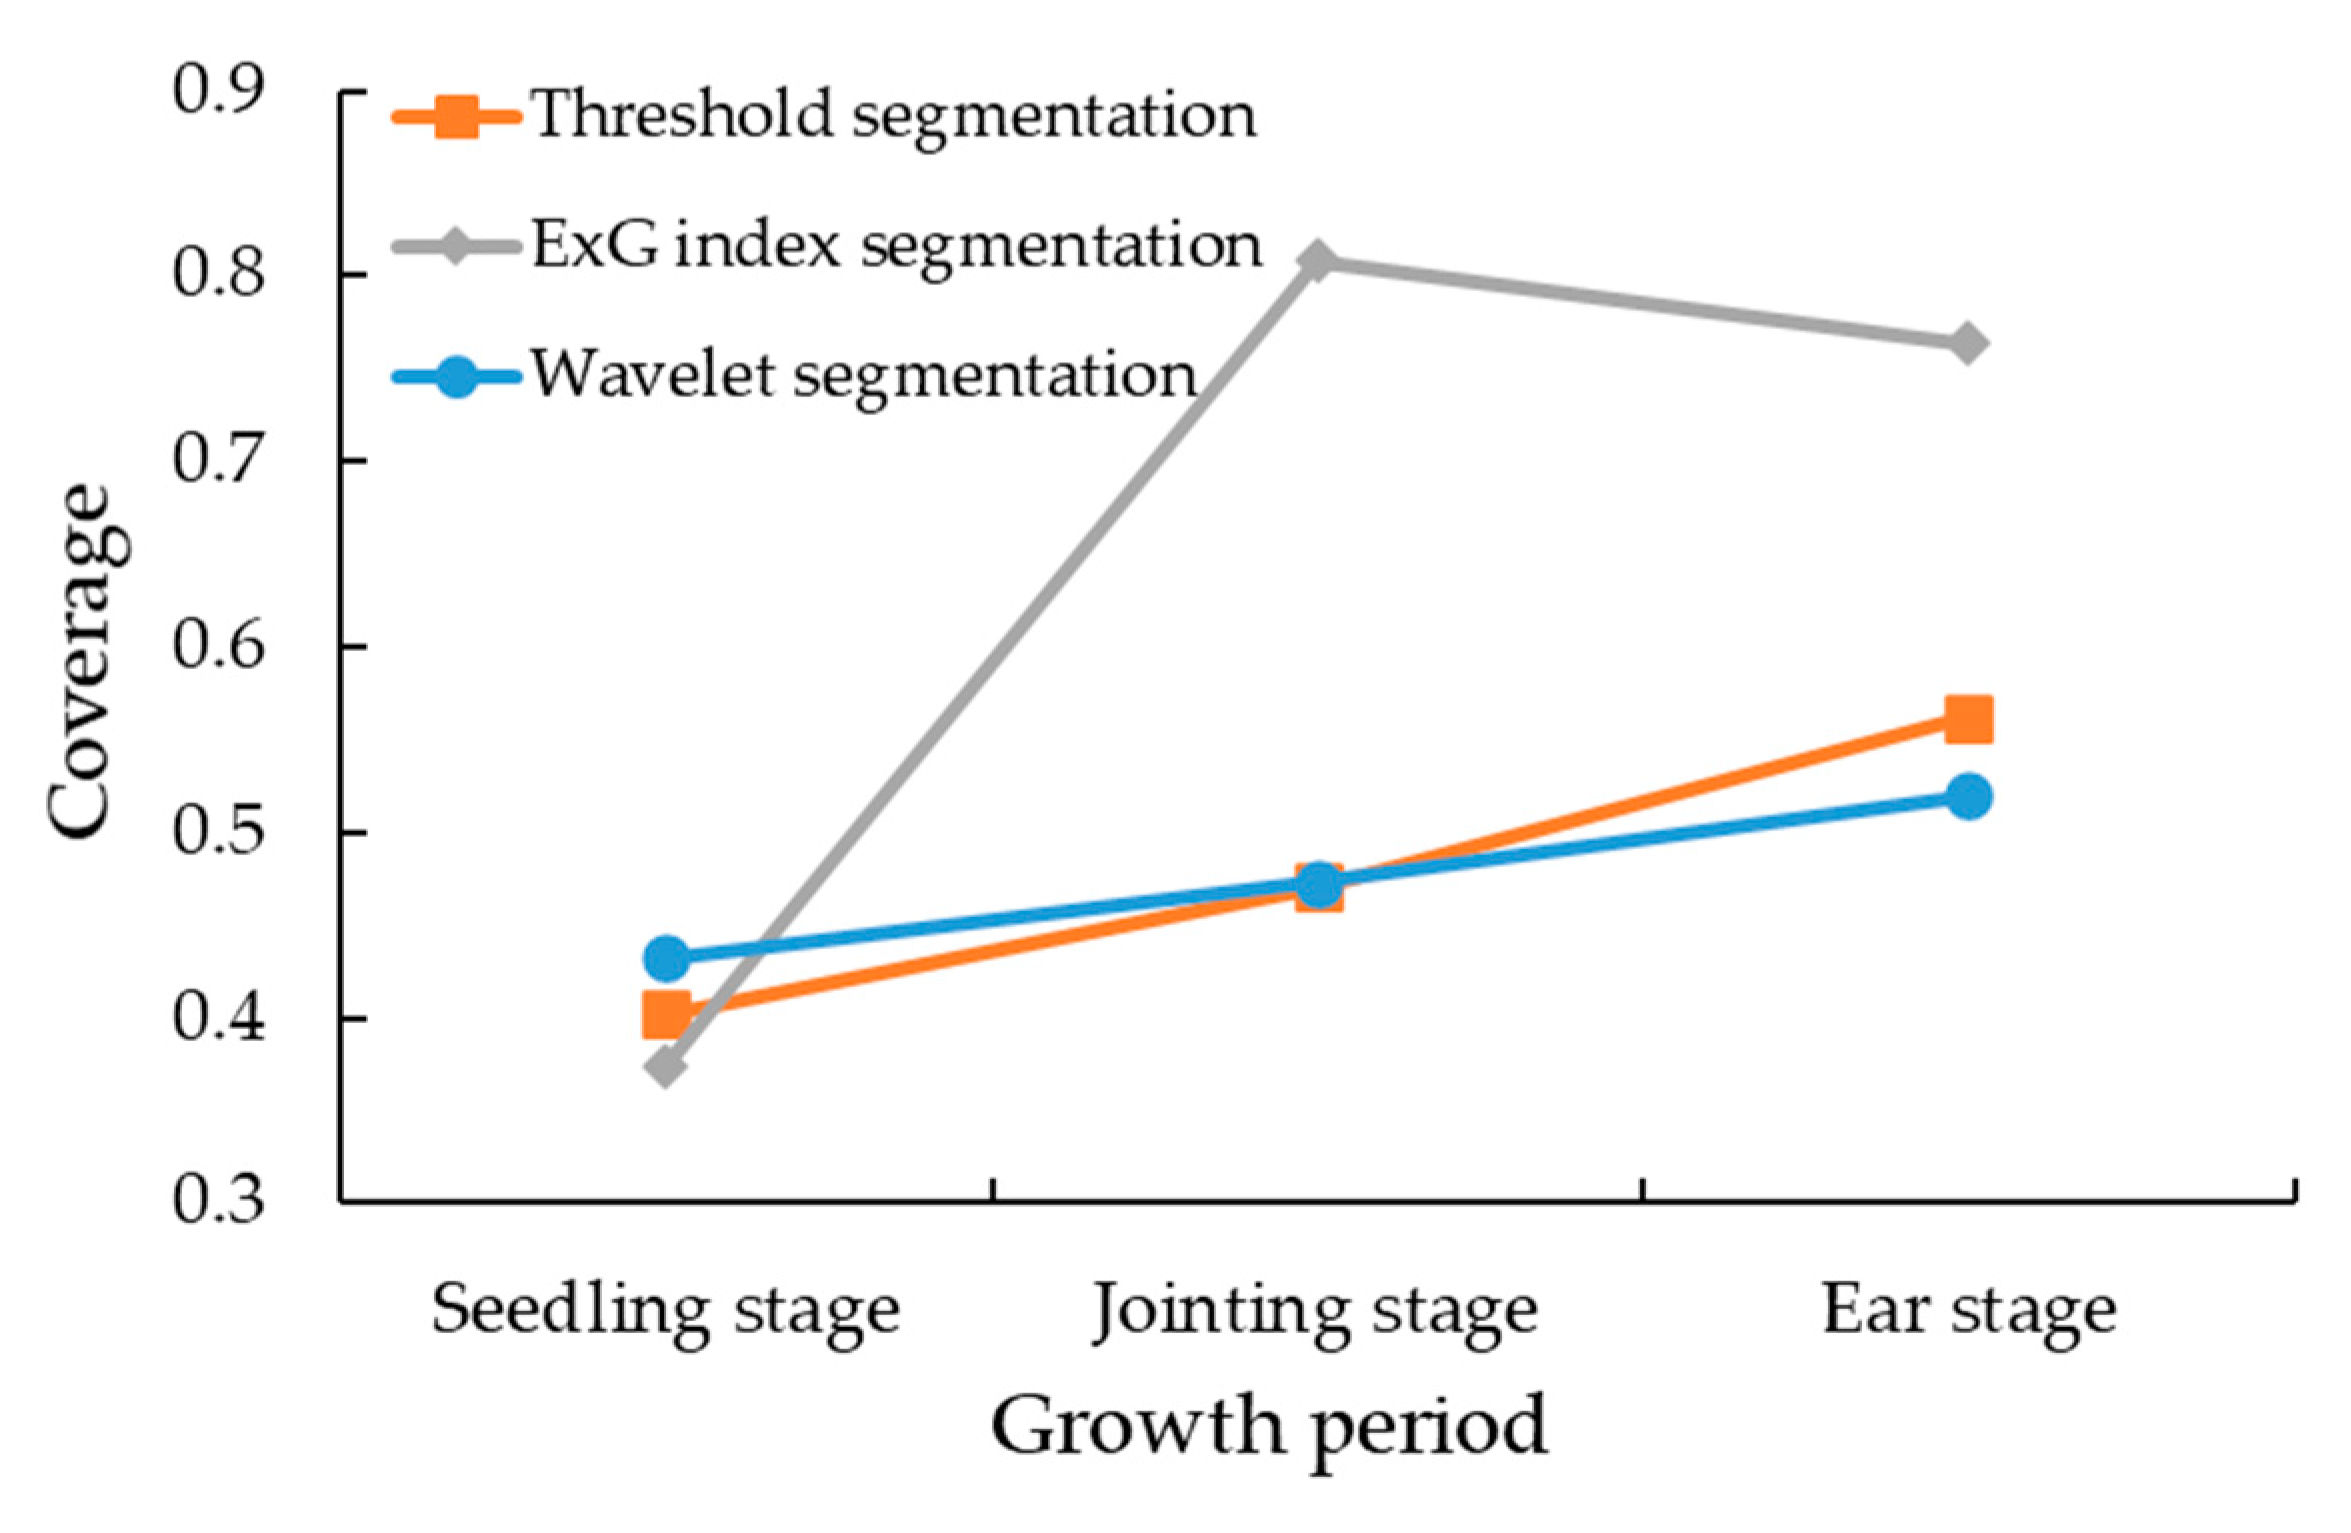
Figure 8 shows the change trend of maize plant coverage calculated by extracting the canopy area by using three segmentation methods during the above-mentioned three growth stages. The maize canopy coverage was calculated by ratio of segmented canopy pixels and full image pixels and presented between 0 and 1. In general, the values of canopy coverage acquired by all of segmentation methods increased with the growth stages. Some differences in the maize canopy coverage calculated by different segmentation methods can be observed in the same growth period. Firstly, canopy coverage values calculated based on three segmented results at the seedling stage were relatively small and lower than 0.45. This phenomenon is attributed to the simple structure of the maize plant at the seedling stage. The visible part of the soil is large, and the division is simple when the leaf volume is low. Secondly, those at the jointing and ear stages were different, especially ExG segmentation results that were significantly higher than others above 0.75; the coverage values of threshold and wavelet segmented images were similar and higher than 0.45; the result of the threshold segmentation was a little bit higher than wavelet segmentation method at the earing stage. The significantly differences between three segmentation methods at the jointing and ear stages also show that the segmentation was more complicated than the seedling stage due to a large number of leaves crossing each other and a complex canopy structure of maize plant.
As mentioned above, in the three segmentation methods used in this study, the maize canopy coverage calculated by the ExG vegetation index method was high. Meanwhile, the maize canopy coverage calculated by the threshold and wavelet segmentation methods was low. This study takes the ear period as an example. The maize coverage calculated by the ExG vegetation index method, threshold segmentation method, and wavelet segmentation method was 0.764, 0.562, and 0.520, respectively. This result is attributed to the complicated canopy structure at the ear stage of maize and the presence of many background effects, such as soil and shadow. The results are difficult to prove by actual coverage values because of the limitation of ideal image acquisition, so that we resort to the diagnosis modeling of chlorophyll content to further estimate the capability and validity of three segmentation methods.
However, the phenomena presented in Figure 8 could be discussed based on the combination of the spectral response in the field and the principal of each segmentation method. The detail is in discussion part.
3.4. Modeling and Analysis of Maize Canopy Chlorophyll Content
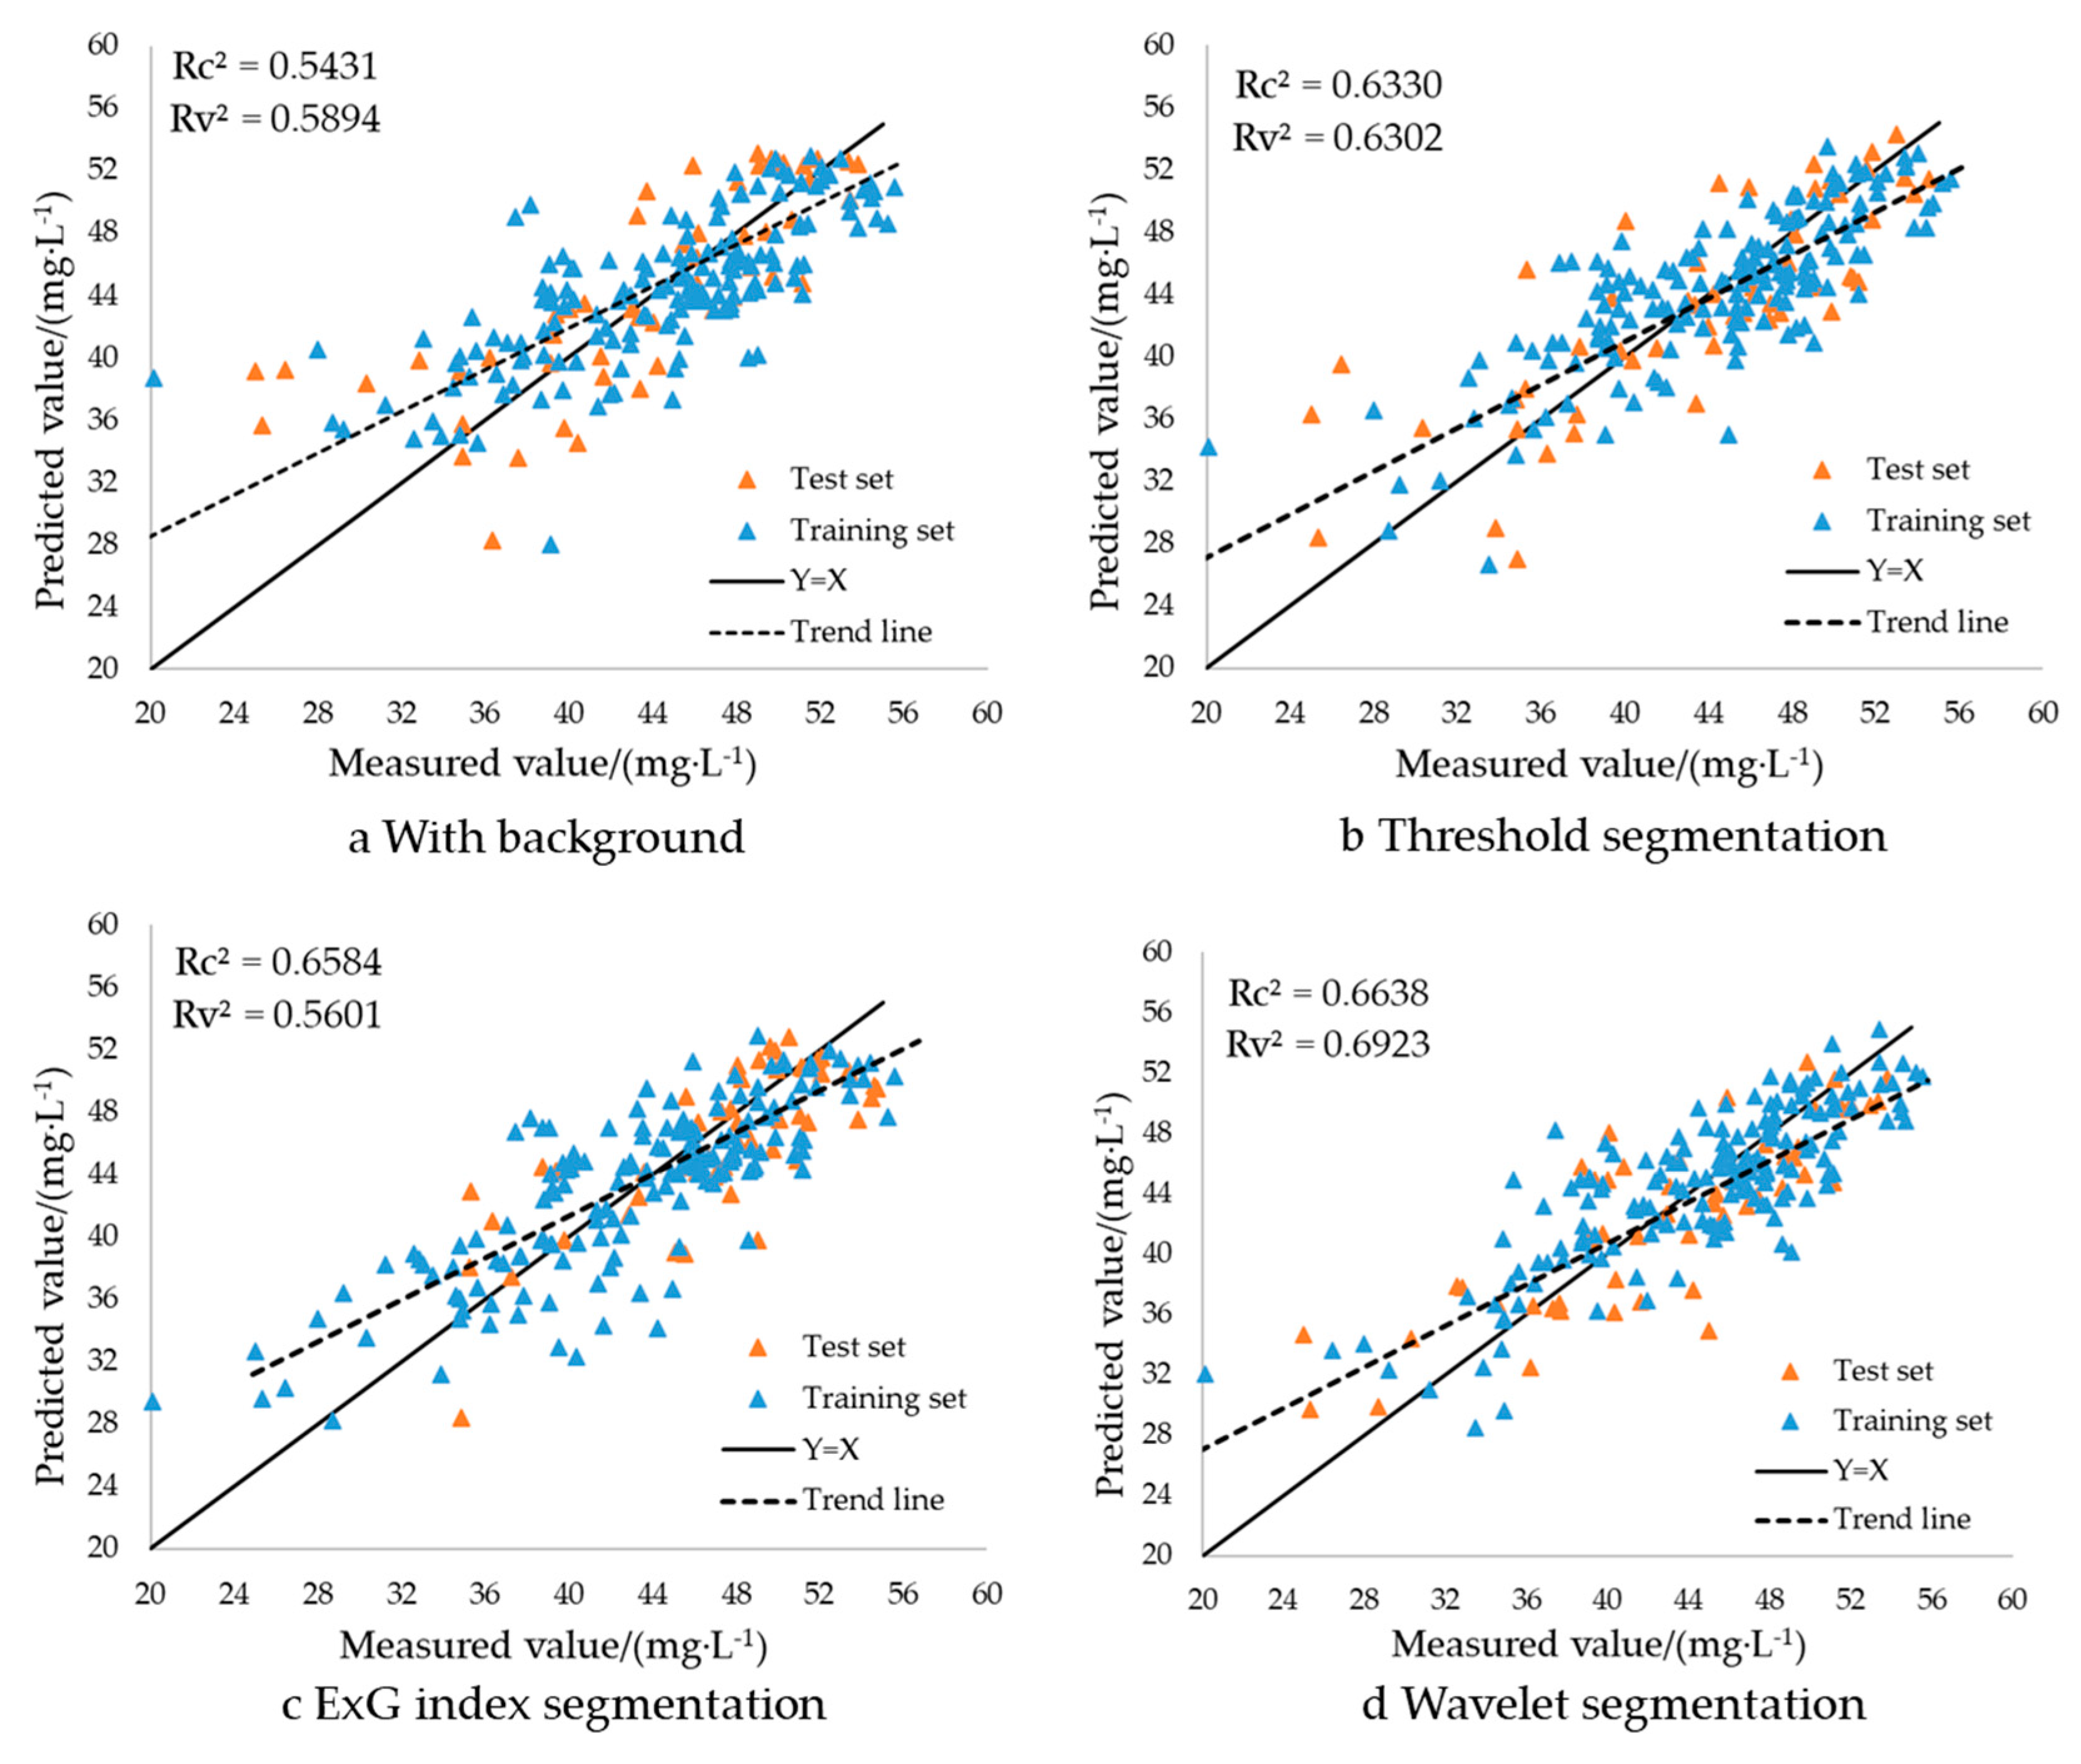
On the basis of the above analysis, the maize canopy multispectral image is segmented, and the background interference in the image is eliminated. The multispectral band reflectance, multiple vegetation indices, and maize canopy chlorophyll content were established to construct a PLS model. Correlation analysis was performed using the maize canopy chlorophyll content calculated by the model and the real value measured in the experiment. The maize canopy chlorophyll based on different segmentation methods was established by comparing the R2 and RMSE of the two groups of variables. The test model was analyzed, and the results are shown in Table 5. Figure 9 shows scatter plots of the predicted and true values obtained under different segmentation methods to intuitively display their relationship.
Table 5 shows the model accuracy of the reflectivity modeling obtained using the original reflectivity modeling and the three segmentation methods. The model built using the original reflectivity has low accuracy and large errors. Compared with the original model, the model constructed based on the reflectance obtained by the three segmentation methods has improved performance to a certain extent in terms of accuracy and error. This indicates that removing the soil background from the original image can improve the diagnostic accuracy of chlorophyll content. Compared with the ExG index segmentation method and the threshold segmentation method, the model based on the wavelet segmentation method shows the best performance and the lowest error (Rc2 = 0.6638, RMSEF = 3.6211, MAE = 2.89; Rv2 = 0.6923, RMSEP = 3.9067, and MAE = 3.19).
4. Discussion
Spectral analysis and imaging spectroscopy, a fast and nondestructive diagnosis method, can comprehensively reflect the changes of physiological and biochemical indexes and canopy structure of crops by analyzing the spectral reflectance characteristics of crops; accordingly, a rapid nondestructive diagnosis of crop nutrition is achieved [6,7]. The reflectance spectral data can be used to diagnose the chlorophyll content of maize in the field. The image acquired by a UAV-based spectral platform contains rich information, including not only spectral information of ground objects but also texture and coverage data.
4.1. Elimination of the Impact of Background and Noise
This study showed that the spectral reflectance of maize canopy greatly changed after the soil background was removed, which was consistent with the results of Wu et al. [22]. Compared with the original image with the soil background, the spectral reflectance values reduce in blue and red bands, and increase in green, red edge, and NIR bands. It is similar to that of the maize canopy in Figure 4. The gray value of the maize canopy is lower than that of the soil in the blue and red bands and is higher than that of the soil in the green, red, and near-infrared bands. It shows that the canopy segmentation could help to enhance the spectral characteristic of crop and reduce the influences from the soil background.
Figure 7 shows that the texture features (standard deviation, smoothness, and entropy) of maize canopy multispectral images become more complex with the extension of growth period. The main reason is that with the growth of maize, the area and number of leaves increase and cross each other, which increases the complexity of canopy structure. Three segmentation methods are used to segment the soil background in the multispectral image, and only the corn part of the image is preserved, which reduces the type of elements in the image and reduces the complexity of the image. Therefore, the standard deviation, smoothness, and entropy in Figure 7 are reduced to some extent by three segmentation methods. Compared with threshold segmentation method and wavelet segmentation method, ExG exponential segmentation method has lower performance. The possible reason is that the illumination change during UAV image acquisition interferes with the calculation of vegetation index, which is easily saturated under high biomass conditions. Previous studies have shown that wavelet transform can be used to process UAV images and decompose different proportions of image signals to eliminate noise [38]. The wavelet segmentation method combines the advantages of wavelet transform and threshold segmentation, and can achieve good results in noise elimination and object classification and classification [39]. This is also confirmed by the results of this study. The wavelet segmentation method is used to remove the soil background, reduce the complexity of crop canopy, and achieve stable performance in three growth periods. Figure 8 shows the results of the three segmentation methods to calculate the coverage of maize at three growth stages. Although the ExG segmentation method is widely used in the field crop detection, it is operated based on different spectral bands. According to the spectral characteristics of crop and soil background, the ExG index shown in Equation (9) is established by grey values of blue, green, and red bands to amplify the spectral difference between crop and soil background. As shown in Figure 4, this way pays attention to the light absorption by chlorophyll and carotene pigment in visible bands related to blue and red, it reduces the soil background which has close grey values among blue, green, and red band image. While threshold and wavelet segmentation methods are applied in NIR image in which the grey values are significant different between corn and soil to show the biological vitality. Compared with the NIR image, grey values are easily affected by environment in visible bands. For example, a strong light radiation might reduce grey contrast and lead miss pixels of leaves, the canopy coverage might be lower than those of threshold and wavelet segmentation methods at the seedling stage. At the jointing and ear stage, the coverage values calculated by ExG show significant changes, because the soil background is misclassified as the crop due to more complex structure of plants and the expanded shading elements from the crossing leaves. The coverage value at ear stage is lower than those at jointing stage because of closed crop lines by luxuriant leaves and reduced misclassification of soil back ground.
Regards to the segmented results of the threshold and wavelet method, the texture analysis helps to evaluate the segmented results and explain how it conducts to improve the quality from image contrast, brightness, and randomness. It is discussed based on texture analysis results shown in Figure 7a,b; standard deviation and smoothness values of wavelet segmented images are higher than that of threshold segmented image at seedling stage, lower at ear stage, and similar at jointing stage, respectively. The higher value of standard deviation indicates the higher image contrast, and it means the edge pixels of leaves are more clearly to classify. The higher smoothness value indicates the lower influence from noise or background, and it shows better performances of image enhancement. As a result, the coverage result of the wavelet segmentation method is higher than that of the threshold segmented image at seedling stage, lower at ear stage, and similar at jointing stage, respectively.
In addition, the wavelet analysis is a method usually used in signal denoising and enhancement. Figure 7c shows that the randomness indicated by entropy is improved by wavelet method during jointing and ear stages. It is contributed by the image denoising to reduce the effects of canopy structure and leaves crossing. The wavelet method also helps to enhance useful edge or detail information in the NIR image so that the randomness locates between ExG and the threshold method at seedling stage. From this view, the wavelet segmentation method not only eliminates the soil background in the image, but also segments the edge and noise points in the image [38], so the calculated coverage by wavelet method is more reliable than the ExG index and threshold segmentation method.
4.2. Diagnosis of Chlorophyll Content in Maize Based on Different Segmentation Methods
The vegetation index has been widely used to diagnose crop nutritional parameters, and its performance varies with wavelength configuration [23,52]. Duan et al. [53] found saturation in estimating LAI (Leaf Area Index) by using NDVI alone. Cheng et al. [16] found that the four NIR-based vegetable indices outperformed the two-color indices in AGB estimation across all growth stages. Therefore, a single band or vegetation index was not easy to show good model accuracy in all growth periods. In this study, 20 commonly used vegetation indices were selected to construct a chlorophyll content diagnostic model for the entire growth period of maize.
The spectral reflectance of maize canopy was obtained on the basis of the three segmentation methods to remove soil background, and the vegetation index was calculated. A chlorophyll content diagnostic model of maize canopy based on different segmentation methods was constructed using the PLS method. The results showed that the accuracy of the diagnostic model constructed using the original canopy spectral data was low (Rc2 = 0.5431, RMSEF = 4.2184, MAE = 3.24; Rv2 = 0.5894, RMSEP = 4.6947, and MAE = 3.36), and the accuracy of the diagnosis of chlorophyll content in maize canopy could be improved to varying degrees by using three segmentation methods to remove background noise in maize multispectral images. However, among the three segmentation methods selected in this study, the accuracy of the training set based on the ExG index segmentation method was 0.6584, but the accuracy of the verification set was only 0.5601, which indicates that the model is not robust enough. This result is consistent with the previous discussion, and the color index is easily affected by ambient light. In the future, spectral radiometer can be used to correct the reflectivity of UAV images, so as to further optimize the performance of the model. The diagnostic model of maize canopy chlorophyll content based on wavelet segmentation had the highest quasi determination (Rc2 = 0.6638, RMSEF = 3.6211, MAE = 2.89; Rv2 = 0.6923, RMSEP = 3.9067, and MAE = 3.19). This also confirmed that the wavelet segmentation method can effectively remove the soil background and noise points in the UAV multispectral image and restore the spectral reflection characteristics of crops in the canopy image. The good performance of wavelet segmentation also shows that image enhancement has great potential in UAV image noise elimination.
5. Conclusions
In the present study, we studied the background noise in the multispectral images of maize canopy acquired by UAV and discussed the performance of three noise rejection methods. The results show that the soil background removal from multispectral images can reduce the complexity of image texture and improve the spectral reflectance characteristics of crop canopy. The wavelet segmentation method achieved better noise rejection effect in the three growth stages of maize compared with the threshold and ExG index segmentation methods. We extracted 20 common vegetation indices on the basis of the original spectral images and the spectral images after background removal and constructed a diagnostic model of maize canopy chlorophyll content using the partial least squares regression method. The results showed that the removal of the soil background was helpful in improving the diagnostic accuracy of the maize canopy chlorophyll content in the field. The diagnostic model of the chlorophyll content in maize canopy based on wavelet segmentation achieved the optimal results (Rc2 = 0.6638, RMSEF = 3.6211; Rv2 = 0.6923, and RMSEP = 3.9067). With the popularity of the UAV remote sensing platform in recent years, the results of this study can provide a valuable reference for noise removal during UAV image crop nutrition monitoring. However, this study was based on small-area plot experiments, and other noises besides soil background still exist in field experiments. Such issue was not discussed in depth in this study. Future work will be conducted in this direction.
Author Contributions
Conceptualization, L.Q., D.G., J.Z., M.L., H.S. and J.M.; Data curation, L.Q., D.G., J.Z., M.L., H.S. and J.M.; Formal analysis, L.Q., D.G., J.Z., M.L., H.S. and J.M.; Funding acquisition, L.Q., J.Z., M.L., H.S. and J.M.; Investigation, L.Q., D.G., J.Z., M.L., H.S. and J.M.; Methodology, L.Q., D.G., J.Z., M.L., H.S. and J.M.; Project administration, M.L., H.S. and J.M.; Resources, L.Q., D.G., J.Z., M.L., H.S. and J.M.; Software, L.Q., D.G., J.Z., M.L. and H.S.; Supervision, L.Q., D.G., J.Z., M.L., H.S. and J.M.; Validation, L.Q., D.G. and M.L.; Visualization, L.Q., J.Z. and H.S.; Writing—original draft, L.Q.; Writing—review & editing, L.Q., M.L., H.S. and J.M. All authors have read and agreed to the published version of the manuscript.
Funding
The project was supported by the National Key Research and Development Program (2018YFD0300505-1), the National Natural Science Fund (Grant No. 31971785 and 31501219), the Fundamental Research Funds for the Central Universities (Grant No. 2020TC036), and the Graduate Training Project of China Agricultural University (JG2019004 and YW2020007).
Acknowledgments
We would like to thank Zizheng Xing, Zhiyong Zhang, Xuying Ma, Di Song, Ruomei Zhao, and Song Li for their help with field data collection.
Conflicts of Interest
The authors declare no conflict of interest.
References
- Gitelson, A.A.; Gritz, Y.; Merzlyak, M.N. Relationships between leaf chlorophyll content and spectral reflectance and algorithms for non–destructive chlorophyll assessment in higher plant leaves. J. Plant Physiol. 2003, 160, 271–282. [Google Scholar] [CrossRef] [PubMed]
- Sun, H.; Li, M.Z.; Zhang, Y.E.; Zhao, Y.; Wang, H.H. Detection of chlorophyll content in maize growth stage. Spectrosc. Spectr. Anal. 2010, 30, 2488–2492. [Google Scholar]
- Liu, H.J.; Li, M.Z.; Zang, J.Y.; Gao, D.H.; Sun, H.; Wu, J.Z. A Modified Vegetation index for Spectral Migration During Crop Growth. Spectrosc. Spectr. Anal. 2019, 39, 3040–3046. [Google Scholar]
- Yuan, Z.; Ata–Ul–Karim, S.T.; Cao, Q.; Lu, Z.; Cao, W.; Zhu, Y.; Liu, X.J. Indicators for diagnosing nitrogen status of rice based on chlorophyll meter readings. Field Crop. Res. 2016, 185, 12–20. [Google Scholar] [CrossRef]
- Gong, Y.; Duan, B.; Fang, S.; Zhu, R.; Wu, X.; Ma, Y.; Peng, Y. Remote estimation of rapeseed yield with unmanned aerial vehicle (UAV) imaging and spectral mixture analysis. Plant Methods 2018, 14, 70. [Google Scholar] [CrossRef] [PubMed]
- Du, M.M.; Noguchi, N. Monitoring of Wheat Growth Status and Mapping of Wheat Yield’s within–Field Spatial V ariations Using Color Images Acquired from UAV–camera System. Remote Sens. 2017, 9, 289. [Google Scholar] [CrossRef] [Green Version]
- Battude, M.; Bitar, A.A.; Morin, D.; Cros, J.; Huc, M.; Sicre, C.M.; Dantec, V.D. Estimating maize biomass and yield over large areas using high spatial and temporal resolution Sentinel–2 like remote sensing data. Remote Sens. Environ. 2016, 184, 668–681. [Google Scholar] [CrossRef]
- Kross, A.; Mcnairn, H.; Lapen, D.; Sunohara, M.; Champagne, C. Assessment of RapidEye vegetation indices for estimation of leaf area index and biomass in corn and soybean crops. Int. J. Appl. Earth Obs. Geoinf. 2015, 34, 235–248. [Google Scholar] [CrossRef] [Green Version]
- Matese, A.; Toscano, P.; Di Gennaro, S.F.; Genesio, L.; Vaccari, F.P.; Primicerio, J.; Gioli, B. Intercomparison of UAV, aircraft and satellite remote sensing platforms for precision viticulture. Remote Sens. 2015, 7, 2971–2990. [Google Scholar] [CrossRef] [Green Version]
- Zhang, Y.; Su, Z.; Shen, W.; Jia, R.; Luan, J. Remote monitoring of heading rice growing and nitrogen content based on UAV Images. Int. J. Smart Home 2016, 10, 103–114. [Google Scholar] [CrossRef]
- Jiang, J.; Zheng, H.; Ji, X.; Cheng, T.; Tian, Y.C.; Zhu, Y.; Cao, W.X.; Reza, E.; Yao, X. Analysis and evaluation of the image preprocessing process of a six–band multispectral camera mounted on an unmanned aerial vehicle for winter wheat monitoring. Sensors 2019, 19, 747. [Google Scholar] [CrossRef] [PubMed] [Green Version]
- Colomina, I.; Molina, P. Unmanned aerial systems for photogrammetry and remote sensing: A review. ISPRS J. Photogramm. Remote Sens. 2014, 92, 79–97. [Google Scholar] [CrossRef] [Green Version]
- Mao, Z.H.; Deng, L.; Sun, J.; Zhang, A.W.; Chen, X.Y.; Zhao, Y. Application of multispectral remote sensing of UAV in corn canopy chlorophyll prediction. Spectrosc. Spectr. Anal. 2018, 38, 2923–2931. (In Chinese) [Google Scholar]
- Jin, S.-Y.; Su, Z.-B.; Xu, Z.-N.; Jia, Y.-J.; Yan, Y.-G.; Jiang, T. Chlorophyll Content Retrieval of Rice Canopy with Multi–spectral Inversion Based on LS–SVR Algorithm. J. Northeast Agric. Univ. 2019, 26, 53–63. [Google Scholar]
- Torressánchez, J.; Lópezgranados, F.; Serrano, N.; Arquero, Q.; Jose, M.S.P. High–Throughput 3–D monitoring of agricultural–tree plantations with unmanned aerial vehicle (UAV) technology. PLoS ONE 2015, 10, e0130479. [Google Scholar]
- Zheng, H.; Cheng, T.; Zhou, M.; Li, D.; Yao, X.; Tian, Y.C.; Cao, W.X.; Zhu, Y. Improved estimation of rice aboveground biomass combining textural and spectral analysis of UAV imagery. Precis. Agric. 2018, 20, 611–619. [Google Scholar] [CrossRef]
- Cheng, T.; Song, R.; Li, D.; Zhou, K.; Zheng, H.; Yao, X.; Tian, Y.C.; Cao, W.X.; Zhu, Y. Spectroscopic estimation of biomass in canopy components of paddy rice using dry matter and chlorophyll indices. Remote Sens. 2017, 9, 319. [Google Scholar] [CrossRef] [Green Version]
- Cinat, P.; Gennaro, S.F.D.; Berton, A.; Matese, A. Comparison of Unsupervised Algorithms for Vineyard Canopy Segmentation from UAV Multispectral Images. Remote Sens. 2019, 11, 1023. [Google Scholar] [CrossRef] [Green Version]
- Ahmed, I.; Eramian, M.; Ovsyannikov, I.; van der Kamp, W.; Nielsen, K.; Duddu, H.S.; Rumali, A.; Shirtliffe, S.; Bett, K. Automatic Detection and Segmentation of Lentil Crop Breeding Plots From Multi–Spectral Images Captured by UAV–Mounted Camera. In Proceedings of the 2019 IEEE Winter Conference on Applications of Computer Vision (WACV), Waikoloa Village, HI, USA, 7–11 January 2019; 2019; pp. 1673–1681. [Google Scholar] [CrossRef]
- Zhou, X.; Zheng, H.B.; Xu, X.Q.; He, J.Y.; Ge, X.K.; Yao, X.; Cheng, T.; Zhu, Y.; Cao, W.X.; Tian, Y.C. Predicting grain yield in rice using multi–temporal vegetation indices from UA V–based multispectral and digital imagery. ISPRS J. Photogramm. Remote Sens. 2017, 130, 246–255. [Google Scholar] [CrossRef]
- Sun, H.; Xing, Z.Z.; Qiao, L.; Long, Y.W.; Gao, D.H.; Li, M.Z.; Qin, Z. Spectral Imaging Detection of Crop Chlorophyll Distribution Based on Optical Saturation Effect Correction. Spectrosc. Spectr. Anal. 2019, 39, 3897–3903. [Google Scholar]
- Wu, Q.; Sun, H.; Li, M.Z.; Song, Y.Y.; Zhang, Y. Research on Maize Multispectral Image Accurate Segmentation and Chlorophyll Index Estimation. Spectrosc. Spectr. Anal. 2015, 35, 178–183. [Google Scholar]
- Yu, K.; Lenz–Wiedemann, V.; Chen, X.; Bareth, G. Estimating leaf chlorophyll of barley at different growth stages using spectral indices to reduce soil background and canopy structure effects. ISPRS J. Photogramm. Remote Sens. 2014, 97, 58–77. [Google Scholar] [CrossRef]
- Gaurav, S.; Babankumar, B.; Mathew, L.N.; Goswami, J.; Choudhury, B.U.; Raju, P.L.N. Chlorophyll estimation using multi–spectral unmanned aerial system based on machine learning techniques. Remote Sens. Appl. Soc. Environ. 2019, 15, 100235. [Google Scholar]
- Haboudane, D.; Tremblay, N.; Miller, J.R.; Vigneault, P. Remote Estimation of Crop Chlorophyll Content Using Spectral Indices Derived From Hyperspectral Data. IEEE Trans. Geosci. Remote Sens. 2018, 46, 423–437. [Google Scholar] [CrossRef]
- Wu, C.; Niu, Z.; Tang, Q.; Huang, W. Estimating chlorophyll content from hyperspectral vegetation indices: Modeling and validation. Agric. For. Meteorol. 2008, 148, 1230–1241. [Google Scholar] [CrossRef]
- Li, F.; Miao, Y.X.; Feng, G.H.; Yuan, F.; Yue, S.C.; Gao, X.W.; Liu, Y.Q.; Liu, B.; Ustin, S.L.; Chen, X.P. Improving estimation of summer maize nitrogen status with red edge–based spectral vegetation indices. Field Crop. Res. 2014, 157, 111–123. [Google Scholar] [CrossRef]
- Roosjen, P.P.; Brede, B.; Suomalainen, J.; Bartholomeus, H.M.; Kooistra, L.; Clevers, J.G. Improved estimation of leaf area index and leaf chlorophyll content of a potato crop using multi–angle spectral data—Potential of unmanned aerial vehicle imagery. Int. J. Appl. Earth Obs. Geoinf. 2018, 66, 14–26. [Google Scholar]
- Torres–Sánchez, J.; López–Granados, F.; Peña, J.M. An automatic object–based method for optimal thresholding in UAV images: Application for vegetation detection in herbaceous crops. Comput. Electron. Agric. 2015, 114, 43–52. [Google Scholar] [CrossRef]
- Jeon, H.Y.; Tian, L.F.; Zhu, H.P. Robust crop and weed segmentation under uncontrolled outdoor illumination. Sensors 2011, 11, 6270–6283. [Google Scholar] [CrossRef]
- Hayat, M.A.; Wu, J.X.; Cao, Y.L. Unsupervised Bayesian learning for rice panicle segmentation with UAV images. Plant Methods 2020, 16, 1. [Google Scholar]
- Hamuda, E.; Glavin, M.; Jones, E. A survey of image processing techniques for plant extraction and segmentation in the field. Comput. Electron. Agric. 2016, 125, 184–199. [Google Scholar] [CrossRef]
- Sang, H.L.; Hyung, I.K.; Nam, I.C. Image segmentation algorithms based on the machine learning of features. Pattern Recognit. Lett. 2010, 31, 2325–2336. [Google Scholar]
- Guo, W.; Rage, U.K.; Ninomiya, S. Illumination invariant segmentation of vegetation for time series wheat images based on decision tree model. Comput. Electron. Agric. 2013, 96, 58–66. [Google Scholar] [CrossRef]
- Zhu, Y.; Huang, C. An Improved Median Filtering Algorithm for Image Noise Reduction. Phys. Procedia 2012, 25, 609–616. [Google Scholar] [CrossRef] [Green Version]
- Verrelst, J.; Rivera, J.P.; Moreno, J.; Campsvalls, G. Gaussian processes uncertainty estimates in experimental Sentinel–2 LAI and leaf chlorophyll content retrieval. ISPRS J. Photogramm. Remote Sens. 2013, 86, 157–167. [Google Scholar] [CrossRef]
- Lv, J.; Yan, Z. Retrieval of chlorophyll content in maize from leaf reflectance spectra using wavelet analysis. International Symposium on Optoelectronic Technology and Application 2014: Imaging Spectroscopy and Telescopes and Large Optics. Int. Soc. Opt. Photonics 2014, 29, 7107–7127. [Google Scholar]
- Fang, L.; Yang, B. UAV Image denoising using adaptive dual–tree discrete wavelet packets based on estimate the distributing of the noise. In Proceedings of the 10th World Congress on Intelligent Control and Automation, Beijing, China, 6–8 July 2012; pp. 4649–4654. [Google Scholar]
- Gao, J.Q.; Wang, B.B.; Wang, Z.Y.; Wang, Y.F.; Kong, F.Z. A wavelet transform–based image segmentation method. Optik 2020, 208, 164123. [Google Scholar]
- Jordan, C.F. Derivation of leaf-area index from quality of light on the forest floor. Ecology 1969, 50, 663–666. [Google Scholar] [CrossRef]
- Rouse, J.W.J.; Haas, R.H.; Schell, J.A.; Deering, D.W. Monitoring Vegetation Systems in the Great Plains with ERTS. NASA Spec. Publ. 1973, 351, 309–317. [Google Scholar]
- Barnes, E.M.; Clarke, T.R.; Richards, S.E.; Colaizzi, P.D.; Haberland, J.; Kostrzewski, M.; Waller, P.M.; Choi, C.Y.; Riley, E.; Thompson, T.L.; et al. Coincident detection of crop water stress, nitrogen status and canopy density using ground–based multispectral data. In Proceedings of the International Conference on Precision Agriculture and Other Resource Management, Bloomington, MN, USA, 16–19 July 2000. [Google Scholar]
- Gitelson, A.A.; Andrés, V.; Verónica, C.; Rundquist, D.C.; Arkebauer, T.J. Remote estima–tion of canopy chlorophyll content in crops. Geophys. Res. Lett. 2005, 32, 93–114. [Google Scholar] [CrossRef] [Green Version]
- Dash, J.; Jeganathan, C.; Atkinson, P.M. The use of MERIS terrestrial chlorophyll index to study spatio–temporal variation in vegetation phenology over India. Remote Sens. Environ. 2010, 114, 1388–1402. [Google Scholar] [CrossRef]
- Kataoka, T.; Kaneko, T.; Okamoto, H.; Hata, S. Crop growth estimation system using machine vision. In Proceedings of the 2003 IEEE/ASME International Conference on Advanced Intelligent Mechatronics (AIM 2003), Kobe, Japan, 20–24 July 2003; Volume 2, pp. 1079–1083. [Google Scholar]
- Huete, A.R. A soil-adjusted vegetation index (SAVI). Remote Sens. Environ. 1988, 25, 295–309. [Google Scholar] [CrossRef]
- Verrelst, J.; Schaepman, M.E.; Koetz, B.; Kneubühler, M. Angular sensitivity analysis of vegetation indices derived from CHRIS/PROBA data. Remote Sens. Environ. 2008, 112, 2341–2353. [Google Scholar] [CrossRef]
- Rondeaux, G.; Steven, M.; Baret, F. Optimization of soil–adjusted vegetation indices. Remote Sens. Environ. 1996, 55, 95–107. [Google Scholar]
- Roujean, J.L.; Breon, F.M. Estimating PAR absorbed by vegetation from bidirectional reflectance measurements. Remote Sens. Environ. 1995, 51, 375–384. [Google Scholar] [CrossRef]
- Chen, J.M. Evaluation of vegetation indices and a modified simple ratio for boreal applications. Can. J. Remote Sens. 1996, 22, 229–242. [Google Scholar] [CrossRef]
- Dash, J.; Curran, P.J. The MERIS terrestrial chlorophyll index. Int. J. Remote Sens. 2004, 25, 5403–5413. [Google Scholar]
- Cao, Q.; Miao, Y.; Feng, G.; Gao, X.; Li, F.; Liu, B.; Yue, S.C.; Cheng, S.S.; Ustin, S.L.; Khosla, R. Active canopy sensing of winter wheat nitrogen status: An evaluation of two sensor systems. Comput. Electron. Agric. 2015, 112, 54–67. [Google Scholar]
- Duan, B.; Liu, Y.; Gong, Y.; Peng, Y.; Wu, X.T.; Zhu, R.S.; Fang, S.H. Remote estimation of rice LAI based on Fourier spectrum texture from UAV image. Plant Methods 2019, 15, 1–12. [Google Scholar]
Figure 1.
Locations and treatments of the experiments in this study.

Figure 2.
Data processing flowchart.

Figure 3.
Box plots of chlorophyll content in maize leaves at three growth stages.

Figure 4.
Grayscale distribution of crops and soil in multispectral images.

Figure 5.
Maize canopy multispectral image segmentation.

Figure 6.
Calculation of maize canopy spectral reflectance by different segmentation methods.

Figure 7.
Calculation of the maize canopy texture features using different segmentation methods.

Figure 8.
Variation trend of maize canopy coverage by different segmentation methods.

Figure 9.
Maize canopy chlorophyll test results.


Table 1.
Multispectral camera parameters.
| Parameter | Parameter Value | Parameter | Parameter Value |
|---|---|---|---|
| Model | Red Edge MX | Perspective | 47.2° |
| Weight | 232 g | Trigger method | Overlap model |
| Size | 8.7 cm × 5.9 cm × 4.54 cm | Bands/nm | 475, 560, 668, 717, and 840 |
| Shutter | Global | Resolution | 1280 × 960 |
Table 2.
Selected multispectral vegetation index.
| Vegetation Index | Formula | Reference |
|---|---|---|
| Ratio vegetation index (RVI) | RVI = NIR/R | Jordan et al. [41] |
| Green ratio vegetation index (RVIGRE) | RVIGRE = NIR/G | Jordan et al. [41] |
| Normalized difference vegetation index (NDVI) | NDVI = (NIR − R)/(NIR + R) | Rouse et al. [27] |
| Normalized difference red edge (NDRE) | NDRE = (NIR − REG)/(NIR + REG) | Barnes et al. [42] |
| Difference vegetation index (DVI) | DVI = NIR − R | Jordan et al. [41] |
| Green difference vegetation index (DVIGRE) | DVIGRE = NIR − G | Jordan et al. [41] |
| Red edge difference vegetation index (DVIRED) | DVIRED = NIR − REG | Jordan et al. [41] |
| Chlorophyll index with red edge (CIredege) | CIredege = (NIR/REG) − 1 | Gitelson et al. [43] |
| Chlorophyll index with green (CIgreen) | CIgreen = (NIR/G) − 1 | Dash et al. [44] |
| Green normalized difference vegetation index (GNDVI) | GNDVI = (NIR − G)/(NIR + GRE) | Kataoka et al. [45] |
| Soil-adjusted vegetation index (SAVI) | SAVI = 1.5(NIR − R)/(NIR + R + 0.5) | Huete et al. [46] |
| Soil-adjusted vegetation index with green (SAVIGRE) | SAVIGRE = 1.5(NIR − G)/(NIR + G + 0.5) | Verrelst et al. [47] |
| Optimized soil-adjusted vegetation index (OSAVI) | OSAVI = (1 + 0.16)(NIR − R)(NIR + R + 0.16) | Rondeaux et al. [48] |
| Optimized soil-adjusted vegetation index with green (OSAVIGRE) | OSAVIGRE = (1 + 0.16)(NIR − G)(NIR + G + 0.16) | Rondeaux et al. [48] |
| Optimized soil-adjusted vegetation index with red edge (OSAVIREG) | OSAVIREG = (1 + 0.16)(NIR − REG)(NIR + REG + 0.16) | Rondeaux et al. [48] |
| Red difference vegetation index (RDVI) | RDVI = (NIR − R)/(NIR + R)^0.5 | Roujean et al. [49] |
| Red difference vegetation index with red edge (RDVIREG) | RDVIREG = (NIR − REG)/(NIR + REG)^0.5 | Roujean et al. [49] |
| Modified simple ratio (MSR) | MSR = (NIR/R − 1)/(NIR/R + 1)^0.5 | Chen et al. [50] |
| Modified simple ratio with red edge (MSRREG) | MSRREG = (NIR/REG − 1)/(NIR/REG + 1)^0.5 | Chen et al. [50] |
| Meris terrestrial chlorophyll index (MTCI) | MTCI = (NIR − REG)/(NIR − R) | Dash et al. [51] |
Table 3.
Chlorophyll content statistics.
| Segmentation Method | Number of Samples | Maximum Value (mg·L−1) | Minimum Value (mg·L−1) | Average Value (mg·L−1) | Standard Deviation (mg·L−1) | |
|---|---|---|---|---|---|---|
| With background | Total sample | 216 | 55.579 | 20.108 | 44.189 | 6.491 |
| Training set | 162 | 55.579 | 20.108 | 44.411 | 6.241 | |
| Validation set | 54 | 53.809 | 24.990 | 43.527 | 7.150 | |
| Threshold segmentation | Total sample | 216 | 55.579 | 20.108 | 44.189 | 6.491 |
| Training set | 162 | 55.579 | 20.108 | 44.407 | 6.152 | |
| Validation set | 54 | 54.572 | 24.990 | 43.539 | 7.377 | |
| ExG index segmentation | Total sample | 216 | 55.579 | 20.108 | 44.189 | 6.491 |
| Training set | 162 | 55.579 | 20.108 | 43.218 | 6.589 | |
| Validation set | 54 | 54.721 | 34.878 | 47.104 | 5.192 | |
| Wavelet segmentation | Total sample | 216 | 55.579 | 20.108 | 44.616 | 6.491 |
| Training set | 162 | 55.579 | 20.108 | 49.030 | 6.245 | |
| Validation set | 54 | 53.809 | 24.989 | 42.911 | 7.025 |
Table 4.
Comparison of root mean square error (RMSE) between different segmentation and original image.
Table 4.
Comparison of root mean square error (RMSE) between different segmentation and original image.
| Segmentation Method | Growth Period | RMSE | ||||
|---|---|---|---|---|---|---|
| B | G | R | Red Edge | NIR | ||
| Threshold segmentation | Seeding stage | 0.021561 | 0.026965 | 0.047821 | 0.057941 | 0.191166 |
| Jointing stage | 0.012054 | 0.02807 | 0.006986 | 0.039441 | 0.06589 | |
| Ear stage | 0.01235 | 0.031656 | 0.008716 | 0.044059 | 0.092574 | |
| ExG index segmentation | Seeding stage | 0.017366 | 0.022469 | 0.043826 | 0.056476 | 0.197419 |
| Jointing stage | 0.023383 | 0.069644 | 0.001567 | 0.106638 | 0.206049 | |
| Ear stage | 0.024629 | 0.059465 | 0.015756 | 0.085482 | 0.179996 | |
| Wavelet segmentation | Seeding stage | 0.014016 | 0.021435 | 0.03936 | 0.053233 | 0.181855 |
| Jointing stage | 0.024369 | 0.068886 | 0.002774 | 0.104372 | 0.197246 | |
| Ear stage | 0.028779 | 0.066664 | 0.019238 | 0.094825 | 0.191218 | |
Table 5.
Diagnostic results of maize canopy chlorophyll with different segmentation methods.
| Segmentation Method | Modeling | Verification | ||||
|---|---|---|---|---|---|---|
| Rc2 | RMSEF | MAE | Rv2 | RMSEP | MAE | |
| With background | 0.5431 | 4.2184 | 3.24 | 0.5894 | 4.6947 | 3.63 |
| Threshold segmentation | 0.6330 | 3.7270 | 2.93 | 0.6302 | 4.5248 | 3.49 |
| ExG index segmentation | 0.6584 | 3.8512 | 3.07 | 0.5601 | 4.6992 | 2.96 |
| Wavelet segmentation | 0.6638 | 3.6211 | 2.89 | 0.6923 | 3.9067 | 3.19 |
© 2020 by the authors. Licensee MDPI, Basel, Switzerland. This article is an open access article distributed under the terms and conditions of the Creative Commons Attribution (CC BY) license (http://creativecommons.org/licenses/by/4.0/).
Share and Cite
MDPI and ACS Style
Qiao, L.; Gao, D.; Zhang, J.; Li, M.; Sun, H.; Ma, J. Dynamic Influence Elimination and Chlorophyll Content Diagnosis of Maize Using UAV Spectral Imagery. Remote Sens. 2020, 12, 2650. https://0-doi-org.brum.beds.ac.uk/10.3390/rs12162650
AMA Style
Qiao L, Gao D, Zhang J, Li M, Sun H, Ma J. Dynamic Influence Elimination and Chlorophyll Content Diagnosis of Maize Using UAV Spectral Imagery. Remote Sensing. 2020; 12(16):2650. https://0-doi-org.brum.beds.ac.uk/10.3390/rs12162650
Chicago/Turabian StyleQiao, Lang, Dehua Gao, Junyi Zhang, Minzan Li, Hong Sun, and Junyong Ma. 2020. "Dynamic Influence Elimination and Chlorophyll Content Diagnosis of Maize Using UAV Spectral Imagery" Remote Sensing 12, no. 16: 2650. https://0-doi-org.brum.beds.ac.uk/10.3390/rs12162650
Note that from the first issue of 2016, this journal uses article numbers instead of page numbers. See further details here.