Mapping Tea Plantations from VHR Images Using OBIA and Convolutional Neural Networks


Key Laboratory of Spatial Data Mining and Information Sharing of Ministry of Education, National & Local Joint Engineering Research Centre of Satellite Geospatial Information Technology, Academy of Digital China (Fujian), Fuzhou University, Fuzhou 350108, China
*
Author to whom correspondence should be addressed.
Remote Sens. 2020, 12(18), 2935; https://0-doi-org.brum.beds.ac.uk/10.3390/rs12182935
Submission received: 14 August 2020
/
Revised: 5 September 2020
/
Accepted: 7 September 2020
/
Published: 10 September 2020
(This article belongs to the Special Issue Operational Land Cover/Land Use Mapping)
Abstract
:Tea is an important economic plant, which is widely cultivated in many countries, particularly in China. Accurately mapping tea plantations is crucial in the operations, management, and supervision of the growth and development of the tea industry. We propose an object-based convolutional neural network (CNN) to extract tea plantations from very high resolution remote sensing images. Image segmentation was performed to obtain image objects, while a fine-tuned CNN model was used to extract deep image features. We conducted feature selection based on the Gini index to reduce the dimensionality of deep features, and the selected features were then used for classifying tea objects via a random forest. The proposed method was first applied to Google Earth images and then transferred to GF-2 satellite images. We compared the proposed classification with existing methods: Object-based classification using random forest, Mask R-CNN, and object-based CNN without fine-tuning. The results show the proposed method achieved a higher classification accuracy than other methods and produced smaller over- and under-classification geometric errors than Mask R-CNN in terms of shape integrity and boundary consistency. The proposed approach, trained using Google Earth images, achieved comparable results when transferring to the classification of tea objects from GF-2 images. We conclude that the proposed method is effective for mapping tea plantations using very high-resolution remote sensing images even with limited training samples and has huge potential for mapping tea plantations in large areas.

1. Introduction
Tea is an important economic crop and has been widely planted in the southern part of China [1]. According to the China Tea Industry Yearbook, tea plantations in China reached 2.79 million hectares in 2015, accounting for 61.7% of the global tea planting area [2]. China is the world’s largest tea producer, and the cultivation and production of tea have played an important role in China’s agricultural economy and agricultural development [3]. Obtaining detailed spatial information regarding tea planting would be extremely useful in developing and implementing effective agricultural practices for tea planting and management [4].
Remote sensing images have been widely used to extract crop information [5]. In recent years, remote sensing images have been utilized in the detection and analysis of tea plantations [6,7,8,9]. Medium- and low-resolution images (e.g., Landsat, MODIS, and Sentinel-2) have been the most commonly used remote sensing satellites for the extraction of the spatial distribution of tea plantations [10,11]. For example, Ma et al. [12] used a time series of MODIS and Landsat data to derive the planting areas of tea, based on a number of selected vegetation indices and phenological features. Combining various features and random forest algorithms, Zhu et al. [2] investigated the extraction of tea plantations using multi-temporal Sentinel-2 images and achieved successful results. These studies show the effectiveness of multi-temporal medium-resolution images in the extraction of tea plantations. However, the mapping of tea plantations with fine spatial details remains extremely challenging due to the high spectral similarity with non-tea plants.
Very high resolution (VHR) remote sensing images, acquired from a variety of sensors (e.g., Worldview, GeoEye, Pleaides, and GF-2), have been effectively used to map tea plantations. Xu et al. [13] and Dihkan et al. [14] used VHR images to extract tea plantations using traditional machine learning methods (e.g., decision trees, support vector machines, and random forests). Their research shows the effectiveness of using VHR images to describe the textures details of tea plantations. However, the improvement in image resolution results in enhancing the internal heterogeneity of the same feature, which restricts the extraction accuracy of tea plantations [15].
Studies have shown that object-based image analysis (OBIA) is more suitable for processing and analyzing high-resolution images than pixel-based methods, given its ability to deal with problems of spectral confusion and mixed pixels and extract features, such as the texture and shape information of images [16,17]. Moreover, OBIA has evident strength in dealing with multi-source data, e.g., derived from Digital Terrain Maps (DTMs) and other thematic maps, and improves classification tasks, particularly in the mapping of heterogeneous landscapes [18]. For example, Xu et al. [19] identified tea plantations in GF-1 images using a multi-level rule classification method based on OBIA and multi-source data fusion. Zhuang et al. [20] used Worldview-2 images to accurately identify tea crops in subtropical regions based on OBIA and machine learning methods. The results were compared with pixel-based methods, which showed that OBIA has higher classification accuracy. While the application of OBIA provides a new solution for extracting tea planting areas using high-resolution images, the classification of complex heterogeneous land cover (such as tea plantation areas) continues to be challenging. Most of existing studies on OBIA use handcrafted features, referring to commonly used low-level image features modeling information regarding color, texture and geometry [21]. Thus, the use of more advanced methods and functions is necessary to improve the classification accuracy of crops on VHR images.
In recent years, deep learning has revolutionized the extraction of thematic information from remote sensing images due to its powerful abstraction of high-level features regarding the semantics of images [22]. Previous studies have found that deep learning can be used in a variety of application [23,24,25]. A convolutional neural network (CNN) is a popular deep learning model designed for image classification tasks, which does not require prior knowledge. It can use a single network with multiple layers to identify features and train classifiers and employs parameters according to the problem and the required accuracy. The use of CNN models for feature extraction can be grouped into two categories: (1) Fine-tuning a pre-trained CNN, and (2) training a CNN from scratch [26]. Usually, it is difficult to collect a large number of samples to train a CNN model from scratch. An alternative is to use a CNN model pre-trained on a large-scale dataset, e.g., ImageNet, as a feature extractor. The pre-trained model can be further fine-tuned with a relatively small-scale dataset, e.g., derived from remote sensing images, via transfer learning [27,28,29,30]. For example, Rezaee et al. [31] investigated the use of CNNs to derive deep features for wetland extraction from optical remote sensing images. Zhou et al. [29] used low-dimensional convolutional neural networks to extract depth features for high-resolution remote sensing image retrieval, achieving state-of-the-art performance. Most studies, however, use CNN models to derive features using image patches, leading to vague boundaries for the extracted thematic information. Deep features have mostly been applied to image scene classification [32] and target detection [33]. Extending the application potential of CNN to agricultural plantations would be valuable, particularly for tea plantation extraction in VHR images.
Combining the concept of OBIA with CNN to form an object-based CNN has been investigated in recent studies [34,35,36]. Object-based CNN has been shown to effectively extract high-level image features, maintain clear boundaries of image objects, and improve the extraction accuracy of tea plantations. Based on the findings and recommendations of previous research, we used an object-based CNN for the extraction of tea plantations using VHR remote sensing images. An object-based CNN is constructed based on a fine-tuned CNN model to extract high-level features with respect to image objects, and instead of using a softmax function, we employed random forest classifiers for object-based tea classification. The use of high-resolution images has become a primary option for thematic information extraction, but its high costs can be restrictive, only for small areas. Google Earth (GE) provides a large number of free images with extremely high resolution. Numerous studies have demonstrated the potential of GE images in a variety of remote sensing applications [37,38,39]. In this study, the object-based CNN model trained with GE images is transferred to GF-2 VHR satellite images to obtain the spatial distribution information of tea plantations, providing a new solution for the extraction of tea plantations. Based upon the tea planting areas extracted from satellite images, the spatial distribution of tea plantations is studied considering terrain factor.
The novelty of this study is as follows: (1) An object-based CNN strategy is developed for extracting tea plantations from VHR remote sensing images. This approach enables the extraction of high-level semantic features of image objects while maintaining clear boundaries of image objects. (2) The transferability of the proposed object-based CNN model pre-trained is explored using widely accessible GE images into GF-2 VHR satellite images for tea mapping in a large area. (3) The spatial distribution of tea plantations on GF-2 is analyzed based on Digital Elevation Model (DEM) and slope data.
The rest of this paper is organized as follows. Section 2 describes the study areas and datasets. Section 3 illustrates the proposed method for the extraction of tea plantations from VHR remote sensing images. Section 4 presents the experimental results. Section 5 provides the discussion and Section 6 provides the conclusion.
2. Study Area and Data
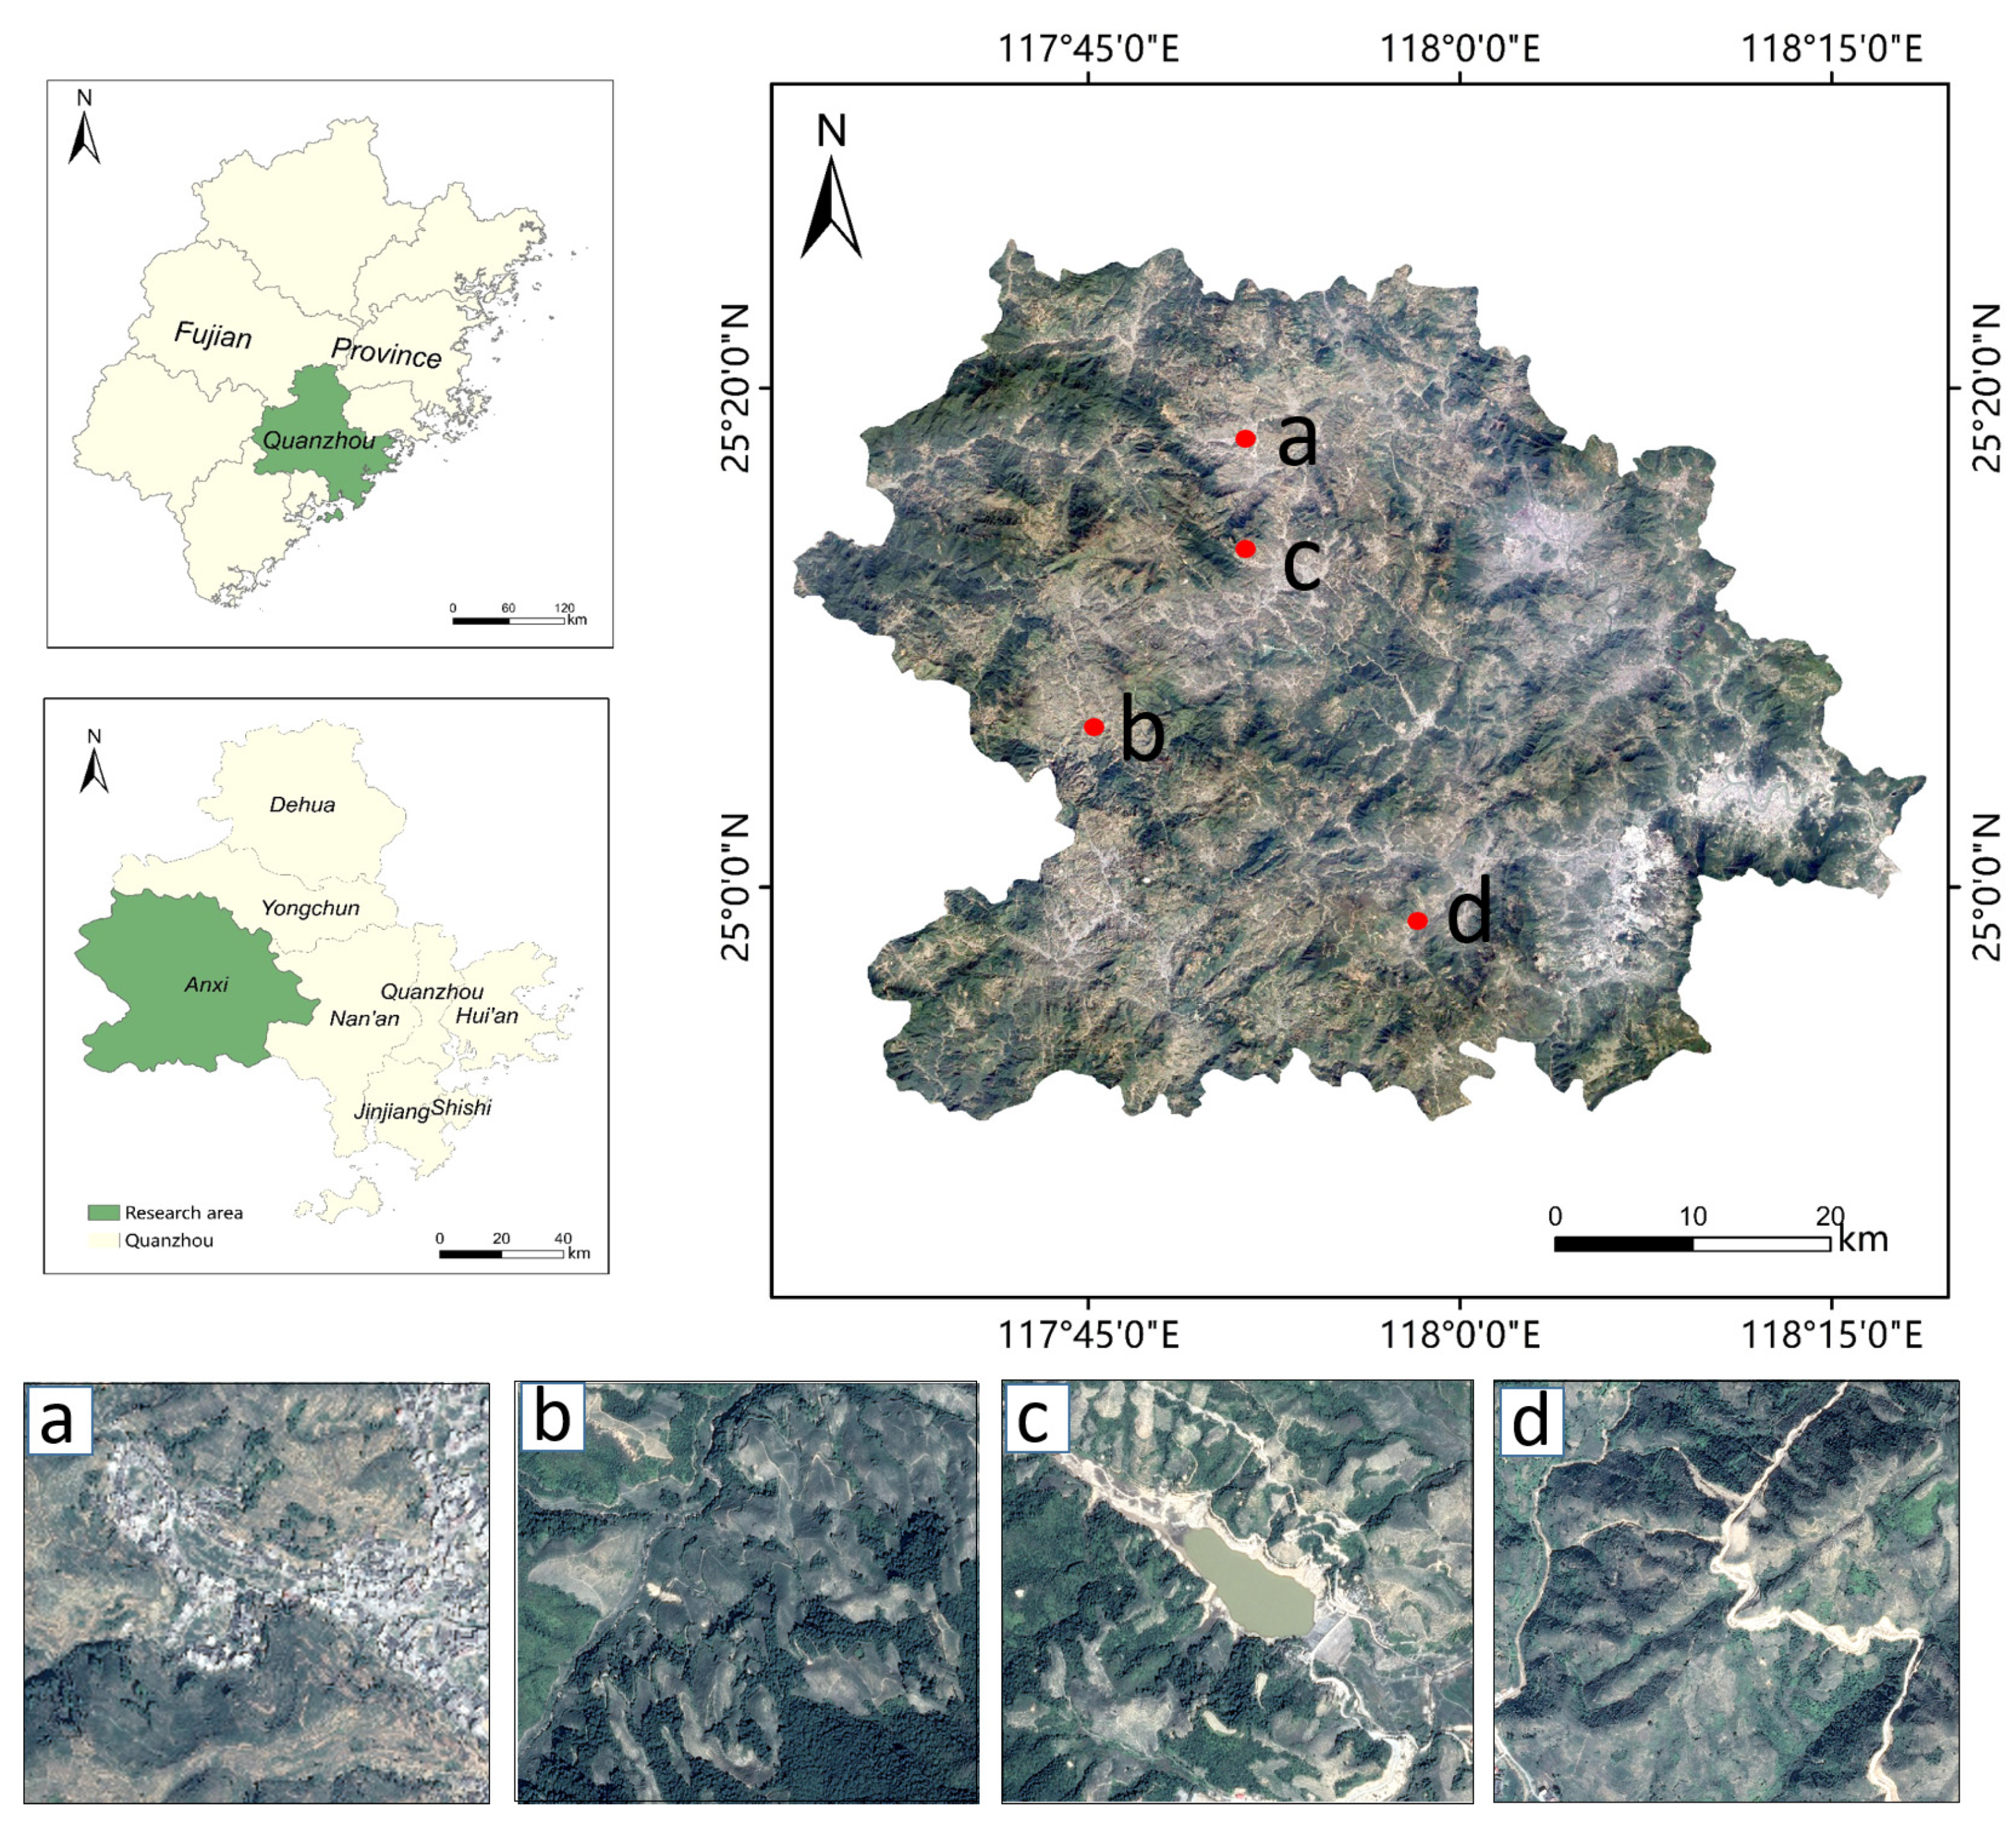
The study area is located in Anxi County, Fujian Province, China. Anxi is famous for tea planting in Fujian and even for the entire country, and is where China’s oolong and Tieguanyin tea originates. Anxi ranks as the first among major tea-producing counties [19]. Figure 1 provides an overview of the study area. The region has a total area of 3057.28 km2 and is dominated by hills and mountains, with valleys and basins distributed in between. The terrain slopes from the northwest to the southeast. The region has a climate characterized as warm and humid, with sufficient sunlight and belongs to the south subtropical maritime monsoon climate with an average annual temperature of 19°/21°.
Two mosaics of VHR images (i.e., Google Earth (GE) and GaoFen (GF-2)), covering the entire Anxi county, were acquired for the study. The GE images have three bands (i.e., red, green, and blue bands) and were resampled to a spatial resolution of 0.5 m, following the practice used in [40,41,42]. The images were acquired in November 2017 when the spectral and textural features of tea plants are pronounced after trimming, while other crops, e.g., rice, are also out of the growing season. The GF-2 images include four multispectral bands (MSS) with a spatial resolution of 4 m and a panchromatic band (PAN) with a 1 m resolution. Ten GF-2 images were used to cover the entire study area, including six scenes taken on 22 January 2015, and four scenes obtained on 6 February 2015. We orthorectified the MSS and PAN images and used the Gram-Schmidt pan sharpening (GS) method in ENVI to obtain a multispectral image with a 1m resolution. Figure 1 shows four representative tea plantations. For each dataset, we used testing areas with a size of pixels. The ground truth was manually digitalized using study images. To train the deep learning model, we selected 4800 image objects from the segmented images as training samples, which were divided into training (70%) and testing (30%) datasets.
In addition, we obtained DEM data with a spatial resolution of 30 m from the NASA Space Shuttle Radar Terrain Mission (SRTM). The data were used to calculate the slope. The DEM and slope data were then used to analyze the spatial distribution of tea plantations.
3. Methods
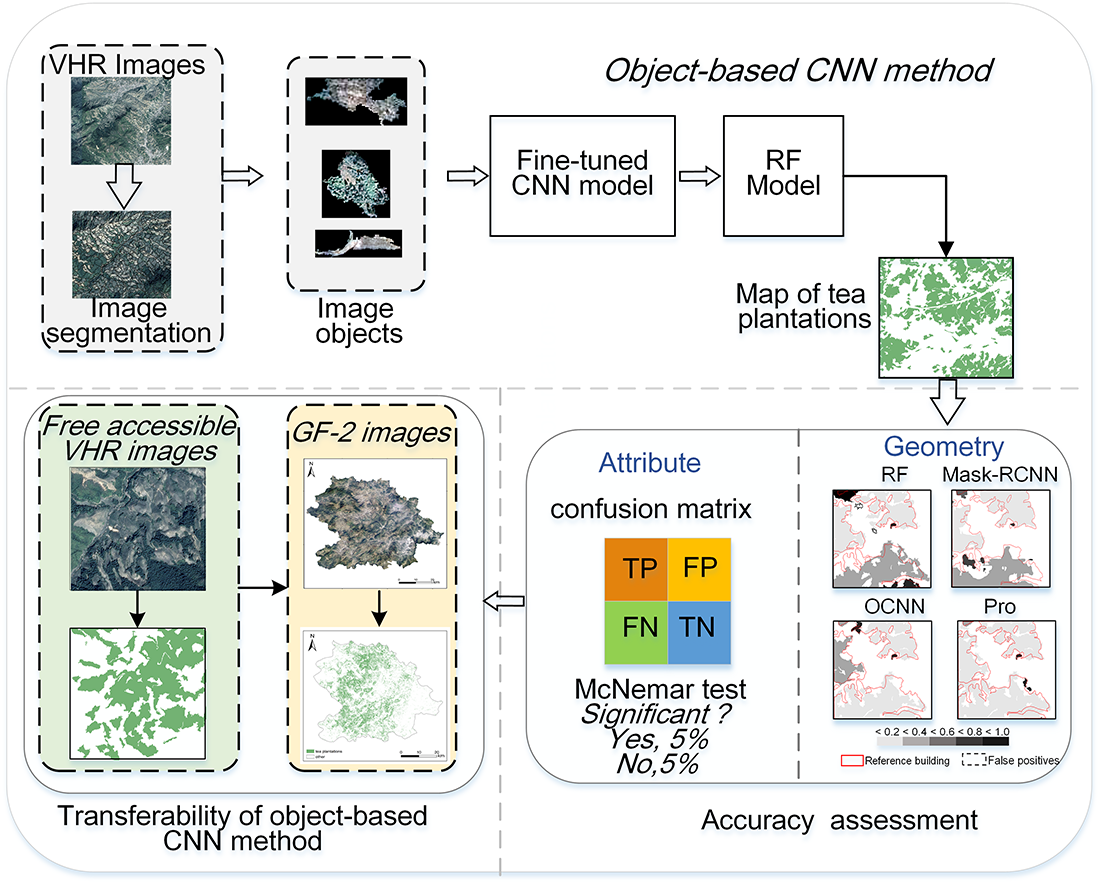
In this study, we propose an object-based CNN for the extraction of tea plantations from VHR remote sensing images. A VHR image was preliminarily segmented to obtain image objects. A fine-tuned Resnet50 was used as the basic model to extract deep features with respect to these image objects. To reduce the dimensionality of the extracted deep features, we conducted a feature selection using the Gini index. We then used a random forest classifier to group the image objects based on the selected features for tea mapping. The workflow of the proposed method is presented in Figure 2.
3.1. Feature Extraction by Object-Based CNN Method
We extracted high-level semantic features of tea plantation at the image object’s level. This allows boundary information derived from image segmentation to be retained during the classification of tea plantations. Multi-resolution segmentation algorithm was employed [43], implemented in the eCognition software, to generate the image objects. For each image object, we obtained the minimum directional bounding box, corresponding to an image tile. In previous studies, image segmentation required zero paddings, and good results were achieved by resizing the images to keep their aspect ratio fixed [44]. In this study, we adopted this step and applied a CNN model to extract the deep features of each image tile.
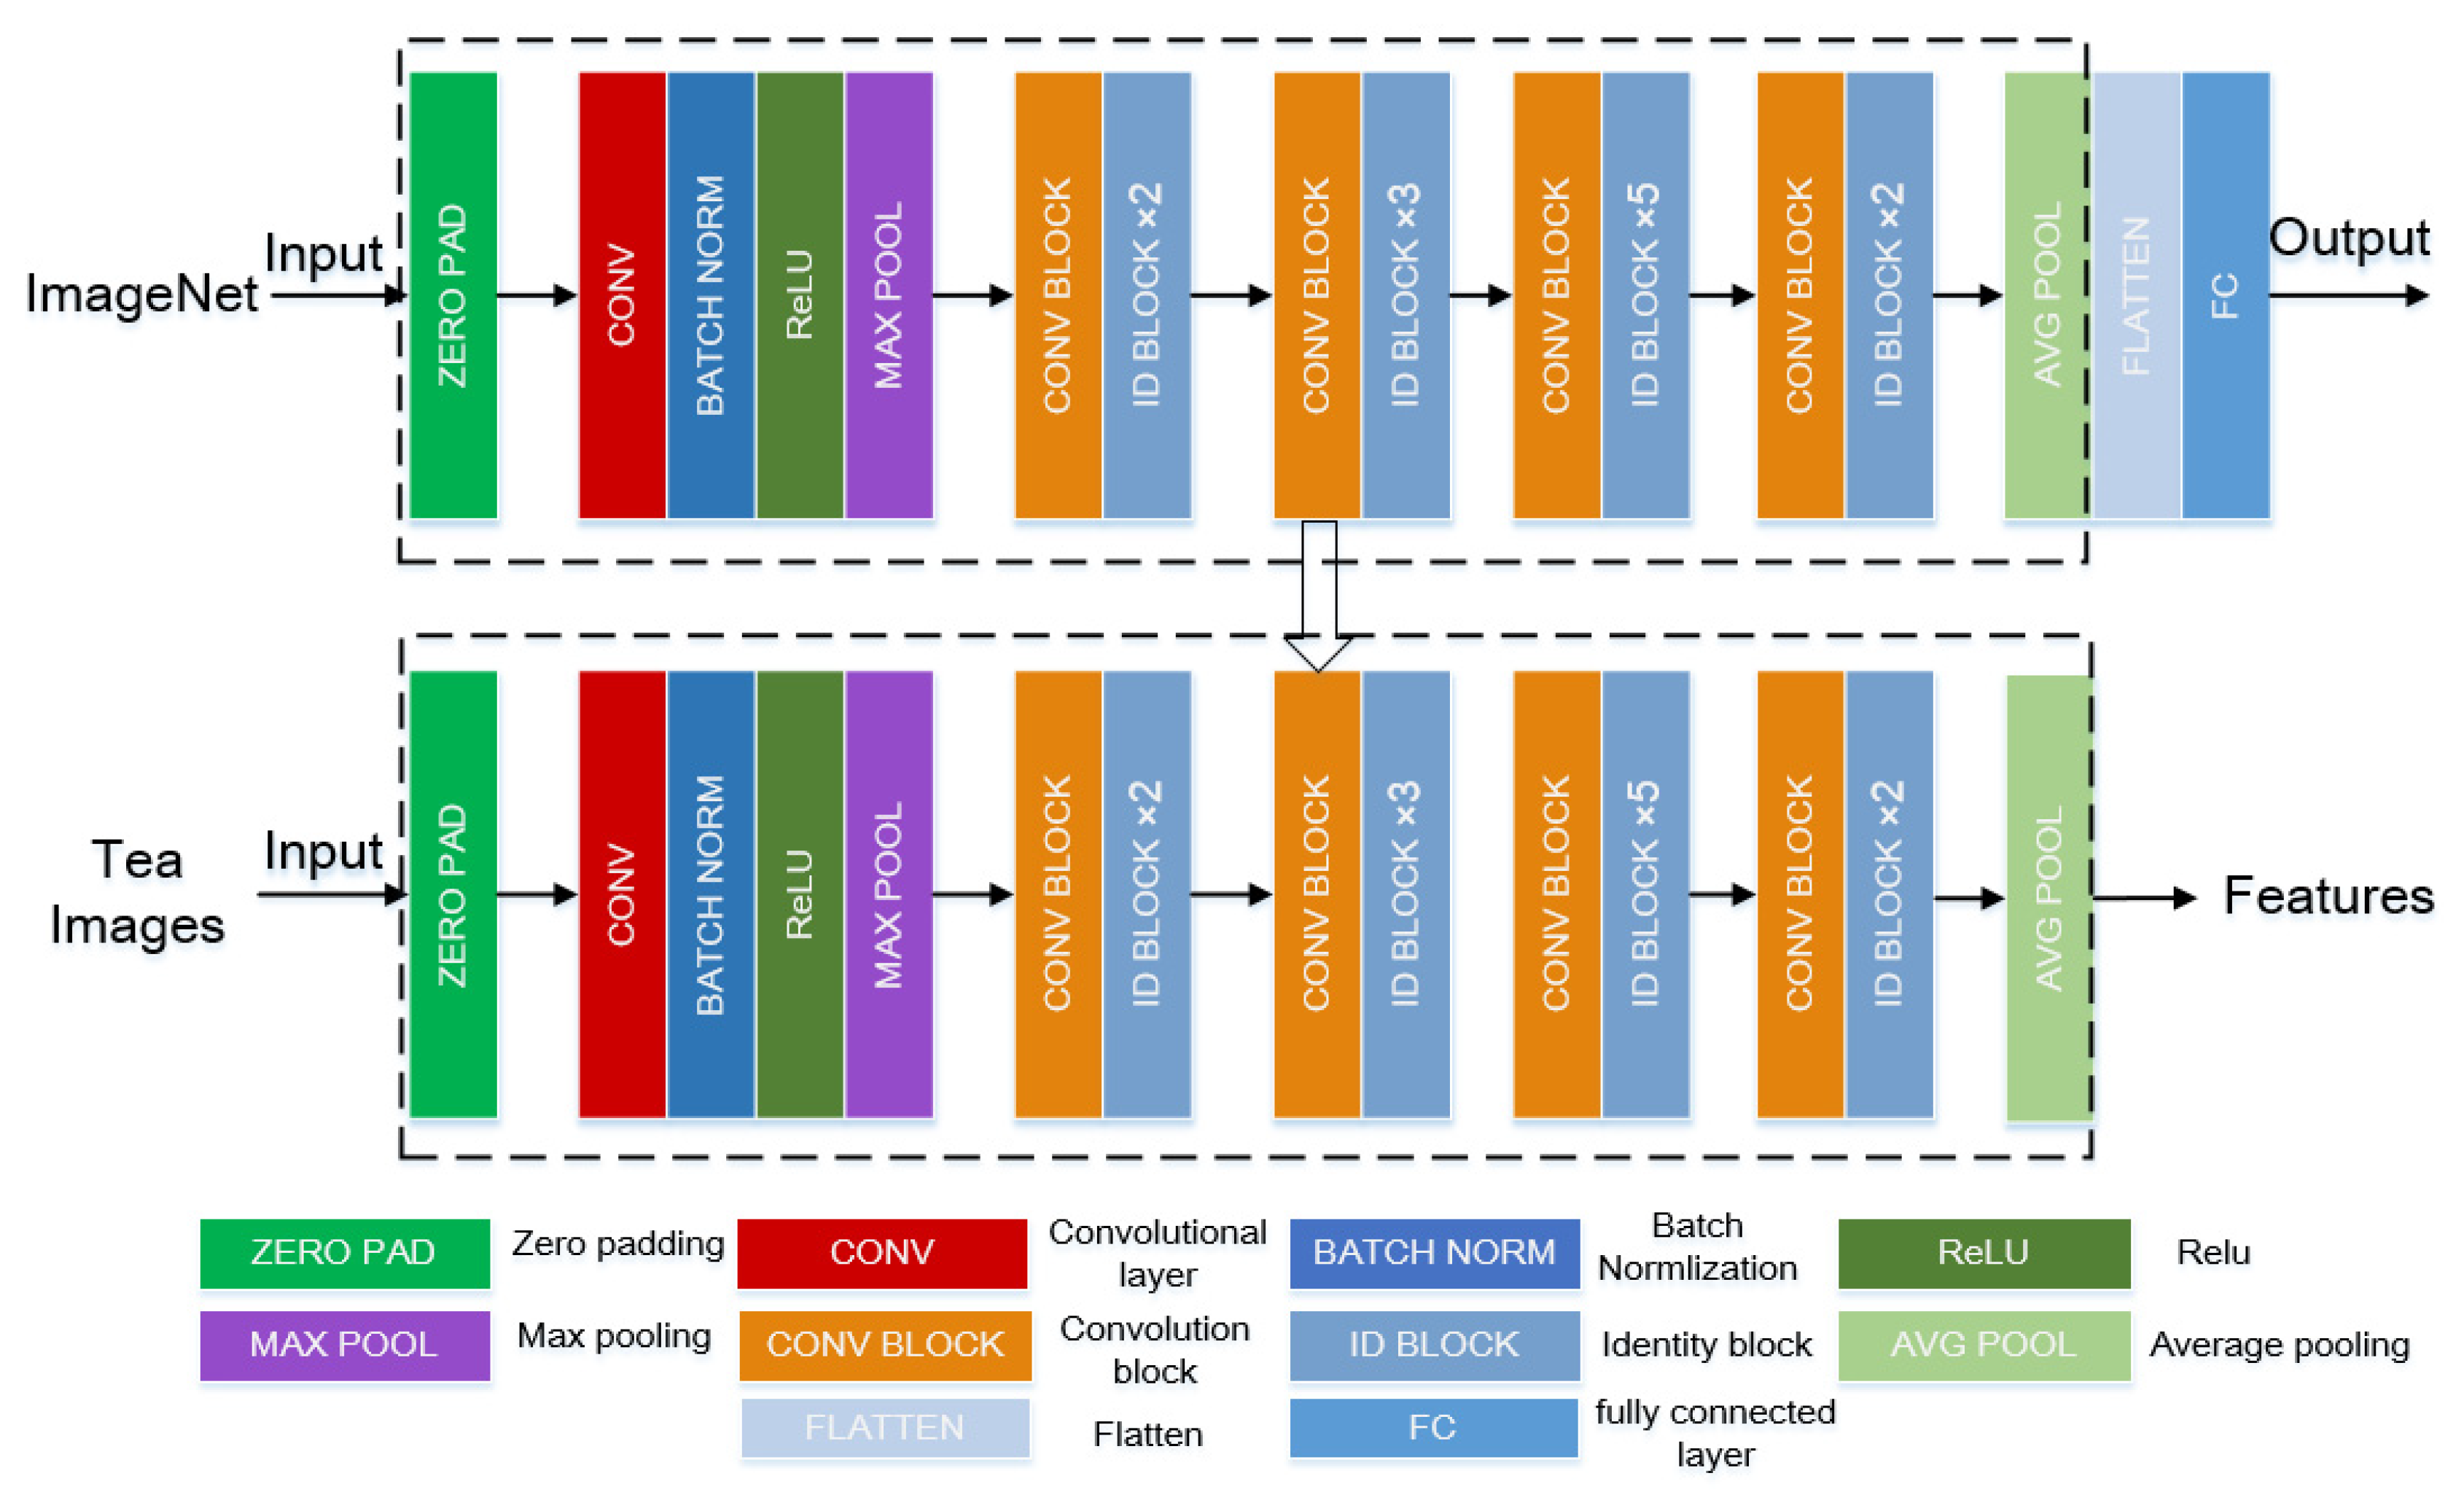
Since collecting a large number of ground-truth remote sensing images would be tedious, we used a CNN model, pre-trained on a large-scale dataset (i.e., ImageNet), as a basic network for feature extraction [45]. To further improve the performance of the pre-trained CNN, we fine-tuned the CNN using samples to adjust the parameters for classification. Resnet50 was used as the basic CNN model for feature extraction. When the number of network layers increases, traditional neural network models (e.g., AlexNet, VGG-16, GoogleNet) often lead to network degradation, difficulties in convergence, and the disappearance of gradients during back-propagation [46]. To deal with these problems, He et al. [47] introduced a residual structure to preserve the original information and reduce network parameters, which can reach a depth of dozens (or even hundreds) of layers when designing a neural network model. Figure 3 shows the framework of Resnet50. The framework consists of identity and convolution blocks stacked in modules. The stacked convolution stratum is composed of 49 layers plus a fully connected layer, which forms a 50-layer residual neural network. Numerous studies have used the convolutional layer as high-level features layers and were able to achieve successful results [29,34,48,49]. Adopting the methodology of previous research, the CNN model used in this paper produces images features using the last convolution layer of the model.
3.2. Feature Selection by Gini Index and Classification
Random forest is a widely used machine learning algorithm, particularly for classification tasks [50,51,52]. It can also be used for feature selection by evaluating the importance of each feature variable for a specific classification task. The commonly used method for feature selection using random forest is based on the Gini index, calculated using the importance score of each feature in the feature subset at each node of the decision tree [53]. Let S be a dataset with n classes, the Gini index [54] can be defined as
where refers to the probability of the i-th sample of the dataset. When the random forest uses a certain feature to divide the node, the set S is divided into m subsets (), and the split Gini index is:
where is the number of samples at child node j, and S is the number of samples at the node. The Gini importance is obtained by subtracting the value from the Gini index of the node before splitting. The larger the value, the higher the degree of importance, and the greater the impact on classification results.
Random forest was used for the classification of image objects into tea or non-tea classes, based on the selected deep features using the Gini index. Traditionally, a simple, fully connected perceptron with a softmax layer is used at the end of a CNN for classification. However, this component requires the training of a large number of parameters, which can easily overfit and result in poor robustness, particularly in cases with insufficient samples [55,56]. In this study, the random forest is used to replace the softmax layer for classifying deep features. As a classification prediction model, the random forest can effectively avoid overfitting, reduce the generalization error of classification, and is more suitable for small sample datasets.
3.3. Performance Evaluation and Accuracy Assessment
To evaluate the performance of the proposed method, we first compared our method with a conventional machine learning method, which uses the random forest for classification in the setting of object-based image analysis (labeled as RF). A number of handcrafted object features were selected based on spectral and textural information (Table 1).We also compared our method with Mask R-CNN. Mask R-CNN inputs the feature map of Region of interest (ROI) Align to the mask branches and uses fully convolutional networks (FCN) to classify the pixels in the target frame individually. To maintain consistency, Resnet50, trained on a large dataset, was selected as the basic CNN network. Existing studies have shown that image features directly obtained from a pre-trained CNN can be well transferred to various applications [56,57]. Thus, we compared our proposed approach, which utilizes an object-based CNN with fine-tuning procedure, against the OCNN, which is also an object-based CNN but does not include fine-tuning operations.
To evaluate the geometric accuracy of extracted tea objects, we conducted an object-based accuracy assessment based on a set of weighted geometric indices to test the classification performance of the proposed method [58]. Suppose is a classified image object, and is a set of reference objects (), where m is the number of classification objects of the specified class in the classification graph, and r refers to the number of overlapping reference objects. Let and be the areas of and , and be their overlapping area. A weight w, corresponding to the ratio of the overlapping area to all reference objects , can then be derived, . The over-classification error and under-classification error are thus obtained by,
Based on the calculated and , the total error can be defined as:
Furthermore, we can use , , and to obtain the corresponding global errors(referred to as GOC, GUC, and GTC) of the classification results,
4. Results
4.1. Construction of Object-Based CNN Method
Using the multi-resolution segmentation algorithm, the image segmentation of the GE dataset was implemented in eCognition to obtain image objects. The scale was set to 70, and the shape and tightness parameters were set by default, which was determined by trial and error. For each image object, the minimum bounding box was determined, corresponding to an image patch, and was resized to pixels. We then fine-tuned the CNN model to extract deep image features in the image patches. The setting of the fine-tuning parameters was set to batch size four, and the learning rate (LR) was set to 0.001. The extracted deep features of the image objects were then used for tea mapping via a random forest classifier, for which the number of decision trees was set to 100 [61].
To analyze the effect of scale values on the accuracy of tea object classification, we changed the settings to different scale values ranging from 30 to 100, with a step of 10. Figure 4 shows the obtained classification accuracies, and the corresponding geometric errors via the GOC, GUC, and GTC error indices. All the obtained accuracies are greater than 90% except for the one with a scale of 100. In terms of geometric errors, the generated classifications have similar GTC. A smaller scale value produces more fragmented segments, leading to a higher GOC error. In contrast, GUC error has the reverse effect. For the following experiments, the scale value was set to 70.
4.2. Feature Selection Based upon Gini Index
We used the fine-tuned object-based CNN to extract deep features with respect to image objects. There were 2048 features for each image object. To reduce the number of object features for classification, we conducted feature selection using the Gini index. Figure 5 shows the effect of the number of selected features on the classification accuracy of tea mapping using the object-based CNN with and without fine-tuning. The results show the accuracy produced by the CNN model with fine-tuning is higher than by the model without fine-tuning, corresponding to 94% and 90%, respectively. More specifically, we found that the classification accuracy improves with the increase in the number of features, and then gently converges after the number of features reaches 64. At the beginning stage, the fine-tuned CNN model improves the accuracy more evident than the model without fine-tuning. Noticeably, the fine-tuned model further improves the accuracy when the model without fine-tuning reaching convergence for instance by giving around 32 features. For this study, we selected 64 features to classify tea image objects.
4.3. Performance Evaluation and Accuracy Assessment
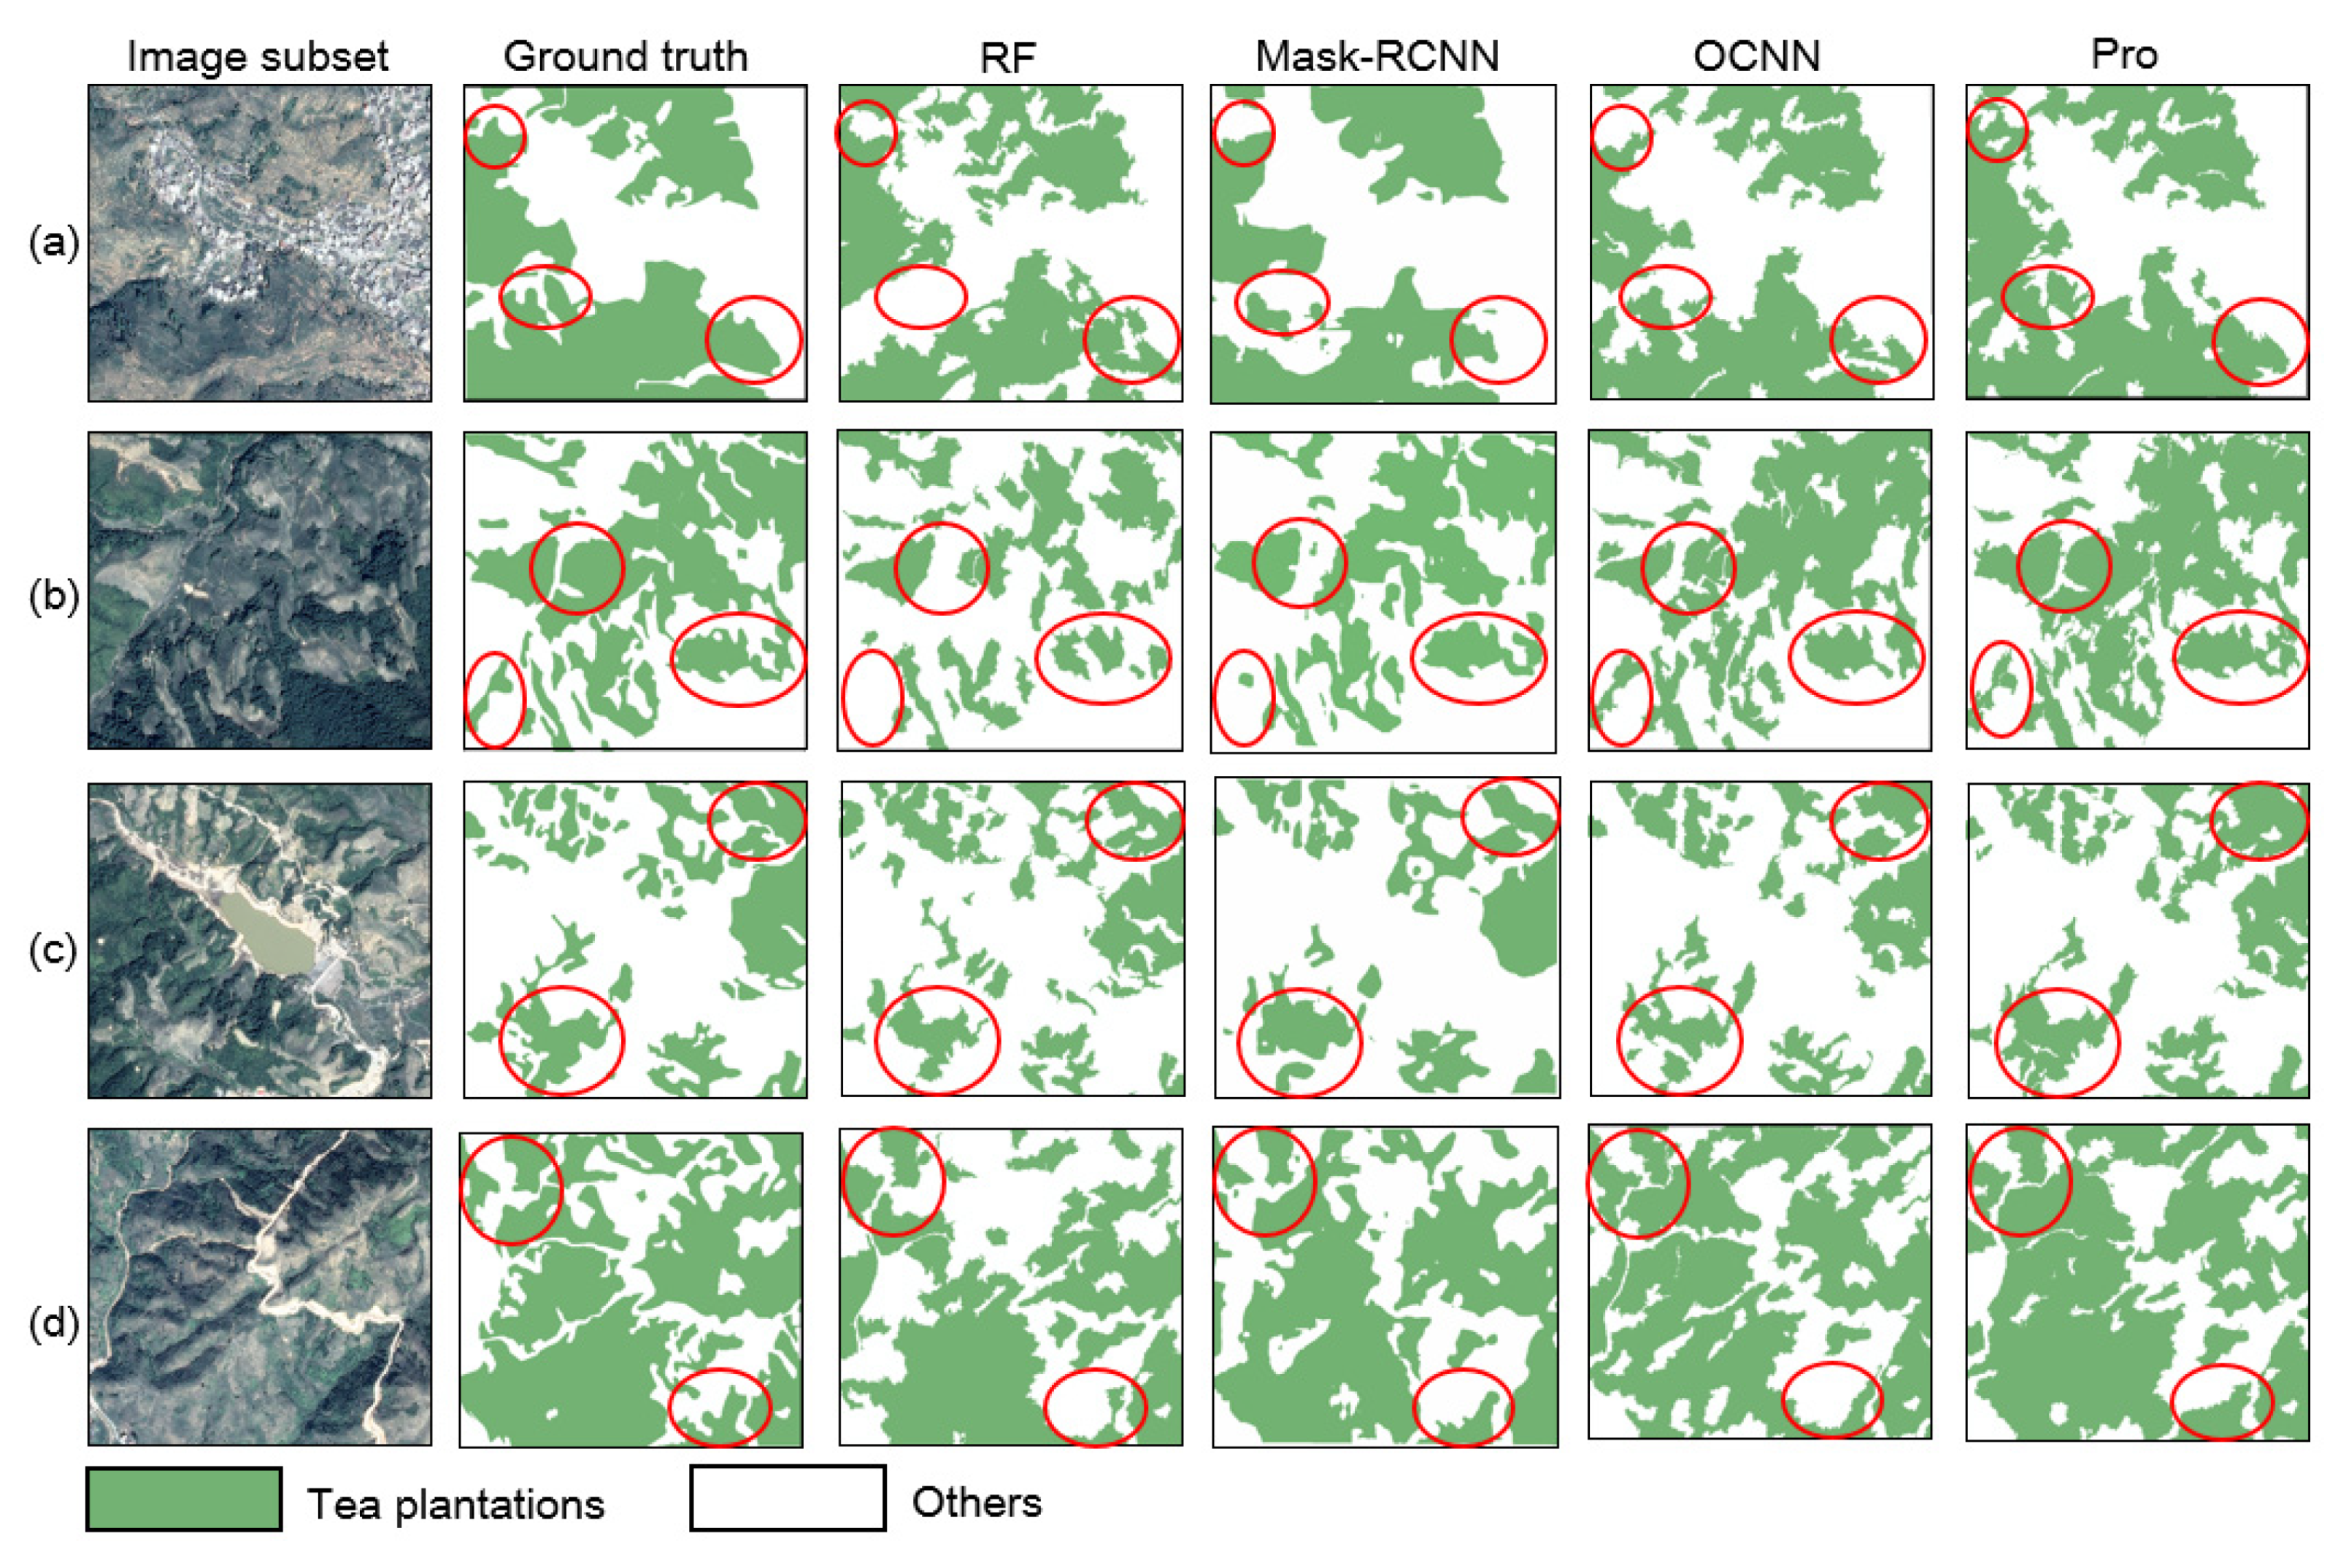
We applied the four classification methods (i.e., RF, Mask R-CNN, and OCNN) and our proposed approach to map tea plantations on the four datasets (Figure 6). For the Mask R-CNN model, we collected 6000 samples, which were randomly partitioned into training (70%) and testing (30%) datasets. For the parameter setting of the Mask R-CNN model, the learning rate was set to 0.001, and the batch size was set to 4. Figure 6 shows the classification results of the four different methods. Through visual inspection, the results obtained from the proposed approach were found to have the highest agreement with the ground truth. Due to the spectral similarity between tea plantation and other vegetation types, the results produced by the RF method yielded more false negatives and false positives compared to other methods, particularly on Dataset b, where the tea plantations were extracted with evident fragmented objects. The results produced by the Mask R-CNN are similar to the ground truth in terms of geometric agreement. However, errors were still visibly present along the edges and boundaries of classified objects. Both the proposed and OCNN methods were able to obtain results with high shape integrity. The proposed approach produced finer spatial detail results, indicating that the deep features extracted by a fine-tuned CNN model are more suitable for characterizing tea plantations than by a CNN model without fine-tuning.
To evaluate the geometric accuracy of the extracted tea plantations, we conducted an object-based accuracy assessment using three global error indices (i.e., GOC, GUC, and GTC). As shown in (Table 2), the proposed method produced the smallest GUC and GTC errors for all the four regions. While the difference of GTC between the proposed and the OCNN methods is slight, referring to 0.18 and 0.21 for the region c, we observed that the GOC and GUC of the results obtained by the proposed method are also smaller than that of the OCNN method. More specifically, the proposed approach produced slightly larger GOC errors in three (b, c, and d) of the four regions compared to the other three. In terms of GUC, the proposed method yielded significantly lower GUC in all four regions than the three other methods. For instance, the GUC error of the RF method is as high as 0.52 in region b. In terms of the total global error, the RF method produced the largest GTC error of 0.40 in region b. In contrast, the proposed method had GTC errors below 0.2 in all four regions, which indicates satisfied object-level classification, a lower degree of fragmentation, and the ability to accurately distinguish tea plantations from complex areas.
Figure 7 shows the distribution of the total error index of tea objects extracted using RF, Mask R-CNN, OCNN, and the proposed method. The results show the RF and OCNN methods yielded more false negatives and false positives. The total error of the proposed method was less than 0.2 as a whole, and the overall accuracy was found to be very high.
To further verify the applicability of our proposed model in tea plantation extraction, we compared the classification accuracy of the three object-based methods using different sample sizes. We changed the size of the training data from 10%–80% at a 10% interval and used the remaining samples as test data (see Figure 8). In all three schemes, as the sample size increases, the classification accuracy also increased. When the training sample size is increased from 10% to 50%, the accuracy increases significantly. When the sample size reaches more than 50%, the classification accuracy becomes stable. Comparing the three schemes, we found that the classification accuracies of OCNN and our proposed approach are significantly higher than that of the RF, indicating that deep convolution features are superior to handcrafted features. In addition, the fine-tuned scheme (Pro) obtained higher accuracy compared with the OCNN. Even when only 10% of the samples were used to train the sample, the fine-tuned CNN model was able to achieve an average accuracy of 91.21%.
4.4. The Transferability of Object-Based CNN Method
Transfer learning builds upon learned knowledge from one dataset to improve learning in another dataset. To evaluate the transferability of the proposed method from GE images to GF-2 images, we designed three groups of experiments to map the tea plantations on GF-2 images. In the first experiment (FT_GF2), the pre-trained resnet50 model was fine-tuned using the GF-2 dataset and was then used for image extraction. In the second experiment (FT_GE), the pre-trained resnet50 model trained on GE images was transferred to obtain the classification of tea plantations from GF-2 images. In the third set of experiments (No_FT), the pre-trained resnet50 model was directly used to extract tea plantation information. All experiments maintained the same parameters and experimental settings. Figure 9 presents the extraction results using the three methods in Region B of Anxi County. As shown in the figure, the results from all three methods are consistent with the ground truth. The results were then assessed using an object-oriented evaluation method and were used to calculate their global error index GTC. The GTC of FT_GF2 is 0.18, the GTC of FT_GE is 0.19, and the GTC of FT_GE is 0.21. The GTC values of FT_GE and FT_GF2 are similar, both of which are less than 0.2. This suggests that the model trained on GE images can be directly used for GF-2 images.
We then obtained the spatial distribution map using the three different methods (see Figure 10). Moreover, the spatial distribution results from the three approaches are visibly similar. The north and southwest regions are characterized as having high-density tea plantations, while the southeast has fewer tea plantation clusters. This is because the southeastern part of Anxi is mainly residential, the terrain is gentle, and the flat land is mainly used for other crops. In terms of details, the FT_GE and the FT_GF2 methodes yielded considerably better results than the NO_FT, and the results of the NO_FT method produced more false negatives and false positives.
We collected 600 samples through visual interpretation and plantation surveys to evaluate the classification results via the confusion matrix (Table 3). The FT_GF2 method obtained an overall accuracy (OA) of 0.86, a producer accuracy (PA) of 0.86, and a user accuracy (UA) of 0.87. The FT_GE method obtained an OA of 0.85, PA of 0.86, and UA of 0.84. In comparison, the NO_FT method (without fine-tuning) resulted in OA of 0.83, PA of 0.81, and UA of 0.84. While the NO_FT method produced promising results, in terms of overall accuracy, the FT_GF2 and FT_GE methods yielded significantly better results than the NO_FT, indicating that the fine-tuned model is more suitable for our target dataset. The OA difference between FT_GF2 and FT_GE methods is only 1%, which suggests that the model using GE image fine-tuning is applicable for tea plantation extraction on GF-2 images.
To analyze whether the results are statistically significant, we performed the McNemar test, and the summary of results is presented in Table 4. The results show there is a statistically significant difference between the results obtained with fine-tuning and without fine-tuning. In contrast, there is no significant difference between the results from the FT_GF2 and the FT_GE methods, although the FT_GF2 method produced higher accuracy results. This proves the transferability of the object-based CNN model trained using GE images on GF-2 images.
4.5. Spatial Distribution Characteristics of Tea Plantations
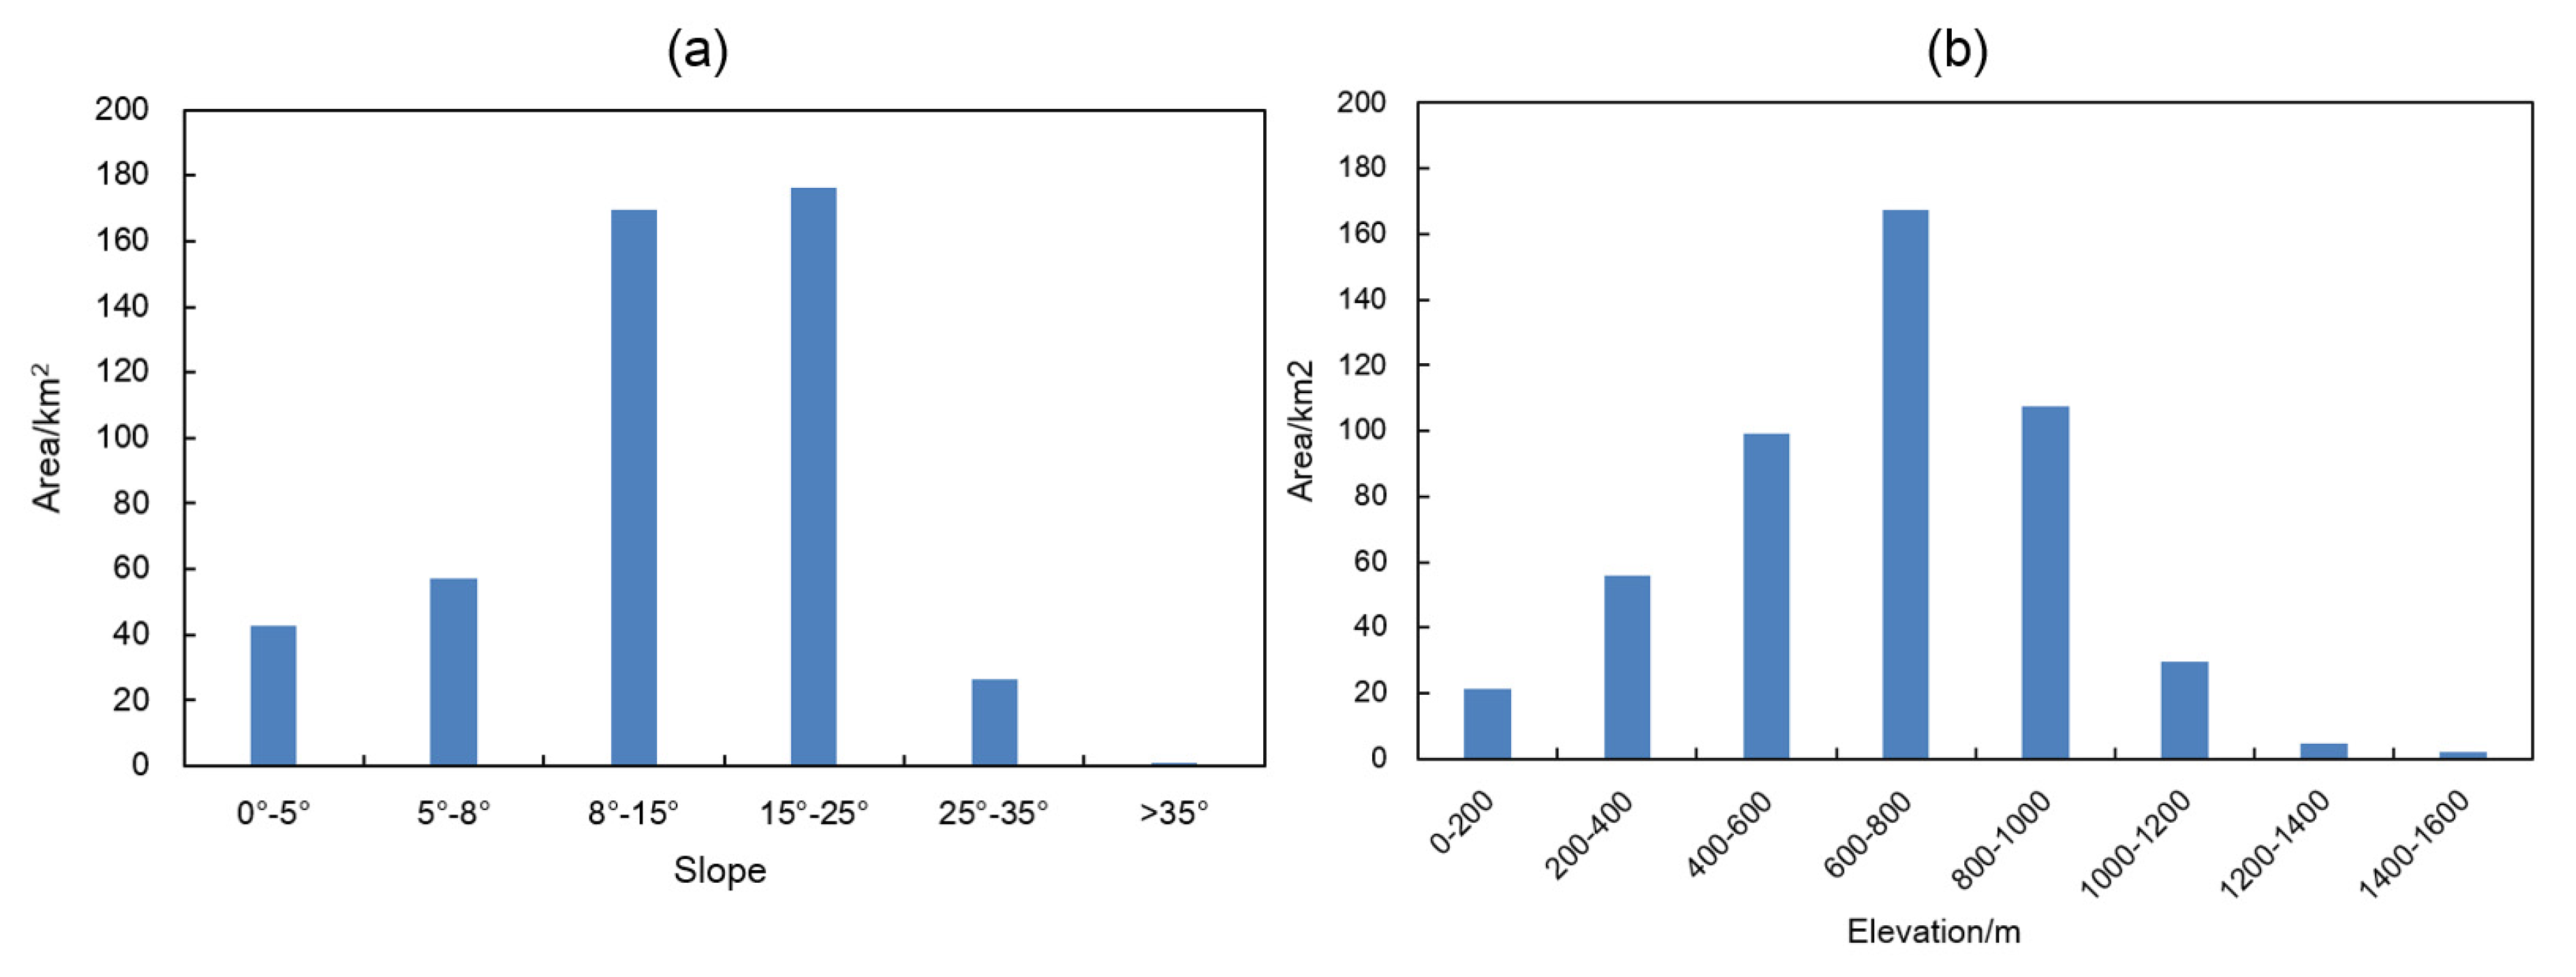
Based on the grouping used in the “Technical Specifications for Water and Soil Conservation in Water Conservancy and Hydropower Projects”, the slopes were divided into six grades: 0°–5°, 5°–8°, 8°–15°, 15°–25°, 25°–35°, and > 35°. In terms of elevation, the Digital Elevation Model (DEM) was used to reclassify the study area into eight elevation zones at 200-meter interval. We then tabulated the area of tea plantations in each slope category and each elevation zone. Figure 11a shows the spatial distribution of tea plantations in the different slope groups for the GF-2 images. The tea plantations are mainly located in the 8°–25° slope category, which comprises an area of 325.60 , equivalent to 75.05% of the total tea plantations in the county. This is followed by 0°–5° and 5°–8° slope zones, which account for 7.12% and 11.16% of the total tea plantation extent, respectively. For slopes greater than 25°, the concentration of tea plantations significantly drops, mainly because steeper terrains restrict human activities and are often unsuitable for tea cultivation. The distribution results suggest tea plantations are highly dependent on terrain and tend to be clustered on gentle slopes.
Figure 11b shows the spatial distribution of tea plantations at different elevations on GF-2 images. The tea plantations are mainly concentrated in the 400–1000 m elevation zone, which has a total area of 334.90 or 74.10% of the total tea plantations in the region. This is followed by the 200–400 m and 1000–1200 m elevation zones, which account for 13.55% and 5.8% of the total tea plantation area, respectively. Low-altitude areas (below 200 m) are mostly flat and are mainly used for residential areas and crop production. On the other hand, high-altitude areas (above 1200 m) are mainly covered by alpine forests, which have little human intervention and are not conducive to tea cultivation.
5. Discussion
In this study, we proposed an object-based CNN method for mapping tea plantations using very high resolution satellite images. The proposed approach combines the concept of object-based image analysis (OBIA) with a CNN model to improve the geometric accuracy of extracted tea plantations. Our experiments reveal that the use of CNN in OBIA setting can effectively improve mapping accuracy, particularly in terms of geometric accuracy. Previous studies have successfully used object-based CNN methods for image classification [26,34,36], so far, however, few have been applied for the classification of tea plantations, particularly in the southern region of China where teas are widely planted. Therefore, a key contribution of this work is to provide a workable strategy to extract tea plantations from VHR images over a large area. Moreover, the proposed method trained using Google Earth (GE) images achieved comparable results when transferring the classification of tea objects derived from GF-2 images, showing the potential of applying the proposed method to other regions.
The spectral information of tea plantations on a VHR image is complex and highly heterogeneous. While tea trees are perennial evergreen plants, it is difficult to completely distinguish tea plantations from forests and certain evergreen farmlands based on handcrafted features. The object-based CNN method uses image objects derived from image segmentation as basic functional units, and then extract deep features for each image object based on the hierarchical representation of CNNs. This highlights the separability of deep features to classify tea plantations while maintaining clear boundaries of the image objects. In our experiment, the global total error (GTC) of the proposed method in the four test areas were all less than 0.2, yielded the smallest geometric error, and had stable classification accuracy above 90%.
When analyzing the effect of the scale of image segmentation on the extraction accuracy of tea plantations, our results showed that the proposed method is not sensitive to the scale of image segmentation between 50 and 80. We thus set the scale parameter manually, corresponding to the value producing the highest overall accuracy and the smallest geometric error. Nevertheless, an automatic setting of the scale parameter, e.g., using the ESP tool [62], can also be used. For image objects obtained after segmentation, we performed zero paddings, and achieved satisfactory results (Figure 6). In comparison, some previous studies can also attain good classification results without zero paddings [34]. Furthermore, the proposed method is only applied to images with three channels and has considerable limitations in the use of multi-band spectral information. More studies have to be undertaken to consider the method’s applicability to medium-resolution images with more channels.
In this study, we used Gini index for feature selection. Compared with the classification using the complete feature set, the classification with a subset after feature selection can produce similar classification accuracy, while the computation efficiency was greatly improved. Our results also confirm that conducting feature selection has a positive impact on the performance of object-based classification [63].
Collecting a large number of samples to train a CNN model from scratch can be difficult. To make our approach more universal, we discussed the transferability of the proposed object-based CNN method pre-trained using GE images to GF-2 VHR satellite images for tea mapping. The proposed method produced similar results with satisfied accuracies for both small (e.g., area B) and large areas (e.g., entire Anxi County), suggesting that the proposed method fine-tuned using the GE images can be transferred to the extraction using GF2 images. Moreover, the results extracted by the FT_GF2 and the FT_GE methods were not significantly different at the 5% confidence level, but there were significant differences between FT_GF2 and No_FT methods, and between FT_GE and No_FT methods. The results of the McNemar test also prove the necessity of fine-tuning the CNN model to improve the classification accuracy of tea plantations. This provides a pragmatic solution to using the CNN method for VHR images with limited training samples, and offers an effective approach for the extraction of a larger range of tea plantations. Since the proposed method is data-driven, it requires little expert knowledge to design features for mapping tea plantations. We believe that it can be effectively used to map tea plantations in other regions, when giving a relatively small number of training samples. Furthermore, regarding applying the proposed method to map other types of crops, we expect that our method can be used as an alternative strategy, leading to a future study.
Last, we analyzed the spatial distribution of tea planting areas considering terrain factor. We observed that the tea plantations in Anxi County are mostly distributed between 8°–25° slope and 400–1000 meter elevation. The distribution of the tea planting areas in Anxi County is largely influenced by terrain, which is comprised mainly by hills and few flat areas. Most of the flatlands are used for residential purposes and crop production, and the soil in some of these lands is not suitable for tea production [64,65,66]. On the other hand, high-altitude areas are inconvenient for tea cultivation and are restrictive to human activities. Understanding the distribution of tea plantations is crucial to the local government for the management of the tea planting and tea production industry.
6. Conclusions
This study provided an object-based CNN method for extracting tea plantations using VHR remote sensing images. More specifically, we used a fine-tuned CNN model in object-based image analysis setting, referred to as object-based CNN, to automatically extract high-level image features regarding tea image objects that were obtained by image segmentation. A random forest was then used for classifying image objects. Experimental results showed that the proposed object-based CNN method significantly improves the classification accuracy, while maintaining well-delineated boundaries. Compared with existing methods (i.e., an object-based classification using random forest, a Mask R-CNN, and an object-based CNN without fine-tuning), the proposed method yielded the smallest over-segmentation and under-segmentation errors. The classification accuracy of the fine-tuned method was found to be higher than the method without fine-tuning, and the difference was statistically significant. Moreover, the proposed object-based CNN strategy fined-tuned using GE images can be transferred to the classification of tea plantations using GF-2 images. We conclude that the proposed object-based CNN strategy can effectively map tea plantations using VHR remote sensing images in large areas, and that the fine-tuning of the model is necessary particularly from the perspective of extraction accuracy. When collecting sufficient training samples is difficult for an application, we suggest using free accessible VHR remote sensing images like images derived from Google Earth to fine-tune the model.
Author Contributions
Z.T. and M.L. conceived and designed the experiments; Z.T. and M.L. performed the experiments; Z.T., M.L. and X.W. analyzed the results; Z.T. and M.L. wrote the paper; Z.T., M.L. and X.W. revised the paper. All authors have read and agreed to the published version of the manuscript.
Funding
This research was funded by the Key Project of Production, Education and Research of Universities in Fujian Province (2017Y4010) and the Central Government Guides the Local Science and Technology Development Special Project (2017L3012).
Acknowledgments
We thank the Fujian Nebula Big Data Application Service Co., Ltd. for providing GF-2 images and Siying Wu for technical support.
Conflicts of Interest
The authors declare no conflict of interest.
References
- Yang, X.; Yu, Z.; Zhang, B.; Huang, J.; Zhang, Y.; Fang, F.; Li, C.; Zhu, H.; Chen, Y. Effect of fluoride on the biosynthesis of catechins in tea [Camellia sinensis (L.) O. Kuntze] leaves. Sci. Hortic. 2015, 184, 78–84. [Google Scholar] [CrossRef]
- Zhu, J.; Pan, Z.; Wang, H.; Huang, P.; Sun, J.; Qin, F.; Liu, Z. An Improved Multi-temporal and Multi-feature Tea Plantation Identification Method Using Sentinel-2 Imagery. Sensors 2019, 19, 2087. [Google Scholar] [CrossRef] [Green Version]
- Liu, S.; Yin, Y.; Liu, X.; Cheng, F.; Yang, J.; Li, J.; Dong, S.; Zhu, A. Ecosystem Services and landscape change associated with plantation expansion in a tropical rainforest region of Southwest China. Ecol. Model. 2017, 353, 129–138. [Google Scholar] [CrossRef]
- Xu, W.; Qin, Y.; Xiao, X.; Di, G.; Doughty, R.B.; Zhou, Y.; Zou, Z.; Kong, L.; Niu, Q.; Kou, W. Quantifying spatial-temporal changes of tea plantations in complex landscapes through integrative analyses of optical and microwave imagery. Int. J. Appl. Earth Obs. Geoinf. 2018, 73, 697–711. [Google Scholar] [CrossRef]
- Zhou, Y.; Luo, J.; Feng, L.; Yang, Y.; Chen, Y.; Wu, W. Long-short-term-memory-based crop classification using high-resolution optical images and multi-temporal SAR data. GI Remote Sens. 2019, 56, 1170–1191. [Google Scholar] [CrossRef]
- Prokop, P. Tea plantations as a driving force of long-term land use and population changes in the Eastern Himalayan piedmont. Land Use Policy 2018, 77, 51–62. [Google Scholar] [CrossRef]
- Wei, Y.; Tong, X.; Chen, G.; Liu, D.; Han, Z. Remote Detection of Large-Area Crop Types: The Role of Plant Phenology and Topography. Agriculture 2019, 9, 150. [Google Scholar] [CrossRef] [Green Version]
- Xu, X.; Zhang, C.; Chen, L.; Li, C. How Does Industrial Waste Gas Emission Affect Health Care Expenditure in Different Regions of China: An Application of Bayesian Quantile Regression. Int. J. Environ. Res. Public Health 2019, 16, 2748. [Google Scholar]
- Xu, X.; Zhang, L.; Chen, L.; Wei, F. Does COVID-2019 have an Impact on the Purchase Intention of Commercial Long-Term Care Insurance among the Elderly in China? Healthcare 2020, 8, 126. [Google Scholar]
- Ghosh, J.K.; Godbole, P.N.; Ghosh, S.K. Mapping of tea gardens from satellite images-a fuzzy knowledge-based image interpetation system. Remote Sens. 2000, 33, 460–468. [Google Scholar]
- Dutta, R.; Stein, A.; Patel, N.R. Delineation of Diseased Tea Patches Using MXL and Texture Based Classification. Int. Arch. Photogramm. Remote Sens. Spat. Inf. Sci. 2008, 37, 1693–1700. [Google Scholar]
- Ma, C.; Yang, F.; Wang, X. Extracting tea plantations in southern hilly and mountainous region based on mesoscale spectrum and temporal phenological features. Remote Sens. Land Resour. 2019, 31, 141–148. [Google Scholar]
- Xu, W.; Sun, R.; Jin, Z. Extracting tea plantations based on ZY-3 satellite data. Trans. Chin. Soc. Agric. Eng. 2016, 32, 161–168. [Google Scholar]
- Dihkan, M.; Guneroglu, N.; Karsli, F.; Guneroglu, A. Remote sensing of tea plantations using an SVM classifier and pattern-based accuracy assessment technique. Int. J. Remote Sens. 2013, 34, 8549–8565. [Google Scholar] [CrossRef]
- Myint, S.W.; Gober, P.; Brazel, A.; Grossman-Clarke, S.; Weng, Q. Per-pixel vs. object-based classification of urban land cover extraction using high spatial resolution imagery. Remote Sens. Environ. 2011, 115, 1145–1161. [Google Scholar] [CrossRef]
- Blaschke, T.; Hay, G.J.; Kelly, M.; Lang, S.; Hofmann, P.; Addink, E.; Feitosa, R.Q.; van der Meer, F.; van der Werff, H.; van Coillie, F.; et al. Geographic Object-Based Image Analysis-Towards a new paradigm. ISPRS J. Photogramm. Remote Sens. 2014, 87, 180–191. [Google Scholar] [CrossRef] [Green Version]
- Ma, L.; Li, M.; Ma, X.; Cheng, L.; Du, P.; Liu, Y. A review of supervised object-based land-cover image classification. ISPRS J. Photogramm. Remote Sens. 2017, 130, 277–293. [Google Scholar] [CrossRef]
- Xofis, P.; Poirazidis, K. Combining different spatio-temporal resolution images to depict landscape dynamics and guide wildlife management. Biol. Conserv. 2018, 218, 10–17. [Google Scholar] [CrossRef]
- Xu, G. Research on Tea Garden Remote Sensing Extraction Based on Object-Oriented and Multi-Metadata Fusion. Ph.D. Thesis, Shanxi Normal University, Xi’an, Shanxi, China, 2016. [Google Scholar]
- Chuang, Y.C.M.; Shiu, Y.S. A Comparative Analysis of Machine Learning with WorldView-2 Pan-Sharpened Imagery for Tea Crop Mapping. Sensors 2016, 16, 594. [Google Scholar] [CrossRef] [Green Version]
- Nanni, L.; Ghidoni, S.; Brahnam, S. Handcrafted vs. non-handcrafted features for computer vision classification. Pattern Recognit. 2017, 71, 158–172. [Google Scholar] [CrossRef]
- Liu, Y.; Yin, B.; Yu, J.; Wang, Z. Image classification based on convolutional neural networks with cross-level strategy. Multimed. Tools Appl. 2017, 76, 11065–11079. [Google Scholar] [CrossRef]
- Gao, Q.; Lim, S. Classification of hyperspectral images with convolutional neural networks and probabilistic relaxation. Comput. Vis. Image Underst. 2019, 188. [Google Scholar] [CrossRef]
- Han, J.; Zhang, D.; Cheng, G.; Guo, L.; Ren, J. Object Detection in Optical Remote Sensing Images Based on Weakly Supervised Learning and High-Level Feature Learning. IEEE Trans. Geosci. Remote Sens. 2015, 53, 3325–3337. [Google Scholar] [CrossRef] [Green Version]
- Xu, Y.; Du, J.; Dai, L.R.; Lee, C.H. A Regression Approach to Speech Enhancement Based on Deep Neural Networks. IEEE-ACM Trans. Audio Speech Lang. Process. 2015, 23, 7–19. [Google Scholar] [CrossRef]
- Zhang, C.; Sargent, I.; Pan, X.; Li, H.; Gardiner, A.; Hare, J.; Atitinson, P.M. An object-based convolutional neural network (OCNN) for urban land use classification. Remote Sens. Environ. 2018, 216, 57–70. [Google Scholar] [CrossRef] [Green Version]
- Cui, X.; Zheng, K.; Gao, L.; Zhang, B.; Yang, D.; Ren, J. Multiscale Spatial-Spectral Convolutional Network with Image-Based Framework for Hyperspectral Imagery Classification. Remote Sens. 2019, 11, 2220. [Google Scholar] [CrossRef] [Green Version]
- Ge, Y.; Jiang, S.; Xu, Q.; Jiang, C.; Ye, F. Exploiting representations from pre-trained convolutional neural networks for high-resolution remote sensing image retrieval. Multimed. Tools Appl. 2018, 77, 17489–17515. [Google Scholar] [CrossRef]
- Zhou, W.; Newsam, S.; Li, C.; Shao, Z. Learning Low Dimensional Convolutional Neural Networks for High-Resolution Remote Sensing Image Retrieval. Remote Sens. 2017, 9, 489. [Google Scholar] [CrossRef] [Green Version]
- Liu, B.; Yu, X.; Zhang, P.; Yu, A.; Fu, Q.; Wei, X. Supervised Deep Feature Extraction for Hyperspectral Image Classification. IEEE Trans. Geosci. Remote Sens. 2018, 56, 1909–1921. [Google Scholar] [CrossRef]
- Rezaee, M.; Mahdianpari, M.; Zhang, Y.; Salehi, B. Deep Convolutional Neural Network for Complex Wetland Classification Using Optical Remote Sensing Imagery. IEEE J. Sel. Top. Appl. Earth Obs. Remote. Sens. 2018, 11, 3030–3039. [Google Scholar] [CrossRef]
- Du, P.; Li, E.; Xia, J.; Samat, A.; Bai, X. Feature and Model Level Fusion of Pretrained CNN for Remote Sensing Scene Classification. IEEE J. Sel. Top. Appl. Earth Obs. Remote Sens. 2019, 12, 2600–2611. [Google Scholar] [CrossRef]
- Chen, X.; Xiang, S.; Liu, C.L.; Pan, C.H. Vehicle Detection in Satellite Images by Hybrid Deep Convolutional Neural Networks. IEEE Geosci. Remote Sens. Lett. 2014, 11, 1797–1801. [Google Scholar] [CrossRef]
- Majd, R.D.; Momeni, M.; Moallem, P. Transferable Object-Based Framework Based on Deep Convolutional Neural Networks for Building Extraction. IEEE J. Sel. Top. Appl. Earth Obs. Remote Sens. 2019, 12, 2627–2635. [Google Scholar] [CrossRef]
- Fu, Y.; Liu, K.; Shen, Z.; Deng, J.; Gan, M.; Liu, X.; Lu, D.; Wang, K. Mapping Impervious Surfaces in Town-Rural Transition Belts Using China’s GF-2 Imagery and Object-Based Deep CNNs. Remote Sens. 2019, 11, 280. [Google Scholar] [CrossRef] [Green Version]
- Wang, L.; Chen, Y.; Tang, L.; Fan, R.; Yao, Y. Object-Based Convolutional Neural Networks for Cloud and Snow Detection in High-Resolution Multispectral Imagers. Water 2018, 10, 1666. [Google Scholar] [CrossRef] [Green Version]
- Guo, Z.; Shao, X.; Xu, Y.; Miyazaki, H.; Ohira, W.; Shibasaki, R. Identification of Village Building via Google Earth Images and Supervised Machine Learning Methods. Remote Sens. 2016, 8, 271. [Google Scholar] [CrossRef] [Green Version]
- Wen, Q.; Jiang, K.; Wang, W.; Liu, Q.; Guo, Q.; Li, L.; Wang, P. Automatic Building Extraction from Google Earth Images under Complex Backgrounds Based on Deep Instance Segmentation Network. Sensors 2019, 19, 333. [Google Scholar] [CrossRef] [Green Version]
- Block, S.; Gonzalez, E.J.; Alberto Gallardo-Cruz, J.; Fernandez, A.; Solorzano, J.V.; Meave, J.A. Using Google Earth Surface Metrics to Predict Plant Species Richness in a Complex Landscape. Remote Sens. 2016, 8, 865. [Google Scholar] [CrossRef] [Green Version]
- Li, W.; Dong, R.; Fu, H.; Wang, J.; Yu, L.; Gong, P. Integrating Google Earth imagery with Landsat data to improve 30-m resolution land cover mapping. Remote Sens. Environ. 2020, 237, 111563. [Google Scholar] [CrossRef]
- Chemura, A.; van Duren, I.; van Leeuwen, L.M. Determination of the age of oil palm from crown projection area detected from World View-2 multispectral remote sensing data: The case of Ejisu-Juaben district, Ghana. ISPRS J. Photogramm. Remote Sens. 2015, 100, 118–127. [Google Scholar] [CrossRef]
- Yan, J.; Zhou, W.; Han, L.; Qian, Y. Mapping vegetation functional types in urban areas with WorldView-2 imagery: Integrating object-based classification with phenology. Urban For. Urban Green. 2018, 31, 230–240. [Google Scholar] [CrossRef]
- Zhang, Z.; Li, A.; Lei, G.; Bian, J.; Wu, B. Change detection of remote sensing images based on multiscale segmentation and decision tree algorithm over mountainous area: A case study in Panxi region, Sichuan Province. Acta Ecol. Sin. 2014, 34, 7222–7232. [Google Scholar]
- Jozdani, S.E.; Johnson, B.A.; Chen, D. Comparing Deep Neural Networks, Ensemble Classifiers, and Support Vector Machine Algorithms for Object-Based Urban Land Use/Land Cover Classification. Remote Sens. 2019, 11, 1713. [Google Scholar] [CrossRef] [Green Version]
- Ng, J.Y.H.; Yang, F.; Davis, L.S. Exploiting Local Features from Deep Networks for Image Retrieval. In Proceedings of the 2015 IEEE Conference on Computer Vision and Pattern Recognition (CVPR), Boston, MA, USA, 7–12 June 2015. [Google Scholar]
- Li, G.; Li, L.; Zhu, H.; Liu, X.; Jiao, L. Adaptive Multiscale Deep Fusion Residual Network for Remote Sensing Image Classification. IEEE Trans. Geosci. Remote Sens. 2019, 57, 8506–8521. [Google Scholar] [CrossRef]
- He, K.M.; Zhang, X.Y.; Ren, S.Q.; Sun, J. Deep Residual Learning for Image Recognition. In Proceedings of the 2016 IEEE Conference on Computer Vision and Pattern Recognition (CVPR), Las Vegas, NV, USA, 27–30 June 2016; pp. 770–778. [Google Scholar]
- Razavian, A.S.; Azizpour, H.; Sullivan, J.; Carlsson, S. CNN Features Off-the-Shelf: An Astounding Baseline for Recognition. In Proceedings of the 27th IEEE Conference on Computer Vision and Pattern Recognition (CVPR), Columbus, OH, USA, 23–28 June 2014; pp. 512–519. [Google Scholar]
- Li, Z.; Wang, H.; Hu, Y. Flame Image Detection Method Based on Deep Learing with Maximal Relevance and Minimal Redundancy. Laser Optoelectron. Prog. 2020, 57, 160–170. [Google Scholar]
- Breiman, L. Random Forests. Mach. Learn. 2001, 45, 5–32. [Google Scholar]
- Fernandez-Delgado, M.; Cernadas, E.; Barro, S.; Amorim, D. Do we Need Hundreds of Classifiers to Solve Real World Classification Problems? J. Mach. Learn. Res. 2014, 15, 3133–3181. [Google Scholar]
- Puissant, A.; Rougier, S.; Stumpf, A. Object-oriented mapping of urban trees using Random Forest classifiers. Int. J. Appl. Earth Obs. Geoinf. 2014, 26, 235–245. [Google Scholar] [CrossRef]
- Canovas-Garcia, F.; Alonso-Sarria, F.; Gomariz-Castillo, F.; Onate-Valdivieso, F. Modification of the random forest algorithm to avoid statistical dependence problems when classifying remote sensing imagery. Comput. Geosci. 2017, 103, 1–11. [Google Scholar] [CrossRef] [Green Version]
- Huang, N.; Wang, D.; Liu, Z.; Lu, G.; Cai, G. Feature selection of composite power quality disturbances under complex noise environment. Chin. J. Sci. Instrum. 2018, 39, 82–90. [Google Scholar]
- Dong, L.; Du, H.; Mao, F.; Han, N.; Li, X.; Zhou, G.; Zhu, D.; Zheng, J.; Zhang, M.; Xing, L.; et al. Very High Resolution Remote Sensing Imagery Classification Using a Fusion of Random Forest and Deep Learning Technique-Subtropical Area for Example. IEEE J. Sel. Top. Appl. Earth Obs. Remote Sens. 2020, 13, 113–128. [Google Scholar] [CrossRef]
- Sharma, J.; Granmo, O.C.; Goodwin, M. Deep CNN-ELM Hybrid Models for Fire Detection in Images. In Proceedings of the 27th International Conference on Artificial Neural Networks (ICANN), Rhodes, Greece, 4–7 October 2018; pp. 245–259. [Google Scholar]
- Weng, Q.; Mao, Z.; Lin, J.; Liao, X. Land-use scene classification based on a CNN using a constrained extreme learning machine. Int. J. Remote Sens. 2018, 39, 6281–6299. [Google Scholar] [CrossRef]
- Li, M.; Bijker, W.; Stein, A. Use of Binary Partition Tree and energy minimization for object-based classification of urban land cover. ISPRS J. Photogramm. Remote Sens. 2015, 102, 48–61. [Google Scholar] [CrossRef]
- Olofsson, P.; Foody, G.M.; Herold, M.; Stehman, S.V.; Woodcock, C.E.; Wulder, M.A. Good practices for estimating area and assessing accuracy of land. Remote Sens. Environ. 2014, 148, 42–57. [Google Scholar] [CrossRef]
- Foody, G.M. Thematic map comparison: Evaluating the statistical significance of differences in classification accuracy. Photogramm. Eng. Remote Sens. 2004, 70, 627–633. [Google Scholar] [CrossRef]
- Zhang, L.; Gong, Z.; Wang, Q.; Jin, D.; Wang, X. Wetland mapping of Yellow River Delta wetlands based on multi-feature optimization of Sentinel-2 images. J. Remote Sens. 2019, 23, 313–326. [Google Scholar] [CrossRef]
- Dragut, L.; Tiede, D.; Levick, S.R. ESP: A tool to estimate scale parameter for multiresolution image segmentation of remotely sensed data. Int. J. Geogr. Inf. Sci. 2010, 24, 859–871. [Google Scholar] [CrossRef]
- Ma, L.; Fu, T.; Blaschke, T.; Li, M.; Tiede, D.; Zhou, Z.; Ma, X.; Chen, D. Evaluation of Feature Selection Methods for Object-Based Land Cover Mapping of Unmanned Aerial Vehicle Imagery Using Random Forest and Support Vector Machine Classifiers. ISPRS Int. J. Geo-Inf. 2017, 6, 51. [Google Scholar] [CrossRef]
- Wu, Z.; Jiang, F.; Zhang, L. Study on Soil Nitrogen Status of Tieguanyin Tea Gardens in Anxi County of Fujian Province. Soils Found. 2020, 52, 16–24. [Google Scholar]
- Xu, X.; Chen, L. Projection of Long-Term Care Costs in China, 2020–2050: Based on the Bayesian Quantile Regression Method. Sustainability 2019, 11, 3530. [Google Scholar]
- Xu, X.; Zhang, L.; Chen, L.; Liu, C. The Role of Soil N2O Emissions in Agricultural Green Total Factor Productivity: An Empirical Study from China around 2006 when Agricultural Tax Was Abolished. Agriculture 2020, 10, 150. [Google Scholar]
Figure 1.
Overview of the study area in Anxi, Fujian Province, China; (a–d) are enlarged views of four typical tea plantation areas.
Figure 1.
Overview of the study area in Anxi, Fujian Province, China; (a–d) are enlarged views of four typical tea plantation areas.

Figure 2.
Workflow of the proposed extraction of tea plantations from very high resolution (VHR) remote sensing images.
Figure 2.
Workflow of the proposed extraction of tea plantations from very high resolution (VHR) remote sensing images.

Figure 3.
The framework of the Resnet50. The Resnet50 model trained on ImageNet, which is transferred to the target dataset, and the last convolutional layer is used as a high-level features output layer.
Figure 3.
The framework of the Resnet50. The Resnet50 model trained on ImageNet, which is transferred to the target dataset, and the last convolutional layer is used as a high-level features output layer.

Figure 4.
Effect of scale values on the attribute accuracies (left) and geometric errors (right) of tea object classifications. GOC, GUC, and GTC refer to global over-, under-, and total classification errors.
Figure 4.
Effect of scale values on the attribute accuracies (left) and geometric errors (right) of tea object classifications. GOC, GUC, and GTC refer to global over-, under-, and total classification errors.

Figure 5.
Effect of the number of selected features on the classification accuracies by convolutional neural network (CNN) models using and without using fine-tuning operations.
Figure 5.
Effect of the number of selected features on the classification accuracies by convolutional neural network (CNN) models using and without using fine-tuning operations.

Figure 6.
Classification results obtained by the RF, Mask R-CNN, OCNN, and the proposed method (labeled as Pro) on four datasets (a–d).
Figure 6.
Classification results obtained by the RF, Mask R-CNN, OCNN, and the proposed method (labeled as Pro) on four datasets (a–d).

Figure 7.
Distribution of the total error index of the tea plantation objects classified by the RF, Mask R-CNN, OCNN, and proposed method (labeled as Pro) on (a–d) test regions. False positives refer to the extracted tea plantation objects that do not overlap with the reference objects.
Figure 7.
Distribution of the total error index of the tea plantation objects classified by the RF, Mask R-CNN, OCNN, and proposed method (labeled as Pro) on (a–d) test regions. False positives refer to the extracted tea plantation objects that do not overlap with the reference objects.

Figure 8.
Effect of sample size on tea plantation extraction.

Figure 9.
Tea plantation results on GF-2 images by the No_FT, FT_GF2, and FT_GE methods.

Figure 10.
The final map of tea plantations in the study area: (a) Tea plantation results extracted by NO_FT; (b) tea plantation results extracted by FT_GF2; (c) tea plantation results extracted by FT_GE.
Figure 10.
The final map of tea plantations in the study area: (a) Tea plantation results extracted by NO_FT; (b) tea plantation results extracted by FT_GF2; (c) tea plantation results extracted by FT_GE.

Figure 11.
Spatial distribution characteristics of tea plantations: (a) The spatial distribution of tea plantations in different slope zones on GF-2 images; (b) the spatial distribution of tea plantations at different elevations on GF-2 images.
Figure 11.
Spatial distribution characteristics of tea plantations: (a) The spatial distribution of tea plantations in different slope zones on GF-2 images; (b) the spatial distribution of tea plantations at different elevations on GF-2 images.


Table 1.
Details of object’s features.
| Feature Types | Features |
|---|---|
| Spectral features | Max_diff, Mean Blue, Mean Green, Mean Red, Brightness |
| Texture features | GLCM Homogeneity, GLCM Contrast, GLCM Dissimilarity, GLCM Entropy, GLCM Ang.2nd moment, GLCM Mean, GLCM StdDev, GLCM Correlation |
| Geometrical features | Asymmetry, Shape Index, Density, Main Direction, compactness, roundness, Border index |
Table 2.
Geometric accuracies of the RF, Mask R-CNN, OCNN, and the proposed method (labeled as Pro) classifications for the four test areas, evaluated by global over-classification (GOC), global under-classification (GUC), and global total classification (GTC) error indices.
Table 2.
Geometric accuracies of the RF, Mask R-CNN, OCNN, and the proposed method (labeled as Pro) classifications for the four test areas, evaluated by global over-classification (GOC), global under-classification (GUC), and global total classification (GTC) error indices.
| GOC | GUC | GTC | ||||||||||
|---|---|---|---|---|---|---|---|---|---|---|---|---|
| a | b | c | d | a | b | c | d | a | b | c | d | |
| RF | 0.16 | 0.13 | 0.17 | 0.14 | 0.29 | 0.52 | 0.28 | 0.30 | 0.24 | 0.40 | 0.25 | 0.25 |
| Mask R-CNN | 0.08 | 0.19 | 0.14 | 0.09 | 0.39 | 0.13 | 0.27 | 0.21 | 0.29 | 0.16 | 0.23 | 0.17 |
| OCNN | 0.08 | 0.18 | 0.17 | 0.17 | 0.25 | 0.23 | 0.23 | 0.21 | 0.19 | 0.22 | 0.21 | 0.20 |
| Pro | 0.12 | 0.14 | 0.18 | 0.17 | 0.16 | 0.11 | 0.16 | 0.17 | 0.14 | 0.13 | 0.18 | 0.17 |
Table 3.
Confusion matrix of tea plantation results on GF-2 images by the No_FT, FT_GF2, and FT_GE. UA, PA, and OA refer to user accuracy, producer accuracy, and overall accuracy, respectively. 95% confidence interval.
Table 3.
Confusion matrix of tea plantation results on GF-2 images by the No_FT, FT_GF2, and FT_GE. UA, PA, and OA refer to user accuracy, producer accuracy, and overall accuracy, respectively. 95% confidence interval.
| Classified | UA | PA | Estimated Area () | OA | |
|---|---|---|---|---|---|
| No_FT | Tea plantations | 0.84 ± 0.04 | 0.81 ± 0.10 | 840.4 ± 107.4 | 0.83 ± 0.04 |
| Other | 0.82 ± 0.04 | 0.84 ± 0.01 | 2077.9 ± 107.4 | ||
| FT_GF2 | Tea plantations | 0.87 ± 0.04 | 0.86 ± 0.11 | 753.1 ± 97.2 | 0.86 ± 0.03 |
| Other | 0.86 ± 0.04 | 0.87 ± 0.01 | 2165.2 ± 9 7.2 | ||
| FT_GE | Tea plantations | 0.86 ± 0.04 | 0.84 ± 0.11 | 784.5 ± 100.9 | 0.85 ± 0.03 |
| Other | 0.85 ± 0.04 | 0.86 ± 0.01 | 2133.9 ± 100.9 |
Table 4.
Summary of the McNemar test to compare the difference between the classification results using different methods. and are the number of discordant pairs.
Table 4.
Summary of the McNemar test to compare the difference between the classification results using different methods. and are the number of discordant pairs.
| – | |z| | Significant? | |||
|---|---|---|---|---|---|
| FT_GF2 vs. NO_FT | 40 | 18 | 22 | 2.89 | Yes, 5% |
| FT_GF2 vs. FT_GE | 31 | 22 | 9 | 1.53 | No, 5% |
| FT_GE vs. NO_FT | 36 | 21 | 15 | 1.98 | Yes, 5% |
© 2020 by the authors. Licensee MDPI, Basel, Switzerland. This article is an open access article distributed under the terms and conditions of the Creative Commons Attribution (CC BY) license (http://creativecommons.org/licenses/by/4.0/).
Share and Cite
MDPI and ACS Style
Tang, Z.; Li, M.; Wang, X. Mapping Tea Plantations from VHR Images Using OBIA and Convolutional Neural Networks. Remote Sens. 2020, 12, 2935. https://0-doi-org.brum.beds.ac.uk/10.3390/rs12182935
AMA Style
Tang Z, Li M, Wang X. Mapping Tea Plantations from VHR Images Using OBIA and Convolutional Neural Networks. Remote Sensing. 2020; 12(18):2935. https://0-doi-org.brum.beds.ac.uk/10.3390/rs12182935
Chicago/Turabian StyleTang, Zixia, Mengmeng Li, and Xiaoqin Wang. 2020. "Mapping Tea Plantations from VHR Images Using OBIA and Convolutional Neural Networks" Remote Sensing 12, no. 18: 2935. https://0-doi-org.brum.beds.ac.uk/10.3390/rs12182935
Note that from the first issue of 2016, this journal uses article numbers instead of page numbers. See further details here.