Article

Spatial-Temporal Distribution Analysis of Industrial Heat Sources in the US with Geocoded, Tree-Based, Large-Scale Clustering

1
Aerospace Information Research Institute, Chinese Academy of Sciences, Beijing 100094, China
2
School of Information Engineering, China University of Geosciences, Beijing 100083, China
3
Development Research Center of China Geological Surve, Beijing 100037, China
*
Author to whom correspondence should be addressed.
Current address: No.9 Dengzhuang South Road, Haidian District, Beijing 100094, China.
Remote Sens. 2020, 12(18), 3069; https://0-doi-org.brum.beds.ac.uk/10.3390/rs12183069
Submission received: 1 August 2020 / Revised: 7 September 2020 / Accepted: 14 September 2020 / Published: 19 September 2020

Abstract

:
Heavy industrial burning contributes significantly to the greenhouse gas (GHG) emissions. It is responsible for almost one-quarter of the global energy-related CO2 emissions and its share continues to grow. Mostly, those industrial emissions are accompanied by a great deal of high-temperature heat emissions from the combustion of carbon-based fuels by steel, petrochemical, or cement plants. Fortunately, these industrial heat emission sources treated as thermal anomalies can be detected by satellite-borne sensors in a quantitive way. However, most of the dominant remote sensing-based fire detection methods barely work well for heavy industrial heat source discernment. Although the object-oriented approach, especially the data clustering-based approach, has guided a novel method of detection, it is still limited by the costly computation and storage resources. Furthermore, when scaling to a national, or even global, long time-series detection, it is greatly challenged by the tremendous computation introduced by the incredible large-scale data clustering of tens of millions of high-dimensional fire data points. Therefore, we proposed an improved parallel identification method with geocoded, task-tree-based, large-scale clustering for the spatial-temporal distribution analysis of industrial heat emitters across the United States from long time-series active Visible Infrared Imaging Radiometer Suite (VIIRS) data. A recursive k-means clustering method is introduced to gradually segment and cluster industrial heat objects. Furthermore, in order to avoid the blindness caused by random cluster center initialization, the time series VIIRS hotspots data are spatially pre-grouped into GeoSOT-encoded grid tasks which are also treated as initial clustering objects. In addition, some grouped parallel clustering strategy together with geocoding-aware task tree scheduling is adopted to sufficiently exploit parallelism and performance optimization. Then, the spatial-temporal distribution pattern and its changing trend of industrial heat emitters across the United States are analyzed with the identified industrial heat sources. Eventually, the performance experiment also demonstrated the efficiency and encouraging scalability of this approach.

1. Introduction

The emissions from the energy-intensive industrial sectors are quite significant contributors to greenhouse gas (GHG) release. The combustion of gas- and oil-based fossil fuels during the modern industrial processes in several heavy-pollution industrial sectors, such as the steel industries, petrochemical industries, and cement industries are the major emitters. They account for nearly one-quarter of the global energy-related carbon dioxide (CO2) emissions and their share continues to grow [1]. Among the top four heavy emitters around the world that account for more than half of the total global emissions, the United States has been the second for decades. With the shift to lower-carbon energy, the US’s GHG emissions in 2018 resumed a long-term downward shift after a sharp soar [2]. However, it is still worth noticing that the industrial emissions rose slightly and even surpassed the emissions from coal-fired power plants [2]. According to the C2ES [3] analysis, the US’s emissions cuts may still off track to meeting the agreement under the Paris climate accord [4]. Moreover, these industrial emissions have already posed a serious threat to the urban environment and even natural ecosystems [5]. Hence, accurate and up-to-date observations and tracking of the distribution patterns of industrial activities over time is crucial to a better understanding of the national or even global climate change trends.
As a matter of fact, these industrial GHG emissions are usually hard to be comprehensively surveyed. That may partly ascribed to the distribution of the industrial factories and their nighttime releasing. Actually, both the energy and non-energy related industrial emissions are usually accompanied by large high-temperature heat release that is produced by carbon-based fossil fuel combustion during industrial producing process [6]. In practice, most of these industrial heat releasers [1] have sharp temperature contrasts with their local surroundings. They can be easily observed by space-borne thermal-infrared radiometer (TIR) sensors in a quantitative way, such as the Moderate Resolution Imaging Spectroradiometer (MODIS) [7]. With the recent advances of sensors, several high-resolution TIR sensors are capable of providing up-to-date observations and continuous tracking of the thermal anomalies—for instance, the Advanced Spaceborne Thermal Emission and Reflection Radiometer (ASTER) [8], the Visible Infrared Imaging Radiometer Suite (VIIRS) [9,10], the Advanced Very High-Resolution Radiometer (AVHRR) [11], and Landsat8 [12,13].
With various fire products from the advanced TIR sensors, plenty of remote-sensing based fire detecting methods [14,15,16] are available to identify the high-temperature heat releasers, including wildfires, waste gas flares, and coal fires. Due to the pre-specified fixed threshold, some traditional threshold-based methods [14] and even multispectral detecting methods [17,18] aiming at eliminating the influence of the surface heterogeneity (like clouds) [19] can only identify big fires with high probability. Likewise, contextual algorithms [10,20], which essentially retrieve thermal anomalies by using the inconsistency over large areas, are closely affected by the natural background temperature variability. Withal, dynamic multi-temporal methods [21] conducting non-linear dynamic prediction [22] could take full advantage of the time-invariant quantities instead of the background intensities, but are greatly restricted to the dynamic weather condition changes [22].
However, most of these dominant fire detection methods barely work for heavy industrial heat source discernment. In fact, it remains quite challenging to precisely distinguish the industrial heat releasers from other fire hotspots like wildfires, and the related works are relatively few. Recently, some studies have relied on the empirical thermal anomaly index (TAI)-based approaches [5,23] which normally need prior knowledge and extra data for the removal of water, wildfires, and other nonindustrial seasonal burnings. It is also worth noticing that a novel object-oriented approach [24] has guided the way to building a frequency-based metric index to determine the degree of spatial and temporal aggregation on time-serial VIIRS Nightfire products. Differing from this empirical frequency-based approach, the cluster-based method [25] has successfully employed the adaptive k-means [26,27] data clustering algorithm on long time-serial VIIRS data to automatically retrieve the centers of the static and persistent industrial heat objects at large-scale from VIIRS thermal anomalies. Nevertheless, as an unsupervised classification algorithm [28,29], to merely use k-means clustering could be being willfully blind to some extent. Furthermore, when extending to a national even global scale, it turns out to be a large-scale spatial-temporal data clustering problem that would finally result in a big data computing challenge [30,31,32,33]. Particularly, the enormous computation introduced by the clustering of tens or even hundreds of millions of fire hotspots data representing in high-dimensional features is extremely time-consuming and could even lead to the infeasibility of it.
To properly settle the above issues, an improved parallel identification method with geocoded, task-tree-based, large-scale clustering is put forward here for the spatial-temporal distribution analysis of industrial heat emitters across the United States from long time-series active VIIRS data. The main contribution of this work is that it introduces the GeoSOT-encoded [34] task tree and the many-task distributed computing approach to not only improve identification efficiency but also tackle the big data computing challenge. Following a divide-and-conquer approach [35], the GeoSOT global subdivision model is adopted to break down the enormous time-series fire hotspots clustering problem into a great deal of small grid clustering problems that could be implemented in parallel as bags of tasks. Though the most popular but simple k-means algorithm is a fantastic trade-off between effectiveness and complexity, it is nearly impracticable to determine the corresponding k parameter (number of clusters) for various industrial settlements with different spatial and temporal aggregation characteristics. Accordingly, a recursive k-means clustering method is introduced to gradually segment and cluster industrial heat objects. Furthermore, in order to avoid the blindness caused by random cluster center initialization, the time series VIIRS hotspots data are spatially pre-grouped into GeoSOT-encoded grid tasks which are also treated as initial clustering objects. In addition, some grouped parallel clustering strategy together with geocoding-aware task tree scheduling is adopted to sufficiently exploit parallelism and performance optimization.
The rest of this paper is organized as follows. The next section discusses the related work of this study and is followed by the description of time-series active VIIRS Nightfire data product in Section 3. Then Section 4 goes into the details of the parallel identification method with geocoded, task-tree-based, large-scale clustering. Afterward, Section 5 demonstrates the spatial-temporal distribution analysis of industrial heat sources in the US as well as the experimental performance analysis; Section 6 discusses the comparative performance analysis; and the last section summarizes this paper.

2. Related Works

As more advanced thermal infrared sensors became employed, diverse thermal anomaly detection methods emerged for the accurate and up-to-date detection of high-temperature heat sources. Below, a number of fire detection methods as well as several industrial identification approaches are comparatively discussed.

2.1. Traditional Fire Detection Methods

Most of traditional fire detection methods are generally based on the Wien’s displacement law and Planck’s blackbody radiation law that the radiance at high-temperature goes up faster in the mid-wave infrared spectrum [5]. They generally use thermal threshold testing or a statistically textual algorithm for the determination of the thermal anomalies.
The fixed-threshold method [14,16,36], the early option of fire detection, has been used for sub-surface coal fires mapping [16] with both AVHRR and Landsat-5 data, gas flaring monitoring with ATSR imageries, and global fire detection [14] from EOS-MODIS. This kind of method normally adopts a fixed threshold testing strategy; namely, a pixel whose brightness temperature surpasses the pre-specified threshold value is labeled as a thermal anomaly or fire. However, the fixed threshold which is mostly a pre-specified empirical value may not always be satisfactory. Thus the drawback of these works lies in the difficulty of finding the optimal threshold, since it is prior unknown and also both spatially and temporally variable [22]. Afterward, multispectral detecting approaches with multiple thresholds have been proposed, such as fire detection and growth monitoring [18] using AVHRR mid-infrared and thermal channels, and fire line extraction [17] from multispectral infrared images. This approach aims at precluding the limitation of the single fixed threshold but also the influence of the surface heterogeneity [5,19] so as to distinguish fires from clouds and background. Nevertheless, due to the fixed threshold approach, only big fires can be identified with high probability [22].
The contextual-based method [37] typically employs contextual algorithms to estimate the average brightness temperatures of the neighboring background. The fire pixels are essentially treated as thermal anomalies using the inconsistency over large areas. This approach has been successfully introduced to the VIIRS active fire detection algorithm [10] and hybrid wildland fire detection [20]. In spite of the self-adaptive and consistently overly large regions, the performance of the contextual approach is basically greatly affected by the natural background variability, especially in daytime when the background temperature is relatively high.
The dynamic multi-temporal method [22] is hybrid approach that applies the non-linear dynamic detection model (DDM) on a simple multi-temporal method. Essentially, a multi-temporal approach primarily focuses on the anomalous changes in time-invariant quantities instead of comparing background intensities. Nevertheless, a simple multi-temporal technique not only entails calibrated thermal data but is also greatly affected by the dynamic weather condition changes over time. The dynamic multi-temporal approach employs a non-linear DDM to predict the background intensities and detect the fires from multi-temporal thermal data as a set of anomalous changes over time. The work of koltunov [22] has demonstrated that the non-linear approach has more encouraging results when detecting small-scale fires.

2.2. Approaches for Industrial Heat Source Identification

Unfortunately, despite the diverse fire detection methods available, few are capable of detecting industrial heat sources. That is mainly because the difficulties lie in the precise deriving of the high-temperature industrial heat sources from other fire hotspots like wildfires and non-industrial burnings. As a matter of fact, only a few existing studies have made any effort toward industrial heat source identification using space-borne thermal data. Here we just classify them into categories, including the index-based method, the frequency-based multi-temporal method, and a spatial-temporal clustering method.
The index-based method seems to follow a mechanism way of discernment using the thermal anomaly index (TAI) as an empirical threshold. A simple TAI index based on high-resolution ASTER data has introduced by Xia [5] for the extracting of hot spots, but it still requires the aid of the modified normalized difference water index (MNDWI) out of Landsat 8 to remove water bodies and Google Earth data to preclude the wildfires and other nonindustrial seasonal heat resources. Withal, Zhang [23] has also constructed a three-sliding widow approach based on empirical thermal anomaly index using VIIR Nightfire product to flag and extract heat-releasing industries in China.
The frequency-based multi-temporal method typically works according to time persistence criteria of the industrial heat release. An early effort was that of Casadio’s [15] gas flaring monitoring with ATSR data; the hot spots with a relatively high frequency of occurrence—more than four times a year—were simply assumed to be industrial areas. Nevertheless, merely adopting an occurrence frequency with a fixed threshold is nothing but a naive attempt. Meanwhile, it is more worth noticing that Liu [24] has pioneered a novel object-oriented way of identifying static and persistent industrial heat sources on time-serial VIIRS Nightfire products. A simplified binary occurrence-frequency image together with a temporal concentration index were respectively introduced as metrics of aggregation degree for spatial and temporal filtering. In this way, the spatial and temporal-aggregation characteristics of the industrial heat releasers have been fully taken advantage of to tackle the spatial-temporal heterogeneity challenges. Anyway, the considerable memory consumption resulting from large binary frequency images and the costly computation caused by multi-temporal calculations are great limitations.
The spatial-temporal clustering method regards the identification of industrial heat sources as an object clustering problem. Yan Ma [25,38] has introduced an improved k-means clustering algorithm to map the distributions of the heavy industrial heat sources in China and India by virtue of VIIRS active fire hotspot product. Differing from the fixed index and frequency image to determine the degree of temporal and spatial aggregation, a clustering algorithm is introduced in this approach to retrieve the centers of the static and persistent industrial objects out of the thermal anomalies. However, it still remains quite challenging, since the enormous computational load introduced by the clustering of the incredibly great number of thermal anomalies is extremely time-consuming and even leads to the infeasibility of it.

3. Datasets and Study Area
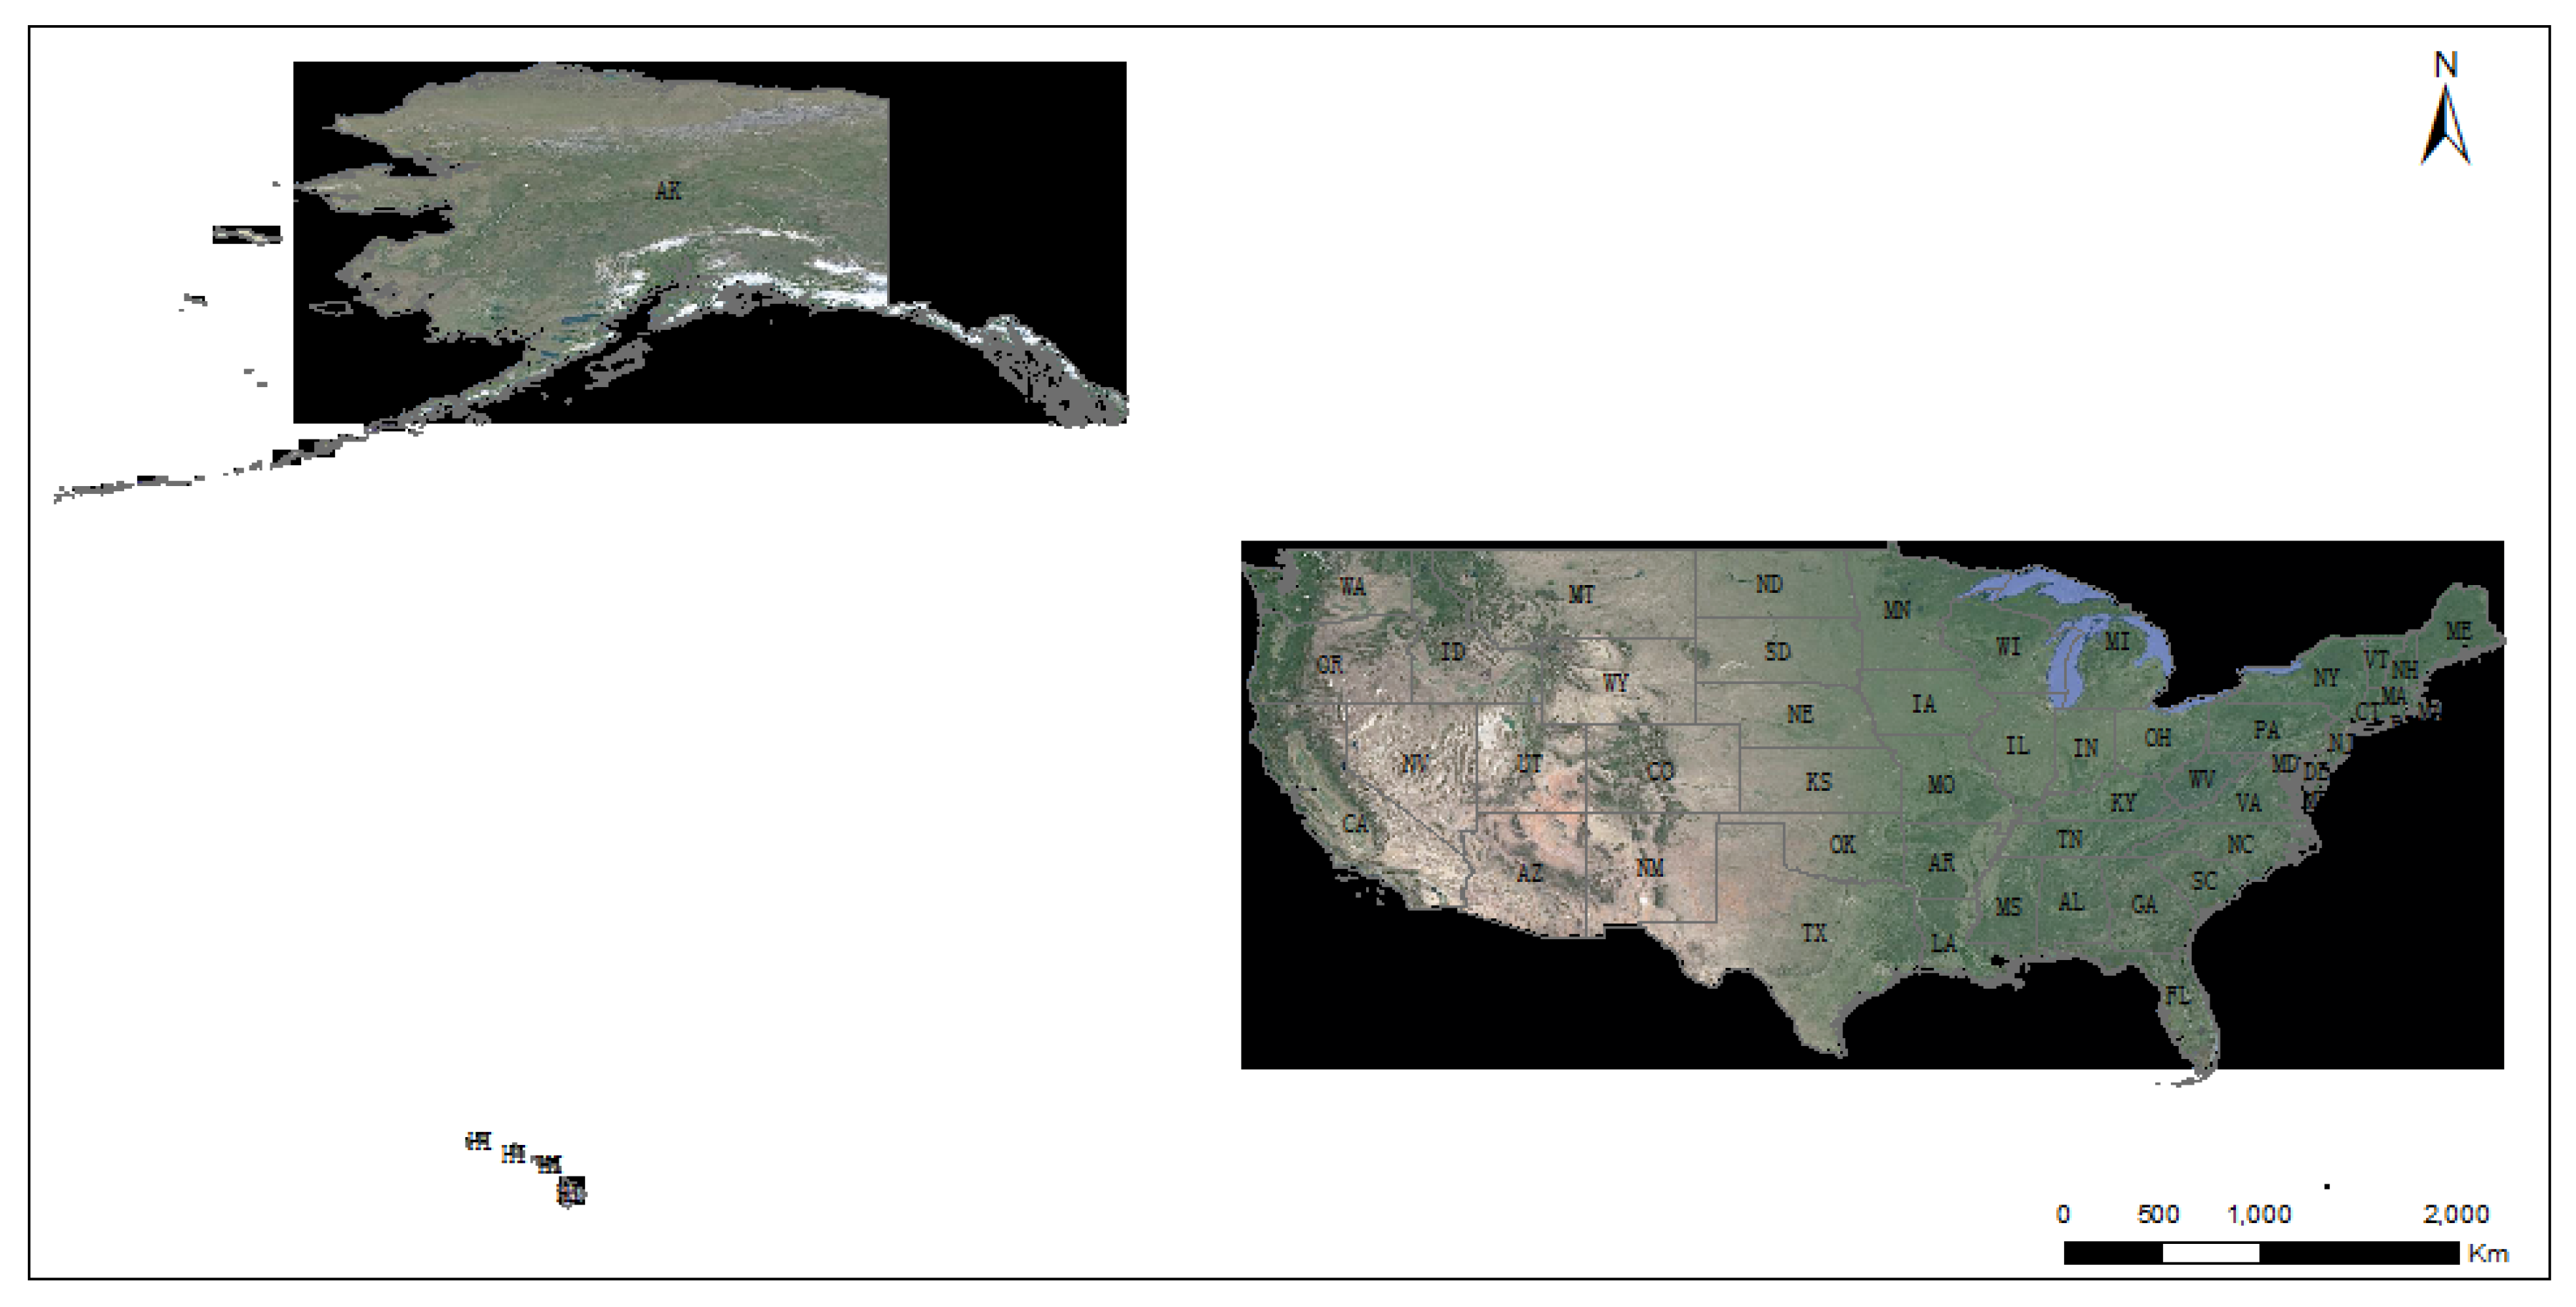
3.1. Study Area

The United States of America (USA) (Figure 1), the world’s most developed and third-largest country, is mostly located in central North America, between Canada and Mexico. The mainland of the US lies between 25 N to 49 N and 70 W to 130 W; Alaska is between 60 N to 70 N and 140 W to 170 W; and the Hawaiian Islands are around 20 N and 150 W to 180 W. It consists of 50 states and a federal district, covering 3.8 million square miles with an estimated population of over 328 million in 2019.
The United States has been the second-largest GHG emitter around the world for the past twenty years. Carbon dioxide accounts for more than 80% of GHG emissions. The top three greenhouse emitters are the electric power sector, transportation sector, industry sector. Natural gas is becoming the dominant U.S. industrial CO2 emission source. It is worth noticing that the industrial emissions rose slightly and even surpassed the emissions from coal-fired power plants according to C2ES analysis; 14 to 18 percent below 2005 is far short of what is needed to address climate change.

3.2. VIIRS Active Fire Products

The VIIRS 375 m active fire product—VNP14IMG—is used for industrial heat source distribution analysis. This experimental Level-2 (L2) data product was generated by Land Science Investigator Processing System (Land-SIPS) [39] of NASA, and provides daily fire detections globally both day and night. This active fire product is produced from all five 375 m I-channels (I1–I5), and the dual-gain 750-m mid-infrared, M13, the channel of the VIIRS instrument. This active fire product is detected with a combination of fixed and contextual tests based on the MOD14 algorithm which is an improved EOS–MODIS algorithm originally designed for the MODIS baseline product (Thermal Anomalies and Fire). The optimized modification was added to accommodate a higher spatial resolution of 375 m. Therefore, comparing it with other similar fire products, the VIIRS fire product offers not only better responses over the small fires but also improved mapping of larger fires both day and night.
The VIIRS sensors was first onboard in the year 2011 and the VNP14IMG active fire product has been available ever since the beginning of 2012. Therefore, the density and spatial distribution of 3,461,260 detected thermal anomalies or fires ranging from 2012 to 2018 is depicted in Figure 2.

4. Methods

We demonstrated an improved parallel industrial heat source identification approach for spatial-temporal distribution analysis with geocoded task-tree-based, large-scale k-means clustering. This approach offers an effective and highly scalable solution to significantly improve the identification efficiency, the large-scale processing capacity, and the performance of spatial-temporal clustering. As a matter of fact, this long time-series industrial heat source identification problem at a national scale is essentially an extremely large-scale data clustering issue based on millions of high-dimensional fire data. Relying on the geocoded, task-tree-based, many-task computing approach, the large-scale heat objects clustering problem could be represented in the form of a geocoded task tree, which is a GeoSOT-encoded quad-tree consisting of a great number of grid tasks, wherein each grid task is responsible for the clustering of the fire hotspots with the same GeoSOT code, which means they are all located inside the region of this grid. Practically, it is also quite reasonable that only the spatially and temporally adjacent fire hotspots are involved in the heat objects clustering, according to the local aggregation characteristic of the industrial heat emission targets. That is mainly because it is not necessary to introduce numerous fire points that are far apart into computation; that could even lead to discouraging performance. In this way, this tremendous big spatial-temporal clustering problem could be naturally broken down into small data clustering grid tasks that could be simultaneously implemented in parallel. Two-level parallelism could be exploited, since a parallel k-means algorithm is also employed for the implementation of each grid task. Furthermore, this approach also offers a recursive k-means clustering method together with a pre-grouping strategy to cope with the initialization problem of the k parameter (number of clusters) and random cluster center. Instead of giving a fixed number of clusters which is also infeasible, the bunches of fire hotspots in each grid task are recursively segmented and detected as candidate heat objects through recursive k-means clustering. Meanwhile, the pre-grouping strategy here spatially fragments the enormous fire hotspots into a great number of subgroups, which are treated as the initial clustering objects.
The main mechanism of this approach is depicted in Figure 3, wherein all the fire hotspots in the long-term time-series VNP14IMG fire data are flatted and serialized into a single unordered multi-dimensional spatial-temporal vector data sequence. When these vector data with enormous fire/hotspots are initially imported, several processing procedures are followed, including parallel data importing, building z geocoded quad task-tree, recursive parallel k-means clustering, and identifying heat objects. The detailed parallel processing procedure is as follows:
-
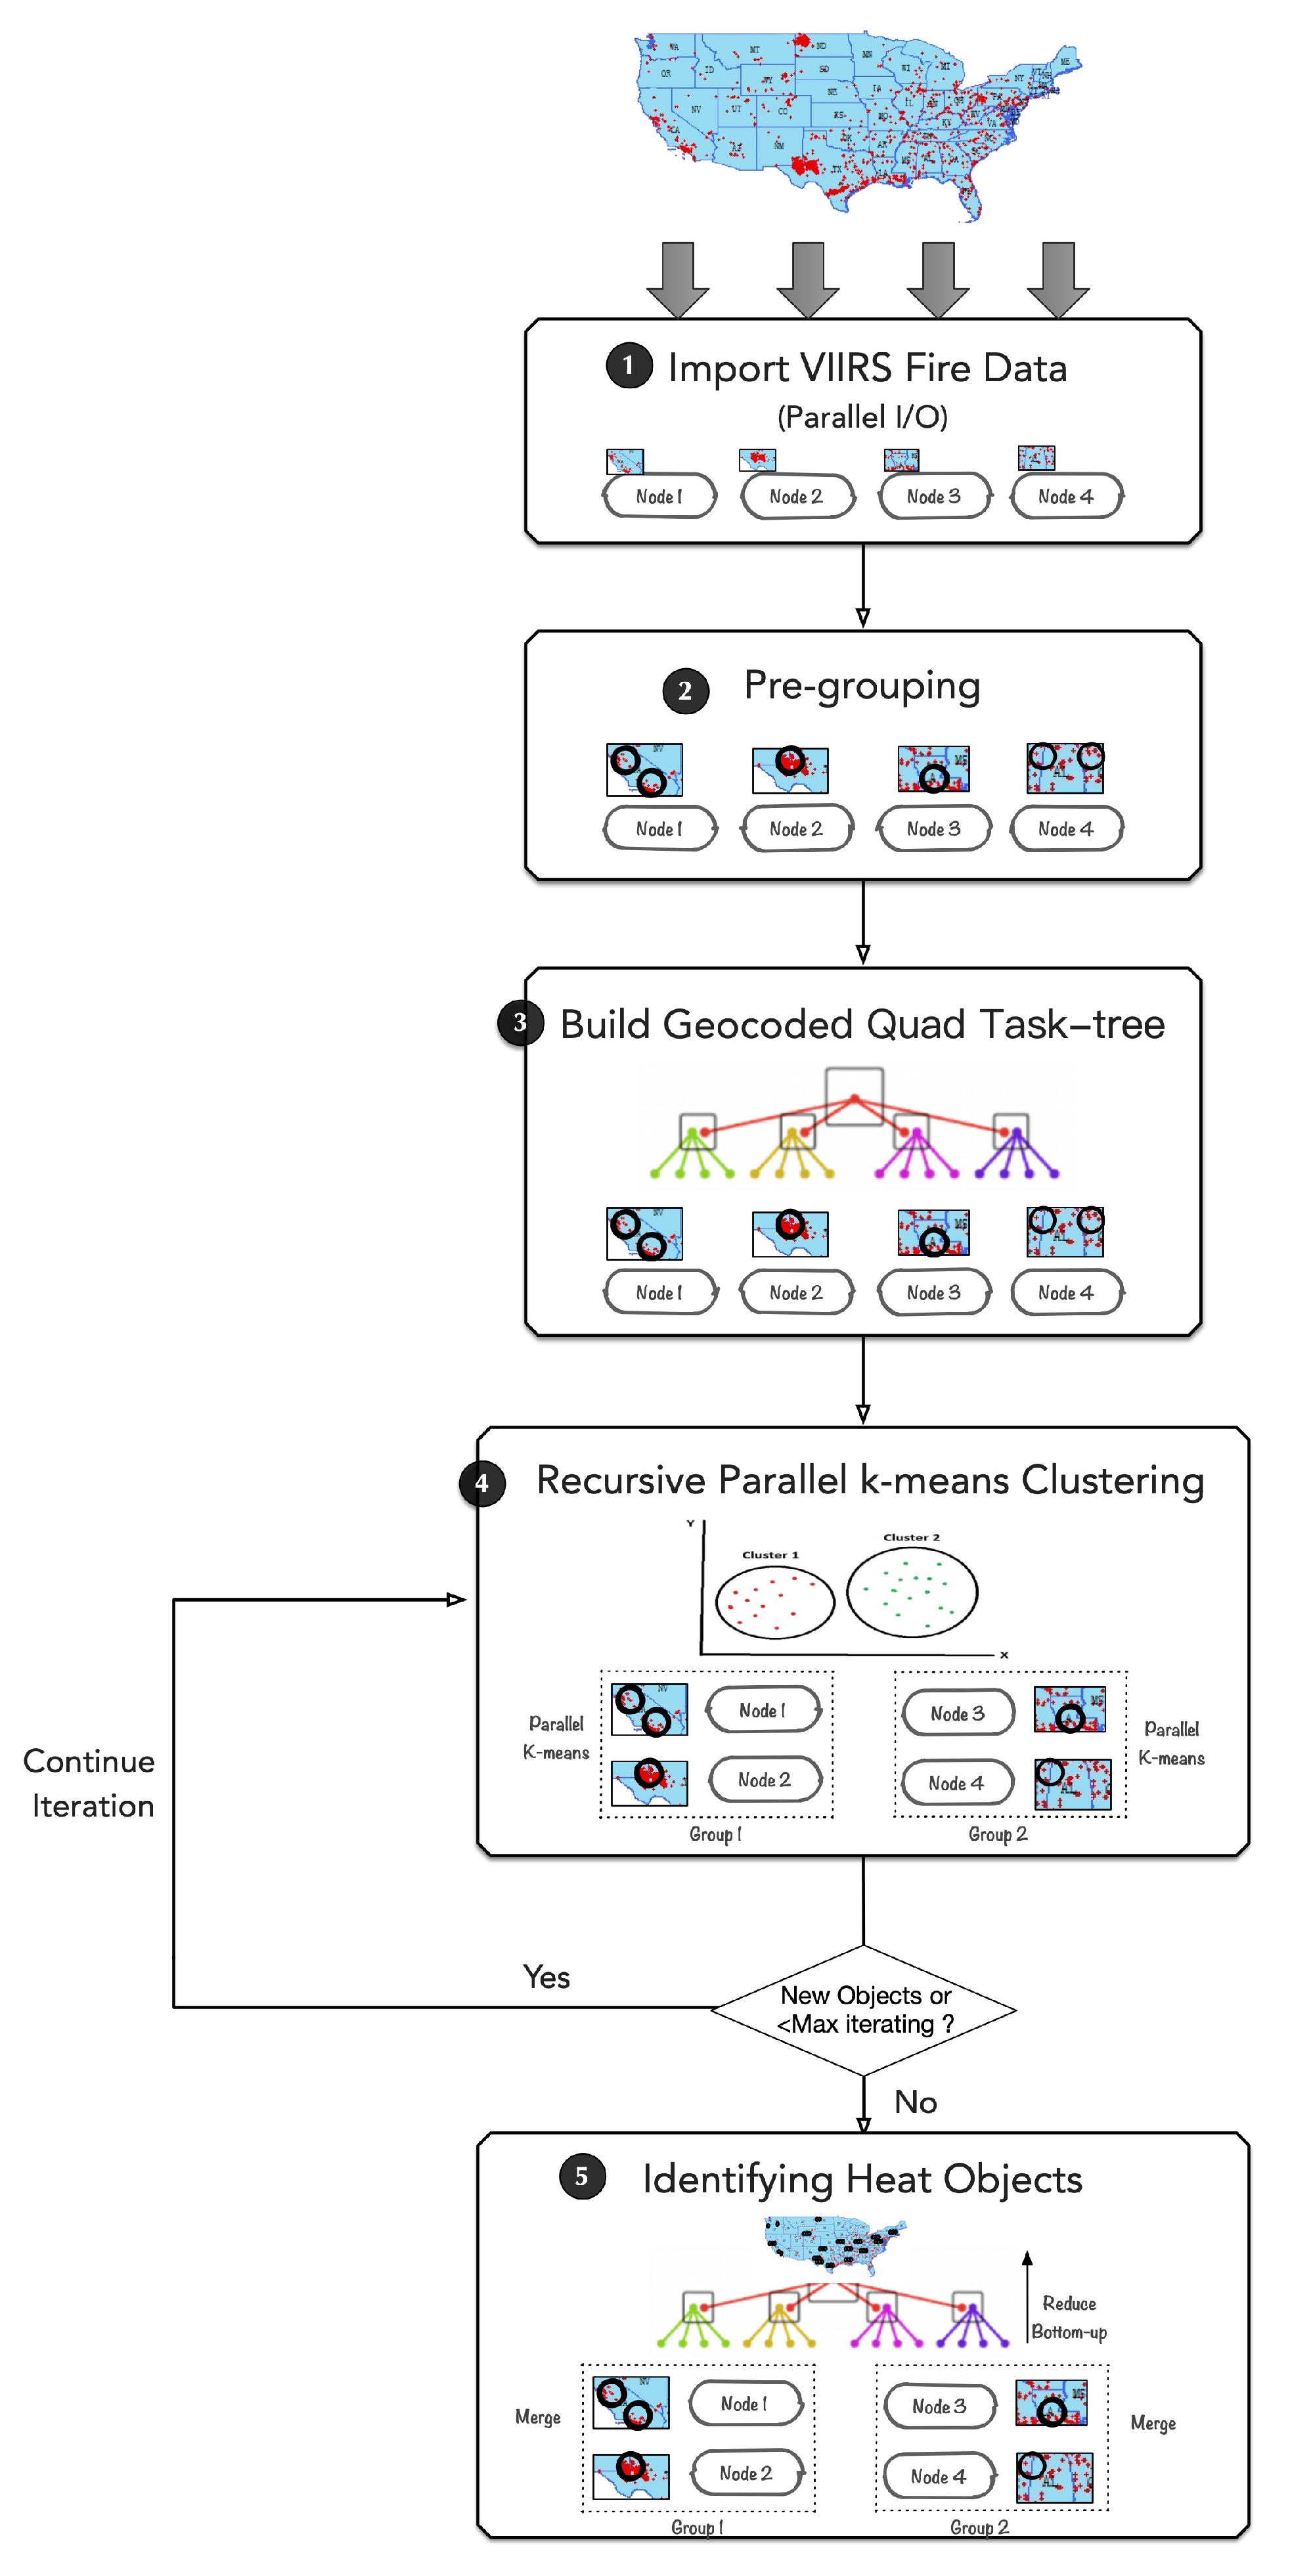
Data importing with Parallel I/O: Firstly, 3,461,260 time-series VIIRS active fire-point data ranging from 2012 to 2018 and covering the whole United States are extracted from the VNP14IMG global datasets. For I/O performance consideration, each computing node adopts an asynchronous parallel I/O operation to concurrently load in its own part of the data. These loaded fire data points are then imported into a heat point stack.
-
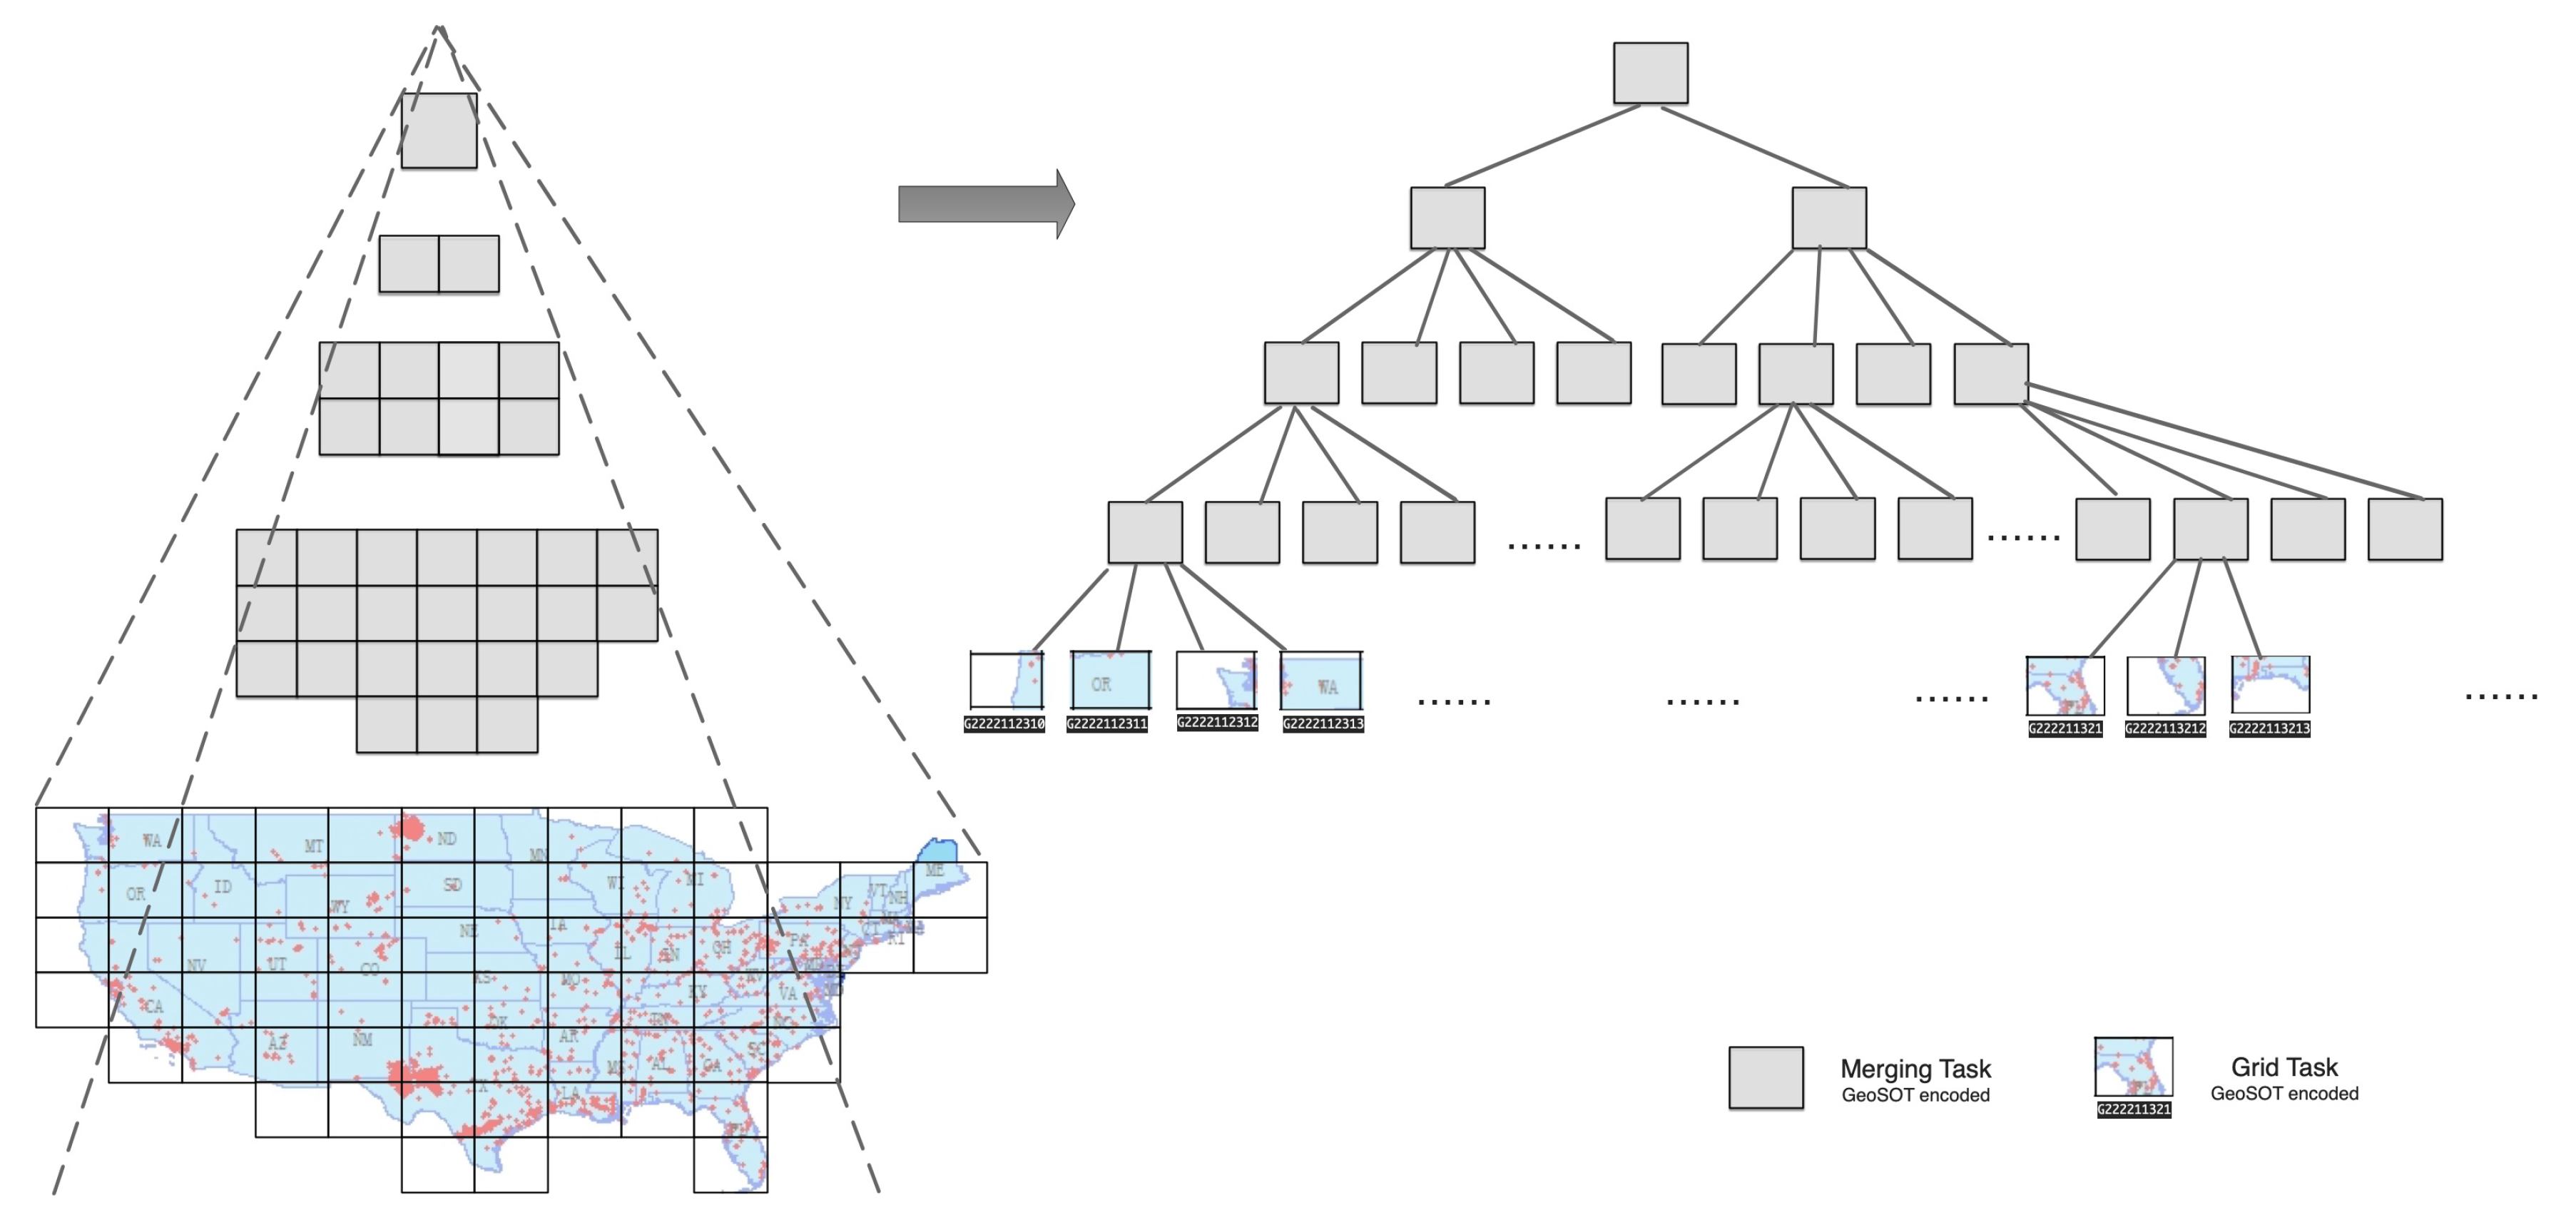
Building the geocoded quad task-tree: Secondly, following a GeoSOT global division, the local fire points in the stack of each computing node are geographically pre-grouped into initial grid tasks and are also regarded as the initial cluster center. Then, each pre-grouped grid task is encoded with a GeoSOT geographical code. Following binary-tree communication, a reduced operation over all the computing nodes is conducted to merge the grid tasks with the same geocode, and heat points inside are re-arranged. Thereafter, in a bottom-up way, a quad task-tree is built out of these grid tasks by connecting them with their neighbor grid tasks according to the GeoSOT code. The grid tasks in the tree are treated as bags of tasks waiting for issued for parallel computing.
-
Recursive parallel k-means clustering: The kernel processing step in the whole procedure. The computing nodes are divided into groups using a group communicator, and the grid tasks in the tree are treated as bags of tasks waiting for issued for parallel computing. Each group of computing nodes simultaneously implements recursive parallel k-means clustering with an empirical cluster number k of 2 on one selected grid task. During each iteration, the odd fire points that are extremely far from the cluster center are filtered out. Following that, the heat points in each grid task are recursively segmented until the recursive convergence condition shows that there are no more new cluster objects anymore. Moreover, a distributed, shared-memory-based data structure of heat objects is also built to ease and optimize the data communication across nodes. Eventually, the potential candidate industrial heat objects can be detected in each grid task.
-
Identifying heat objects: Finally, reduce all the grid tasks following the geocoded quad task-tree in a bottom-up way. The overlapped heat objects are merged in order to avoid fake objects result from over-segmentation. Whether the overlapped heat objects are merged or not is judged by the distance of objects and the size of the overlapping region. Finally, all the industrial heat objects can be identified.

4.1. Building a GeoSOT-Encoded Quad Task-Tree

When scaling to a large area, the long time-series industrial heat source detection is extremely complicated by the incredibly large-scale data clustering of up to millions of high-dimensional fire-points data. To tackle the tremendous computation introduced by this large-scale data clustering problem, a many-task computing approach with a GeoSOT-encoded quad task-tree is proposed here for optimization. According to the geographical-invariance and local aggregation feature of the industrial heat sources, a grid-task-based pre-grouping method is employed for an initial clustering. Following that, the huge scale data clustering problem can not only be naturally broken down into small grid tasks but also the blindness exists in the clustering of large amounts of data that may be settled. Then, by using a GeoSOT global division method, a GeoSOT-encoded quad task-tree is built out from the great number of grid tasks. The grid tasks inside the tree could subsequently be implemented in parallel as bags of tasks following a bottom-up order.

4.1.1. Pre-Grouping Based on GeoSOT Global Division

Differently from the natural biomass burnings or wildfires, the existing industrial heat sources are normally static and persistent. The fire hotspots or thermal anomalies from industrial heat emitters have their own spatial and temporal aggregation characteristics. Actually, the fire hotspots in the VIIRS active fire products could be found closely gathered around the small areas near the heart centers of the industrial heat sources [24]. In other words, a group of spatially aggregated fire hotspots would be identified as candidates for industrial heat emitters with a higher probability. In a normal data clustering procedure, all data are involved in the calculation for each cluster center. However, in a millions-of-points-scale data clustering scenery, it seems unwise and even quite naive to put all the fire hotspots together for calculation. This is mainly because only the spatially and temporally adjacent fire hotspots have effective roles in determining the cluster centers of the industrial heat objects. The enormous calculation burden introduced by the majority of the other faraway fire hotspots appears to be totally unnecessary. Therefore, to greatly reduce complexity and avoid over-segmentation, a GeoSOT global-division-based pre-grouping is employed as initial clustering. The main mechanism of the re-grouping procedure is depicted in Figure 4.
The flow chart and the parallel implementation procedure goes as follows:
-
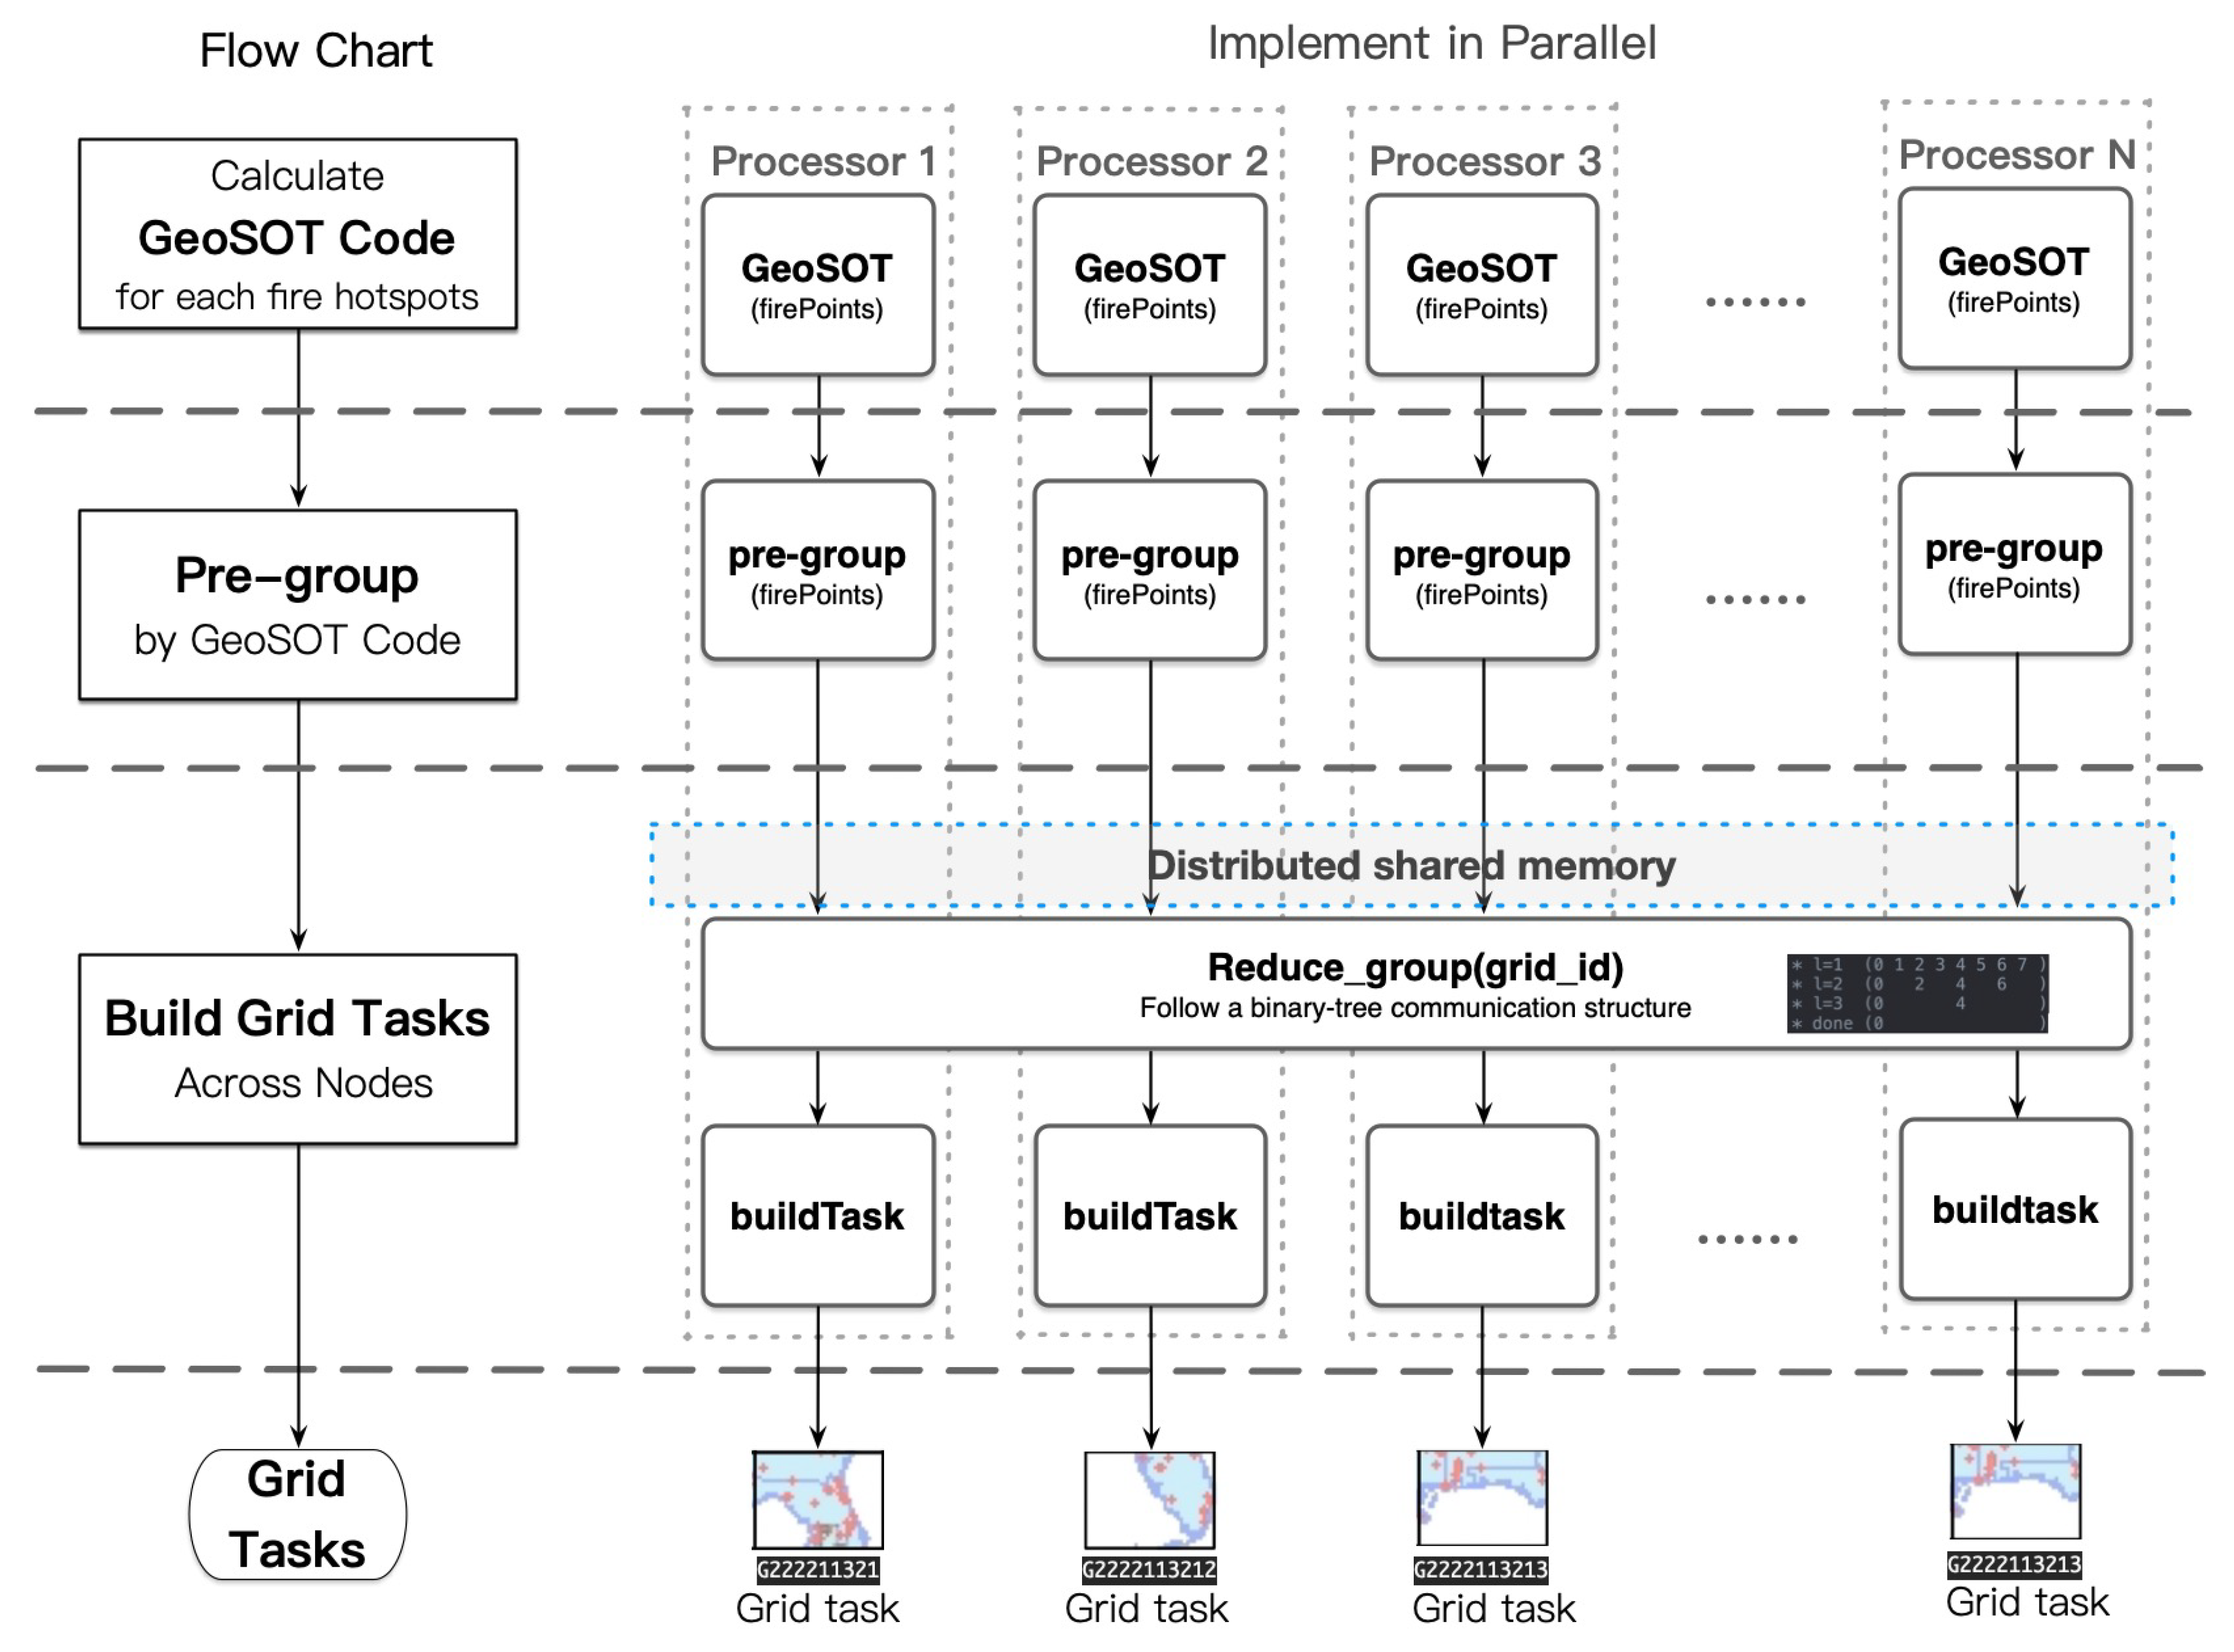
Firstly, calculate GeoSOT code for fire hotspots to find exact grids the fires are in. Each processor calculates the GeoSOT-encoded grid ID for each fire hotspot located in a local fire hotspots stack according to the GeoSOT global division method. With the longitude and latitude values of the fire hotspots in the geographic coordinate system as well as the size of the basic grid cell, the GeoSOT-encoded grid ID can be easily determined with the GeoSOT discrete grid model. Here, we adopt a maximum level of 33 for the GeoSOT model, since a tiny grid size could always lead to over-segmentation of objects.
-
Then, pre-group the fire hotspots by their GeoSOT codes. The processor then creates a stack to store these fire hotspots groups and checks the tagged fire hotspots. If the GeoSOT codes of the tagged fire hotspots are totally new, then it creates a new group tagged with this GeoSOT grid ID and puts this new group into a group stack. Otherwise, if there already exists a group tagged with this GeoSOT code, then it inserts these fire hotspots into this group. Then, if the stack of fire hotspots is not empty, it goes back to calculate its GeoSOT-encoded grid ID and does the pre-grouping until all the fire hotspots are handled.
-
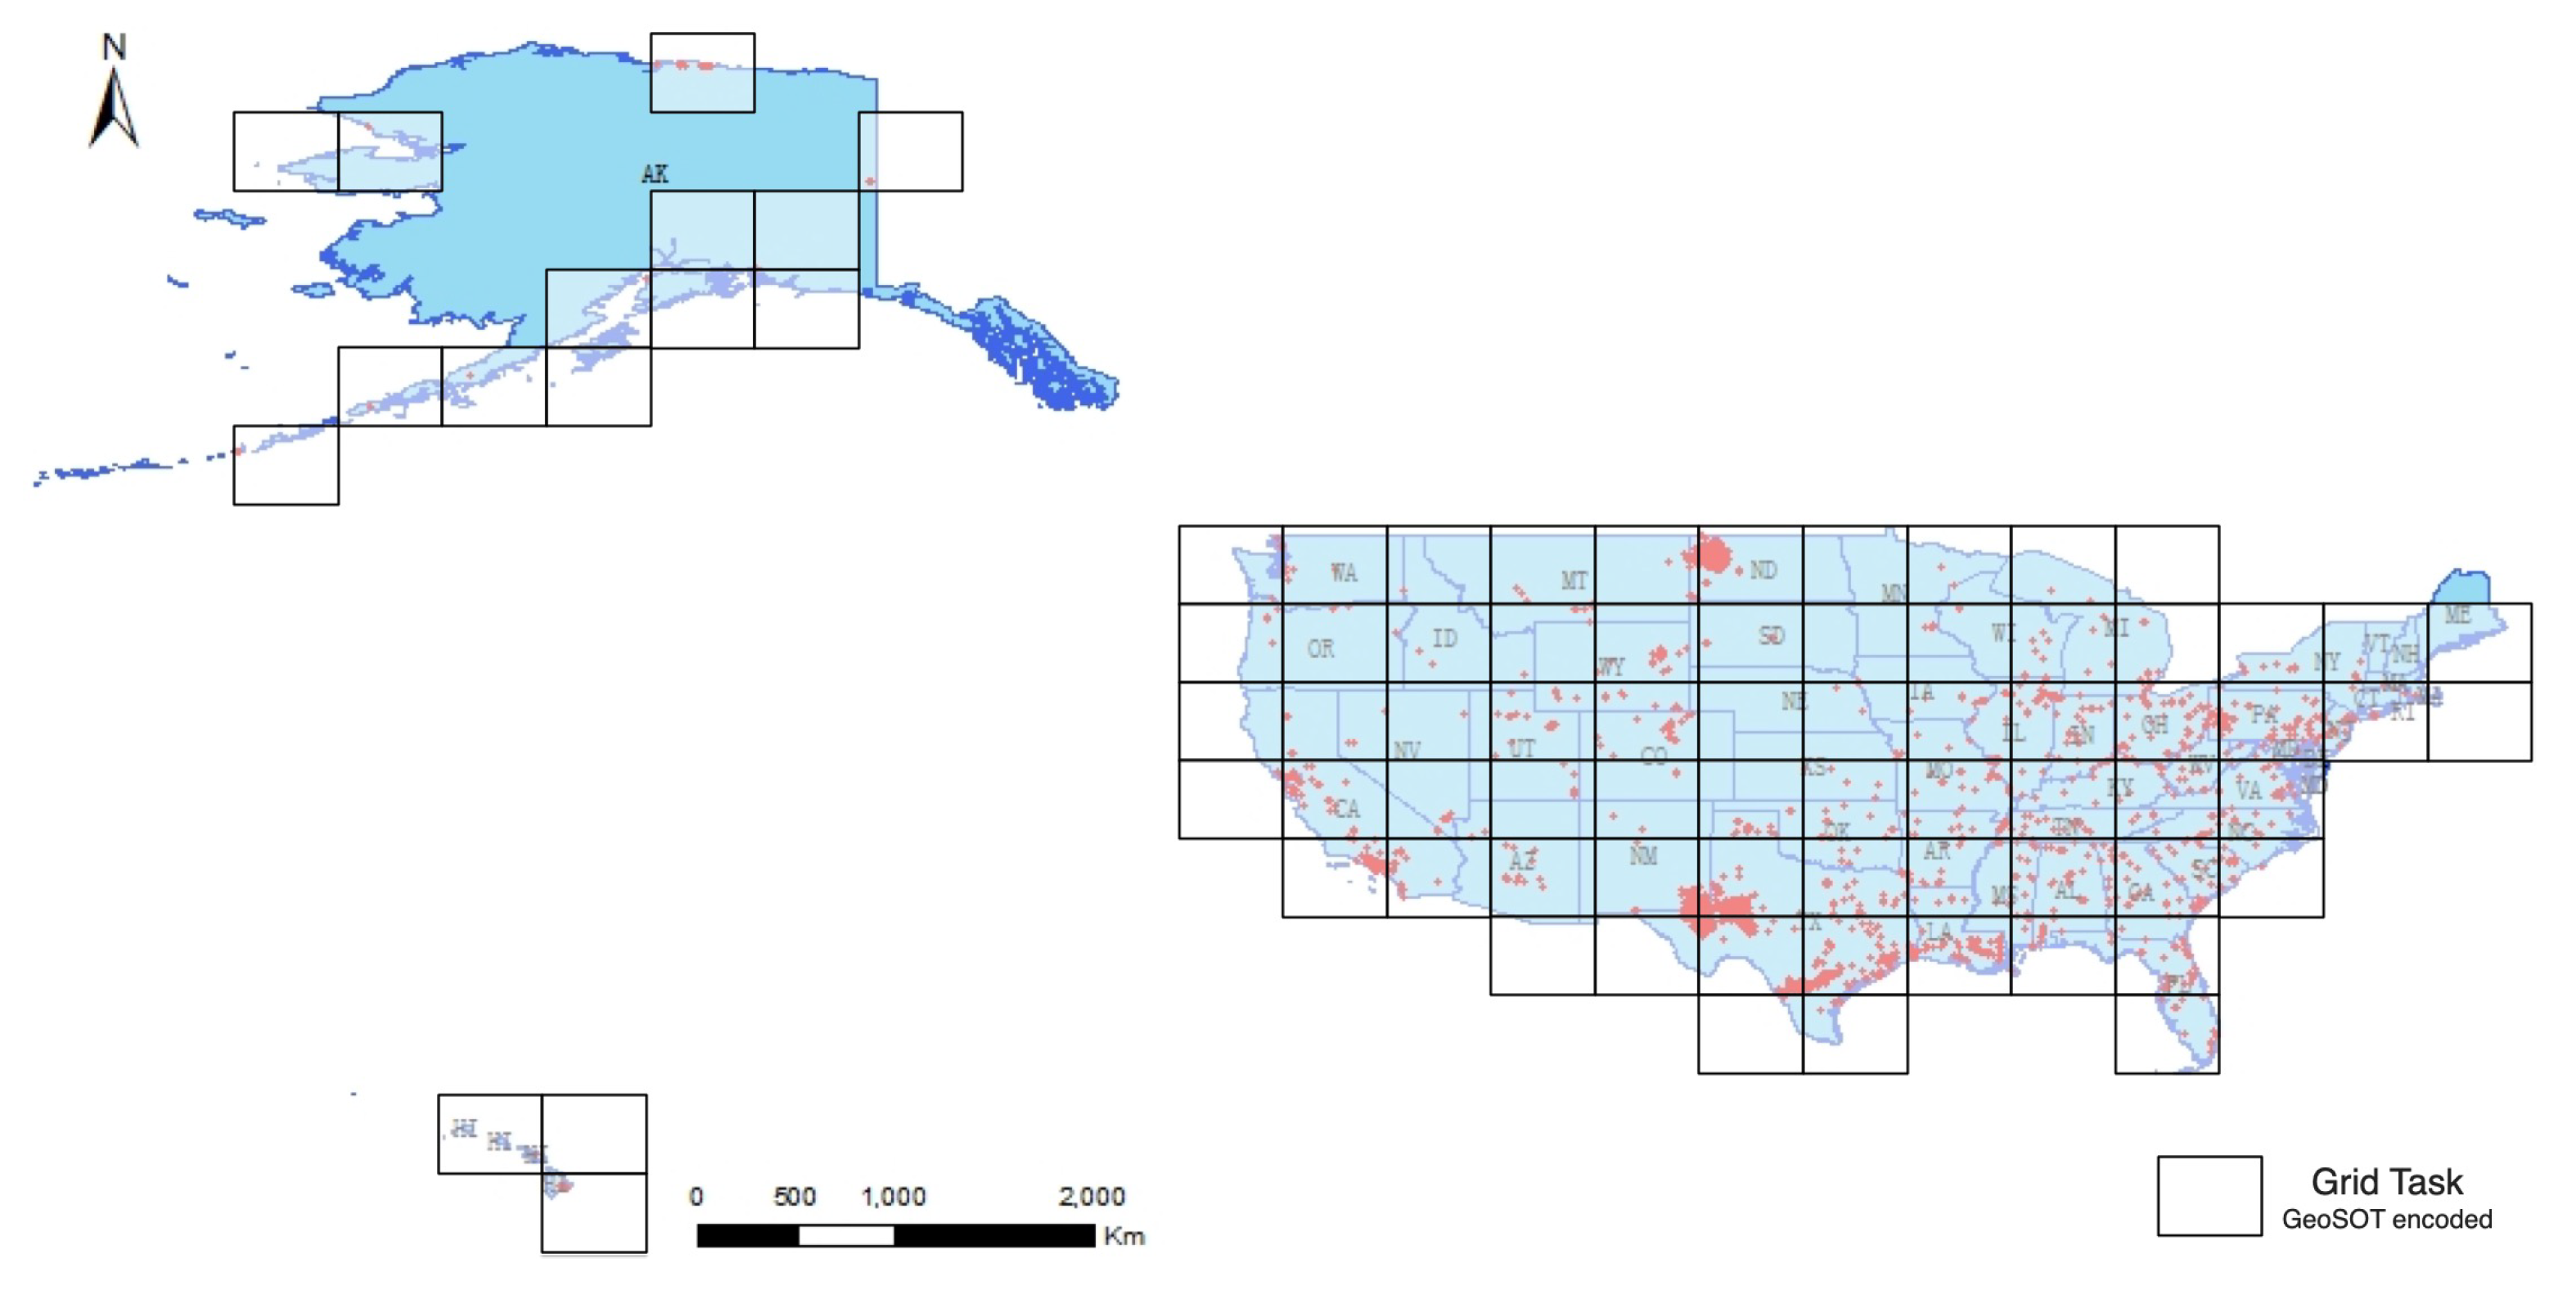
Finally, build the GeoSOT-encoded grid tasks across processors. After all the fire hotspots in each processor are locally pre-grouped, these initial fire hotspot groups with the same GeoSOT grid code are still randomly scattered across the processors. Thus, reducing these initial groups is inevitable. For performance consideration, a binary-tree communication structure is employed for reducing the fire hotspot groups. Following a bottom–top order along the binary communication tree, each processor P i reduces the initial fire hotspot groups with its near neighbor P i + 1 . In a case in which these two processors both have fire hotspot groups with the same GeoSOT grid ID, they are merged to a single group. Afterward, the reduced processor P i continues to reduce with the P i + 2 k (where k is the depth of the binary-tree) until the root processor. Eventually, a GeoSOT-encoded grid task is built out from the reduced initial fire hotspot group in which all fire hotspots in the same GeoSOT grid are merged. In order to ease the data exchanging among the binary-tree communication structure, virtual distributed shared memory across processors is constructed with a one-side communication operator of MPI (Message Passing Interface). Each processor puts its initial fire hotspots group stack data into the virtual distributed shared memory for easy sharing with neighboring processors.
Accordingly, following the GeoSOT discrete grid model, the fire hotspots spatially located in the same GeoSOT grid cell are segmented into an initial group. Then these initial groups of fire hotspots are built as GeoSOT-encoded grid tasks for clustering. As is demonstrated in Figure 5, the extremely complicated large-scale clustering problem has naturally been broken down into a great deal of GeoSOT grid tasks of clustering that can be implemented in parallel. Moreover, unlike a static top-down global division, only the GeoSOT grid with a certain number of fire hotspots is grouped as a valid grid task instead of generating any empty grid tasks. The determining of the size of the grid cell is a trade-off between computation and over-segmentation. If the grid cell is too small, it will give rise to the over-segmentation of industrial heat objects. On the contrary, if the cell grid is much too big, then it will increase the computing complexity of clustering inside the grid task and eventually cause poor parallelism and discouraging performance. Here a grid cell is empirically defined as a square area with a size of 0.5 × 0.5 .

4.1.2. Building a Distributed, GeoSOT-Encoded Quad Task-Tree

In a case wherein the grid task is built through initial pre-grouping, a GeoSOT-encoded task-tree could then be built across the processors for the subsequent data clustering. As is shown in Figure 6, there are two kinds of task nodes in the GeoSOT-encoded task tree. The bottom leaf node is the grid task which is responsible for implementing clustering operation among the fire hotspots so as to detect candidate industrial heat sources. The other intermediate node is a merging task that merges the candidate industrial heat sources generated from four neighbor grid tasks. This is mainly because though the GeoSOT global division could break down the large-scale clustering into small clustering grid tasks with lower complexity, it also tears apart the underlining industrial heat sources located around the boundaries of the cell grids. This also means the decomposition of the tasks could by-produce the over-segmentation of the objects. Therefore, a GeoSOT-encoded task tree is proposed here for sewing the chopped objects back efficiently.
The GeoSOT-encoded task tree is built following a bottom-up manner. Firstly, the grid tasks built from initial grouping are directly taken as the leaf task nodes. Thereafter, the GeoSOT code of the upper-level of each grid task is calculated, namely, the GeoSOT code of its parent node. When more than two grid tasks have the same parent GeoSOT code, a merging task node is generated and these grid tasks are treated as the children of this merging task. Following that, the whole task tree can be built until the root merging task is generated. Thus, the detection of the industrial heat sources turns into finding the centers of areas with relatively high densities of thermal anomalies.

4.2. Optimized Recursive k-means Clustering in Parallel

Relying on the spatial and temporal aggregation feature of the industrial heat emitters, the detection of the static and persistent industrial heat objects may turn out to be a search for the centers of areas with relatively higher densities of thermal anomalies than neighbors. Meanwhile, the data clustering algorithms [26] following the notion of clusters are in pursuit of finding out high-density regions separated by low-density regions. From this perspective, the data clustering-based approach seems to be a more appropriate way over the traditional index-based or empirical frequency-based methods, wherein k-means is still one of the most prevalent and efficient clustering algorithms, since it performs a most graceful trade-off between clustering efficiency and computational complexity. Nevertheless, choosing the proper parameters for k-means algorithm is anything but easy, especially the most critical choice of the number of the clusters and the initial cluster center, which is the most difficult problem in data clustering. Anyway, there is no existing perfect criterion for choosing these parameters. Generally, the currently available ways are some heuristics-based methods [40] and the empirical way of choosing from multiple independent attempts of different k values and different initializations. Nevertheless, it is almost impracticable to determine the parameter k in advance in the scenario of millions of fire hotspots with no idea of the number of potential industrial heat sources.
Therefore, the optimized recursive parallel k-means clustering demonstrated in Figure 7 is adopted for gradually segmenting and for the final detection of industrial heat sources from enormous fire hotspots. The main idea of this approach is to combine the notion of the hierarchical clustering algorithm together with the partitional idea of k-means. The pre-grouped GeoSOT-encoded grid tasks in G = { X g r i d } , X g r i d X , g r i d = 1 , , g are selected as the initial partition for clustering. Following the divide-and-conquer idea of hierarchical divisive k-means clustering, the fire hotspots inside the pre-grouped grid task are recursively partitioned into k clusters at each step with k-means algorithm. For the kernel k-means clustering, there are a great number of optimized k-means algorithms available, even the parallel implemented versions [41,42,43], wherein a parallel MPI-enabled implementation of k-means is employed for kernel data clustering. For performance consideration, the computing processors are divided into communicator groups and each group is responsible for concurrently executing recursive k-means on each grid task in parallel across processors. Therefore, two-level parallelism is fully exploited for performance optimization.
Let X = { x i } , i = 1 , , n define the set of n d-dimensional fire hostspot points, wherein the fire points are d-dimensional vectors x i = { l a t i t u d e , l o n g t i t u d e , a c q _ t i m e , b r i g h t _ t i 4 , b r i g h t _ t i 5 , , x i ( m ) } , i = 1 , , n , m = 1 , , d . The set of a great number of fire points X is eventually clustered into a set of k clusters, C = { c k } , i = 1 , , k .
The main steps of this optimized recursive parallel k-means clustering algorithm are as follows:
  • Divide the processors into group communicators wherein each group has a number of processors available for implementing parallel k-means data clustering.
  • Choose a pre-grouped GeoSOT-encoded grid task X g r i d for each processor group and take this pre-grouped fire hotspot as an initial partition for clustering.
  • Each group concurrently executes a parallel k-means data clustering algorithm across a group of computing nodes inside their group communicator.
    (a)
    Distribute the fire points in g r i d g across processors inside its group communicator.
    (b)
    Each processor concurrently implements a local k-means data clustering algorithm with a parameter k of K t to generate a new partition of K t sub-clusters and assign patterns to each closest cluster center. Here we choose a K t as four.
    (c)
    Reduce the squared error across the processors inside the group concurrently and minimize J ( c K t ) the sum of the error overall K t clusters.
    J ( c K t ) = k = 1 K t x i c K t x i μ k 2 .
    (d)
    Calculate the new cluster centers: C K t = { c K t } , i = 1 , , K t .
  • Omit new clusters with outlier fire points. When new clusters that cover a relatively reasonable small region also contain a small number of fire points, an outlier object check takes place or can be omitted.
  • Check whether each new cluster is a valid candidate industrial heat object. New clusters that cover a relatively reasonable small region but are not outlier objects are taken as candidates for the industrial heat objects and put into candidate object stacks. Thus, these small new clusters would not be intended for further recursive clustering. The other bigger new clusters c k , 0 < k < K t should be put into cluster stacks for further recursive parallel k-means clustering.
  • Conduct the critical convergence condition. Check if the cluster stack is not empty and then pick one new cluster for further clustering, namely, X g r i d c k ; repeat steps 3 to 5 until there are no new clusters, finally leading to the stability of the cluster membership.

4.3. Identifying Heat Objects through a Geocode-Aware Task-Tree

Once when all the grid tasks have done their work of recursive parallel k-means clustering to detect all the candidate industrial heat objects, plenties of over-segmented fake objects located across the boundary of the adjacent grid still required to be fixed. As is depicted in Figure 8, an identifying with geocode-aware task tree scheduling is employed for gradually sewing the chopped objects and identifying them as final objects following a geo-encoded task tree in a bottom-up way. The main idea of the task-tree-based industrial heat objects identification approach is as follows:
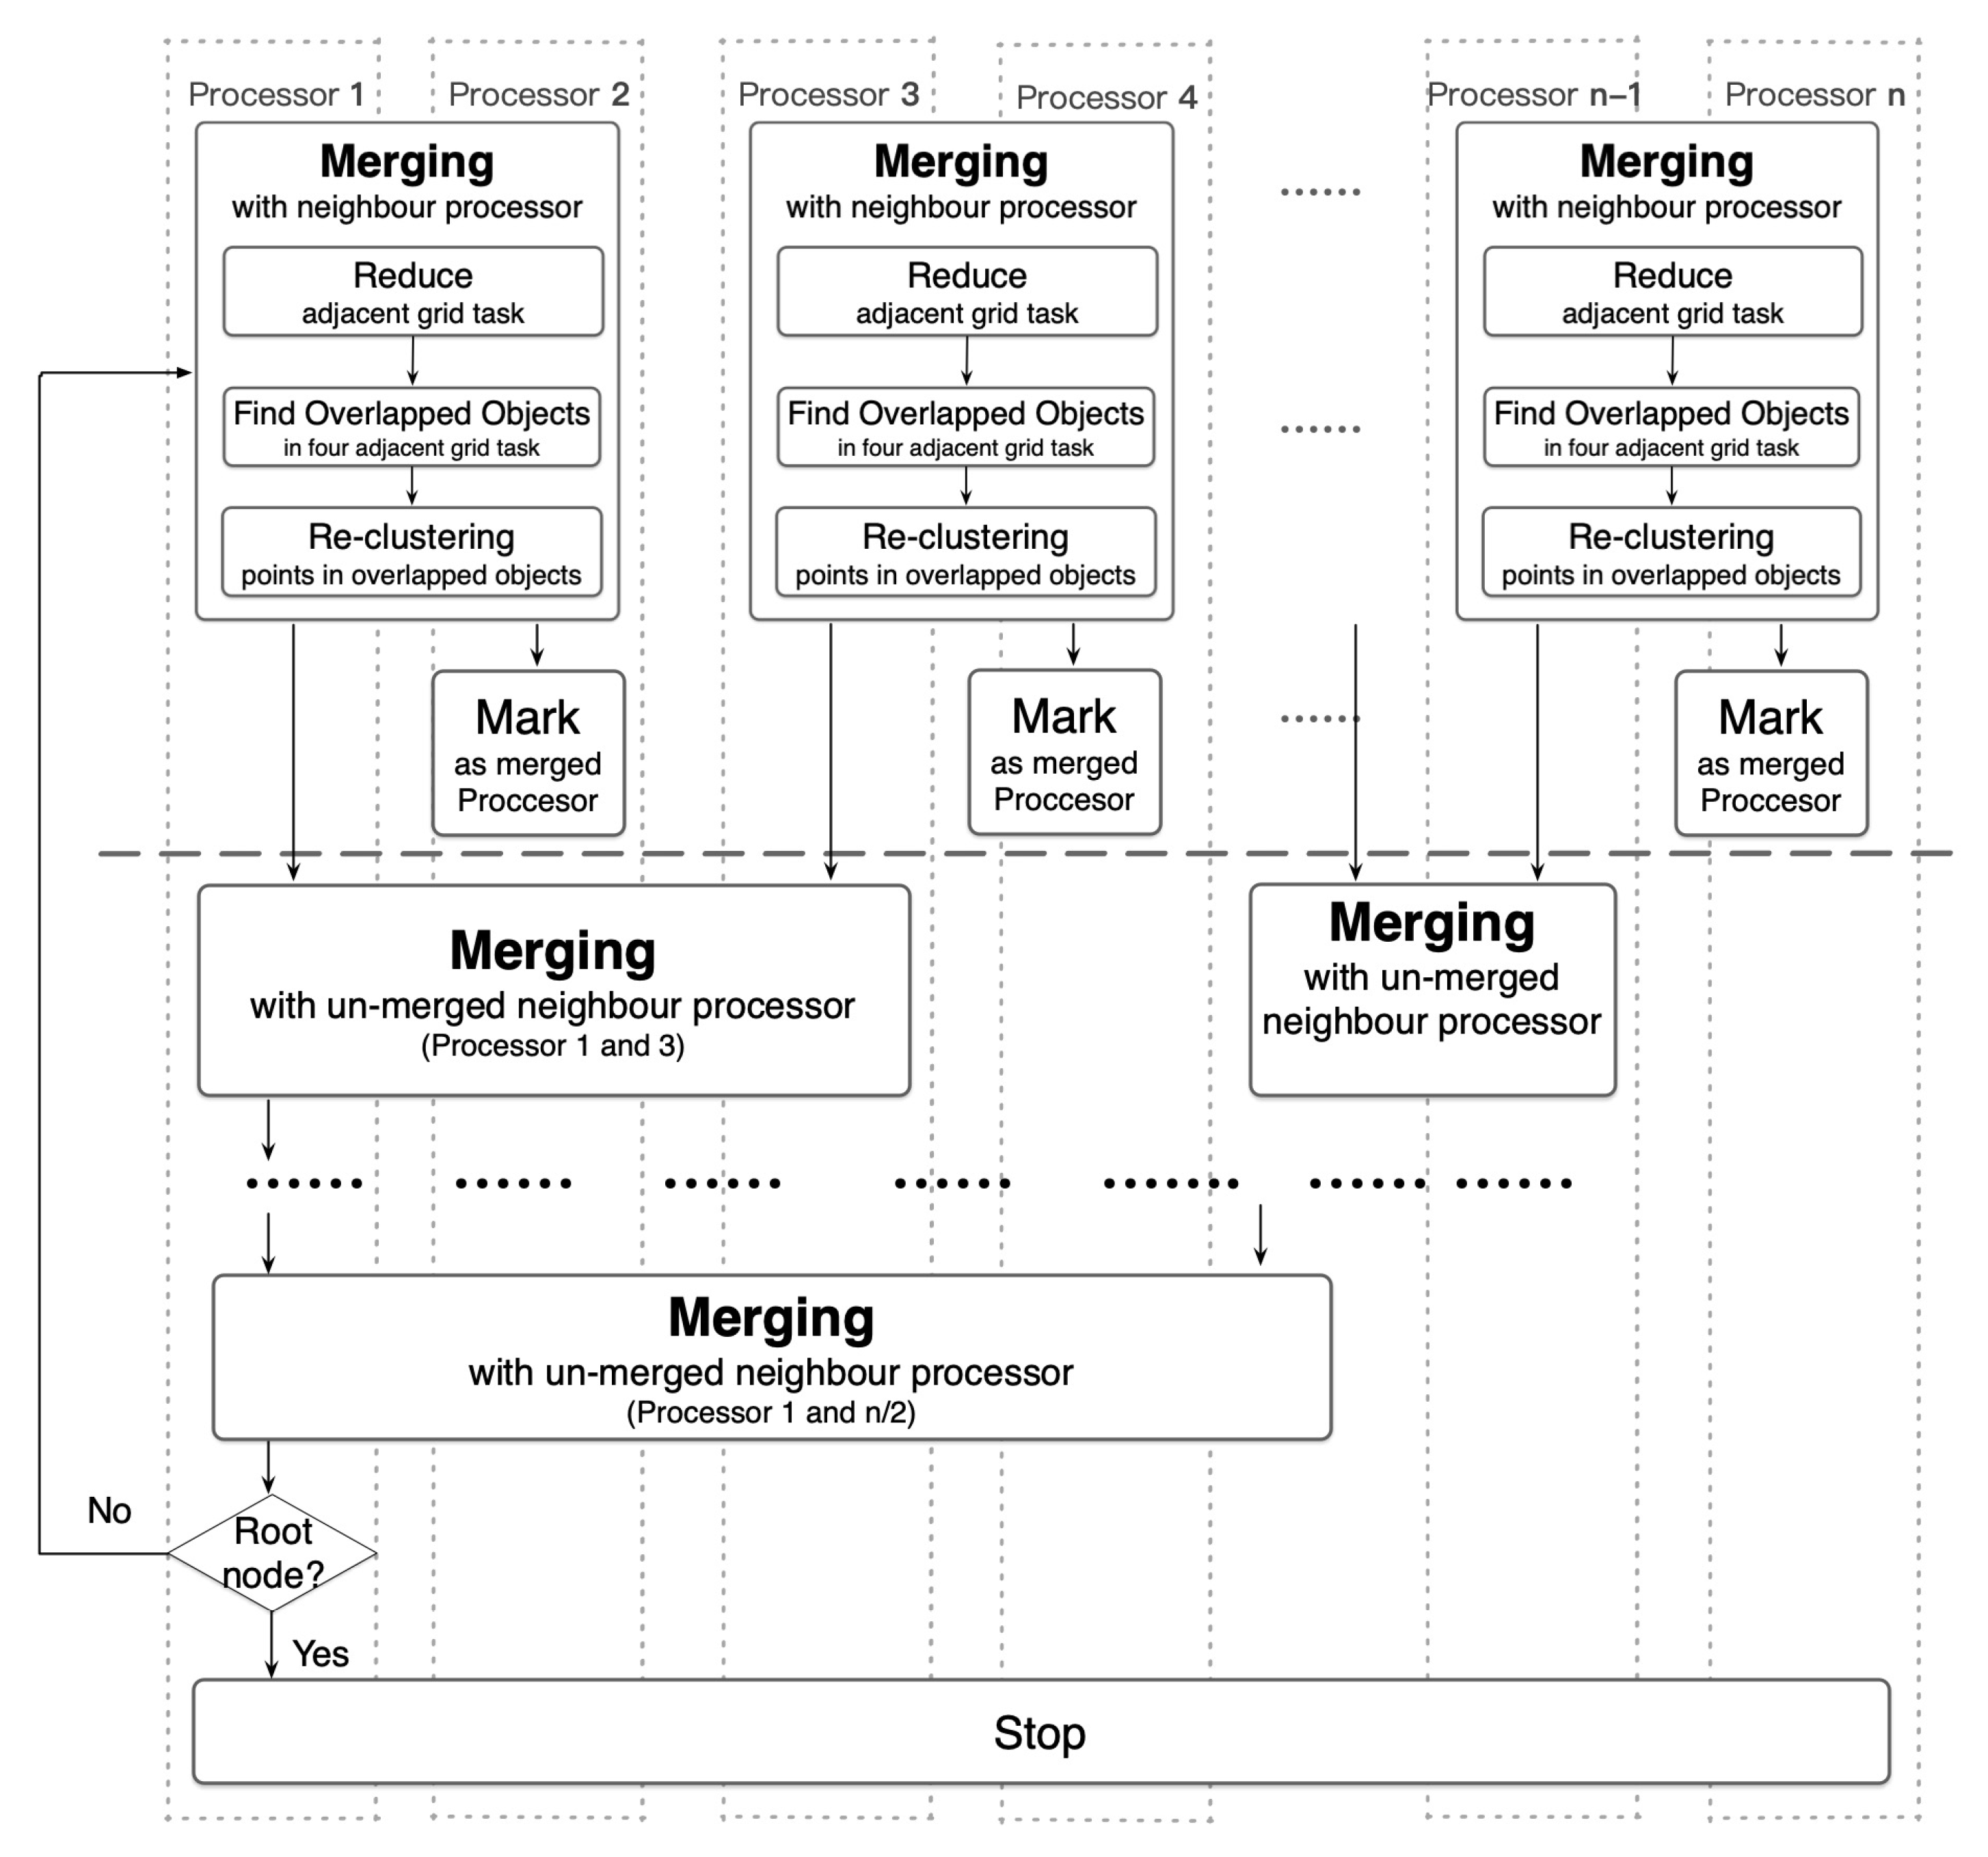
  • Construct a binary-tree structured communication network across processors for a hierarchical merging and reducing of the candidate industrial heat objects, wherein the merging tasks namely non-leaf task nodes in the geo-encoded task tree are responsible for merging and reducing all the over-segmented industrial heat objects.
  • Following a bottom-up way, each un-merged processor conducts task merging with its nearest right un-merged neighbor processor with a bigger id.
    (a)
    Reduce the geographically adjacent grid task nodes that belong to the same farther merging task which encoded with a higher level GeoSOT grid ID in the GeoSOT quad task-tree.
    (b)
    When all the four tasks required for a merging task have all found, find out the overlapping candidate objects along the boundary of grid tasks by judging the distance between objects and the size of overlapping regions.
    (c)
    Then conduct another k-means clustering a second time among all the fire points inside these overlapped candidate heat objects so as to over-come the over-segmenting problem.
  • Mark this processor as a merged processor; repeat step 2 until the root of the task tree.
Accordingly, through a hierarchical merging and re-clustering among overlapped candidate industrial heat objects, the industrial heat sources could be eventually identified.

5. Results

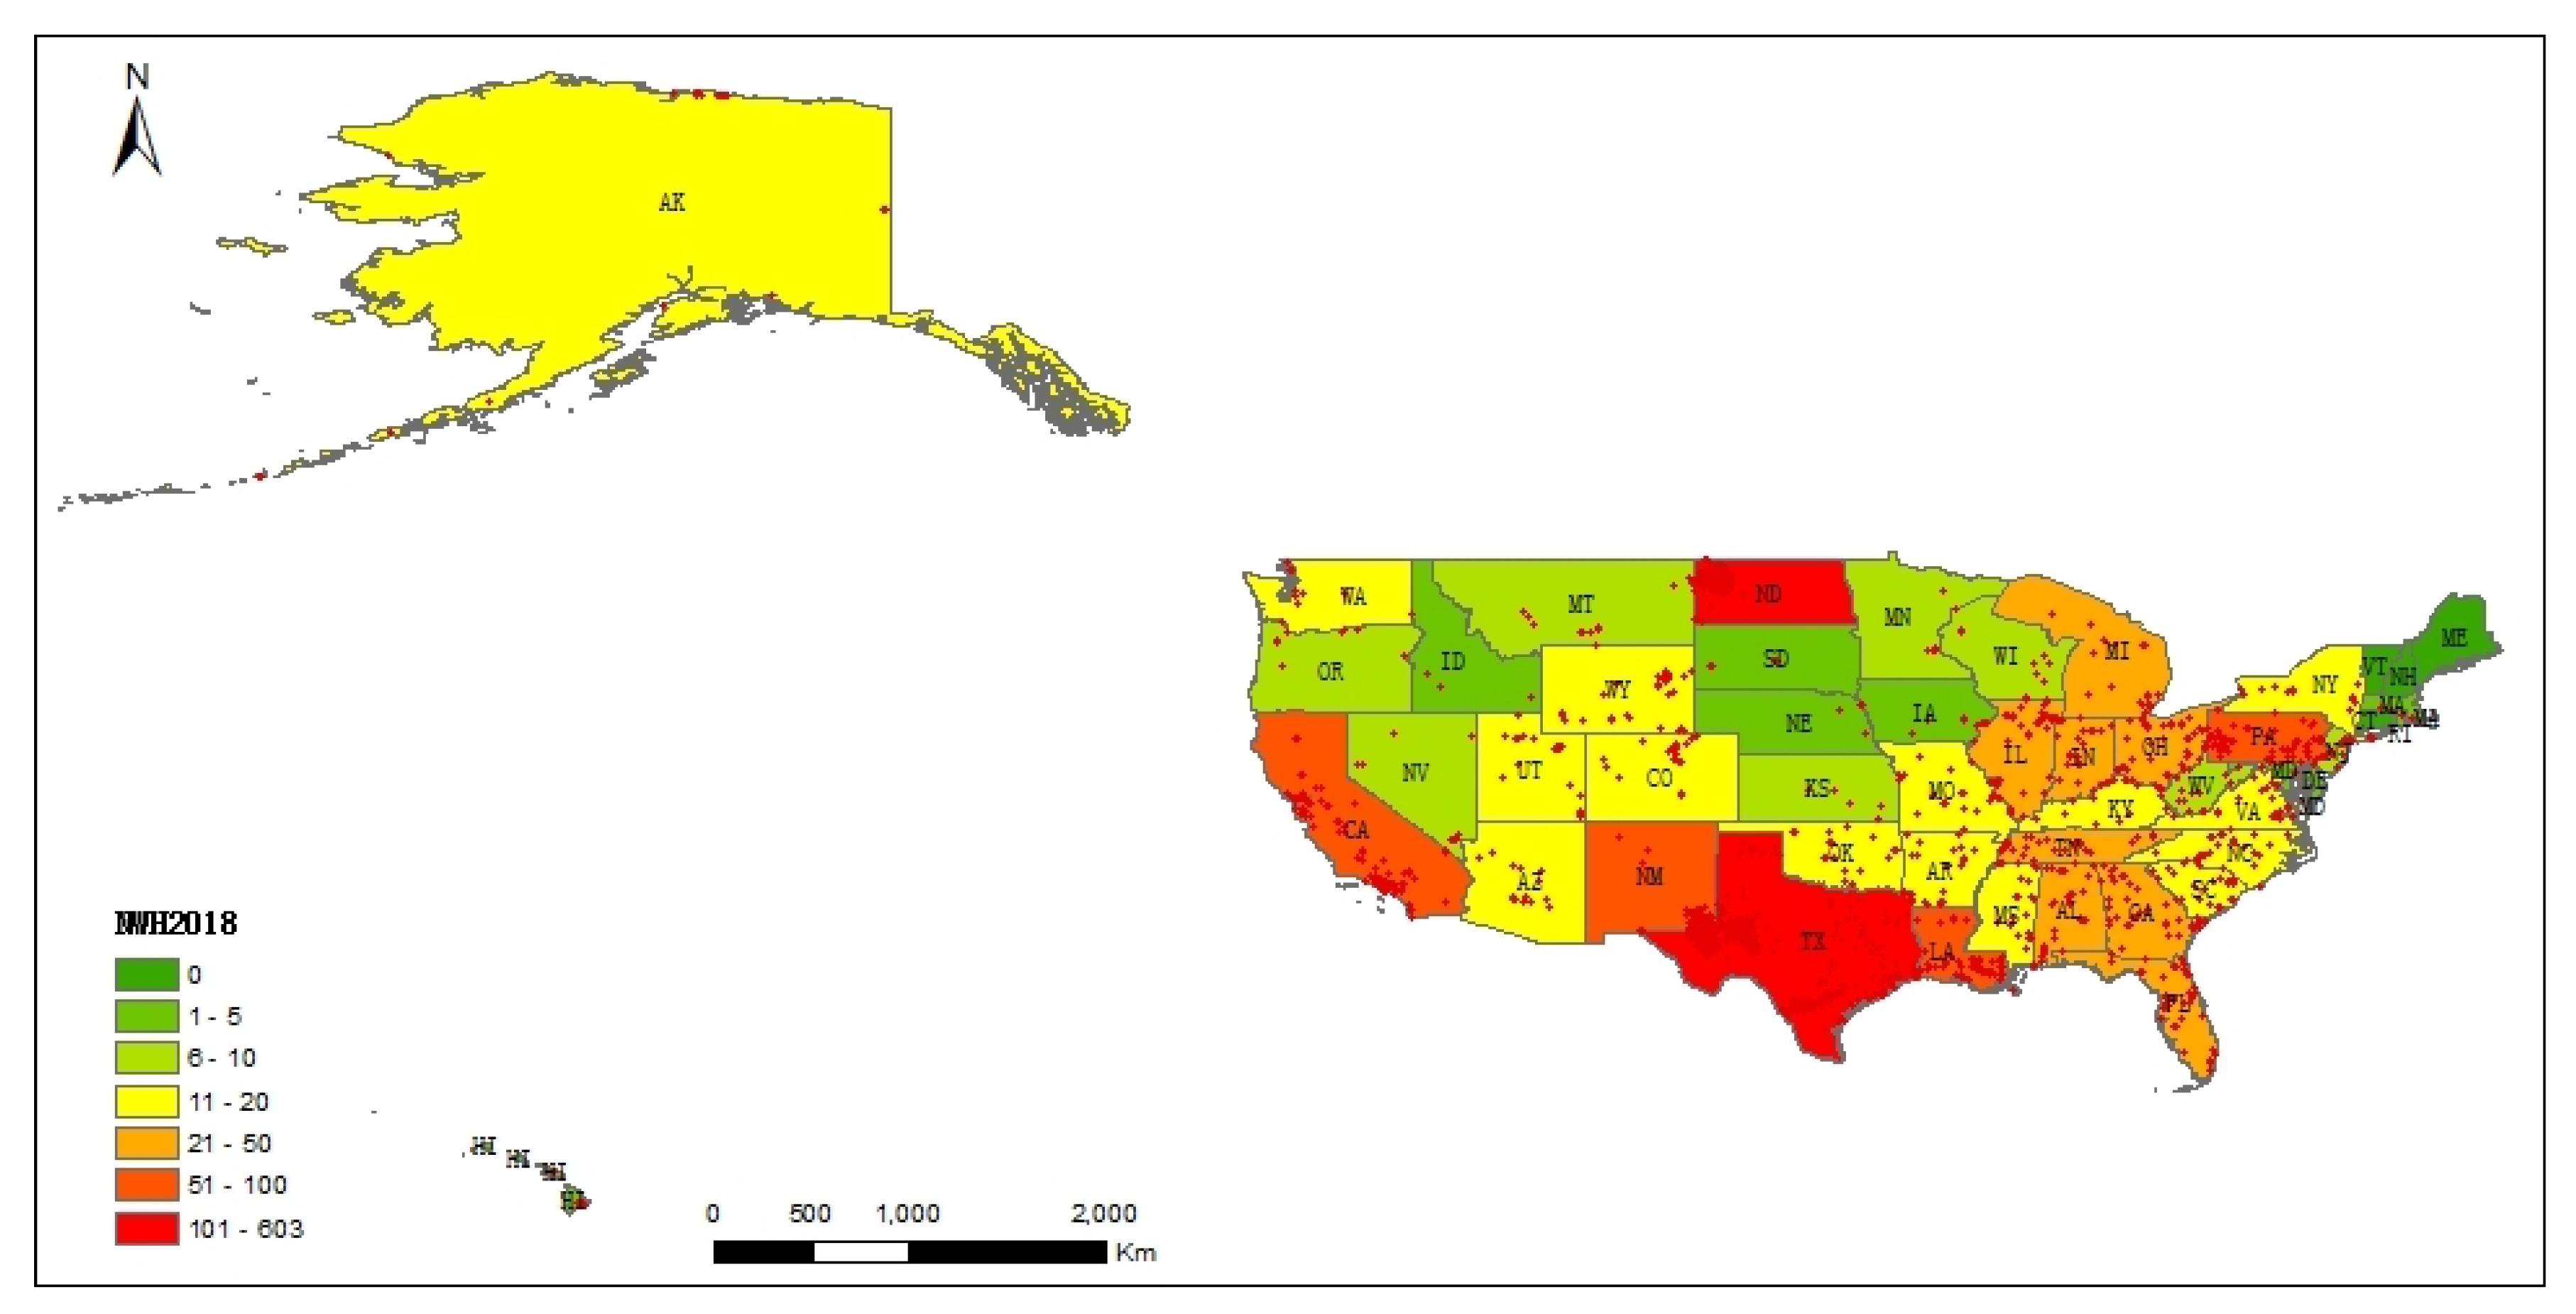
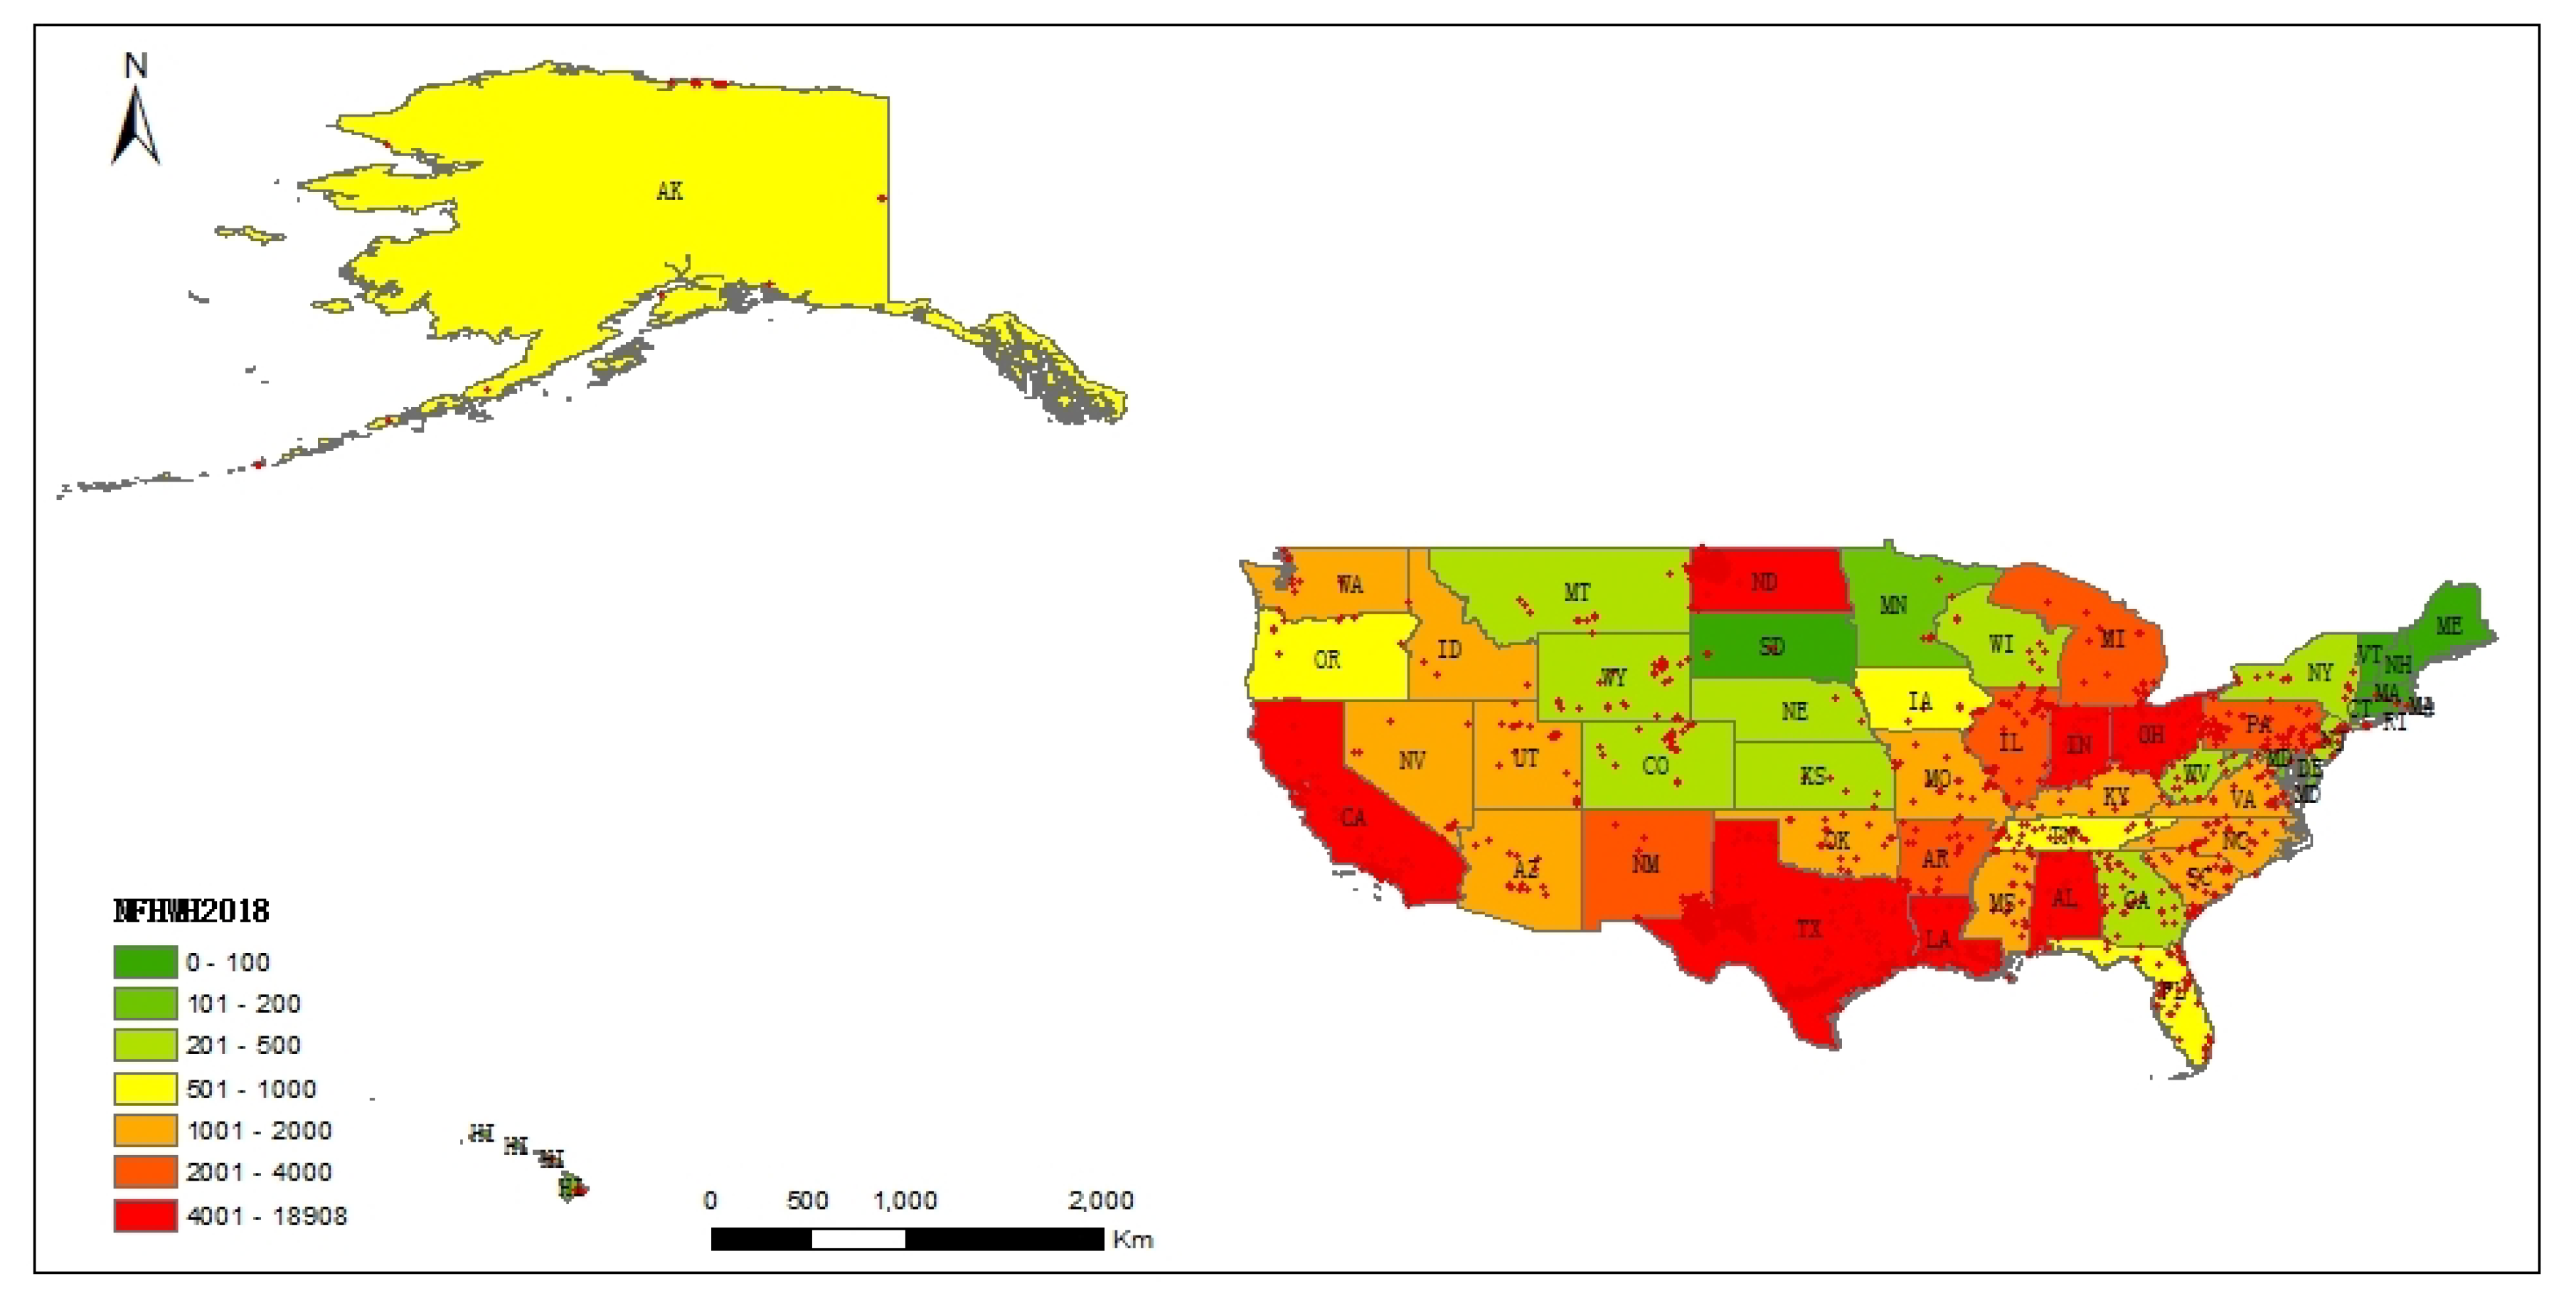
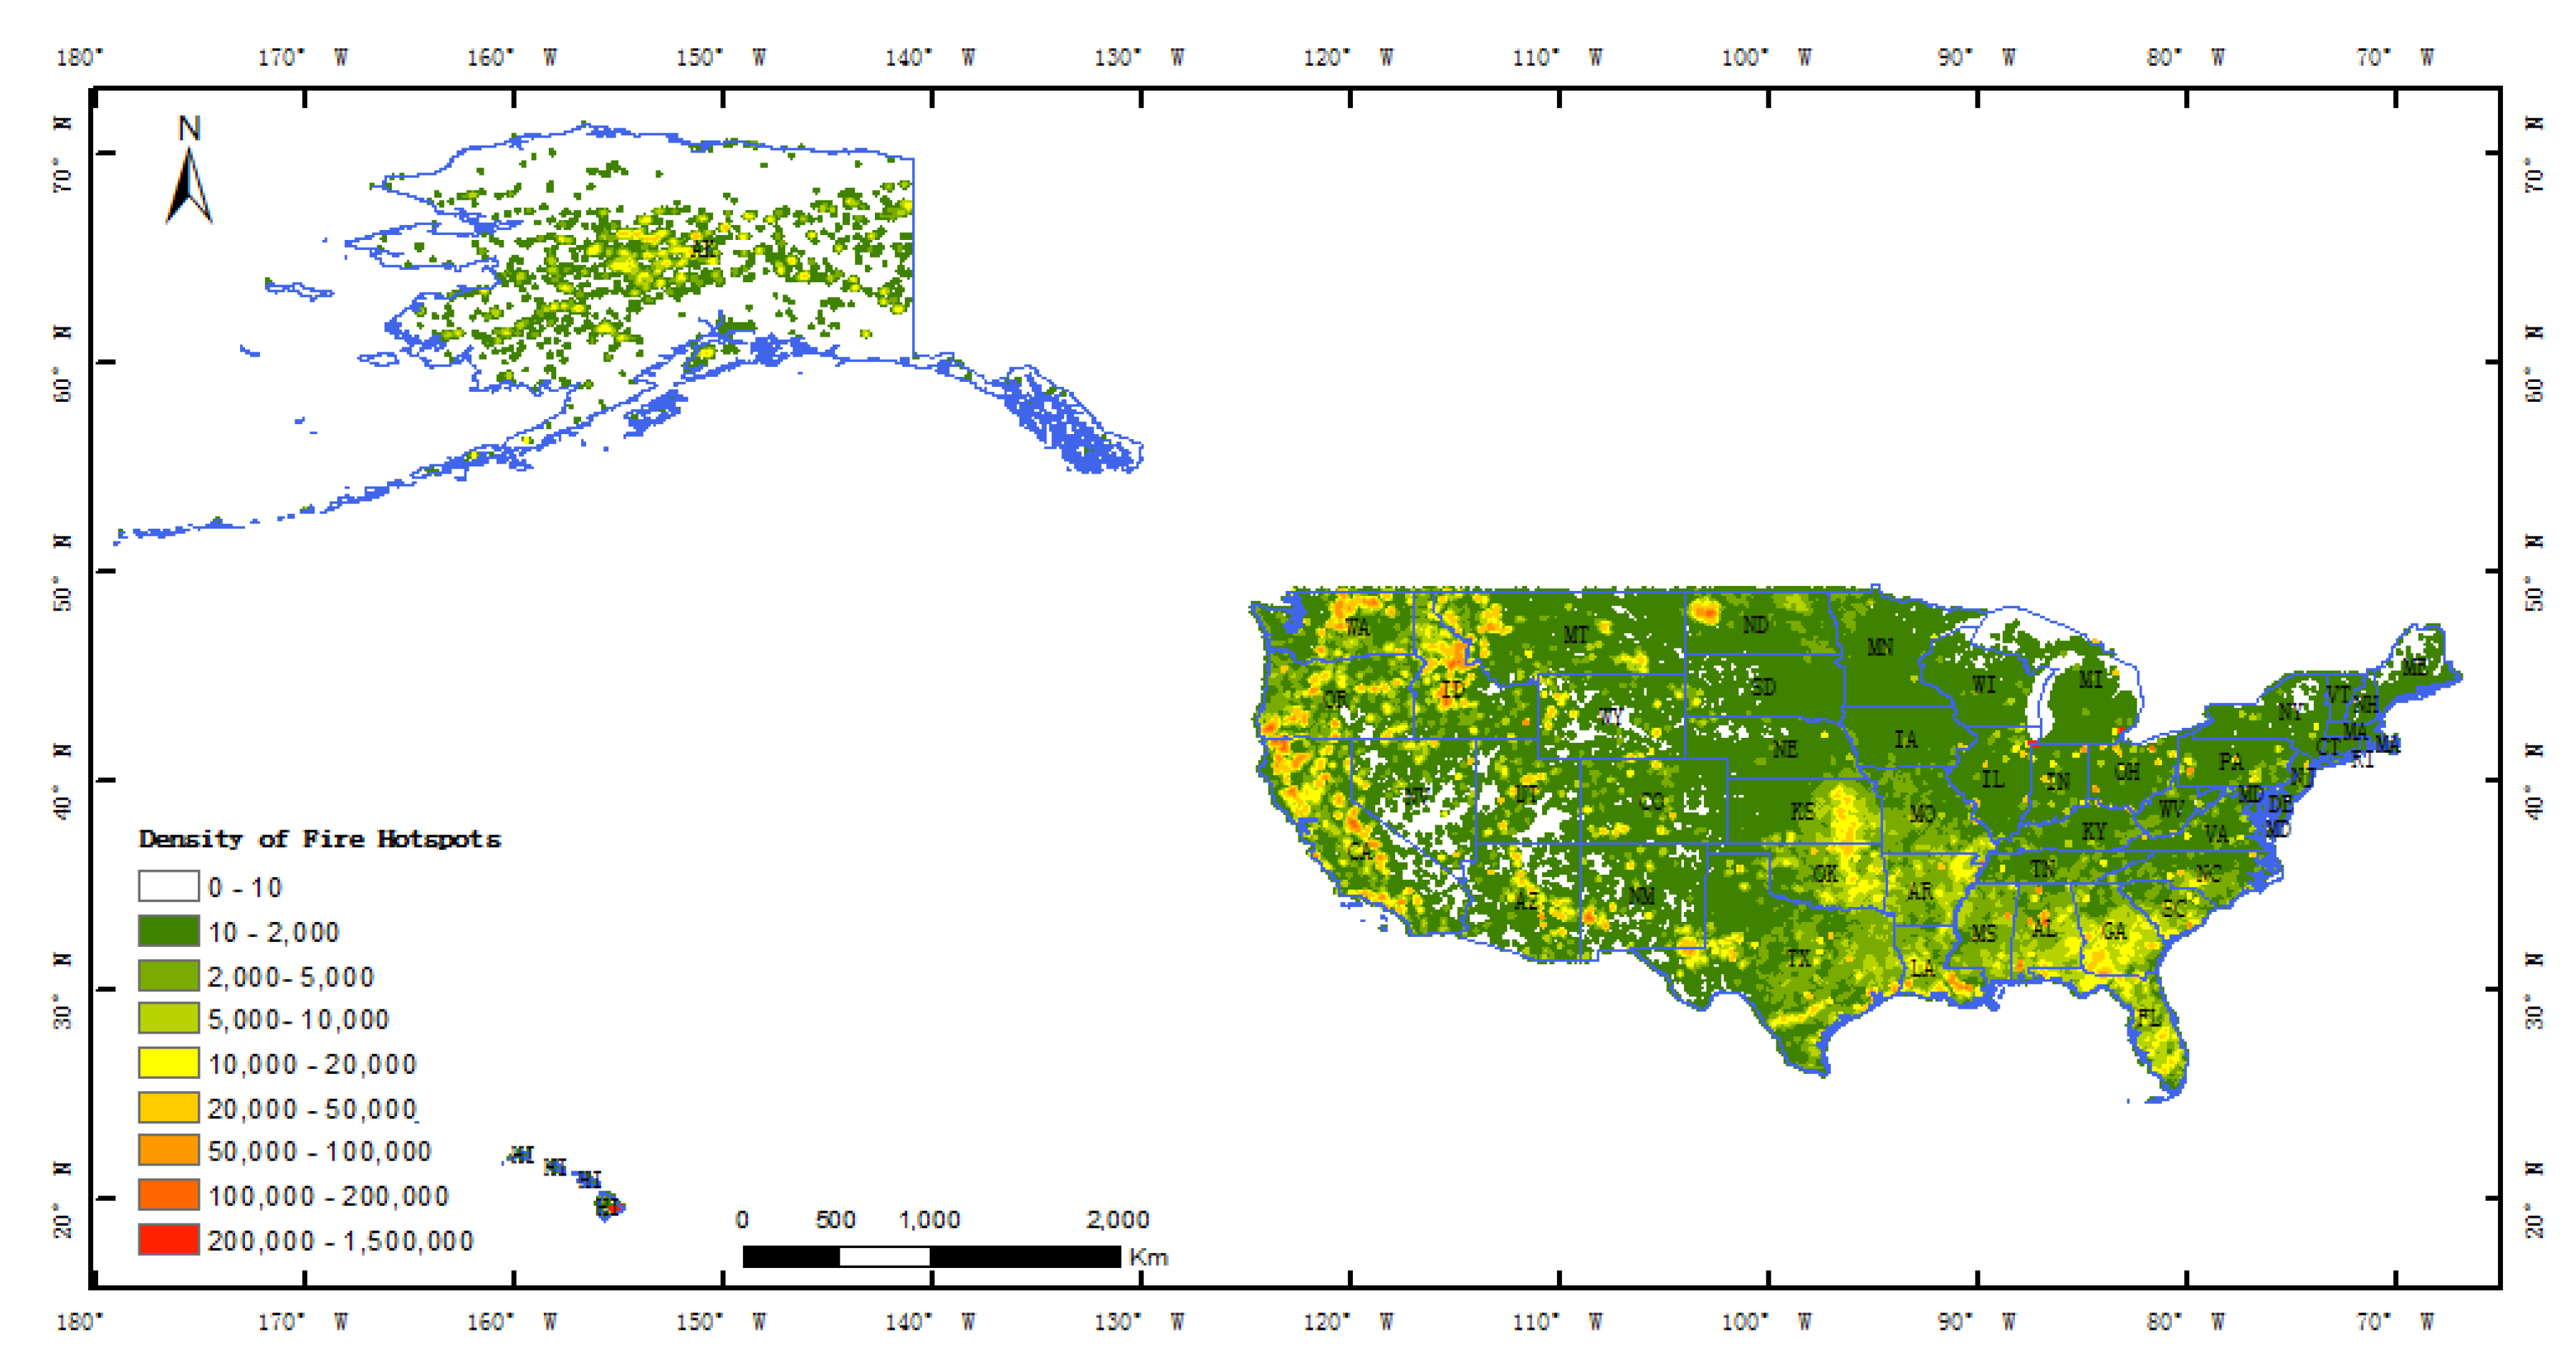
5.1. Distribution Characteristics of Heavy Industrial Heat Sources cross the United States

The distribution pattern of the heavy industrial heat sources across the whole United States in the year 2018 is depicted in Figure 9, wherein about a total of 1748 working heavy industrial heat emitters have been detected and identified. Most of the heavy industrial heat sources are located along the north and south boundaries of the country, namely, near Canada and Mexico. The top four emitting states, including North Dakota, Texas, California, and Pennsylvania account for nearly half of the total number of the heavy industrial heat sources. It is quite convincing that most of the heavy emitters are centralized in the northeast industrial area, southern industrial area, and western area of the country. Historically, the northeast industrial area used to be the largest industrial zone in the United States and even the whole world. It is worth noticing that some historical states with heavy pollution like Illinois are no more the heavy industrial emitters, and some new states located in the middle of the country, such as North Dakota, turned out to be the heaviest industrial emission releasers.
With the geocoded task-tree-based parallel industrial heat source identification approach, 1748 working heavy industrial heat emitters have been detected and identified from 3,998,465 fire hotspots. The density of the heavy industrial heat emission at the national scale in the US in the year 2018 is also shown in Figure 10. It is shown that the historically industrial area with more detected heavy industrial sources also has a higher emitting frequency, namely, a bigger number of active hotspots inside the industrial heat releasers. The interesting thing witnessed is that some states in the traditional northeast industrial area, though having less detected heavy industrial emitters, still have significantly high emitting frequencies.
Except for the spatial distribution pattern, the temporal characteristics of the heavy industrial heat sources across the whole nation were also found and shown in Figure 11. As is demonstrated in Figure 11a, the number of industrial heat releasers/sources around the entire nation has undergone a steady increase from the year 2012 to 2018. Likewise, the emission frequency, namely, the number of the fires or hotspots detected inside the industrial heat objects, has also presented a steady growth trend except for the year 2013. This is also consistent with the conclusion of the reported in the C2ES [3] analysis, though the US’s GHG emissions have resumed a long-term downward trend these years, the industrial emissions rose slightly and even suprpassed the emissions from coal-fired power plants [2].

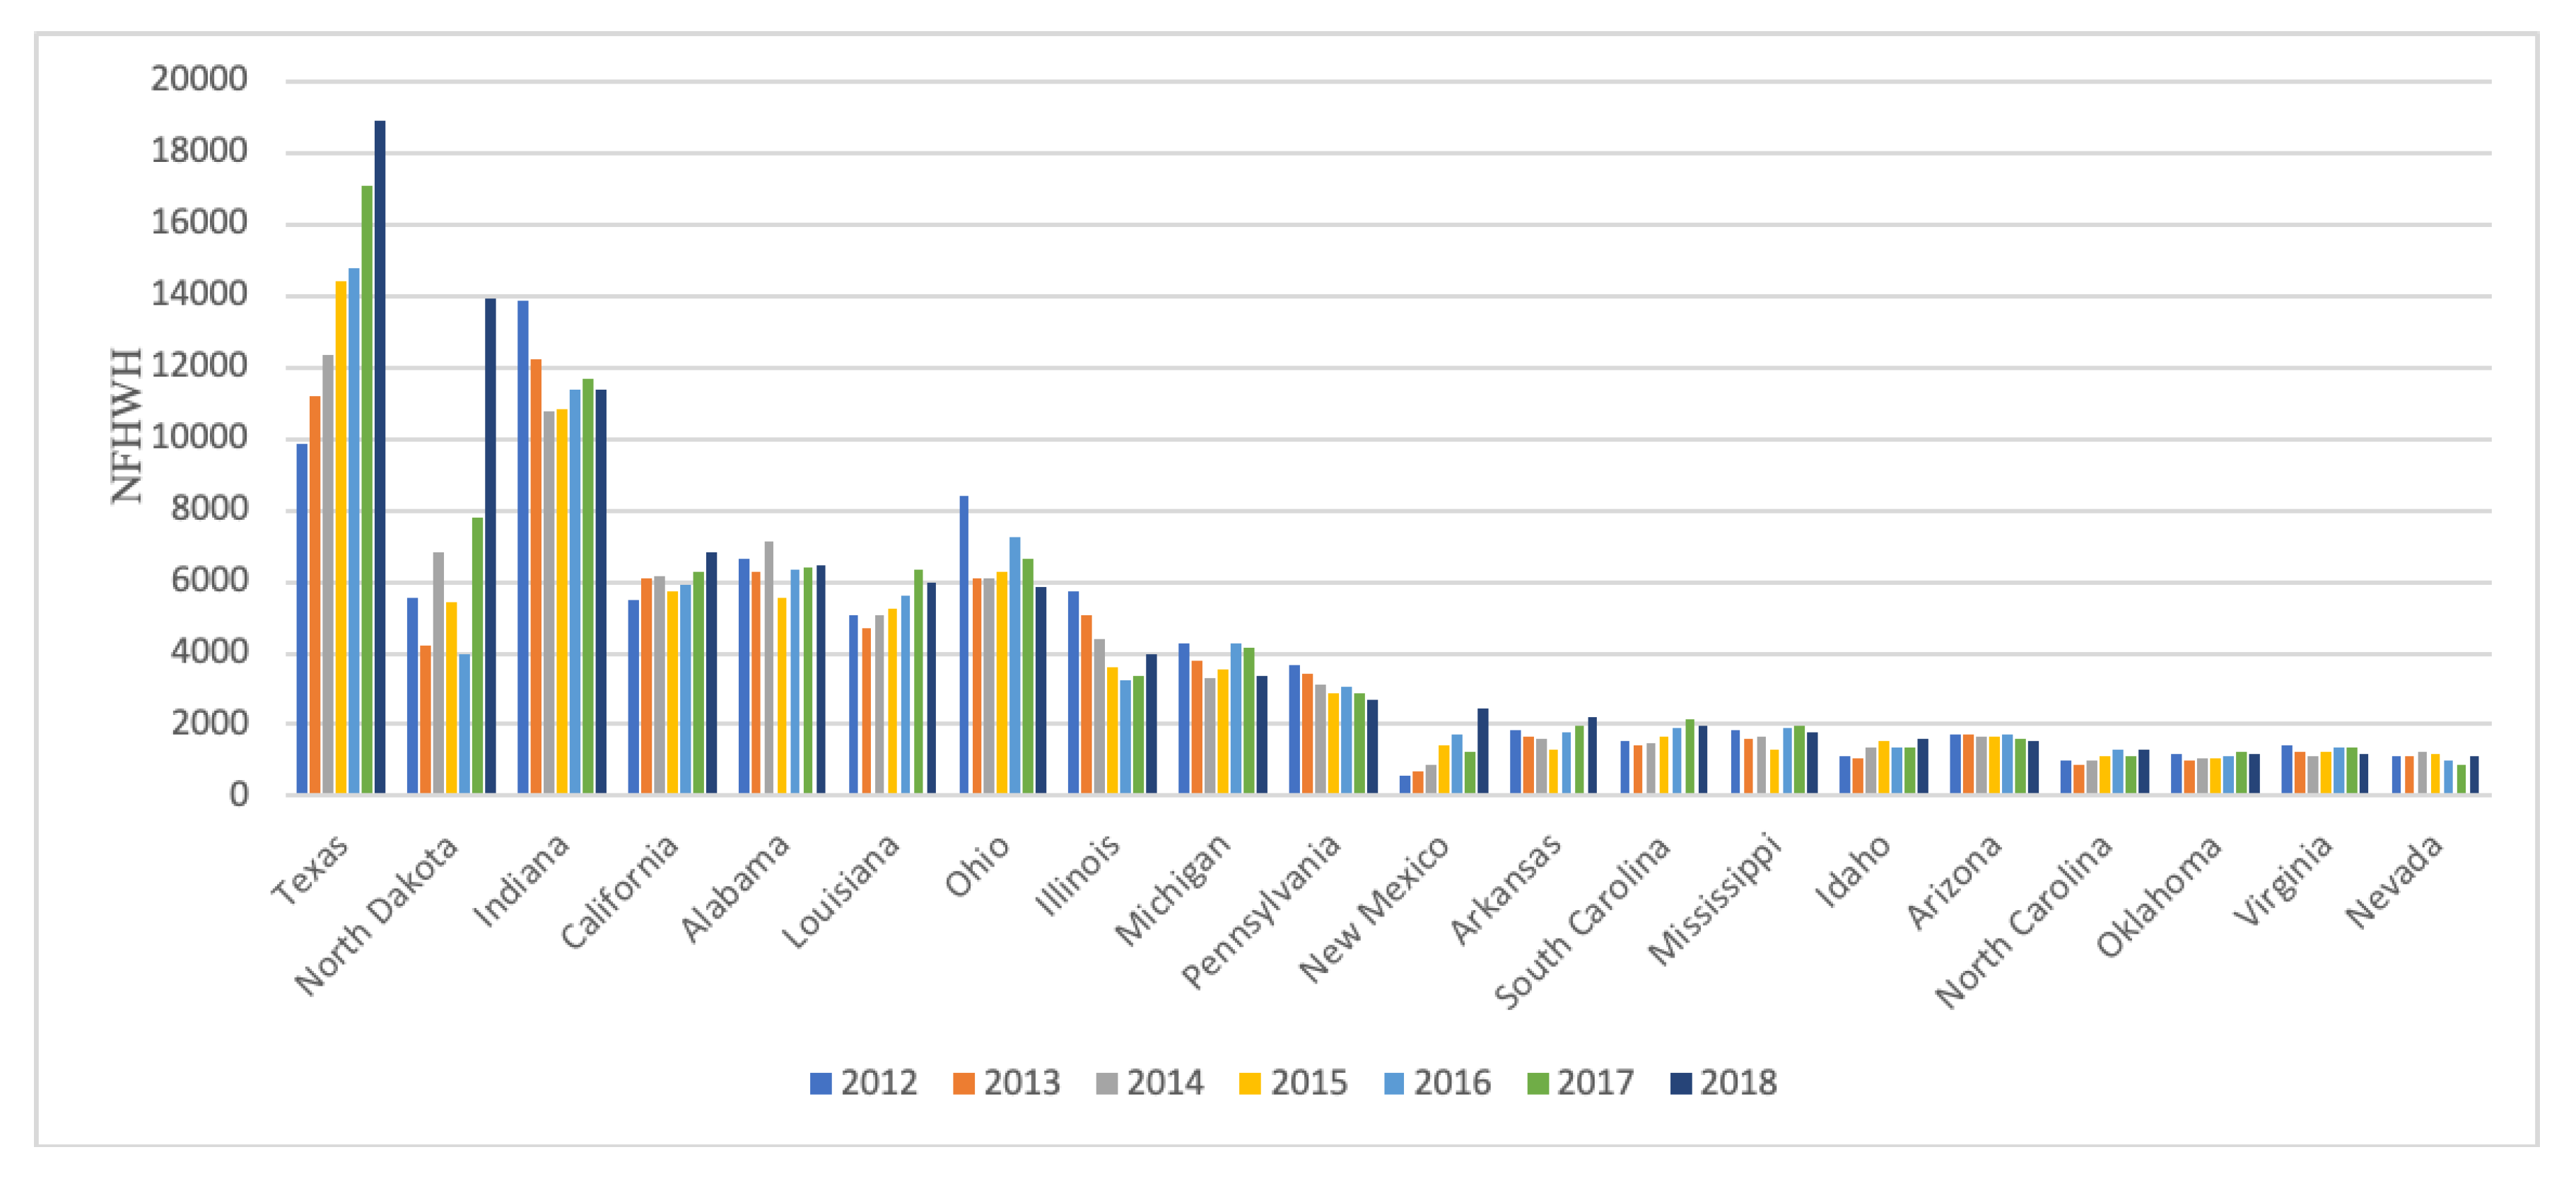
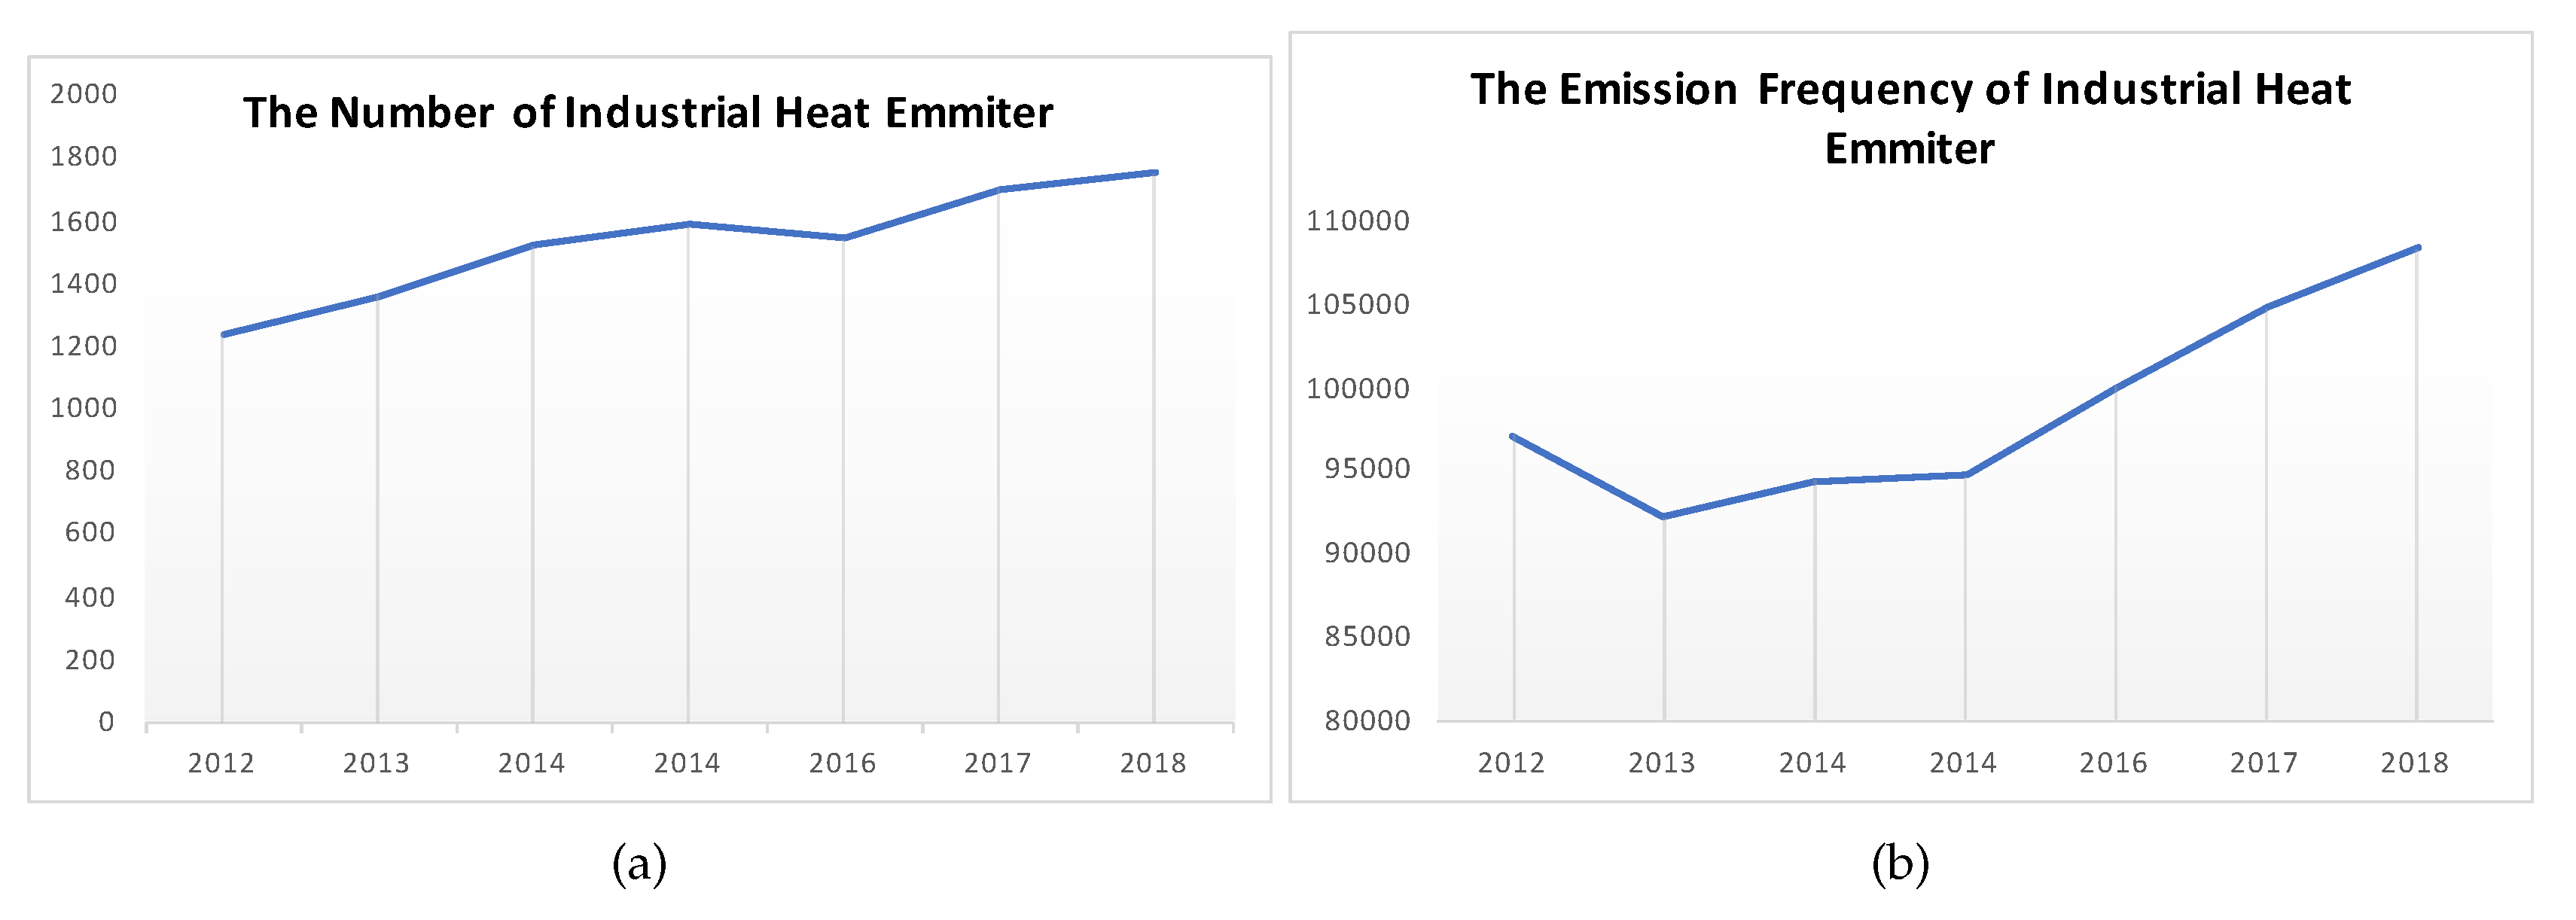
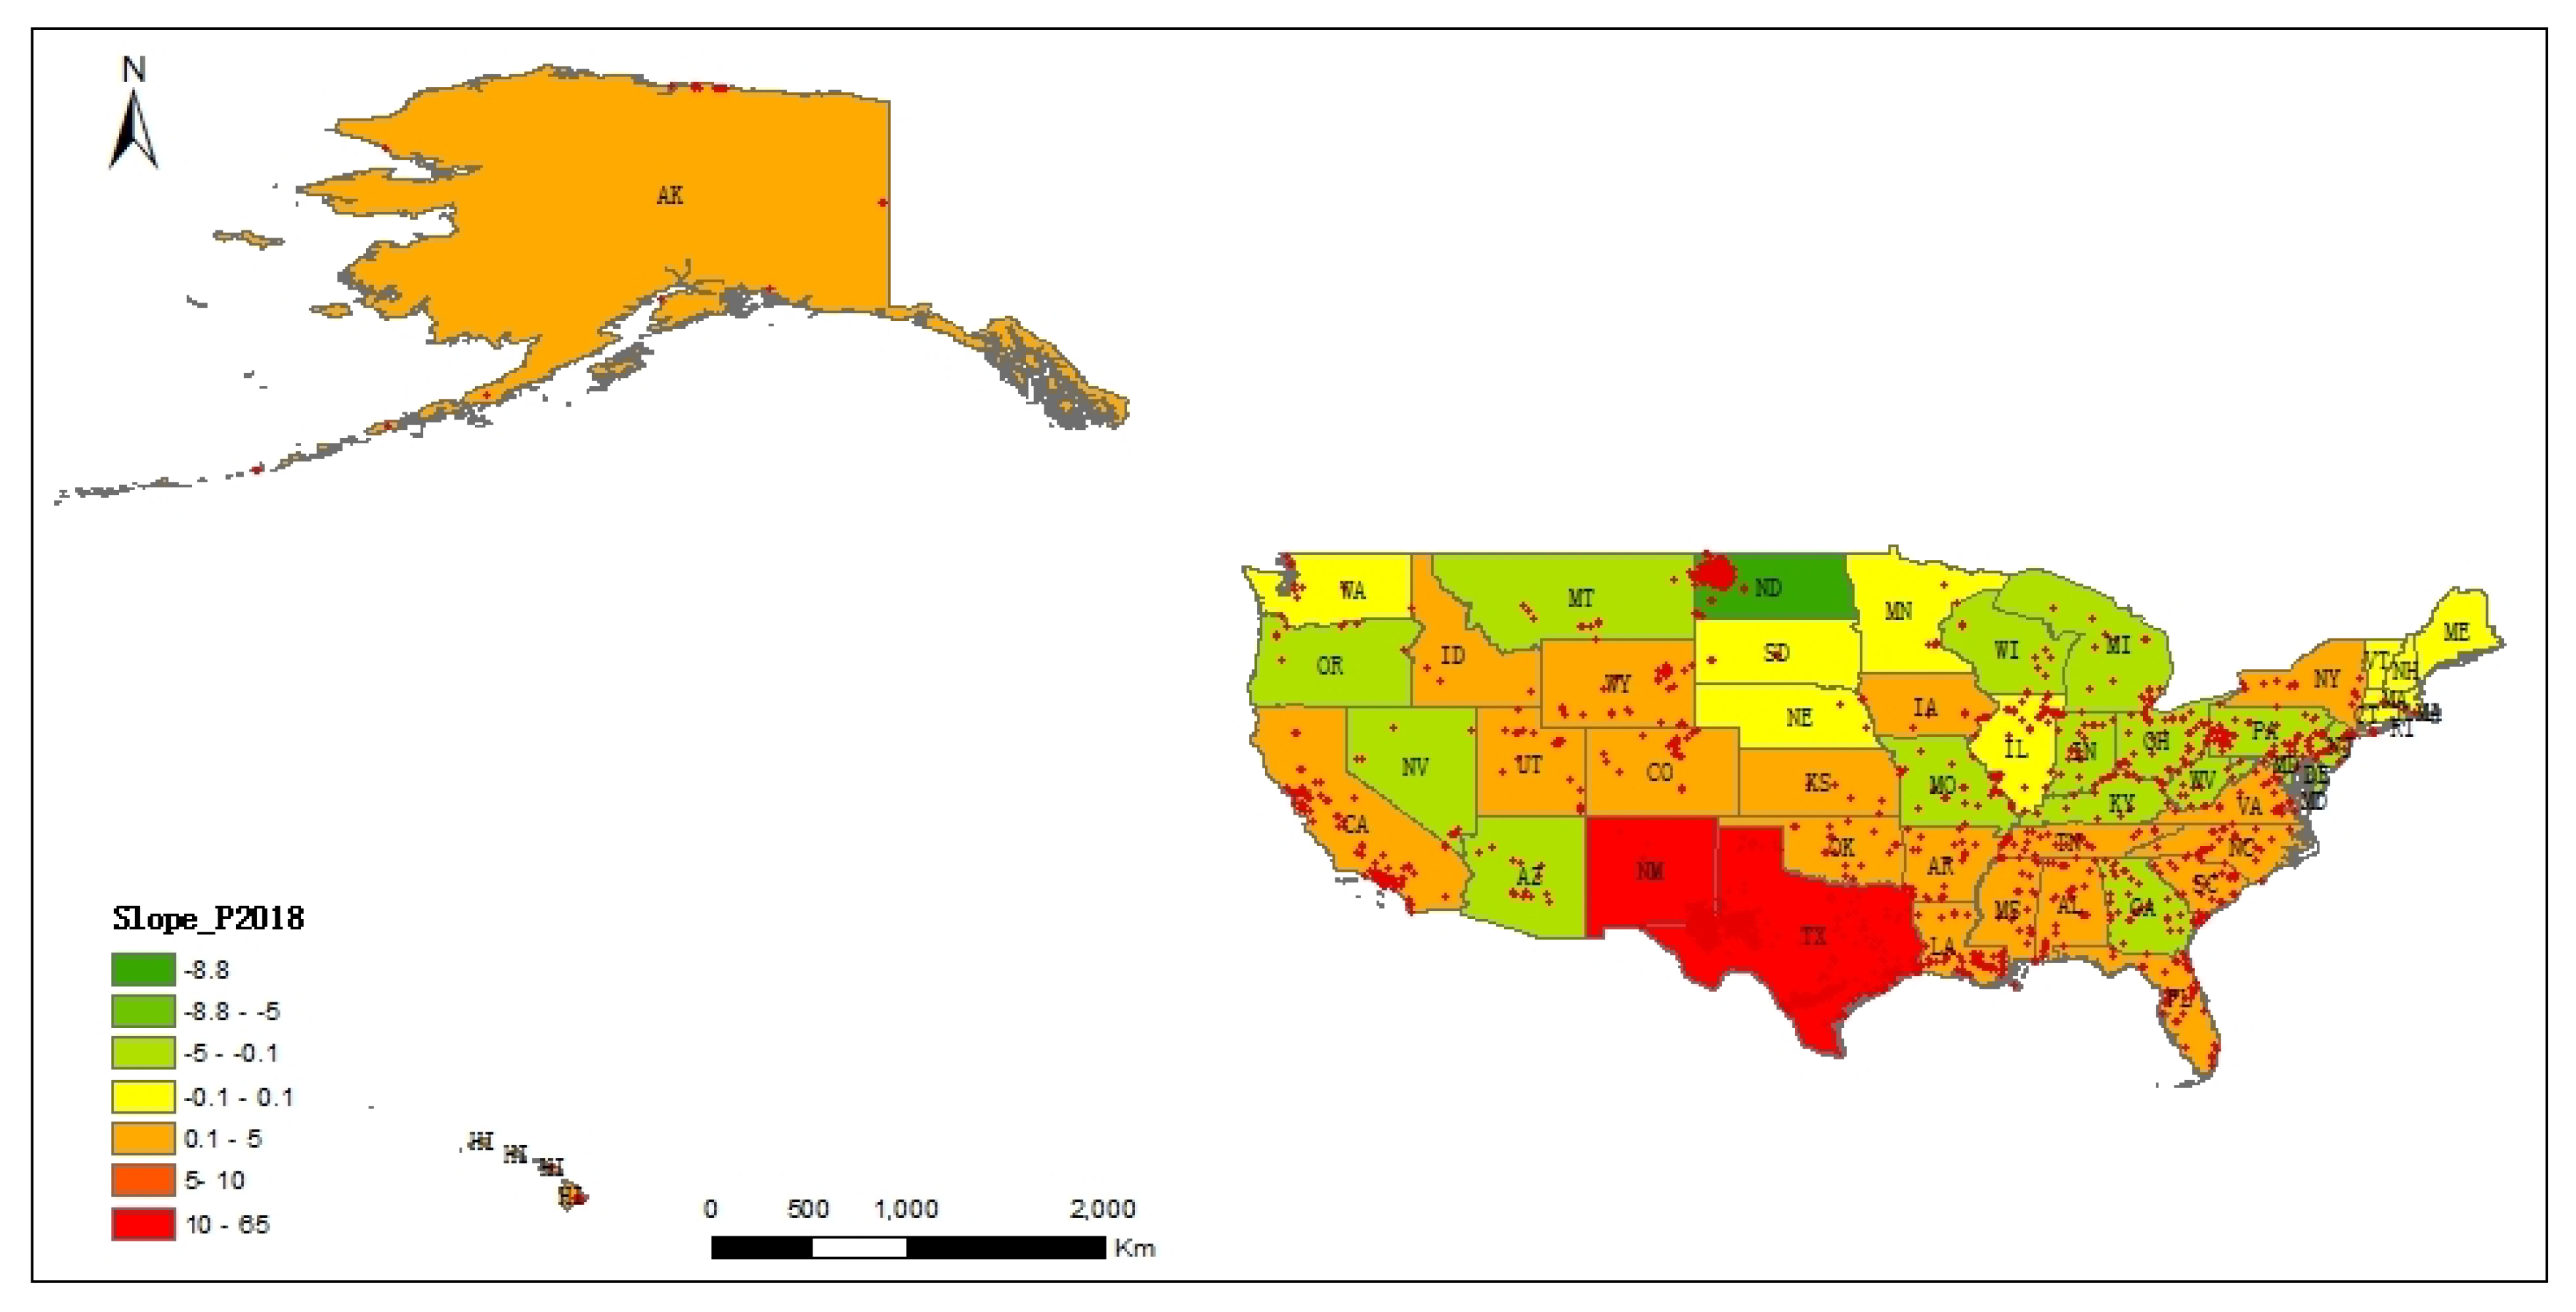
5.2. Spatial-Temporal Distribution Characteristics at State Scale

The comparative analysis of the spatial-temporal distribution characteristics among 51 states has been conducted with the time span from 2012 to 2018 with a metric index of S l o p e N W H [25], where NWH [25] refers to the number of working heavy industrial heat sources (NWH) and the S l o p e N W H represents a relatively normalized increasing rate from the year 2012 to 2018. As is demonstrated in Figure 12, only two states have undergone a significant increase during these years. Texas, the fastest increasing state, has a S l o p e N W H value of 64.66%, and New Mexico, the second-fastest increasing state, has a S l o p e N W H value of 12.94%. Except for these two states, most of the states have no obvious increase, and up to 17 states underwent a slight decrease until 2018.
Meanwhile, the changes in the distribution pattern of industrial heat releasers across key states from the year 2012 to the year 2018 are also shown in Figure 13. It is worth noticing that the traditional Rust Belt states that are also known as the Factory Belt or Steel Belt, such as Pennsylvania, Ohio, Michigan, and Illinois, have been undergoing a continuous decrease of industrial heat releasing, except for Indiana that after a short downwards in the year 2012 and 2013, which recovered to continue steadily increase from the year 2014 on. It is worth noticing that some Midwestern states, in the so-called Corn Belt or “Breadbasket of America”, have undergone a sharp increase through the last decade. The most significant examples are Texas, North Dakota, and New Mexico, wherein the number of industrial emitters in Texas almost doubled through the last decade, while the data in North Dakota nearly tripled and the data in New Mexico incredibly quadrupled. In addition, the trend of historically rich states along the east coastline is very steady with no obvious increase nor decrease in the number of industrial heat releasers. Therefore, we could draw the conclusion that benefiting from the deindustrialization, most of the historically heavily polluted areas are gradually improving, while some Midwestern and southern states have demonstrated sharp increases in industrial releasers which also means a sharp deterioration of the environment.

6. Discussion

To further evaluate our proposed a geocoded task-tree-based industrial heat source detection method, we implemented this method in parallel as IHSDetect-p on an MPI-enabled cluster. For comparative performance analysis, IHS-matlab a serial version of the industrial heat source detection method was also implemented on top of the commercial processing software Matlab. Hence, the performance experiment was conducted respectively with IHSDetect-p and IHS-matlab, wherein the parallel industrial heat source identification algorithm IHSDetect-p is implemented on an MPI-enabled multi-core cluster equipped with 12 multi-core processors connected by a 20 gigabyte Infiniband using RDMA protocol. Each processor is a blade server with dual Intel(R) quad-core CPU (3.0 GHz) and 8 GB memory. The operating system was Cent OS5.0, the compiler is the Intel MPI C/C++ Compiler with optimizing level O3 option. While the IHS-matlab is implemented on a workstation equipped with Matlab software.
The performance metrics of both run time and speedup with increasing nodes are also respectively plotted in Figure 14a,b. As is demonstrated in Figure 14a, the serial IHS-matlab program implemented with Matlab took about 192 min namely more than three hours to finish the industrial heat source identification in a nation-scale of the whole United States. By contrast, the IHSDetect-p program implemented in parallel with a geocoded-tree based large-scale clustering only took less than 10 min to conduct the industrial heat object identification across the whole nation of the USA with about twelve nodes (96 cores). Meanwhile, a speedup of 19X is achieved when 12 nodes with 96 cores are employed for processing.
As showed in Figure 14b, the IHSDetect-p program performed a nearly linear speedup with an increasing scale of computing nodes and cores. Nevertheless, when more than 6 nodes (48 cores) are accommodated, the parallelization efficiency shows a downward trend which could also be seen from the declines in the increasing speed of the speedup metric. The main reason for it is that when enough processors are offered, the communications penalty cost by reducing and merging grid tasks across a large number of processors would not be totally ignored. Despite the slight downwards in the parallelization efficiency, the geocoded task-tree-based industrial heat source detection program IHSDetect-p has already shown its encouraging parallel implementing performance and its scalability.
To achieve the performance improvement as discussed above, a many-task computing approach with a GeoSOT-encoded quad task-tree is proposed to tackle the incredible large-scale data clustering challenge of a million-scale of high-dimensional fire points. As a matter of fact, this study essentially extended the idea of big data factorization proposed by Chen et al. [44,45,46] to employ a GeoSOT global division method so as to gradually break down the small grid tasks. Eventually, a GeoSOT-encoded quad task tree could be formed from these small bags of grid tasks for a fully exploiting of the parallelism. As a result, as is discussed above the final performance of this study is had been significantly improved. Accordingly, Chen et al.’s methods held great potentials in probing temporal-spatial big data with the capability of deriving the very concise and low-dimensional informative factors. In addition, in order the solve the problem lies in the determination of corresponding k parameter and cluster center initialization, an optimized recursive k-means clustering method is adopted to segment and cluster industrial heat objects in a hierarchical way. Actually this method hold a similar idea with coreset K-means [47] and Steinbach’s bisecting k-means [48] which a hierarchical divisive version of k-means. For future work, the further classification of the detected industrial heat emitters is of critical importance and worth been probed into.

7. Conclusions

Though the satellite-borne sensors offer a quantitive way of detecting thermal anomalies like fires, most of the available fire detection methods barely work well for heavy industrial heat source identification. Moreover, scaling to a national or even global scale long-time series processing, the efficient detection of static and persistent industrial heat releasers is greatly challenged with the extremely big data computing problem introduced by the large-scale clustering of tens of millions of fire hotspots data. As demonstrated above, an optimized industrial heat source identification method with geocoded-tree based large-scale clustering is proposed in this paper. The main contribution of this work is that it introduces the GeoSOT-encoded task tree and many-task distributed computing to not only improve identification efficiency but also tackle the big data computing challenge. Following a divide-and-conquer approach, the GeoSOT global subdivision model is adopted to break down the enormous time-series fire hotspots clustering problem into a great deal of small grid clustering problems that can be implemented in parallel as bags of tasks. Moreover, to tackle the difficulty lies in the determination of corresponding k parameter and avoid the blindness caused by random cluster center initialization, an optimized recursive k-means clustering method with a GeoSOT division-based pre-grouping is introduced to gradually segment and cluster industrial heat objects. With this approach, spatial-temporal distribution analysis of industrial heat emitters across the United States was successfully conducted from long time-series active VIIRS data. Meanwhile, the changing trends in the distribution pattern of industrial heat releasers across key states in the last decades were also covered in detail. Furthermore, the experimental performance result showed an excellent performance and elegant scalability compared to the traditional way with increasing computing resources. We draw the conclusion that the industrial heat source identification with geocoded task-tree-based large-scale clustering is effective and scalable.

Author Contributions

Y.M. and C.M. are responsible for the conceptualization, methodology, study, and software implementation; Y.W. and Y.Z. conducted the performance optimization; P.L., J.Y., and X.D. contributed to the data preparation, analysis, and validation; Y.M. wrote the original manuscript; X.D. and Y.M. did the editing. All authors have read and agreed to the published version of the manuscript.

Funding

This research has been jointly supported by the National Key R&D Program of China (grant number 2016YFC0600510, grant number 2018YFC1505501), the national natural science foundation of China (grant number 41872253), the Youth Innovation Promotion Association of the Chinese Academy of Sciences (number Y6YR0300QM), and the Strategic Priority Research Program of Chinese Academy of Sciences, Project title: CASEarth (grant number XDA19080103).

Conflicts of Interest

The authors declare no conflict of interest.

References

  1. Bellevrat, K.W. Commentary: Clean and Efficient Heat for Industry. Available online: https://www.iea.org/newsroom/news/2018/january/commentary-clean-and-efficient-heat-for-industry.html (accessed on 23 January 2018).
  2. Kusnetz, N. U.S. Emissions Dropped in 2019: Here’s Why in 6 Charts. Available online: https://insideclimatenews.org/news/07012020/infographic-united-states-emissions-2019-climate-change-greenhouse-gas-coal-transportation (accessed on 7 January 2020).
  3. Climate, C.F.; Solutions, E. Projecting and Accelerating U.S. Greenhouse Gas Reductions. Available online: https://www.c2es.org/site/assets/uploads/2017/09/projecting-accelerating-us-greenhouse-gas-reductions.pdf (accessed on 10 September 2017).
  4. Dimitrov, R.S. The Paris agreement on climate change: Behind closed doors. Glob. Environ. Politics 2016, 16, 1–11. [Google Scholar] [CrossRef] [Green Version]
  5. Xia, H.; Chen, Y.; Quan, J. A simple method based on the thermal anomaly index to detect industrial heat sources. Int. J. Appl. Earth Obs. Geoinf. 2018, 73, 627–637. [Google Scholar] [CrossRef]
  6. Roberts, D. This Climate Problem is Bigger Than Cars and Much Harder to Solve. Available online: https://www.vox.com/energy-and-environment/2019/10/10/20904213/climate-change-steel-cement-industrial-heat-hydrogen-ccs (accessed on 10 October 2019).
  7. Hulley, G.; Malakar, N.; Hughes, T.; Islam, T.; Hook, S. Moderate Resolution Imaging Spectroradiometer (MODIS) MOD21 Land Surface Temperature and Emissivity Algorithm Theoretical Basis Document; Technical Report; Jet Propulsion Laboratory, National Aeronautics and Space: Pasadena, CA, USA, 2016.
  8. Sekertekin, A.; Arslan, N. Monitoring thermal anomaly and radiative heat flux using thermal infrared satellite imagery—A case study at Tuzla geothermal region. Geothermics 2019, 78, 243–254. [Google Scholar] [CrossRef]
  9. Elvidge, C.D.; Baugh, K.; Zhizhin, M.; Hsu, F.C.; Ghosh, T. VIIRS night-time lights. Int. J. Remote Sens. 2017, 38, 5860–5879. [Google Scholar] [CrossRef]
  10. Schroeder, W.; Oliva, P.; Giglio, L.; Csiszar, I.A. The New VIIRS 375 m active fire detection data product: Algorithm description and initial assessment. Remote Sens. Environ. 2014, 143, 85–96. [Google Scholar] [CrossRef]
  11. Cracknell, A.P. Advanced Very High Resolution Radiometer AVHRR; CRC Press: Boca Raton, FL, USA, 1997. [Google Scholar]
  12. Schroeder, W.; Oliva, P.; Giglio, L.; Quayle, B.; Lorenz, E.; Morelli, F. Active fire detection using Landsat-8/OLI data. Remote Sens. Environ. 2016, 185, 210–220. [Google Scholar] [CrossRef] [Green Version]
  13. Kumar, S.S.; Roy, D.P. Global operational land imager Landsat-8 reflectance-based active fire detection algorithm. Int. J. Digit. Earth 2018, 11, 154–178. [Google Scholar] [CrossRef] [Green Version]
  14. Kaufman, Y.J.; Justice, C.; Flynn, L.; Kendall, J.; Giglio, L.; Prins, E.; Ward, D.; Menzel, P.; Setzer, A. Monitoring global fires from EOS-MODIS. J. Geophys. Res. 1998, 103, 215–239. [Google Scholar] [CrossRef]
  15. Casadio, S.; Arino, O.; Serpe, D. Gas flaring monitoring from space using the ATSR instrument series. Remote Sens. Environ. 2012, 116, 239–249. [Google Scholar] [CrossRef]
  16. Mansor, S.B.; Cracknell, A.P.; Shilin, B.; Gornyi, V. Monitoring of underground coal fires using thermal infrared data. Int. J. Remote Sens. 1994, 15, 1675–1685. [Google Scholar] [CrossRef]
  17. Ononye, A.E.; Vodacek, A.; Saber, E. Automated extraction of fire line parameters from multispectral infrared images. Remote Sens. Environ. 2007, 108, 179–188. [Google Scholar] [CrossRef] [Green Version]
  18. Pozo, D.; Olrno, F.; Alados-Arboledas, L. Fire detection and growth monitoring using a multitemporal technique on AVHRR mid-infrared and thermal channels. Remote Sens. Environ. 1997, 60, 111–120. [Google Scholar] [CrossRef]
  19. Roy, D.P.; Landmann, T. Characterizing the surface heterogeneity of fire effects using multi-temporal reflective wavelength data. Int. J. Remote Sens. 2005, 26, 4197–4218. [Google Scholar] [CrossRef]
  20. Li, Y.; Vodacek, A.; Kremens, R.L.; Ononye, A.; Tang, C. A hybrid contextual approach to wildland fire detection using multispectral imagery. IEEE Trans. Geosci. Remote Sens. 2005, 43, 2115–2126. [Google Scholar]
  21. Roberts, G.; Wooster, M. Development of a multi-temporal Kalman filter approach to geostationary active fire detection & fire radiative power (FRP) estimation. Remote Sens. Environ. 2014, 152, 392–412. [Google Scholar]
  22. Koltunov, A.; Ustin, S. Early fire detection using non-linear multitemporal prediction of thermal imagery. Remote Sens. Environ. 2007, 110, 18–28. [Google Scholar] [CrossRef]
  23. Zhang, P.; Yuan, C.; Sun, Q.; Liu, A.; You, S.; Li, X.; Zhang, Y.; Jiao, X.; Sun, D.; Sun, M.; et al. Satellite-Based Detection and Characterization of Industrial Heat Sources in China. Environ. Sci. Technol. 2019, 53, 11031–11042. [Google Scholar] [CrossRef]
  24. Liu, Y.; Hu, C.; Zhan, W.; Sun, C.; Murch, B.; Ma, L. Identifying industrial heat sources using time-series of the VIIRS Nightfire product with an object-oriented approach. Remote Sens. Environ. 2018, 204, 347–365. [Google Scholar] [CrossRef]
  25. Ma, C.; Yang, J.; Chen, F.; Ma, Y.; Liu, J.; Li, X.; Duan, J.; Guo, R. Assessing heavy industrial heat source distribution in China using real-time VIIRS active fire/hotspot data. Sustainability 2018, 10, 4419. [Google Scholar] [CrossRef] [Green Version]
  26. Jain, A.K. Data clustering: 50 years beyond K-means. Pattern Recognit. Lett. 2010, 31, 651–666. [Google Scholar] [CrossRef]
  27. Abubaker, M.; Ashour, W.M. Efficient data clustering algorithms: Improvements over Kmeans. Effic. Data Clust. Algorithms Improv. Kmeans 2013, 3, 37–49. [Google Scholar] [CrossRef] [Green Version]
  28. Liu, P.; Zhang, H.; Eom, K.B. Active Deep Learning for Classification of Hyperspectral Images. IEEE J. Sel. Top. Appl. Earth Obs. Remote Sens. 2017, 10, 712–724. [Google Scholar] [CrossRef] [Green Version]
  29. Liu, P.; Choo, K.K.R.; Wang, L.; Huang, F. SVM or Deep Learning? A Comparative Study on Remote Sensing Image Classification. Soft Comput. 2017, 21, 7053–7065. [Google Scholar] [CrossRef]
  30. Guo, H.; Nativi, S.; Liang, D.; Craglia, M.; Wang, L.; Schade, S.; Corban, C.; He, G.; Pesaresi, M.; Li, J.; et al. Big Earth Data science: An information framework for a sustainable planet. Int. J. Digit. Earth 2020, 13, 743–767. [Google Scholar] [CrossRef] [Green Version]
  31. Guo, H.; Goodchild, M.F.; Annoni, A. Manual of Digital Earth; Springer Nature: Berlin/Heidelberg, Germany, 2020. [Google Scholar]
  32. Ma, Y.; Wu, H.; Wang, L.; Huang, B.; Ranjan, R.; Zomaya, A.; Jie, W. Remote sensing big data computing: Challenges and opportunities. Future Gener. Comput. Syst. 2015, 51, 47–60. [Google Scholar] [CrossRef]
  33. Liu, P.; Di, L.; Du, Q.; Wang, L. Remote Sensing Big Data: Theory, Methods and Applications. Remote Sens. 2018, 10, 711. [Google Scholar] [CrossRef] [Green Version]
  34. Li, S.; Cheng, C.; Chen, B.; Meng, L. Integration and management of massive remote-sensing data based on GeoSOT subdivision model. J. Appl. Remote Sens. 2016, 10, 034003. [Google Scholar] [CrossRef]
  35. Khalilian, M.; Boroujeni, F.Z.; Mustapha, N.; Sulaiman, M.N. K-means divide and conquer clustering. In Proceedings of the 2009 International Conference on Computer and Automation Engineering, Bangkok, Thailand, 8–10 March 2009; pp. 306–309. [Google Scholar]
  36. Li, Z.; Nadon, S.; Cihlar, J. Satellite-based detection of Canadian boreal forest fires: Development and application of the algorithm. Int. J. Remote Sens. 2000, 21, 3057–3069. [Google Scholar] [CrossRef] [Green Version]
  37. Ichoku, C.; Kaufman, Y.; Giglio, L.; Li, Z.; Fraser, R.; Jin, J.Z.; Park, W. Comparative analysis of daytime fire detection algorithms using AVHRR data for the 1995 fire season in Canada: Perspective for MODIS. Int. J. Remote Sens. 2003, 24, 1669–1690. [Google Scholar] [CrossRef]
  38. Ma, C.; Niu, Z.; Ma, Y.; Chen, F.; Yang, J.; Liu, J. Assessing the Distribution of Heavy Industrial Heat Sources in India between 2012 and 2018. ISPRS Int. J. Geo-Inf. 2019, 8, 568. [Google Scholar] [CrossRef] [Green Version]
  39. Schroeder, W. Visible Infrared Imaging Radiometer Suite (VIIRS) 375 m & 750 m Active Fire Detection Data Sets Based on Nasa VIIRS Land Science Investigator Processing System (SIPS) Reprocessed Data-Version 1, NASA. 2017. Available online: https://lpdaac.usgs.gov/documents/132/VNP14_User_Guide_v1.3.pdf (accessed on 1 August 2020).
  40. Tibshirani, R.; Walther, G.; Hastie, T. Estimating the number of clusters in a data set via the gap statistic. J. R. Stat. Soc. Ser. B (Stat. Methodol.) 2001, 63, 411–423. [Google Scholar] [CrossRef]
  41. Ding, Y.; Zhao, Y.; Shen, X.; Musuvathi, M.; Mytkowicz, T. Yinyang k-means: A drop-in replacement of the classic k-means with consistent speedup. In Proceedings of the 32nd International Conference on Machine Learning, ICML 2015, Lille, France, 6–11 July 2015; pp. 579–587. [Google Scholar]
  42. Paoletti, M.E.; Haut, J.M.; Plaza, J.; Plaza, A.; Vigo-Aguiar, J. Yinyang K-means clustering for hyperspectral image analysis. In Proceedings of the 17th International Conference on Computational and Mathematical Methods in Science and Engineering, Cadiz, Spain, 4–8 July 2017; pp. 1625–1636. [Google Scholar]
  43. Lv, Z.; Hu, Y.; Zhong, H.; Wu, J.; Li, B.; Zhao, H. Parallel k-means clustering of remote sensing images based on mapreduce. In Proceedings of the International Conference on Web Information Systems and Mining, Sanya, China, 24–25 September 2010; Springer: Berlin/Heidelberg, Germany, 2010; pp. 162–170. [Google Scholar]
  44. Ke, H.; Chen, D.; Shi, B.; Zhang, J.; Liu, X.; Zhang, X.; Li, X. Improving Brain E-Health Services via High-Performance EEG Classification with Grouping Bayesian Optimization. IEEE Trans. Serv. Comput. 2020, 13, 696–708. [Google Scholar] [CrossRef]
  45. Chen, D.; Hu, Y.; Wang, L.; Zomaya, A.Y.; Li, X. H-PARAFAC: Hierarchical Parallel Factor Analysis of Multidimensional Big Data. IEEE Trans. Parallel Distrib. Syst. 2017, 28, 1091–1104. [Google Scholar] [CrossRef]
  46. Chen, D.; Tang, Y.; Zhang, H.; Wang, L.; Li, X. Incremental Factorization of Big Time Series Data with Blind Factor Approximation. IEEE Trans. Knowl. Data Eng. 2019, 1–14. [Google Scholar] [CrossRef]
  47. Chen, K. On coresets for k-median and k-means clustering in metric and euclidean spaces and their applications. SIAM J. Comput. 2009, 39, 923–947. [Google Scholar] [CrossRef]
  48. Karypis, M.S.G.; Kumar, V.; Steinbach, M. A comparison of document clustering techniques. In Proceedings of the TextMining Workshop at KDD2000, Boston, MA, USA, 20–23 August 2000. [Google Scholar]
Figure 1. Study area in the United States.
Remotesensing 12 03069 g001
Figure 2. The density and spatial distribution of active fires in the United States.
Remotesensing 12 03069 g002
Figure 3. Parallel industrial heat source identification approach for spatial-temporal distribution analysis with a geocoded task-tree-based large-scale clustering.
Remotesensing 12 03069 g003
Figure 4. Flow chart and parallel implementation of pre-grouping based on GeoSOT global division.
Remotesensing 12 03069 g004
Figure 5. Grid tasks generated following a GeoSOT global division.
Remotesensing 12 03069 g005
Figure 6. Building a GeoSOT-encoded quad task-tree from millions of fire hotspots.
Remotesensing 12 03069 g006
Figure 7. Optimized recursive k-means clustering implemented in parallel.
Remotesensing 12 03069 g007
Figure 8. Identifying heat objects through a geocode-aware task-tree.
Remotesensing 12 03069 g008
Figure 9. Distribution patterns of working industrial heat releasers in different states in the US (2018).
Remotesensing 12 03069 g009
Figure 10. Numbers of hotspots representing active industrial heat releasers in different states in the US (2018).
Remotesensing 12 03069 g010
Figure 11. The temporal characteristics of detected working industrial heat releasers in the US from 2012 to 2018 ((a) is for the amount of industrial heat releasers/sources, (b) is for the emmission frequncy of industrial heat releasers/sources).
Remotesensing 12 03069 g011
Figure 12. The comparative analysis of the distribution pattern of industrial heat releasers in 2012 and 2018 with slope index based on the number of heat releasers.
Remotesensing 12 03069 g012
Figure 13. Changes in the distribution pattern of industrial heat releasers across key cities from 2012 to 2018.
Remotesensing 12 03069 g013
Figure 14. Comparative experimental performance analysis with increasing nodes ((a) is for the run time merit of the performance, and (b) is fo the speedup merit of the performance).
Remotesensing 12 03069 g014

