On the Assessment of Non-Local Multi-Looking in Detection of Persistent Scatterers Using SAR Tomography


Department of Earth Observation Science (EOS), Faculty of Geo-Information Science and Earth Observation (ITC), University of Twente, 7514 AE Enschede, The Netherlands
Remote Sens. 2020, 12(19), 3195; https://0-doi-org.brum.beds.ac.uk/10.3390/rs12193195
Submission received: 9 August 2020
/
Revised: 24 September 2020
/
Accepted: 28 September 2020
/
Published: 30 September 2020
(This article belongs to the Special Issue Multipass Synthetic Aperture Radar for Monitoring the Built Environment and Preservation of the Cultural Heritage)
Abstract
:Synthetic aperture radar (SAR) tomography has shown great potential in multi-dimensional monitoring of urban infrastructures and detection of their possible slow deformations. Along this line, undeniable improvements in SAR tomography (TomoSAR) detection framework of multiple permanent scatterers (PSs) have been observed by the use of a multi-looking operation that is the necessity for data’s covariance matrix estimation. This paper attempts to further analyze the impact of a robust multi-looking operation in TomoSAR PS detection framework and assess the challenging issues that exist in the estimation of the covariance matrix of large stack data obtained from long interferometric time series acquisition. The analyses evaluate the performance of non-local covariance matrix estimation approaches in PS detection framework using the super-resolution multi-looked Generalized Likelihood Ratio Test (GLRT). Experimental results of multi-looking impact assessment are provided using two datasets acquired by COSMO-SkyMED (CSK) and TerraSAR-X (TSX) over Tehran, Iran, and Toulouse, France, respectively. The results highlight that non-local estimation of the sample covariance matrix allows revealing the presence of the scatterers, that may not be detectable using the conventional local-based framework.
1. Introduction
The differential synthetic aperture radar (SAR) interferometric techniques are today well assessed and widely exploited in remote sensing of complex urban scenarios to measure the Earth’s surface displacement [1,2,3]. Among them, the class of persistent scatterer (PS) SAR interferometry (PS-InSAR) [1] has been recognized as one of the typical techniques for inspection of urban environments and natural terrains such as volcanoes and rural areas [4,5]. The approach mainly operates at the full spatial resolution and allows improved information extraction of coherent scatterers. The extracted information is commonly associated with the residual topography and the related deformation parameter, i.e., mean velocity of scatterers [1]. It should be reminded that the term coherent scatterer mainly refers to the spatially concentrated backscattering responses, such as those obtained from the anthropic structures in the urban area that are persistent over the data acquisition time interval.
However, due to the side-looking intrinsic properties of SAR systems, the vertical structures of an urban environment can represent a challenging scenario for interferometric data-processing and consequently limit the PS-InSAR application for inspection of man-made constructions. In such a scenario, an alternative approach is SAR tomography (TomoSAR). The technique explores SAR data obtained over different orbits to reconstruct the backscattering distribution along the vertical direction and consequently resolves the backscattering confusion from the scatterers inside a resolution cell [6]. It is important to note that besides the detection of superimposed PSs, SAR tomography permits the improved detection process of single scatterers with respect to interferometric techniques [7]. Hence, TomoSAR completes and extends the application of PS-InSAR and it similarly allows estimation of the scatterer’s parameters related to possible deformation that may be given by the mean deformation velocity and the thermal dilation [8,9,10].
TomoSAR principally relies on the persistence of the scatterers during the observation time interval. Although the tomographic distributed source model [11] may mitigate the short term effect of decorrelating sources, the discrimination between reliable scatterers and false alarms is an imperative task, specifically when dealing with data obtained in a long time interval. Commonly, the key point in TomoSAR permanent scatterer detection framework, in the presence of noise, is related to increasing the number of detectable and reliable scatterers while keeping low the possibility of signal misinterpretation that leads to false alarm [12]. This issue can be approached by the detection methods that allow controlling the false alarm rate (FAR) such as Generalized Likelihood Ratio Test (GLRT). In the framework of GLRT scheme, an efficient strategy for the detection of multiple PSs lying in the same range-azimuth pixel is the support GLRT technique [13] that is based on the best support of the unknown signal which matches the data. Recently, the efficiency of this typical GLRT-based approach was significantly improved by the use of multi-looking in [14]. The main objective of multi-look GLRT is improving the detection capability over the scene and in particular over the areas characterized by a low Signal to Noise Ratio (SNR). Thus, by applying the adaptive spatial filtering techniques, the probability of detection is improved at the cost of spatial resolution loss. More precisely, by a slight multi-looking and trading off the spatial resolution, a significant improvement can be obtained by multi-looking operation [14].
Generally, the robust implementation of multi-look GLRT [14] relies on the proper identification of similar samples, i.e., the realizations of the signal acquisitions or looks, through the estimation of the data covariance matrix (CM). From the fact that different realizations of each image are generally unavailable, the true covariance matrix is unknown. However, it is straightforward to approximate the true CM by the sample covariance matrix (SCM) that corresponds to the maximum likelihood estimation (MLE), when the data vector obeys the classical zero-mean complex circular Gaussian distribution model [15]. Proper identification of similar pixels in the image that share a statistical similarity is a challenging issue. Traditionally, SCM can be estimated using a limited number of local pixels, which typically are selected in a neighborhood of the target cell, as it happens in the boxcar-based approach. The known boxcar technique is limited by losing the spatial resolution and overlapping the different backscattering contributions. To mitigate the effects of the resolution loss and scattering confusion, the adaptive multi-looking operations have been employed in the literature [16].
In the framework of adaptive multi-looking, a successful trend has been emerged with the non-local techniques, where rather than selecting neighborhood pixels, the main idea is to select the similar pixels within the image, usually, within a searching window. The similarity or the relative importance of pixels is defined by comparing their surrounding neighborhoods, known as patches [16]. However, the efficiency of patch-based approaches depends on the definition of the similarity criterion that quantifies how much the patches are similar. To improve the discrimination power of the similarity criterion, the use of a pre-estimated covariance matrix of each patch is strongly recommenced in the literature [17]. Among the different criteria, the generalized likelihood ratio (GLR) has shown several invariance properties [18] and it has been frequently employed in the literature [16,17]. Nevertheless, the performance of GLR-based criterion drops when the pre-estimated CM departs from Wishart distribution, as it may happen when dealing with a large number of data obtained from long interferometric time-series acquisitions.
In this paper, the investigation on the role of covariance matrix estimation approaches for multiple PSs detection is deepened. In the context of the patch-based framework, the limitation of the similarity criterion based on the pre-estimated covariance matrix was highlighted. Accordingly, a more efficient and robust scheme based on the statistical distribution tests is adopted for identifying the similar pixels. Along this line, two different tests were assessed; one compares the distribution of two noisy patches [19], while the other compares a pre-defined distribution model with the empirical distribution of the ratio between the patches [20]. Typically, if the deterministic components of two noisy patches are equal, then their ratio will follow a known distribution. In this paper, these two statistical methods together with the classical boxcar-averaging approach were assessed and their potentials and limitations on multiple PSs detection using multi-look GLRT framework were discussed and evaluated.
This paper begins with an overview of the tomographic SAR signal model as well as the basic principles of multi-look GLRT detection framework in Section 2. Moreover, the explanation of covariance matrix estimation using the two non-local statistical methods is provided in this section. Comparative analyses on the role of covariance matrix estimation using real data acquired by COSMO-SkyMED (CSK) and TerraSAR-X (TSX) are reported in Section 3. Further discussions and conclusions on the results reported by the analyses are then given in Section 4 and Section 5.
2. Material and Method
2.1. TomoSAR Signal Model
Let us consider a multi-baseline (MB) geometry of SAR imaging system that operates at wavelength and range distance r. The system acquires N images of the same area along different trajectories that are distinct by orthogonal baselines from a reference master acquisition. By performing the classical two-dimensional focusing, the single look complex (SLC) SAR images are obtained from the raw data in each track; and the SLC images are coregistered with subpixel accuracy to the reference master one. For a fixed azimuth-range pixel, in the absence of miscalibration errors and properly deramped on the measured data, the stack data vector, say , is the superposition of backscattering from M scatterers along the elevation dimension, i.e.,
where is the lth realization of the source signal vector, that contains the M complex backscattering, indicates the steering matrix with M steering vectors, and is the complex additive white noise that follows a Gaussian distribution with zero mean and standard deviation of . Moreover, is the parameter vector that represents the position of the mth scatterer in the elevation direction in the three-dimensional (3D) case, i.e., , or along with the mean deformation velocity in the 4D case , and the thermal dilation coefficient in the 5D case . The parameters , , represent the relative elevation, mean deformation velocity, and temperature of mth scatterer, respectively. Then, the jth element of steering vector is given as:
where , , and indicate the spatial, temporal, and thermal baselines of jth acquisition with respect to a given master image. Moreover, is the incident angle, is the exponential operator and i is the standard unit imaginary number.
The covariance matrix of the observed signal in (1) is generally given by:
where is a non-negative real vector represents the backscattering distribution. Note that in SAR tomography, the reflectivity values are assumed to be uncorrelated. In (3), is a identity matrix, , †, and E are diagonal, Hermitian, and expectation operators, respectively. In multi-look SAR tomography, the main objective concerns the reconstruction of the backscattering distribution p, for each azimuth–range resolution cell, using the covariance matrix estimated by a set of L independent and homogeneous looks. It is understood that the multi-looking operation is employed, since the single look estimation of the data covariance matrix offers a poor statistical estimate.
The problem of estimating p amounts to a spectral estimation problem [6]. Beamforming is a simple and traditional filter design criterion coming from the spectral estimation theory. The criterion allows to recover the backscattering from a specific scatterer, while limiting the other interfering spectral components. Hence, the filtered signal’s retrieved power can be given by:
where is the sample covariance matrix estimated by:
In (5), indicates the relative importance of the lth look [16,17]. In the reconstruction using (4), the resolution of the backscattering reflectivity is limited and connected to the distribution of the baselines (spatial, temporal, thermal) and, consequently, the reconstructed vertical reflectivity profile may suffer from the sidelobe issues [6]. Hence, to the aim of sidelobes suppression and resolution improvement, the tomographic processing can be performed by Capon and sparsity-based approaches, i.e., compressive sensing [21,22,23,24].
However, the main investigated and experimented tomographic focusing algorithms for the processing of multi-temporal spaceborne SAR data are affected by decorrelating sources and temporal coherence loss of the (natural) scatterers. This is well known to produce defocusing and blurring effects as well as non-reliable parameter estimation. Hence, the discrimination between reliable scatterers with non-reliable ones and false alarms is an imperative task. As noted before, the discrimination can be performed by the detection methods that allow controlling the false alarm rate such as GLRT. The next subsection presents an overview of the multi-look GLRT detection approach.
2.2. TomoSAR Detection Framework
To address the problem of accurate detection of true scatterers, multi-look GLRT is among the most competitive ones that allows scatterer identification by controlling the false alarm rate. Generally, the detection problem can be conveniently cast in terms of the multiple hypothesis tests as:
where the hypothesis assumes the absence of PS, i.e., the observed data is a circularly symmetric Gaussian random vector with zero mean and covariance matrix , while assumes the presence of m PSs, whose parameters are collected in the unknown matrix , while contains the reflectivity of the m scatterers. Moreover, is constructed by their m corresponding steering vectors. When the hypothesis is valid, then the observed data are a zero-mean circularly symmetric Gaussian random vector with covariance matrix R. Hence, the multi-look GLRT for the binary hypotheses test , that evaluates the presence of n scatterers versus the presence of m scatterers, can be written by:
where f is the joint probability density function (PDF) of the looks. Let us assume the statistical zero-mean complex Gaussian model for the looks. Then, by limiting the detection process to single and double scatterers cases, i.e., , and , the first stage of the multi-look support GLRT that evaluates the presence or absence of scatterers is representable by [14]:
where . In (8), the true covariance matrix R is replaced by its approximation, i.e., the sample covariance matrix . When the complement of is accepted in the previous stage, then the second step of multi-look support GLRT acts as:
In the above equations, indicates the trace operator, and is the threshold of each step that can be set using the constant false alarm rate (CFAR) approach [13]. In particular, the thresholds at each step k of the detection test can be derived in such a way to obtain an assigned probability of false alarm (FA). In this paper, both thresholds are numerically derived in such a way to obtain a constant false alarm rate . Moreover, the parameters and in (8) and (9) can be obtained using the joint maximum likelihood estimation approach under . However, to the aim of fast implementation, the parameters are estimated by two decoupled MLEs, such that:
2.3. The Role of Covariance Matrix Estimation
Generally, increasing the density of detected scatterers, with the desired probability of a false alarm, is eminently important in TomoSAR PS detection framework. As noted before, a significant improvement in the detection process has been reported by moving from single-look to multi-look framework [14]. Along this line, in this paper, a further investigation on the role of different covariance matrix estimation approaches in tomographic PS detection is performed. As can be seen in the previous section, the detection performance in the employed tests (8) and (9), under the desired FAR, relies on the robust estimation of the sample covariance matrix. Hence, to investigate how and to what extent the PS detection can be improved by the robust SCM estimation, the typical approaches including local and non-local techniques, are experimented and compared.
Typically, the robust estimation of the sample covariance matrix in Equation (5) requires the selection of L samples that share a statistical similarity. As noted before, the selected L samples are limited to the local neighborhood pixels by the traditional boxcar method, which may lead to a mix of the information of scatterers belonging to the different objects. In addition, the traditional boxcar method sets the importance of all samples to be relatively equal, i.e., . It is more efficient to estimate the weights from the data.
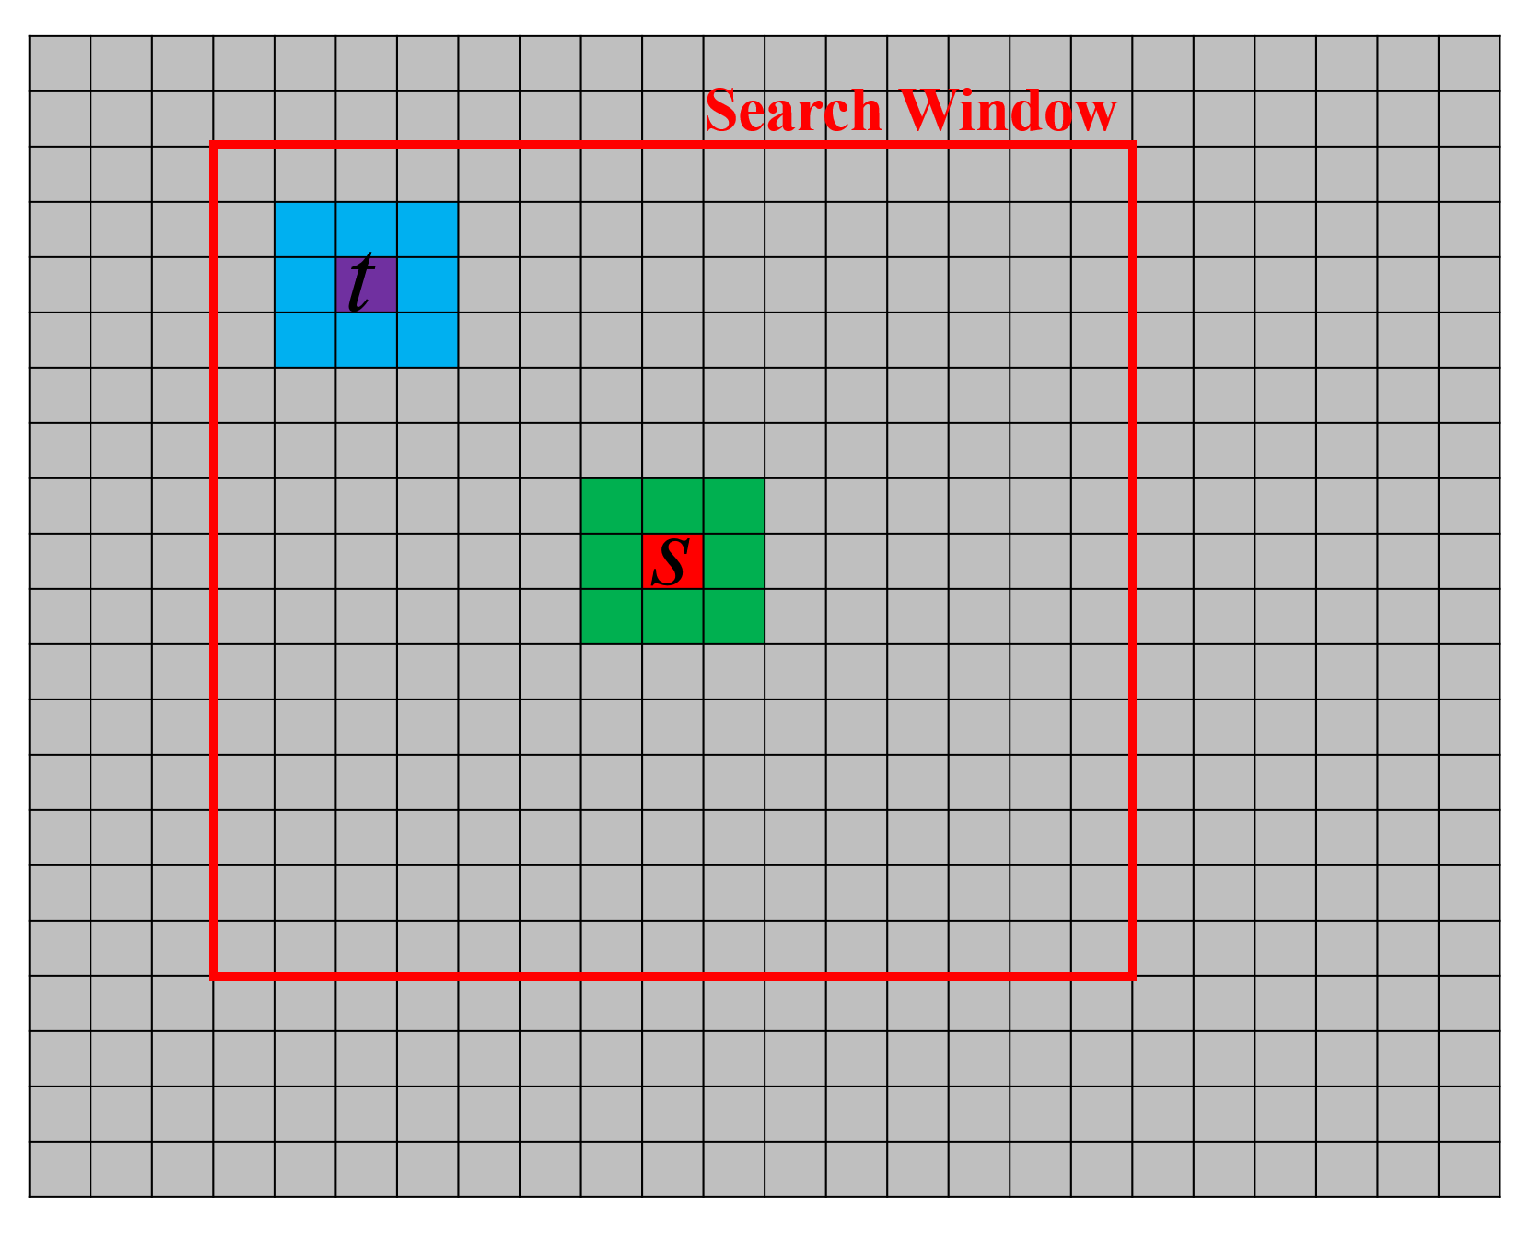
The patch-based technique is an efficient framework that avoids enforcing the sample selection to belong to a restricted class of signals. Particularly, this framework is based on the search of non-local neighbors of pixel s to be filtered, within a search window of a specific size, which shares statistical similarity with pixel t. Commonly, the pixel s is in the center of the search window (see Figure 1). A pixel t in the search window is assumed to be similar to the pixel s, if their patches or local neighbors that surround the two pixels are similar. The patches have the same shape and dimension, centered on pixels s and t (Figure 1). Hence, the similarity for two pixels is discerned by comparing their patches’ information. Once the similarities of all pixels in the search window are estimated, then the aggregation of the pixels is implemented with the weighted maximum likelihood approach using Equation (5). The weight or the relative importance w is generally estimated from the degree of similarity.
In the literature, the weight calculation using the complex data information were performed either by the pre-estimated sample covariance matrices through the GLR distance [17] or by checking the complex model of the observation vector [25]. Both approaches rely on the pre-estimated SCM, computed using a limited number of patch’s pixels. These frameworks have shown to be efficient with polarimetric and multi-channel interferometric data, where a limited number of images is employed [17,25]. However, when the dimensionality N of the stack data vector is much greater than the number of samples, the pre-estimated SCM is a singular matrix and the loss of likelihood of the estimation is non-negligible. In such a case, these techniques may lose their efficiency. Following this issue, the statistical test is a possible approach to compare the patches from the large stack data vectors and estimate their similarity. This framework is limited to the use of intensity/amplitude of SAR data since the tests can be mainly applied to real data vectors rather than complex values. However, the framework still is efficient when dealing with big TomoSAR data vector. In the next subsections, two statistical criteria for the estimation of sample covariance matrix from big TomoSAR data are presented.
2.3.1. Amplitude-Based Similarity Criterion
The amplitude-based similarity criterion is the commonly adopted approach in the literature [19], where the similarity criterion is defined using the empirical cumulative distribution functions (ECDFs) of two patches. Let be the informative vector that consists of the amplitudes (or intensities) of the stack data vectors in the patch s:
where indicates transposition and represents the data vector information, given in (1), for the lth sample in the patch s. The variables of are assumed to be independent and identically distributed. Given two informative vectors and of two patches s and t, a statistical test is applied to identify whether the samples s and t are drawn from the same probability distribution function. The Kolmogorov–Smirnov test is a possible option for this purpose [19], while the Anderson–Darling (AD) test can offer a better detection rate at a constant false alarm rate [26]. To compare the informative vectors of the patches, the AD test can be written as:
where and are the vectors obtained sampling the ECDFs of the independent and identically distributed observations in the row vectors and , respectively. indicates the vector obtained sampling the ECDF of the combined observations in the row vector . The parameter j in (12) is the element index of the ECDF vectors, such that is the jth element of . The test is performed for every pixel (t) in the search window to identify their degree of similarity to the pixel s. Note that the adopted AD test in (12) depends on the considered patch size. Hence, to extricate the dependence of AD distance to the considered patch size, the modified AD distance is employed, i.e., [20]
2.3.2. Ratio-Based Similarity Criterion
The other approach to compare the noisy patches is the ratio-based similarity criterion that relies on the computation of a ratio patch. Let us consider the super image generated by the temporal averaging of stack images. In a multi-temporal dataset, the speckle is temporally decorrelated, and the temporal multi-looking can effectively reduce the speckle temporal fluctuation and generate a super image with a higher SNR. Now, let us represent the amplitude information of patch s in the super image as . Apparently, the row vector can be written as a Hadamard product of the deterministic () and the speckle noise () terms, i.e., . It is known that the PDF of can be given by the square root gamma distribution as [27]:
where is the gamma function. For two patches s and t with informative vectors and , let us define the ratio patch as:
It is being understood that if the patches ( and ) belong to the same distribution, their deterministic (noise-free) components are equal, and then the ratio vector corresponds to the noise ratio (since and consequently represents the speckle ratio). In (15), the variables of are assumed to be independent and identically distributed. Additionally, in [28], it has been shown that the distribution of the ratio between two random speckle noises, i.e., , can be given as:
Particularly, in Equation (16) is the PDF of the ratio between two speckle variables or the PDF of ratio between two identically distributed square root gamma random variables. Hence, in a general situation, if the ratio vector (15) follows the statistical distribution given in (16), then patches are similar, and on the contrary, when the deterministic parts of the patches are different, the distribution of the ratio patch deviates from the model in (16). Generally, a statistical test can be applied to specify whether the ratio vector is drawn from the probability model given in (16). To this aim, the AD test based on the ECDF of the ratio vector and the known cumulative distribution function (CDF) of is performed. Hence, the AD test can be represented as:
where indicates the sampled ECDF of the independent and identically distributed observations in , and is a vector representing the sampled CDF of the independent and identically distributed random variables in the vector having the distribution model in (16). Moreover, indicates the sampled ECDF of the combined observations in the vector . Then, the modified distance in (17) is given as:
It should be noted that the generation of super images relies on the assumption of having a constant deterministic signal (y) over the acquisition, while the measured complex signal in (1), which is the production of deterministic and noise components, can be modeled with the Gaussian distribution. Moreover, when the signal to additive noise ratio before amplitude averaging is sufficiently high, the generated super image can be seen as a multi-look image, where the multiplicative noise distribution can be still represented by (14).
The framework uses the super image to find similar samples in the noisy data. However, it should be noted that when generating the ratio patch using the original multi-temporal (noisy) stack data (i.e., ), the presence of additive noise and temporally decorrelated speckle are disturbing factors for model assumption. In particular, the ratio of two patches with equal deterministic components () may not correspond to the speckle ratio, i.e., . The use of a super image for the generation of the ratio patch can significantly mitigate the additive noise contribution such that the equality can be approximately verified, i.e., . This justifies the investigation of the ratio-based statistical approach for covariance matrix estimation of TomoSAR data. Note that the additive noise effect mitigation by temporal averaging process is paid at the cost of estimating ECDFs using a reduced number of samples. Moreover, dissimilar partially coherent pixels that have different time-series backscattering histories may be represented by similar average values. In such a case, the reliability of the estimated similarity measure using the super image can be impaired. The reference [20] introduced this ratio-based technique for the noise reduction of a single amplitude SAR image; while in this paper, the technique is extended to the multi-baseline data and the similarity is estimated by generation of the super image and using the AD test (17). It should be noted that despite the fully developed speckle assumption [29] mismatch in textured area, the applicability of this ratio-based approach over urban areas has been shown in [20].
2.3.3. Transformation of Similarity to Weight and Aggregation Process
In this paper, the conventional boxcar approach and two non-local frameworks are considered for the estimation of sample covariance matrix in (5). The boxcar framework estimates the SCM using the local neighborhood pixels, in which the similarity of all pixels is assumed to be relatively equal, i.e., . Instead, in non-local techniques, the degree of similarly is estimated from the data.
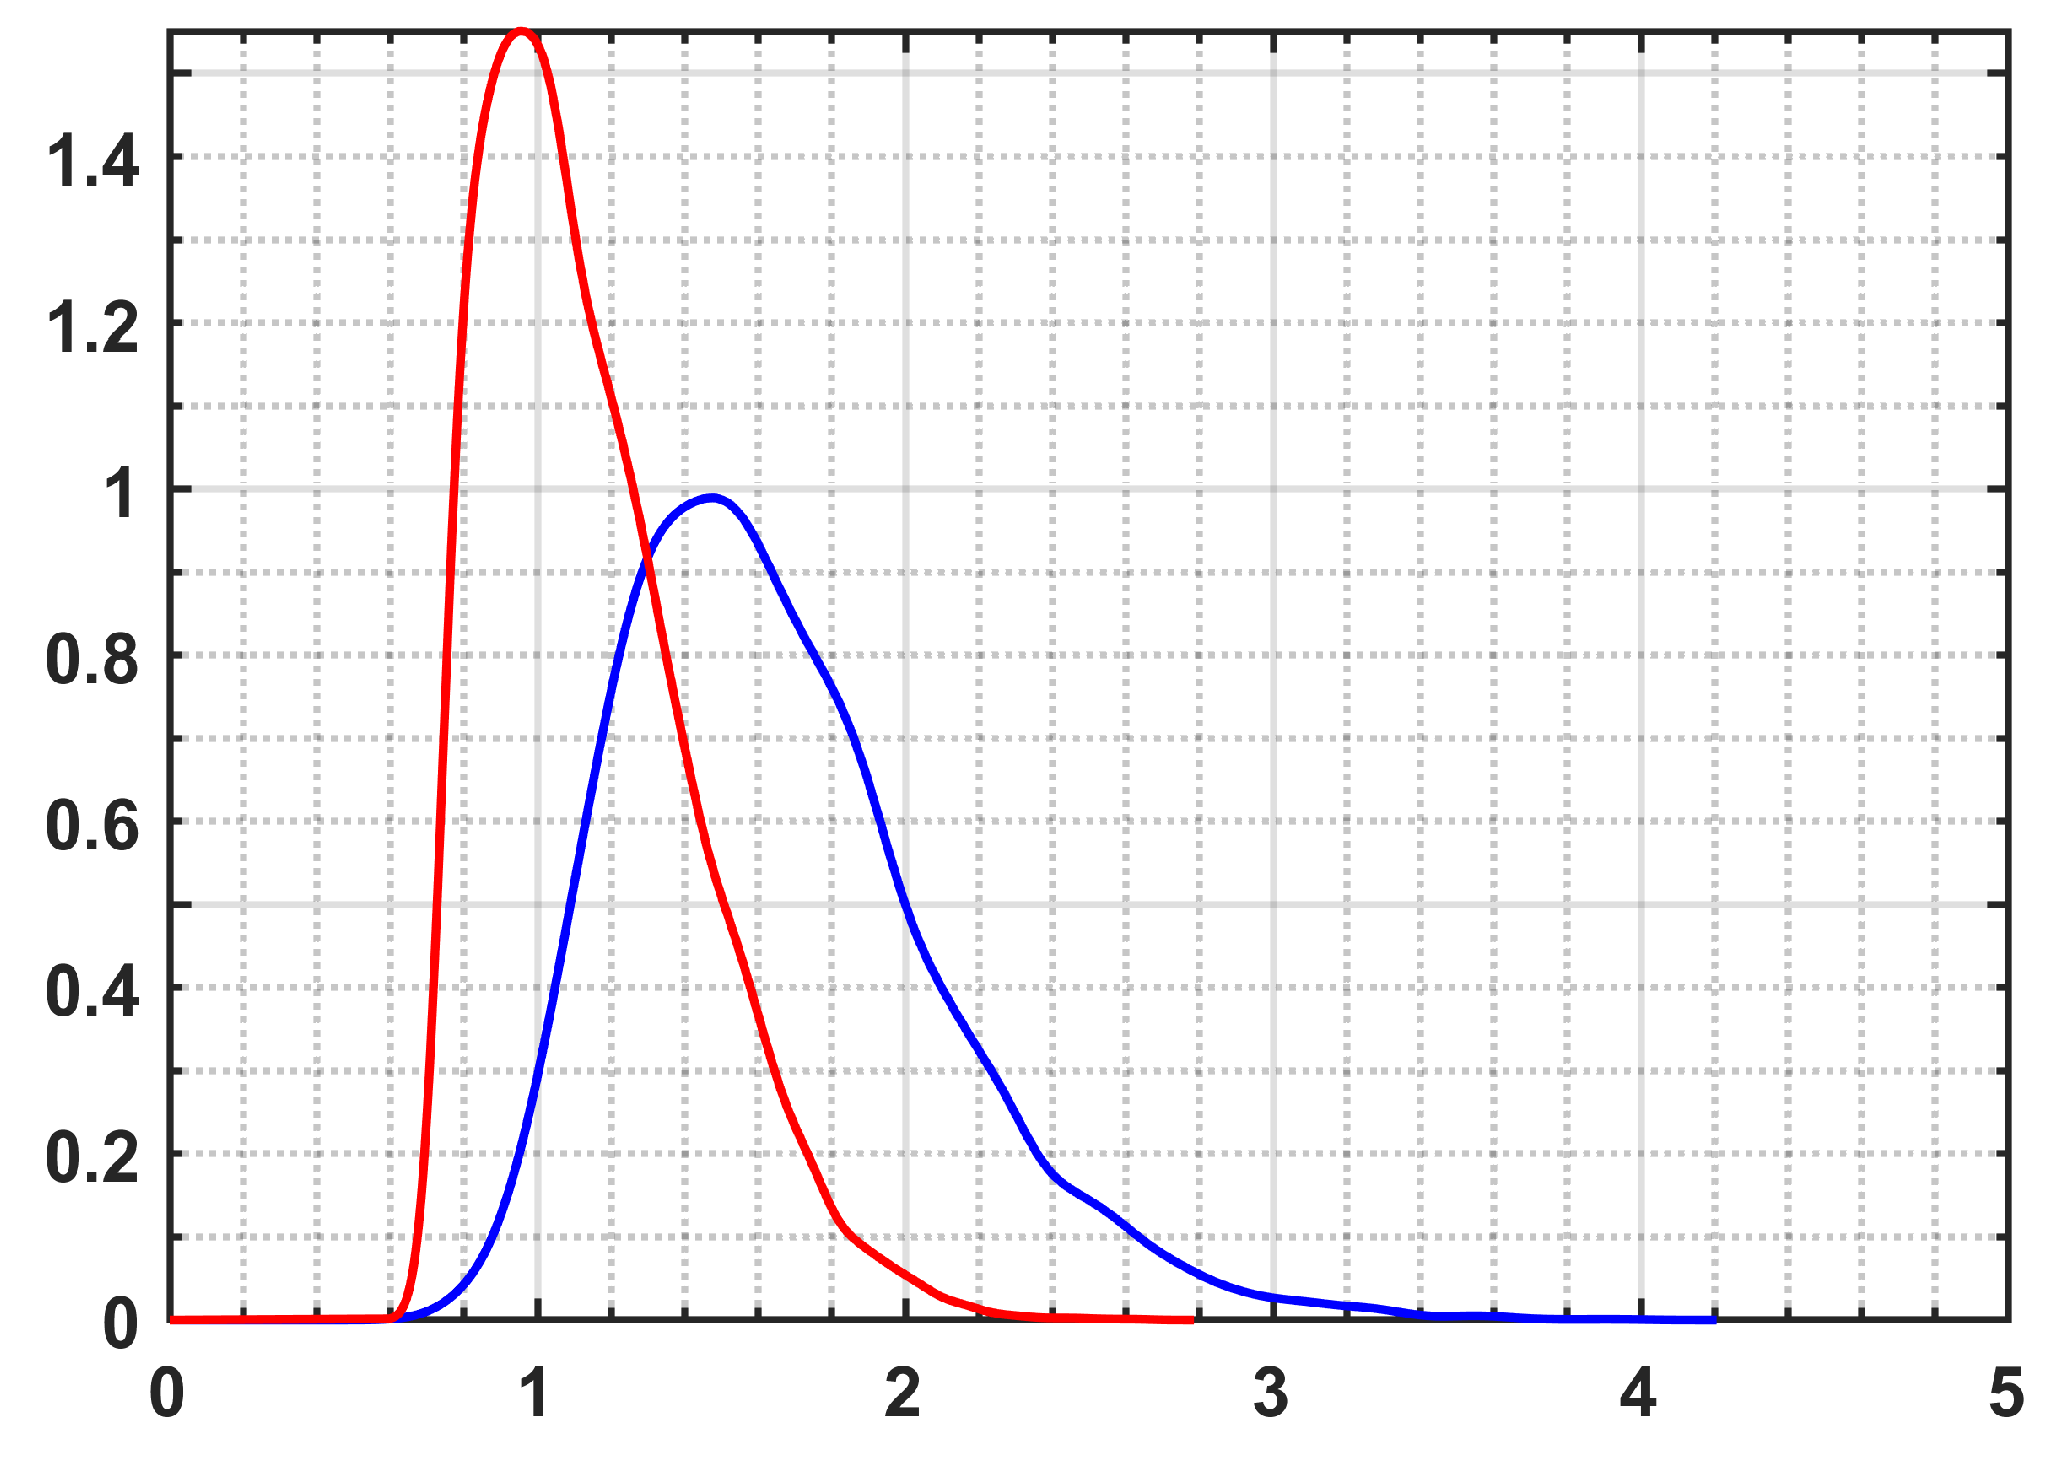
The first considered non-local method is the Amplitude-based Distribution Similarity (ADS) technique, in which the similarity is estimated by comparing the amplitude information of the patches ( and ) using (13). Once the similarities of the samples in the search window are computed, it is mandatory to define how to aggregate these samples in order to have a non-local estimation of the covariance matrix. For this aim, a weight function has to be defined according to the relative importance of each sample used in the non-local estimation. Hence, in order to map the similarity into weight, the idea presented in [20] is followed, such that the PDF of modified distance in (13) is considered as the weight function. The probability distribution of is shown with blue profile in Figure 2. From the PDF, it is apparent that the pixels with small values of AD distances are considered within the fusion step, while pixels belonging to patches having large distances are neglected. Once the similarity distance (13) is mapped into the weight value, the non-local covariance matrix is computed using Equation (5).
The second non-local method is the Ratio-based Distribution Similarity (RDS) technique, where the information of the ratio patch from the generated super image are used to estimate the distance using (18). In analogy to the previous method, the transformation of ratio-based similarity to the weight is performed by the PDF of , as shown with the red profile in Figure 2.
It should be noted that both plots in Figure 2 are obtained by numerical simulation and by computing the PDFs of the modified AD distances from two noisy patches, whose deterministic components are equal. Note that the PDFs neglect the pixel with modified distance smaller than 0.6. This is due to the point that the AD distances in (12) and (17) are improbable to assume zero as a minimum value [20]. Accordingly, transformation of the AD distance (12) and (17) to the modified AD distance (13) and (18) makes the minimum value become approximately 0.6. Finally, the implementation frameworks of both non-local covariance matrix estimations are summarized in the given algorithms in Table 1.
3. Experimental Results
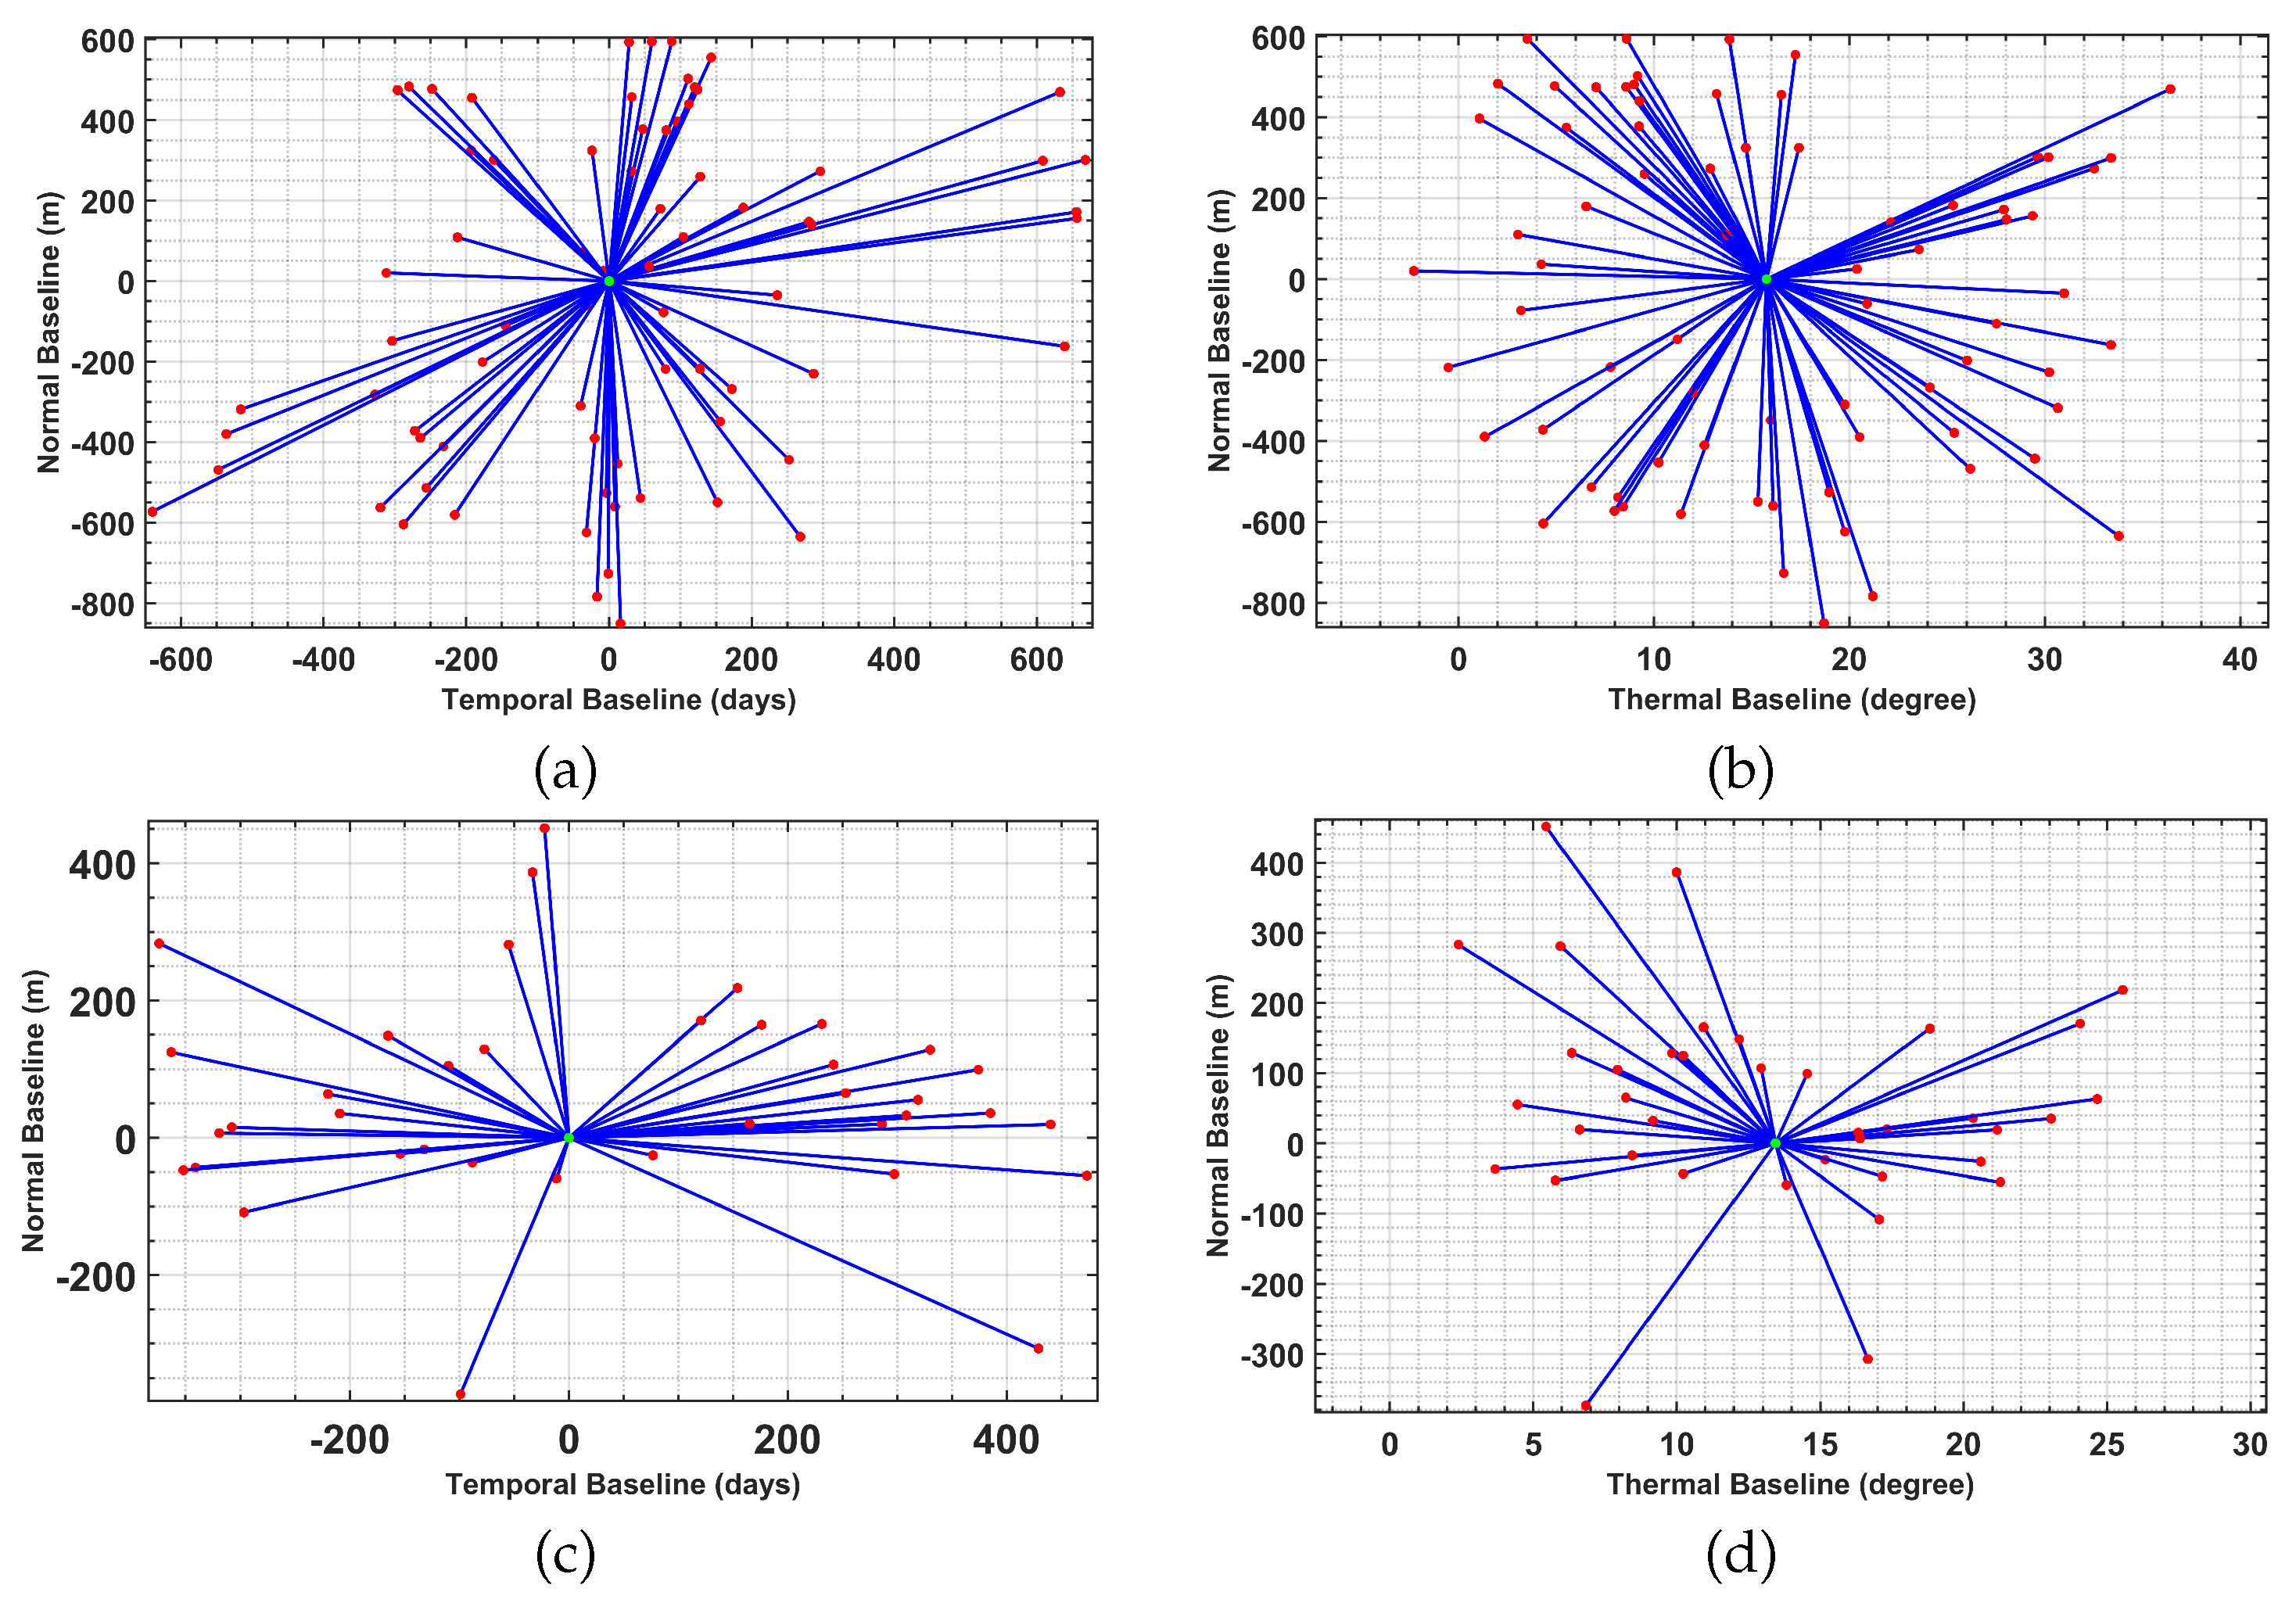
To assess the efficiency of robust SCM estimation, the experiments were carried out on two different datasets. The first dataset was acquired by COSMO-SkyMED sensor over Tehran metropolitan, and it consists of 75 single look complex images acquired between June 2011 and December 2014 with the system operating in the strip-map mode and HH polarization. The second dataset was captured by TerraSAR-X sensor over the city of Toulouse, France. The data are a 2.3 year (between September 2013 and November 2015) temporal stack of 39 Spotlight images in VV polarization. The datasets’ characteristics are summarized in Table 2 and the baseline configurations are represented in Figure 3. The figure presents the correlation of different baselines and the sensors’ configuration in spatial, temporal, and thermal domains.
The Rayleigh resolutions for CSK dataset are about 7.3 m, 0.43 cm/year, and 0.42 mm/degree, and for TSX stack data are about 14.2 m, 0.49 cm/year, and 0.53 mm/degree along the elevation, the linear deformation rate, and thermal dilation, respectively. It should be noted that according to the Nyquist sampling, the Rayleigh resolution is the highest achievable resolution [10]. Moreover, both datasets were calibrated to the atmospheric effect and baseline errors by compensating for a constant phase offset, i.e., using a pixel in the image whose deformation is known (typically a high coherent pixel located in a non-deforming zone, which is characterized by a priori information about the test site) [30].
To assess the role of the covariance matrix, the performance of support GLRT in single-look [13] and multi-look detection frameworks was evaluated, in which the data covariance matrix for multi-look processing was estimated using the traditional boxcar, and the above-mentioned non-local approaches (ADS and RDS). The boxcar approach was implemented with a window size, while the non-local techniques were implemented with an search window and a patch window. After the estimation of sample covariance matrix, the support GLRT detection frameworks have been employed for the detection of single and double scatterers. It should be noted that all estimations and detection processes were carried in 5D space. Finally, both detection tests were performed by the threshold values from FAR approach ().
3.1. CSK Data Experiments: Tall Buildings
The first experiment is dedicated to assess the scatterer detection performance from tall buildings, which are corresponding to the layover regions in the SAR images. The studied buildings are the International tower and Millennium building in Tehran, where their corresponding interferometric fringes, between two specific CSK acquisition dates, are represented in Figure 4. The International tower and Millennium building are 162 and 118 m tall, respectively. The interferometric fringes in Figure 4 are represented in HSV color-coded, and they are generated when the interferometric phase, the absolute value of ensemble coherence, and the intensity image are coded by the hue, saturation, and value, respectively.
The trilateral shape of the International tower (Figure 4a) makes ground-wall interaction perfectly sensible at CSK image spatial resolution scale. The tower’s layover mainly is expected to compose of the contribution of the scatterers situated on the ground and on the wall with single and double bounces scattering mechanisms. From the implementation of the single-look and multi-look support GLRT, the detected single/double scatterers are projected onto the optical 3D Google Earth image of the tower. The first row of Figure 5 reports the elevation of the detected scatterers estimated using the employed approaches over the International tower. The color of the scatterers on the 3D images represents the elevation of detected scatterers. As can be seen, the color changes from blue to red by passing from the scatterers on the ground to the ones on top of the tower.
Additionally, the analysis of reconstruction of the single and double scatterers from the second building has been implemented. The corresponding results from different frameworks are presented in the second row of Figure 5. Similarly, the color represents the elevation of the detected scatterers. For quantitative evaluation of the role of robust multi-looking in the detection process, the number of identified (single and double) scatterers using single-look and the different multi-look frameworks are represented in Table 3. From experimental results, the performance of employed multi-look frameworks over the single-look detection process can be verified, while the potential of multi-look support GLRT was affected by the estimation approaches of the sample covariance matrix. It should be noted that within the time interval of CSK image acquisition, the Millennium building was under construction and it was completed in 2017. This might be the main reason that no reliable scatterer is detected from the top of the building, while other elements such as baseline distribution can also be an effective factor for this issue.
3.2. CSK Data Experiments: Urban Area
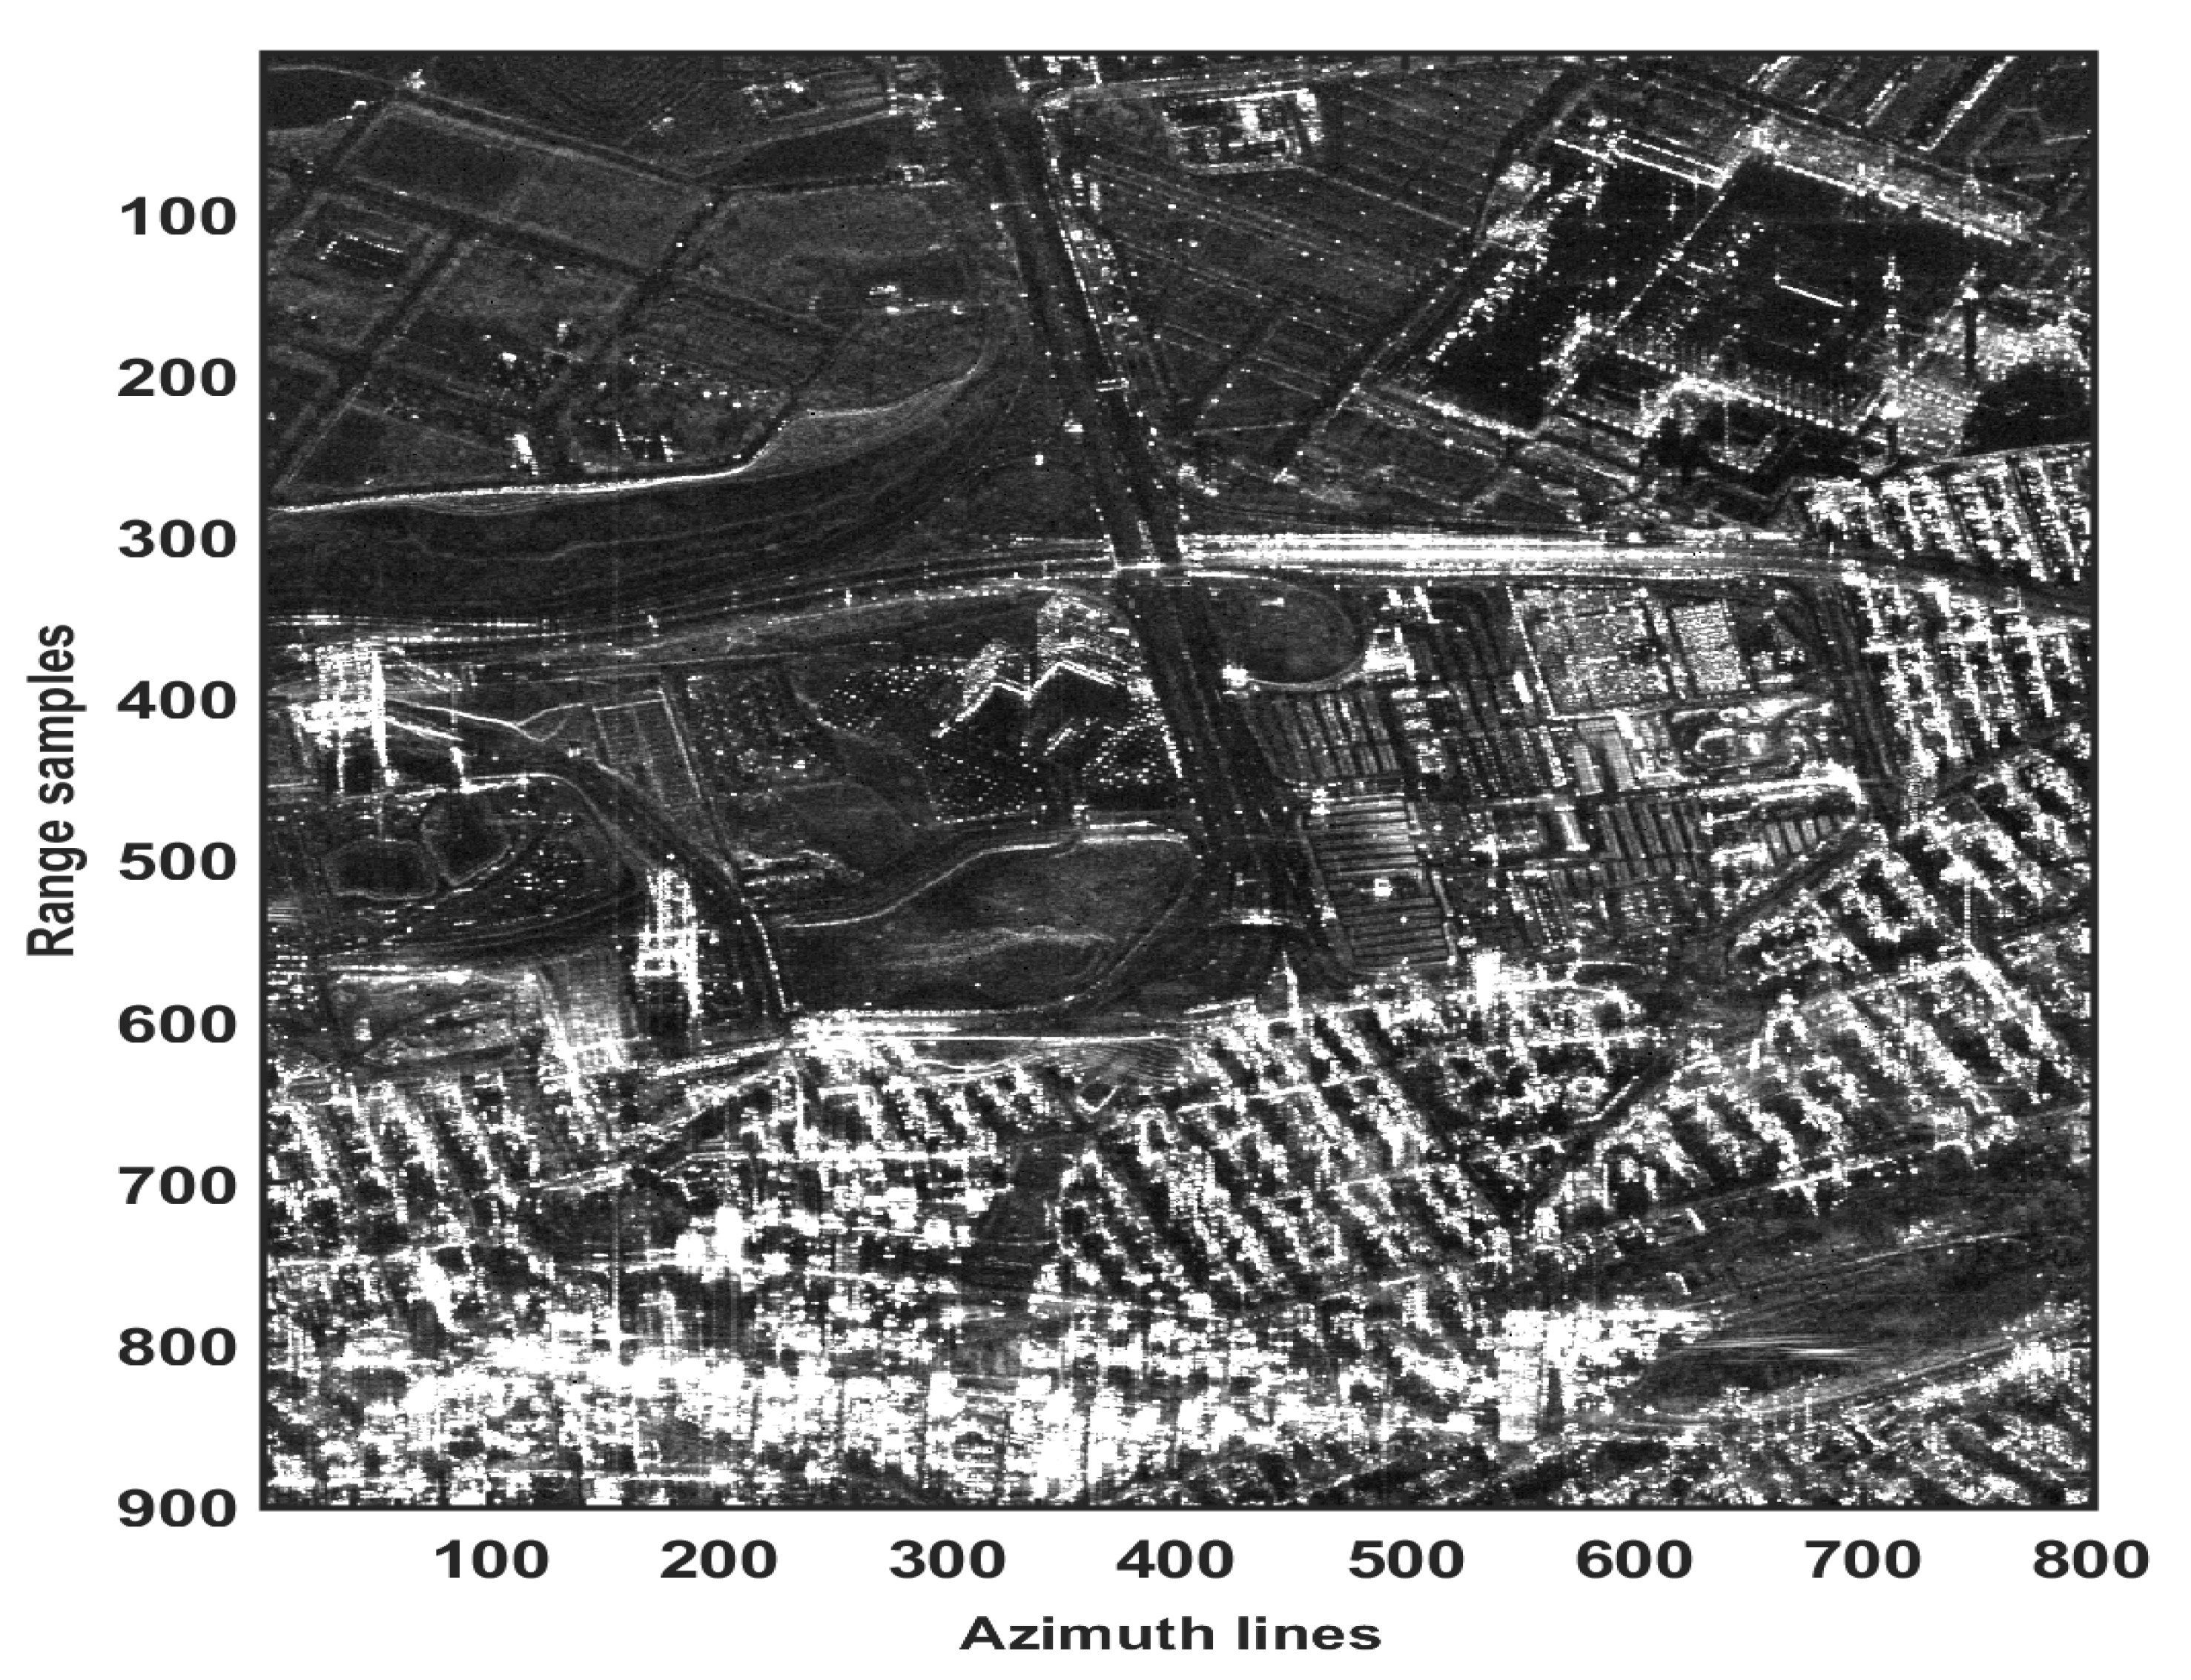
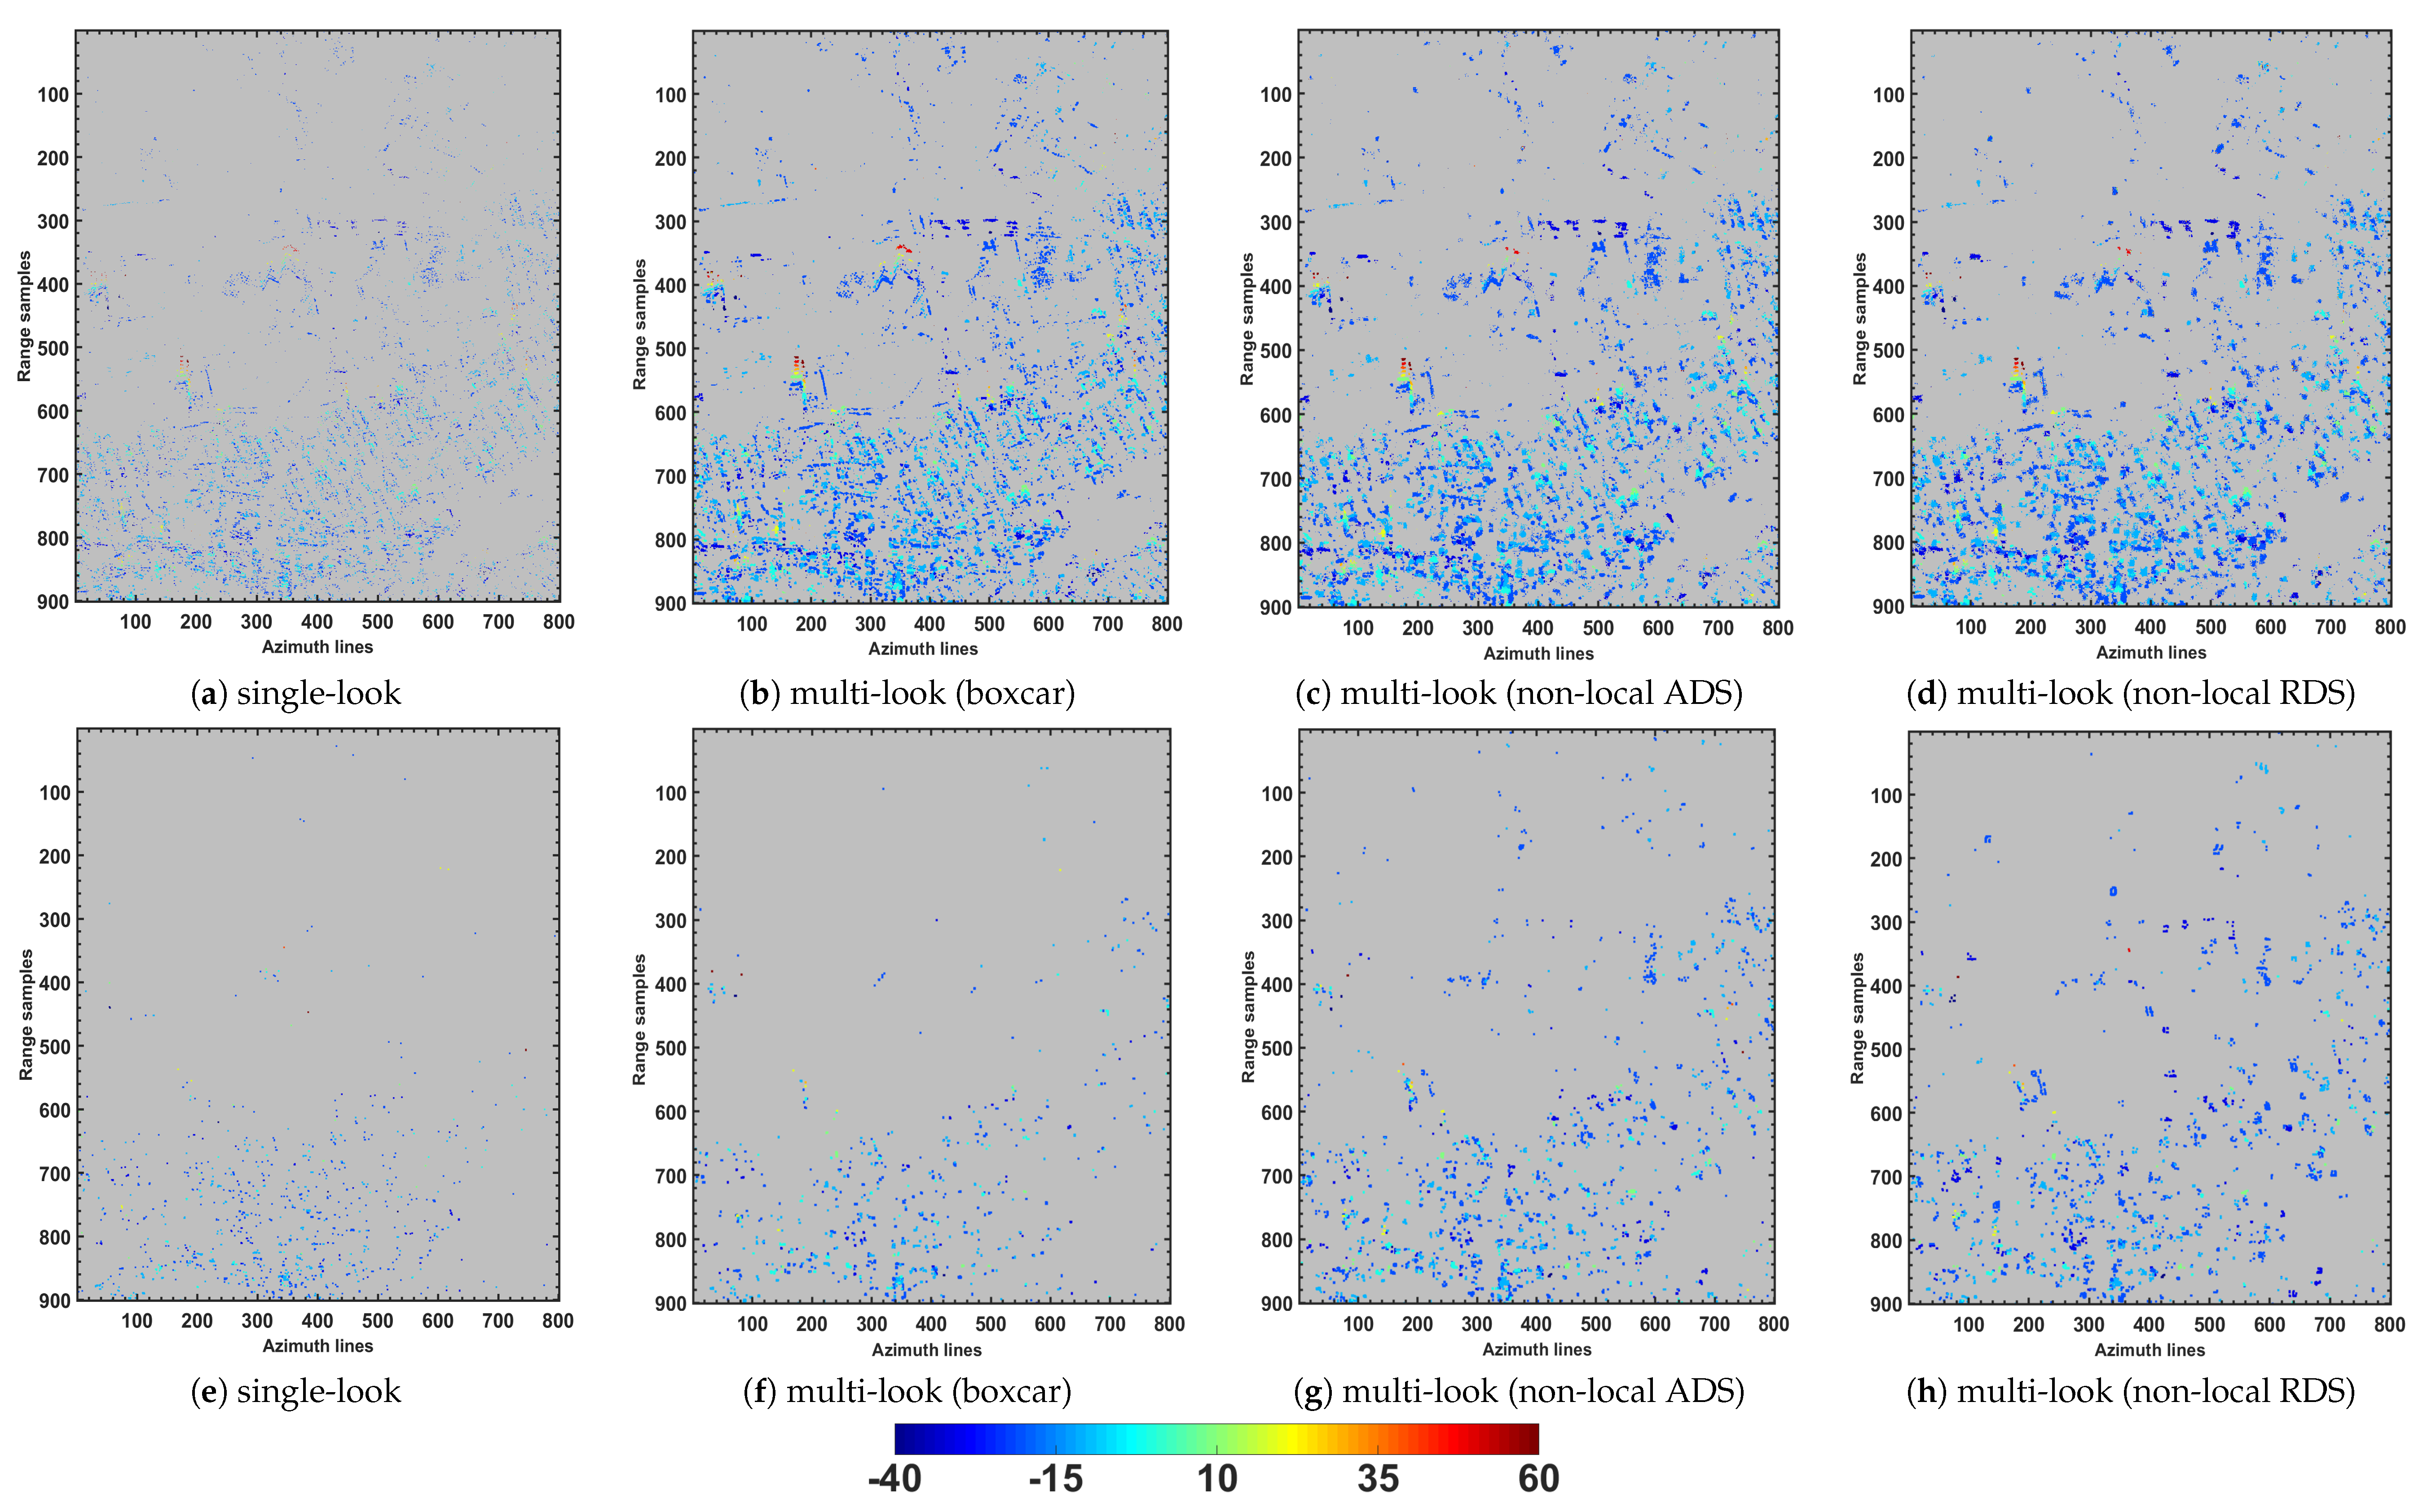
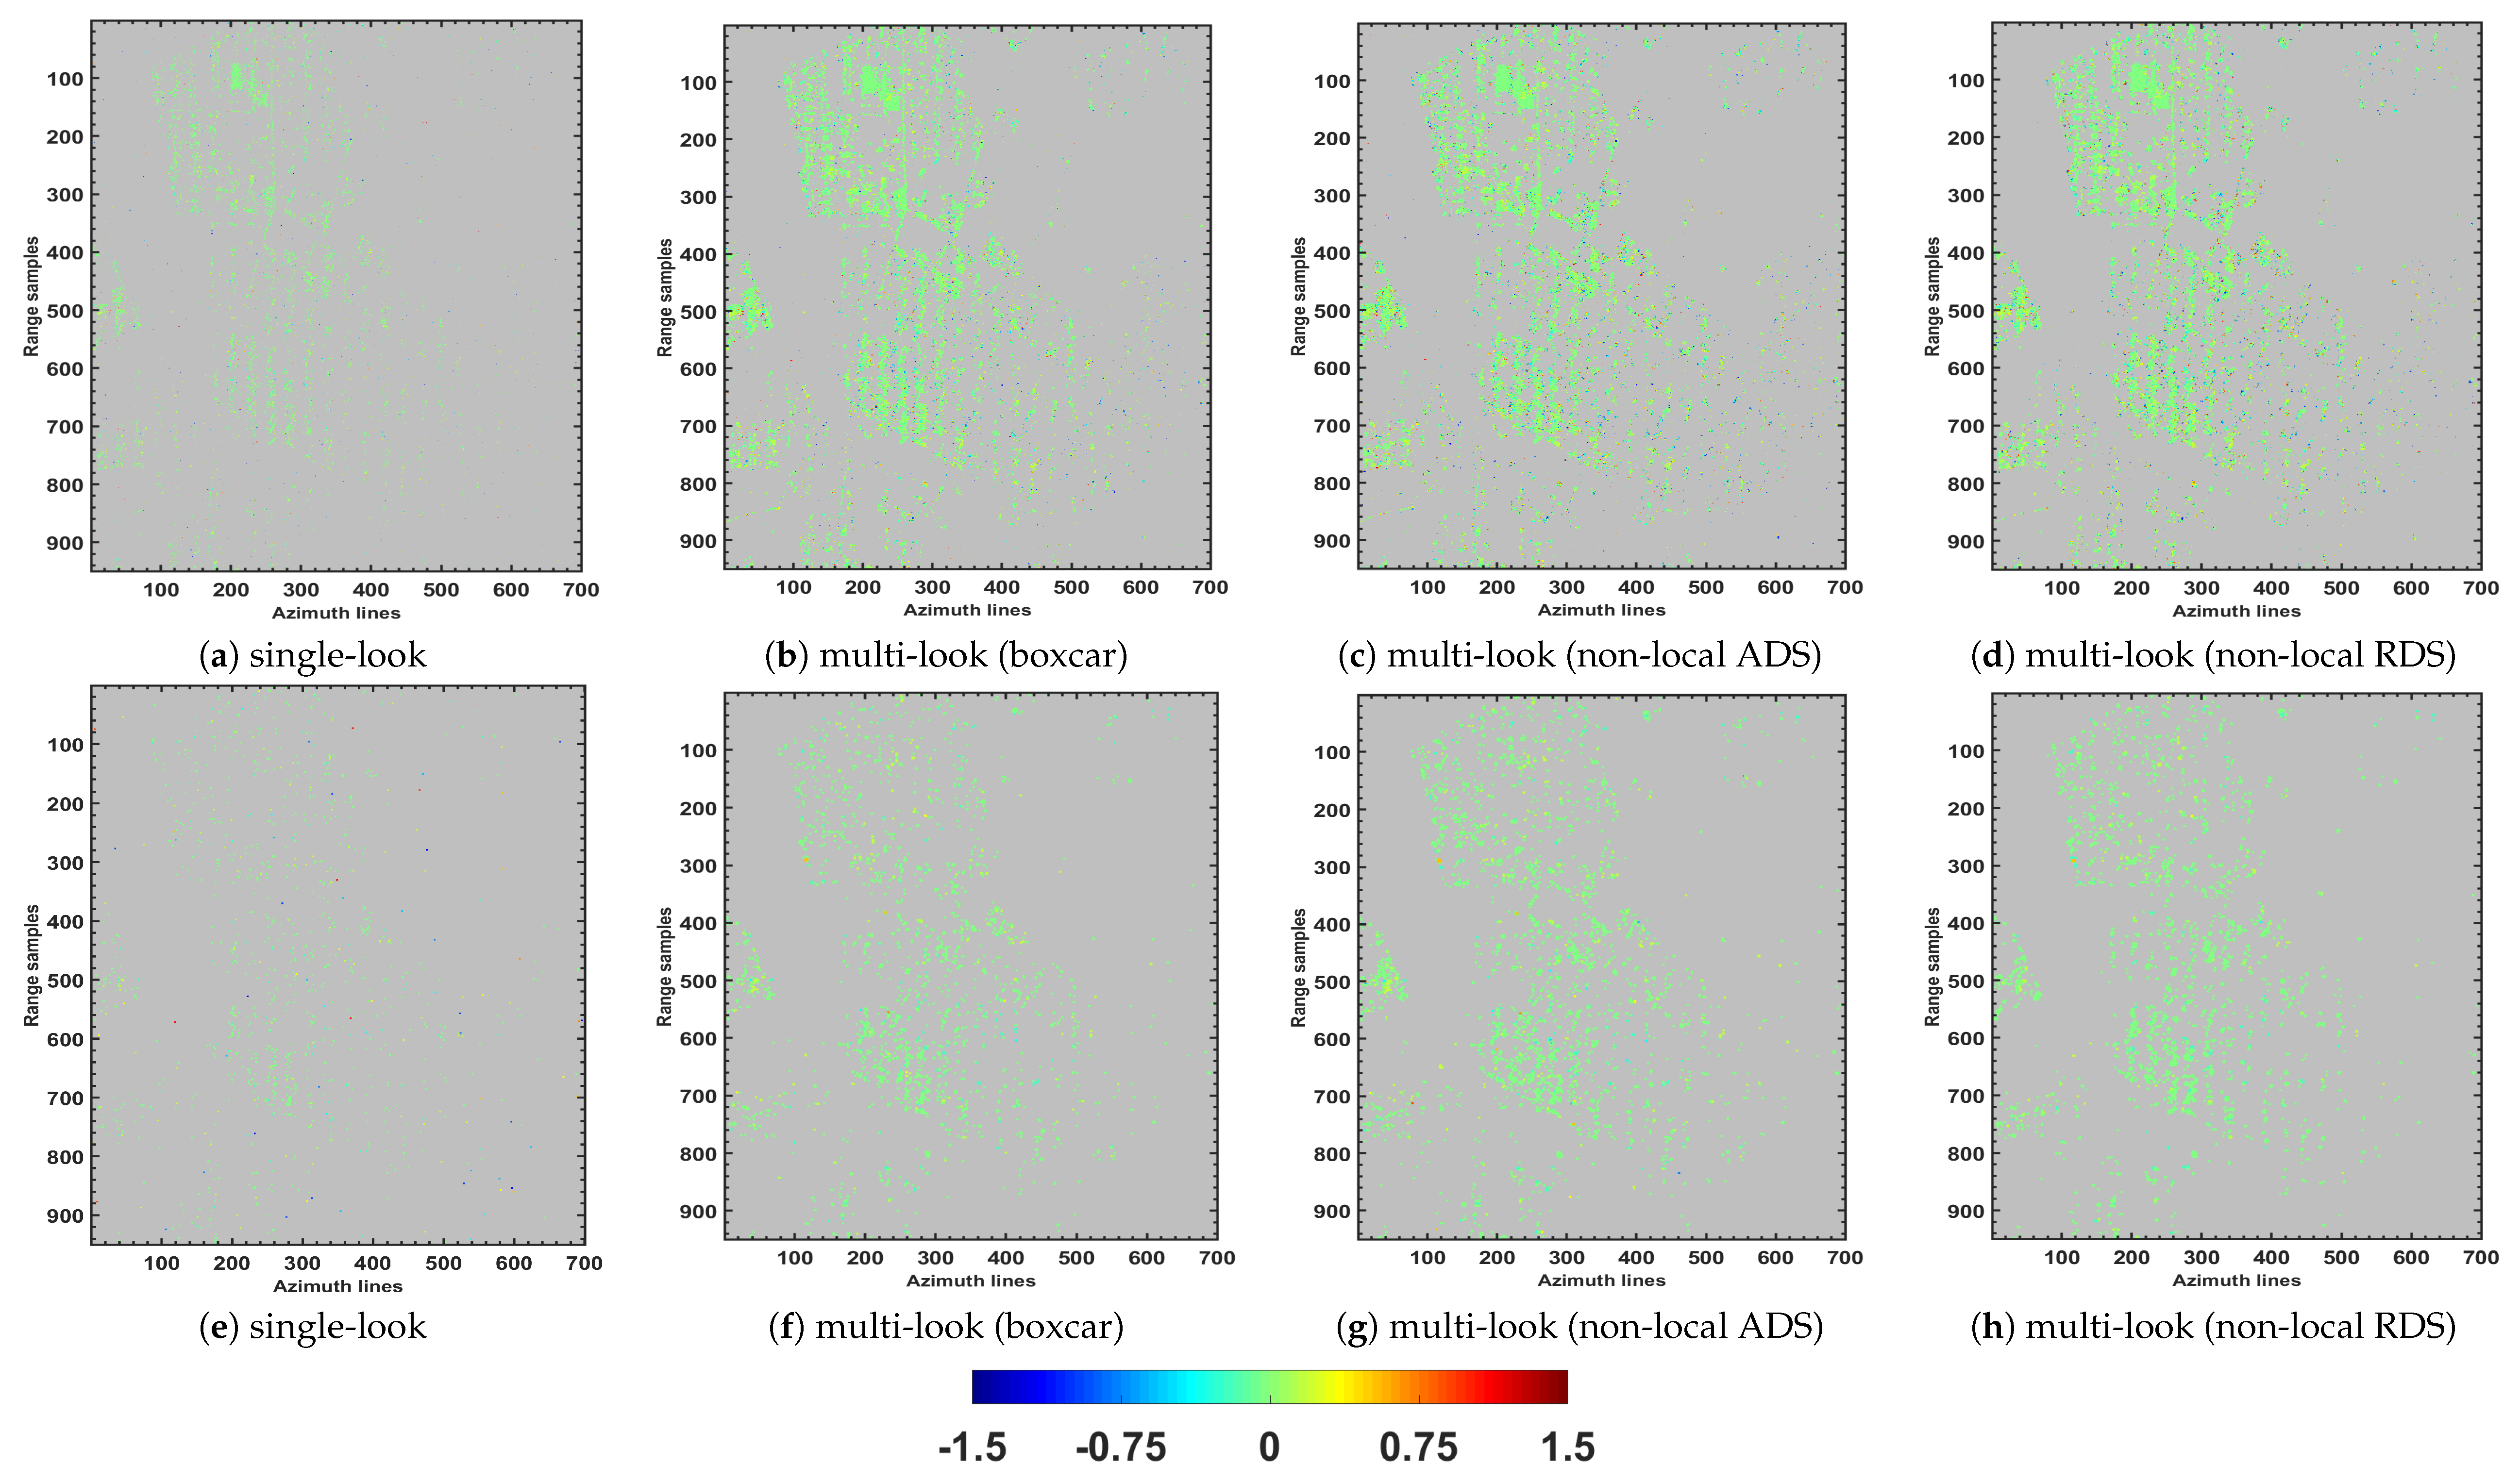
In order to assess the behavior of multi-looking operation when dealing with different targets, further experiments with CSK dataset in a larger region including different target scattering mechanisms have been performed. The amplitude image of the selected subset of the data with a size of pixels is shown in Figure 6. The data were processed and the detection tests in Equations (8) and (9) were carried out in the 5D space, in which, the scanned intervals of elevation (residual height), mean deformation velocity, and thermal dilation were set to [−60 60] m, [−3 3] cm/year, and [1.5 1.5] mm/°C, respectively. The test were preformed by exploiting the estimated covariance matrix from local and non-local approaches. Additionally, for the sake of comparison, the results from single-look support GLRT are reported. The residual heights of the detected single (Figure 7a–d) and double (Figure 7e–h) PSs are represented in the coordinate system of the SAR image. Moreover, to quantitatively compare the detection performance, the number of characterized single and double PSs are presented in Table 4. From the results, the performance of multi-look approaches over the single-look detection is evident. Moreover, comparison of the employed multi-look frameworks shows that the densities of detected single scatterers using the three multi-look techniques are slightly different. Instead, the density of double scatterers using the non-local techniques is improved with respect to the one obtained by the boxcar approach. It should be noted that the linear velocity and thermal dilation maps of the detected PSs, which are not reported for the sake of brevity, showed generally zero linear and non-linear deformations of the test site.
3.3. CSK Data Experiments: Non-Urban Area
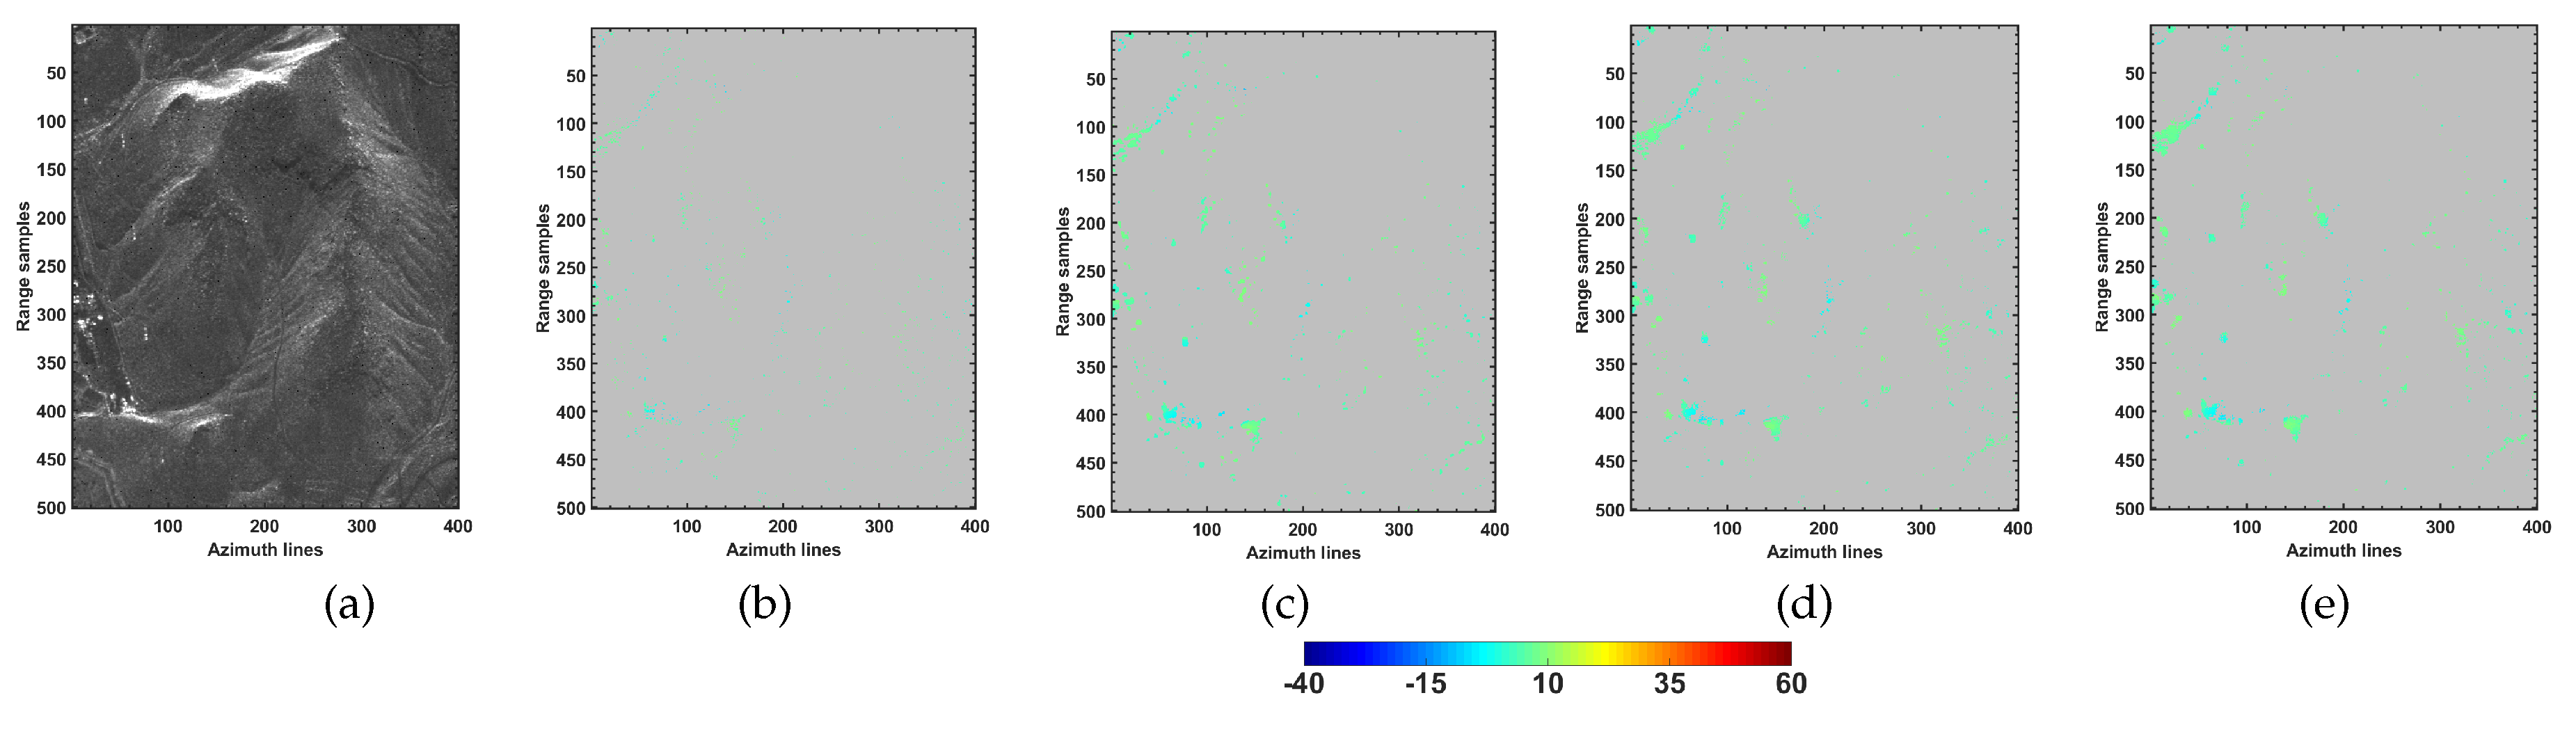
Additional experiments using CSK datasets were carried out over the non-urban and mainly non-layover area. The amplitude image of the selected subset of CSK dataset as well as the detected single scatterers using different employed frameworks are reported in Figure 8. Since the area does not encompass the layover phenomenon, the presence of double scatterers is minimal or negligible (see the number of detected double scatterers in Table 5). However, from the reported single scatterers, significant improvements were obtained by the use of multi-look operations in comparison with the single-look framework.
3.4. TSX Data Experiments
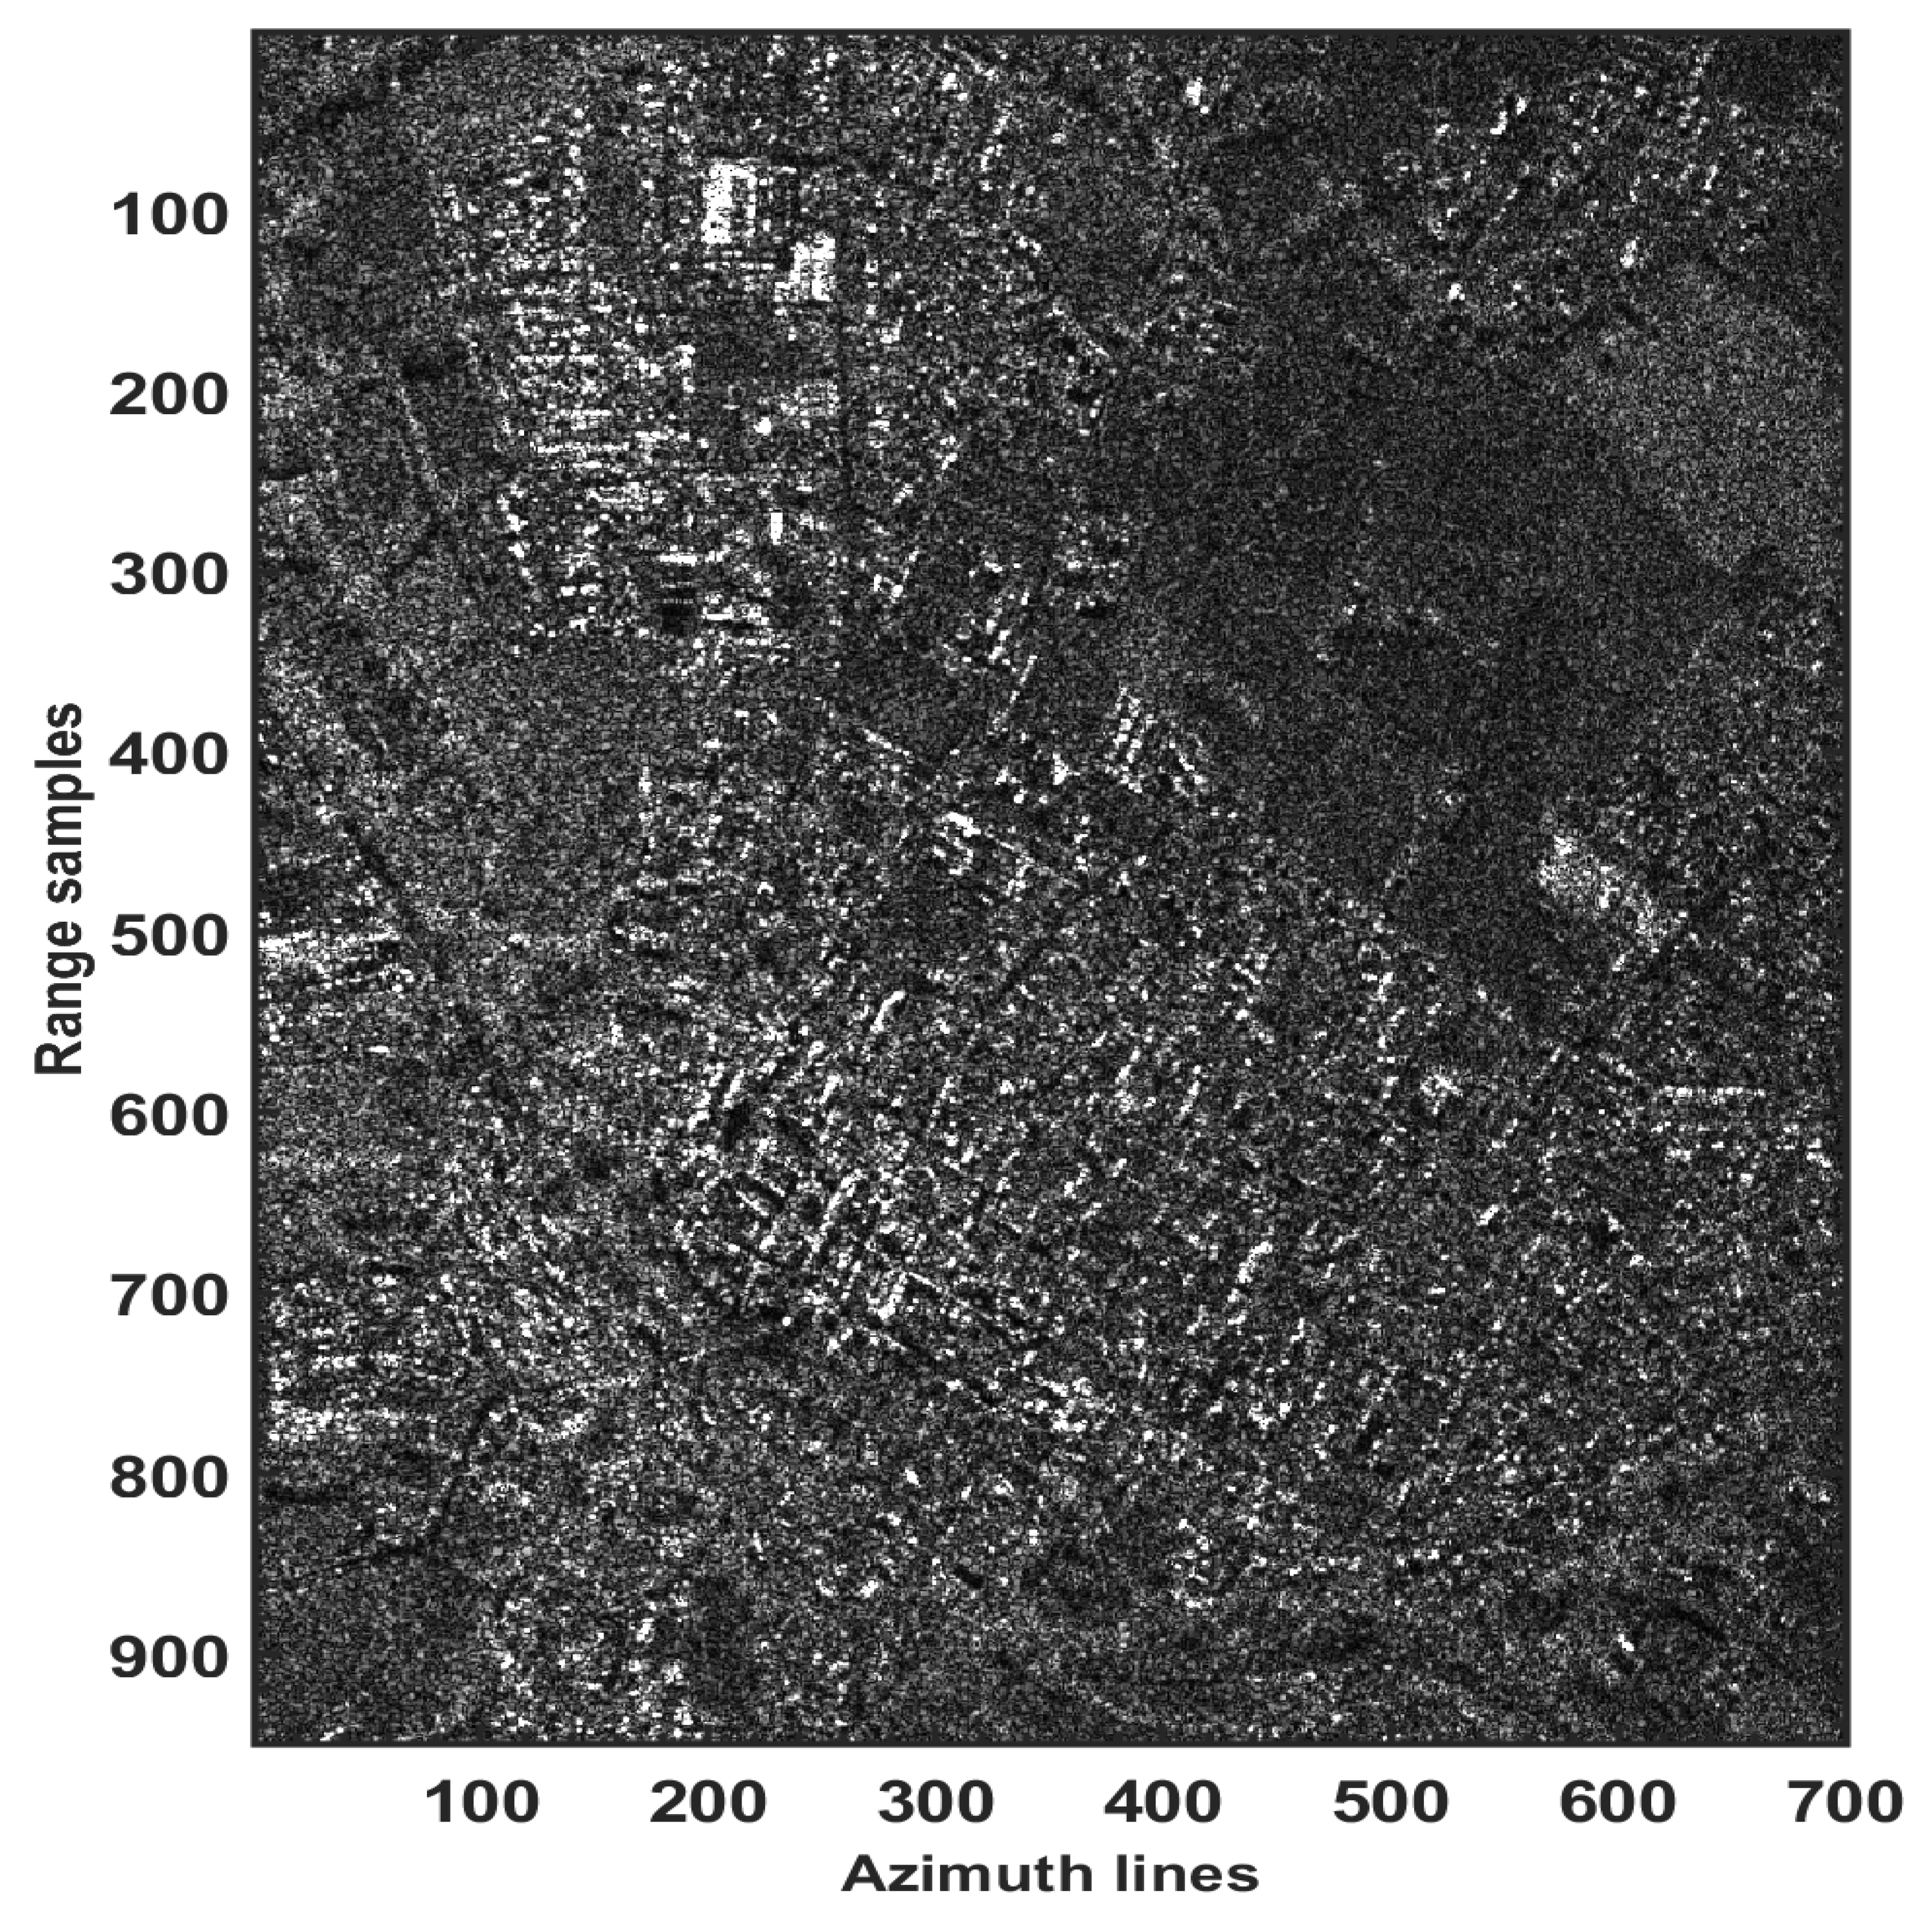
Further evaluation of the single-look and multi-look processes was executed using the TerraSAR-X dataset. Figure 9 shows the average amplitude (averaged across dataset’s acquisitions) or super image of the investigated area related to the city of Toulouse, France. The sample covariance matrix of the dataset is estimated again by three different employed approaches. Both single and multi-look support GLRT detection methods were carried out in the 5D space, while the parameter of the detected PSs (i.e., residual height, mean deformation velocity, and thermal dilation) were computed using the Equation (10). In particular, the residual height (elevation) interval was set to [−70, 70] m with an increment step of 2.5 m, the mean deformation velocity was scanned in the range of [−3 3] cm/year with a spacing of 0.25 cm/year, while the thermal coefficient interval [−1.5 1.5] mm/°C was scanned with an increment step of 0.1 mm/°C. The thermal maps of the dominant scatterers are reported in the first row of Figure 10, where the color-map is set according to the range of the thermal dilation. Additionally, the thermal information of the detected double scatterers is represented in the second row of Figure 10. In analogy to the previous experiments, considerable improvement in detection of double scatterers is reported by the non-local techniques in comparison with the boxcar approach. For a quantitative comparison of the results, Table 6 presents the number of detected single and double scatterers. Both qualitative and quantitative comparisons verify the influence of multi-looking in PS density.
4. Discussion
It is understood that the capability of the detection tests (8) and (9) in providing higher densities of PSs may rely on the robust estimation of data covariance matrix. The role of covariance matrix can be affirmed from the reported results achieved by the processing of CSK and TSX datasets. In particular, different lines were followed to assess the impact of robust covariance matrix estimation.
First, the role of multi-looking operation was analyzed for the reconstruction of the reliable multiple scatterers from tall buildings, i.e., in layover regions. In this case, the role of covariance matrix estimation is analyzed with respect to the detection of superimposed scatterers and particularly the detection of double scatterers from the upper part of the buildings. The qualitative (Figure 5) and quantitative (Table 3) results over the two investigated towers (International and Millennium) indicate the significance of multi-look process over the single-look detection framework reported in the literature [13]. Moreover, comparison of the obtained results by the employed multi-look frameworks indicates that the increased number of the detected scatterers was achieved by the non-local covariance matrix estimation approaches. The improvement by non-local techniques was obtained for both single and double scatterers. In particular, for the International tower, and in comparison with the boxcar-based detection framework, around 128 and 70 additional single scatterers were detected when SCM is computed using ADS and RDA, respectively. Furthermore, from the experimental results (specifically the results of the International tower), the appealing achievement by the NL techniques is related to the detection of additional double scatterers from the upper layers of the towers. The robust covariance matrix estimation by both NL approaches enabled to reveal the presence of the additional weaker scatterers and reach the top layers of the towers, where their presences were not detected using the traditional boxcar-based framework and single-look support GLRT. This achievement is confirmed by the results in Figure 5 and Table 3, where 226 and 239 additional double scatterers from the International tower were detected using ADS and RDS, respectively, in comparison with the boxcar technique. Although, the boxcar-based framework outperforms the single-look detection process, in comparison with the NL-based approaches, it fails to properly resolve the layover of scatterers from ground and upper layers of the towers, where the selection of similar samples is limited to the neighborhood pixels that may lead to some scattering confusion and consequently poor estimation of covariance matrix. Instead, the definition of search window allows NL approaches to be more convenient techniques by the selection of non-local similar samples leading to better noise reduction and consequently revealing the weaker scatterers.
On the basis of the performance evaluation of the experimental results from the investigated towers, some remarks are in order. The non-local framework fulfills tangible advantages over the local technique and single-look support GLRT. Indeed, in the boxcar approach, on the one hand, the limited number of neighborhood samples my not provide a robust estimation of covariance matrix; and on the other hand, increasing the window size and the number of local samples brings scattering confusion and resolution issues. Instead, the NL approaches are able to select more pixels with the same distribution within the defined search window and consequently resolve the local estimation problems. Moving to the non-local techniques, the comparable results were reported by both approaches. This affirms the applicability of the employed RDS in tomographic detection framework. It is worth pointing out that the model’s assumption in RDS may cause mismatches. However, generation of super image mitigates the mismatches’ issues related to the presence of additive noise and temporally decorrelated speckle from an image to image. Finally, it should be noted that the detected targets from both buildings were geocoded and overlapped to the 3D Google Earth images. The tomographic geocoded points fit well the shape of the buildings in the 3D view, thus providing evidence of the reliability of detected scatterers.
Moreover, to conclude on the importance of multi-looking operation, further experiments were presented using a larger subset of CSK data in the urban area including the pixels from different objects (Figure 6). In such a scenario, and unlike the boxcar approach, the patch-based framework is expected to perform optimally and avoid the potentially dangerous identification between closeness and similarity [18]. From both qualitative (Figure 7) and quantitative (Table 4) comparisons, it can be observed that the employed non-local techniques provided a higher density of detected PSs and they outperform over the boxcar and single-look detection methods. Particularly, single-look support GLRT detected 21,445 single scatterers and 1293 double scatterers, while using boxcar framework, 63,130 single and 3112 double scatterers were characterized. Instead, by the non-local ADS, 65,204 singles and 4266 doubles were detected. Moreover, the NL RDS provided 64,539 singles and 4291 doubles. In analogy to the experiments from the towers, the main improvements by the non-local approaches are related to the detection of double scatterers. This is confirmed in the reported residual height maps of double scatterers in Figure 7, indicating the role of covariance matrix estimation in TomoSAR PS detection framework. The robust NL estimation of the sample covariance matrix allowed improving signal quality and consequently revealing the presence of weaker (double) scatterers, that were not detected by the classical boxcar and single-look estimation approaches.
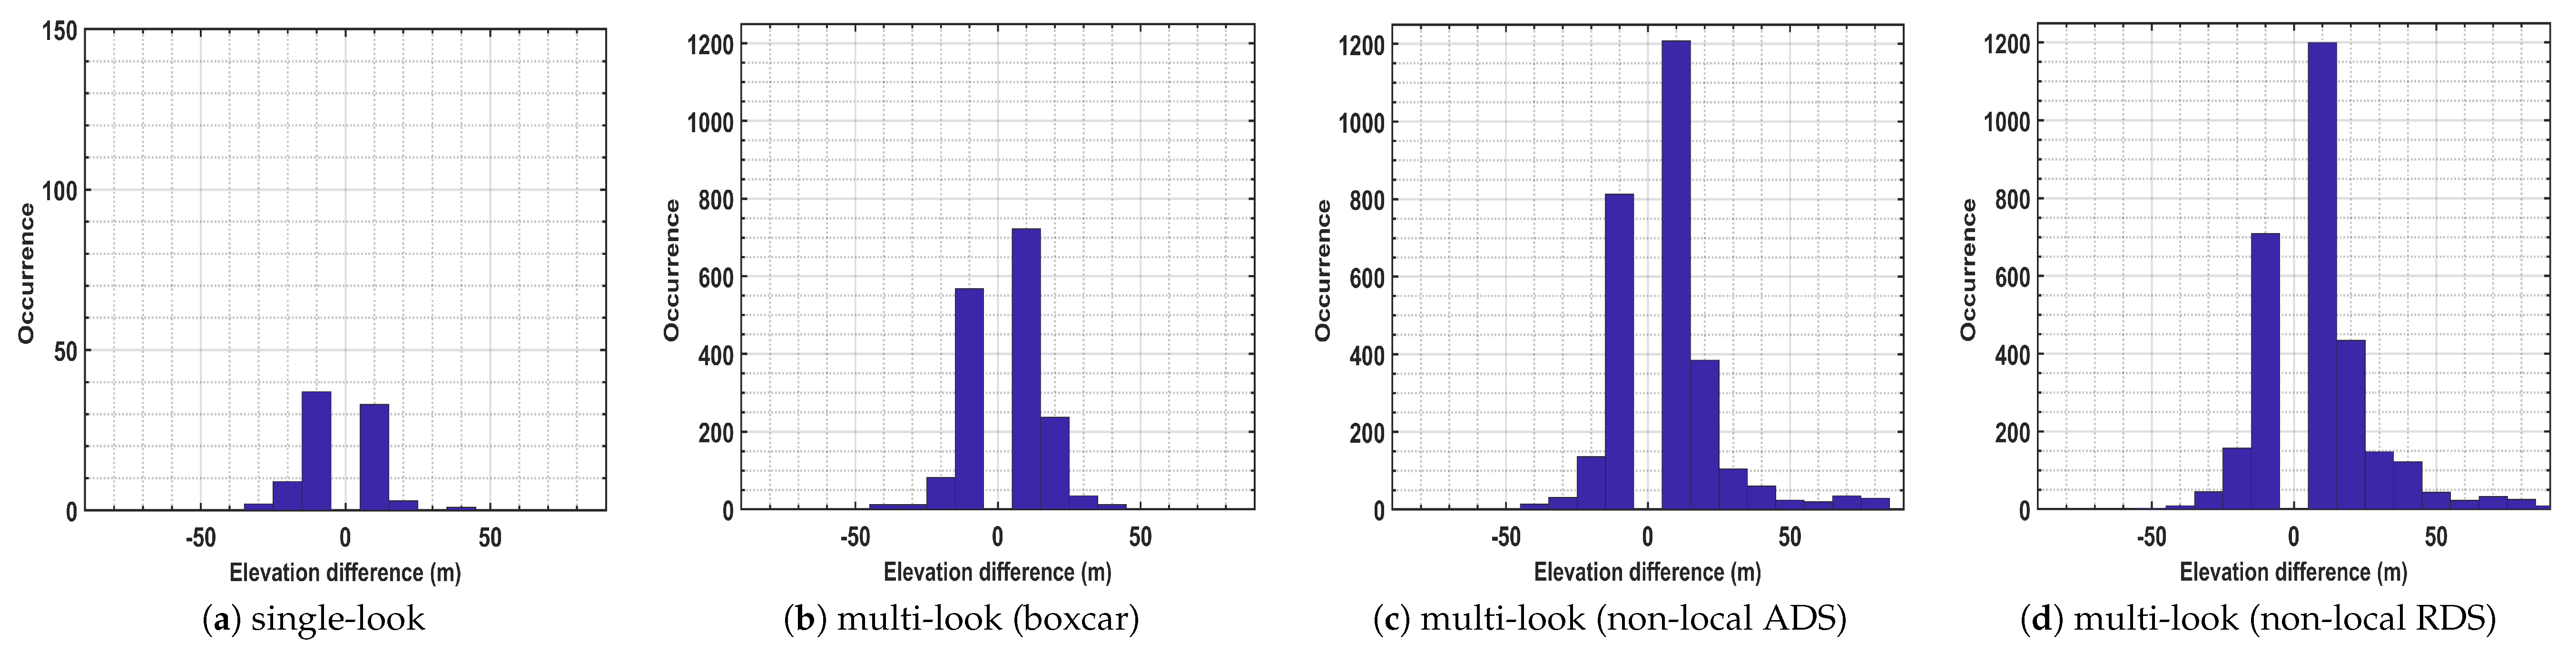
Additionally, the super-resolution capability (ability to detect the superimposed scatterers that are situated below the Rayleigh resolution) of the employed support GLRT detection frameworks with respect to the covariance matrix estimation approach is assessed. To this aim, for all pixels contains more than one PSs, the height differences between single and double scatterers were computed and the results are represented in Figure 11. The reported histograms provide two important indications:
- More double scatterers below the Rayleigh resolution were detected by the non-local approaches (around 2000 PSs by both NL approaches, while about 1200 PSs using the boxcar method, and less than 100 PSs using single-look framework, see the occurrences related to the height difference around ).
- Double scatterers from upper layers of buildings were properly detected by non-local techniques, while those were missed by boxcar approach and specifically by the single-look framework (see the occurrences related to the higher values of height difference). This is consistent with the reported results from the towers.
These improvements achieved by the non-local techniques are typically related to the robust covariance matrix estimation through the proper sample selection framework. Unlike boxcar approach, the non-local techniques avoid overlapping different backscattering contributions and allow better signal improvement; consequently, revealing the presence of additional weaker scatterers. Moreover, it should be noted that the visual comparison of the estimated residual heights (Figure 7) for the single and double scatterers achieved by different detection operations provides evidence of spatial consistency, which can validate the residual height maps.
Additional experiments from the employed approaches over a rural area were reported in Figure 8 and Table 5. The area mainly covers the distributed scatterers and non-layover region (except over the existing buildings and top of the mountain in the upper part of Figure 8a). Hence, the test site is consistent with the model assumptions of the RDS approach in (16), such that speckle follows the known fully developed model [29]. From the reported results in Figure 8, the NL RDS approach slightly outperforms the ADS technique, while generally comparable results were obtained by local and non-local multi-look approaches in the test site. This could be due to the fact that in the considered area the distributed scattering mechanisms are mainly encountered, where the non-local samples in the search window may not fulfill a tangible advantage over the local samples. Instead, a significant increase in the total number of single scatterers was obtained by the employed multi-look GLRT techniques with respect to the single-look framework. The estimation of covariance matrix permits noise reduction and consequently reveals the presence of the partially coherent scatterers in the rural test site, in which the single-look processing could not detect them.
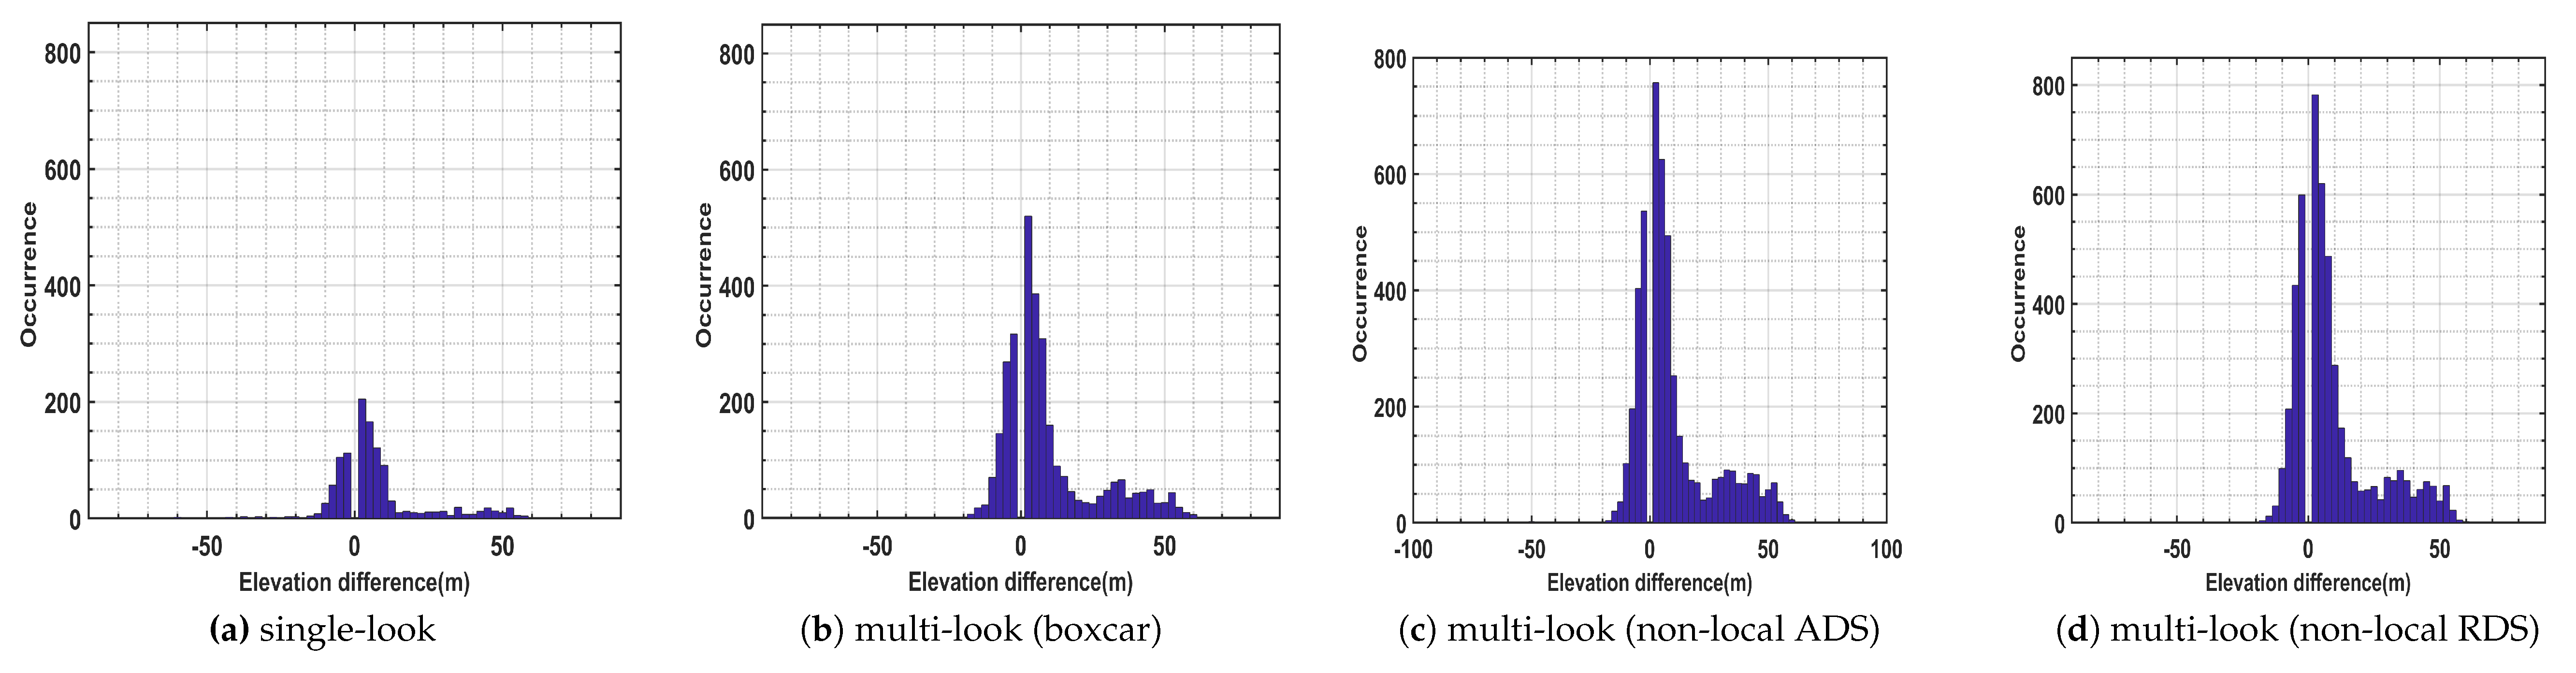
Furthermore, in analogy to the CSK data experiment from the urban area, the analyses of the covariance matrix to detect the single and double scatterers using TerraSAR-X images have been performed. From the provided thermal dilation maps in Figure 10 and Table 6, again the efficiency of the non-local techniques over the conventional boxcar approach as well as single-look support GLRT was proven in urban areas. In general, 1977 and 2180 additional double scatterers were revealed by the non-local ADS and RDS, respectively, where those scatterers were not characterized using the multi-look boxcar-based framework. Further analyses on the elevation separation have been made using the histogram of height difference between detected single and double scatterers (see Figure 12). In consistence with the indications reported using the CSK dataset over the urban area, the detected additional double scatterers (Figure 12) using non-local approaches are mainly related to top parts of buildings and also the situation where the scatterers’ distance in the elevation space is below the Rayleigh resolution.
As a final remark, the performance of the non-local ADS and RDS approaches over the different window and patch sizes were assessed. The results of detection processes using the image of the International building (Figure 4a), including the tower and surrounding areas, are represented in Table 7. Analysis of the detected single and double scatterers using both employed NL techniques showed that by increasing the size of the search window, the performance of detection frameworks was improved. The higher window size adds more similar samples to the search window, leading to a more robust estimation of the data covariance matrix at the cost of a higher computational process. Hence, the intermediate search window size is preferred to guarantee the presence of enough similar samples, while incurring the computational cost. From the results, the higher patch size generally increased the number of detected single scatterers. However, when a patch is employed, the double scatterers are slightly decreased. Typically, by increasing the patch size, the information of different objects are added to the patches which can affect the efficiency of similarity measure and the estimated covariance matrix. Hence, this might be a reason that support GLRT could not increase the detection of weaker (double) scatterers with the largest patch. Moreover, it should be noted that smaller patches are suitable to capture the edges and prevent the blurring effects. Generally, the optimal sizes of the patch and the search window in NL-based tomography are a complex task and it mainly relies on the spatial resolution, the number of images, and the study area.
5. Conclusions
In this paper, the role of the multi-looking operation in the detection of single and double scatterers using TomoSAR PSs detection framework was analyzed and evaluated. It has been shown that under the same TomoSAR configuration parameters and the same system resolutions, the detection of multiple scatterers can be affected by the non-robust estimation of the sample covariance matrix. The tomographic experimental results achieved by the processing of high-resolution COSMO-SkyMED and TerraSAR-x images in different study areas affirmed the role of data covariance matrix in the detection frameworks. It has been shown that the multi-look frameworks with respect to the conventional single-look detection approach allows efficient noise reduction and revealing the presence of the additional scatterers, and consequently increasing the density of the detected PSs. Additionally, evaluation of detection performance over the different multi-looking approaches provided important indications on the efficiency of robust covariance matrix estimations.
In the urban area, the main achievement obtained by the employment of non-local techniques was related to the detection of double scatterers. The efficient estimation of covariance matrix using non-local techniques allows further noise reduction and reveals the presence of weaker (double) scatterers, which may not be detectable when the covariance matrix is estimated using the conventional boxcar approach. In particular, detection of double scatterers below the Rayleigh resolution and the scatterers from upper layers of buildings were the main improvements reported by the employment of non-local techniques over the local-based framework. Note that sample selection in the neighborhood of the target pixel by the boxcar approach may mix the different signals, while the non-local approaches avoid overlapping the different backscattering by taking into account only NL pixels belonging to a same distribution model. Hence, the proper sample selection by non-local techniques allowed detection of further weaker scatterers due to the better SNR improvement.
In rural areas, where the data are recorded from homogeneous regions without encompassing the edge structures and layover phenomenon, the non-local techniques may not fulfill a tangible advantage over the local techniques. In such a case, the classical boxcar technique can be applicable for a multi-look detection process. The patch-based adaptive sample selection methods generally suit the urban PS applications, where the detailed scatterers of the building can be optimally detected.
It should be noted that the amplitude statistical sample selection approaches might be seen as the typical methods for the identification of similar pixels using the big TomoSAR dataset. However, extending the statistical distribution tests to the complex data without relying on the pre-estimation of the sample covariance matrix and incorporating the tests with information related to the parameters of the scatterers might be a more effective similarity criterion. Hence, the benefit of such a criterion should be assessed.
Funding
This research received no external funding.
Acknowledgments
I wish to acknowledge the valuable and insight discussions with Dr. Giampaolo Ferraioli (of the Università di Napoli Parthenope, Italy). I also wish to thank the anonymous reviewers and the academic editor for their valuable comments, which have improved the quality of this paper and the Italian Space Agency and the DLR for providing the COSMO-SkyMED and TerraSAR-X datasets within the ASI AO Project ID 725 and MTH3182 proposals, respectively.
Conflicts of Interest
The author declares no conflict of interest.
References
- Ferretti, A.; Prati, C.; Rocca, F. Permanent scatterers in SAR interferometry. IEEE Trans. Geosci. Remote Sens. 2001, 39, 8–20. [Google Scholar] [CrossRef]
- Berardino, P.; Fornaro, G.; Lanari, R.; Sansosti, E. A new algorithm for surface deformation monitoring based on small baseline differential SAR interferograms. IEEE Trans. Geosci. Remote Sens. 2002, 40, 2375–2383. [Google Scholar] [CrossRef] [Green Version]
- Mora, O.; Mallorqui, J.J.; Broquetas, A. Linear and nonlinear terrain deformation maps from a reduced set of interferometric SAR images. IEEE Trans. Geosci. Remote Sens. 2003, 41, 2243–2253. [Google Scholar] [CrossRef]
- Hooper, A.; Segall, P.; Zebker, H. Persistent scatterer interferometric synthetic aperture radar for crustal deformation analysis, with application to Volcán Alcedo, Galápagos. J. Geophys. Res. Solid Earth 2007, 112. [Google Scholar] [CrossRef] [Green Version]
- Yang, B.; Xu, H.; Liu, W.; Ge, J.; Li, C.; Li, J. An Improved Stanford Method for Persistent Scatterers Applied to 3D Building Reconstruction and Monitoring. Remote Sens. 2019, 11, 1807. [Google Scholar] [CrossRef] [Green Version]
- Gini, F.; Lombardini, F.; Montanari, M. Layover solution in multibaseline SAR interferometry. IEEE Trans. Aerosp. Electron. Syst. 2002, 38, 1344–1356. [Google Scholar] [CrossRef]
- Rambour, C.; Budillon, A.; Johnsy, A.C.; Denis, L.; Tupin, F.; Schirinzi, G. From Interferometric to Tomographic SAR: A review of synthetic aperture radar tomography-processing techniques for scatterer unmixing in urban areas. IEEE Geosci. Remote Sens. Mag. 2020, 8, 6–29. [Google Scholar] [CrossRef]
- Reale, D.; Fornaro, G.; Pauciullo, A. Extension of 4-D SAR Imaging to the Monitoring of Thermally Dilating Scatterers. IEEE Trans. Geosci. Remote Sens. 2013, 51, 5296–5306. [Google Scholar] [CrossRef]
- Lombardini, F. Differential tomography: A new framework for SAR interferometry. IEEE Trans. Geosci. Remote Sens. 2005, 43, 37–44. [Google Scholar] [CrossRef]
- Fornaro, G.; Reale, D.; Serafino, F. Four-Dimensional SAR Imaging for Height Estimation and Monitoring of Single and Double Scatterers. IEEE Trans. Geosci. Remote Sens. 2009, 47, 224–237. [Google Scholar] [CrossRef]
- Aghababaei, H.; Ferraioli, G.; Schirinzi, G. Differential SAR Tomography Reconstruction Robust to Temporal Decorrelation Effects. IEEE Trans. Geosci. Remote Sens. 2019, 57, 9071–9080. [Google Scholar] [CrossRef]
- De Maio, A.; Fornaro, G.; Pauciullo, A. Detection of Single Scatterers in Multidimensional SAR Imaging. IEEE Trans. Geosci. Remote Sens. 2009, 47, 2284–2297. [Google Scholar] [CrossRef]
- Budillon, A.; Johnsy, A.C.; Schirinzi, G. A Fast Support Detector for Superresolution Localization of Multiple Scatterers in SAR Tomography. IEEE J. Sel. Top. Appl. Earth Obs. Remote Sens. 2017, 10, 2768–2779. [Google Scholar] [CrossRef]
- Dănișor, C.; Fornaro, G.; Pauciullo, A.; Reale, D.; Datcu, M. Super-Resolution Multi-Look Detection in SAR Tomography. Remote Sens. 2018, 10, 1894. [Google Scholar] [CrossRef] [Green Version]
- Wang, Y.; Zhu, X.X. Robust Estimators for Multipass SAR Interferometry. IEEE Trans. Geosci. Remote Sens. 2016, 54, 968–980. [Google Scholar] [CrossRef]
- Deledalle, C.; Denis, L.; Poggi, G.; Tupin, F.; Verdoliva, L. Exploiting Patch Similarity for SAR Image Processing: The nonlocal paradigm. IEEE Signal Process. Mag. 2014, 31, 69–78. [Google Scholar] [CrossRef]
- Deledalle, C.; Denis, L.; Tupin, F.; Reigber, A.; Jäger, M. NL-SAR: A Unified Nonlocal Framework for Resolution-Preserving (Pol)(In)SAR Denoising. IEEE Trans. Geosci. Remote Sens. 2015, 53, 2021–2038. [Google Scholar] [CrossRef] [Green Version]
- Deledalle, C.; Denis, L.; Tupin, F. How to compare noisy patches? Patch similarity beyond Gaussian noise. Int. J. Comput. Vis. 2012, 99, 86–102. [Google Scholar] [CrossRef] [Green Version]
- Ferretti, A.; Fumagalli, A.; Novali, F.; Prati, C.; Rocca, F.; Rucci, A. A New Algorithm for Processing Interferometric Data-Stacks: SqueeSAR. IEEE Trans. Geosci. Remote Sens. 2011, 49, 3460–3470. [Google Scholar] [CrossRef]
- Ferraioli, G.; Pascazio, V.; Schirinzi, G. Ratio-Based Nonlocal Anisotropic Despeckling Approach for SAR Images. IEEE Trans. Geosci. Remote Sens. 2019, 57, 7785–7798. [Google Scholar] [CrossRef]
- Capon, J. High-resolution frequency-wavenumber spectrum analysis. Proc. IEEE 1969, 57, 1408–1418. [Google Scholar] [CrossRef] [Green Version]
- Budillon, A.; Evangelista, A.; Schirinzi, G. Three-Dimensional SAR Focusing From Multipass Signals Using Compressive Sampling. IEEE Trans. Geosci. Remote Sens. 2012, 49, 488–499. [Google Scholar] [CrossRef]
- Zhu, X.X.; Bamler, R. Super-Resolution Power and Robustness of Compressive Sensing for Spectral Estimation with Application to Spaceborne Tomographic SAR. IEEE Trans. Geosci. Remote Sens. 2011, 50, 247–258. [Google Scholar] [CrossRef]
- Aghababaee, H.; Ferraioli, G.; Ferro-Famil, L.; Schirinzi, G.; Huang, Y. Sparsity based full rank polarimetric reconstruction of coherence matrix T. Remote Sens. 2019, 11, 1288. [Google Scholar] [CrossRef] [Green Version]
- Schmitt, M.; Schönberger, J.L.; Stilla, U. Adaptive Covariance Matrix Estimation for Multi-Baseline InSAR Data Stacks. IEEE Trans. Geosci. Remote Sens. 2014, 52, 6807–6817. [Google Scholar] [CrossRef]
- Wang, Y.; Xiang, Z.X.; Bamler, R. Retrieval of phase history parameters from distributed scatterers in urban areas using very high resolution SAR data. ISPRS J. Photogramm. Remote Sens. 2012, 73, 89–99. [Google Scholar] [CrossRef] [Green Version]
- Frery, A.C.; Dacostafreitasyanasse, C.; Santaanna, S.J. Statistical characterization of SAR data: The multiplicative model and extensions. STIN 1995, 96, 16633. [Google Scholar]
- Touzi, R.; Lopes, A.; Bousquet, P. A statistical and geometrical edge detector for SAR images. IEEE Trans. Geosci. Remote. Sens. 1988, 26, 764–773. [Google Scholar] [CrossRef]
- Goodman, N.R. Statistical analysis based on a certain multivariate complex Gaussian distribution (an introduction). Ann. Math. Stat. 1963, 34, 152–177. [Google Scholar] [CrossRef]
- Aghababaei, H.; Fornaro, G.; Schirinzi, G. Phase Calibration Based on Phase Derivative Constrained Optimization in Multibaseline SAR Tomography. IEEE Trans. Geosci. Remote Sens. 2018, 56, 6779–6791. [Google Scholar] [CrossRef]
Figure 1.
Representation of the non-local frameworks. The red box indicates the search window, and the green and light blue boxes are the patches of pixels s and t, respectively.
Figure 1.
Representation of the non-local frameworks. The red box indicates the search window, and the green and light blue boxes are the patches of pixels s and t, respectively.

Figure 2.
Weight functions for similarity measure (blue profile ) and similarity measure (red profile ).
Figure 2.
Weight functions for similarity measure (blue profile ) and similarity measure (red profile ).

Figure 3.
The distributions of the COSMO-SkyMED (CSK) data acquisition (a,b) and the TerraSAR-X (TSX) data acquisition (c,d).
Figure 3.
The distributions of the COSMO-SkyMED (CSK) data acquisition (a,b) and the TerraSAR-X (TSX) data acquisition (c,d).

Figure 4.
The color-coded interferometric fringes between the master (31 March 2013) and slave (2 May 2013) images. (a) International tower. (b) Millennium tower. The horizontal and vertical axes are related to azimuth and range directions.
Figure 4.
The color-coded interferometric fringes between the master (31 March 2013) and slave (2 May 2013) images. (a) International tower. (b) Millennium tower. The horizontal and vertical axes are related to azimuth and range directions.

Figure 5.
The elevation (m) of detected scatterers reported on the optical google-earth image. The first row: International tower and the second row: the Millennium building.
Figure 5.
The elevation (m) of detected scatterers reported on the optical google-earth image. The first row: International tower and the second row: the Millennium building.

Figure 6.
Temporal average amplitude image (super image) of the test area from the CSK dataset. (Abas-abad region, Tehran, Iran).
Figure 6.
Temporal average amplitude image (super image) of the test area from the CSK dataset. (Abas-abad region, Tehran, Iran).

Figure 7.
The residual height (m) of detected scatterers using different multi-looking operations (CSK dataset: urban area). Figures in the first and second rows are related to the single and double scatterers, respectively.
Figure 7.
The residual height (m) of detected scatterers using different multi-looking operations (CSK dataset: urban area). Figures in the first and second rows are related to the single and double scatterers, respectively.

Figure 8.
The CSK experiments over non-urban area. (a) Temporal average amplitude image. The detected single scatterers using (b) single-look support Generalized Likelihood Ratio Test (GLRT), (c) boxcar, (d) non-local Amplitude-based Distribution Similarity (ADS), and (e) non-local RDS multi-look support GLRT.

Figure 9.
Temporal average amplitude image (super image) of the test area from the TSX dataset (Toulouse, France).
Figure 9.
Temporal average amplitude image (super image) of the test area from the TSX dataset (Toulouse, France).

Figure 10.
Distribution of the detected single (a–d) and double (e–h) scatterers using the different processing operations (TSX dataset). The color-map is set according to the estimated thermal dilation in mm/°C.
Figure 10.
Distribution of the detected single (a–d) and double (e–h) scatterers using the different processing operations (TSX dataset). The color-map is set according to the estimated thermal dilation in mm/°C.

Figure 11.
The histogram of height difference between single and double scatterers in the CSK dataset in Figure 7.
Figure 11.
The histogram of height difference between single and double scatterers in the CSK dataset in Figure 7.

Figure 12.
The histogram of height difference between single and double scatterers in the TSX dataset in Figure 10.
Figure 12.
The histogram of height difference between single and double scatterers in the TSX dataset in Figure 10.


Table 1.
Implementation algorithm of the non-local covariance matrix estimation approaches.
| The Algorithm of ADS Approach | The Algorithm of RDS Approach |
|---|---|
| For each pixel s in the image, For each pixel t in the search window Generate the informative vectors and in (11) Compute the similarity in (13) End Transfer to the weight using the blue PDF in Figure 2 Compute the SCM in (5) End | Generate super image from temporal average of stack data For each pixel s in the image, For each pixel t in the search window Generate and using the patches s and t over the super image Compute the similarity in (18) End Transfer to the weight using the red PDF in Figure 2 Compute the SCM in (5) End |
Table 2.
Sensors and datasets characteristics.
| Number of Acquisitions | Temporal Span | Resolution | Wavelength | Sensor Altitude | Polarization | ||
|---|---|---|---|---|---|---|---|
| Range | Azimuth | ||||||
| CSK | 75 | 3.5 years | 1.47 m | 3 m | 3.1 cm | 628.15 km | HH |
| TSX | 39 | 2.3 years | 1.17 m | 3.3 m | 3.1 cm | 500.54 km | VV |
Table 3.
The number of detected scatterers from International and Millennium towers.
| International Tower | Millennium Building | |||
|---|---|---|---|---|
| single scatterer | double scatterer | single scatterer | double scatterer | |
| single-look | 572 | 143 | 673 | 21 |
| multi-look (boxcar) | 1812 | 373 | 1329 | 77 |
| multi-look (non-local ADS) | 1940 | 599 | 1406 | 107 |
| multi-look (non-local RDS) | 1882 | 612 | 1392 | 94 |
Table 4.
The number of detected single and double scatterers in Figure 7.
Table 4.
The number of detected single and double scatterers in Figure 7.
| Single-Look | Multi-Look | Multi-Look | Multi-Look | |
|---|---|---|---|---|
| (Boxcar) | (Non-Local ADS) | (Non-Local RDS) | ||
| single scatterer | 21,445 | 63,130 | 65,204 | 64,539 |
| double scatterer | 1293 | 3112 | 4266 | 4291 |
Table 5.
The number of detected single and double scatterers in Figure 8.
Table 5.
The number of detected single and double scatterers in Figure 8.
| Single-Look | Multi-Look | Multi-Look | Multi-Look | |
|---|---|---|---|---|
| (Boxcar) | (Non-Local ADS) | (Non-Local RDS) | ||
| single scatterer | 1513 | 3672 | 3887 | 3914 |
| double scatterer | 13 | 86 | 98 | 94 |
Table 6.
The number of detected single and double scatterers in Figure 10.
Table 6.
The number of detected single and double scatterers in Figure 10.
| Single-Look | Multi-Look | Multi-Look | Multi-Look | |
|---|---|---|---|---|
| (Boxcar) | (Non-Local ADS) | (Non-Local RDS) | ||
| single scatterer | 18,491 | 56,522 | 58,650 | 59,452 |
| double scatterer | 1310 | 3526 | 5503 | 5706 |
Table 7.
The detection performance of non-local techniques with respect to window size (W) and patch size (P).
Table 7.
The detection performance of non-local techniques with respect to window size (W) and patch size (P).
| (W = 7, P = 5) | (W = 9, P = 5) | (W = 9, P = 7) | (W = 11, P = 5) | (W = 11, P = 7) | (W = 11, P = 9) | ||
|---|---|---|---|---|---|---|---|
| Single scatterers | ADS | 7015 | 7227 | 7331 | 7404 | 7538 | 7718 |
| RDS | 7094 | 7200 | 7250 | 7395 | 7455 | 7619 | |
| Double scatterers | ADS | 1357 | 1447 | 1488 | 1517 | 1517 | 1489 |
| RDS | 1344 | 1452 | 1440 | 1531 | 1589 | 1538 |
© 2020 by the author. Licensee MDPI, Basel, Switzerland. This article is an open access article distributed under the terms and conditions of the Creative Commons Attribution (CC BY) license (http://creativecommons.org/licenses/by/4.0/).
Share and Cite
MDPI and ACS Style
Aghababaei, H. On the Assessment of Non-Local Multi-Looking in Detection of Persistent Scatterers Using SAR Tomography. Remote Sens. 2020, 12, 3195. https://0-doi-org.brum.beds.ac.uk/10.3390/rs12193195
AMA Style
Aghababaei H. On the Assessment of Non-Local Multi-Looking in Detection of Persistent Scatterers Using SAR Tomography. Remote Sensing. 2020; 12(19):3195. https://0-doi-org.brum.beds.ac.uk/10.3390/rs12193195
Chicago/Turabian StyleAghababaei, Hossein. 2020. "On the Assessment of Non-Local Multi-Looking in Detection of Persistent Scatterers Using SAR Tomography" Remote Sensing 12, no. 19: 3195. https://0-doi-org.brum.beds.ac.uk/10.3390/rs12193195
Note that from the first issue of 2016, this journal uses article numbers instead of page numbers. See further details here.