Article

Burned Area Detection and Mapping: Intercomparison of Sentinel-1 and Sentinel-2 Based Algorithms over Tropical Africa

1
Environmental Remote Sensing Research Group, Department of Geology, Geography and Environment, University of Alcala, 28801 Alcala de Henares, Spain
2
Department of Mining and Metallurgical Engineering and Materials Science, School of Engineering of Vitoria-Gasteiz, University of the Basque Country UPV/EHU, 01006 Vitoria-Gasteiz, Spain
3
Centre for Landscape and Climate Research, School of Geography, Geology and Environment, University of Leicester, Leicester LE1 7RH, UK
4
Remote Sensing Solutions GmbH, 81673 Munich, Germany
5
GAF AG, 80634 Munich, Germany
*
Author to whom correspondence should be addressed.
Submission received: 14 November 2019 / Revised: 10 January 2020 / Accepted: 14 January 2020 / Published: 20 January 2020

Abstract

:
This study provides a comparative analysis of two Sentinel-1 and one Sentinel-2 burned area (BA) detection and mapping algorithms over 10 test sites (100 × 100 km) in tropical and sub-tropical Africa. Depending on the site, the burned area was mapped at different time points during the 2015–2016 fire seasons. The algorithms relied on diverse burned area (BA) mapping strategies regarding the data used (i.e., surface reflectance, backscatter coefficient, interferometric coherence) and the detection method. Algorithm performance was compared by evaluating the detected BA agreement with reference fire perimeters independently derived from medium resolution optical imagery (i.e., Landsat 8, Sentinel-2). The commission (CE) and omission errors (OE), as well as the Dice coefficient (DC) for burned pixels, were compared. The mean OE and CE were 33% and 31% for the optical-based Sentinel-2 time-series algorithm and increased to 66% and 36%, respectively, for the radar backscatter coefficient-based algorithm. For the coherence based radar algorithm, OE and CE reached 72% and 57%, respectively. When considering all tiles, the optical-based algorithm provided a significant increase in agreement over the Synthetic Aperture Radar (SAR) based algorithms that might have been boosted by the use of optical datasets when generating the reference fire perimeters. The analysis suggested that optical-based algorithms provide for a significant increase in accuracy over the radar-based algorithms. However, in regions with persistent cloud cover, the radar sensors may provide a complementary data source for wall to wall BA detection.

Graphical Abstract

1. Introduction

Fire has a key ecological role in a large part of the Earth’s surface since it affects global bio-chemical cycles, carbon sequestration, soil properties, water supply, and biodiversity. Due to its contribution to the global climate system, fire disturbance is considered an Essential Climatic Variable (ECV) [1] with global burned area (BA) products being routinely derived from coarse resolution sensors (>250 m) such as the Medium Resolution Imaging Spectrometer (MERIS), the Moderate Resolution Imaging Spectroradiometer (MODIS), or SPOT Vegetation [2,3,4,5,6,7,8,9,10]. A comparison analysis done with reference data from 2008 found that NASA’s MCD64A1 was the most accurate global BA product of the existing global BA products [11] with commission (CE) and omission errors (OE) reaching 42% and 68%, respectively. More recent analyses, carried out with reference data from 2003 to 2014 [9] and 2014 to 2015 [12], found average commission errors of 35% and 40.2%, respectively, while omission errors reached 62% and 72.6%, respectively. With these values, global BA products are far from achieving the accuracy requirements needed for climate modelling, i.e., omission and commission errors below 20%, [13], in part due to the low spatial resolution, which results in small fires being overlooked [14]. In fact, the likelihood of detecting small burns (i.e., <100 ha) in coarse resolution products is low due to the frequent omission errors [6,11,14]. A recent study suggested that contribution of small fires may be significant as BA products based on MODIS imagery (500 m) estimated 80% less burned area than those based on Sentinel-2 (20 m) in sub-Saharan Africa when compared to products based on medium resolution imagery [15]. Small fires have a large impact on emissions in most ecosystems [16]. Apart from small fire size, BA uncertainties were also related to satellite instrument calibration and viewing geometry, the temporal sampling related to the persistence of the burn signal, and the detection algorithm design [17]. In addition, for atmospheric modelling, ancillary information becomes important, including the detection date, type of burned land (generally relying on external land cover products with their own uncertainties), and combustion completeness and fraction burned area, i.e., critical parameters for atmospheric emission estimations [18]. To overcome some of these limitations (e.g., small fire size, burned fraction), medium resolution optical sensors have been used for BA detection and mapping with early algorithms being mostly based on Landsat imagery [19,20,21,22,23]. However, detection from Landsat imagery is challenging because of the low temporal resolution of this data (16 days), particularly over areas with persistent cloud cover and short post-fire signal persistence (e.g., savannah fires). The launches of Sentinel-1 (-with microwave) and Sentinel-2 (optical) sensors have incentivised the development of novel BA detection and mapping algorithms as the availability of relatively dense time-series (3–5 days when different sensors or Synthetic Aperture Radar (SAR) viewing geometries are combined) may significantly reduce omission errors for regions where small fires account for a large proportion of total BA or where the earth surface is obscured by persistent cloud cover. However, most such algorithms have been developed and tested for rather small areas [24,25] or few fire events [26,27,28,29,30] except for the global BA prototype product with Landsat data for a single year [23], and the wall-to-wall mapping of Sub-Saharan Africa performed with Sentinel-2 images for 2016 [15].
Locally developed algorithms are difficult to transfer to other regions as changes in surface reflectance or backscatter coefficient are dependent on a range of factors, including vegetation type and structure, fire regimes, and climatic variables. To improve the characterisation of small fires over large areas, the European Space Agency (ESA) Climate Change Initiative (CCI) programme developed BA algorithms and products from medium resolution sensors for the generation of a small fire database (SFD) at regional to continental scales. The CCI programme aims to obtain information on different ECVs using remote sensing data to help improving climate modelling [31,32]. The SFD was initially focused on sub-Saharan Africa, the most burned continent worldwide [9,33], and was largely based on optical sensors (O) and time series (ts) analysis (Ots) [15]. Over areas with persistent cloud cover (daily mean cloud cover above 50%), the SFD was complemented by burned perimeters detected from time series of Sentinel-1 C-band radar (R) interferometric coherence (RtsC).
The SFD was complemented by regional BA products in tropical South-East Asia (1.5 million km2) and South America (7 million km2). To cope with the persistent cloud cover in these regions, the BA detection and mapping algorithms were based on synthetic aperture radar (SAR) backscatter coefficient acquired by the Sentinel-1 C-band sensor [34,35]. The BA product for tropical South America was based on radar temporal series of the backscatter (B) coefficient (RtsB) while the product for South-East Asia used a multi-temporal approach based on radar backscatter analysis at the beginning and the end of the fire season. The different components of the SFD are available for download from the Fire CCI website (https://www.esa-fire-cci.org/).
While the algorithms were individually validated [15,35,36], such validation was carried out for different areas and time periods. Since the algorithms used to generate the SFD components were based on different input datasets (e.g., optical, SAR) and detection strategies, the objective of this study was to intercompare the algorithms, assessing them over the same areas and with the same reference datasets. However, as the algorithm developed for South-East Asia [34] was designed specifically for fires in low laying (<15° slope) peat swamp forests, its evaluation outside such conditions was not feasible. Therefore, this study only compared the three time-series algorithms (Ots, RtsB, and RtsC) designed to work over a variety of fire regimes and vegetation types.

2. Materials and Methods

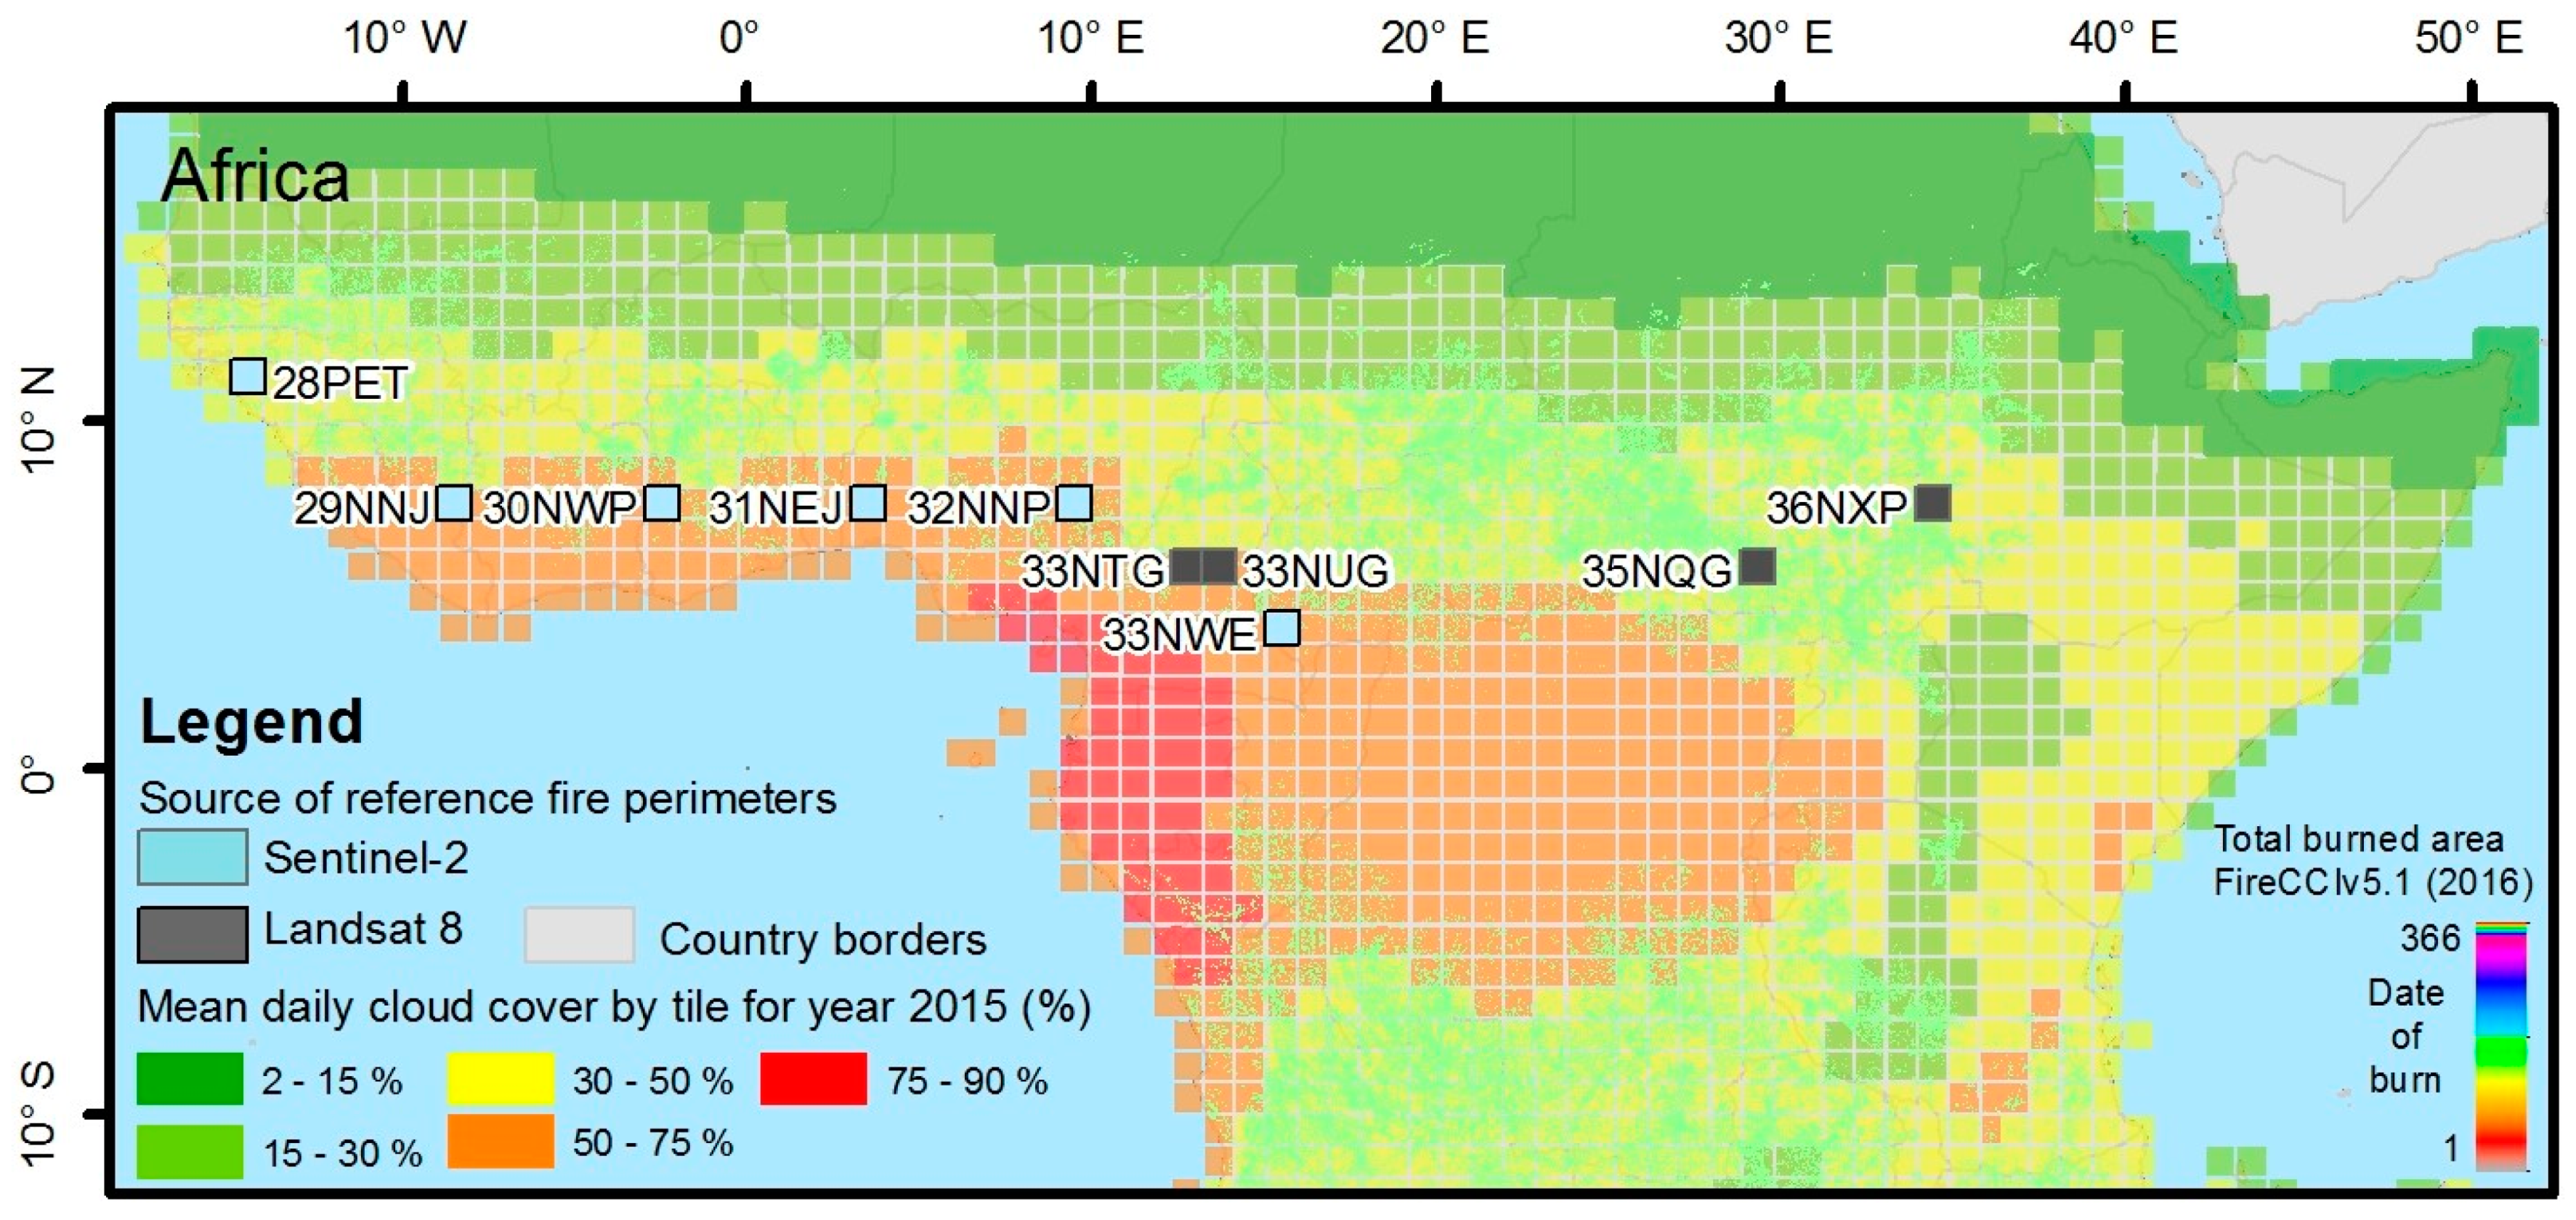
2.1. Reference Datasets

Ten Military Reference Grid System (MGRS) tiles (100 × 100 km) were used to analyse burned area agreement with reference fire perimeters derived from optical images within the 2015 and 2016 fire seasons (Figure 1 and Table 1). The tiles were selected along an east–west transect in areas with high fire activity and daily mean cloud cover below 75% to allow for the deployment of the optical-based algorithm (Figure 1). Four tiles were dominated (>75% cover) by forests. In the remaining tiles, the land cover was a mix of cropping areas, savannas, grasslands, shrublands, and forests (Table 1). The reference datasets were formed by (1) fire perimeters derived from Landsat 8 imagery (four tiles) and (2) fire perimeters derived from Sentinel-2 imagery (six tiles). Tiles with reference fire perimeters derived from Landsat imagery were selected to assess the effect of temporal discrepancy between BA detection and validation dates.
The Landsat based reference fire perimeters were generated from consecutive image pairs. The time length between consecutive observations was limited (e.g., ideally one satellite cycle) to avoid confusion due to fire-unrelated land cover changes or misinterpretation of the fire signal over areas with rapid vegetation growth. However, in areas with frequent cloud cover, the interval was increased (e.g., up to 32 days) to allow formation of additional sampling pairs. The use of a larger interval was reasonable as vegetation usually needs longer time to recuperate after fire. Indeed, the global median persistence time of fire scars visible on an optical dataset was estimated as 29 days [37]. For efficiency, the surface reflectance of each individual image pair was reformatted into a raster file containing six bands, the shortwave infra-red (SWIR), near infra-red (NIR), and RED bands of each image forming the pair. An independent interpreter digitised training polygons for burned and unburned areas and clouds. The polygons were subsequently used to train a Random Forest classifier [38,39], taking as input variables the pre- and post-reflectance and the multitemporal differenced Normalized Burn Ratio (dNBR) index [40]. The burned area classification was based on an iterative process of visual inspection, delineation of additional training polygons, and classification. When classification errors were spotted, the classification was improved by digitizing missed areas or removing incorrectly labelled areas. Within post-processing, fire perimeters below 0.1 ha were removed.
The Sentinel-2 based reference fire perimeters were selected from an available pool of validation tiles and provided for more diverse land cover types. In each validation tile, two Sentinel-2 cloud-free images with a temporal difference as short as possible were selected in a period where fires were visually observed. The minimum temporal difference was the revisit period of 10 days, which was extended in some cases up to 1 or 2 months (30 or 60 days) due to high cloud coverage or low image availability, particularly in February 2016. The Sentinel-2 L1C products were processed to surface reflectance [41]. Reference burned perimeters were generated from the pre- and post-fire reflectance images using the Burned Area Mapping Software (BAMS) [42]. BAMS also uses training polygons to classify burned areas. The classification results were subsequently analysed by a trained operator. The training polygons were modified until acceptable classification results were obtained. Polygons not corresponding to burned areas were removed manually, with most being caused by cloud shadows and crop harvest.

2.2. SFD Algorithms Description in Brief

2.2.1. Optical Time Series

The optical-based detection algorithm (Ots) uses time-series of atmospherically corrected Sentinel-2 Multi Spectral Instrument (MSI) reflectance measurements from the L2A product [15]. The algorithm detects the burned areas using spectral changes in three bands, near-infrared (NIR) and short and long short shortwave infrared bands (SWIRS, SWIRL) at the original spatial resolution of 20 m. These bands are used to calculate two spectral indices the Mid-Infrared Burned Index (MIRBI) and the Normalized Burned Ratio 2 (NBR2) as in Equations (1) and (2). The algorithm compares two consecutive Sentinel-2 images using the multitemporal difference and the post-fire values of the MIRBI, NBR2 spectral indices, and the NIR reflectance. The algorithm applies fixed thresholds to obtain an Initial Burned/Not Burned area which is cross-checked against the existence of MODIS active fire hotspots. When hotspots exist, the Initial Burned/Not Burned is confirmed (IBC). IBC areas are used to select burned seeds, which are subsequently used to derive a burned membership function, where the minimum and maximum values are extracted from unburned background and burned areas. The algorithm is locally adapted as IBC existence is tested, and subsequent membership functions are derived for each MGRS tile and Sentinel-2 image pair analysed. As the membership functions are derived at tile level, the algorithm assumes a certain spectral homogeneity for different burned land cover classes. The algorithm uses consecutive Sentinel-2 acquisitions to derive BA maps at 20 m spacing. Unobserved areas (affected by clouds and cloud shadows) are gap-filled by using up to four pre-fire images to reduce omission errors. In areas where Sentinel-2A data were recorded at the nominal frequency and in the absence of heavy cloud cover (>95% cloud free), the BA maps temporal frequency is ten days. A detailed description of the algorithm is found in Roteta et al. (2019).
M I R B I = 10 ρ S W I R L 9.8 ρ S W I R S + 2
N B R 2 = ρ S W I R S ρ S W I R L ρ S W I R s + ρ S W I R L
where ρ S W I R L and ρ S W I R S are, respectively, short wave infrared long reflectance (SWIRL) and short wave infrared short reflectance (SWIRS).

2.2.2. SAR Coherence Time Series

To complement the optical-based burned area in regions affected by persistent cloud cover, a BA detection and mapping algorithm was developed based on time-series of Sentinel-1 interferometric coherence (RtsC). The algorithm needs four consecutive Sentinel-1 acquisitions (12 days apart) to identify the burned areas over the period of interest. For each period of interest, the algorithm generates three interferometric products corresponding to pre-, fire, and post-fire epochs. The post-fire epoch is used to cross-check that burns have indeed taken place. The burned area detection and mapping algorithm uses pre-trained machine learning algorithms such as Random Forests (RF). The training is based on manually selected polygons over four land cover classes (no data, burned, unburned, and water). The training polygons were selected and digitised for each biome in independent tiles distributed over Sub-Saharan Africa using pre- and post-fire Sentinel-2 observations of burn events. Biome specific pre-trained models are used to map burned area at 30 m spacing every 12 days.

2.2.3. SAR Backscatter Coefficient Time Series

An algorithm based on temporal time-series of Sentinel-1 backscatter coefficient (RtsB) was also developed to identify anomalous changes in the radar signal and associate them with biomass burning [35]. The algorithm considers multi-temporal changes of incoherent SAR-based metrics (e.g., backscatter intensities) together with ancillary information on land cover and active fires (hotspots). The Reed-Xiaoli detector [43] is used to distinguish areas affected by anomalous changes (AC) with respect to a reference state provided by Sentinel-1 dataset acquired before the period of interest. When hotspots coincide in space and time with ACs, these areas are labelled as burned. The remaining ACs are labelled as burned/unburned using machine learning (i.e., RF). The RFs are trained locally (within 100 × 100 tiles) by main land cover types (e.g., crops, forests). RF training samples are obtained from ACs overlapping hotspots after applying a series of filtering mechanisms to ensure high burned/unburned probabilities of the selected samples. As for the Ots algorithm, the RtsB algorithm is self-calibrating over each MGRS tile and detection period. The algorithm uses consecutive Sentinel-1 acquisitions to derive BA maps at 40 m spacing. The temporal resolution may vary between six days to one month depending on Sentinel-1 actual acquisition frequency. A detailed description of the algorithm is found in Belenguer-Plomer et al. [35] while its further validation was detailed in [36].

2.3. Burned Area Detection Accuracy Assessment

The three algorithms were deployed to detect, and map burned area over the time periods with available reference fire perimeters. As inference processes (models) are affected by errors, there is an element of uncertainty regarding the results produced using remote sensing data. Therefore, the quality of remote sensing data and the derived products need to be characterised quantitatively to facilitate critical information on product reliability to end users. The accuracy of the results is usually characterised through cross-tabulation against reference datasets by accounting for the spatio-temporal coincidences and disagreements. The approach is widely used in BA mapping projects [6,11,44,45,46,47,48,49,50]. However, one should also bear in mind that cross-tabulation based on ancillary reference datasets derived from remote sensing data acquired by other sensors, largely indicates the agreement between different BA products as the accuracy of the reference dataset is often not known.
For each tile, the agreement between the reference and the detected burned areas was computed through cross-tabulation [51,52]. The result of the cross tabulation can be represented by the error matrix (Table 2), which express the amount of agreement between a product and a reference classification. From the confusion matrix, commission (CE, Equation (1)), omission errors (OE, Equation (2)), and the Dice coefficient (DC, Equation (3)) were computed. DC summarises both commission and omission errors showing the global accuracy for the target category (Padilla et al., 2014).
The detected BA products were matched to the reference BA perimeters dates as closely as possible. However, due to the different satellite orbital cycles, the detection and validation periods often differed except for the Ots algorithm when deployed over tiles where reference burn perimeters were derived from Sentinel-2 images (i.e., the same sensor was used when generating both reference fire perimeter and the BA product). The validation metrics were computed over each tile, over all tiles, and by main land cover classes (e.g., crops, grasslands, shrubs, and tropical forests). The CCI Land Cover product v2.0.7 for the year 2015 [53] was used to segment the area by main land cover types. Cloud affected areas, no data areas, and Sentinel 1/2 pre-processing errors were masked out and were not used when computing the accuracy metrics. The pixel-wise spatial agreement between the optical (Ots) and radar (RtsB) based algorithms was also computed. The RtsB algorithm was used as it showed higher accuracies when compared to the RtsC algorithm.
C e = e 12 e 1 +
O e = e 21 e + 1
D C = 2 e 11 2 e 11 + e 12 + e 21

3. Results

Although reference validation periods were common, the detection periods varied slightly depending on the algorithm input data (e.g., Sentinel-1, Sentinel-2), thus limiting a like for like comparison. However, general trends could be distinguished (Table 3). The Ots Sentinel-2 algorithm provided superior agreement with the reference fire perimeters when compared to the Sentinel-1 algorithms for all tiles except 33NUG, 33NQG, and 36NXP. Considering all tiles, the Ots algorithm showed OE and CE around 30% while for the radar backscatter coefficient-based algorithm (RtsB), the OE and CE were 66% and 36%, respectively. For the coherence-based algorithm (RtsC), slightly higher OE (67%) and CE (55%) errors were observed. Over all tiles, the largest difference between the three algorithms was observed for the omission errors, which were twice as much for the radar-based algorithms (66 vs. 33%). One should notice that much higher accuracies were obtained for the Ots algorithm over tiles where the validation data were generated from Sentinel-2 images (Table 3) when compared to tiles where the validation data was generated from Landsat-8 images. For the later tiles, the Ots algorithm showed OE and CE estimates in the same range as those observed for the RtsB algorithm.
By land cover type, the Ots algorithm showed small (<20%) OE and CE over cropping areas, and shrublands, which increased for savanna (17–50%) and forest (42–44%) vegetation. For the RtsB algorithm, the errors were largely similar over most classes with OE around 70% and CE between 30 and 40% (Table 4). For the coherence-based algorithm (RtsC), the OE and CE varied within higher intervals 60–80% and 45% to 70%, respectively. The smallest difference between the optical and the SAR BA mapping accuracy was observed for the forest class (DC 57% vs. 46%) and the RtsB algorithm.
The pixel-wise spatial agreement for the total burned area detected by the optical-based Ots and the radar-based RtsB algorithm ranged between 7% and 65% (Table 5) except for tile 33NUG where the Ots algorithm performed poorly (Table 3). For unburned areas, the spatial agreement between the two algorithms was above 91% (Table 5) except for tile 35NQG where both algorithms had large (>60%) omission errors (Table 3 and Figure 2). Commission errors usually occurred over different areas for the two algorithms as the spatial agreement was below 1% for six tiles. For tiles 35NQG and 36NXP, CE agreement was much higher (around 20%), which may be related with the low mean daily cloud cover (<30%) or different landscapes in eastern Africa. For the omission errors, the agreement between the algorithms reached over 30% in four tiles and over 10% in nine tiles (Table 5). Over tiles dominated by low vegetation and high small fires activity (31NEJ, 32NNP), the agreement between the two algorithms was low (<10%) due to the high omission errors observed for the Sentinel-1 algorithm (Figure 2). The maximum agreement of the detected burned area (nearly 65%) was observed over tile 29NNJ (Table 5 and Figure 2). Notice that for unburned areas, the percentage spatial agreement in Table 5 was computed using the reference unburned area as the reference. For burned areas, OE and CE, the spatial agreement was computed using as reference the burned area. BA detection accuracy (i.e., DC), as well as the size of the detected burned area, was positively related to the number of large size fire patches (Figure 3).
The classification rate (classified vs. not classified) was also analysed. Not classified pixels corresponded to areas of clouds/shadows in optical images (Ots) or pre-processing errors (e.g., difficulties in deriving coherence estimates) in the radar-based algorithms. The average classification rates for the Ots, RtsB, and RtsC algorithms were 83%, 100%, and 85%, respectively.

4. Discussion

The algorithms compared here were developed using diverse input datasets (optical, radar backscatter, and interferometric coherence) and change detection strategies. Considering all tiles, the use of an optical-based algorithm (Ots) increased the accuracy of burned area detection by about 23% when compared to the most accurate radar-based (RtsB) algorithm (DC 0.68 vs. 0.45). When compared to reference fire perimeters derived from independent sensors (i.e., Landsat-8), the RtsB algorithm provided more accurate detection for three of the four tiles analysed (33NUG 35NQG, 36NXP). However, the particularly high errors observed over the 33NUG tile for the Ots algorithm seemed to be related to the few cloud-free observations of the Sentinel-2 sensor. Over tiles where Sentinel-2 images were used to derive the validation perimeters, the BA detection accuracy improved noticeably (OE 19% and CE 11%, average values) for the Ots algorithm (also based on Sentinel-2 images) when compared to tiles where reference perimeters were derived from Landsat images. The increased agreement with the reference data was attributed to (i) exact matching of validation and detection periods thus avoiding errors due to missing or extra days, (ii) the same spatial resolution (20 m) at which validation and detection were carried out and thus lower errors along fire borders, (iii) the use of the same spectral information (Sentinel-2 bands) and similarities between the BAMS algorithm (used for validation perimeters) and the Ots algorithm as both use a two step mapping strategy. However, accuracy metrics for the Ots algorithm over Sub-Saharan Africa were higher (DC = 0.77, OE = 0.27, CE = 0.19) when using a fully statistical validation approach [15], which included unmatched validation periods (from Landsat-7 and 8) and temporally long sample units. This suggests that the tiles selected for algorithms inter-comparison may not represent average burn conditions over all of Africa and that temporally short sample units may underestimate BA detection accuracy. Such an assumption is also supported by the higher accuracy observed for the RtsC coherence algorithm, (DC = 0.48, OE = 0.53, CE = 0.57) when assessed over a significantly larger area in the same region (Sub-Saharan Africa) [54]. Over the studied tiles, the time series coherence-based algorithm (RtsC) showed larger errors when compared to the time-series backscatter-based algorithm (RtsB) over all areas as well as lower detection rates (85% vs. 100%). This suggests that the coherent scattering properties of the vegetation before and after the fire event may not be changing sufficiently in the post-fire image to indicate a fire event may have been present. It was also noticed that the interferometric coherence was very dynamic in Sub-Saharan Africa, possibly as a result of fire-unrelated vegetation structure and moisture changes as a result of the on-going dry season that coincides with the fire season.
Of the three algorithms, only the RtsB algorithm was previously validated over other study areas including 44 sites (20 × 30 km each) in the Amazon basin [36] and 15 MGRS tiles globally distributed [35]. In the Amazon basin, the RtsB algorithm provided more accurate (DC 0.63 vs. 0.45) overall results [36]. The increased accuracy may be related to the different fire regime for the Amazon grasslands (few repeat burns, large fire patches), the large number of sites dominated by forests (25 out of 44), and the use of temporally long sampling units over the Amazon sites [50]. When compared to globally distributed MGRS tiles, the accuracy observed in Africa for the RtsB algorithm was generally lower except for the Australian grasslands and shrublands [35]. Such spatial differences suggest that the radar-based algorithm may need further refinement to better adapt to the local conditions (fire regime, vegetation type, environmental factors).
The optical-based Ots algorithm showed higher variation of the DC by land cover type with values ranging from 57% to 85%. In particular, OE and CE for tropical forests were more than double when compared to other land covers. Such large errors were attributed to the poor performance of the Ots algorithm over the heavily burned 35NQG tile (dominated by forest cover). The large OE (61%) and CE (64%) errors in tile 35NQG seemed unrelated to the daily mean cloud cover (15–30%) or the number of small fire patches as for tile 33NWE (also dominated by forest cover) the OE and CE were much lower (0.22 and 0.03) despite increased mean daily cloud cover (50–75%), and a similar number of small fire patches. Instead, higher errors in tiles dominated by forest vegetation (33NTG, 35NUG, 35NQG) seemed to be related to mismatches between detection and validation periods due to the use of Landsat imagery when generating the reference fire perimeters. Indeed, for forest dominated tiles (28PET, 33NWE) where reference fire perimeters were generated from Sentinel-2 imagery (i.e., exact matching of detection and validation dates), the observed OE and CE where much lower.
The accuracy of the radar-based algorithms was more stable with DC differences below 8% and 16% for the RtsB and RtsC, respectively. The Ots and RtsB algorithms showed a consistent pattern in regard to the location of commission errors. Such errors largely occurred over different areas (spatial agreement <6% for most tiles), suggesting potential synergies with a combined radar-optical detection method. The spatial agreement of the burned area detected by the Ots and RtsB algorithms did not depend on the total burned area but was negatively correlated with the number of large fire patches particularly when tile 33NUG was discarded from the analysis (Pearson’s r = 0.55). Notice that the Ots algorithm showed poor results (DC = 0.04) over tile 33NUG as explained above. Correlation of DC values with the number of large fire patches reached 0.52, −0.30 and 0.43 for Ots, RtsB, and RtsC respectively suggesting more accurate results with an increasing number of large fire patches for the Ots and RtsC algorithms and the opposite for the RtsB algorithm although the relationship for the latter was weak. In addition, strong correlations (>0.7) were observed between the total burned area detected by the Ots and RtsC algorithms and the number of large fire patches.
The validation of medium resolution (10–30 m) BA products is a known issue due to the difficulty in obtaining reference datasets from high spatial resolution optical sensors (e.g., WorldView, GeoEye, Planet) over large areas and temporal spans. This study was limited by the lack of reference fire perimeters from such high spatial resolution sensors. However, the rather small difference between the spatial resolution at which the burned area was detected 20–40 m and the imagery used to derive the reference fire perimeters (20–30 m) should not impede obtaining at least some preliminary conclusions as shown in this study.

5. Conclusions

The analysis suggested that optical-based algorithms may provide for a significant increase in accuracy over SAR based algorithms, particularly over regions where persistent cloud cover is not an issue as detection rates may otherwise drop considerably. However, BA detection from SAR time series is in its infancy when compared to the decades-long research based on optical sensors. Therefore, more mature SAR-based BA detection algorithms may provide accuracy metrics like those obtained from high resolution optical data (e.g., Sentinel-2) by taking advantage of combined backscatter-coherence information. Further work is needed to better understand the relationship between interferometric SAR coherence from C-band and the process of vegetation burning in terms of the influence of scatters and their post-fire stability. Furthermore, locally adaptive SAR-based algorithms that use information from different polarisations depending on the land cover type, topography, and post-fire backscatter change direction (increase vs. decrease) may improve burned area detection particularly over grass and shrub dominated areas. Nevertheless, the added complexity of SAR data interpretation and the massive amount of data generated by interferometric SAR processing may only be justified over areas of persistent cloud cover where optical-based algorithms struggle.
Future work should also assess the consequences of the high BA, OE, and CE for greenhouse gases emissions, mitigation actions, restoration work, non-carbon ecosystem services, etc., as such analysis was beyond the scope of this study.

Author Contributions

Conceptualization, M.A.T. and E.C.; methodology, M.A.T. and M.A.B.-P.; software, M.A.B.-P.; formal analysis, M.A.T. and M.A.B.-P.; investigation, M.A.B.-P. and M.A.T.; resources, M.A.B.-P., Á.F.-C., E.R., A.B., J.W., W.W., S.L., and P.N.; data curation, M.A.B.-P., Á.F.-C., E.R., A.B., J.W., W.W., S.L., and P.N.; writing—original draft preparation, M.A.T. and M.A.B.-P.; writing—review and editing, M.A.T., M.A.B.-P., E.R., A.B., J.W., W.W., K.T., S.L., P.N., F.S., and E.C.; visualization, M.A.B.-P.; supervision, M.A.T. and E.C.; funding acquisition, M.A.T. and E.C. All authors have read and agreed to the published version of the manuscript.

Funding

This research has been financed by the European Space Agency (ESA) through the Fire_cci (Climate Change Initiative) project (Contract 4000126706/19/I-NB) and by the Spanish Ministry of Science, Innovation, and Universities through a Formacion Profesorado Universitario (FPU) doctoral fellowship (FPU16/01645).

Conflicts of Interest

The authors declare no conflict of interest.

References

  1. Bojinski, S.; Verstraete, M.; Peterson, T.C.; Richter, C.; Simmons, A.; Zemp, M. The concept of essential climate variables in support of climate research, applications, and policy. Bull. Am. Meteorol. Soc. 2014, 95, 1431–1443. [Google Scholar] [CrossRef]
  2. Tansey, K.; Grégoire, J.M.; Stroppiana, D.; Sousa, A.; Silva, J.; Pereira, J.M.; Boschetti, L.; Maggi, M.; Brivio, P.A.; Fraser, R.; et al. Vegetation burning in the year 2000: Global burned area estimates from spot vegetation data. J. Geophys. Res. 2004, 109, 1–22. [Google Scholar] [CrossRef] [Green Version]
  3. Plummer, S.; Arino, O.; Simon, M.; Steffen, W. Establishing a earth observation product service for the terrestrial carbon community: The globcarbon initiative. Mitig. Adapt. Strateg. Glob. Chang. 2006, 11, 97–111. [Google Scholar] [CrossRef]
  4. Roy, D.P.; Boschetti, L.; Justice, C.O.; Ju, J. The collection 5 modis burned area product—Global evaluation by comparison with the modis active fire product. Remote Sens. Environ. 2008, 112, 3690–3707. [Google Scholar] [CrossRef]
  5. Tansey, K.; Grégoire, J.-M.; Defourny, P.; Leigh, R.; Pekel, J.-F.; Bogaert, E.; Bartholome, E. A new, global, multi-annual (2000–2007) burnt area product at 1 km resolution. Geophys. Res. Lett. 2008, 35. [Google Scholar] [CrossRef]
  6. Giglio, L.; Loboda, T.; Roy, D.P.; Quayle, B.; Justice, C.O. An active-fire based burned area mapping algorithm for the modis sensor. Remote Sens. Environ. 2009, 113, 408–420. [Google Scholar] [CrossRef]
  7. Alonso-Canas, I.; Chuvieco, E. Global burned area mapping from envisat-meris and modis active fire data. Remote Sens. Environ. 2015, 163, 140–152. [Google Scholar] [CrossRef]
  8. Chuvieco, E.; Yue, C.; Heil, A.; Mouillot, F.; Alonso-Canas, I.; Padilla, M.; Pereira, J.M.; Oom, D.; Tansey, K. A new global burned area product for climate assessment of fire impacts. Glob. Ecol. Biogeogr. 2016, 25, 619–629. [Google Scholar] [CrossRef] [Green Version]
  9. Chuvieco, E.; Lizundia-Loiola, J.; Pettinari, M.L.; Ramo, R.; Padilla, M.; Mouillot, F.; Laurent, P.; Storm, T.; Heil, A.; Plummer, S. Generation and analysis of a new global burned area product based on modis 250 m reflectance bands and thermal anomalies. Earth Syst. Sci. Data Discuss. 2018, 10, 2015–2031. [Google Scholar] [CrossRef] [Green Version]
  10. Giglio, L.; Boschetti, L.; Roy, D.P.; Humber, M.L.; Justice, C.O. The collection 6 modis burned area mapping algorithm and product. Remote Sens. Environ. 2018, 217, 72–85. [Google Scholar] [CrossRef]
  11. Padilla, M.; Stehman, S.V.; Hantson, S.; Oliva, P.; Alonso-Canas, I.; Bradley, A.; Tansey, K.; Mota, B.; Pereira, J.M.; Chuvieco, E. Comparing the accuracies of remote sensing global burned area products using stratified random sampling and estimation. Remote Sens. Environ. 2015, 160, 114–121. [Google Scholar] [CrossRef] [Green Version]
  12. Boschetti, L.; Roy, D.P.; Giglio, L.; Huang, H.; Zubkova, M.; Humber, M.L. Global validation of the collection 6 modis burned area product. Remote Sens. Environ. 2019, 235, 111490. [Google Scholar] [CrossRef]
  13. Mouillot, F.; Schultz, M.G.; Yue, C.; Cadule, P.; Tansey, K.; Ciais, P.; Chuvieco, E. Ten years of global burned area products from spaceborne remote sensing—A review: Analysis of user needs and recommendations for future developments. Int. J. Appl. Earth Obs. Geoinf. 2014, 26, 64–79. [Google Scholar] [CrossRef] [Green Version]
  14. Randerson, J.T.; Chen, Y.; Werf, G.R.; Rogers, B.M.; Morton, D.C. Global burned area and biomass burning emissions from small fires. J. Geophys. Res. Biogeosci. 2012, 117. [Google Scholar] [CrossRef]
  15. Roteta, E.; Bastarrika, A.; Padilla, M.; Storm, T.; Chuvieco, E. Development of a sentinel-2 burned area algorithm: Generation of a small fire database for sub-saharan africa. Remote Sens. Environ. 2019, 222, 1–17. [Google Scholar] [CrossRef]
  16. Van der Werf, G.R.; Randerson, J.T.; Giglio, L.; van Leeuwen, T.T.; Chen, Y.; Rogers, B.M.; Mu, M.; van Marle, M.J.E.; Morton, D.C.; Collatz, G.J.; et al. Global fire emissions estimates during 1997–2016. Earth Syst. Sci. Data 2017, 9, 697–720. [Google Scholar] [CrossRef] [Green Version]
  17. Brennan, J.; Gómez-Dans, J.; Disney, M.; Lewis, P. Theoretical uncertainties for global satellite-derived burned area estimat. Biogeosceinces 2019, 16, 3147–3164. [Google Scholar] [CrossRef] [Green Version]
  18. Chuvieco, E.; Mouillot, F.; van der Werf, G.R.; San Miguel, J.; Tanase, M.; Koutsias, N.; García, M.; Yebra, M.; Padilla, M.; Gitas, I.; et al. Historical background and current developments for mapping burned area from satellite earth observation. Remote Sens. Environ. 2019, 225, 45–64. [Google Scholar] [CrossRef]
  19. Stroppiana, D.; Bordogna, G.; Carrara, P.; Boschetti, M.; Boschetti, L.; Brivio, P.A. A method for extracting burned areas from landsat tm/etm+ images by soft aggregation of multiple spectral indices and a region growing algorithm. ISPRS J. Photogramm. Remote Sens. 2012, 69, 88–102. [Google Scholar] [CrossRef]
  20. Goodwin, N.R.; Collett, L.J. Development of an automated method for mapping fire history captured in landsat tm and etm+ time series across queensland, Australia. Remote Sens. Environ. 2014, 148, 206–221. [Google Scholar] [CrossRef]
  21. Stroppiana, D.; Azar, R.; Calò, F.; Pepe, A.; Imperatore, P.; Boschetti, M.; Silva, J.M.N.; Brivio, P.A.; Lanari, R. Integration of optical and sar data for burned area mapping in mediterranean regions. Remote Sens. 2015, 7, 1320–1345. [Google Scholar] [CrossRef] [Green Version]
  22. Hawbaker, T.J.; Vanderhoof, M.K.; Beal, Y.-J.; Takacs, J.D.; Schmidt, G.L.; Falgout, J.T.; Williams, B.; Fairaux, N.M.; Caldwell, M.K.; Picotte, J.J.; et al. Mapping burned areas using dense time-series of landsat data. Remote Sens. Environ. 2017, 198, 504–522. [Google Scholar] [CrossRef]
  23. Long, T.; Zhang, Z.; He, G.; Jiao, W.; Tang, C.; Wu, B.; Zhang, X.; Wang, G.; Yin, R. 30 m resolution global annual burned area mapping based on landsat images and google earth engine. Remote Sens. 2019, 11, 489. [Google Scholar] [CrossRef] [Green Version]
  24. Lasaponara, R.; Tucci, B. Identification of burned areas and severity using sar sentinel-1. IEEE Geosci. Remote Sens. Lett. 2019, 16, 917–921. [Google Scholar] [CrossRef]
  25. Engelbrecht, J.; Theron, A.; Vhengani, L.; Ke, J. A simple normalized difference approach to burnt area mapping using multi-polarisation c-band sar. Remote Sens. 2017, 9, 764. [Google Scholar] [CrossRef] [Green Version]
  26. Verhegghen, A.; Eva, H.; Ceccherini, G.; Achard, F.; Gond, V.; Gourlet-Fleury, S.; Cerutti, P.O. The potential of sentinel satellites for burnt area mapping and monitoring in the congo basin forests. Remote Sens. 2016, 8, 986. [Google Scholar] [CrossRef] [Green Version]
  27. Mathieu, R.; Main, R.; Roy, D.; Naidoo, L.; Yang, H. Detection of burned areas in southern african savannahs using time series of c-band sentinel-1 data. In Proceedings of the IGARSS 2018—2018 IEEE International Geoscience and Remote Sensing Symposium, Valencia, Spain, 22–27 July 2018; pp. 5337–5339. [Google Scholar]
  28. Roy, D.P.; Huang, H.; Boschetti, L.; Giglio, L.; Yan, L.; Zhang, H.H.; Li, Z. Landsat-8 and sentinel-2 burned area mapping—A combined sensor multi-temporal change detection approach. Remote Sens. Environ. 2019, 231, 111254. [Google Scholar] [CrossRef]
  29. Stavrakoudis, D.; Katagis, T.; Minakou, C.; Gitas, I.Z. Towards a Fully Automatic Processing Chain for Operationally Mapping Burned Areas Countrywide Exploiting Sentinel-2 Imagery; SPIE: Bellingham, WA, USA, 2019. [Google Scholar]
  30. Filipponi, F. Exploitation of sentinel-2 time series to map burned areas at the national level: A case study on the 2017 italy wildfires. Remote Sens. 2019, 11, 622. [Google Scholar] [CrossRef] [Green Version]
  31. Hollmann, R.; Merchant, C.J.; Saunders, R.; Downy, C.; Buchwitz, M.; Cazenave, A.; Chuvieco, E.; Defourny, P.; de Leeuw, G.; Forsberg, R.; et al. The esa climate change initiative: Satellite data records for essential climate variables. Bull. Am. Meteorol. Soc. 2013, 94, 1541–1552. [Google Scholar] [CrossRef] [Green Version]
  32. Plummer, S.; Lecomte, P.; Doherty, M. The esa climate change initiative (cci): A european contribution to the generation of the global climate observing system. Remote Sens. Environ. 2017, 203, 2–8. [Google Scholar] [CrossRef]
  33. Giglio, L.; Randerson, J.T.; Werf, G.R. Analysis of daily, monthly, and annual burned area using the fourth generation global fire emissions database (gfed). J. Geophys. Res. Biogeosci. 2013, 118, 317–328. [Google Scholar] [CrossRef] [Green Version]
  34. Lohberger, S.; Stängel, M.; Atwood, E.C.; Siegert, F. Spatial evaluation of indonesia’s 2015 fire-affected area and estimated carbon emissions using sentinel-1. Glob. Chang. Biol. 2017. [Google Scholar] [CrossRef] [PubMed]
  35. Belenguer-Plomer, M.A.; Tanase, M.A.; Fernandez-Carrillo, A.; Chuvieco, E. Burned area detection and mapping using sentinel-1 backscatter coefficient and thermal anomalies. Remote Sens. Environ. 2019, 233, 111345. [Google Scholar] [CrossRef]
  36. Fernandez-Carrillo, A.; Belenguer-Plomer, M.A.; Chuvieco, E.; Tanase, M.A. Effects of Sample Size on Burned Areas Accuracy Estimates in the Amazon Basin; SPIE: Bellingham, WA, USA, 2018. [Google Scholar]
  37. Melchiorre, A.; Boschetti, L. Global analysis of burned area persistence time with modis data. Remote Sens. 2018, 10, 750. [Google Scholar] [CrossRef] [Green Version]
  38. Breiman, L. Random forests. Mach. Learn. 2001, 45, 5–32. [Google Scholar] [CrossRef] [Green Version]
  39. Pedregosa, F.V.G.; Gramfort, A.; Michel, V.; Thirion, B.; Grisel, O.; Blondel, M.; Prettenhofer, P.; Weiss, R.; Dubourg, V.; Vanderplas, J.; et al. Scikit-learn: Machine learning in python. J. Mach. Learn. 2011, 12, 2825–2830. [Google Scholar]
  40. Key, C.H.; Benson, N.C. Remote Sensing Measure of Severity: The Normalized Burn Ratio, Firemon Landscape Assessment (La) V4, Sampling and Analysis Methods; USFS Rocky Mountain Research Station: Fort Collins, CO, USA, 2004.
  41. Main-Knorn, M.; Pflug, B.; Louis, J.; Debaecker, V.; Müller-Wilm, U.; Gascon, F. Sen2cor for Sentinel-2; SPIE: Bellingham, WA, USA, 2017. [Google Scholar]
  42. Bastarrika, A.; Alvarado, M.; Artano, K.; Martinez, M.P.; Mesanza, A.; Torre, L.; Ramo, R.; Chuvieco, E. Bams: A tool for supervised burned area mapping using landsat data. Remote Sens. 2014, 6, 12360–12380. [Google Scholar] [CrossRef] [Green Version]
  43. Reed, I.S.; Yu, X. Adaptive multiple-band cfar detection of an optical pattern with unknown spectral distribution. IEEE Trans. Acoust. Speech Signal Process. 1990, 38, 1760–1770. [Google Scholar] [CrossRef]
  44. Boschetti, L.; Flasse, S.P.; Brivio, P.A. Analysis of the conflict between omission and commission in low spatial resolution dichotomic thematic products: The pareto boundary. Remote Sens. Environ. 2004, 91, 280–292. [Google Scholar] [CrossRef]
  45. Boschetti, L.; Roy, D.; Justice, C.O. International Global Burned Area Satellite Product Validation Protocol. Part I—Production and Standardization of Validation Reference Data; Committee on Earth Observation Satellites: New York, NY, USA, 2009. [Google Scholar]
  46. Roy, D.P.; Boschetti, L. Southern africa validation of the modis, L3JRC, and globcarbon burned-area products. IEEE Trans. Geosci. Remote Sens. 2009, 47, 1032–1044. [Google Scholar] [CrossRef]
  47. Boschetti, L.; Stehman, S.V.; Roy, D.P. A stratified random sampling design in space and time for regional to global scale burned area product validation. Remote Sens. Environ. 2016, 186, 465–478. [Google Scholar] [CrossRef] [PubMed]
  48. Chuvieco, E.; Opazo, S.; Sione, W.; Del Valle, H.; Anaya, J.; Di Bella, C.; Cruz, I.; Manzo, L.; López, G.; Mari, N.; et al. Global burned land estimation in latin america using modis composite data. Ecol. Appl. 2008, 18, 64–79. [Google Scholar] [CrossRef] [PubMed] [Green Version]
  49. Padilla, M.; Stehman, S.V.; Chuvieco, E. Validation of the 2008 modis-mcd45 global burned area product using stratified random sampling. Remote Sens. Environ. 2014, 144, 187–196. [Google Scholar] [CrossRef]
  50. Padilla, M.; Olofsson, P.; Stephen, V.S.; Tansey, K.; Chuvieco, E. Stratification and sample allocation for reference burned area data. Remote Sens. Environ. 2017, 203, 240–255. [Google Scholar] [CrossRef]
  51. Congalton, R.G. A review of assessing the accuracy of classifications of remotely sensed data. Remote Sens. Environ. 1991, 37, 35–46. [Google Scholar] [CrossRef]
  52. Latifovic, R.; Olthof, I. Accuracy assessment using sub-pixel fractional error matrices of global land cover products derived from satellite data. Remote Sens. Environ. 2004, 90, 153–165. [Google Scholar] [CrossRef]
  53. Kirches, G.; Brockmann, C.; Boettcher, M.; Peters, M.; Bontemps, S.; Lamarche, C.; Schlerf, M.; Santoro, M.; Defourny, P. Land Cover CCI—Product User Guide—Version 2.4; ESA Public Document CCI-LC-PUG; European Union: Brussels, Belgium, 2014; Volume 4. [Google Scholar]
  54. Padilla, M.; Wheeler, J.; Tansey, K. Esa Climate Change Initiative—Fire_cci D4.1.1 Product Validation Report (PVR); Universidad de Alcala: Madrid, Spain, 2018; Available online: https://www.esa-fire-cci.org/Documents (accessed on 15 December 2019).
Figure 1. Tiles used for inter-comparison together with the mean daily cloud cover (2015) and the total burned (2016), according to the FireCCI5.1 global product. The source of the optical imagery used to generate the reference fire perimeters for each of the analysed tiles is also shown.
Remotesensing 12 00334 g001
Figure 2. Pixel-wise agreement between reference and burned areas detected by the Sentinel-2 (i.e., Ots) and Sentinel-1 (i.e., RtsB) algorithms.
Remotesensing 12 00334 g002aRemotesensing 12 00334 g002b
Figure 3. The relationship between detection accuracy (left) and detected area (right) for the optical-based (Ots) and interferometric coherence based (RtsC) algorithms for the 10 tiles analysed.
Remotesensing 12 00334 g003
Table 1. Military Grid Reference System (MGRS) tiles used for inter-comparison. The main land cover type (from CCI Land Cover product, 2015) and the total burned area. The sensor used to generate the reference fire perimeters was labelled S for Sentinel-2 and L for Landsat-8.
MGRSMain Land Cover (%)AnalysedTotalNo. of Patches
TileCropsGrasslands/ShrubsForestsFire Period (dd.mm.yyyy)Burned Area (km2)Small (<25 ha)Large (>25 ha)
28PETS18145411.01.2016–11.03.20161205.62717525
29NNJS57241802.01.2016–02.03.20161139.49736278
30NWPS58132827.12.2015–16.01.2016543.02469182
31NEJS61261018.12.2015–07.01.2016909.424957544
32NNPS50321622.12.2015–10.02.20163609.1378681144
33NTGL0108915.01.2016–16.02.2016456.04104274
33NUGL0287222.10.2016–25.12.2016271.44255193
33NWES2108702.01.2016–22.01.2016859.57212674
35NQGL009901.11.2016–19.12.20163529.14538658
36NXPL5534209.09.2016–12.11.201611.64112
All25.12151.5-12534.1978974484
Table 2. Sampled error matrix on a sampling unit *.
ProductReferenceTotal
BurnedUnburned
Burnede11e12e1+
Unburnede21e22e2+
Totale+1e+2
* eij express the agreements (diagonal cells) or disagreements (off diagonal) between the BA product (map) and the reference data.
Table 3. Agreement between reference and detected BA by algorithm and tile. L-validation data from Landsat 8 images; S-validation data from Sentinel-2 images. ‘All tiles’ shows values (in bold) computed for a confusion matrix formed by all pixels from the 10 tiles analysed.
AlgorithmDetected Area (Rounded) with Respect to Reference (in Parenthesis) by Land Cover Classes (km2)Accuracy Metrics (Tile Level)
TotalCropsGrasslandsShrubsTropical ForestsOECEDC
Ots28PETS795 (1206)43 (64)3 (4)53 (84)679 (1029)0.370.030.76
29NNJS1753 (1139)923 (696)65 (13)266 (234)487 (194)0.090.330.77
30NWPS575 (543)133 (116)0 (0)80 (87)360 (340)0.160.040.89
31NEJS867 (909)427 (454)5 (5)268 (280)165 (168)0.170.120.85
32NNPS3430 (3609)1351 (1434)25 (27)1281 (1347)763 (791)0.140.090.89
33NTGL442 (456)0 (0)0 (0)74 (83)366 (372)0.50.430.53
33NUGL19 (271)0 (2)0 (0)3 (66)16 (202)0.980.510.04
33NWES834 (860)19 (22)12 (13)122 (130)681 (694)0.220.030.86
35NQGL3901 (3529)0 (0)0 (0)17 (13)3880 (3514)0.610.640.37
36NXPL216 (12)4 (1)0 (0)92 (10)118 (0)0.570.930.12
All tiles12831 (12534)2901 (2789)109 (63)2256 (2335)7516 (7304)0.330.310.68
RtsB28PETS426 (1206)16 (64)1 (4)17 (84)379 (1029)0.710.160.44
29NNJS935 (1139)574 (696)10 (13)195 (234)156 (194)0.350.190.72
30NWPS1707 (543)723 (116)0 (0)204 (87)780 (340)0.50.520.49
31NEJS262 (909)123 (454)1 (5)82 (280)57 (168)0.890.630.16
32NNPS1090 (3609)408 (1434)8 (27)412 (1347)251 (791)0.80.320.31
33NTGL343 (456)0 (0)0 (0)63 (83)279 (372)0.610.430.46
33NUGL335 (271)3 (2)0 (0)75 (66)257 (202)0.520.410.53
33NWES726 (860)13 (22)8 (13)104 (130)602 (694)0.470.280.61
35NQGL2235 (3529)1 (0)0 (0)8 (13)2225 (3514)0.630.410.46
36NXPL101 (12)3 (1)0 (0)56 (10)42 (0)0.180.740.39
All tiles8161 (12534)1864 (2789)29 (63)1215 (2335)5026 (7304)0.660.360.45
RtsC28PETS310 (1206)12 (64)1 (4)34 (84)242 (1029)0.870.470.2
29NNJS143 (1139)78 (696)3 (13)29 (234)32 (194)0.910.260.15
30NWPS344 (543)27 (116)0 (0)37 (87)279 (340)0.760.480.33
31NEJS244 (909)127 (454)1 (5)74 (280)41 (168)0.980.910.04
32NNPS3933 (3609)2230 (1434)31 (27)1202 (1347)466 (791)0.580.610.41
33NTGL537 (456)0 (0)0 (0)99 (83)437 (372)0.720.850.19
33NUGL19 (271)0 (2)0 (0)5 (66)14 (202)0.960.190.08
33NWES172 (860)3 (22)2 (13)24 (130)144 (694)0.930.540.11
35NQGL2321 (3529)0 (0)0 (0)12 (13)2308 (3514)0.140.380.72
36NXPL17 (12)0 (1)1 (0)9 (10)7 (0)0.930.620.12
All tiles8040 (12534)2477 (2789)38 (63)1524 (2335)3969 (7304)0.670.550.38
Table 4. Agreement between reference and detected burned areas by land cover type using a common confusion matrix formed by all pixels from the 10 tiles analysed.
AlgorithmOtsRtsBRtsC
Land Cover (%)OECEDCOECEDCOECEDC
Crops0.150.160.850.690.300.430.720.690.29
Grasslands0.170.500.620.720.360.390.770.610.29
Shrubs0.190.130.840.710.330.410.720.560.34
Tropical forest0.440.420.570.630.380.460.610.460.45
Table 5. Spatial agreement (%) between detections from Sentinel-1 (RtsB) and Sentinel-2 (Ots) based algorithms (NB–not burned, BA–burned area, CE–commission errors, OE–omission errors).
Tile28PET29NNJ30NWP31NEJ32NNP
NB S-1 & S-298.691.495.798.093.7
BA Sl-1 & S-223.364.737.36.77.1
CE S-1 & S-20.22.20.90.40.7
OE S-1 & S-230.93.612.416.312.9
Tile33NTG33NUG33NWE35NQG36NXP
NB S-1 & S-296.798.096.066.698.1
BA Sl-1 & S-221.51.041.818.436.0
CE S-1 & S-25.70.30.418.623.1
OE S-1 & S-232.953.710.641.810.7

