Detection of Maize Tassels from UAV RGB Imagery with Faster R-CNN

1
College of Information and Electrical Engineering, China Agricultural University, Beijing 100083, China
2
College of Land Science and Technology, China Agricultural University, Beijing 100083, China
*
Author to whom correspondence should be addressed.
Remote Sens. 2020, 12(2), 338; https://0-doi-org.brum.beds.ac.uk/10.3390/rs12020338
Submission received: 7 December 2019
/
Revised: 15 January 2020
/
Accepted: 17 January 2020
/
Published: 20 January 2020
(This article belongs to the Special Issue Quantitative Remote Sensing for Agricultural Monitoring in the Big Data Era)
Abstract
:Maize tassels play a critical role in plant growth and yield. Extensive RGB images obtained using unmanned aerial vehicle (UAV) and the prevalence of deep learning provide a chance to improve the accuracy of detecting maize tassels. We used images from UAV, a mobile phone, and the Maize Tassel Counting dataset (MTC) to test the performance of faster region-based convolutional neural network (Faster R-CNN) with residual neural network (ResNet) and a visual geometry group neural network (VGGNet). The results showed that the ResNet, as the feature extraction network, was better than the VGGNet for detecting maize tassels from UAV images with 600 × 600 resolution. The prediction accuracy ranged from 87.94% to 94.99%. However, the prediction accuracy was less than 87.27% from the UAV images with 5280 × 2970 resolution. We modified the anchor size to [852, 1282, 2562] in the region proposal network according to the width and height of pixel distribution to improve detection accuracy up to 89.96%. The accuracy reached up to 95.95% for mobile phone images. Then, we compared our trained model with TasselNet without training their datasets. The average difference of tassel number was 1.4 between the calculations with 40 images for the two methods. In the future, we could further improve the performance of the models by enlarging datasets and calculating other tassel traits such as the length, width, diameter, perimeter, and the branch number of the maize tassels.

1. Introduction
By 2050, agricultural production will need to be doubled to meet food demands because of population growth [1]. Maize is one of the most important cereal crops in the world. Maize plants are capable of natural pollination, but self-pollination is not ideal. Continuous monitoring of maize tassel growth can ensure the security, quality, and yield of maize [2]. In the past, tassel recognition in breeding mainly depended on human efforts, which was time-consuming, labor-intensive, and with limited sample sizes. Therefore, fast and accurate identification is important for a better understanding of the phenotypic traits of maize tassels.
With the development of a computer vision and an image-based plant phenotyping platform, researchers obtained high-resolution plant growth images easily and implemented automatic and rapid identification of phenotypic traits [3,4,5]. The earliest detection of maize tassels was conducted by image segmentation using the support vector machine method [6]. Researchers adopted the datasets based on maize images with high resolution and achieved high accuracy for detecting maize tassels [4,6]. However, the processes of image capturing used relatively low throughput, were labor-intensive, and were unable to be applied in a larger field. Lu et al. [4,7] developed the mTASSLE software to monitor different stages of maize tassel traits with an automatic fine-grained machine vision system and proposed the TasselNet to count maize tassels. However, the sample size was still limited.
Therefore, improving the throughput of phenotyping measurements is a significant challenge in this kind of research. Recent developments in the application of the unmanned aerial vehicle (UAV) mounted with high definition cameras have increased the sample size tremendously [8,9,10]. Researchers have implemented many applications in plant height estimation [11,12,13], seedling counting [14,15,16], and crop growth estimation [17,18] using UAV images. Nevertheless, there are fewer applications of maize tassel detection using UAV images [19] which is challenging in natural environments due to light conditions, possible occlusions, and different maize genotypes. Deep learning algorithms have been widely used to count stem [20], seedling number [16], and wheat spike number [14]. Among networks in the Faster R-CNN [21] algorithm, Quan et al. [16] conducted an experiment on the detection of maize seedling with different convolutional neural networks and confirmed that VGGNet [22] and ResNet [23] performed better than GoogleNet [24] and SqueezeeNet [25]. Kumar et al. [19] confirmed that the Faster R-CNN algorithm performed better than You Only Look Once (YOLO) [26] for the detection of maize tassel with UAVs.
Therefore, the aim of our study is to use VGGNet and ResNet as the feature extraction networks in Faster R-CNN to detect maize tassels both with images from UAV and photographed on the ground using a mobile phone. Then, the anchor size in the region proposal network was modified according to the real size of the tassel pixels to improve the detection accuracy. Finally, we compared our method with TasselNet [7] to further verify the general performance using an independent dataset.
2. Materials and Methods
2.1. Field Experiments, Image Acquisition, and Labelling
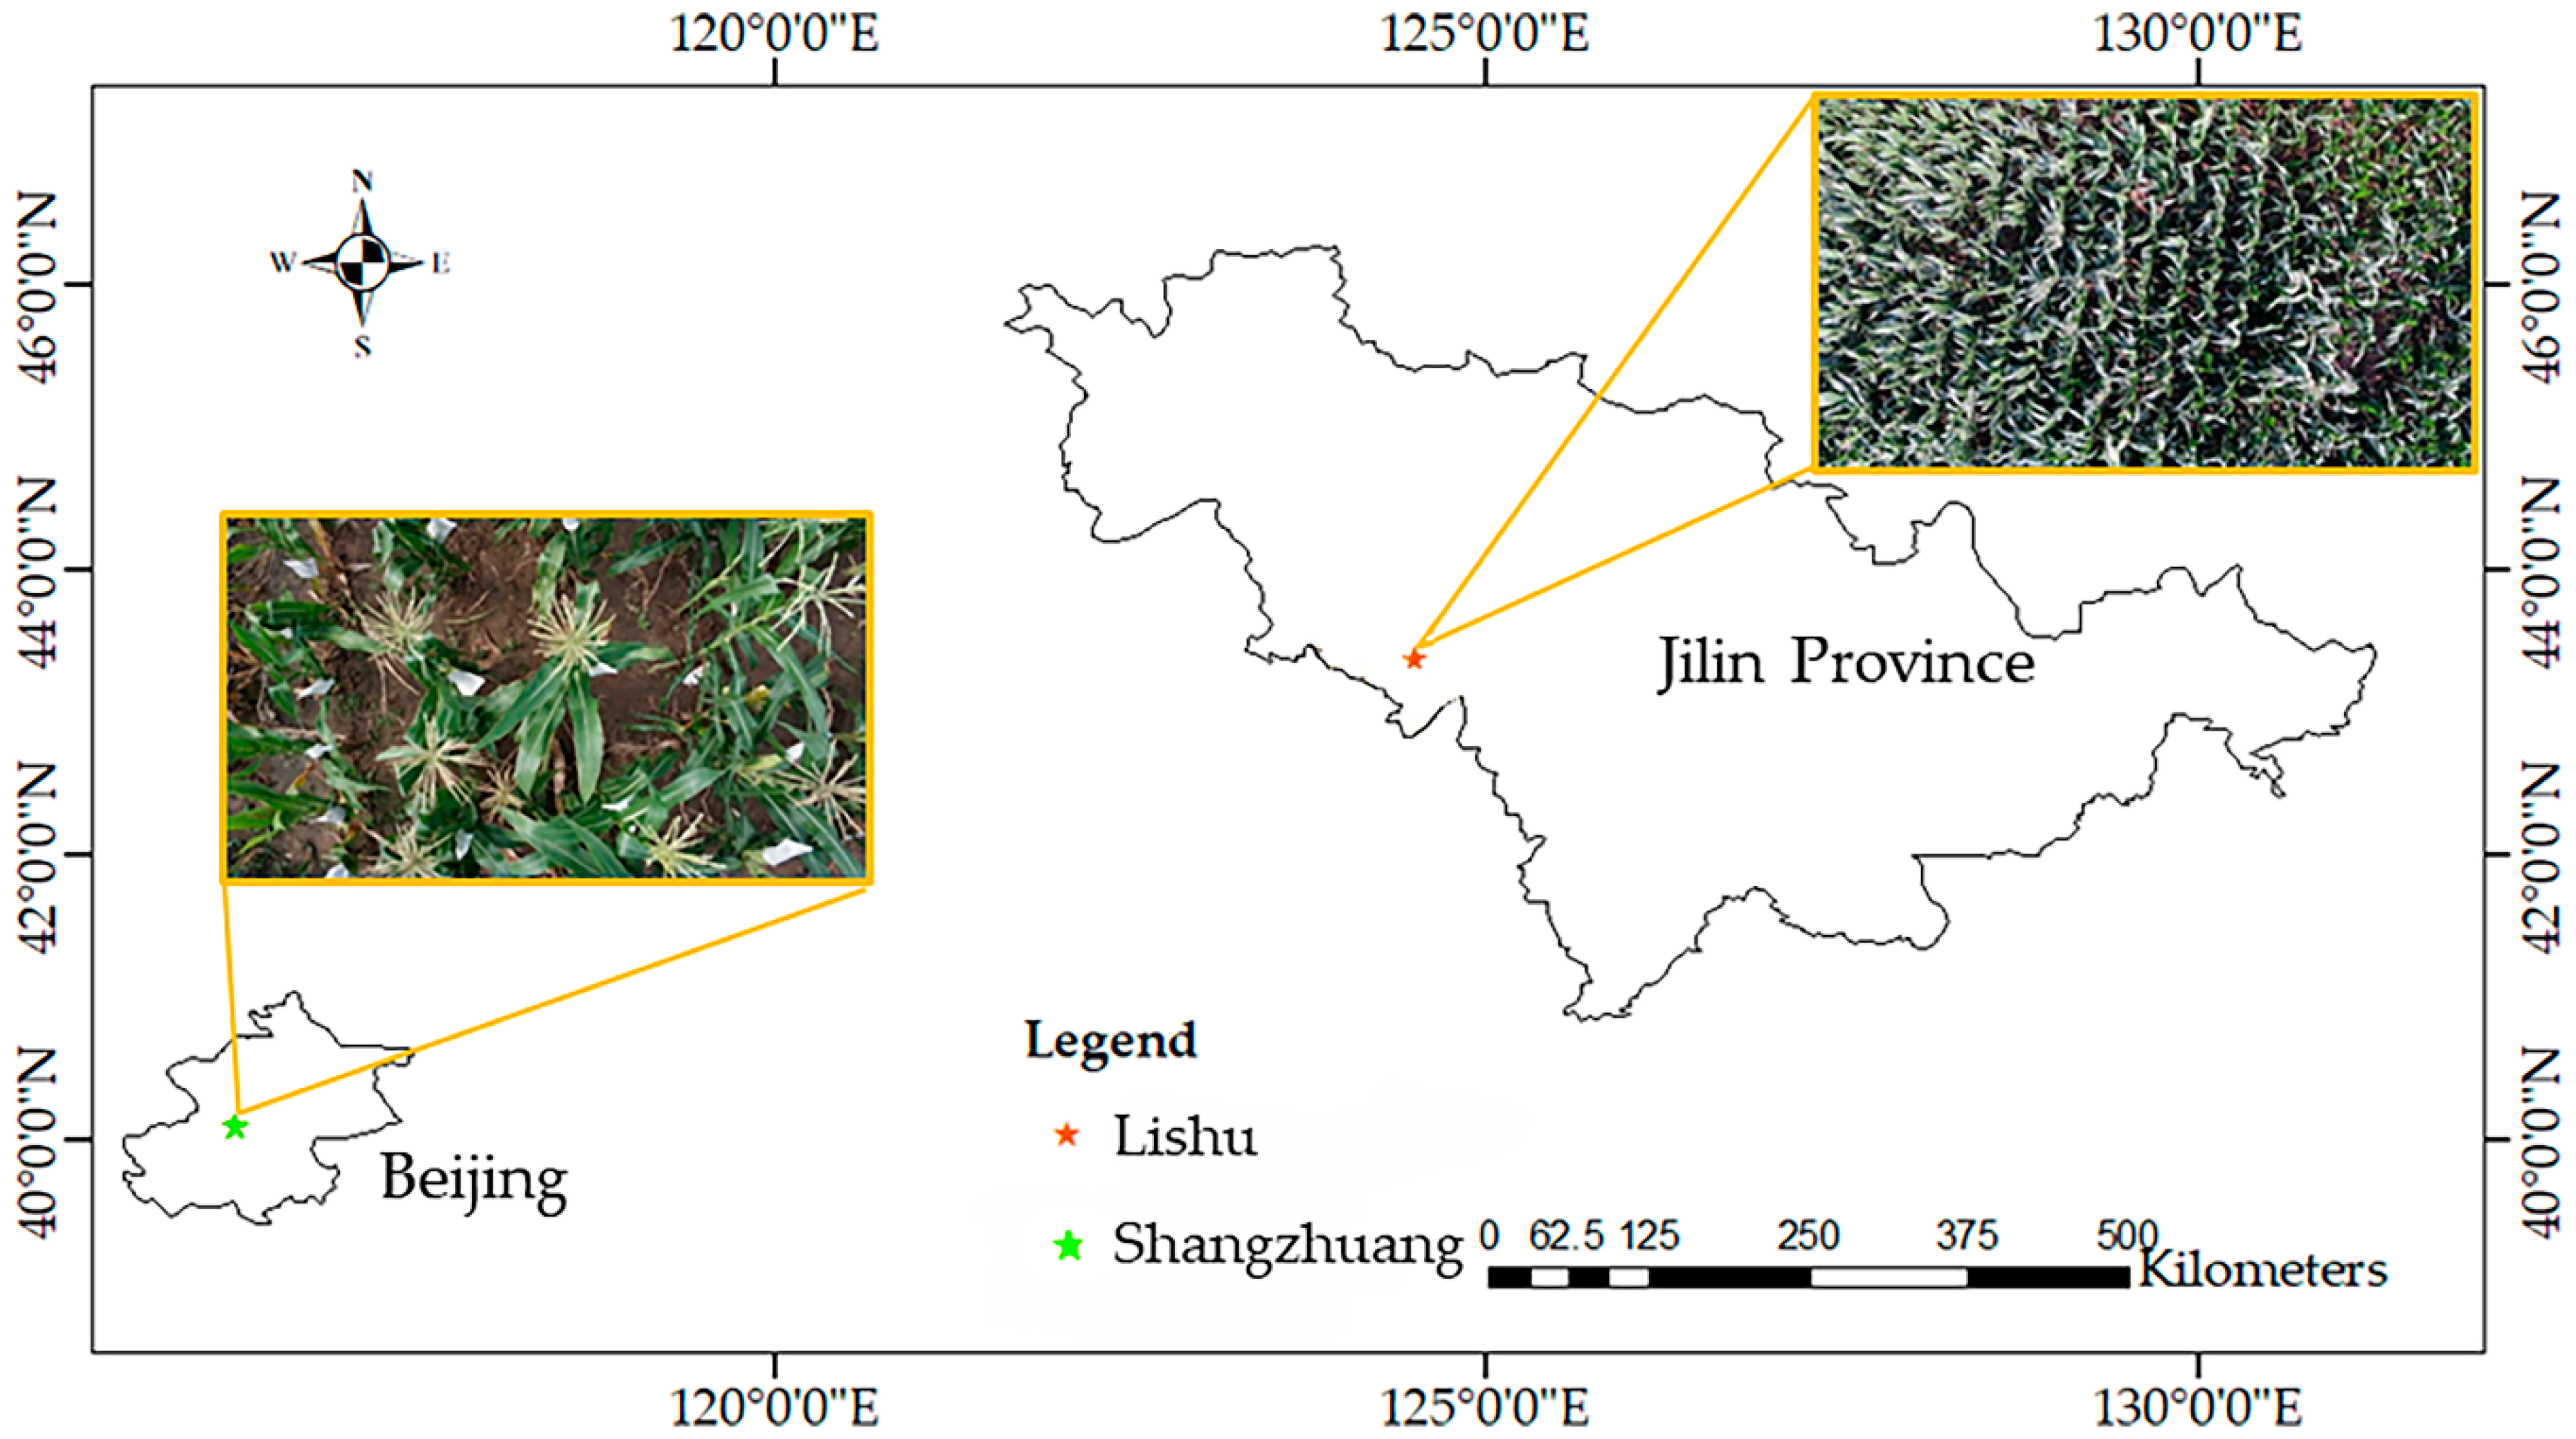
There were 485 maize inbred lines with extensive genetic diversity in each replicate. Image datasets were collected from two experimental fields at Lishu (43°16′45″ N, 124°26′10″ E), Jilin, China, and Shangzhuang (40°06′5″ N, 116°12′22″ E), Beijing, China. The 356 images of field-grown maize were obtained with UAV DJI Inspires 2 using a ZENMUSE X5S camera (DJI, Shenzhen, China) at the Lishu experimental farm. The flying height was 15 m from the ground and the camera resolution was 5280 × 2970 pixels, as shown in Figure 1, right part. All inbred lines were planted in one row for each material. The maize flowering time was different, which resulted in no tassels appearing in some areas of the images. In order to reduce the data processing time, the original images were cropped and filtered into 1125 images with 600 × 600 resolution.
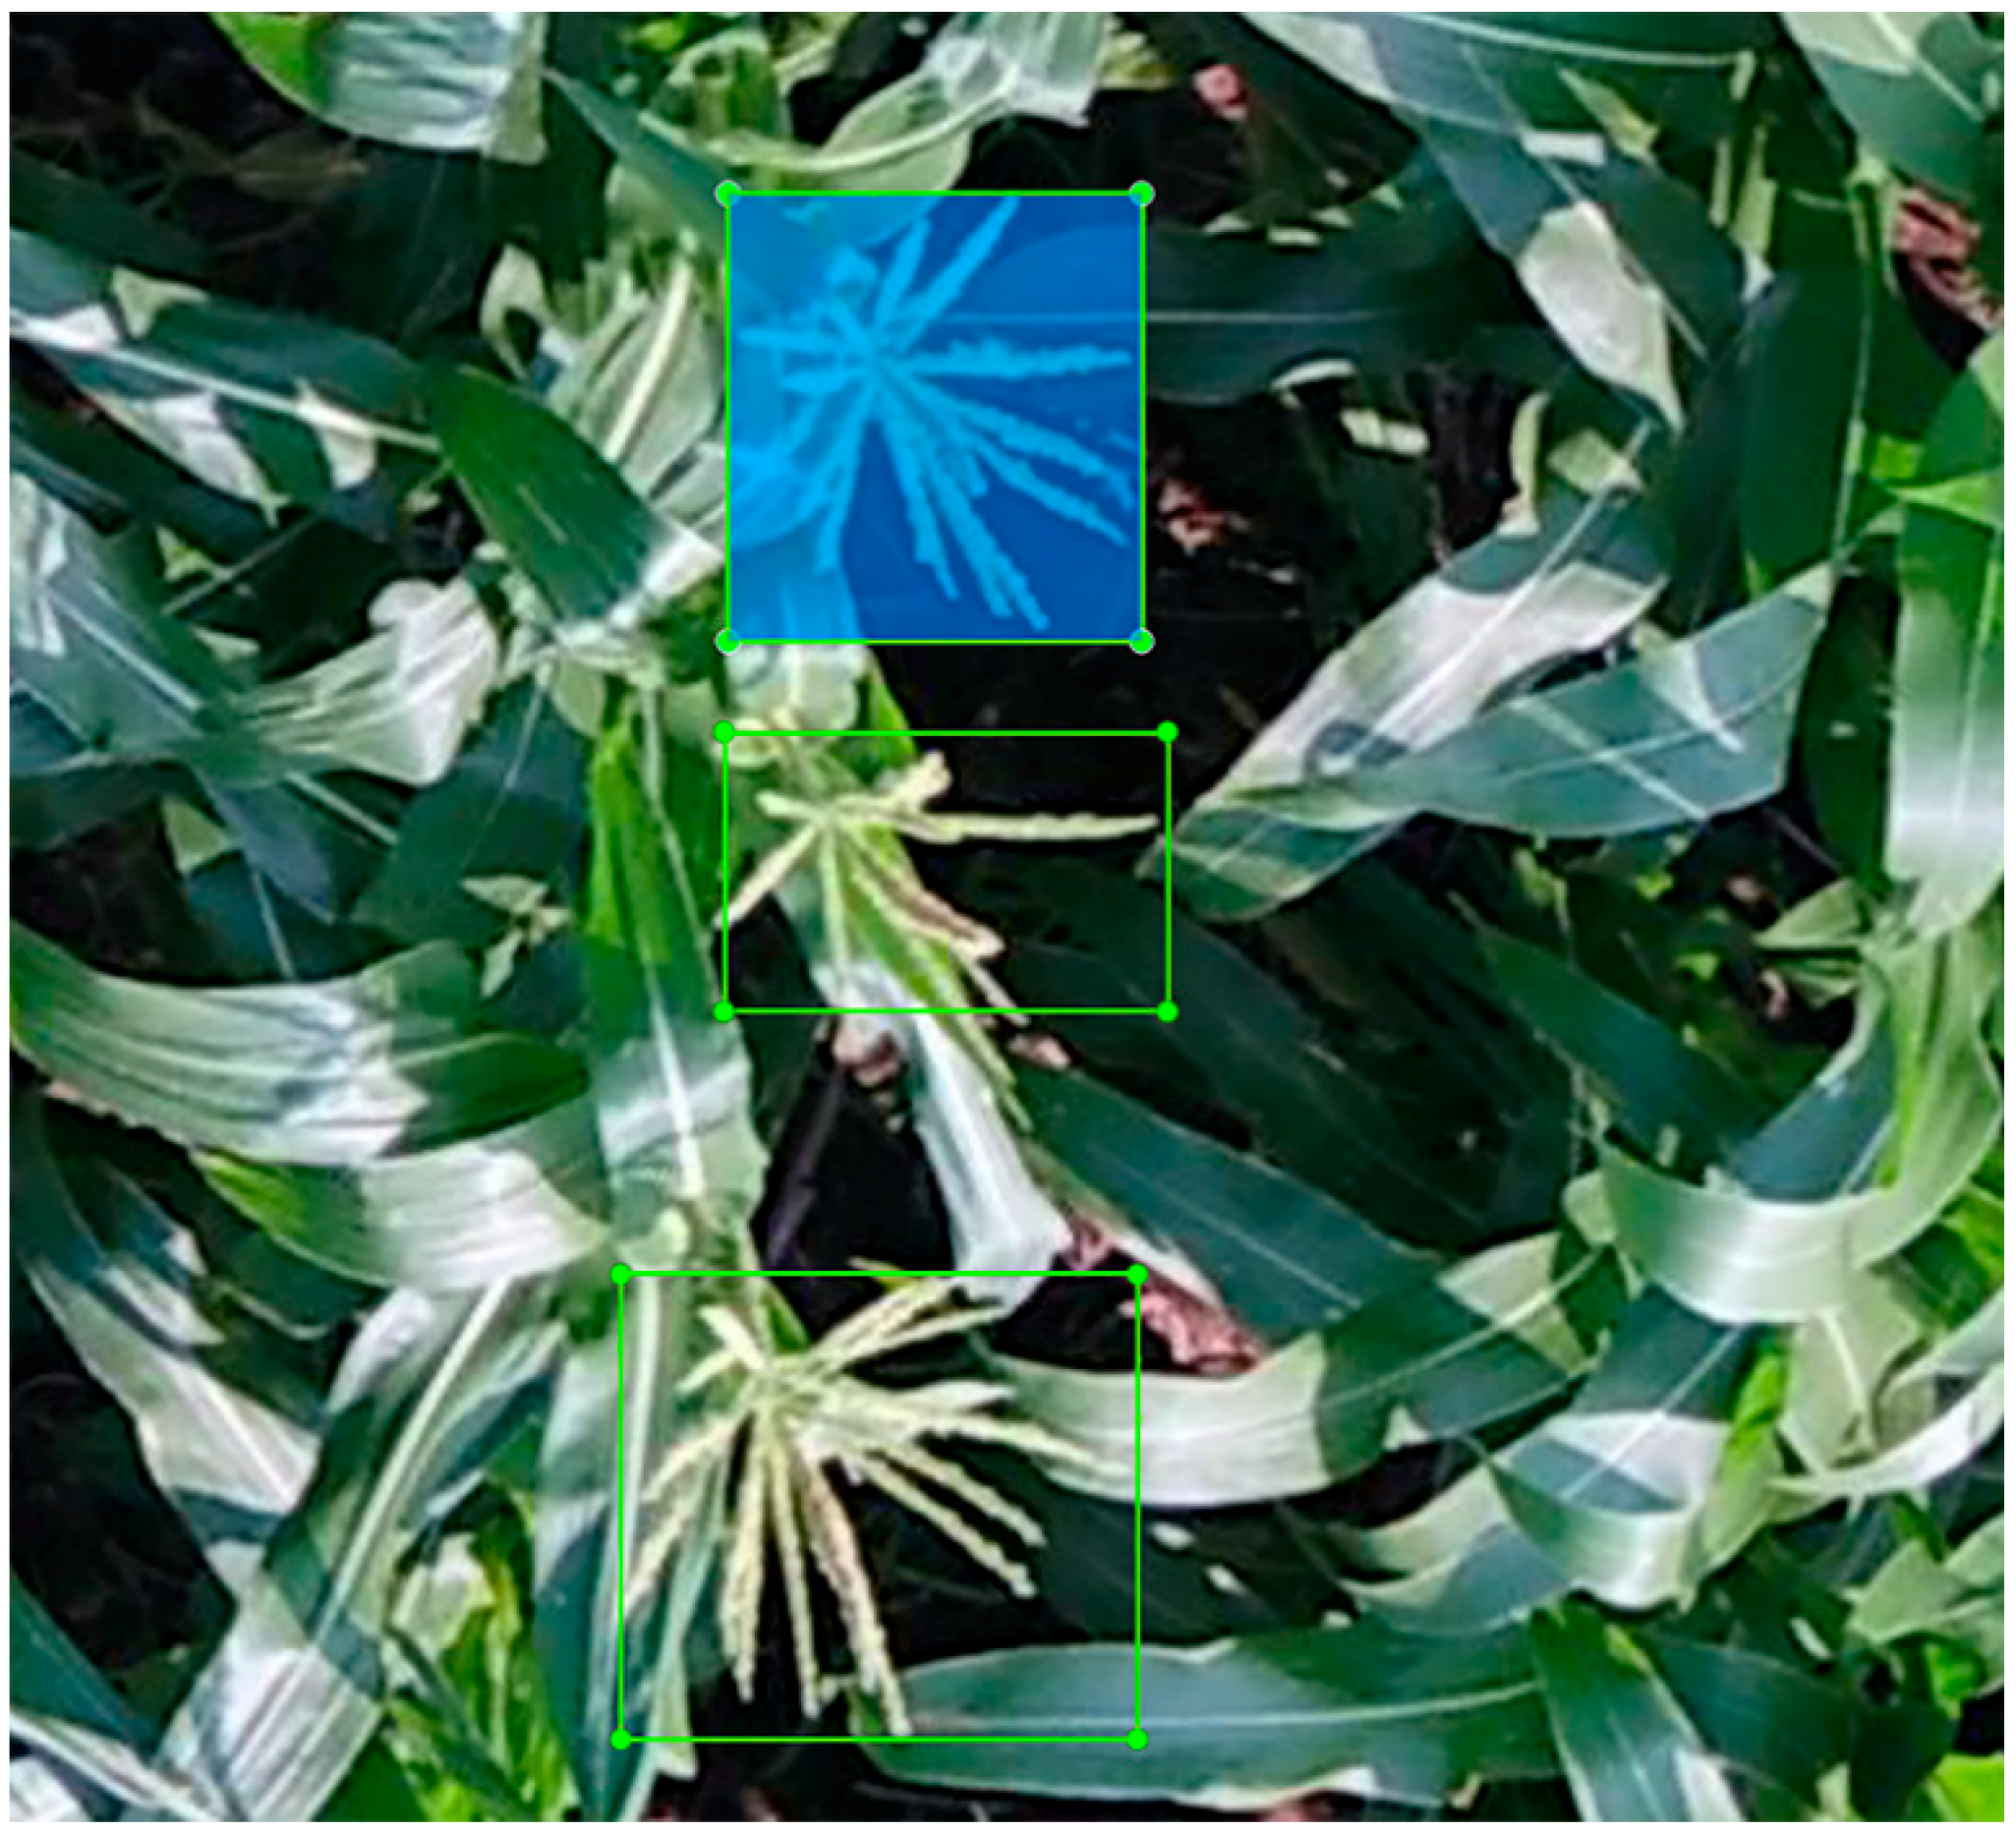
The graphical image annotation tool LabelImg [27] was used to draw the bounding boxes in these cropped images, as shown in Figure 2. All the pixels of maize tassel were within the range of the bounding boxes. The annotated images were divided randomly into the training-validation set and the test set according to the ratio 7:3. In the training-validation set, the ratio of the training vs. validation was 7:3, randomly. Another set of 89 maize images was collected using a mobile phone, 3 m from the ground, at the Shangzhuang experimental farm and was used to validate the general performance of the models, as shown in the lower left part of Figure 1. The resolution of the images was 4000 × 2250 pixels.
2.2. Model Description
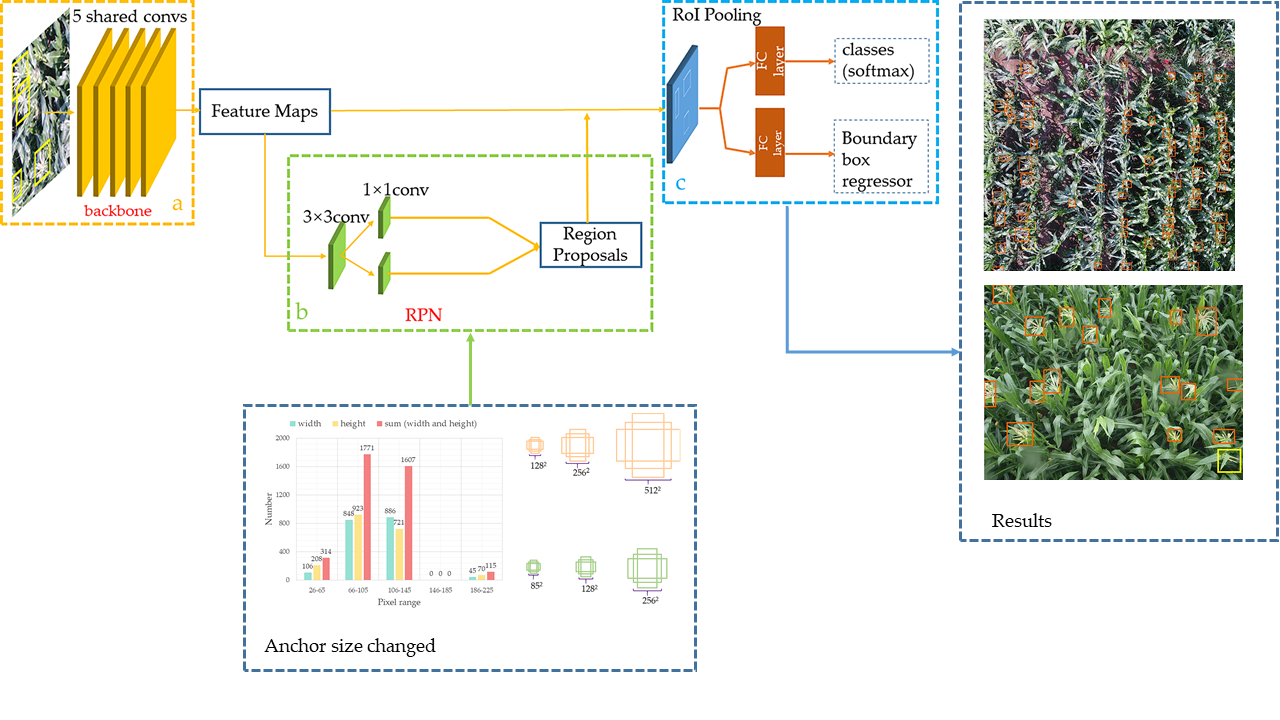
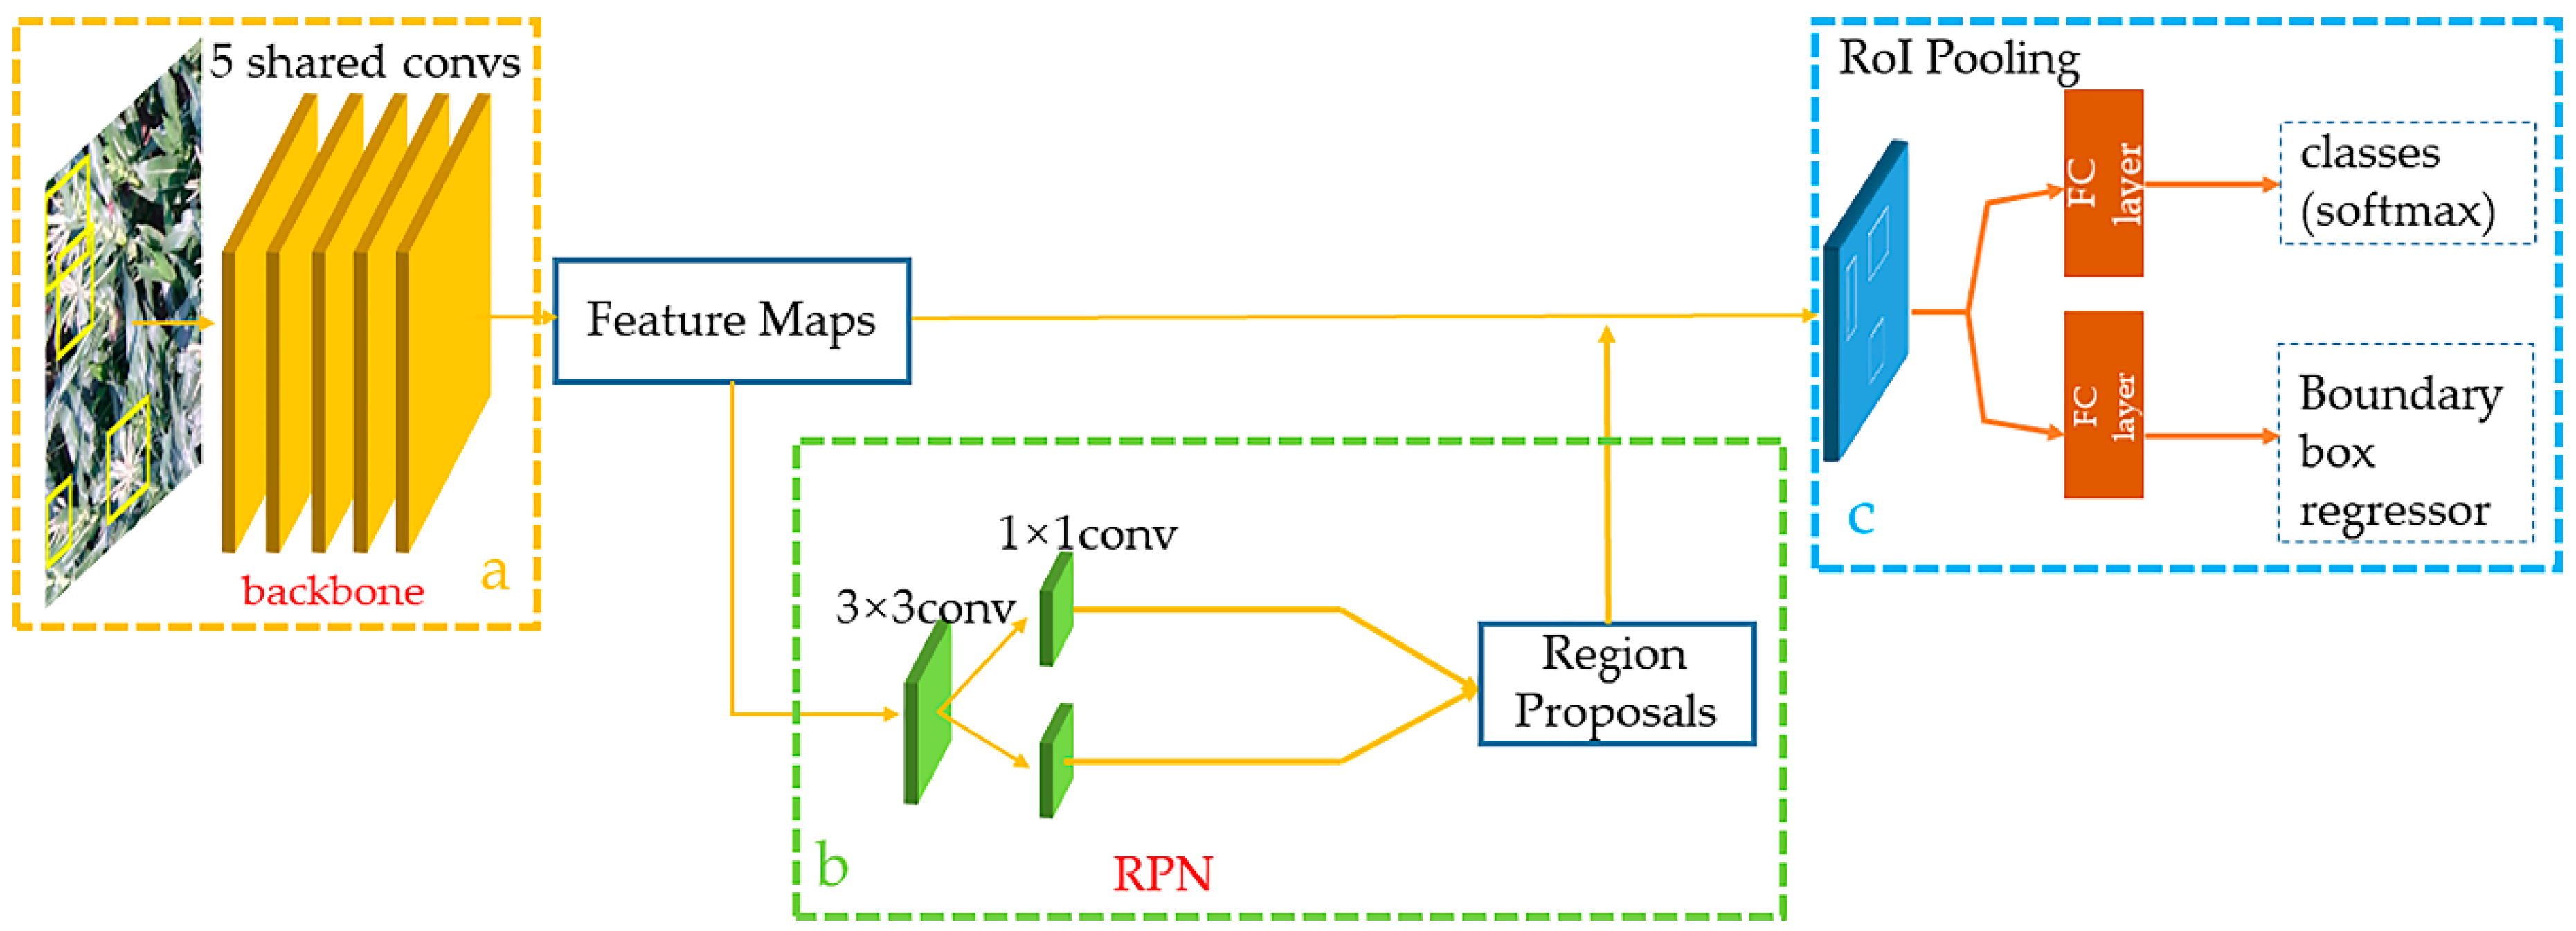
The Faster R-CNN implements an end-to-end object detection algorithm and is shown in Figure 3. Faster R-CNN generates feature maps through five shared convolutional layers in a given annotated image (Figure 3a). The region proposal network (RPN) determines whether the object is foreground or background and processes the first bounding box regression (Figure 3b). Then, these region proposals are processed by the regions of interest (RoI) pooling (Figure 3c). The softmax classification is used to determine which category the object belongs to. Finally, the boundary box regressor corrects the position of the object subtly. Compared to the previous algorithm [28,29], the Faster R-CNN no longer relies on the experience of feature engineers. Although Faster R-CNN has a long training time, its accuracy is extremely high in the complex context.
2.2.1. Region Proposal Network
The region proposal network algorithm has the capacity to take an image of any size as input and form a series of rectangular region proposals. In this process, a sliding network employs a 3 × 3 window that slides over the feature maps generated by the last layer. Eventually, a fixed vector is formed. Then, two fully connected layers are created. One is the bounding regression box layer and another is the classification layer (Figure 3b). At each window position, nine candidate boxes with multiple scales and aspect ratios (named anchor) are generated to ensure better translation invariance.
2.2.2. Anchor Size Adjustment
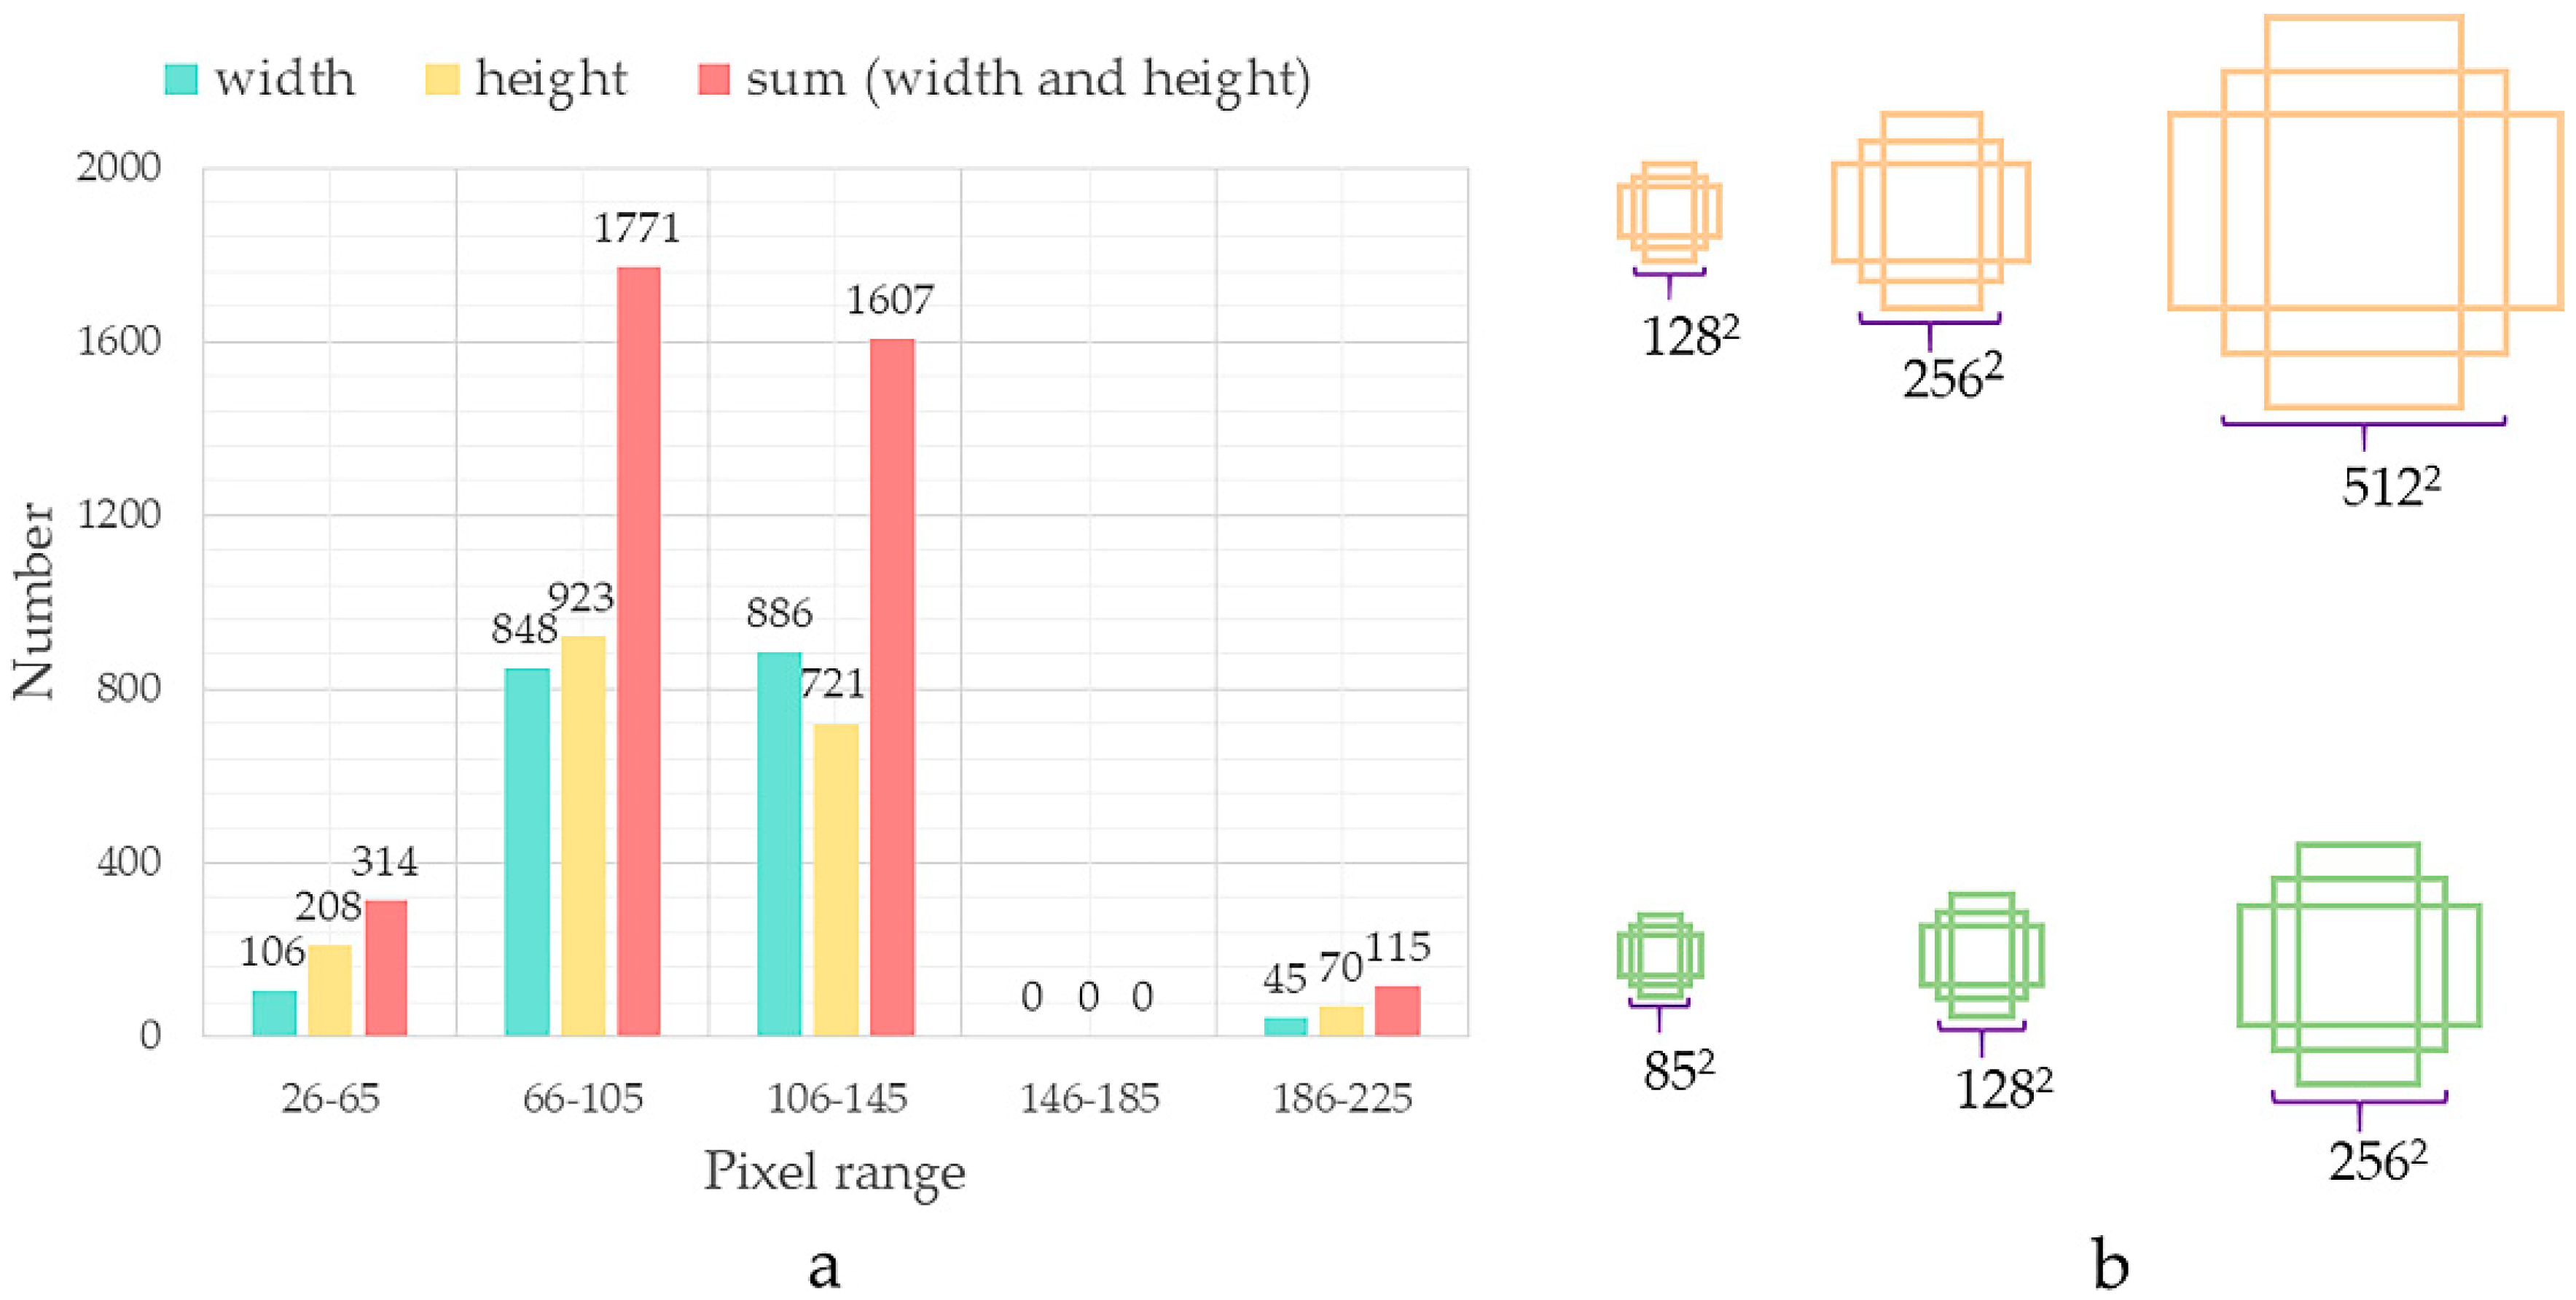
The original default parameters of the anchor size are [1282, 2562, 5122] in the Faster R-CNN. We found that the distributions of pixel width and height of individual tassels are mostly between 66 to 105 for images with 600 × 600 resolution, as shown in Figure 4a. Inspired by the small object detection in optical remote sensing images via modified Faster R-CNN [30], we adjusted the anchor size to [852, 1282, 2562], as shown in Figure 4b.
2.2.3. Convolutional Neural Network
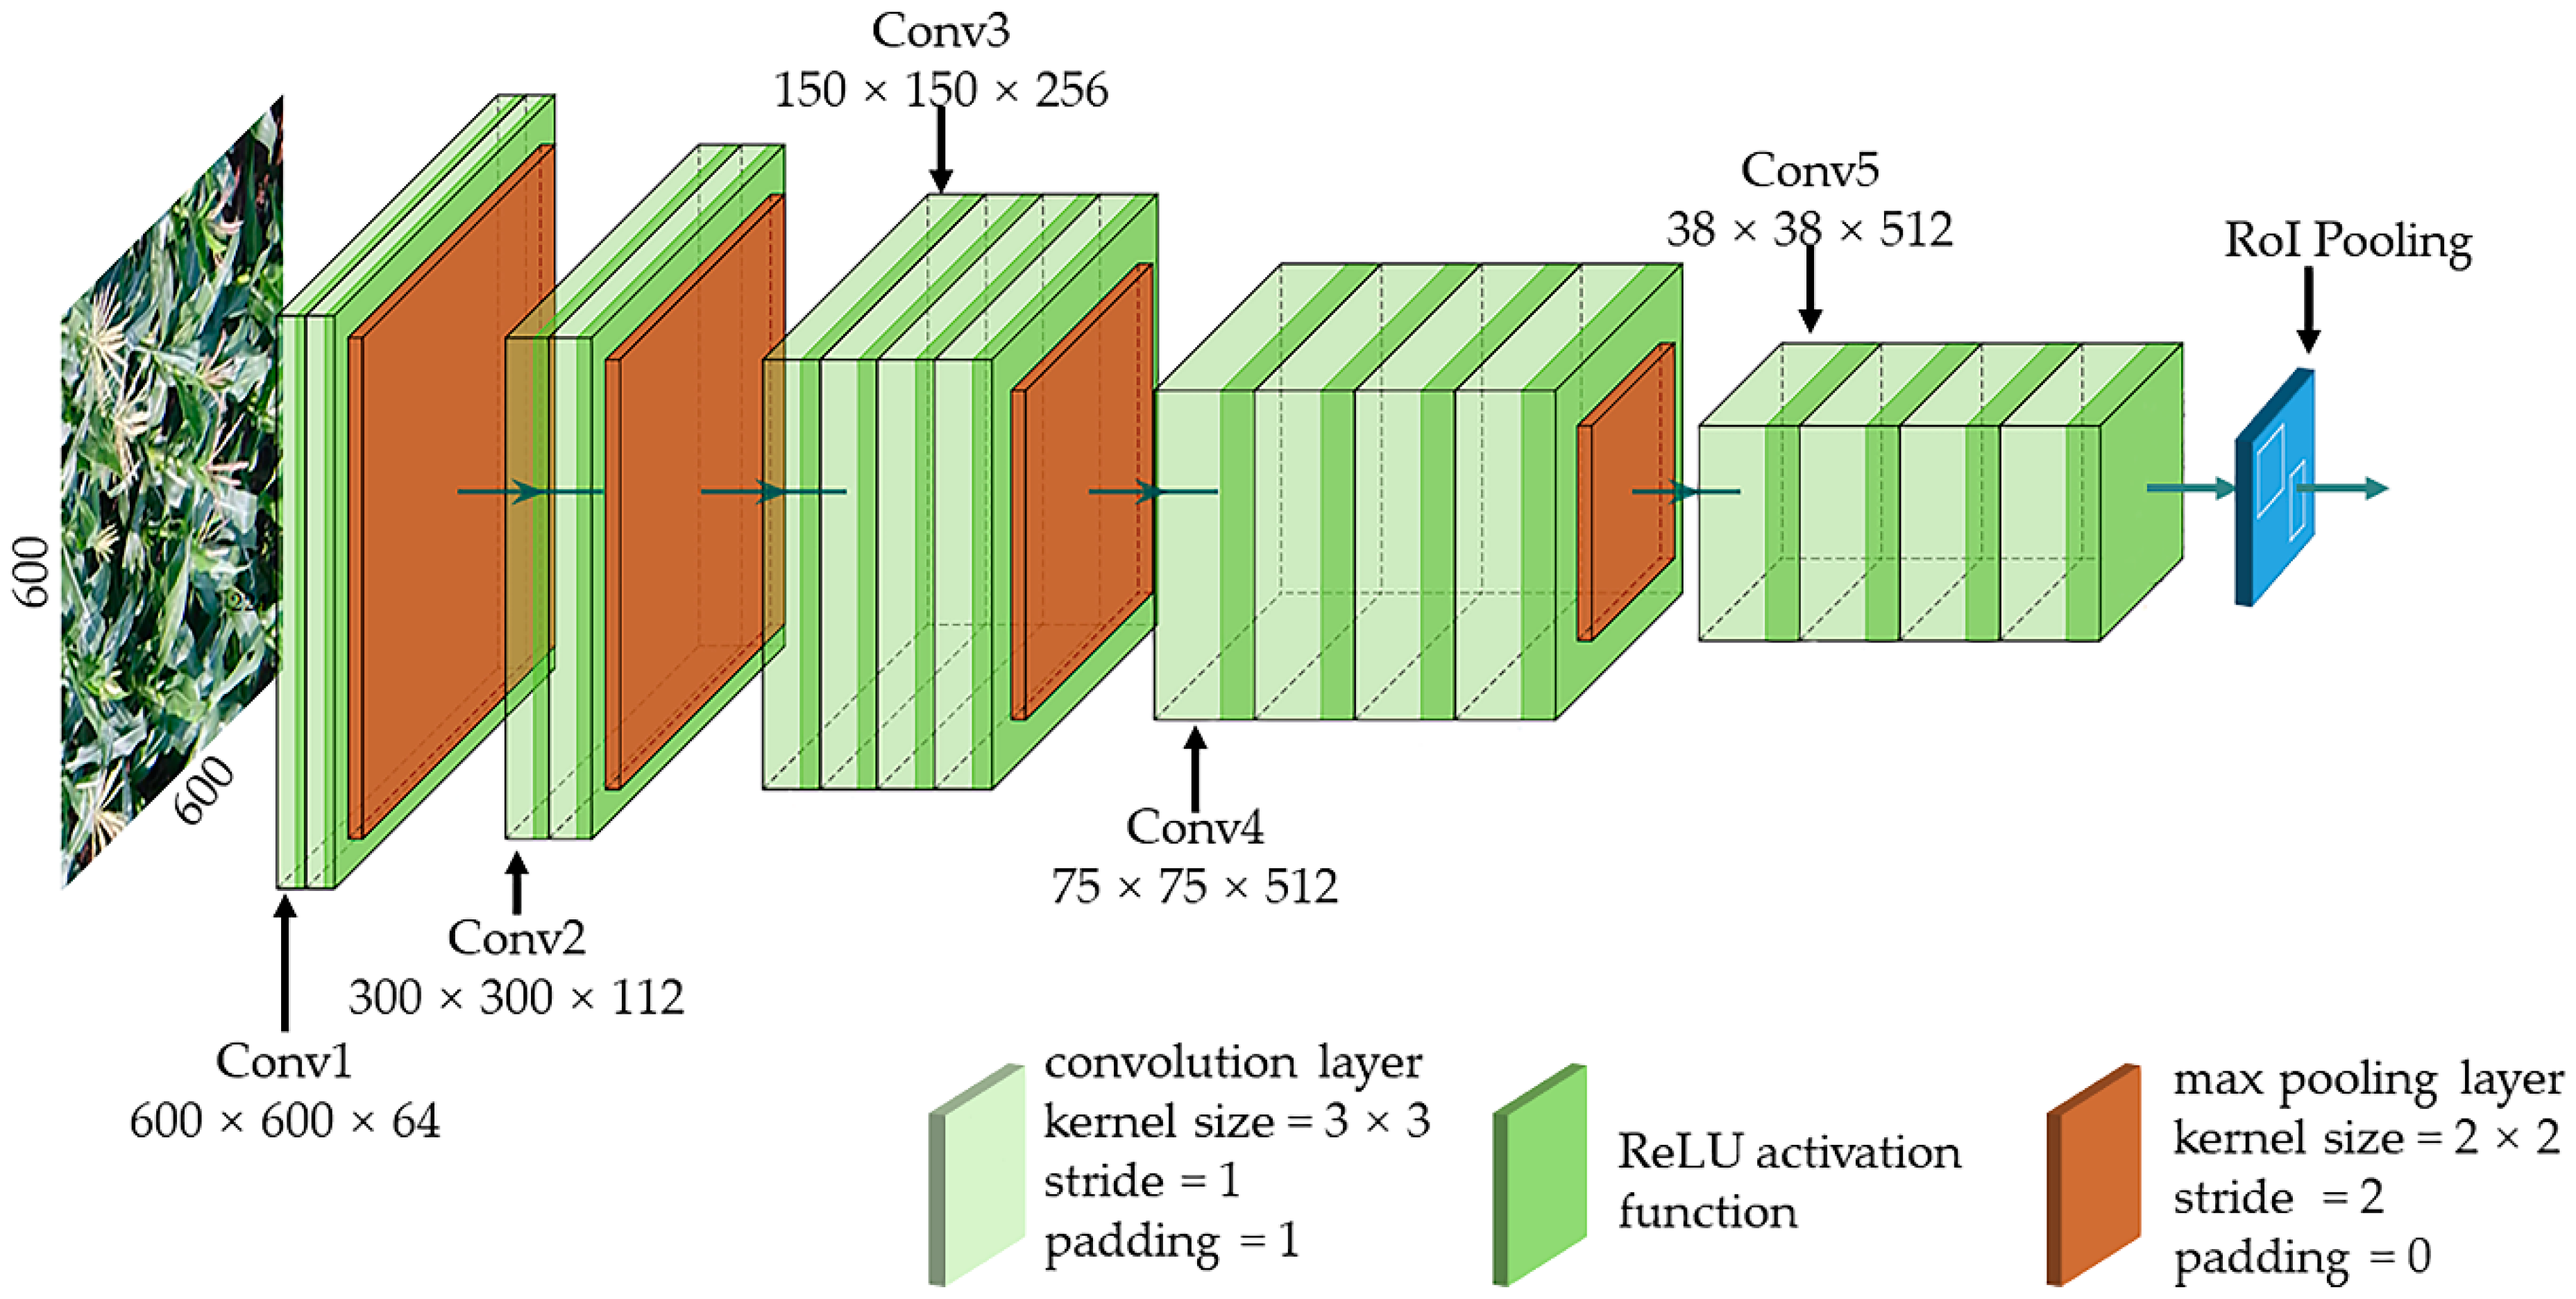
The visual geometry group neural network (VGGNet) was developed by the Visual Geometry Group at Oxford University. In 2014, VGGNet won the ImageNet Large Scale Visual Recognition Challenge (ILSVRC) classification task [31]. Consequently, researchers have referred to the VGGNet’s classic ideas to design advanced classification models. The idea of a 3 × 3 convolution kernel is the basis of the subsequent models. Typical models are VGG16 and VGG19, which differed in the number of convolution layers. The default pixel size of the input image is 224 × 224 for the VGG19 model. However, the input image size was 600 × 600 in our experiment. Then, the image is followed by five convolution-pooling activation layers. We adopted the default VGG19 network structure except the Max pooling layer of the fifth convolution, in order to keep more information in feature maps [16], as shown in Figure 5. In order to avoid overfitting by the network model, a regularization or dropout layer was added after each layer of the convolution-pooling layer [32].
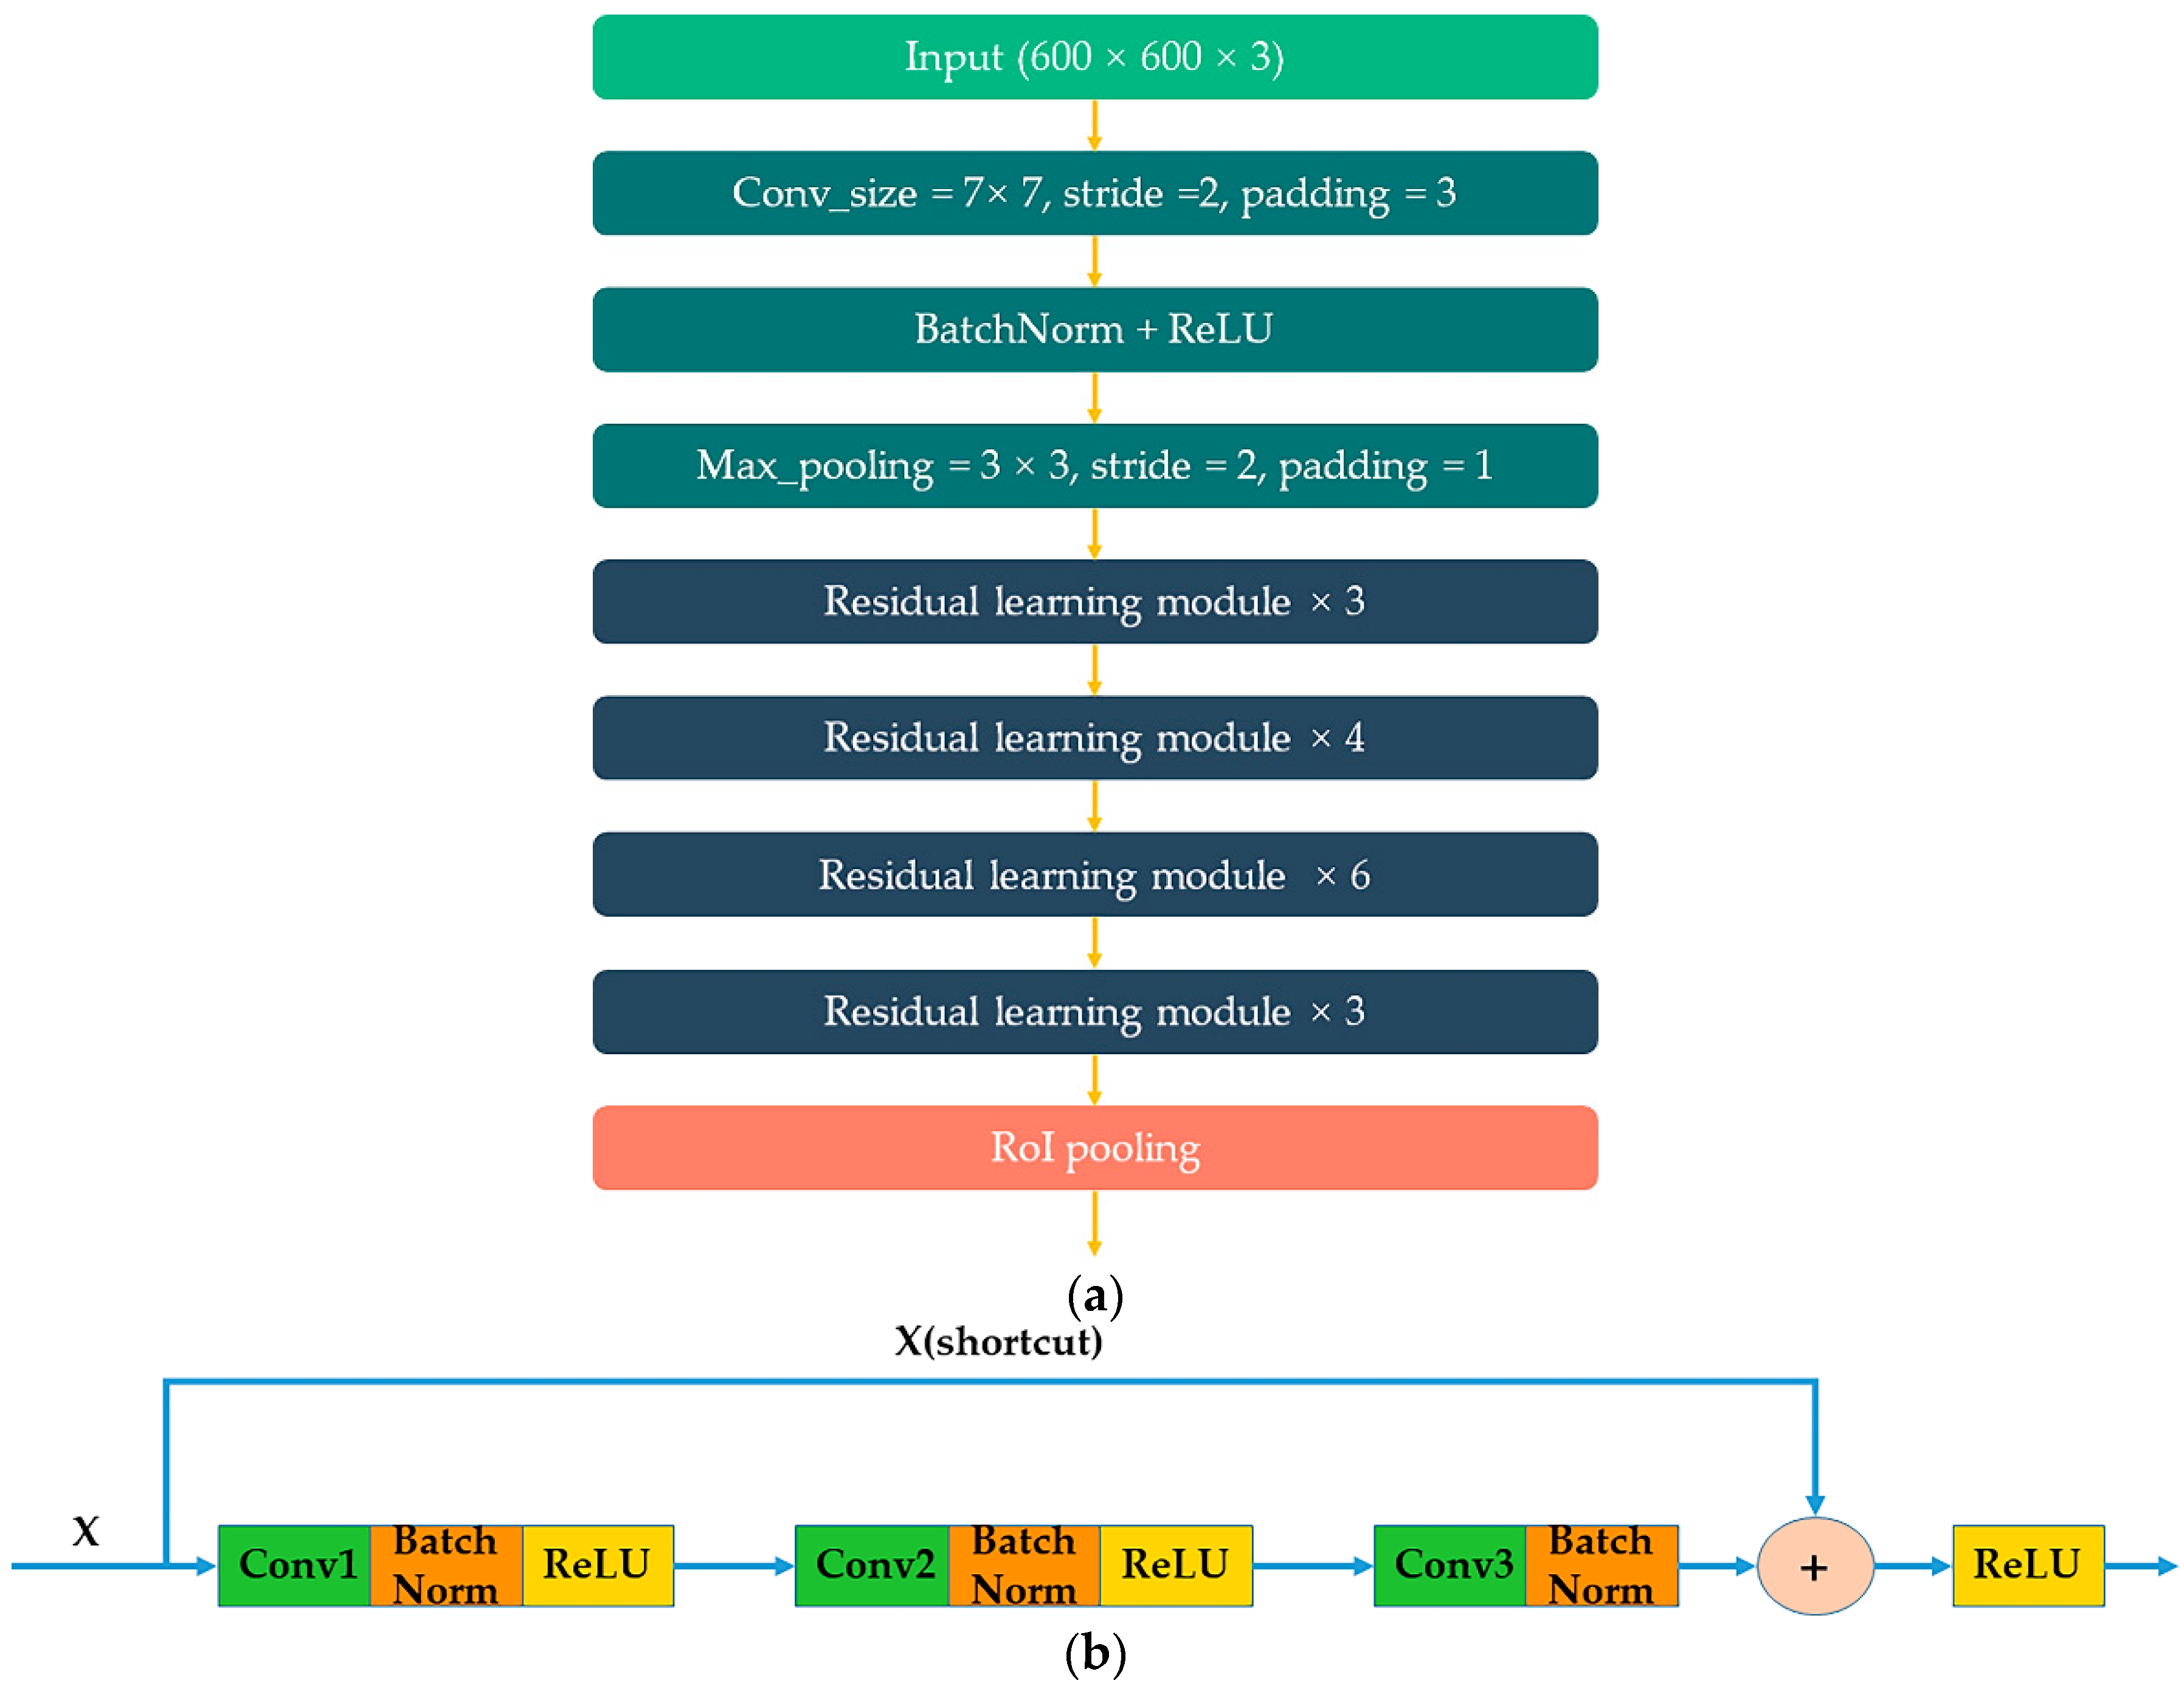
The residual neural network (ResNet) was proposed by the Microsoft Research Institute and won the championship at the 2015 ILSVRC competition. ResNet18, ResNet34, ResNet50, ResNet101, and ResNet152 were designed in [23]. The structure of ResNet50 is shown in Figure 6a. The main idea of ResNet is to add a direct connection channel to the network and to propose residual to learn the differences among the neural network layers. Traditional convolution networks or fully connected networks probably result in information loss, and thus cause gradient disappearance or explosions during deep network training. Therefore, the ResNet solved this problem by means of directly bypassing the input information to the output. The residual learning model of ResNet has two branches as shown in Figure 6b. One branch is the “X” which is processed using three convolution layers, batch normalization, and the ReLU layer, and another branch is processed with a shortcut. After integration of the two branches using feature maps fusion, the entire network only needs to learn the differences between input and output with a simplification of the learning objectives and difficulty. We adopted ResNet50, ResNet101, and ResNet152 as feature map extraction in Faster R-CNN.
In order to achieve better training results and reduce the running time, we used the weight parameters from ImageNet’s pretraining model. The model iteration was set to 200, and the number of trainings per iteration was 1000. The learning rate was set to 0.0001. We adopted the standard stochastic gradient descent method as the optimized network parameters. Our initial network weights were adopted from [33].
Location regression loss and classification loss function for an image are referenced from [21] as follows:
where Ncls, Nloc, and α represent the loss parameter which are 256, 2400, and 10, respectively. Here, i represents the index of an anchor in a mini batch.
where represents predicted probability. If anchor is a positive sample, is 1. Otherwise, is 0.
where x, y are center point coordinates of the box; w, h are the width and height of the box; , , represent the predicted box, anchor box, and ground-truth box, respectively.
2.3. Model Evaluation
Our model was implemented using the Keras framework on the Window10 Professional operation system with Inter Core i7-7800X and a GTX1080ti GPU. The evaluation methods were mainly based on the challenges of pattern analysis, statistical modeling and computational learning. For each image, the detection model returned a set of regression boxes with a confidence score between zero and one. The predicted bounding box had the same format as the real bounding box: {Xmin, Ymin, Xmax, Ymax}.
The intersection over union (IoU) is commonly used for evaluation of the model performance. The formula of IoU is as follows:
The model detection bounding boxes are calculated. If the real box and the detection bounding box match exactly, the value of IoU is one. The threshold value is set to 0.5. If the value of IoU exceeds the threshold, the detection object is considered correct. The correct tests are marked as true positive (TP), while the other tests are considered as false positives (FP). The value of average precision (AP) is the area enclosed by the accuracy rate, the recall rate curve and the coordinate axis. The test model evaluated all test datasets, with the accuracy and recall rates as follow:
where TP, FP, and FN are the numbers of true positives, false positives, and false negatives detected for each image. High accuracy means fewer false positives. A high recall rate means that most of the targets can be detected.
3. Results and Discussion
3.1. Comparisons between Different Feature Extraction Networks
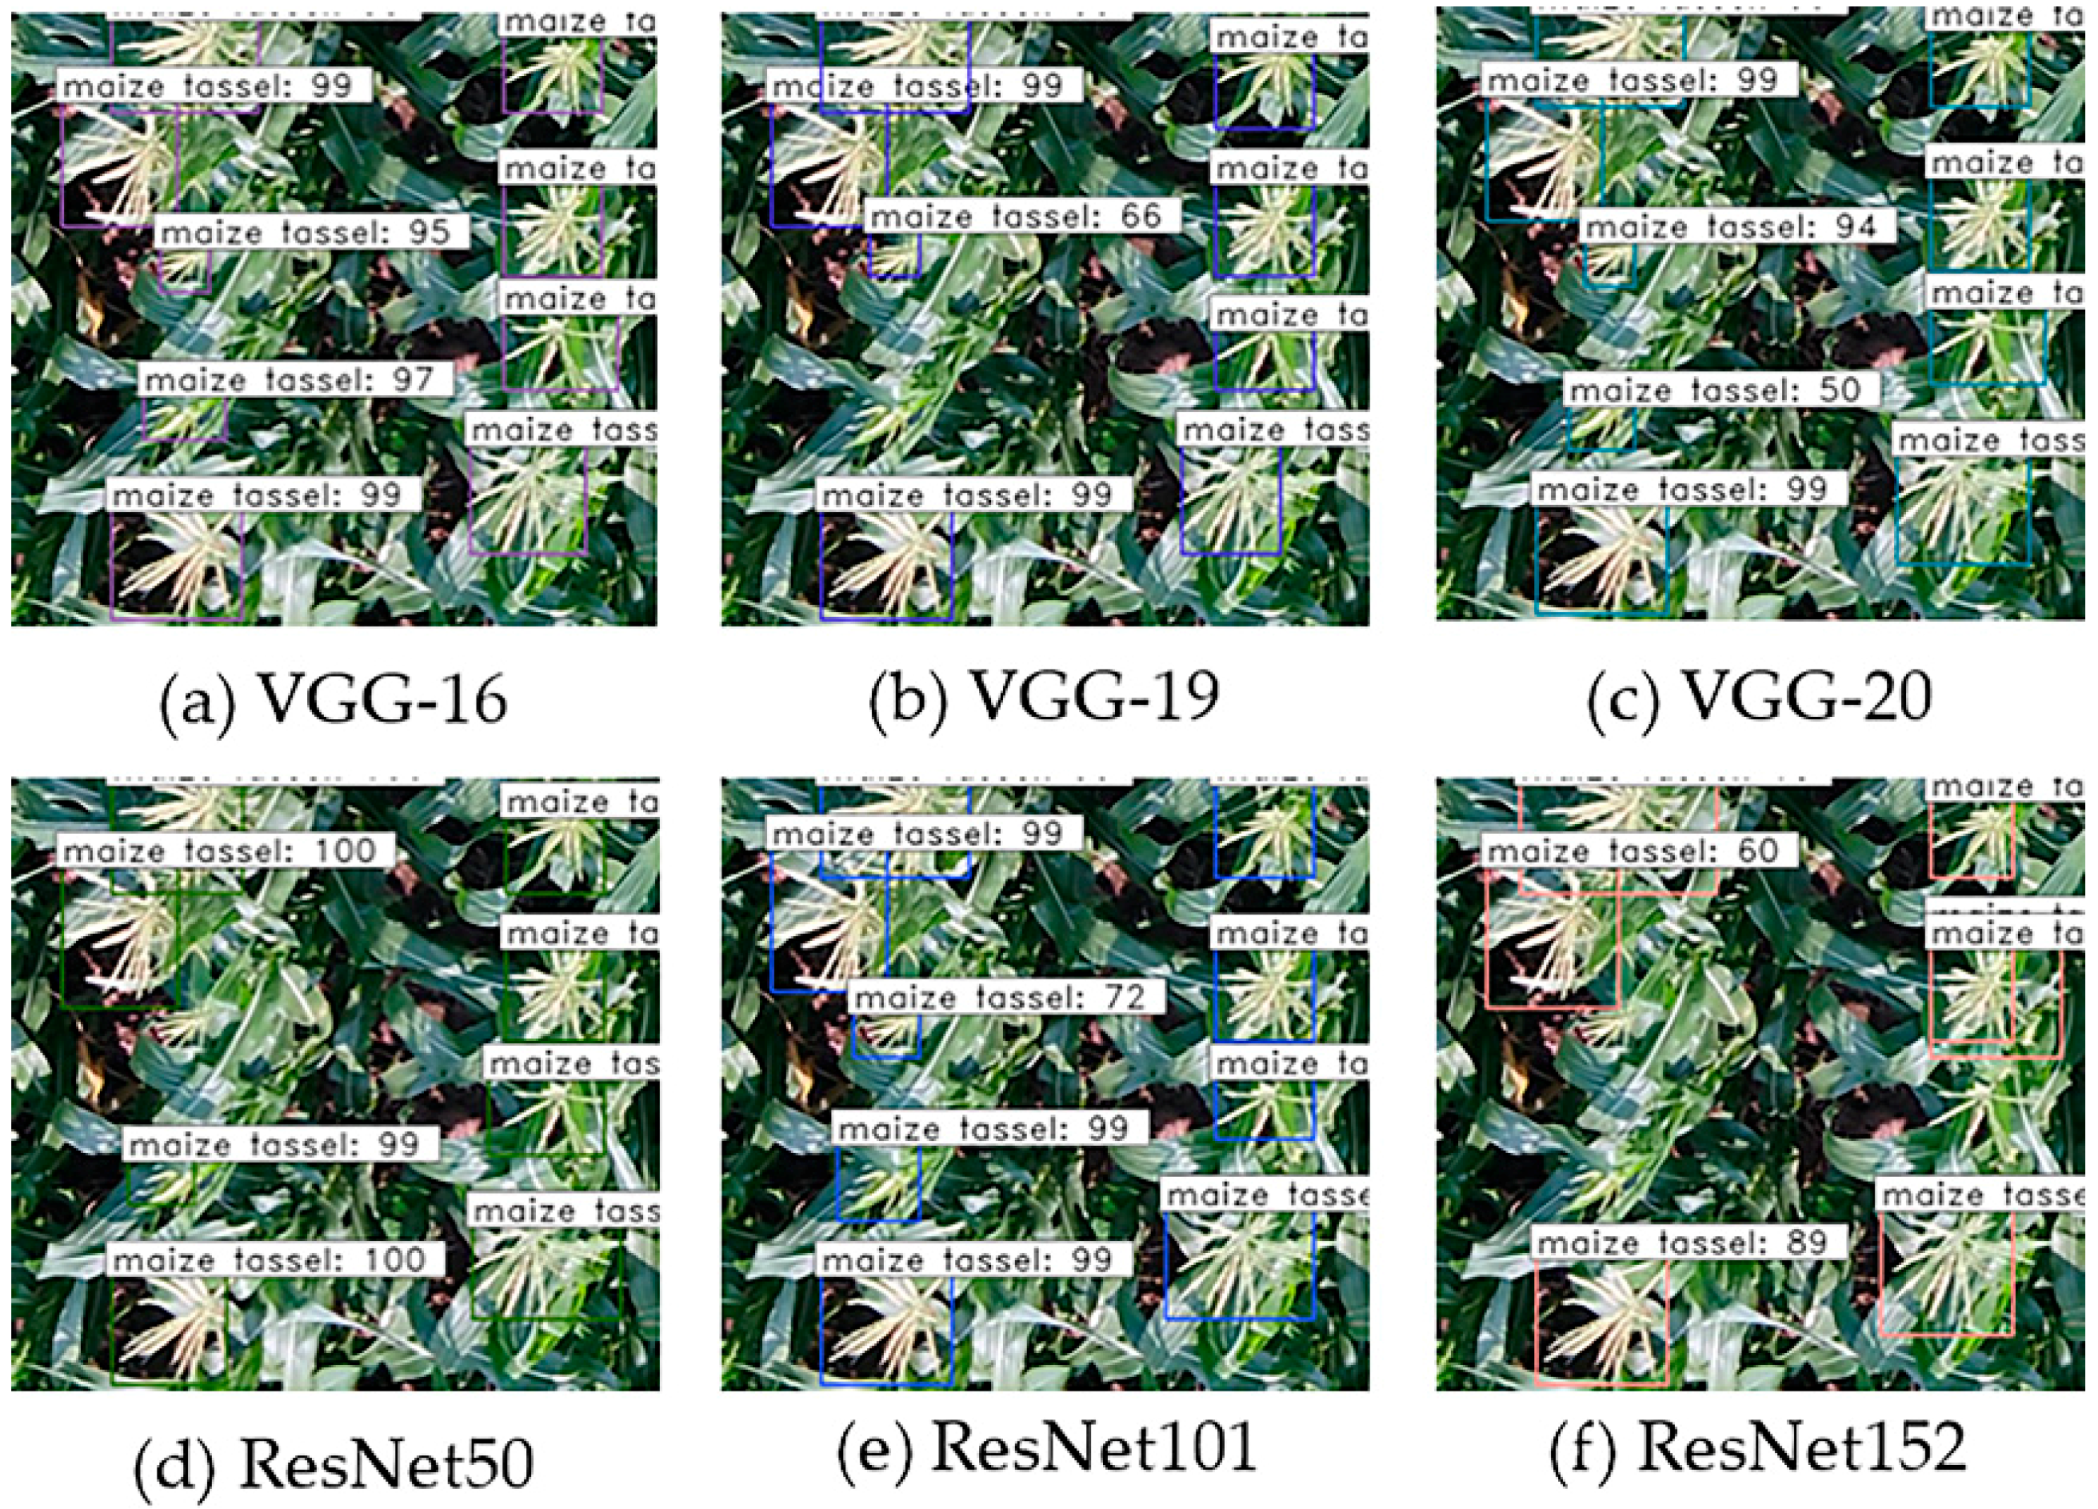
In the Faster R-CNN, different feature extraction networks lead to different performances of the final object detection [34]. VGGNet and ResNet performed well in classification of the remote sensing images [35,36]. Therefore, VGGNet and ResNet were used as the feature extraction networks in this study. We employed VGG16, VGG19, and VGG20 separately, and we also used ResNet50, ResNet101, and ResNet152 which have more depth in the neural network layers. The final results are shown in Figure 7 and Table 1. The “maize tassel: 99” means 99% probability that the object in the bounding box belongs to a maize tassel. The results demonstrated that ResNet101 was the best for maize tassel detection, with an AP of 94.99%. Furthermore, higher accuracy was obtained with ResNet (ResNet50, ResNet101, ResNet152) as compared with VGGNet (VGG16, VGG19, VGG20). Ren et al. [37] also showed that the ResNet model has the capacity to perform better than VGGNet. The loss drop curve is shown in Figure 8.
3.2. Comparison between Different Anchor Sizes
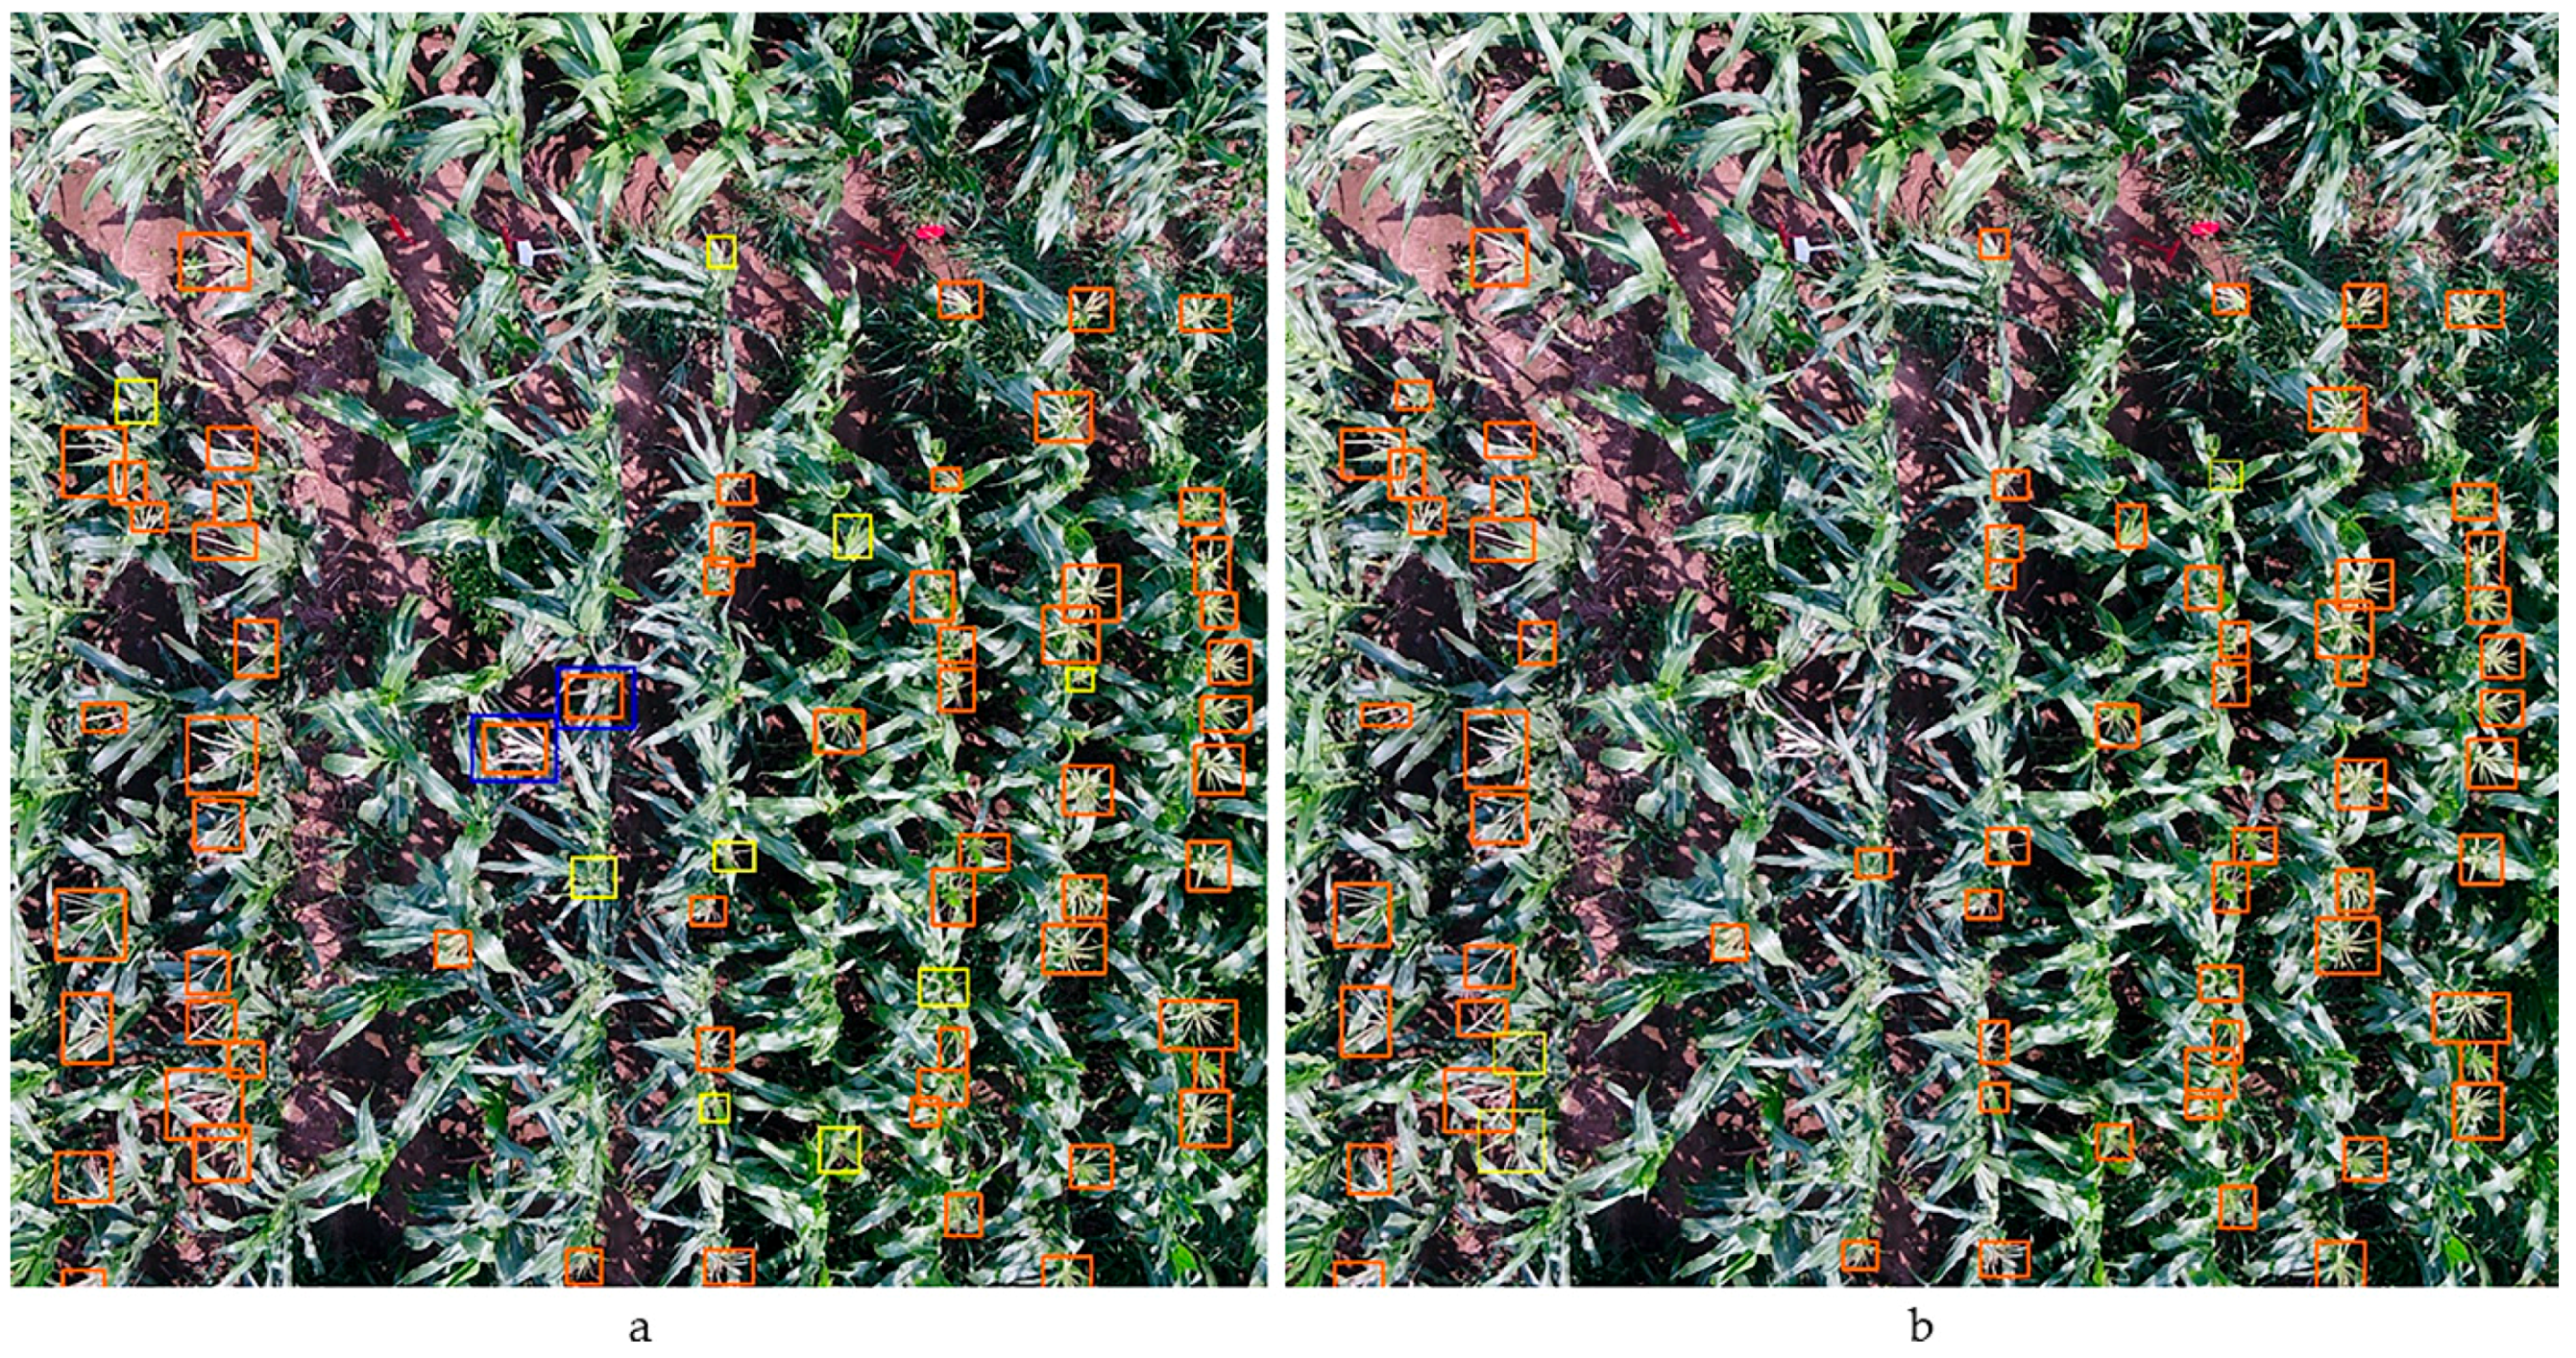
Here, ResNet was used as the feature extraction network to detect tassels in the original UAV images with a resolution of 5280 × 2970 because of its better performance. Figure 9 shows the model performances with different anchor sizes. It can be seen that 61 maize tassels were detected with the default anchor size, characterized by the red boxes in Figure 9a. Two recognition errors were found which mistook the decaying maize leaves as tassels and are recorded with blue boxes in Figure 9a. Nine small maize tassels were not detected with the default anchor size. We recorded these missed tassels with yellow boxes in Figure 9a. In Figure 9b, only three maize tassels were not detected with the modified anchor size. Generalized in Table 2, the modified anchor size can improve the accuracy of maize tassel detection, especially for the small tassels.
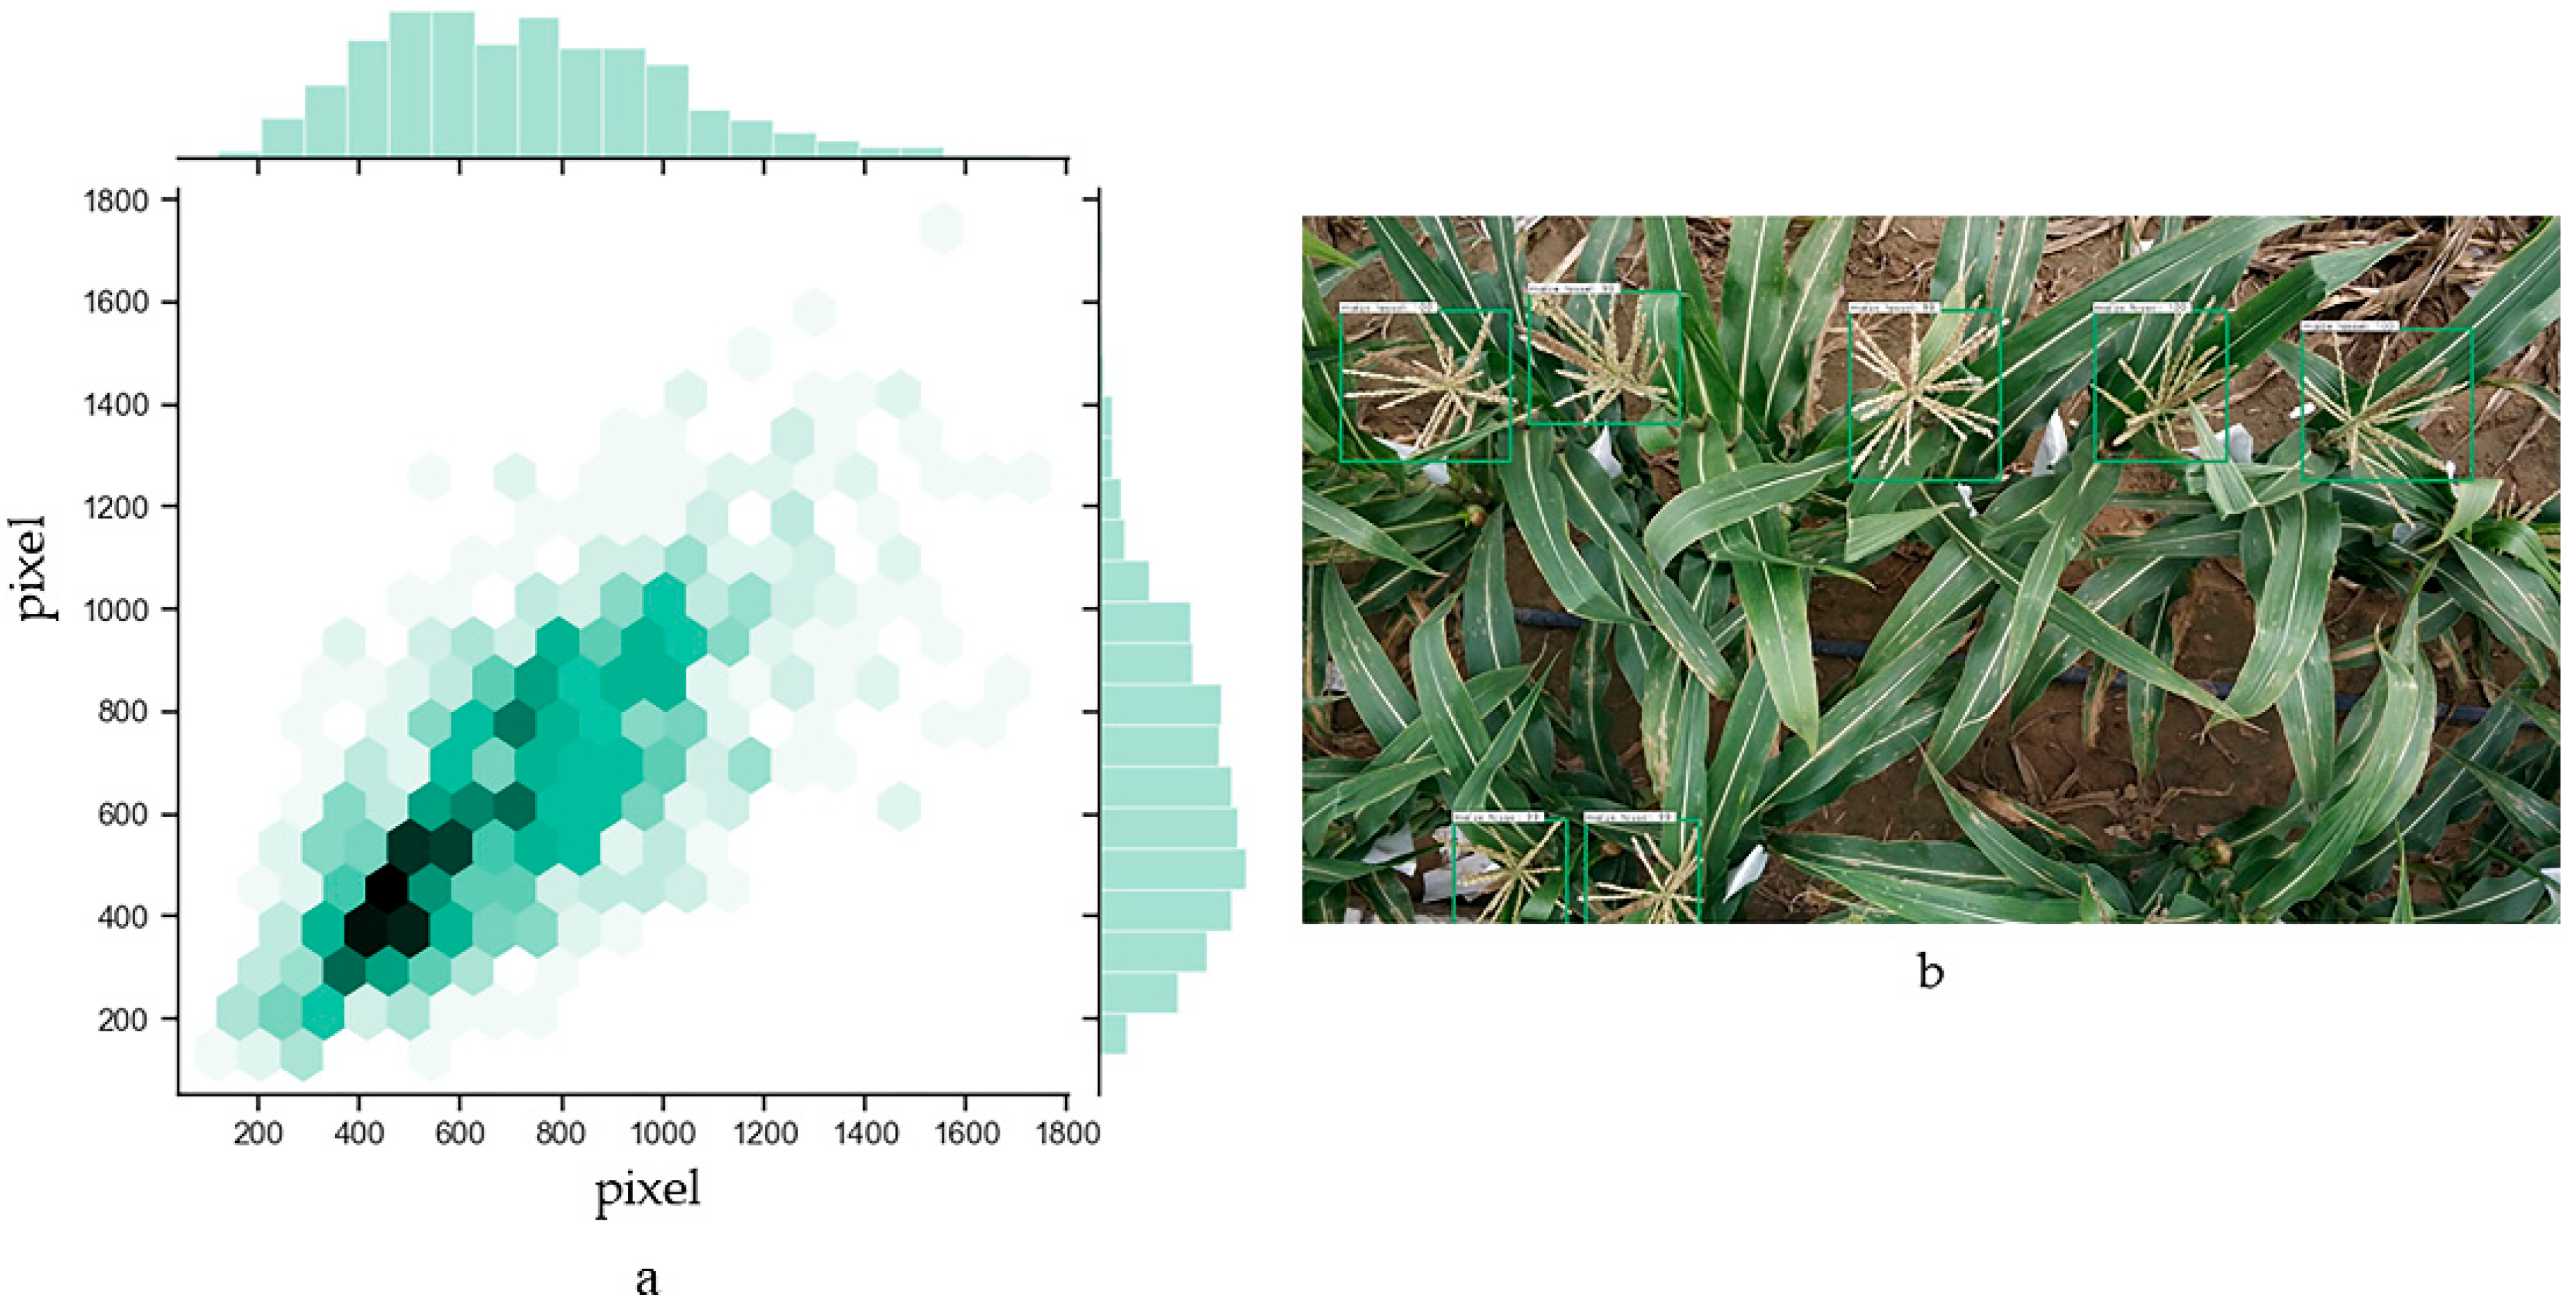
We tested the generalization of model performance with independent images collected by mobile phone, as shown in Figure 1. The pixel size of the maize tassel, here, was between 400 dpi and 1000 dpi, as shown in Figure 10a. In order to fit the range of modified anchor size, we resized the original image of the Shangzhuang experimental farm from 4000 × 2250 to 1066 × 600 resolution. Then, we used ResNet101 as the feature extraction network. The anchor value was [852, 1282, 2562], and the AP value could be up to 95.92%.
3.3. Comparison with TasselNet
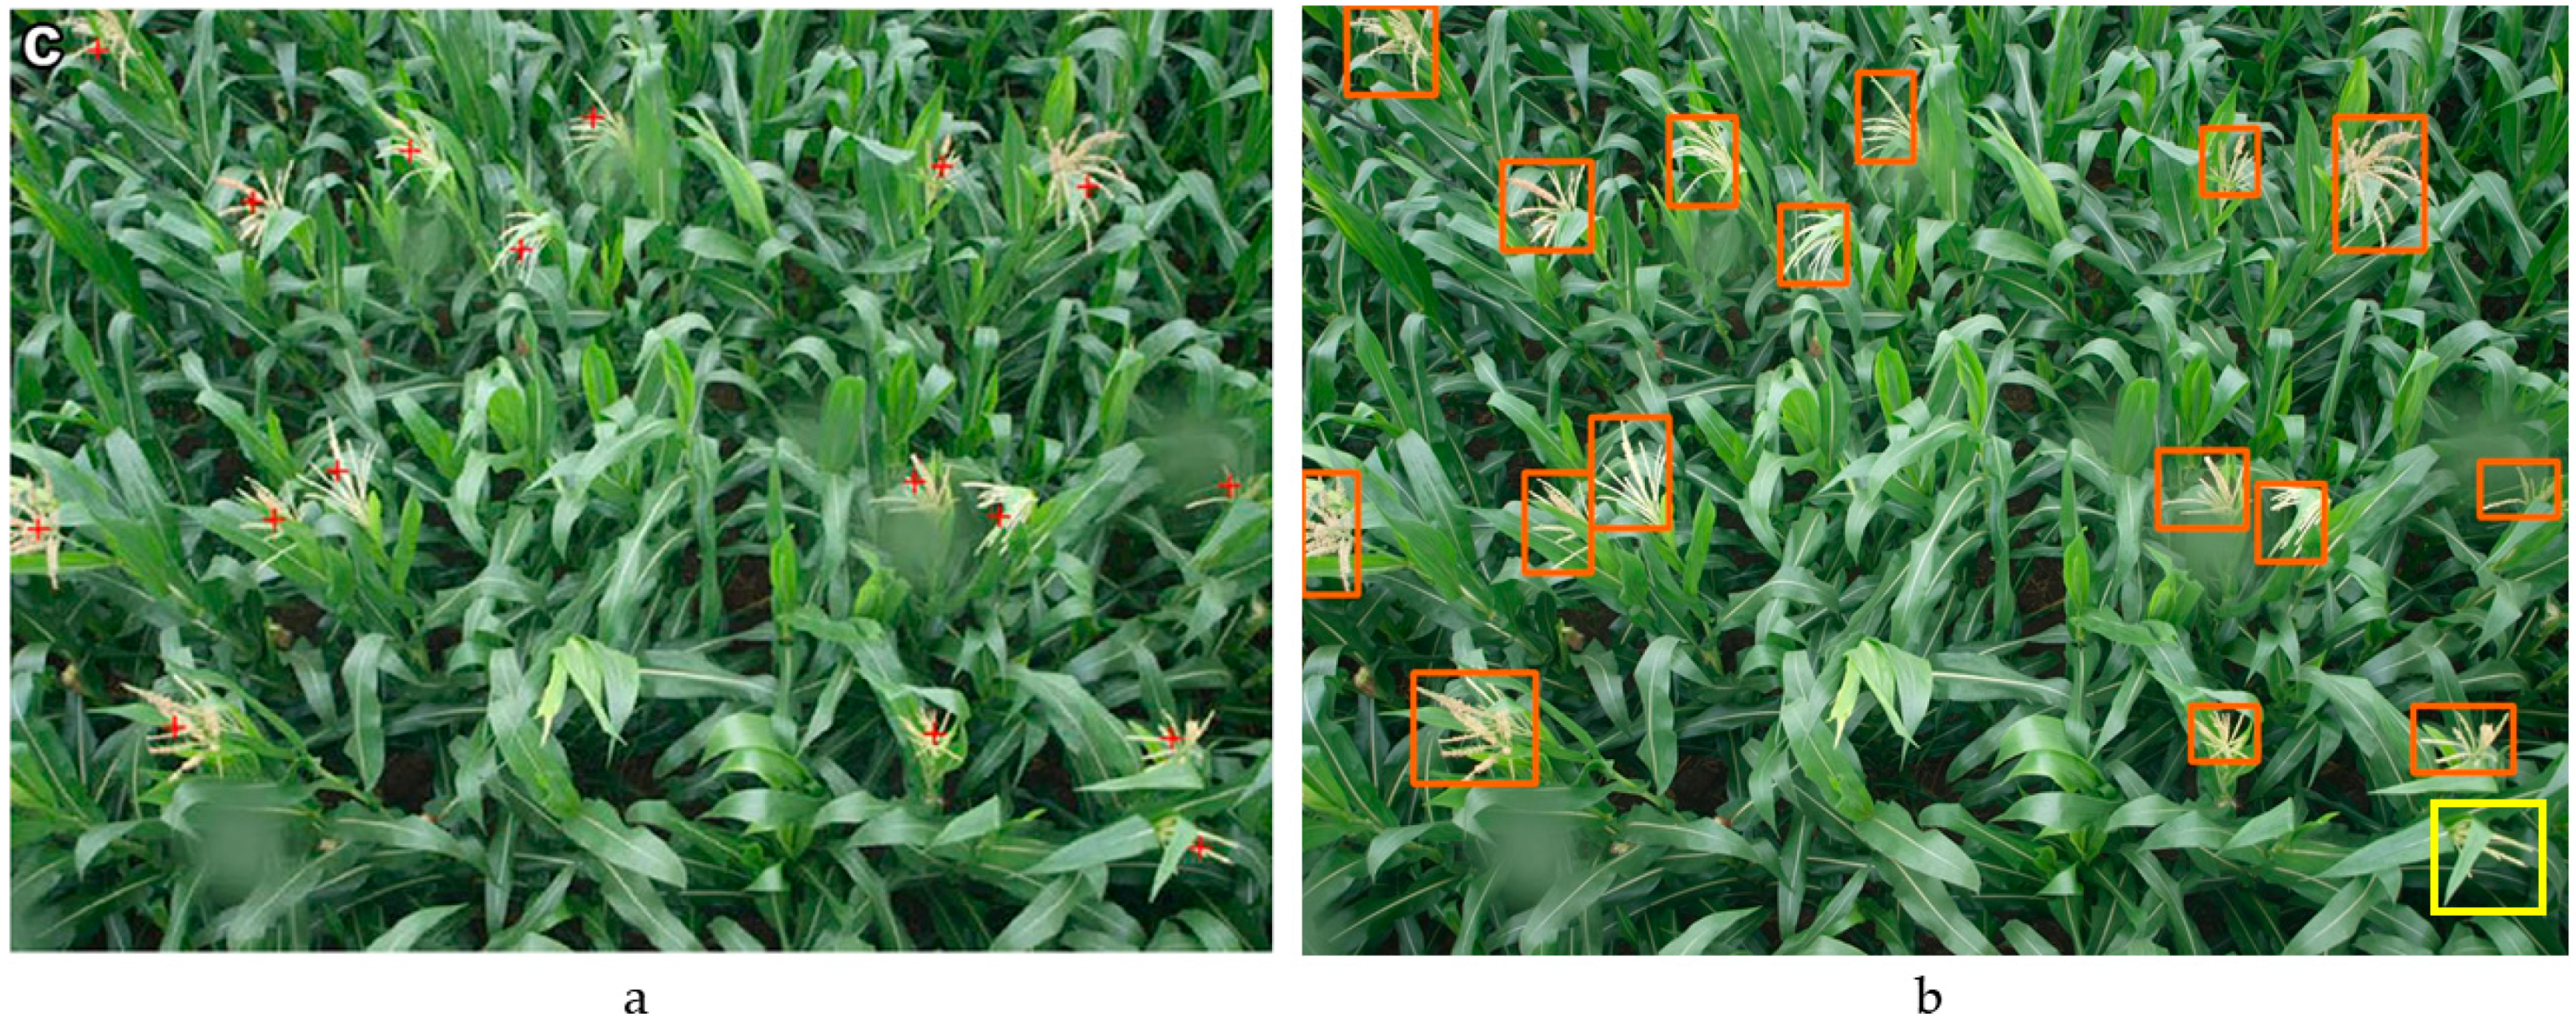
Lu et al. [7] proposed TasselNet to count maize tassels with LeNet [38], AlexNet [39], and VGGNet16 [22] as the feature extraction network. After merging and normalizing the local counts, TasselNet can output maize tassel numbers. They released the Maize Tassel Counting (MTC) dataset to draw attention from practitioners working in related fields. Therefore, we tested the MTC dataset with ResNet101 in our Faster R-CNN and the results are shown in Figure 11. There was a 1.4 difference for average tassel number detection between these two models based on a comparison with 40 images. Our Faster R-CNN did not perform better than TasselNet for detecting maize tassels. As shown in Figure 11b, tassels seriously blocked by leaves were not detected by our Faster R-CNN. It should be emphasized that we tested MTC images in our model without training their dataset. This can further validate the generalization of our Faster R-CNN. In the future, we could adopt other recently developed networks [40,41,42] to improve detection accuracy and extract the size and color of individual tassel’s traits by combining with the semantic segmentation algorithm [43,44].
4. Conclusions
The aim of our current research was to evaluate the accuracy of detecting the maize tassels using a modified Faster R-CNN algorithm with different resolution images collected by UAV, mobile phone, and from an independent dataset. We found that ResNet, as the feature extraction network, was better than VGGNet for detecting maize tassels from UAV images with 600 × 600 resolution. The AP values differed from 87.94% to 91.51% using VGGNet and from 91.99% to 94.99% using ResNet. Then, we used ResNet to detect tassels from UAV images with 5280 × 2970 resolution. The AP values were from 86.46% to 87.27%. In order to better detect the small objects in one image with 5280 × 2970 resolution obtained by UAV, we modified the anchor size in the region proposal network to improve detection accuracy. The AP values were improved from 87.82% to 89.96%. The AP value could reach up to 95.95% with images obtained using a mobile phone by resizing the images. Then, we compared our modified model with TasselNet using an independent MTC dataset. The average difference of tassel number was 1.4 between the two methods based on a comparison with 40 images. It took fifty minutes to obtain 485 maize images with 5280 × 2970 resolution with UAV in a 10,500 m2 field. We annotated the training dataset for two weeks. It took one day to train each model. It would take more than five persons to complete the survey within one day, for the whole field, Furthermore, different people would have different evaluation criteria which could result in bias. In the future, we could enlarge our image datasets collected by UAV at different heights and different time series to further improve the performance of the models and calculate other phenotypic traits.
Author Contributions
Y.C. collected the dataset; C.C. designed the experimental process and drafted the article; R.K. and Y.M. (Yan Ma) prepared the visualization of the experimental figure; Y.M. (Yuntao Ma) and Y.L. revised the article. All authors have read and agree to the published version of the manuscript.
Funding
This work was supported by The National Key Research and Development Plan: High- Efficient Ground and Aerial Spraying Technology and Intelligent Equipment (grant no. 2016YFD0200700). The authors also thank the College of Information and Electrical Engineering of China Agricultural University for providing the high- performance computing platform.
Acknowledgments
The authors would like to acknowledge the anonymous reviewers for valuable comments and members of the editorial team for proof carefully.
Conflicts of Interest
The authors declared that there is no conflict of interest.
References
- Gomes da Silva, F.J.; Gouveia, R.M. Sustainable Consumption. In Cleaner Production; Springer: Cham, Switzerland, 2019; pp. 77–128. [Google Scholar]
- Huang, J.; Gómez-Dans, J.L.; Huang, H.; Ma, H.; Wu, Q.; Lewis, P.E.; Liang, S.; Chen, Z.; Xue, J.; Wu, Y.; et al. Assimilation of remote sensing into crop growth models: Current status and perspectives. Agric. For. Meteorol. 2019, 276–277, 107609. [Google Scholar] [CrossRef]
- Sadeghi-Tehran, P.; Virlet, N.; Ampe, E.M.; Reyns, P.; Hawkesford, M.J. DeepCount: In-Field Automatic Quantification of Wheat Spikes Using Simple Linear Iterative Clustering and Deep Convolutional Neural Networks. Front. Plant Sci. 2019, 10, 1176. [Google Scholar] [CrossRef] [PubMed]
- Lu, H.; Cao, Z.; Xiao, Y.; Fang, Z.; Zhu, Y.; Xian, K. Fine-grained maize tassel trait characterization with multi-view representations. Comput. Electron. Agric. 2015, 118, 143–158. [Google Scholar] [CrossRef]
- Korir, N.K.; Han, J.; Shangguan, L.; Wang, C.; Kayesh, E.; Zhang, Y.; Fang, J. Plant variety and cultivar identification: Advances and prospects. Crit. Rev. Biotechnol. 2013, 33, 111–125. [Google Scholar] [CrossRef] [PubMed]
- Kurtulmuş, F.; Kavdir, I. Detecting corn tassels using computer vision and support vector machines. Expert Syst. Appl. 2014, 41, 7390–7397. [Google Scholar] [CrossRef]
- Lu, H.; Cao, Z.; Xiao, Y.; Zhuang, B.; Shen, C. TasselNet: Counting maize tassels in the wild via local counts regression network. Plant Methods 2017, 13, 79. [Google Scholar] [CrossRef] [Green Version]
- Ha, J.G.; Moon, H.; Kwak, J.T.; Hassan, S.I.; Dang, M.; Lee, O.N.; Park, H.Y. Deep convolutional neural network for classifying Fusarium wilt of radish from unmanned aerial vehicles. J. Appl. Remote Sens. 2017, 11, 042621. [Google Scholar] [CrossRef]
- Bendig, J.; Yu, K.; Aasen, H.; Bolten, A.; Bennertz, S.; Broscheit, J.; Gnyp, M.L.; Bareth, G. Combining UAV-based plant height from crop surface models, visible, and near infrared vegetation indices for biomass monitoring in barley. Int. J. Appl. Earth Obs. Geoinform. 2015, 39, 79–87. [Google Scholar] [CrossRef]
- Santos, A.A.D.; Marcato Junior, J.; Araújo, M.S.; Di Martini, D.R.; Tetila, E.C.; Siqueira, H.L.; Aoki, C.; Eltner, A.; Matsubara, E.T.; Pistori, H. Assessment of CNN-Based Methods for Individual Tree Detection on Images Captured by RGB Cameras Attached to UAVs. Sensors 2019, 19, 3595. [Google Scholar] [CrossRef] [Green Version]
- Wang, X.; Zhang, R.; Song, W.; Han, L.; Liu, X.; Sun, X.; Luo, M.; Chen, K.; Zhang, Y.; Yang, H. Dynamic plant height QTL revealed in maize through remote sensing phenotyping using a high-throughput unmanned aerial vehicle (UAV). Sci. Rep. UK 2019, 9, 3458. [Google Scholar] [CrossRef] [Green Version]
- Hu, P.; Chapman, S.C.; Wang, X.; Potgieter, A.; Duan, T.; Jordan, D.; Guo, Y.; Zheng, B. Estimation of plant height using a high throughput phenotyping platform based on unmanned aerial vehicle and self-calibration: Example for sorghum breeding. Eur. J. Agron. 2018, 95, 24–32. [Google Scholar] [CrossRef]
- Madec, S.; Baret, F.; de Solan, B.; Thomas, S.; Dutartre, D.; Jezequel, S.; Hemmerlé, M.; Colombeau, G.; Comar, A. High-Throughput Phenotyping of Plant Height: Comparing Unmanned Aerial Vehicles and Ground LiDAR Estimates. Front. Plant Sci. 2017, 8, 2002. [Google Scholar] [CrossRef] [PubMed] [Green Version]
- Zhou, C.; Liang, D.; Yang, X.; Xu, B.; Yang, G. Recognition of Wheat Spike from Field Based Phenotype Platform Using Multi-Sensor Fusion and Improved Maximum Entropy Segmentation Algorithms. Remote Sens. 2018, 10, 246. [Google Scholar] [CrossRef] [Green Version]
- Gnädinger, F.; Schmidhalter, U. Digital Counts of Maize Plants by Unmanned Aerial Vehicles (UAVs). Remote Sens. 2017, 9, 544. [Google Scholar] [CrossRef] [Green Version]
- Quan, L.; Feng, H.; Lv, Y.; Wang, Q.; Zhang, C.; Liu, J.; Yuan, Z. Maize seedling detection under different growth stages and complex field environments based on an improved Faster R–CNN. Biosyst. Eng. 2019, 184, 1–23. [Google Scholar] [CrossRef]
- Yeom, J.; Jung, J.; Chang, A.; Maeda, M.; Landivar, J. Automated Open Cotton Boll Detection for Yield Estimation Using Unmanned Aircraft Vehicle (UAV) Data. Remote Sens. 2018, 10, 1895. [Google Scholar] [CrossRef] [Green Version]
- Herrmann, I.; Bdolach, E.; Montekyo, Y.; Rachmilevitch, S.; Townsend, P.A.; Karnieli, A. Assessment of maize yield and phenology by drone-mounted superspectral camera. Precis. Agric. 2019, 1–26. [Google Scholar] [CrossRef]
- Kumar, A.; Taparia, M.; Rajalakshmi, P.; Desai, U.B.; Naik, B.; Guo, W. UAV Based Remote Sensing for Tassel Detection and Growth Stage Estimation of Maize Crop using F-RCNN. In Proceedings of the Computer Vision Problems in Plant Phenotyping, Long Beach, CA, USA, 17 June 2019. [Google Scholar]
- Madec, S.; Jin, X.; Lu, H.; De Solan, B.; Liu, S.; Duyme, F.; Heritier, E.; Baret, F. Ear density estimation from high resolution RGB imagery using deep learning technique. Agric. For. Meteorol. 2019, 264, 225–234. [Google Scholar] [CrossRef]
- Ren, S.; He, K.; Girshick, R.; Sun, J. Faster R-CNN: Towards Real-Time Object Detection with Region Proposal Networks. arXiv 2015, arXiv:1506.01497. [Google Scholar] [CrossRef] [Green Version]
- Simonyan, K.; Zisserman, A. Very Deep Convolutional Networks for Large-Scale Image Recognition. arXiv 2014, arXiv:1409.1556. [Google Scholar]
- He, K.; Zhang, X.; Ren, S.; Sun, J. Deep Residual Learning for Image Recognition. arXiv 2015, arXiv:1512.03385. [Google Scholar]
- Szegedy, C.; Liu, W.; Jia, Y.; Sermanet, P.; Reed, S.; Anguelov, D.; Erhan, D.; Vanhoucke, V.; Rabinovich, A. Going deeper with convolutions. arXiv 2014, arXiv:1409.4842. [Google Scholar]
- Iandola, F.N.; Han, S.; Moskewicz, M.W.; Ashraf, K.; Dally, W.J.; Keutzer, K. SqueezeNet: AlexNet-level accuracy with 50x fewer parameters and <0.5 MB model size. arXiv 2016, arXiv:1602.07360. [Google Scholar]
- Redmon, J.; Divvala, S.; Girshick, R.; Farhadi, A. You only look once: Unified, real-time object detection. In Proceedings of the IEEE Conference on Computer Vision and Pattern Recognition (CVPR), Las Vegas, NV, USA, 26 June–1 July 2016; pp. 779–788. [Google Scholar]
- LabelImg. Available online: https://github.com/tzutalin/labelImg (accessed on 25 December 2015).
- Dalal, N.; Triggs, B. Histograms of oriented gradients for human detection. In Proceedings of the 2005 IEEE Computer Society Conference on Computer Vision and Pattern Recognition (CVPR), San Diego, CA, USA, 20–25 June 2005. [Google Scholar]
- Lowe, D.G. Distinctive image features from scale-invariant keypoints. Int. J. Comput. Vision 2004, 60, 91–110. [Google Scholar] [CrossRef]
- Ren, Y.; Zhu, C.; Xiao, S. Small Object Detection in Optical Remote Sensing Images via Modified Faster R-CNN. Appl. Sci. 2018, 8, 813. [Google Scholar] [CrossRef] [Green Version]
- Deng, J.; Dong, W.; Socher, R.; Li, L.; Li, K.; Fei-Fei, L. ImageNet: A large-scale hierarchical image database. In Proceedings of the 2009 IEEE Conference on Computer Vision and Pattern Recognition (CVPR), Miami, FL, USA, 20–25 June 2009. [Google Scholar]
- Srivastava, N.; Hinton, G.; Krizhevsky, A.; Sutskever, I.; Salakhutdinov, R. Dropout: A Simple Way to Prevent Neural Networks from Overfitting. J. Mach. Learn. Res. 2014, 15, 1929–1958. [Google Scholar]
- Trained Image Classification Models for Keras. Available online: https://github.com/fchollet/deep-learning-models (accessed on 11 November 2016).
- Han, L.; Yu, C.; Xiao, K.; Zhao, X. A New Method of Mixed Gas Identification Based on a Convolutional Neural Network for Time Series Classification. Sensors 2019, 19, 1960. [Google Scholar] [CrossRef] [Green Version]
- Bazi, Y.; Al Rahhal, M.M.; Alhichri, H.; Alajlan, N. Simple Yet Effective Fine-Tuning of Deep CNNs Using an Auxiliary Classification Loss for Remote Sensing Scene Classification. Remote Sens. 2019, 11, 2908. [Google Scholar] [CrossRef] [Green Version]
- Meng, Z.; Li, L.; Tang, X.; Feng, Z.; Jiao, L.; Liang, M. Multipath Residual Network for Spectral-Spatial Hyperspectral Image Classification. Remote Sens. 2019, 11, 1896. [Google Scholar] [CrossRef] [Green Version]
- Ren, Y.; Zhu, C.; Xiao, S. Object Detection Based on Fast/Faster RCNN Employing Fully Convolutional Architectures. Math. Probl. Eng. 2018, 2018, 3598316. [Google Scholar] [CrossRef] [Green Version]
- Lecun, Y.; Bottou, L.; Bengio, Y.; Haffner, P. Gradient-based learning applied to document recognition. Proc. IEEE 1998, 86, 2278–2324. [Google Scholar] [CrossRef] [Green Version]
- Krizhevsky, A.; Sutskever, I.; Hinton, G. ImageNet classification with deep convolutional neural networks. Commun. ACM 2017, 60, 84–90. [Google Scholar] [CrossRef]
- Howard, A.; Zhu, M.; Chen, B.; Kalenichenko, D.; Wang, W.; Weyand, T.; Andreetto, M.; Adam, H. MobileNets: Efficient Convolutional Neural Networks for Mobile Vision Applications. arXiv 2017, arXiv:1704.04861. [Google Scholar]
- Huang, G.; Liu, Z.; Maaten, L.; Weinberger, K.Q. Densely Connected Convolutional Networks. arXiv 2017, arXiv:1608.06993. [Google Scholar]
- Hu, J.; Shen, L.; Albanie, S.; Sun, G.; Wu, E. Squeeze-and-Excitation Networks. arXiv 2017, arXiv:1709.01507. [Google Scholar]
- Long, J.; Shelhamer, E.; Darrell, T. Fully Convolutional Networks for Semantic Segmentation. arXiv 2015, arXiv:1411.4038. [Google Scholar]
- He, K.; Gkioxari, G.; Dollár, P.; Girshick, R. Mask R-CNN. arXiv 2017, arXiv:1703.06870. [Google Scholar]
Figure 1.
Image datasets were collected at two experimental sites. Images were taken using a mobile phone, 3 m from the ground at the Shangzhuang experimental farm (left). Images were taken using a ZENMUSE X5S camera mounted on a UAV DJI Inspires 2, 15 m from the ground at the Lishu experimental farm (right).

Figure 2.
Bounding boxes of maize tassels interactively drawn using the LabelImg software.

Figure 3.
(a) The algorithm generates feature maps through five shared convolutional layers in a given annotated image. (b) The region proposal network (RPN) determines whether the object is foreground or background and processes the first bounding box regression and (c) these region proposals are classified and corrected after RoI pooling.

Figure 4.
(a) The distribution of pixels in the maize tassel images. (b) The default and modified anchor sizes are colored with orange and green.
Figure 4.
(a) The distribution of pixels in the maize tassel images. (b) The default and modified anchor sizes are colored with orange and green.

Figure 5.
Extracted feature map using VGG19 with 600 × 600 resolution image. Conv represents convolutional neural network.
Figure 5.
Extracted feature map using VGG19 with 600 × 600 resolution image. Conv represents convolutional neural network.

Figure 6.
(a) The structure of residual neural network 50 (ResNet50) and (b) the core structure of the residual learning module in ResNet50. Conv represents convolution neural network, Conv1 and Conv3 kernel size is 3 × 3, Conv2 kernel size is 1 × 1, padding is 1, stride is 1 and activation function is ReLU.

Figure 7.
Probability for maize tassel detection with different feature extraction network models. (a–f) represent feature extraction networks.
Figure 7.
Probability for maize tassel detection with different feature extraction network models. (a–f) represent feature extraction networks.

Figure 8.
The loss curve with different neural networks as feature map extraction in faster region-based convolutional neural network (Faster R-CNN).
Figure 8.
The loss curve with different neural networks as feature map extraction in faster region-based convolutional neural network (Faster R-CNN).

Figure 9.
Maize tassels identified by the default anchor size [1282,2562,5122] (a), and the modified anchor size [852, 1282, 2562] (b) with ResNet101 in Faster R-CNN. The red boxes, yellow boxes, and blue boxes represent the original prediction, absent detection, and incorrect detection, respectively.

Figure 10.
(a) The distribution of pixels in the maize tassel images obtained by mobile phone. Images of maize tassel taken 3 m above the ground at the Shangzhuang experimental site. (b) The images were detected by the modified anchor size in the Faster R-CNN using ResNet101 as the feature extraction network.

Figure 11.
Maize tassels identified by TasselNet (a) and by our Faster R-CNN (b). The yellow box represents the missed detection of maize tassels by Faster R-CNN.
Figure 11.
Maize tassels identified by TasselNet (a) and by our Faster R-CNN (b). The yellow box represents the missed detection of maize tassels by Faster R-CNN.


Table 1.
Test results with different feature extraction models.
| Test Data | Feature Extraction Network | AP Value |
|---|---|---|
| UAV | VGG16 | 91.51% |
| UAV | VGG19 | 91.18% |
| UAV | VGG20 | 87.94% |
| UAV | ResNet50 | 91.99% |
| UAV | ResNet101 | 94.99% |
| UAV | ResNet152 | 93.69% |
Note: All image sizes were 600 × 600, UAV flight altitude was 15 m, and test image number was 224.
Table 2.
Model test results with different anchor sizes.
| Test Data | Feature Extraction Network | AP Value of [1282,2562,5122] | AP Value of [852,1282,2562] |
|---|---|---|---|
| UAV | ResNet50 | 87.27% | 89.93% |
| UAV | ResNet101 | 87.21% | 89.96% |
| UAV | ResNet152 | 84.46% | 87.82% |
Note: All image sizes were 5280 × 2970, UAV flight altitude was 15 m, and image number was 34.
© 2020 by the authors. Licensee MDPI, Basel, Switzerland. This article is an open access article distributed under the terms and conditions of the Creative Commons Attribution (CC BY) license (http://creativecommons.org/licenses/by/4.0/).
Share and Cite
MDPI and ACS Style
Liu, Y.; Cen, C.; Che, Y.; Ke, R.; Ma, Y.; Ma, Y. Detection of Maize Tassels from UAV RGB Imagery with Faster R-CNN. Remote Sens. 2020, 12, 338. https://0-doi-org.brum.beds.ac.uk/10.3390/rs12020338
AMA Style
Liu Y, Cen C, Che Y, Ke R, Ma Y, Ma Y. Detection of Maize Tassels from UAV RGB Imagery with Faster R-CNN. Remote Sensing. 2020; 12(2):338. https://0-doi-org.brum.beds.ac.uk/10.3390/rs12020338
Chicago/Turabian StyleLiu, Yunling, Chaojun Cen, Yingpu Che, Rui Ke, Yan Ma, and Yuntao Ma. 2020. "Detection of Maize Tassels from UAV RGB Imagery with Faster R-CNN" Remote Sensing 12, no. 2: 338. https://0-doi-org.brum.beds.ac.uk/10.3390/rs12020338
Note that from the first issue of 2016, this journal uses article numbers instead of page numbers. See further details here.