Ground Deformation and Its Causes in Abbottabad City, Pakistan from Sentinel-1A Data and MT-InSAR


Department of Land Surveying and Geo-Informatics, The Hong Kong Polytechnic University, Hong Kong, China
*
Author to whom correspondence should be addressed.
Remote Sens. 2020, 12(20), 3442; https://0-doi-org.brum.beds.ac.uk/10.3390/rs12203442
Submission received: 24 September 2020
/
Revised: 13 October 2020
/
Accepted: 15 October 2020
/
Published: 20 October 2020
Abstract
:Land subsidence, as one of the engineering geological problems in the world, is generally caused by compression of unconsolidated strata due to natural or anthropogenic activities. We employed interferometric point target analysis (IPTA) as a multi-temporal interferometric synthetic aperture radar (MT-InSAR) technique on ascending and descending Sentinel-1A the terrain observation with progressive scans SAR (TOPSAR) images acquired between January 2015 and December 2018 to analyze the spatio-temporal distribution and cause of subsidence in Abbottabad City of Pakistan. The line of sight (LOS) average deformation velocities along ascending and descending orbits were decomposed into vertical velocity fields and compared with geological data, ground water pumping schemes, and precipitation data. The decomposed and averaged vertical velocity results showed significant subsidence in most of the urban areas in the city. The most severe subsidence was observed close to old Karakorum highway, where the subsidence rate varied up to −6.5 cm/year. The subsidence bowl profiles along W–E and S–N transects showed a relationship with the locations of some water pumping stations. The monitored LOS time series histories along an ascending orbit showed a close correlation with the rainfall during the investigation period. Comparative analysis of this uneven prominent subsidence with geological and precipitation data reflected that the subsidence in the Abbottabad city was mainly related to anthropogenic activities, overexploitation of water, and consolidation of soil layer. The study represents the first ever evidence of land subsidence and its causes in the region that will support the local government as well as decision and policy makers for better planning to overcome problems of overflowing drains, sewage system, littered roads/streets, and sinking land in the city.
1. Introduction
Ground subsidence is a common geological hazard worldwide, which is mostly linked to natural (e.g., earthquake, compression of soil, and change in aquifer) or anthropogenic (e.g., underground construction activities, groundwater extraction) processes [1]. Subsidence at the local scale specifically in urban areas can be a serious threat to the economy, such as damages to infrastructures (buildings, roads, bridges, canals), and to viable and sustainable economic development [2]. Changes in geological settings, mining, construction of subways, and ground water extraction are among the main causes of land subsidence in most cities in the world [3,4]. Other than these causes, the subsidence showed high correlation with changing geology in terms of strata lithology, formation, and structure [5]. The areas with unconsolidated surficial deposits generally form the most prolific aquifers and subsidence in such areas is mostly due to the extensive extraction of ground water [6]. This extensive use of underground water resources and increase in the pumping stations due to increase in the population is causing significant loss in small and large aquifers in most parts of the world, creating problems related to drainage system, flooding during rainy seasons, and the functioning of structures such as canals [6,7,8]. Numerous events of localized land subsidence have been reported in the past couple of decades in various parts of the world, especially due to extensive groundwater discharge [9]. Variation in seasonal timings and change in precipitation patterns have disturbed the runoff and recharge in aquifer systems. This change in runoff and recharge is also linked with increased demand of water in cities, which is one of the hurdles in achieving the sustainable goals of any country. Therefore, the demand for spatio-temporal monitoring of this hazard has increased to take necessary measures and to achieve sustainable goals.
A number of traditional studies describing different methodologies and effective solutions are available in the literature to monitor and study the ground deformation/subsidence processes. These traditional point-based monitoring studies include the following: global positioning system (GPS), leveling, and geological monitoring methods [10,11]. These methods lack in providing enough samples for ground-based subsidence monitoring and are very difficult to use in areas surrounded by steep slopes. Interferometric synthetic aperture radar (InSAR) has been proven to be the most efficient method, widely used to monitor land subsidence all over the world [1,12,13]. This technique is capable of detecting small changes at an unprecedented level of spatial details (centimeter to millimeter) in land surface elevation at low cast under ideal conditions [14,15,16]. So far, the problem incorporated in InSAR approach due to change in scatterer with time is mainly due to atmospheric and ionospheric disturbances, which lead to the introduction of decorrelation in the signal [17,18]. This is a common problem associated with the repeat-pass InSAR technique as a result of discrepancies that arise between two related SAR signals over the same location at different epochs [19]. Many advanced InSAR techniques has been developed to overcome this limitation by using multi-temporal InSAR (MT-InSAR) techniques [20]. MT-InSAR techniques work on the principal of simultaneously processing multi-SAR images to accurately extract deformation information. Zhang et al. [21] and Crosetto et al. [22] presented very good reviews of these techniques. These MT-InSAR techniques have been widely applied to monitor ground subsidence on different SAR data sets, concluding that these techniques have the ability to overcome (at least partially) the weaknesses of the conventional InSAR approach [23,24,25].
In this study, a step-wise and iterative technique, i.e., interferometric point target analysis (IPTA) multi-baseline technique of persistent scatterer interferometry (PSI), is implemented on Sentinel -1 (4 season × 4 years) data acquired between January 2015 and December 2018 along ascending and descending orbits in order to investigate, highlight, and understand the causes of subsidence and its temporal evolution in response to increasing demand of ground water and changes in soil properties in Abbottabad city of Pakistan (Figure 1). Based on iterative process for calculating high-precision deformation on point scatterers (PSs), IPTA has been proven to hold strong power in monitoring deformation using a large number of SAR images [26,27,28,29]. The study area has various types of natural conditions surrounded by mountains and an attractive place thanks to its natural beauty. This is why the city has experienced rapid urban growth in the past decade. In order to facilitate this increased urban settlement in the area, the Government of Pakistan (GoP) has implemented various drinking water supply schemes/projects [30]. As a result of contamination in the surface water and upper level of groundwater, the need to drill deeper borewells has increased with the increased number of tubewells in the area. This study is the first ever attempt to examine the spatio-temporal deformation patterns and their causes in the region. The results obtained by implementing the advanced InSAR technique will support the local government for better decision making and planning to overcome problems such as overflowing drains, disturbed sewerage system, sinking land, and littered roads and streets.
2. Study Area and Datasets
2.1. Characteristics of the Study Area
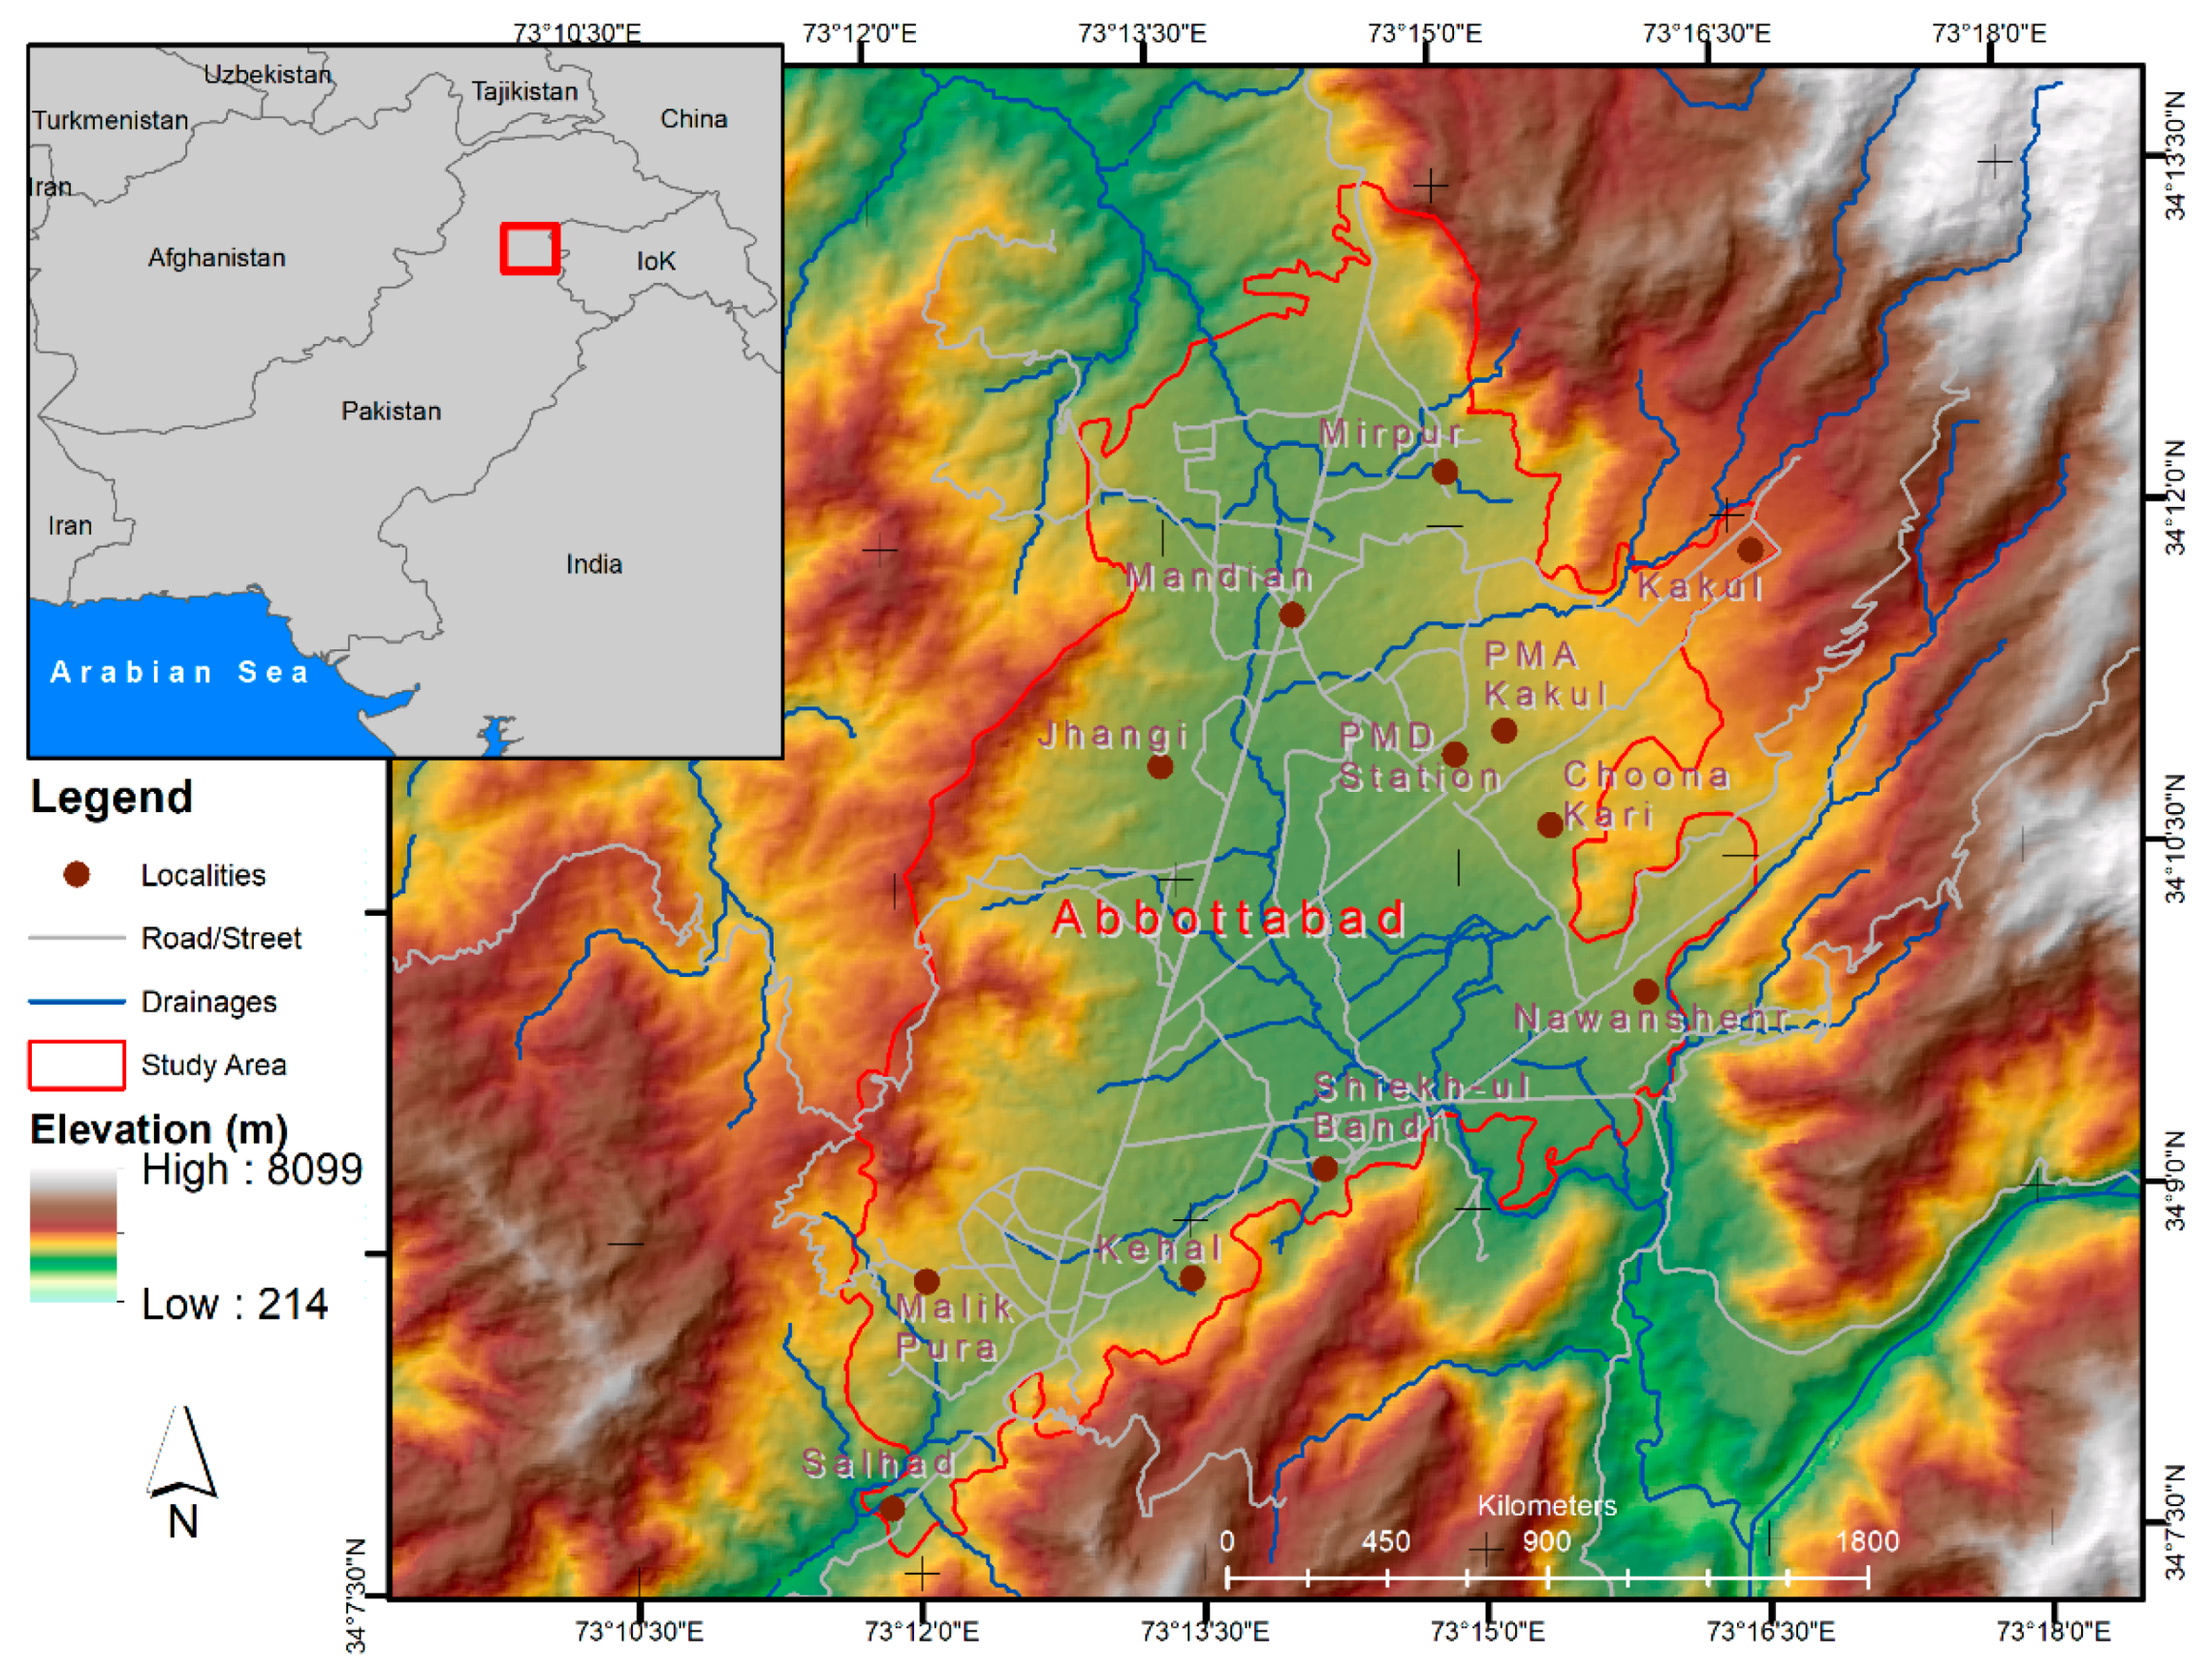
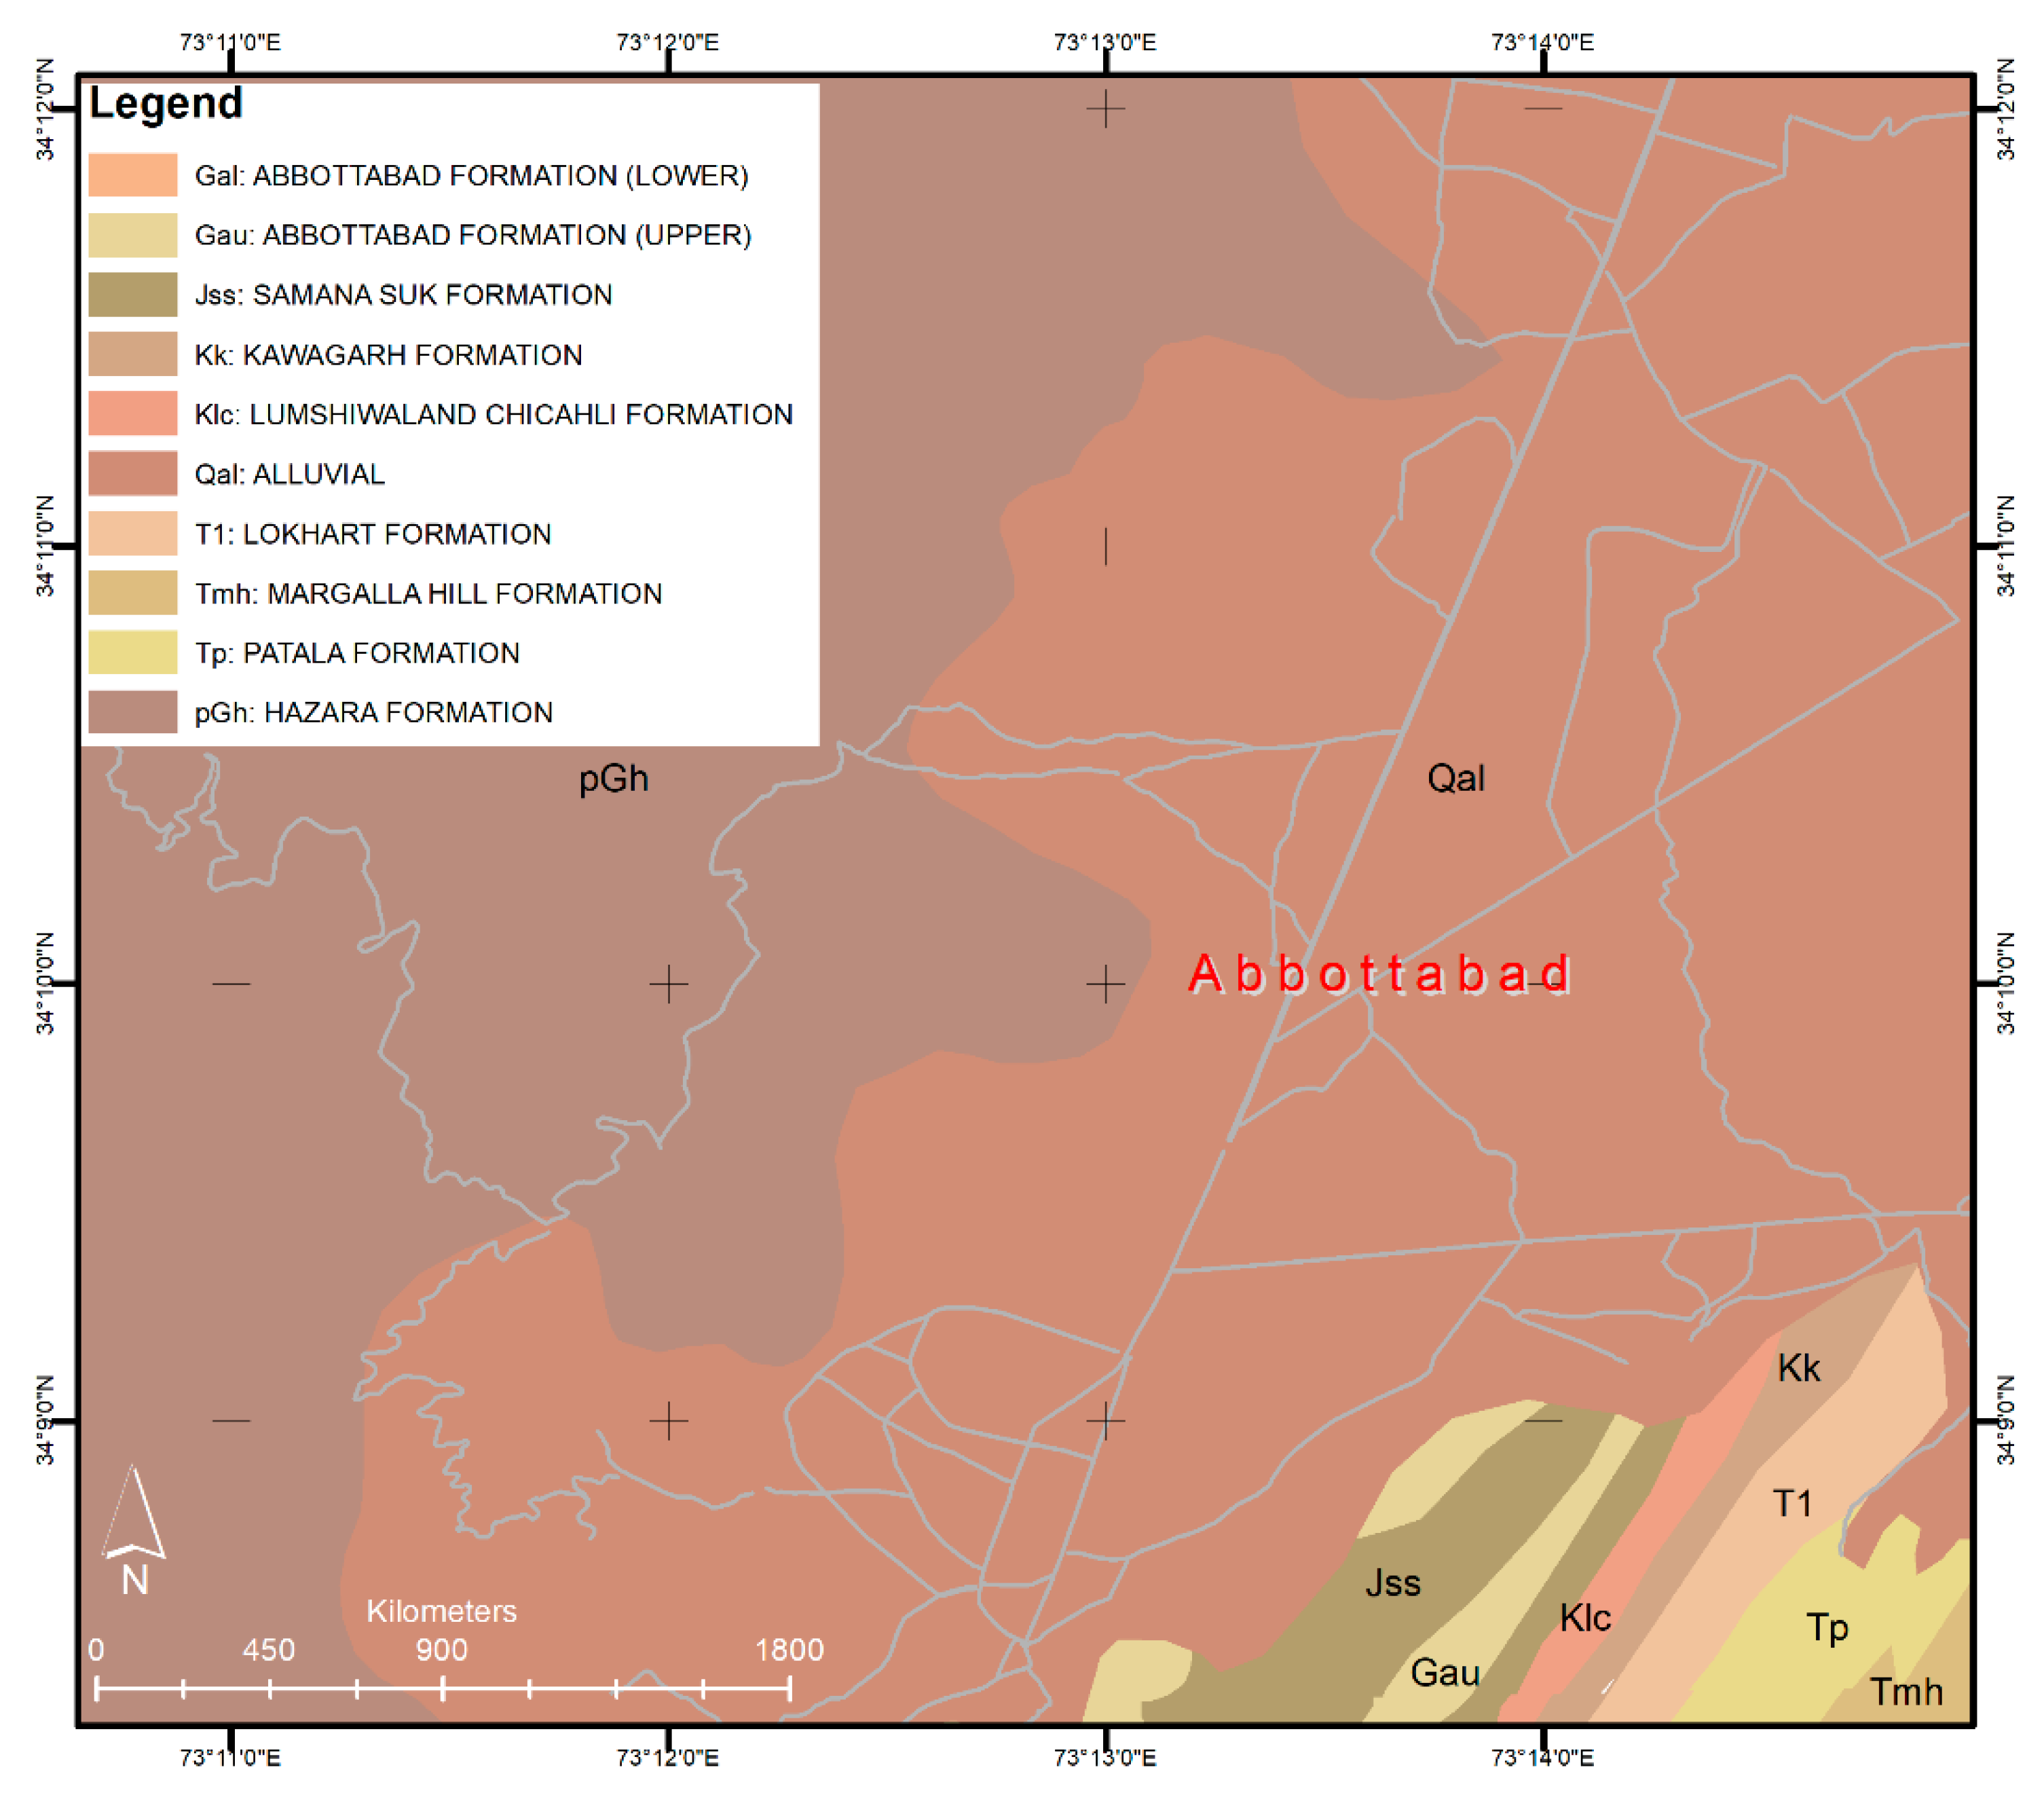
Abbottabad, formerly known as “the city of the maple trees” and a famous hill station in the lower Himalayas, is the administrative headquarters of the Hazara division of Khyber Pakhtunkhwa province of Pakistan (Figure 1). Geographically, the study area extends from 34°14′47.00″ N, 73°11′56.00″ E to 34° 7′46.00″ N, 73°16′56.00″ E. Endowed with scenic and green mountains located about 125 km north of Islamabad (Capital of Pakistan) through Karakoram Highway, the area is a very famous hill resort in summer. With an altitude of 1260 m (4120 ft), the area also serves as a gateway to Galliyat regions in west. Geologically, the central part of the study area consists of Quaternary Alluvial (unconsolidated surficial deposits of sand and gravel) surrounded by Hazara, Tanawal, Lokhart, and Hazira formation [31].
Being the part of Orash Valley, rainfall occurs throughout the year with the highest rainfall during monsoon seasons, making the region prone to flashflood. According to the recent census report, the population of the city has increased at a rate of 3.61%/year from 1998 to 2017 [32].
2.2. Datasets
The selection of Sentinel-1 data was based on the fact that this mission provides long-term, timely data with satisfactory resolution free of cost. These data are a reliable source to study the deformation and its evolution over time, which can be used to predict future scenarios [33]. Therefore, in this study, we used Sentinel -1A data along the ascending and descending orbits (incident angle ~33.81 and 33.15 degrees, respectively). Interferometric wide swath (IW) single look complex (SLC) the terrain observation with progressive scans SAR (TOPSAR) images, operating in C-band (~5.6 cm wavelength), acquired from European Space Agency (ESA) distributed under Copernicus program, were used to map the spatial distribution of ground deformation and time series deformation patterns. The 84 acquired ascending orbit images (track 100) were between 4 January 2015 and 2 December 2018, and the 82 descending orbit images (track 107) were between 17 January 2015 and 27 December 2018. All the acquired images were preprocessed for orbital refinement using precise orbit determination (POD) files released by ESA. Moreover, 1 arc second (~30 m) shuttle radar topography mission (SRTM) digital elevation model (DEM) was downloaded from United States geological survey (USGS) and used to simulate and remove topographic phases. For processing and co-registration, the acquired images on 8 August 2017 for ascending data and 13 December 2016 for descending data were selected as master images. This selection of the master image was based on the joint correlation method presented in [34].
Google Earth was used to interpret and analyze the data at different stages. Advanced InSAR processing software, GAMMA-2017®, developed by GAMMA Remote Sensing AG, Switzerland, was used to define and implement the IPTA processing chain for the mapping of ground subsidence in the area.
3. Methodology
The use of the InSAR technique for ground deformation mapping and monitoring depends on a number of factors, including operational band (C, X, or L), type of incident surface, topography and geography of the area, number of acquisitions, and temporal intervals between repeated images. These factors play an important role in achieving high efficiency of the InSAR technique [35]. To achieve such efficiency of the results, the IPTA approach was employed to analyze and monitor the ground subsidence in the area. Although the phase model used for point target analysis is the same as that used in conventional interferometry, its step-wise iterative process is very helpful in refining the parameters and to separate the deformation phase from all non-deformation phase components of Equation (1) [36].
where is the unwapped phase of the ith point target in the kth interferogram and is expressed as the sum of (atmospheric path delay phase), (decorrelation phase noise), (phase residues due to the digital elevation model (DEM) inaccuracies), and actual deformation phase.
The term is the phase attributed to the errors introduced by DEM as elaborated in Equation (2) by [35],
where is the height error (m) increment; is the perpendicular baseline; and , and are the radar wavelength, slant range, and look angle, respectively.
The term is actual deformation phase that can be further divided into linear and non-linear components [35]. The linear component of this deformation phase is presented in Equation (3).
where is the time difference of the kth interferogram and is the linear deformation velocity at the ith point target. Moreover, the efficiency of the models and data storage capacities is one of the main concerns of the researchers working with limited computer resources. The vector format data structure used in this approach has provided a great benefit to generate results even with the limited system resources. The overall processing sequence adopted for IPTA processing in this research study is presented in Figure 2.
3.1. Generation of Point List and Differential Interferograms
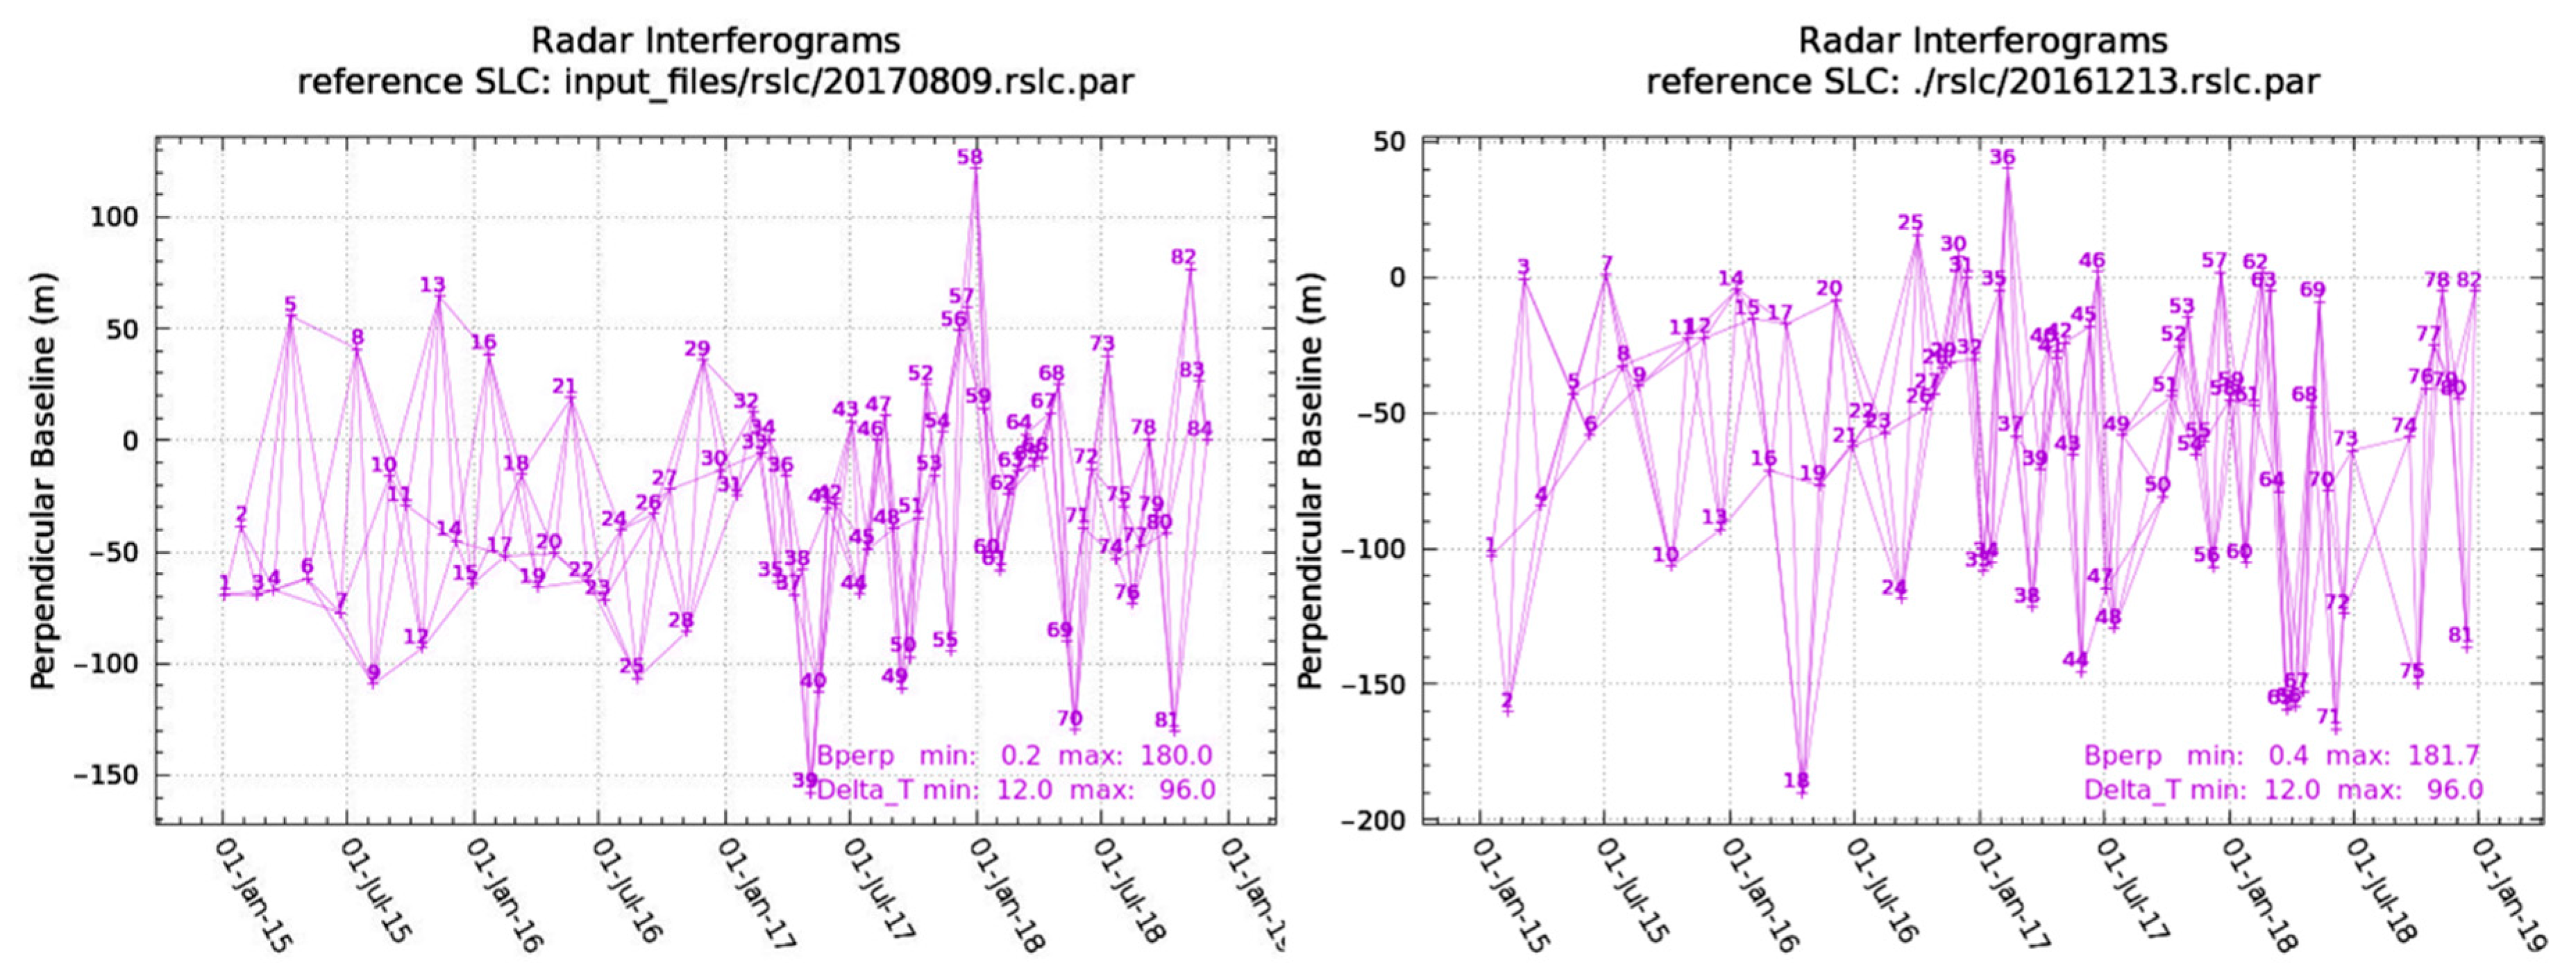
In order to minimize the contribution of non-deformation phases elaborated in Equation (1), generation of a good quality of points is important. In this study, the strategy used to determine good quality point targets, i.e., persistent scatterers (PS), was based on two approaches, i.e., temporal variability and spectral diversity [36]. The ratio of the mean (temporal average of backscattering) to the standard deviation (sigma) of backscatter from this average was used for temporal variability. For spectral diversity, an averaged coherence from each SLC was used to select the PS with low spectral diversity. In order to have enough PS, the point targets of both the approaches were merged together. For these points, the SLC values are extracted and written in the vector data SLC point data stack. Taking advantage of the long-term time series data, the maximum scene difference of three (3) scenes was considered with perpendicular baseline check of 200 m and temporal baseline check of 100 days to generate interferometric pairs. Based on the baseline chart (Figure 3), these PS were translated to generate point-based DEM, leading to calculating the point-based differential interferogram.
3.2. Interferometric Point Target Processing
IPTA is based on a 2D linear regression model, in which the phase difference between point targets is analyzed in the temporal domain. This 2D regression is based on the linear dependency of the topographic phase with the perpendicular baseline (Equation (2)) and the linear dependency of the deformation phase with time (Equation (3)). This 2D linear regression was applied to generate initial estimates of deformation phase, residual topography, and phase standard deviation. This phase standard deviation represented a quality check between the model fit and differential phase. In addition to these terms, the phase model also generated the linear regression phase residual, which was comprised of phase variations related to atmospheric artifacts as well as non-linear deformation phase component with decorrelation noise (Equation (4)).
The residual phase at this stage exhibited phase jumps related to unwrapping errors that were removed iteratively using the minimum cost flow (MCF) algorithm [37]. Because atmospheric phase screen (APS) and non-linear deformation phases are spatial low-pass signals, we applied the linear least square spatial filtering method to the unwrapped residual phase in order to calculate the phase attributes related to APS. The estimated APS is then subtracted from the point-based differential interferogram stack for all of the PS candidates. As presented in Figure 2, this process was iterated several times to generate improved quality estimates of the height correction, APS, and refined unwrapped differential phase. More technical details on processing strategies using the IPTA framework can be found in [36,38].
3.3. Deformation Rate and Time Series Retrieval
The final deformation rate and deformation time series histories were retrieved for each point by implementing the multi-baseline (mb) approach [39]. These final deformation histories and average annual deformation rates corresponding to point information are converted to line of sight (LOS) displacement and equiangular (EQA) projection for further analysis.
3.4. Decomposition of LOS Displacements into 2D Displacement Fields
The mean LOS velocity fields against each PS, extracted from two different orbits, i.e., ascending and descending, were decomposed into vertical and east–west components. Assuming the negligible north–south movement [40], the vertical () and east–west () components were computed using Equation (5) [41,42].
where and represent the incident angles of ascending and descending orbits, respectively, and is the difference between headings of ascending and descending orbits.
3.5. Causal Factors of Deformation
The cause of the subsidence is normally considered and interpreted as an individual/single factor, but urban subsidence especially in areas surrounded by hills with variety of geological units may be caused by the interaction of two or more factors together. This interaction between causal factors is very clear and reported in many studies [43]. If changes in such casual factors are left unnoticed, then the subsidence can lead to significant disaster in the area. Abbottabad, being one of the major affected cities in the October 2005 earthquake, has attracted a number of researchers for several reasons. One reason is its location in an intermountain basin with thick Quaternary deposits. Apart from the number of causal factors of subsidence, we gathered data about natural and anthropogenic factors that influence land subsidence. Geological layers (Figure 4) were extracted from the map of Geological Survey of Pakistan (GSP) [44] and refined using the map published in [31].
Precipitation data were gathered from Kakul Station of Pakistan Meteorological Department (PMD) from the year 2015 to 2018. Moreover, information related to the increase in drinking water supply schemes was collected from various reports [45,46,47] and compiled for the analysis. Because of the unavailability of ground water discharge data at these water supply schemes, the analysis with ground water discharge was done with the help of the implemented plans of water supply under such schemes. The pattern of subsidence and the locations of high subsidence zones were compared and analyzed with these developments in the area.
4. Results
The criteria for the generation of interferometric pairs on the basis of multi-baseline can guarantee that all of the Sentinel 1A images are involved. These interferometric pairs were assessed by applying a standard two-pass D-InSAR algorithm to generate differential interferograms. During D-InSAR processing, it was observed that the interferograms with relatively longer temporal intervals showed the phase variations in some part of the study area. The phase variations could be related to topographic residuals and perpendicular baselines. Such phase variation cannot be categorized to a specific phase signal unless multiple D-InSAR products based on time series data are analyzed. For this purpose, IPTA was employed in Abbottabad city and adjacent surrounding areas to extract deformation information.
4.1. Average Subsidence Rate Map
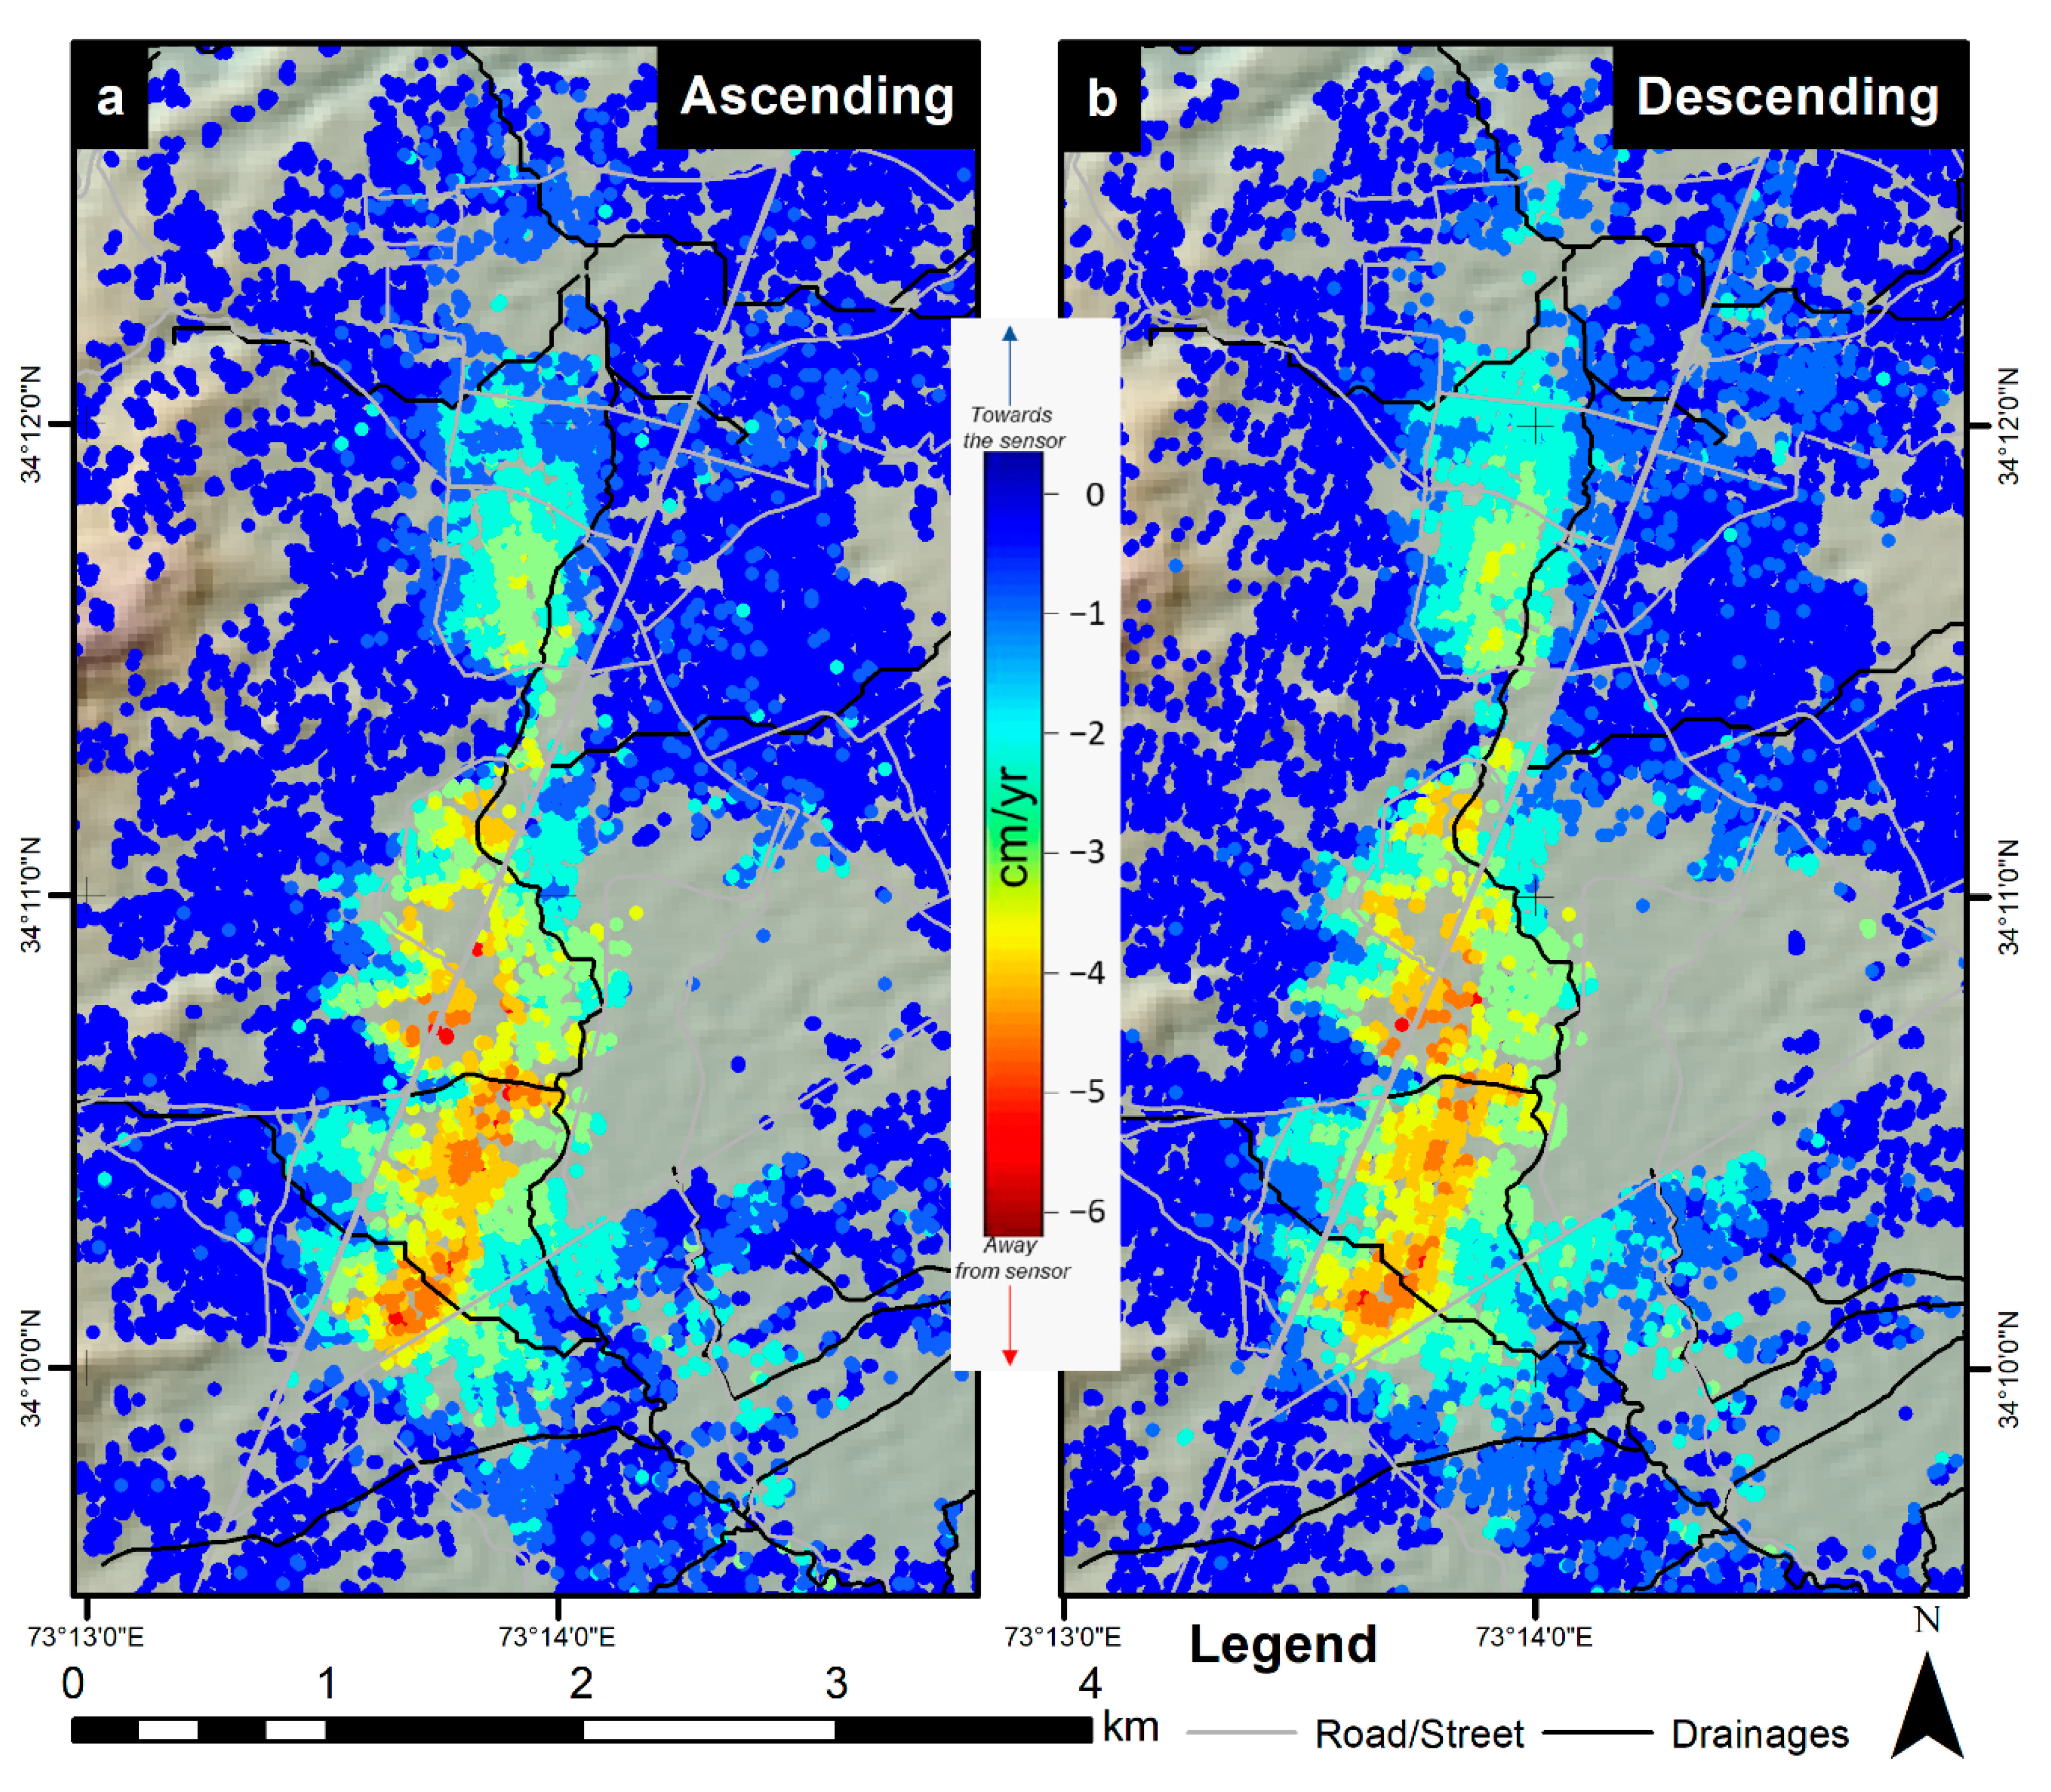
Figure 5 shows the average velocities in cm per year along LOS directions of both ascending (left) and descending (right) data, derived by implementing the IPTA technique. These LOS results were geocoded in WGS 84 coordinate system and superimposed onto the shaded relief map of the study area. Color ramps from blue to red represent the movement of land along the LOS direction. The negative deformation values indicate the movement away from the sensor (i.e., subsidence) and positive deformation values are related to movement towards the sensor (i.e., uplift). Owing to lower positive values (Figure 5), it can be assumed that there is no movement towards the sensor (i.e., uplift); therefore, the term “deformation” is represented as “subsidence” in this research paper. It can be seen in Figure 5 that the results extracted from both orbits’ data exhibit similar spatial patterns. These similar patterns represent the presence of dominant vertical deformation and negligible horizontal velocity [42].
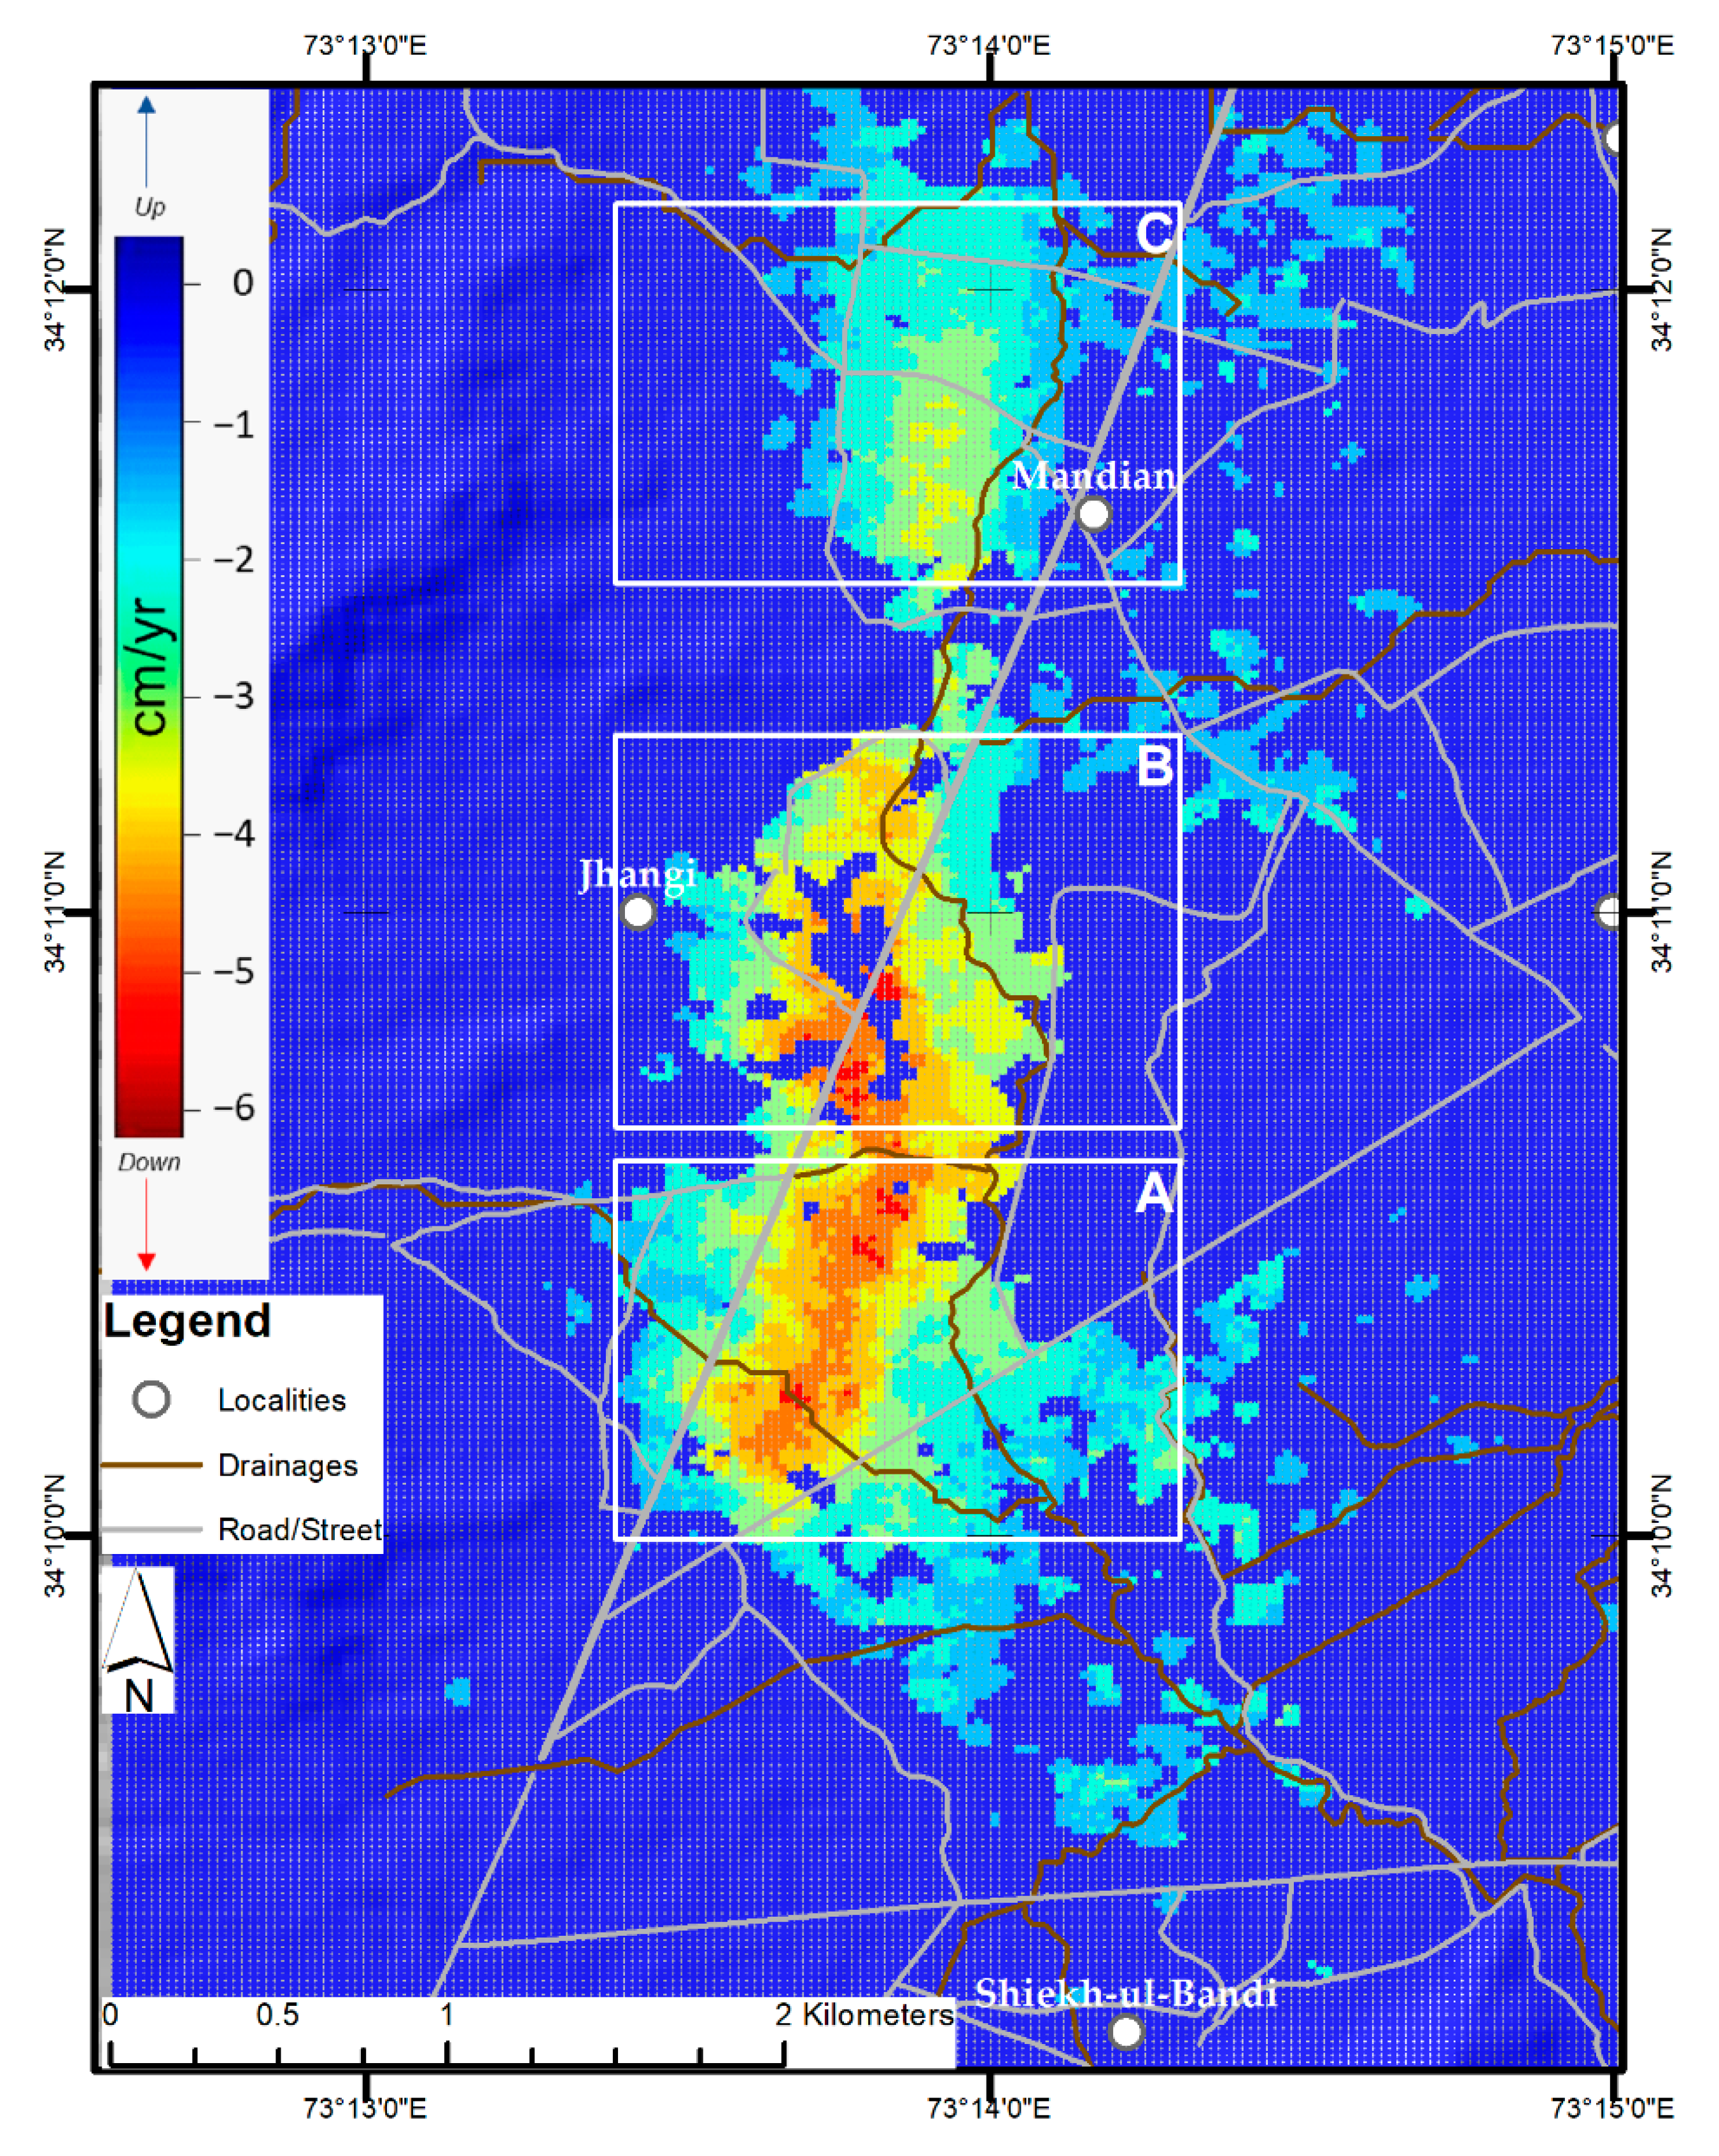
The results of average vertical velocity obtained after decomposing LOS velocities of both orbits are shown in Figure 6. It was observed in Figure 6 that the averaged vertical deformation (subsidence) rate varies up to −6.5 centimeter (cm) per year in the area. Figure 6 also represents a prominent, un-even subsidence pattern and the most prominent pattern with values from −6.5 to −2 cm/year was identified along the old Karakoram highway (locally known as road Nowshera-Abbottabad road, N35), which is settled in the foothills of the Himalayas, including the cantonment area of the city.
Moreover, Figure 6 also represents three main subsidence regions, i.e., A, B, and C. A and B are the regions with high population density and exhibit higher subsidence rates, whereas region C falls into the medium to low subsidence region with a relatively scattered population. The subsidence in region A incorporates residential societies of Hassan town, Amir alam awan town. The subsidence varies from −6.5 cm/year to −0.5 cm/year in this region. Region B lies in Mir Alam Town and Jhangi area with a higher centered value of −6.5 cm/year up to −1 cm/year at the outer edges of the region. Region C is the northern part of the main city, and lies in Kaghan and Sir Syed Colony with relatively higher altitudes than regions A and B. The subsidence rate varies between −3.0 and −1 cm per year in this region.
4.2. Subsidence Time Series
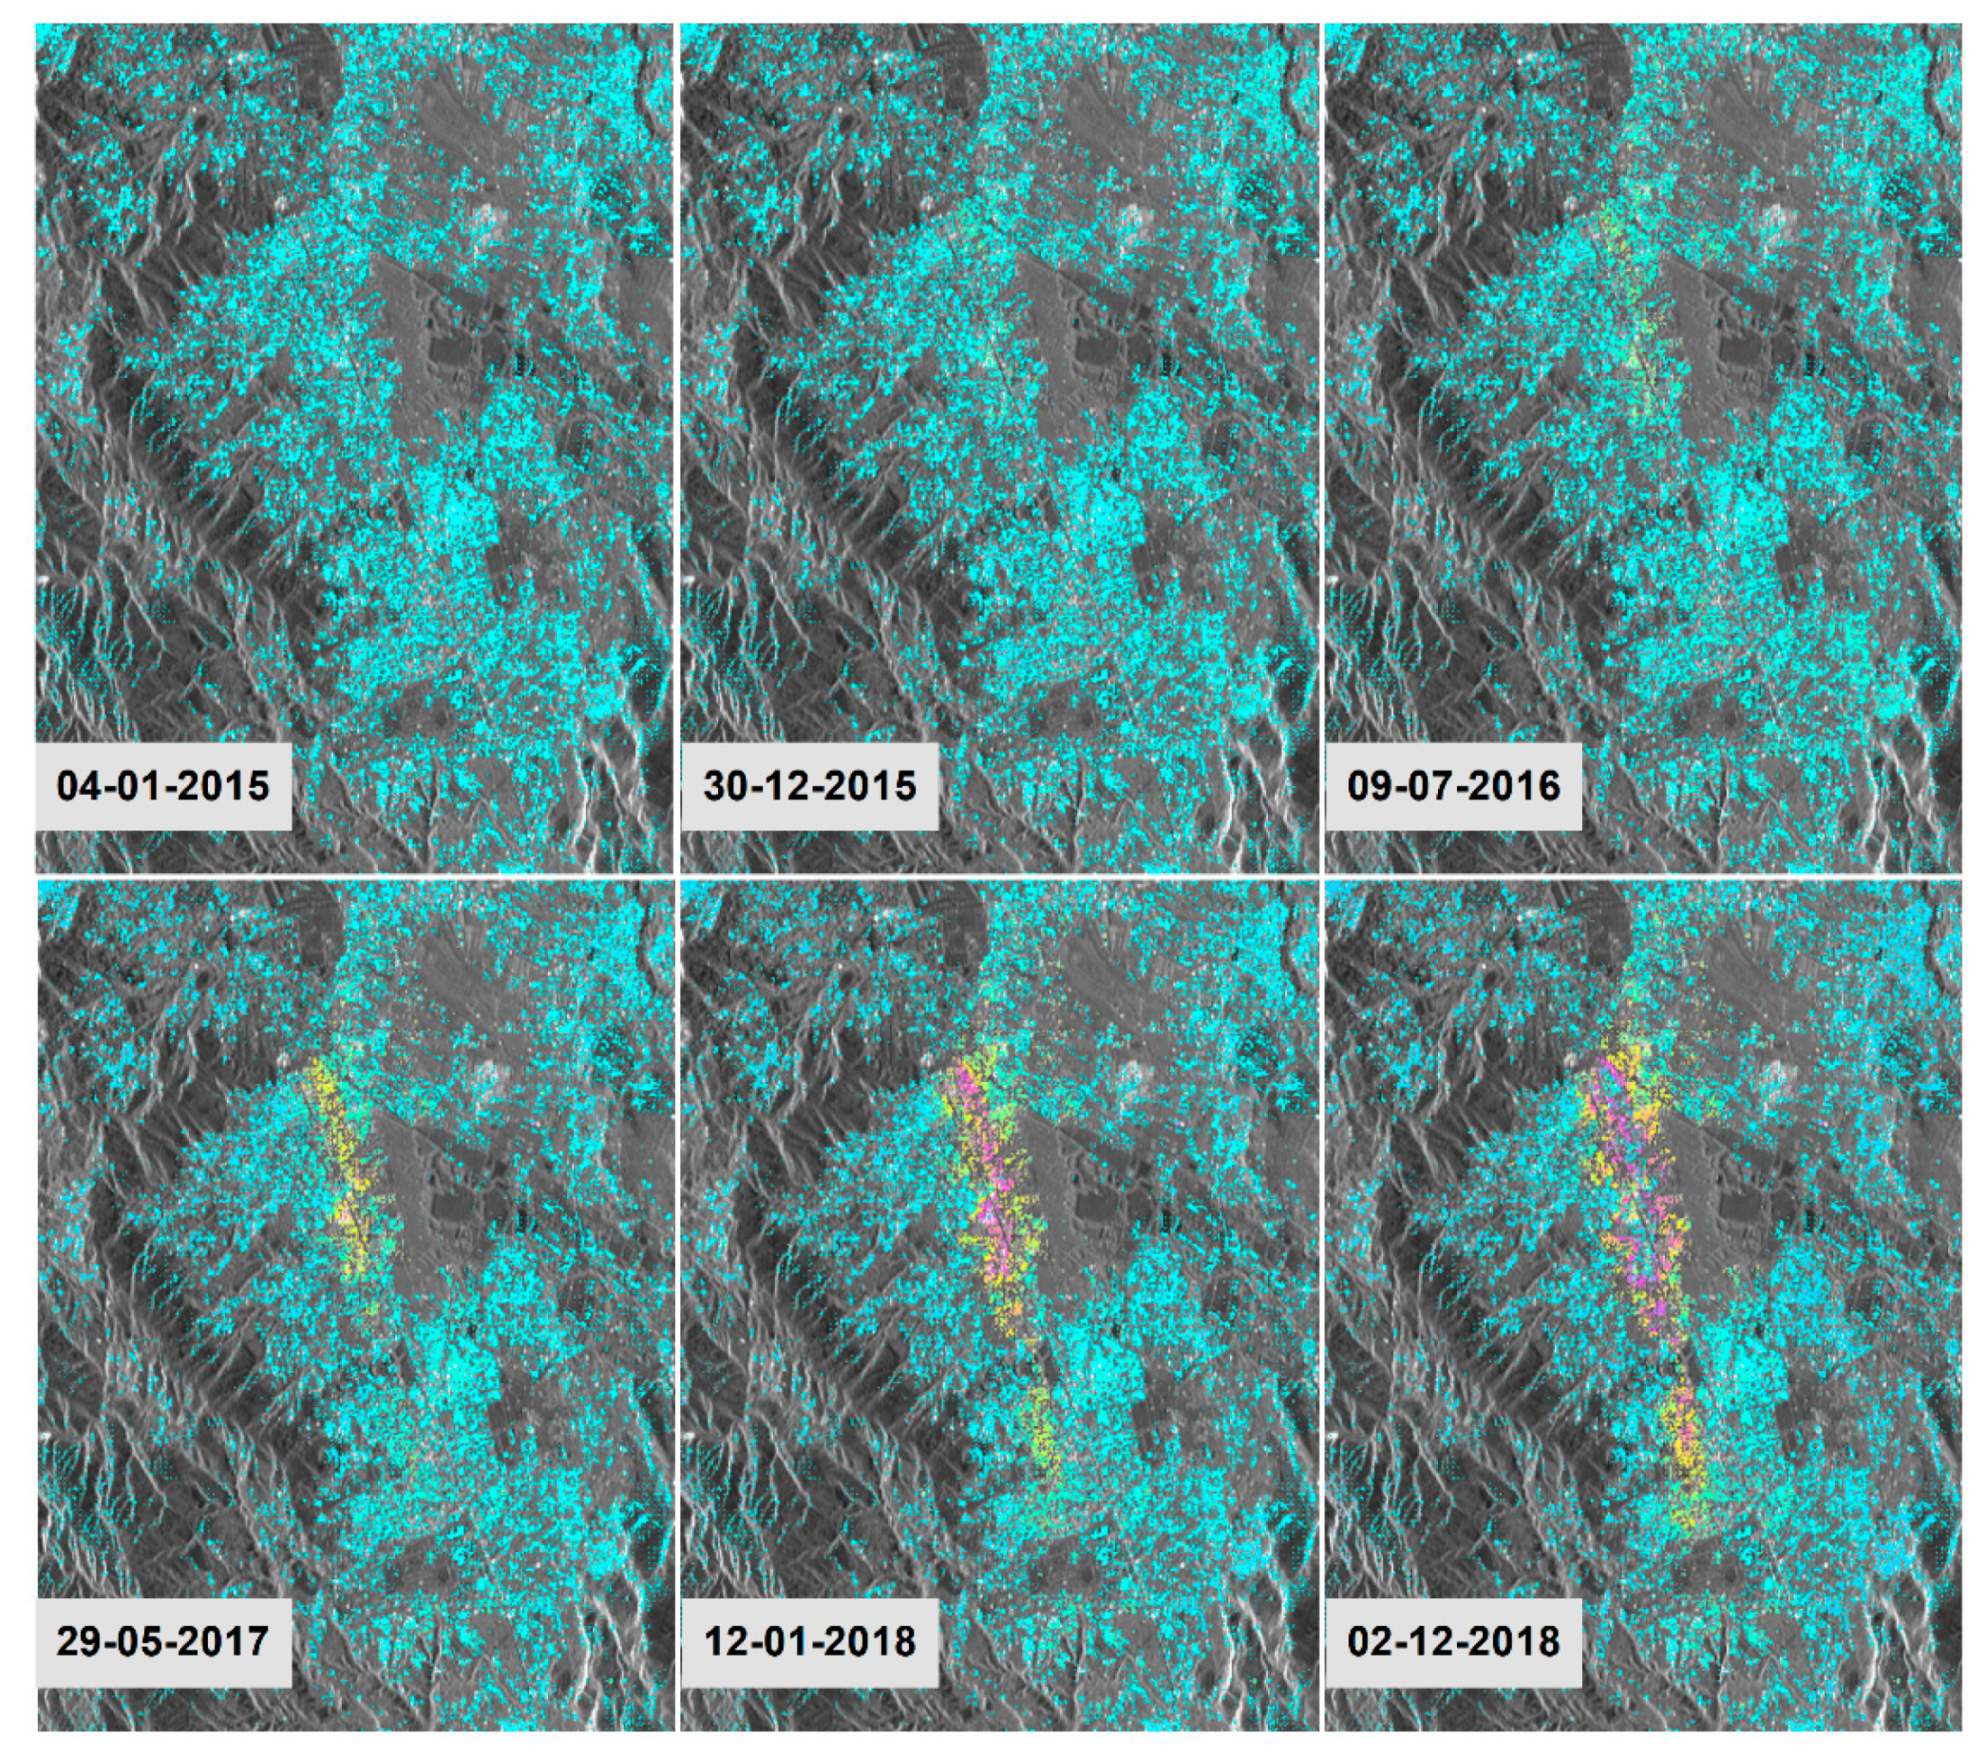
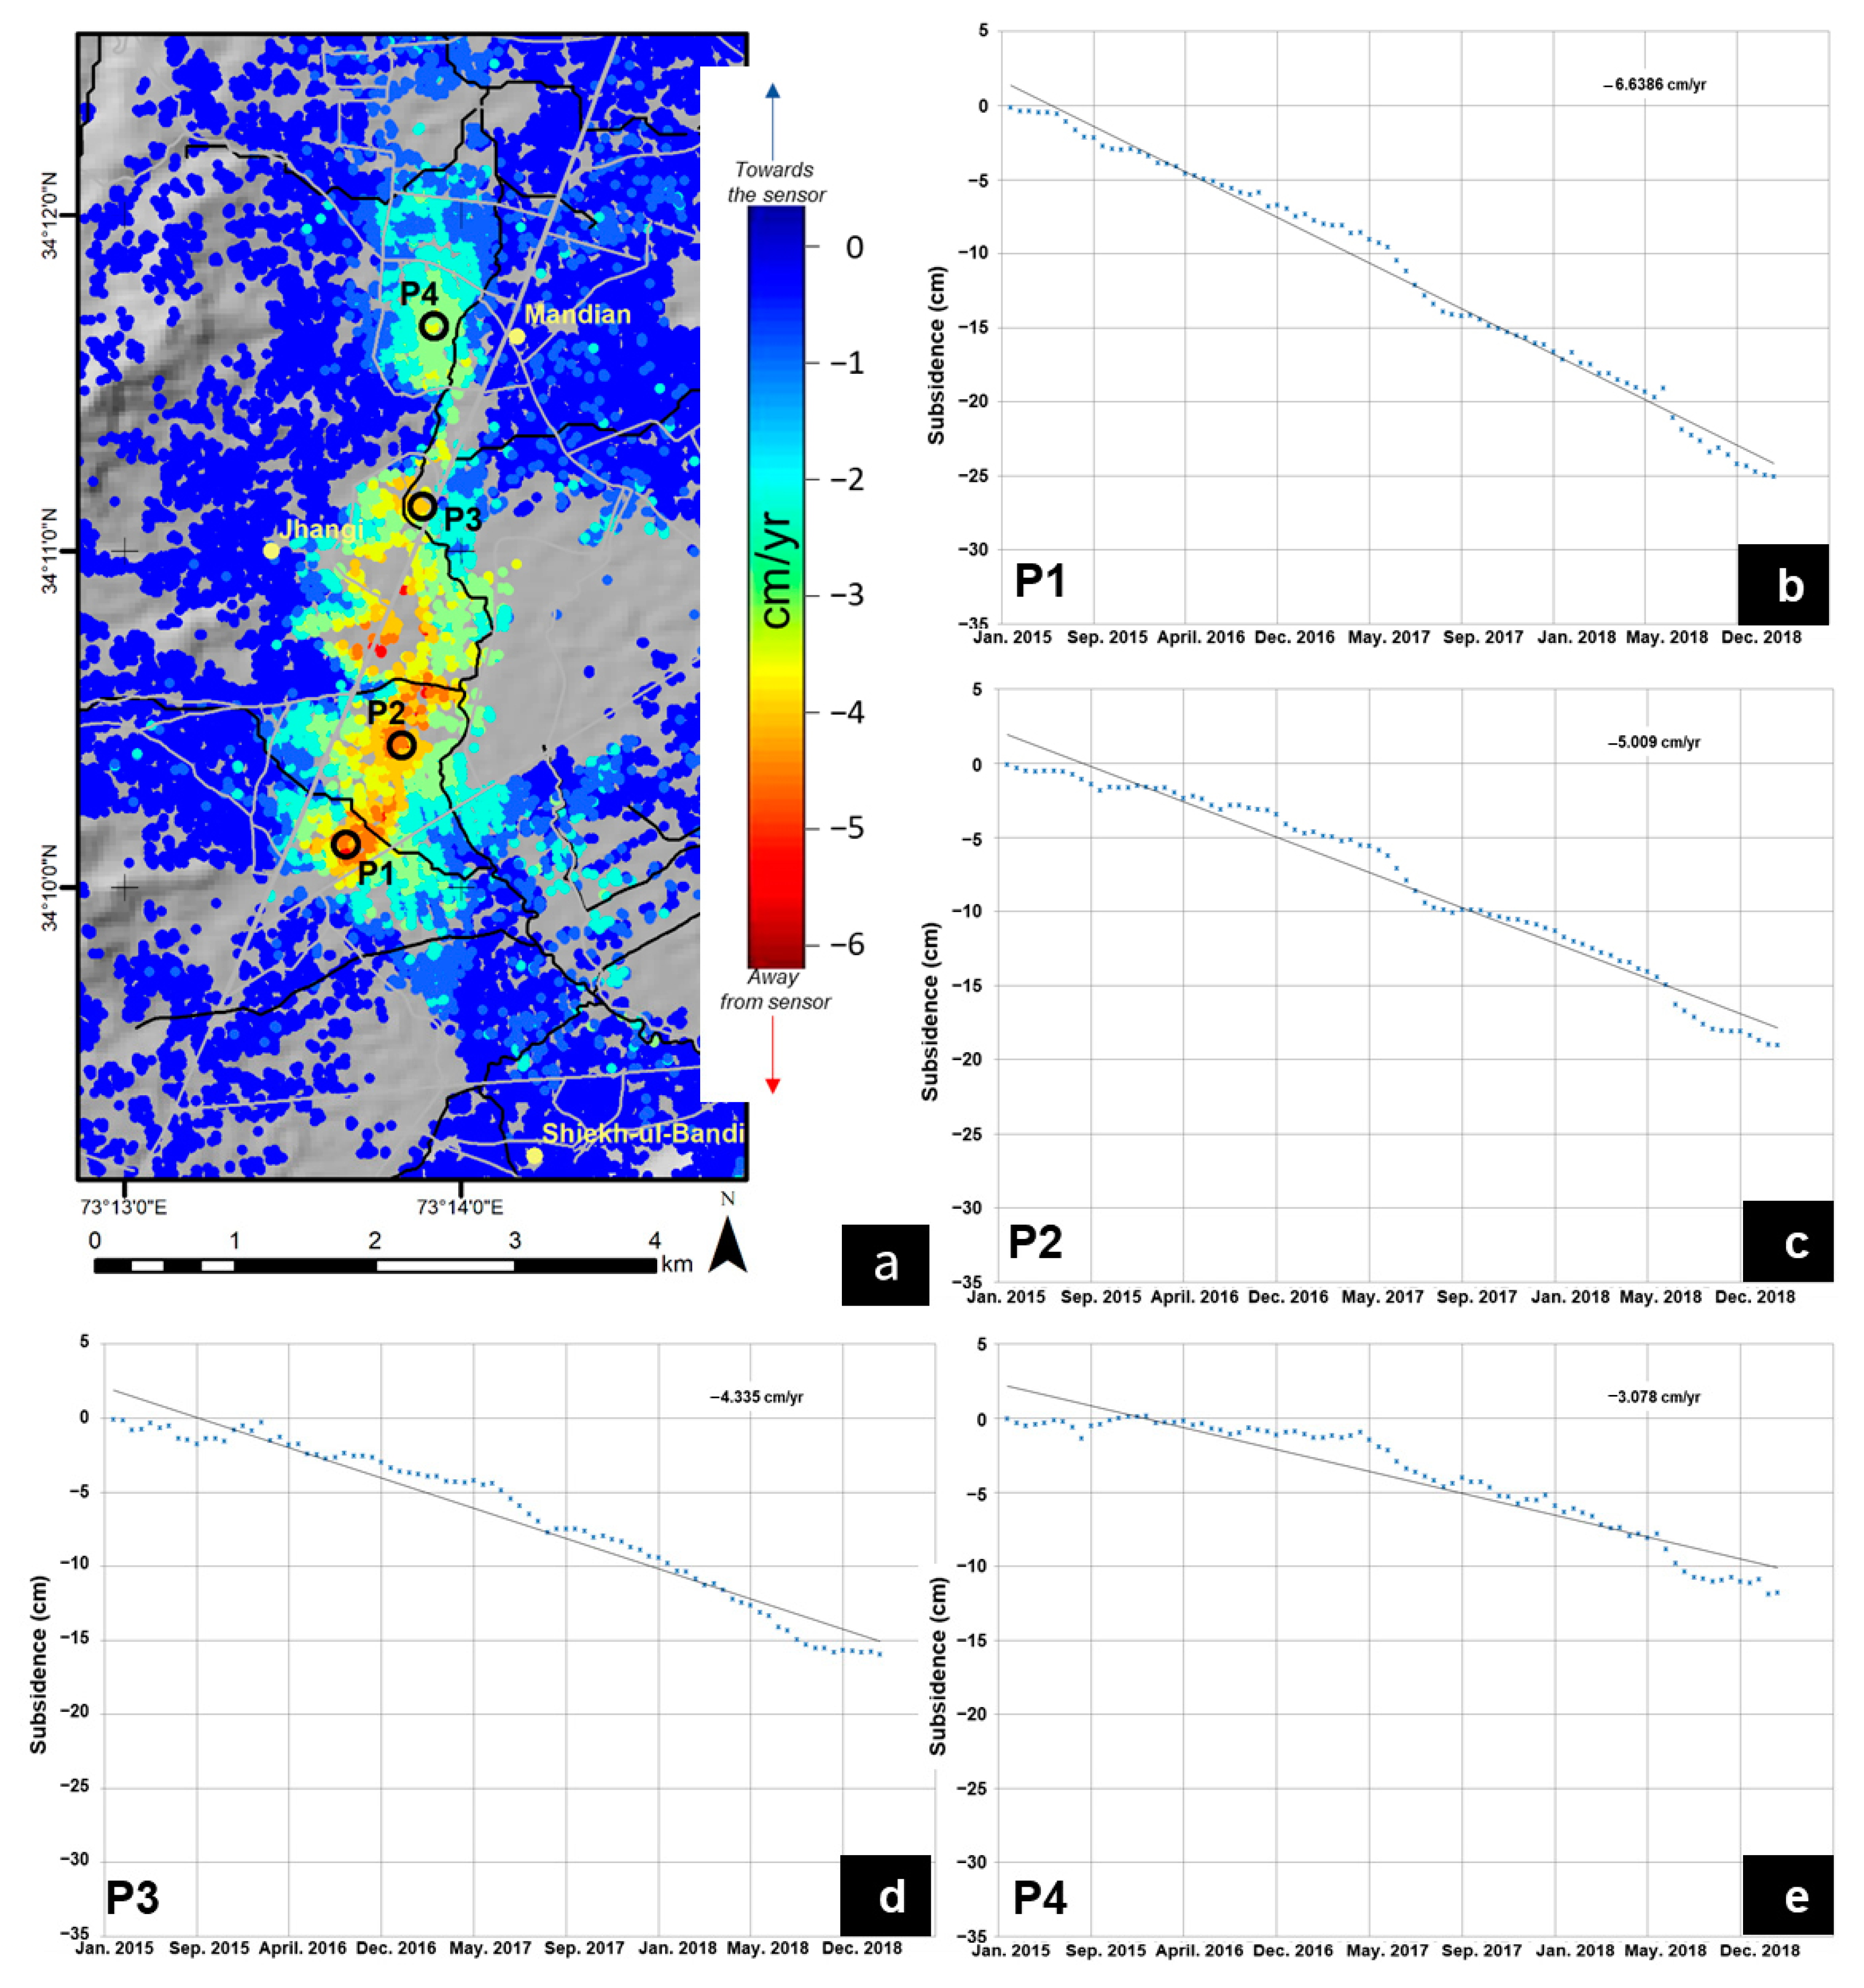
The spatio-temporal evolution in the deformation pattern using ascending orbit data at six (6) different stages overlaid on averaged multi-looked intensity (MLI) image in RADAR geometry is shown in Figure 7. Analyzing the increasing and expanding trend of the deformation in the eastward/westward and southward/westward directions, respectively, four typical PS (P1, P2, P3, and P4) were selected for detailed regional time series analysis (Figure 8a–e). Time series trends show the deformation evaluation extracted using ascending data and scattered at different locations over the deforming area. The locations of these points are shown in Figure 8a.
Based on LOS deformation obtained using ascending data, the temporal variations in the subsidence values of P1 vary from 0 to −25 cm, with an average rate of −6.63 cm/year. P2, which lies in the upper part of subsidence zone A, exhibits an average rate of −5 cm/year and the trend varies from 0 to −18 cm. P3, which lies in the upper part of subsidence zone B, varies from 0 to −16 cm, with an average rate of −4.3 cm/year. P4, which lies in northern part of study area and in the center of subsidence zone C, shows lower values varying from 0 to −12 cm, with an average rate of −3 cm/year. The temporal variations of these points are shown altogether in Figure 8b–e. These variations show a non-linear trend in the subsidence. The variations in time series patterns show that deformation slows down and is sustained for a certain period of time. One of the possible reasons for this variation could be the seasonal changes in the underground water levels, particularly after the monsoon season every year.
5. Discussion and Analysis
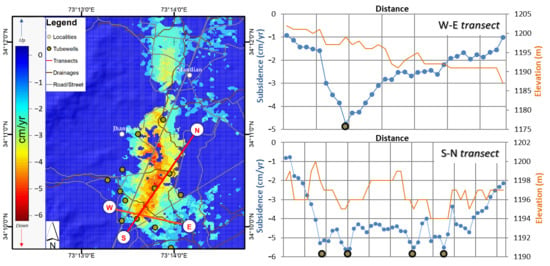
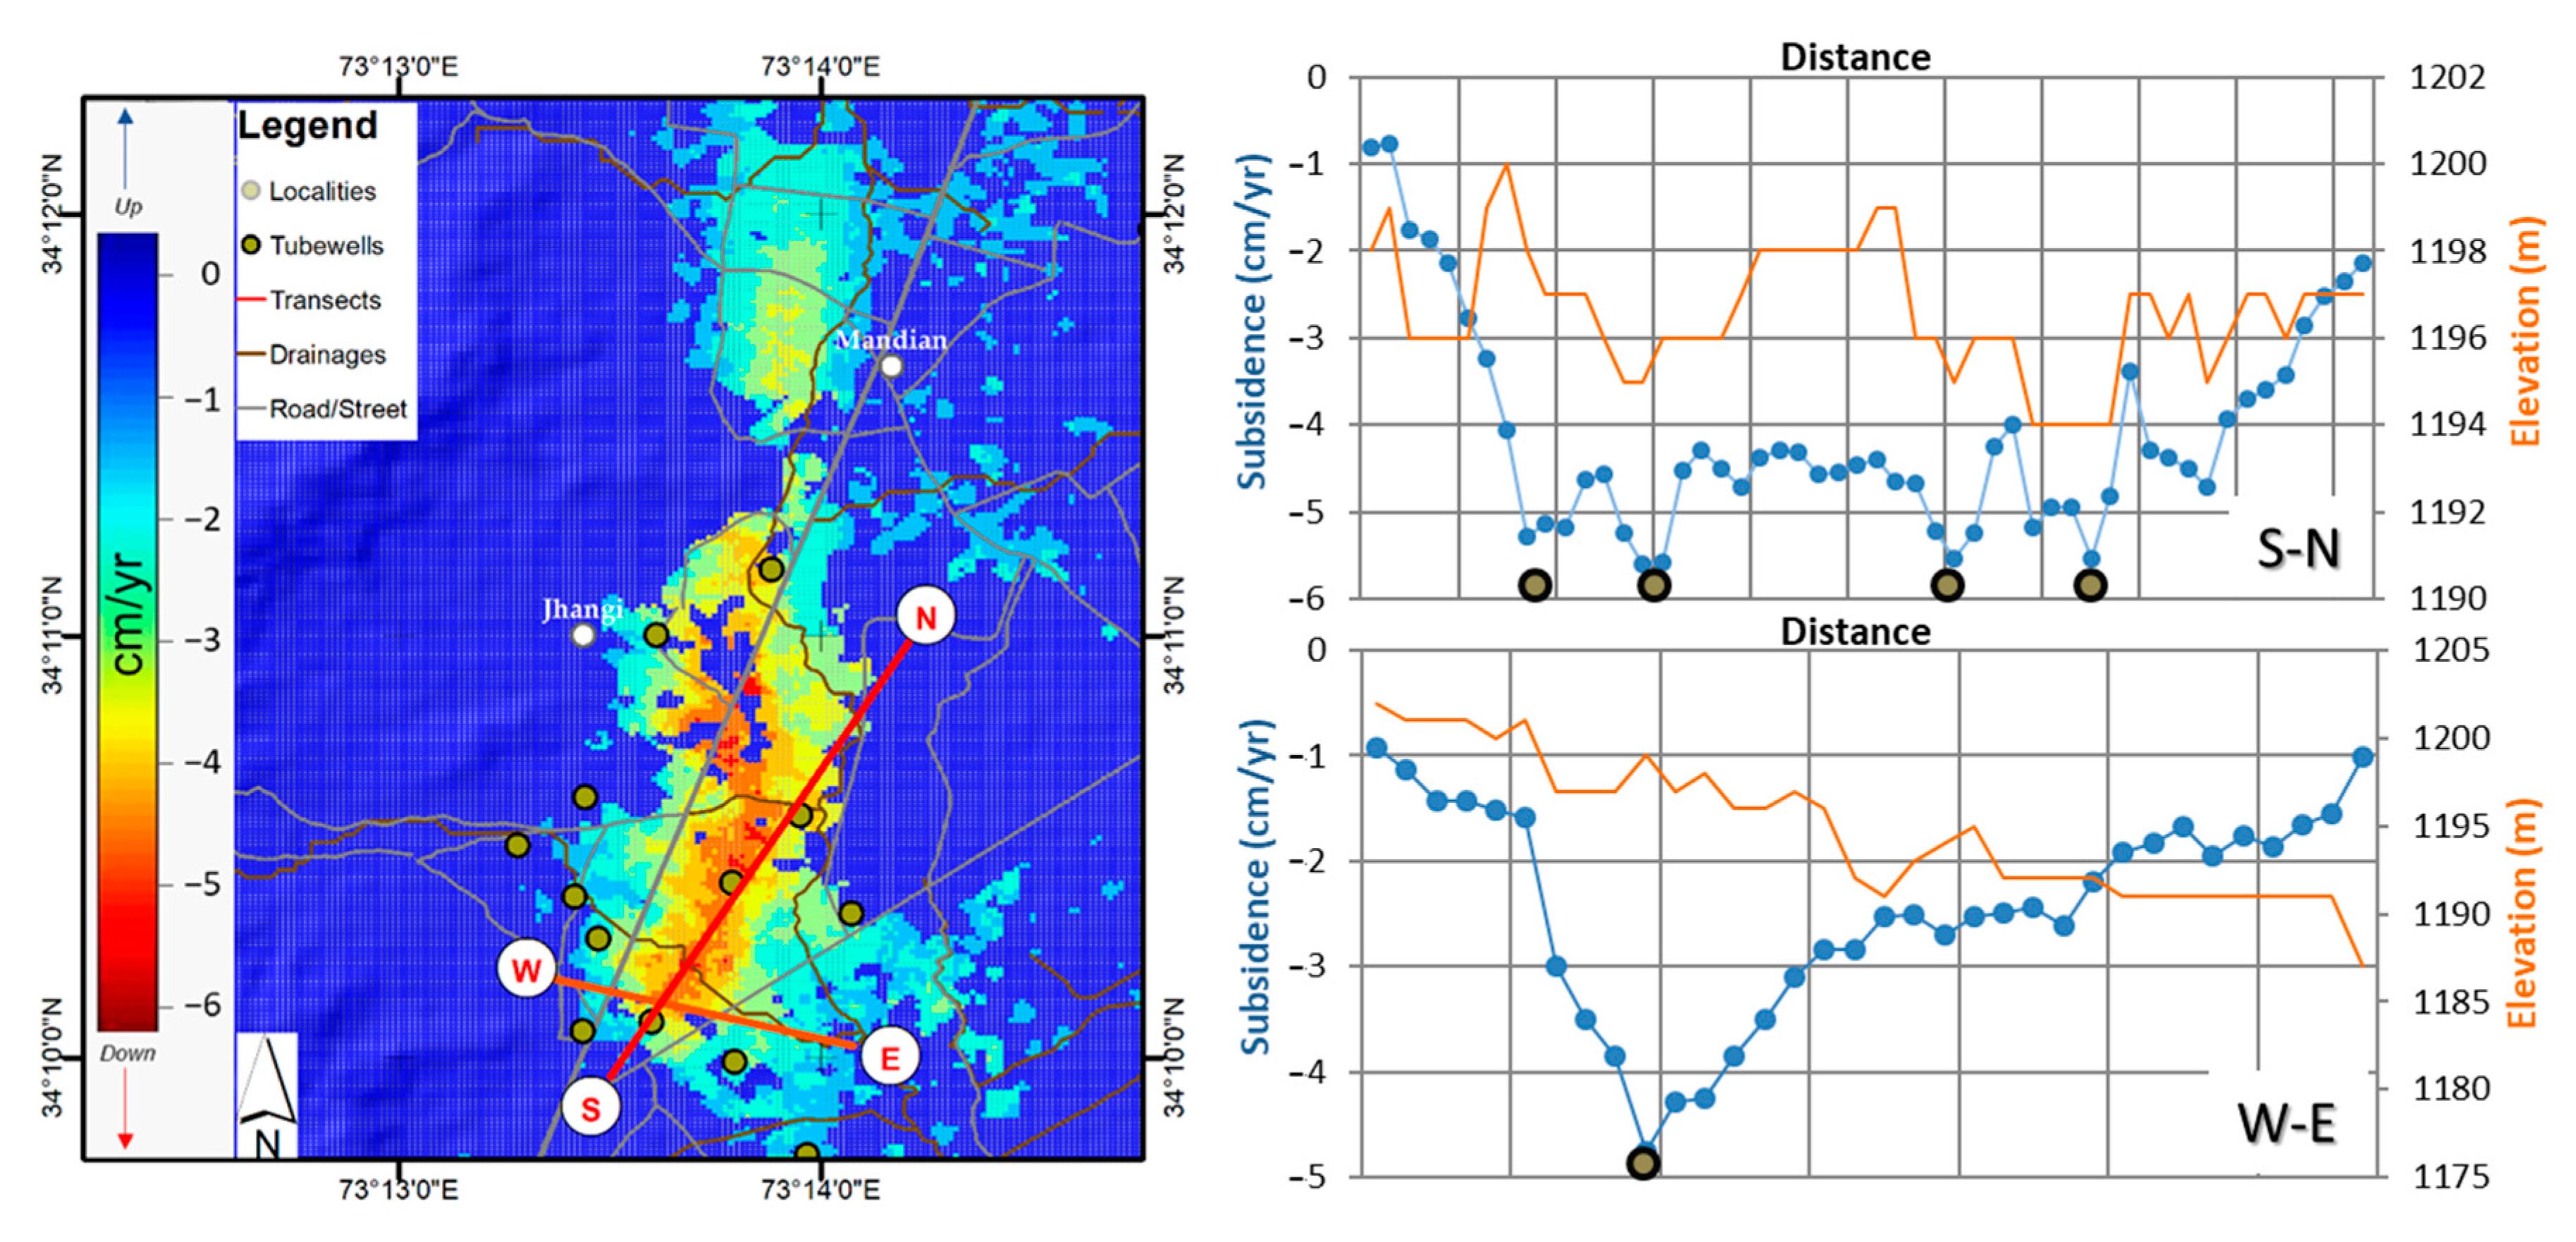
Being part of the valley and foothills, the city exhibits heavy flash floods. Several drainage systems were introduced in the area to move the flooded water from the city to the nearby river channels via Darkhan Katha into Dor River. With the passage of time, the situation of flooded and standing water in the city is becoming more severe, which results in paralysing the city with traffic jams, especially during rainfall seasons [48]. To better understand this scenario, the subsidence profiles along two transects, west to east (W–E) and south to north (S–N), were analyzed. It was observed that the magnitude of LOS subsidence along these transects decreases in value while moving from W–E or S–N, keeping the maximum values in the centers of the transects and causing a bowl-shaped profile, particularly along the W–E transect, and some major dips in the subsidence profile along the S–N transect (Figure 9). The comparison of these subsidence profiles with the actual ground elevation profiles can be seen in Figure 9. It is clear from Figure 9 that these bowl-shaped regions of subsidence zones in this part of the city are basically responsible for the standing water during the rainfall season, limiting human activity; navigation; and severe destruction to roads, streets, and buildings, making them prone to seepage as well.
In general, most subsidence areas in Abbottabad belong to residential area and commercial area. The subsidence in these areas is of course due to some underground activities related to various anthropogenic (e.g., ground water withdrawal) and natural (e.g., soil consolidation) processes. In most cases, the land subsidence pattern represents an integrated effect of both of these factors. In such cases, the anthropogenic factors act as a speed up tool for the naturally occurring events such as subsidence and degradation. Because of the increase in population with time, this subsidence and degradation can be related to the increase in the demand of the underground natural resources (water discharge). The detailed relationships of land subsidence with the categorized factors are discussed below.
5.1. Soil Consolidation
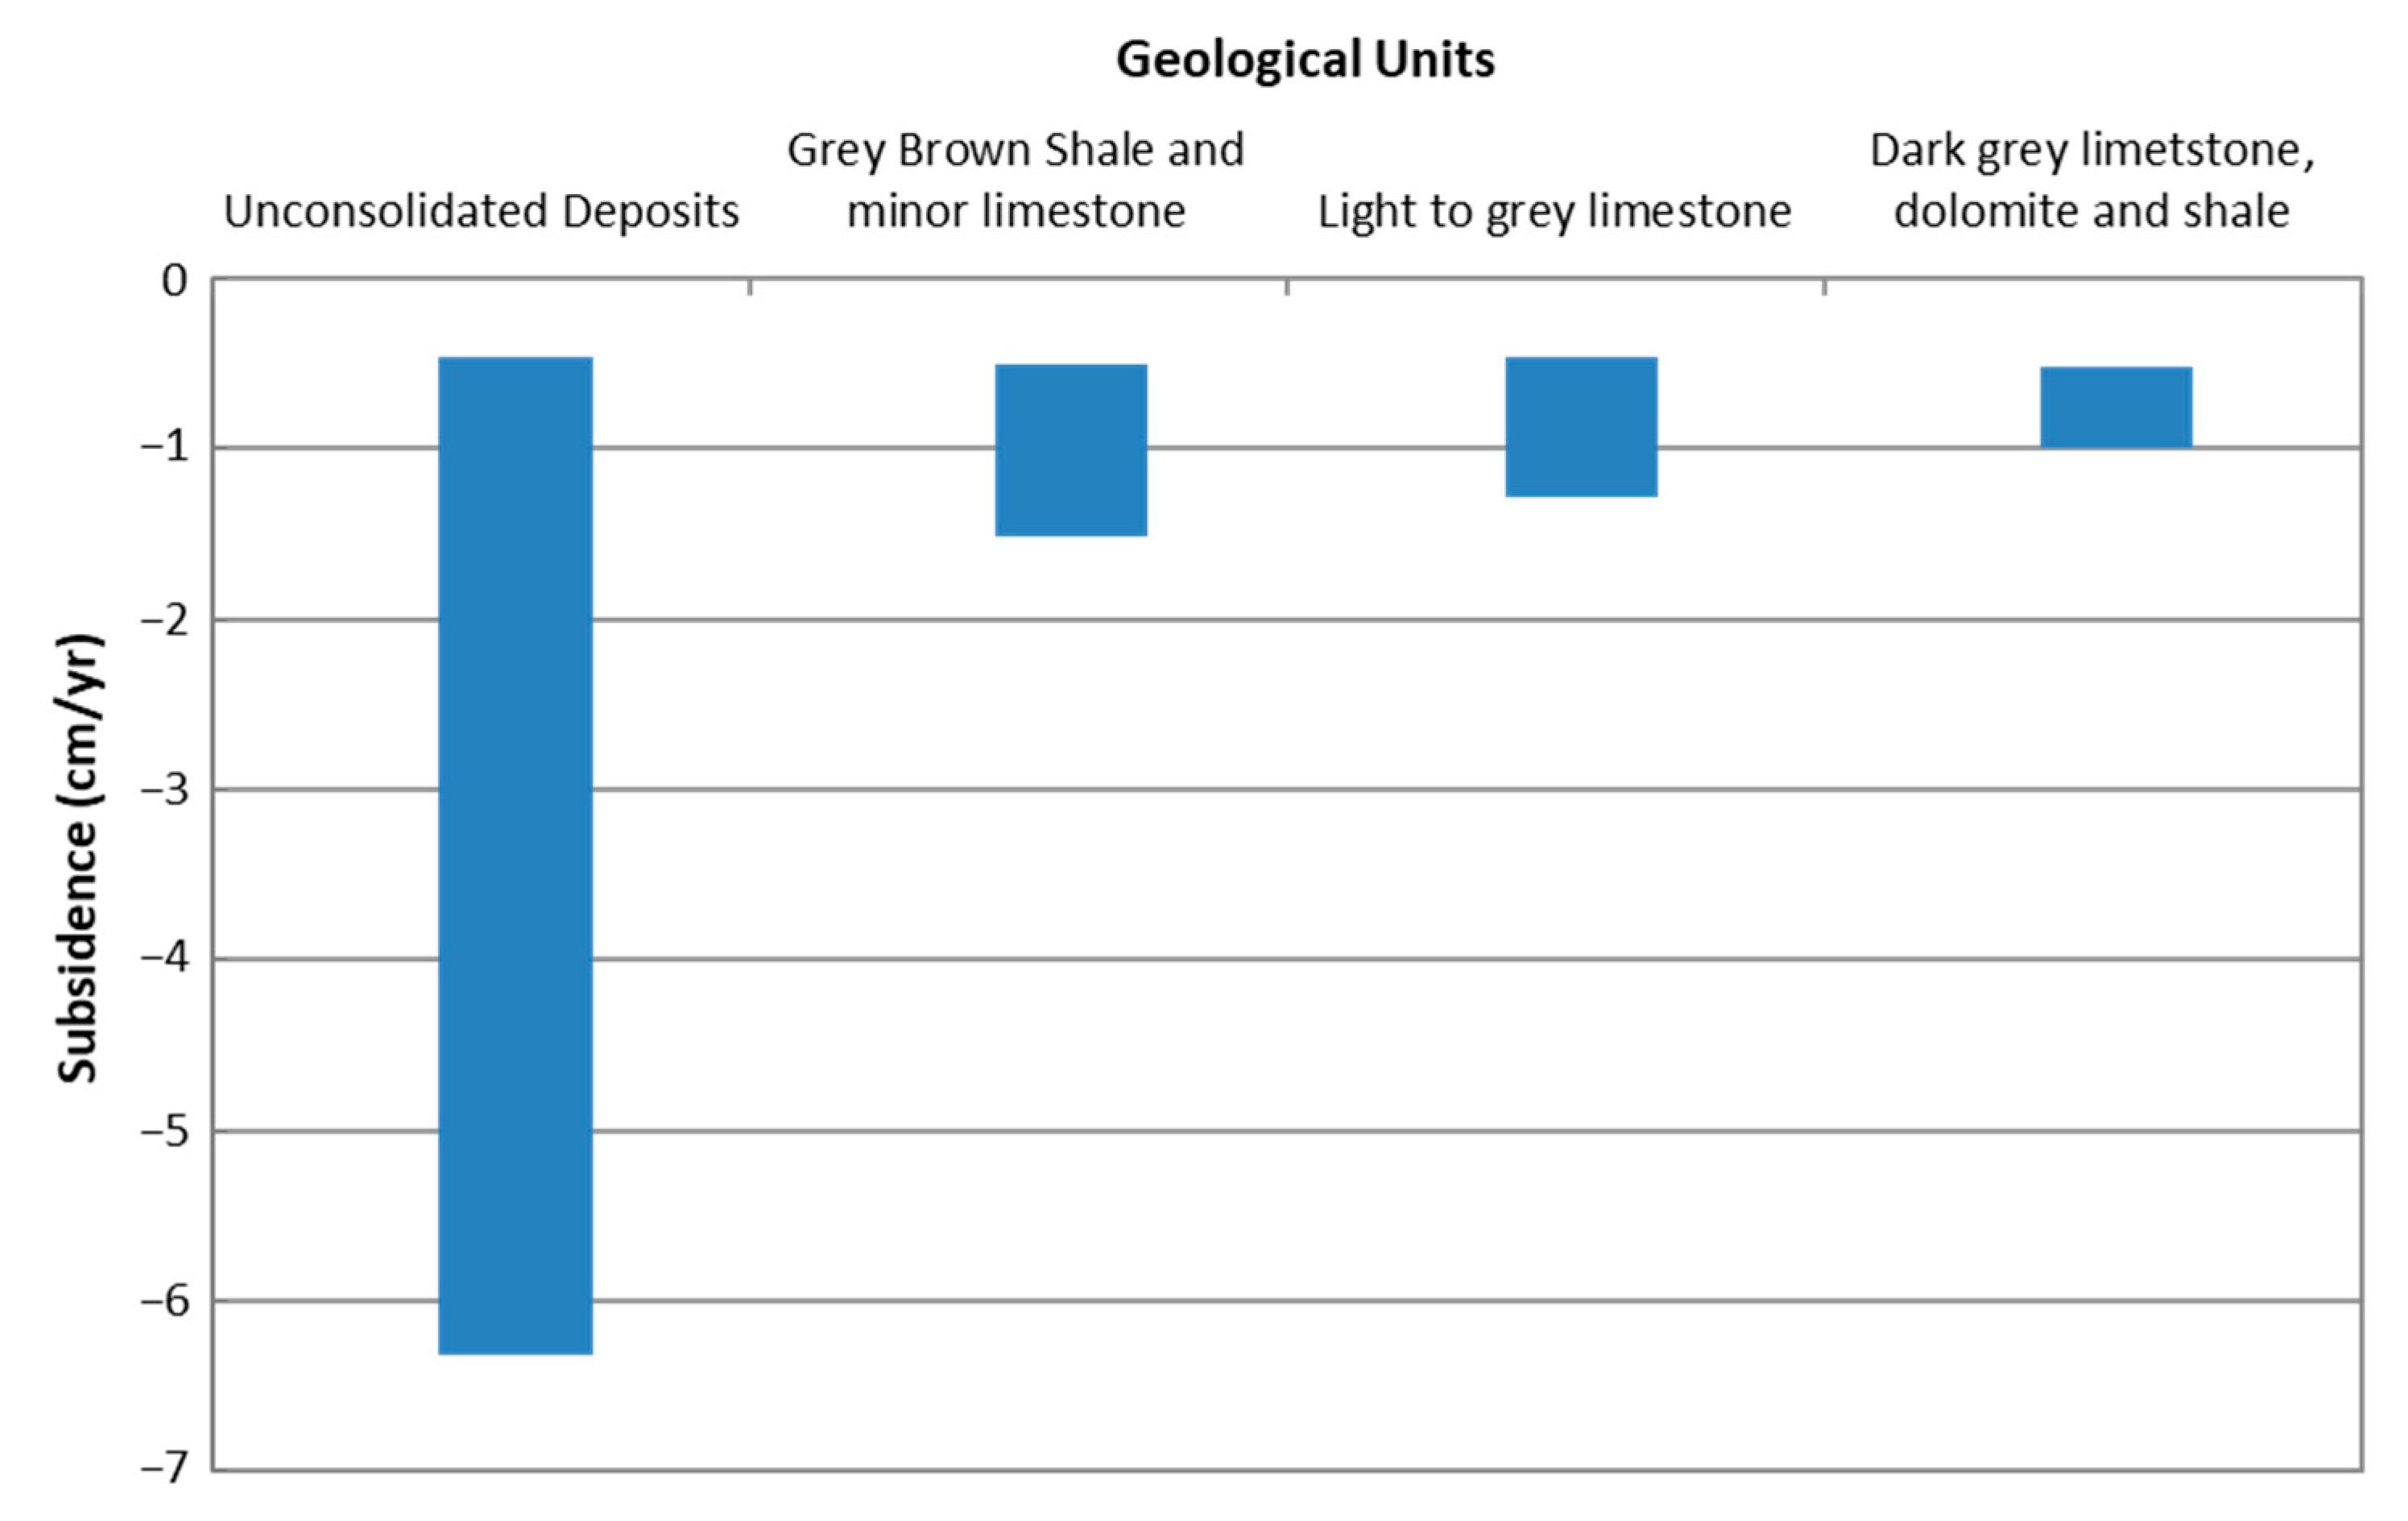
Unconsolidated soil is postulated as a primary driver of land subsidence in most of the major cities and areas of the world [6]. Figure 4 shows that most of the central part of the study area is located in alluvial sediments with grey brown shale and minor limestone in the west; dolomite, dark grey shale, light grey medium to thick bedded limestone in the south; and dolomite limestone comprised of sandstone and shale in the north [31]. Figure 10 shows the relationship between these geological units and average vertical subsidence rates. It can be observed in Figure 10 that most of the subsidence area belongs to unconsolidated deposits (alluvial surfaces).
Keeping in view the importance of unconsolidated deposits, which makes mattresses of aquifers, the three-layered structure analysis as presented by [46] showed that the first layer is comprised of clay and silt along the inter-beds of gravel, with a thickness of 30 to 40 m in the west and 70 to 80 m in the central part of the subsidence area; the second layer majorly consists of gravel with a conspicuously increased thickness of about 40 m in the center and southern part of the subsidence area; and the third layer of the unconsolidated soil in the region is underlying bedrock, represented by shale in the west and dolomite and limestone in the east. The thickness of the second layer increases while moving in a westerly direction along the transect W–E, which follows exactly the western extent of the subsidence region. This structural analysis showed a strong correlation with the overall extent subsidence. Although most of the land subsidence occurred in alluvium deposits, the direct correlation between this type of soil with subsidence may not be solely possible, but the direct correlation of this type of geological unit with the existence of aquifer and its exploitation (changing the unconsolidated surface to consolidated surface) could provide a better understanding of the land subsidence process in this populated part of the city.
5.2. Effect of Ground Water Withdrawal
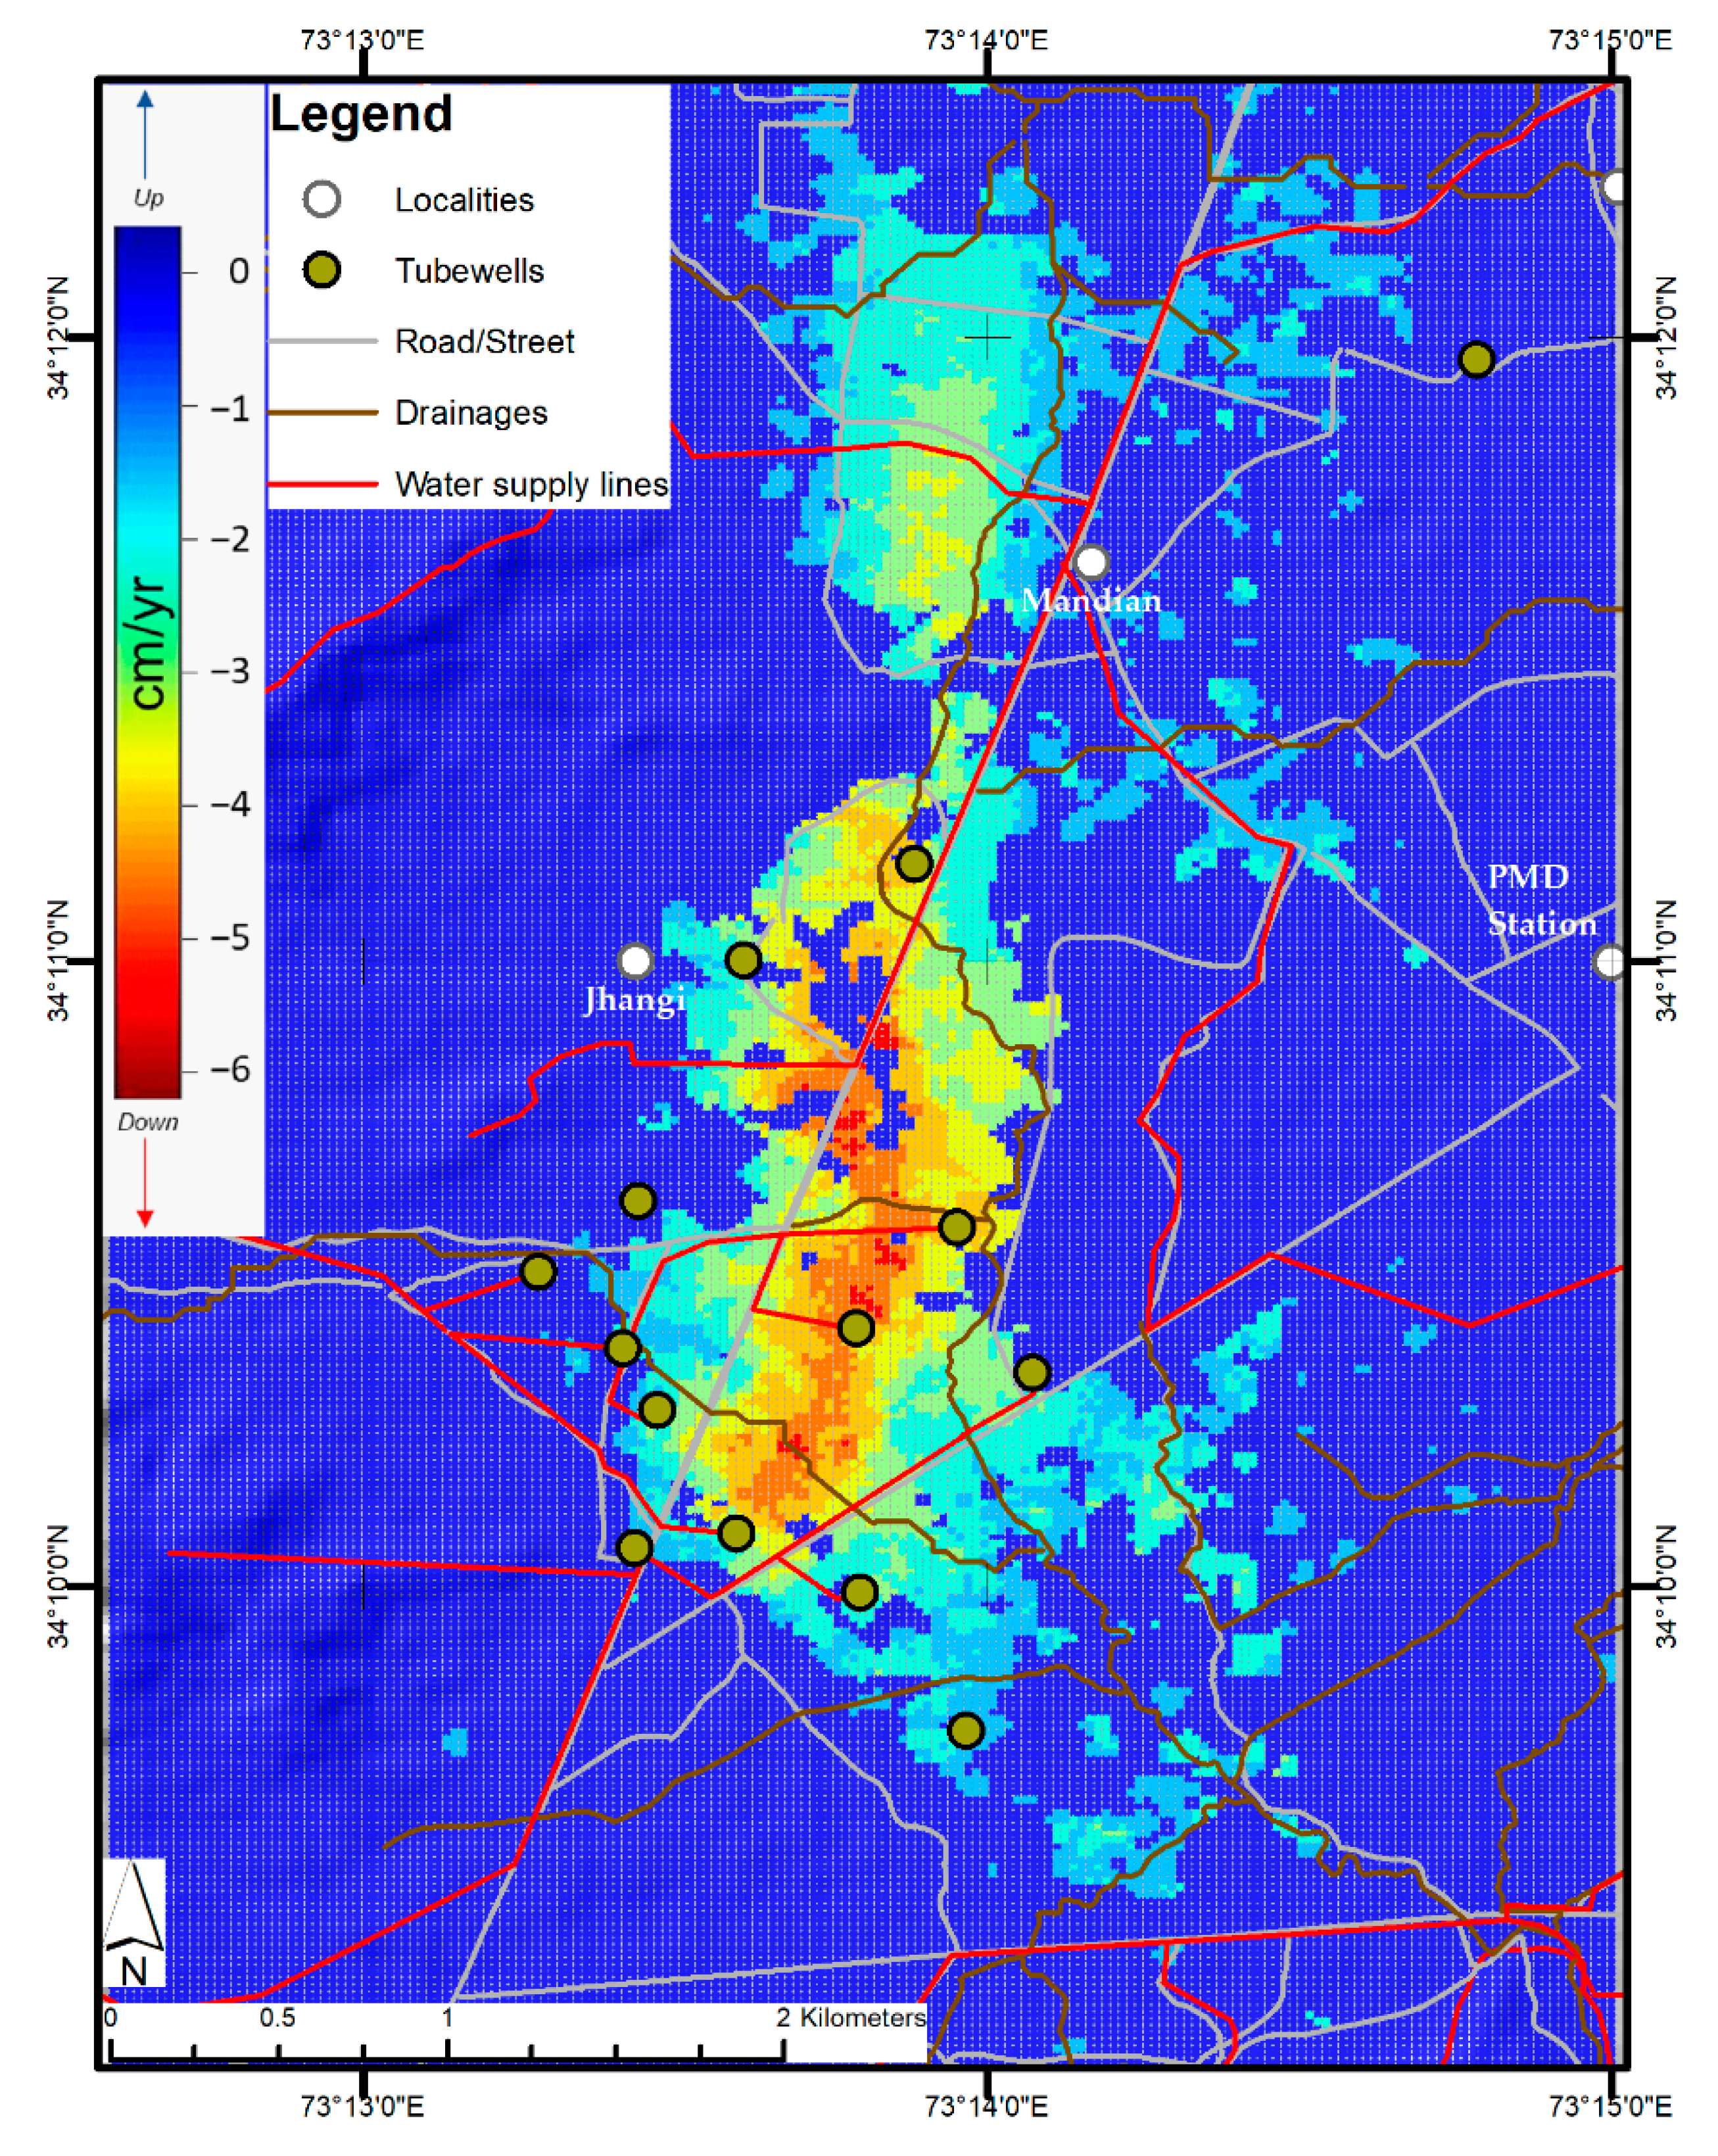
Anthropogenic factors mostly include infrastructure development, mining activities, and ground water exploitation. Abbottabad city and the surrounding area are mostly dependent on surface water and ground water. The increase in the contamination of water due to mixing of minerals from surrounded hills was bringing water-borne diseases into the community and becoming more severe with time [49]. In order to handle this situation, Government bodies implemented a number of safe drinking water schemes in the area. One of the major and most recent schemes was aided by the Japanese Government and implemented by Japan International Cooperation Agency (JICA) after conducting a survey in 2009 [46]. Under this project, combined use of surficial and underground water was proposed by repairing the old tubewells and building new tubewells in the areas with dense population. For this purpose, a network of water supply lines connecting surface water reservoirs and tubewells was developed (Figure 11), implemented, and handed over to the Government in October 2015 [50].
By comparing the subsidence of the area with the existing and implemented water supply scheme, it can be seen in Figure 9 that the crests along profiles W–E and S–N belong to the locations of tubewells. Similarly, it can be seen in Figure 11 that the extent and pattern of the subsidence zone follow the distributed locations of tubewells/boreholes. The edges of subsidizing zones are at relatively higher altitudes than the central part of the city and follow the locations of other tubewells in this area. As elaborated in Section 5.1, the aquifers in the study area are identified in the first and second layers of the underground soil and groundwater in these aquifers moves with varying water level from 1190 to 1210 m mean sea level (M.S.L); therefore, it was emphasized by the JICA team during the handing over of the project to monitor the water discharge in order to avoid major future issues, such as subsidence in the area. The increase of 3.5 percent population per year since 1999 in 2017, including an increase of 17 percent from 2009 to 2015 [47], ultimately increased the drinking water demand in the area.
Nevertheless, the area of higher subsidence rates agrees well with the tubewell in the study area; the deformation mostly started with an excessive increase of water pumping from developed tubewells during the investigating period. One of the other possibilities of this subsidence could be the water leakage problem in the underground pipes, as there have been more than 800 different cases reported regarding water leakage issues in the area. Moreover, illegal connections and uncontrolled pumping hours could also be responsible for the changing water table in the area.
In order to verify the cause of this change in the area, we analyzed the temporal correlation between IPTA-InSAR derived time series subsidence at investigated PSs, i.e., P1, P2, P3, and P4, and the precipitation (Figure 12). The collected precipitation data at the nearby Kakul station (the location of the station is shown in Figure 11) showed a strong correlation with time series trend (Figure 12). The seasonal variation in the ground water particularly after monsoon rainfall (June through September) justifies the cause of the subsidence in the area. The monsoon rainfall refills the aquifers, balancing the underground water discharge and stabilizing the process of subsidence. This clearly demonstrates the process and cause of subsidence in the study area. Zhang et al. [51] and Galloway et al. [52] showed a similar relationship and joint effect of natural and anthropogenic conditions with subsidence. Moreover, the identification of high subsidence particularly in the peripheries of tubewell locations showed a good ability of Sentinel 1A data and the IPTA approach for land subsidence mapping in this part of the region.
6. Conclusions and Future Work
In this study, the multi-temporal InSAR approach of IPTA was employed on multi-track Sentinel 1A TOPSAR images collected between January 2015 and December 2018 to analyze the spatio-temporal distribution and trend of subsidence in Abbottabad City and the surrounding area. Step by step processing chain of iterative IPTA approach was employed and the causes of the subsidence were investigated by analyzing the relationship between natural (soil consolidation) and anthropogenic factors (ground water extraction) in detail. The average subsidence rate map showed that the central part of the subsiding area, which is close to Karaokram highway and cantonment, including major localities such as Hassan town, Amir Alam Awan town, Mir alam town, and Jhangi Area, is sinking at a maximum rate of ~6.5 cm/year, varying from different rates up to 1 cm/year. Time series history graphs showed a close correlation with the rainfall during the investigation period and subsidence profiles along the W–E and S–N transects showed varying crests along the transects that are related to the locations of tubewells. The overall pattern of the subsidence was investigated, and it was found that it follows the development made for providing safe drinking water to the community under a recently completed project of JICA. The aquifer in this part of the Abbottabad basin is decreasing as a result of extensive water discharge in recent years, resulting in the consolidation of soil, further leading to the creation of several local problems in the area. Building dikes/bowls after rainfall or flood are ultimate responses to the subsidence processes and the concerned departments were unaware of this phenomenon in the study area. This study highlights the first ever evidence of land subsidence and its causes in the region, and the results obtained by implementing the advanced InSAR technique can provide support to the local government as well as decision and policy makers for better decision making and planning to overcome problems such as availability of drinking water, overflowing drains, sewage system, littered roads/streets, and sinking land in this part of the city.
Because in situ observations were not available, some decorrelation noises may be present in the final deformation maps, but they have been greatly minimized during 2D regression quality checks at each iteration. Therefore, the LOS deformation rates generated for each point target are basically reliable for mapping the land subsidence in the area, and showed consistency in the results of ascending and descending data sets. Despite our success of monitoring of subsidence in Abbottabad with IPTA, other MT-InSAR methods such as temporary coherent scatterer (TCP) and the Stanford method for persistent scatterers (StaMPS) could also be investigated in order to highlight the performance ability of these techniques in the area. Correlation of InSAR generated results with hazards related to land subsidence using GPS time series data and underground water level measurement can also be included in future research.
Author Contributions
All authors contributed to the manuscript and discussed the results. This research was supervised by X.D. Conceptualization, N.S. and X.D.; Data curation, N.S., H.L., and S.W.; Methodology, N.S. and S.W.; Formal Analysis, N.S. and H.L.; Funding acquisition, X.D. In addition, all authors contributed to the final revision of manuscript. All authors have read and agreed to the published version of the manuscript.
Funding
The first author is supported by a Hong Kong Ph.D. Fellowship of the Research Grant Council (RGC). The work was partly supported by the RGC (Grants Numbers: PolyU152164/18E and PolyU152233/19E), The Hong Kong Polytechnic University (project numbers: ZE1F and 1-ZVN6), and Research Institute for Sustainable Urban Development (RISUD) of The Hong Kong Polytechnic University (1-BBWB).
Acknowledgments
The authors wish to acknowledge the ESA for releasing and arranging the Sentinel-1A and its POD data. We greatly appreciate the editors and the reviewers for their constructive suggestions and insightful comments that helped us greatly to improve this manuscript.
Conflicts of Interest
The authors declare no conflict of interest.
References
- Zhou, L.; Guo, J.; Hu, J.; Li, J.; Xu, Y.; Pan, Y.; Shi, M. Wuhan surface subsidence analysis in 2015–2016 based on Sentinel-1A data by SBAS-InSAR. Remote Sens. 2017, 9, 982. [Google Scholar] [CrossRef] [Green Version]
- Deltares. Sinking Cities: An Integrated Approach Towards Solutions; Deltares—Taskforce Subsidence: Delft/Utrecht, The Netherlands, 2015. [Google Scholar]
- Wang, H.; Feng, G.; Xu, B.; Yu, Y.; Li, Z.; Du, Y.; Zhu, J. Deriving spatio-temporal development of ground subsidence due to subway construction and operation in delta regions with PS-InSAR data: A case study in Guangzhou, China. Remote Sens. 2017, 9, 1004. [Google Scholar] [CrossRef] [Green Version]
- Ding, X.L.; Liu, G.X.; Li, Z.W.; Li, Z.L.; Chen, Y.Q. Ground subsidence monitoring in Hong Kong with satellite SAR interferometry. Photogramm. Eng. Remote Sens. 2004, 70, 1151–1156. [Google Scholar] [CrossRef]
- Higgins, S.A.; Overeem, I.; Steckler, M.S.; Syvitski, J.P.M.; Seeber, L.; Akhter, S.H. InSAR measurements of compaction and subsidence in the Ganges-Brahmaputra Delta, Bangladesh. J. Geophys. Res. Earth Surf. 2014, 119, 1768–1781. [Google Scholar] [CrossRef]
- Holzer, T.L.; Johnson, A.I. Land subsidence caused by ground water withdrawal in urban areas. GeoJournal 1985, 11, 245–255. [Google Scholar] [CrossRef]
- Schmid, W.; Hanson, R.T.; Leake, S.A.; Hughes, J.D.; Niswonger, R.G. Feedback of land subsidence on the movement and conjunctive use of water resources. Environ. Model. Softw. 2014, 62, 253–270. [Google Scholar] [CrossRef]
- Galloway, D.L.; Burbey, T.J. Review: Regional land subsidence accompanying groundwater extraction. Hydrogeol. J. 2011, 19, 1459–1486. [Google Scholar] [CrossRef]
- Radutu, A.; Nedelcu, I.; Gogu, C.R. An overview of ground surface displacements generated by groundwater dynamics, revealed by InSAR techniques. Procedia Eng. 2017, 209, 119–126. [Google Scholar] [CrossRef]
- Ding, X.L.; Huang, D.F.; Yin, J.H.; Chen, Y.Q.; Lau, C.K.; Yang, Y.; Sun, Y.R.; Chen, W. A new generation of multi-antenna GPS system for landslide and structural deformation monitoring. In Advances in Building Technology; Anson, M., Ko, J.M., Lam, E.S.S., Eds.; Elsevier: Oxford, UK, 2002; pp. 1611–1618. ISBN 978-0-08-044100-9. [Google Scholar]
- Lingyun, J.; Qingliang, W.; Shuangxu, W. Present-day 3D deformation field of Northeast China, observed by GPS and leveling. Geod. Geodyn. 2014, 5, 34–40. [Google Scholar] [CrossRef] [Green Version]
- Aimaiti, Y.; Yamazaki, F.; Liu, W. Multi-Sensor InSAR Analysis of progressive land subsidence over the coastal city of Urayasu, Japan. Remote Sens. 2018, 10, 1304. [Google Scholar] [CrossRef] [Green Version]
- Ikuemonisan, F.E.; Ozebo, V.C.; Olatinsu, O.B. Geostatistical evaluation of spatial variability of land subsidence rates in Lagos, Nigeria. Geod. Geodyn. 2020, 11, 316–327. [Google Scholar] [CrossRef]
- Ding, X.L.; Li, Z.; Zhu, J.; Feng, G.; Long, J. Atmospheric effects on InSAR measurements and their mitigation. Sensors 2008, 8, 5426–5448. [Google Scholar] [CrossRef] [PubMed] [Green Version]
- Massonnet, D.; Feigl, K.L. Radar interferometry and its application to changes in the Earth’s surface. Rev. Geophys. 1998, 36, 441–500. [Google Scholar] [CrossRef] [Green Version]
- Zebker, H.A.; Villasenor, J. Decorrelation in interferometric radar echoes. IEEE Trans. Geosci. Remote Sens. 1992, 30, 950–959. [Google Scholar] [CrossRef] [Green Version]
- Hanssen, R.F. Radar Interferometry: Data Interpretation and Error Analysis (Remote Sensing and Digital Image Processing); van der Meer, F., Ed.; Kluwer Academic Publishers: Norwell, MA, USA, 2001; ISBN 9780792369455. [Google Scholar]
- Zhang, B.; Ding, X.L.; Zhu, W.; Wang, C.; Zhang, L.; Liu, Z. Mitigating ionospheric artifacts in coseismic interferogram based on offset field derived from ALOS-PALSAR data. IEEE J. Sel. Top. Appl. Earth Obs. Remote Sens. 2016, 9, 3050–3059. [Google Scholar] [CrossRef]
- Damoah-Afari, P.; Ding, X.L.; Zhong Lu, Z.L.; Omura, M. Magnitude and extent of six years of land subsidence in shanghai revealed by JERS-1 SAR data. In Geoscience and Remote Sensing New Achievements; Imperatore, P., Riccio, D., Eds.; IntechOpen Limited: London, UK, 2010. [Google Scholar]
- Pepe, A.; Calò, F. A review of interferometric synthetic aperture RADAR (InSAR) multi-track approaches for the retrieval of Earth’s surface displacements. Appl. Sci. 2017, 7, 1264. [Google Scholar] [CrossRef] [Green Version]
- Zhang, L.; Ding, X.L.; Lu, Z. Ground deformation mapping by fusion of multi-temporal interferometric synthetic aperture radar images: A review. Int. J. Image Data Fusion 2015, 6, 289–313. [Google Scholar] [CrossRef]
- Crosetto, M.; Monserrat, O.; Cuevas-González, M.; Devanthéry, N.; Crippa, B. Persistent scatterer interferometry: A review. ISPRS J. Photogramm. Remote Sens. 2016, 115, 78–89. [Google Scholar] [CrossRef] [Green Version]
- Hu, J.; Li, Z.W.; Ding, X.L.; Zhu, J.J.; Zhang, L.; Sun, Q. 3D coseismic displacement of 2010 Darfield, New Zealand earthquake estimated from multi-aperture InSAR and D-InSAR measurements. J. Geod. 2012, 86, 1029–1041. [Google Scholar] [CrossRef]
- Samsonov, S.V.; Feng, W.; Peltier, A.; Geirsson, H.; d’Oreye, N.; Tiampo, K.F. Multidimensional small baseline subset (MSBAS) for volcano monitoring in two dimensions: Opportunities and challenges. Case study Piton de la Fournaise volcano. J. Volcanol. Geotherm. Res. 2017, 344, 121–138. [Google Scholar] [CrossRef]
- Wang, C.; Ding, X.L.; Li, Q.; Shan, X.; Liu, P. Using an integer least squares estimator to connect isolated InSAR fringes in earthquake slip inversion. IEEE Trans. Geosci. Remote Sens. 2016, 54, 2899–2910. [Google Scholar] [CrossRef]
- Guangcai, F.; Zhiwei, L.; Xinjian, S.; Bing, X.; Yanan, D. Source parameters of the 2014 Mw 6.1 South Napa earthquake estimated from the Sentinel 1A, COSMO-SkyMed and GPS data. Tectonophysics 2015, 655, 139–146. [Google Scholar] [CrossRef]
- San-Ming, L.U.O.; Xin-Jian, S.; Wen-Wu, Z.H.U.; Kai-Fu, D.U.; Wen-Ni, W.A.N.; Hong-Bao, L.; Zhi-Guang, L.I.U. Monitoring vertical ground deformation in the North China Plain using the multitrack PSInSAR technique. Chin. J. Geophys. 2014, 57, 2139–3129. [Google Scholar] [CrossRef]
- Zhang, B.; Zhang, L.; Yang, H.; Zhang, Z.; Tao, J. Subsidence prediction and susceptibility zonation for collapse above goaf with thick alluvial cover: A case study of the Yongcheng coalfield, Henan Province, China. Bull. Eng. Geol. Environ. 2016, 75, 1117–1132. [Google Scholar] [CrossRef]
- Wegmuller, U.; Walter, D.; Spreckels, V.; Werner, C.L.; Wegmüller, U.; Walter, D.; Spreckels, V.; Werner, C.L. Nonuniform ground motion monitoring with TerraSAR-X persistent scatterer interferometry. IEEE Trans. Geosci. Remote Sens. 2010, 48, 895–904. [Google Scholar] [CrossRef]
- Mustafa, U.; Haq, M.; Ahmad, I. Environmental Fiscal Reform in Abbottabad: Drinking Water; Pastakia, F., Ed.; International Union for Conservation of Nature (IUCN): Islamabad, Pakistan, 2009. [Google Scholar]
- Hussain, Z.; Khan, S.; Khan, M.A.; Waseem, M.; Ahmed, W. Mapping sediment thickness of the Abbottabad basin, Pakistan. J. Earth Syst. Sci. 2018, 128, 7. [Google Scholar] [CrossRef] [Green Version]
- Pakistan Bureau of Statistics. Available online: http://www.pbs.gov.pk/ (accessed on 15 April 2020).
- Lasaponara, R.; Masini, N. Big Earth data for cultural heritage in the Copernicus era. In Remote Sensing for Archaeology and Cultural Landscapes: Best Practices and Perspectives Across Europe and the Middle East; Hadjimitsis, D.G., Themistocleous, K., Cuca, B., Agapiou, A., Lysandrou, V., Lasaponara, R., Masini, N., Schreier, G., Eds.; Springer International Publishing: Cham, Switzerland, 2020; pp. 31–46. ISBN 978-3-030-10979-0. [Google Scholar]
- Chen, Q.; Ding, X.L.; Liu, G.X. Method for optimum selection of common master acquisition for PS-InSAR. Acta Geod. Cartogr. Sin. 2007, 36, 395–399. [Google Scholar]
- Mora, O.; Mallorqui, J.J.; Broquetas, A. Linear and nonlinear terrain deformation maps from a reduced set of interferometric SAR images. IEEE Trans. Geosci. Remote Sens. 2003, 41, 2243–2253. [Google Scholar] [CrossRef]
- Werner, C.; Wegmuller, U.; Wiesmann, A.; Strozzi, T. Interferometric Point Target Analysis with JERS-1 L-band SAR data. In Proceedings of the IGARSS 2003. 2003 IEEE International Geoscience and Remote Sensing Symposium. Proceedings (IEEE Cat. No.03CH37477), Toulouse, France, 21–25 July 2003; Volume 7, pp. 4359–4361. [Google Scholar]
- Costantini, M. A novel phase unwrapping method based on network programming. IEEE Trans. Geosci. Remote Sens. 1998, 36, 813–821. [Google Scholar] [CrossRef]
- Rabus, B.; Werner, C.; Wegmueller, U.; McCardle, A. Interferometric point target analysis of RADARSAT-1 data for deformation monitoring at the Belridge/Lost Hills oil fields. In Proceedings of the International Geoscience and Remote Sensing Symposium (IGARSS), Anchorage, AK, USA, 20–24 September 2004. [Google Scholar]
- Werner, C.L.; Wegmüller, U.; Strozzi, T. Deformation time-series of the lost-hills oil field using a multi-baseline interferometric SAR inversion algorithm with finite difference smoothing constraints. In Proceedings of the AGU Fall Meeting Abstracts, San Francisco, CA, USA, 3–7 December 2012. [Google Scholar]
- Wright, T.J.; Parsons, B.E.; Lu, Z. Toward mapping surface deformation in three dimensions using InSAR. Geophys. Res. Lett. 2004, 31. [Google Scholar] [CrossRef] [Green Version]
- Samiei-Esfahany, S.; Hanssen, R.F.; Van Thienen-visser, K.; Muntendam-bos, A. On the effect of horizontal deformation on InSAR subsidence estimates. In Proceedings of the Fringe 2009, Frascati, Italy, 30 November–4 December 2009. [Google Scholar]
- Aslan, G.; Cakir, Z.; Lasserre, C.; Renard, F. Investigating subsidence in the Bursa Plain, Turkey, using ascending and descending Sentinel-1 Satellite Data. Remote Sens. 2019, 11, 85. [Google Scholar] [CrossRef] [Green Version]
- Cui, Z.D.; Yang, J.Q.; Yuan, L. Land subsidence caused by the interaction of high-rise buildings in soft soil areas. Nat. Hazards 2015, 79, 1199–1217. [Google Scholar] [CrossRef]
- GSP. Geological Map of Abbottabad area NWFP, Pakistan. Map series Vol. III at 1:50,000 scale, Issued by Director General. Geological Survey of Pakistan (GSP). 2002. Available online: https://www.gsp.gov.pk/ (accessed on 19 October 2020).
- Japan International Cooperation Agency (JICA). Basic Design Study Report on the Project for Improvement of the Water Supply in Abbottabad, Pakistan; Japan International Cooperation Agency: Tokyo, Japan, 2004. [Google Scholar]
- Japan International Cooperation Agency (JICA). Preparatory Survey Report on the Project for the Improvement of Water Supply System in Abbottabad, Pakistan; Japan International Cooperation Agency: Tokyo, Japan, 2009. [Google Scholar]
- Japan International Cooperation Agency (JICA). Ex-Post Project Evaluation 2017: Package IV—5 (Pakistan, Bangladesh); Japan International Cooperation Agency: Tokyo, Japan, 2018. [Google Scholar]
- Recorder, B. Rain Continues to Paralysis Life in Hazara. Available online: https://fp.brecorder.com/2018/08/20180809397986/ (accessed on 20 April 2020).
- Ahmed, T.; Pervez, A.; Mehtab, M.; Sherwani, S.K. Assessment of drinking water quality and its potential health impacts in academic institutions of Abbottabad (Pakistan). Desalin. Water Treat. 2015, 54, 1819–1828. [Google Scholar] [CrossRef]
- Japan Gifts Water Supply System to Abbottabad. Available online: https://www.jica.go.jp/pakistan/english/office/topics/press151015.html (accessed on 10 May 2020).
- Zhang, Y.; Liu, Y.; Jin, M.; Jing, Y.; Liu, Y.; Liu, Y.; Sun, W.; Wei, J.; Chen, Y. Monitoring land subsidence in Wuhan city (China) using the SBAS-INSAR method with radarsat-2 imagery data. Sensors (Switzerland) 2019, 19, 743. [Google Scholar] [CrossRef] [PubMed] [Green Version]
- Galloway, D.L.; Coplin, L.S.; Ingebritsen, S.E. Effects of land subsidence in the Greater Houston Area. In Managing Urban Water Supply; Agthe, D.E., Billings, R.B., Buras, N., Eds.; Springer: Dordrecht, The Netherlands, 2003; pp. 187–203. ISBN 978-94-017-0237-9. [Google Scholar]
Figure 1.
Location map of study area.

Figure 2.
Processing workflow for interferometric point target analysis (IPTA).

Figure 3.
Baseline vs. time plots (left) ascending orbit data (right) descending orbit data.

Figure 4.
Geological map of the study area.

Figure 5.
Average line of sight (LOS) velocity maps: (a) ascending and (b) descending orbits’ data.

Figure 6.
Mean vertical velocity map in cm/year. The red color represents downward movement (i.e., subsidence).
Figure 6.
Mean vertical velocity map in cm/year. The red color represents downward movement (i.e., subsidence).

Figure 7.
Six different stages of cumulative land subsidence pattern in RADAR geometry. The background image is the averaged intensity image of the study area. One color cycle corresponds to 10 cm/year displacement.
Figure 7.
Six different stages of cumulative land subsidence pattern in RADAR geometry. The background image is the averaged intensity image of the study area. One color cycle corresponds to 10 cm/year displacement.

Figure 8.
Time series evaluation of averaged LOS deformation presented using ascending data: (a) location of PSs, (b) P1, (c) P2, (d) P3, and (e) P4.
Figure 8.
Time series evaluation of averaged LOS deformation presented using ascending data: (a) location of PSs, (b) P1, (c) P2, (d) P3, and (e) P4.

Figure 9.
Subsidence profile along the S–N and W–E transects.

Figure 10.
Relationship between geological units and average subsidence rate.

Figure 11.
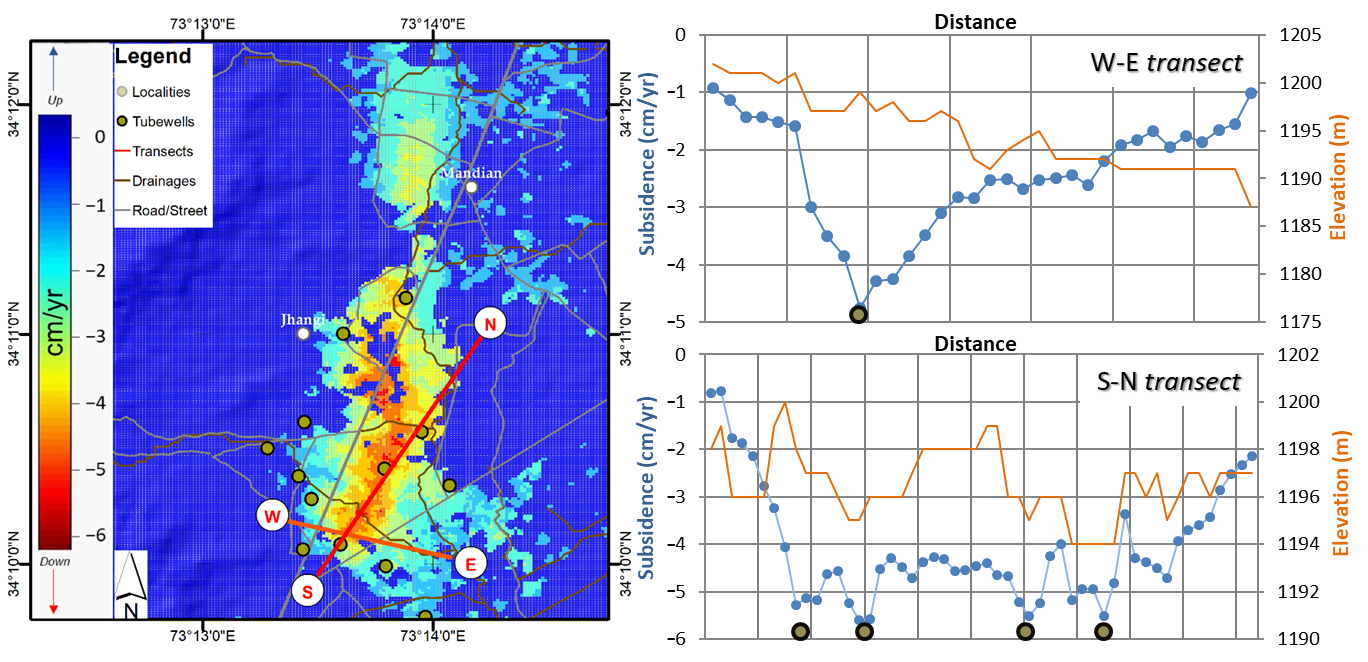
Location of tubewells and supply lines overlaid on average vertical velocity map.

Figure 12.
Time series LOS subsidence of PS points P1, P2, P3, and P4 versus daily precipitation at Kakul Station.
Figure 12.
Time series LOS subsidence of PS points P1, P2, P3, and P4 versus daily precipitation at Kakul Station.

Publisher’s Note: MDPI stays neutral with regard to jurisdictional claims in published maps and institutional affiliations. |
© 2020 by the authors. Licensee MDPI, Basel, Switzerland. This article is an open access article distributed under the terms and conditions of the Creative Commons Attribution (CC BY) license (http://creativecommons.org/licenses/by/4.0/).
Share and Cite
MDPI and ACS Style
Shahzad, N.; Ding, X.; Wu, S.; Liang, H. Ground Deformation and Its Causes in Abbottabad City, Pakistan from Sentinel-1A Data and MT-InSAR. Remote Sens. 2020, 12, 3442. https://0-doi-org.brum.beds.ac.uk/10.3390/rs12203442
AMA Style
Shahzad N, Ding X, Wu S, Liang H. Ground Deformation and Its Causes in Abbottabad City, Pakistan from Sentinel-1A Data and MT-InSAR. Remote Sensing. 2020; 12(20):3442. https://0-doi-org.brum.beds.ac.uk/10.3390/rs12203442
Chicago/Turabian StyleShahzad, Naeem, Xiaoli Ding, Songbo Wu, and Hongyu Liang. 2020. "Ground Deformation and Its Causes in Abbottabad City, Pakistan from Sentinel-1A Data and MT-InSAR" Remote Sensing 12, no. 20: 3442. https://0-doi-org.brum.beds.ac.uk/10.3390/rs12203442
Note that from the first issue of 2016, this journal uses article numbers instead of page numbers. See further details here.