1. Introduction
Obtaining accurate wave conditions is a crucial issue for both marine activities and geographic science, such as the ocean climate. Significant wave height (SWH) is the most commonly used and effective parameter not only for describing sea surface dynamics but also for wave forecasting.
Providing in situ observations, wave buoys are the traditional means of observing waves. Wave buoys can measure diverse and comprehensive wave information, such as the SWH, mean period and even directional wave spectra. Because of their direct measurement of the ocean surface, buoy observations are always considered one of the most accurate ways to obtain SWH, which tends to be used as the ground truth for wave conditions in a wide variety of related applications. Wave observations are widely used in the validation/calibration phase of wave remote sensing missions to improve the retrieval algorithm [
1], and buoy data are used as reliable references to validate and improve the physical processes, parametric schemes or model settings implemented in wave models [
2,
3,
4]. As the traditional method of wave monitoring, buoys record long-term data that can indicate trends in climate change [
5]. Therefore, wave buoy observations are one of the fundamentals of both oceanography and atmospheric sciences, and the accuracy and consistency of wave buoys are both extremely important for further usage.
However, a wave buoy is a complex system that is composed of multiple instruments and can be classified into various types or models. There are significant differences in the shapes and sizes of the hulls, measurement principles of the sensors, calculation methods, etc., and all these aspects have certain impacts on the accuracy of the buoy measurements [
6]. It is known that a national wave buoy network is always a combination of various types of buoys, in addition to the diverse models used by different countries. The buoy network supported by the National Data Buoy Center (NDBC) under the National Oceanic and Atmospheric Administration (NOAA), which is widely used in operations and research, contains several different hull types, such as 3, 6 and 12 m diameters [
7]. The European buoy network, which is operated by the Met Office and Meteo-France, mainly uses 3 m buoys in the Atlantic and some vessels in the English Channel [
8]. Meanwhile, the Chinese operational wave buoy network, which belongs to the State Oceanic Administration (SOA) and Ministry of Natural Resources (MNR), is made up of 10m discus buoys that weight more than 50 tons each. It is necessary and valuable to calibrate the different buoy types or instrumental conditions before applying their data. Therefore, adequate works and studies focus on this objective. Both hardware and algorithm upgrades have been performed to improve the accuracy and maintain the consistency of NDBC buoys [
9,
10]. The errors in the NDBC buoy data are removed before these data are used in the analysis of long-term trends in wave height [
11]. The wave measurements from light vessels were indicated to be less accurate than those from buoys based on the comparison to the SWH of the wave model, and vessels impart a significant negative bias due to their weights and sizes when compared to regular wave buoys [
12]. Apart from the difference in buoy attributes, biological attachments also impact SWH observations if the buoy experiences biofouling [
13].
Consistency between different national wave buoy systems is equally important as, if not more important than, the intercomparison within a single buoy network. This is because inconsistency between different networks prompts misleading directions of global wave forecast model tuning [
14] or incorrect regional wave climate trends. Using parallel observations in field experiments is the most direct and effective way to obtain the consistency of different buoys by making simultaneous comparisons at close distances [
15]. However, there would be many difficulties (e.g., excessive cost) in performing parallel comparisons between buoys from different national buoy networks, e.g., the NDBC and the Chinese operational buoy observation systems.
Therefore, a remote cross-calibration method dealing with widely separated wave buoys is essential for the subsequent usage of buoy wave data. The relative accuracy of buoys can be obtained by comparing both to another independent wave data source. The SWH results from a wave model are used as a reference to characterize the difference between 3 m buoys and light vessels [
12]; however, the accuracy of the wave model is strongly related to regional metrological, climate or topographic features. Therefore, this method, which treats the wave model as a stable reference, may not work for buoys located excessively far apart.
After three decades of rapid development and improvement, space-borne altimeters such as the Jason [
16,
17,
18] and HY2 series [
19,
20] now provide global wave observations under all weather conditions. The SWH from the altimeter nadir is accurate enough to be applied in validation or improvement of numerical wave models [
21,
22,
23] and in wave climate studies [
24]. Furthermore, the inversion principle of altimeters, which obtains the SWH from the slope of the leading edge of the returned signal, means that the accuracy of altimeters is not significantly related to regional metrological conditions. Therefore, the SWH from altimeters can be used as a reliable standalone reference in characterizing the buoy errors. Currently, Jason-3, Sentinel-3A and 3B, SARAL and HY-2B are routinely used in operational service with high and stable accuracy.
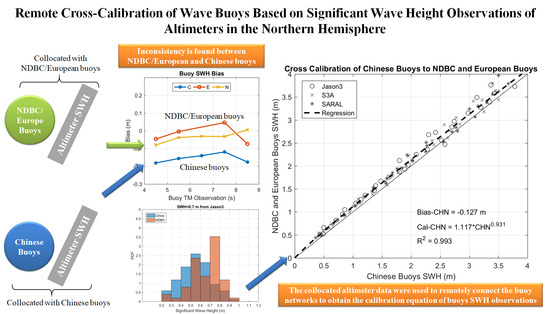
In this paper, we present how we use multi-mission altimeter SWHs to perform remote cross-calibration of buoys belonging to different networks. We first introduce the altimeter observations and the buoy data that are used. We then show the significant differences that result from the assessments of the same altimeter against different buoy networks. Then, we explain how to remotely “connect” buoys from different networks by collocation of altimeters and accomplish the remote cross-calibration of these buoys. The effectiveness of the remote calibration method is proven by assessing the HY2B altimeter SWH based on different buoy networks. Finally, the discussion and conclusions are presented.
2. Data and Validation of Altimeters against Buoy Networks
In this paper, the altimeter L2 geophysical data records (GDRs) for Jason-3, SARAL, and Sentinel-3A from 1 January 2018, to 31 December 2019, were used to perform both the validation and cross-calibration of buoy networks. The L2 products from April 2019 to July 2020 of HY2B were used in the assessment to show the difference in validation results before and after buoy cross-calibration. HY2B was launched in October 2018 and is now the world’s newest altimeter and the calibration/validation phase has indicated good accuracy of wave observations [
25,
26].
The wave observations of the buoys from the NDBC, European and Chinese networks are collocated with altimeters. The locations of all buoys mentioned are shown by red circles marked in
Figure 1. We used 45 buoys from the NDBC, 4 buoys from the European network and 16 buoys from the Chinese network in this paper. To remove the land effect on the altimeter signal, only buoys with distances offshore greater than 50 km were considered. These buoys provided hourly SWH and mean wave period observations.
The validations of the SWHs from the altimeters were performed against the buoys from the NDBC, European and Chinese networks to verify whether the three buoy networks showed consistent results. The observations from the altimeters and buoys were matched according to the following rules: spatially, we retained only the altimeter footprint nearest to the buoy location and the distance between the crossovers was considered to be less than 50 km; temporally, the gap in the SWH observation times between the altimeter and the collocated buoy had to be less than 1 h (±30 min). During the validation of altimeter SWH data, statistical analyses based on the bias, normalized root mean square error (NRMSE), root mean square error (RMSE) and scatter index (SI) were implemented. These statistical parameters are defined as follows:
where
represents the SWH from altimeters and
is the matched buoy observation.
The assessments of Jason-3, Sentinel-3A, SARAL and HY2B SWHs were performed against the three buoy networks.
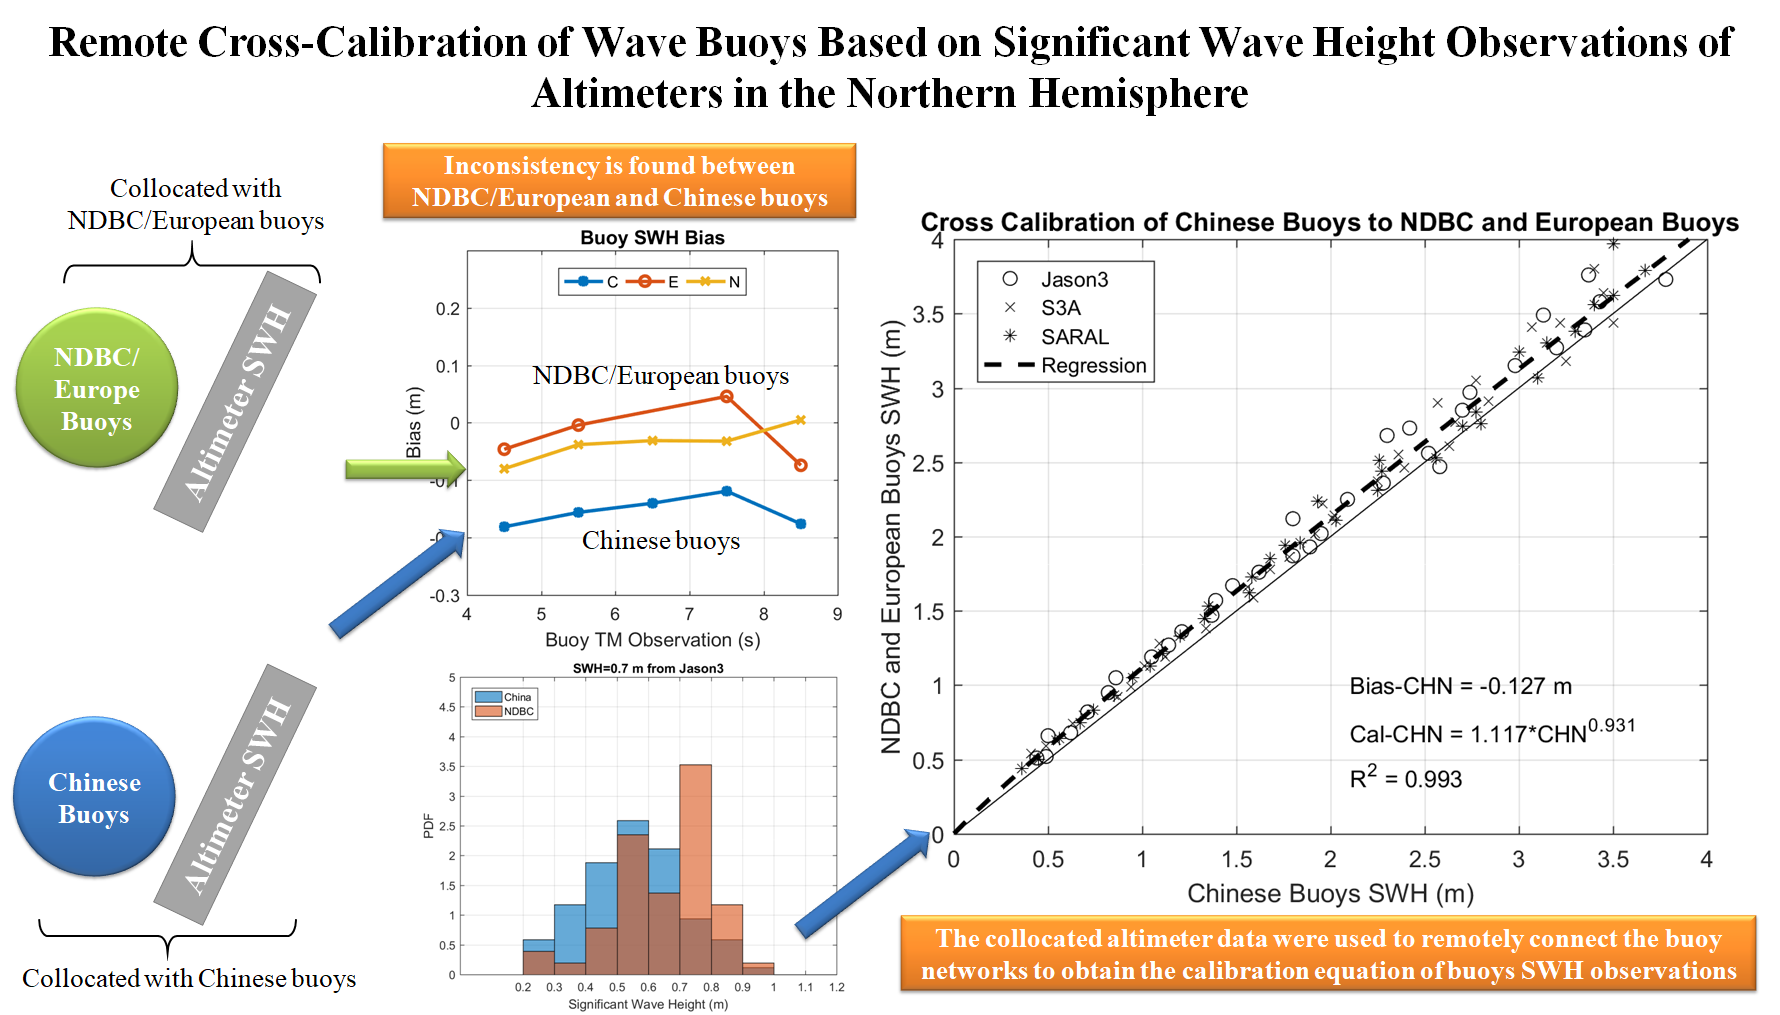
Figure 2 first shows the assessment of the Jason-3 SWH from the L2 GDR products. From the scatter diagrams in
Figure 2a–c, in general, the Jason-3 SWH shows a reasonable scatter against the three buoy systems. However, one can find a positive shift in the scatter against the Chinese network compared to the other two buoy networks. The statistical parameters also indicate this shift. Limited biases of 0.020 m and 0.047 m were obtained from the comparison against the European and NDBC buoy networks, respectively, while a 0.168 m positive bias was obtained from the Chinese buoy network. Significant differences in NRMSE and SI were also found in the assessment results between the Chinese buoys and NDBC/European buoys, which were 25.1% to 11.5%/12.2% and 20.6% to 11.5%/12.0%, respectively. We also investigated the variation of the bias and NRMSE with the SWH ranges, as illustrated in
Figure 2c–e. Six SWH ranges were considered. We clearly see that the positive bias from the validation against the Chinese network was observed for all SWH ranges, while the bias distributions from the European and NDBC buoys were close to each other. This shows that the buoys from the European and NDBC networks give similar bias estimation with respect to Jason-3, but the Chinese buoys give a much more positive bias.
Figure 2e shows the percentage of the bias obtained from dividing by the mean SWH in each SWH range. The Chinese buoys again showed a significant deviation when compared to the European and NDBC networks. In the section from 1 m to 1.5 m, the Chinese buoys showed that the proportion of the bias accounts for 30% of the average SWH observed, which is two times larger than those from the European and NDBC buoys. A similar situation was also found in the NRMSE distribution. The NRMSE from Chinese buoys again stands out when the SWH was lower than 3 m, after which all the curves became centralized. From the assessment of Jason-3 SWH against the three buoy networks, the European and NDBC buoys show similar validation results; however, an obvious difference was found from the Chinese buoys which mean an inconsistency among the buoy networks can be inferred.
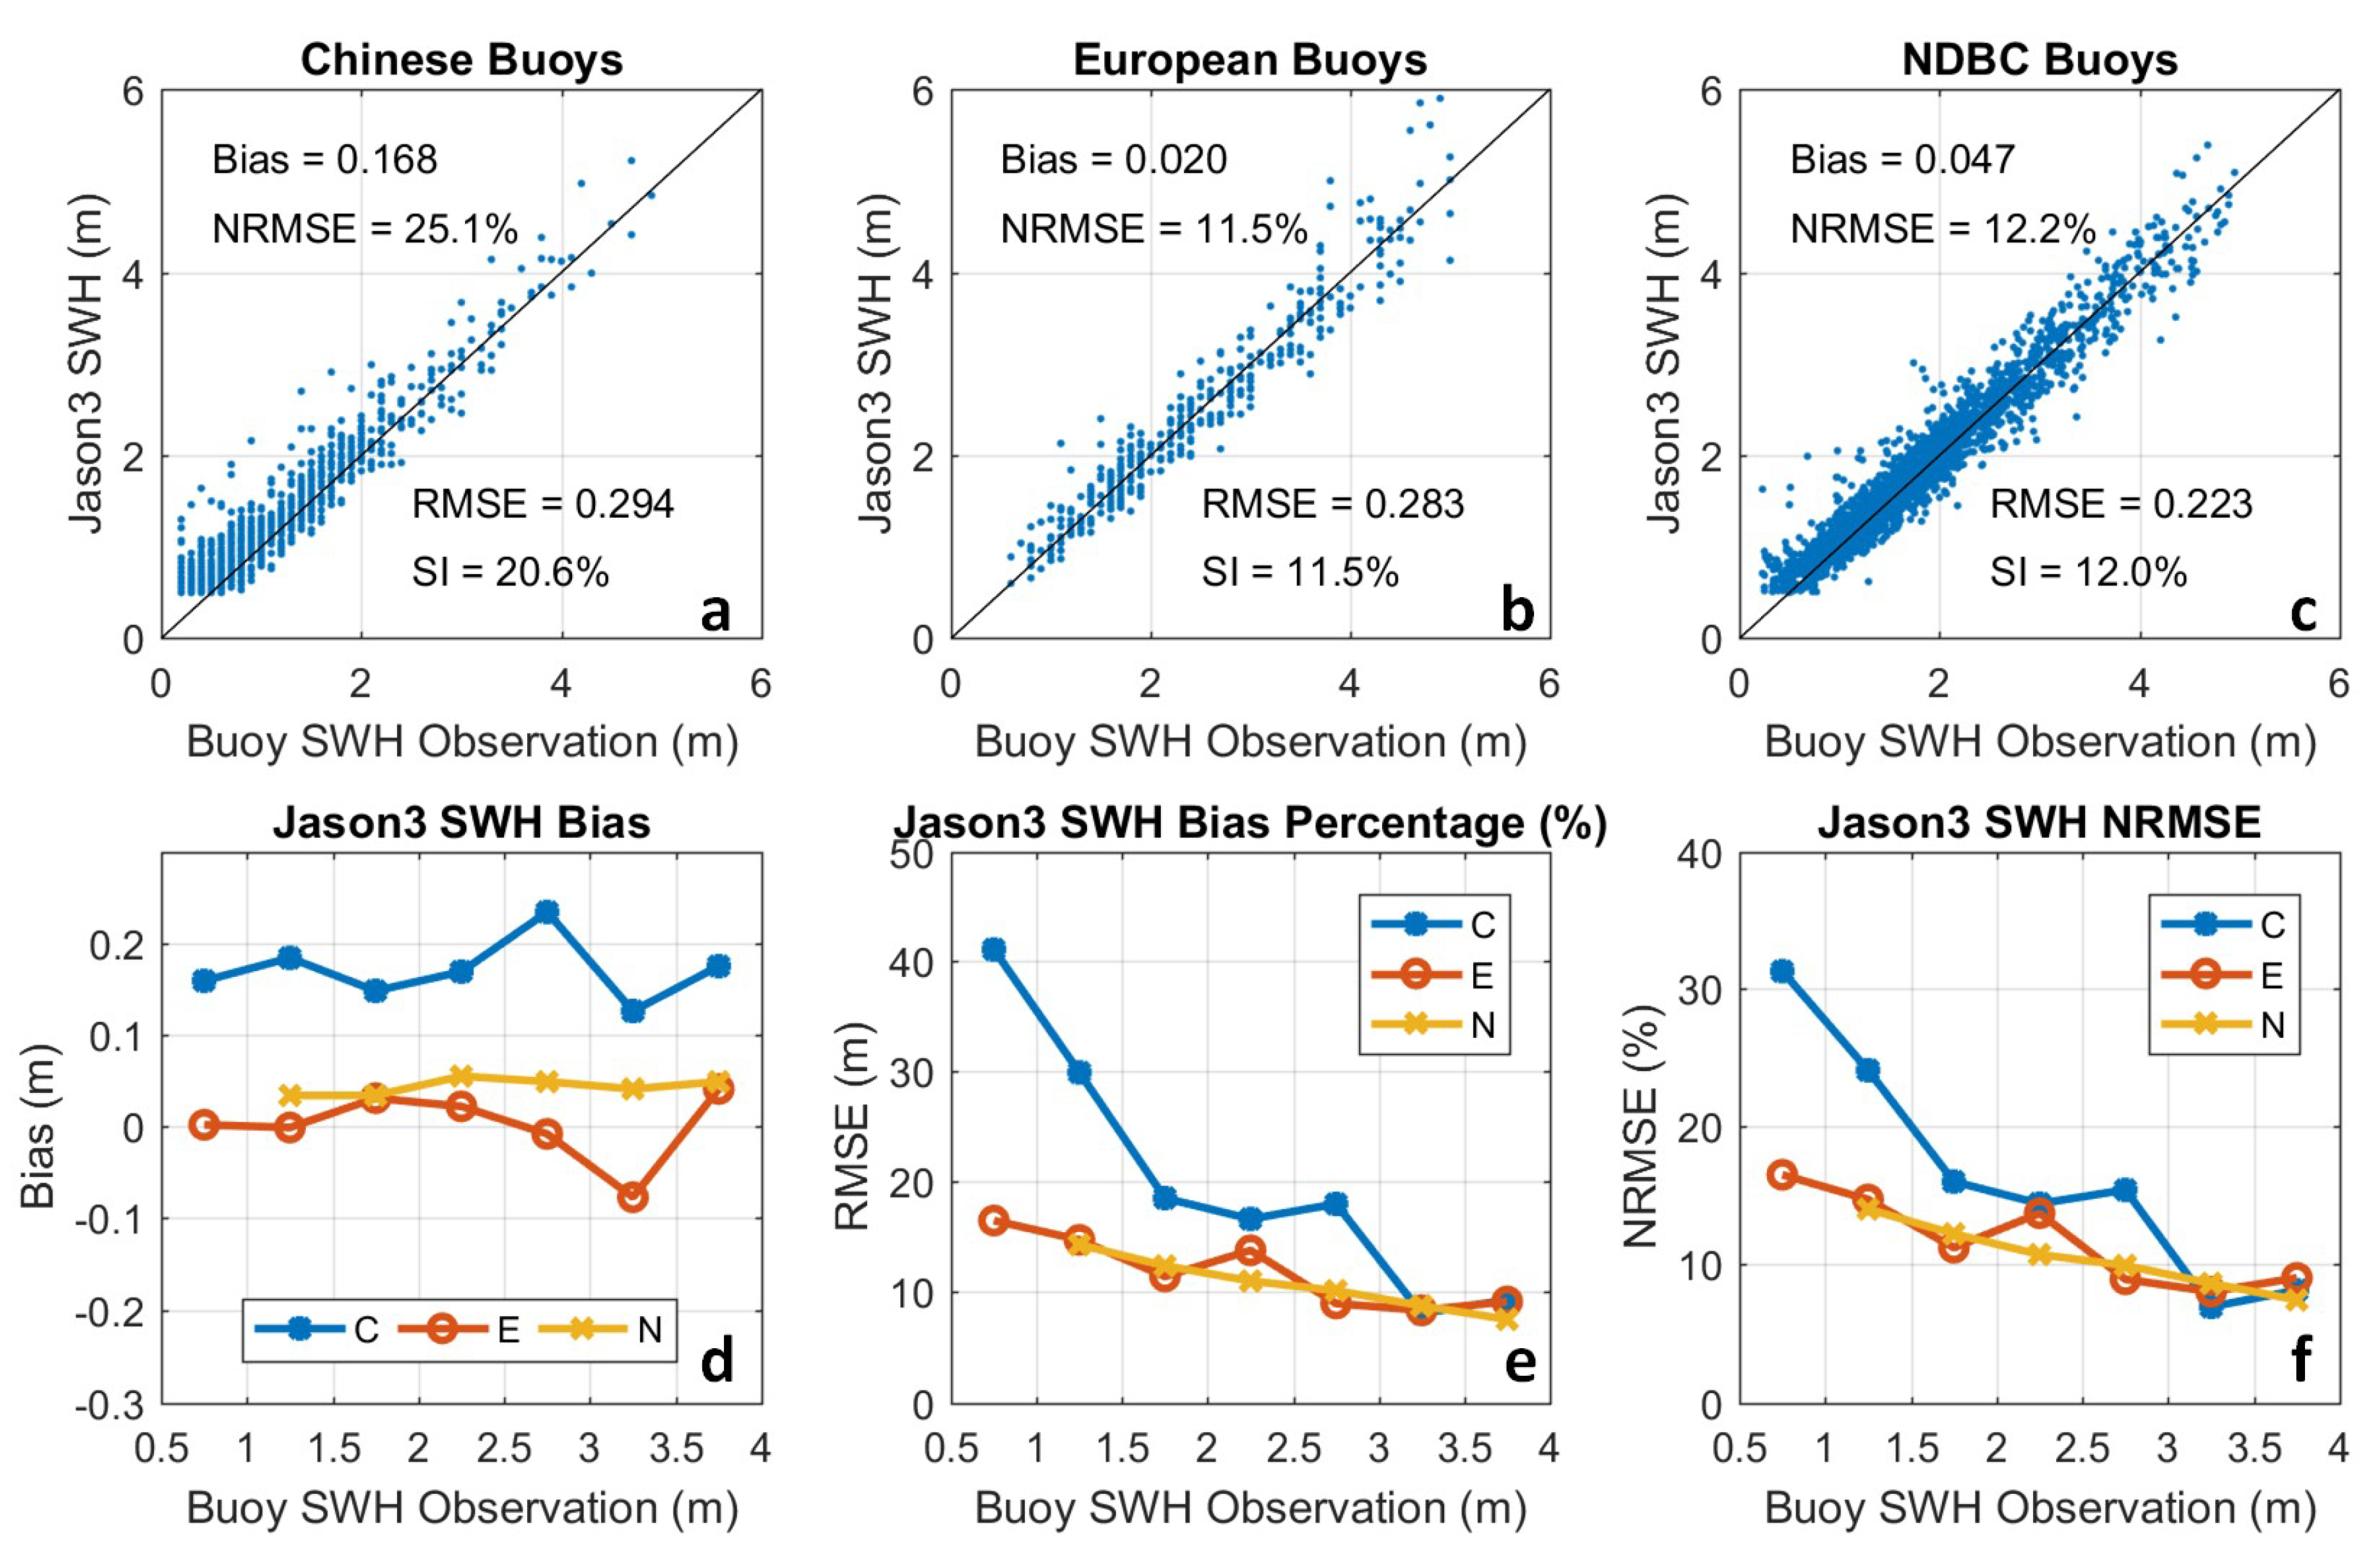
If the Jason-3 SWH is used as the reference, the relative bias distributions with the mean wave period of the three buoy networks are indicated in
Figure 3. As shown in
Figure 3a, the Chinese buoys gave the largest negative bias throughout the mean wave period of 4s to 9s. The European network and NDBC buoys yield limited bias within −0.08 m to 0.07 m, and their bias was distributed similarly throughout the whole mean wave period region. A more significant discrepancy between Chinese buoys and European/NDBC is shown in
Figure 3b. The negative bias reaches −14% to −23% of the mean SWH observed when the mean period is less than 6 s, which is likely due to wind sea conditions. The bias percentages of the three buoy networks were centralized when the mean period increased to more than 7 s, which indicates a more swell-dominated condition. The related NRMSEs of the three buoy networks showed the same trend as the mean wave period increases, as shown in
Figure 3c. That is, a large discrepancy was found between Chinese buoys and the other two networks and the curves merged together during the likely swell cases.
In addition to Jason-3, validations of Sentinel-3A, SARAL and HY2B SWH against three buoy networks were performed. The statistics for these altimeters, including Jason-3, are listed in
Table 1. From the comparison of the biases of all the altimeters involved, Chinese buoys showed the highest positive bias, while European and NDBC buoys gave relatively limited bias values, and the biases of these two buoy networks were similar to each other. The same situation occurred in the statistics of NRMSE and SI. The assessments based on the collocated Chinese buoys achieved the largest NRMSE and SI, approximately 15% to 25%, but they were approximately 10% for the European and NDBC buoy networks. A possible explanation for the large difference in the altimeter validations between the Chinese and European/NDBC buoy networks is the different sizes and weights of the buoys. The Chinese network is formed by 10 m discus buoys that weigh more than 50 tons, while the European/NDBC networks mainly use 3 m buoys that weigh much less. Like the heavy vessels in the English Chanel [
12], the wave-following property of Chinese buoys is quite limited, making the large Chinese buoys less easily shaken than other buoys under light wave conditions, especially in the wind sea. The insufficient calibration and parallel observation experiment made the situation worse because the calibration is not always carried out when the payload is installed on or under the buoy, and the SWH corrections due to the poor wave-following property are mainly achieved by very limted experiments. The effects of their corrections now seem to be inadequate. Therefore, the Chinese buoys always give an underestimated SWH compared to the European/NDBC buoys, and the negative bias decreases with an increase in wave height.
3. Remote Cross-Calibration Method
Since a significant inconsistency was found between the Chinese buoy network and European/NDBC buoys, cross calibration was seriously required. During the collocated assessment of altimeter SWH, the following equations hold:
where,
and
are the SWH observations of the collocated buoy and altimeter, respectively;
is the true wave SWH;
and
are the biases of the buoy and altimeter, respectively, when the SWH is
; and
and
are the random errors of the buoy and altimeter, respectively, when the SWH is
. We assumed that the bias and randomness were functions that only related to the true SWH.
Combining (5) and (6), we can eliminate the true SWH:
Then, taking mathematical expectations on both sides of the equation, the random error should be 0, which leads to:
where
and
are actually the biases of the altimeter and buoy, respectively.
Similarly, when this altimeter collocated with another buoy, we can also have:
where the subscript “b2” indicates the parameters of another buoy.
Now, it should be noted that for a fixed SWH range (for example, 1, 2 m), if there are “enough” and “random” samples of altimeter observations distributed in this range, the expectation of altimeter observations collocated with these two buoys should be identical, and the biases of altimeters in this range should also be equal. Then, from Equations (8) and (9), we can infer that:
Now, we make a connection of the two buoy observations by collocating these two buoys with altimeter observations. indicates the relative difference between these two buoys. There is no dependency upon altimeter attributes in Equation (10).
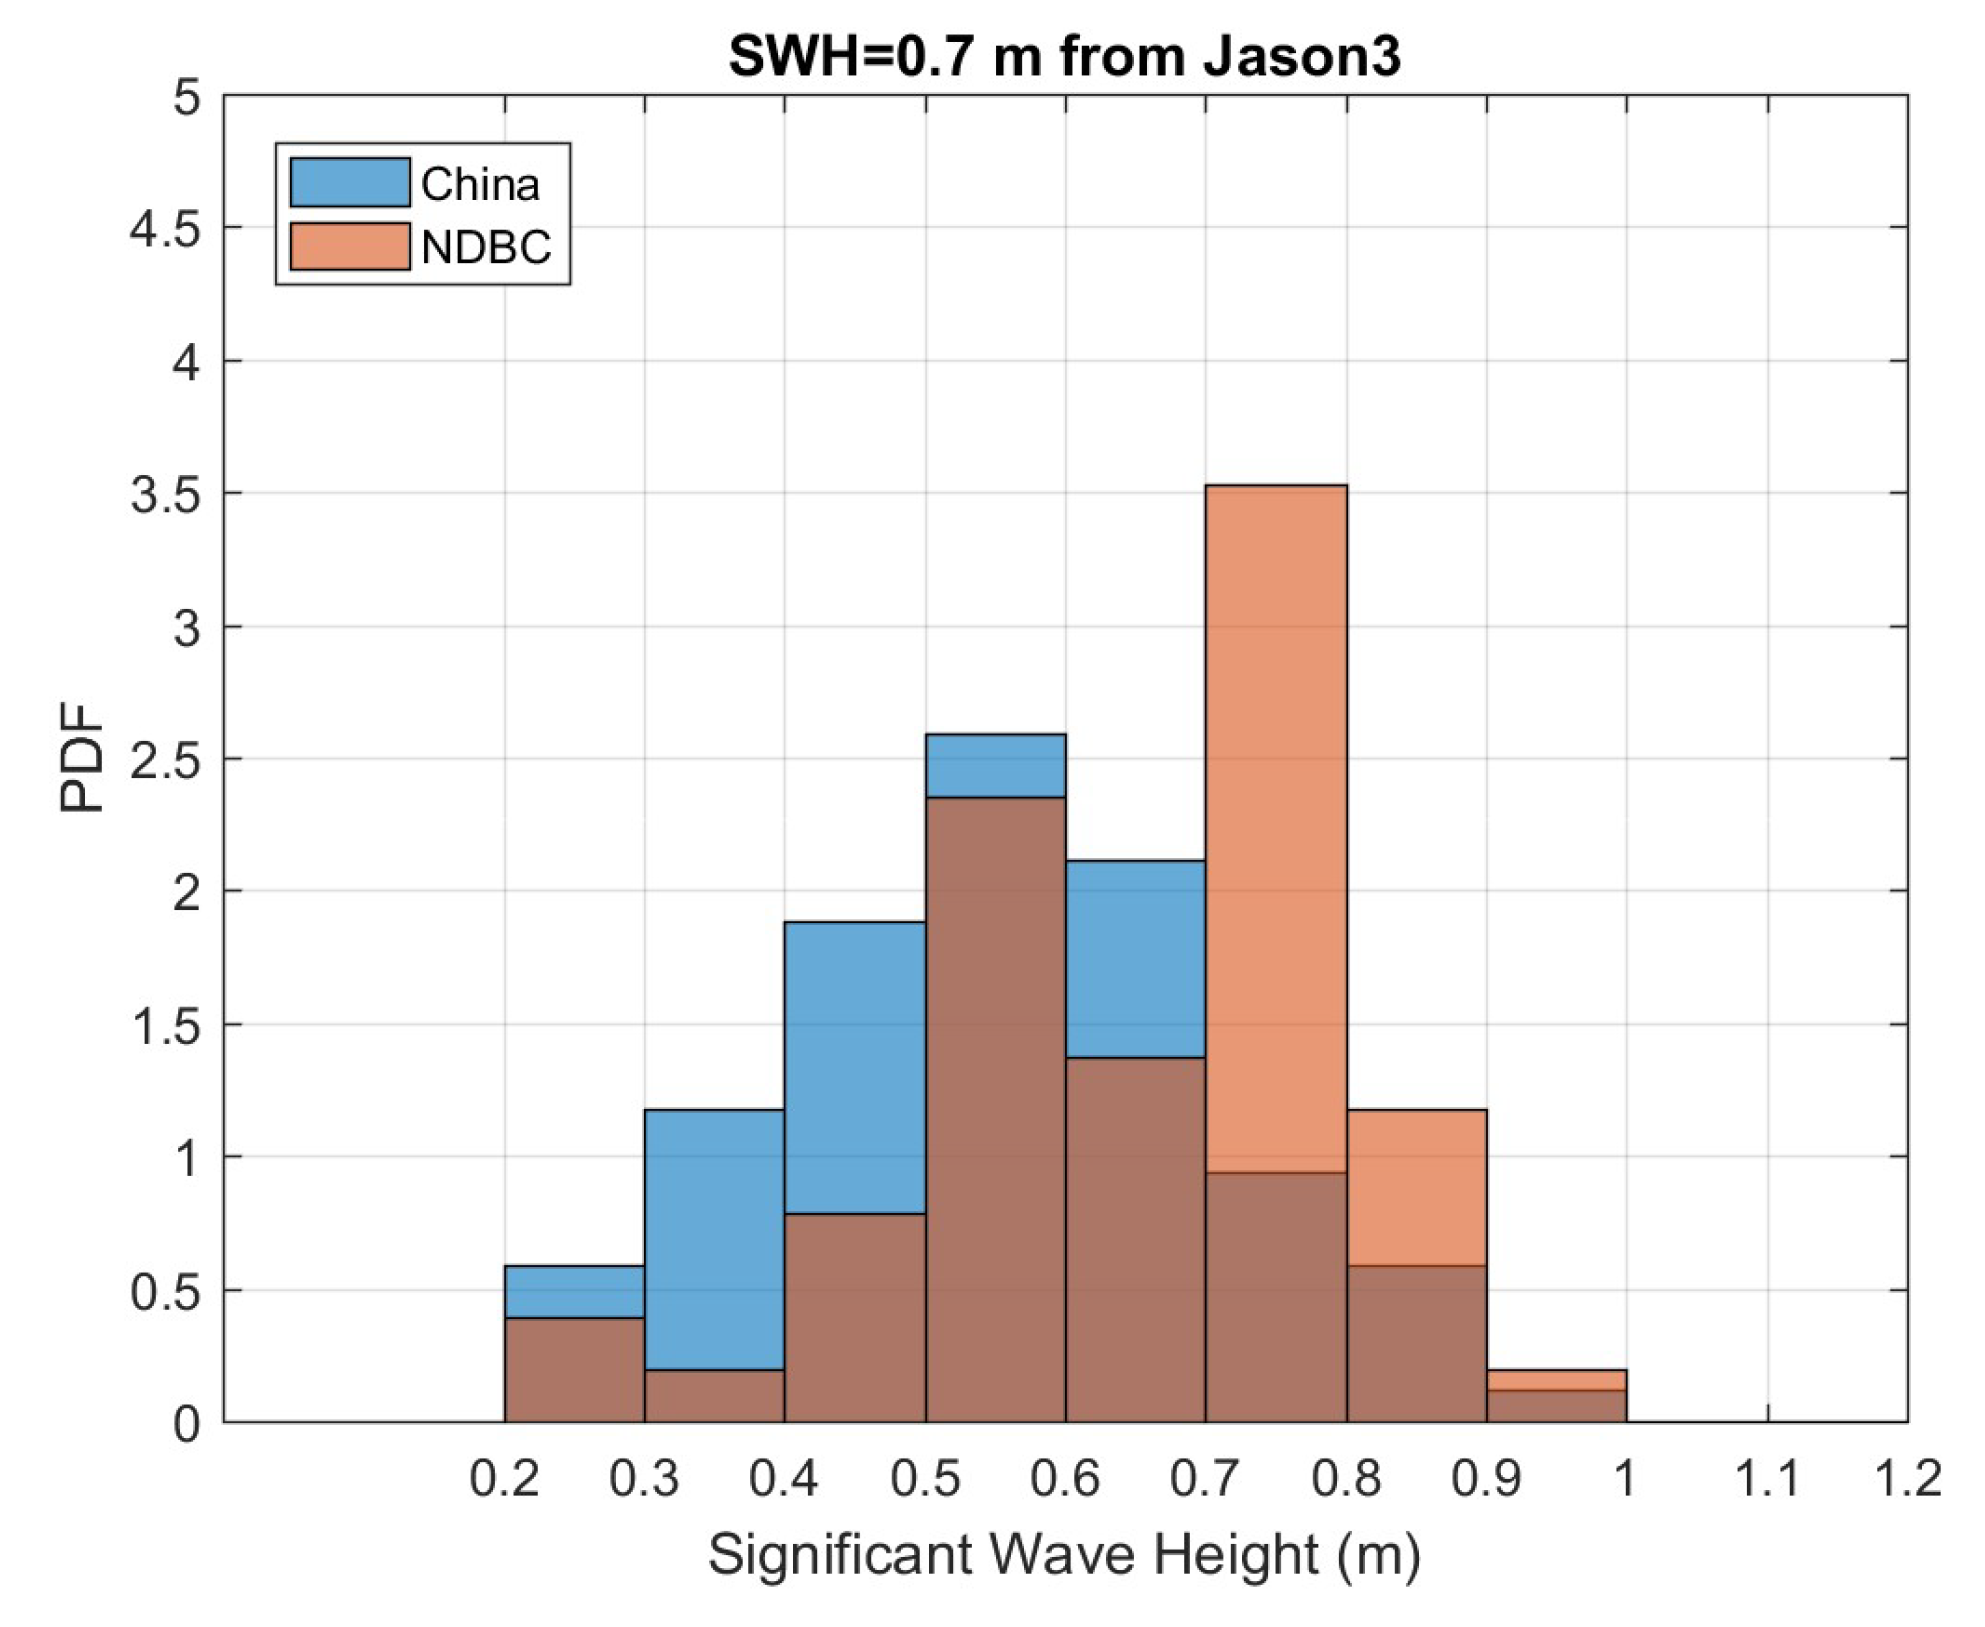
The following section describes how we implemented the remote matchup of buoys through altimeter collocation. Considering that the relative difference between buoys may relate to the SWH and that the numerical resolution of buoy is always 0.1 m, several ranges of the collocated SWHs from the altimeter were divided. They are: (0.35, 0.45 m), (0.45, 0.55 m), (0.55, 0.65 m), … (3.95, 4.05 m), of which the expectations are 0.4 m, 0.5 m, 0.6 m, …and 4.0 m, respectively, under a fully random distribution. One example of the range (0.65, 0.75 m) is shown in
Figure 4, indicating the distribution of Chinese buoys and NDBC buoys when Jason-3 gives the expectation of 0.7 m SWH.
From
Figure 4, we note that when Jason-3 gives an expected SWH of 0.7 m, the collocated Chinese buoys and NDBC buoys show different SWH distributions. Shown as the blue bars in
Figure 4, the Chinese buoys tend to give a lower centered distribution than the NDBC buoys, which again proves that the Chinese buoys produce a significant negative bias compared to the NDBC buoys. Then, the expectations of Chinese buoys and NDBC buoys can be calculated, and the values are 0.50 m and 0.65 m, respectively. This means that when the NDBC buoys give a SWH of 0.65 m, the Chinese buoys would give a SWH of 0.50 m.
Then, all SWH ranges were processed as described above, and because the method does not depend on the type and accuracy characteristics of altimeters, the collocations with Jason-3, Sentinel-3A and SARAL were all used to avoid unsatisfied statistical assumptions caused by an insufficient number of samples. Since high consistency is found between the European buoys and NDBC buoys, in the following cross-matching and calibrations, we considerthe buoys from the European and NDBC networks together.
Based on all the collocations of buoys and Jason-3, Sentinel-3A and SARAL, the remote matches of the Chinese buoys and European/NDBC buoys are shown as scatters in
Figure 5. It can be easily noted that all the matchups from the three altimeters show the same pattern in which the Chinese buoys underestimate the SWH compared to European/NDBC buoys. The negative bias of Chinese buoys is −0.127 m. The least squares regression method is applied to obtain the cross-calibration equation to correct the Chinese buoys:
where
and
are the calibrated and original SWH observations from Chinese buoys, respectively.
4. Validation of HY2B with Calibrated and Original SWHs
As shown in
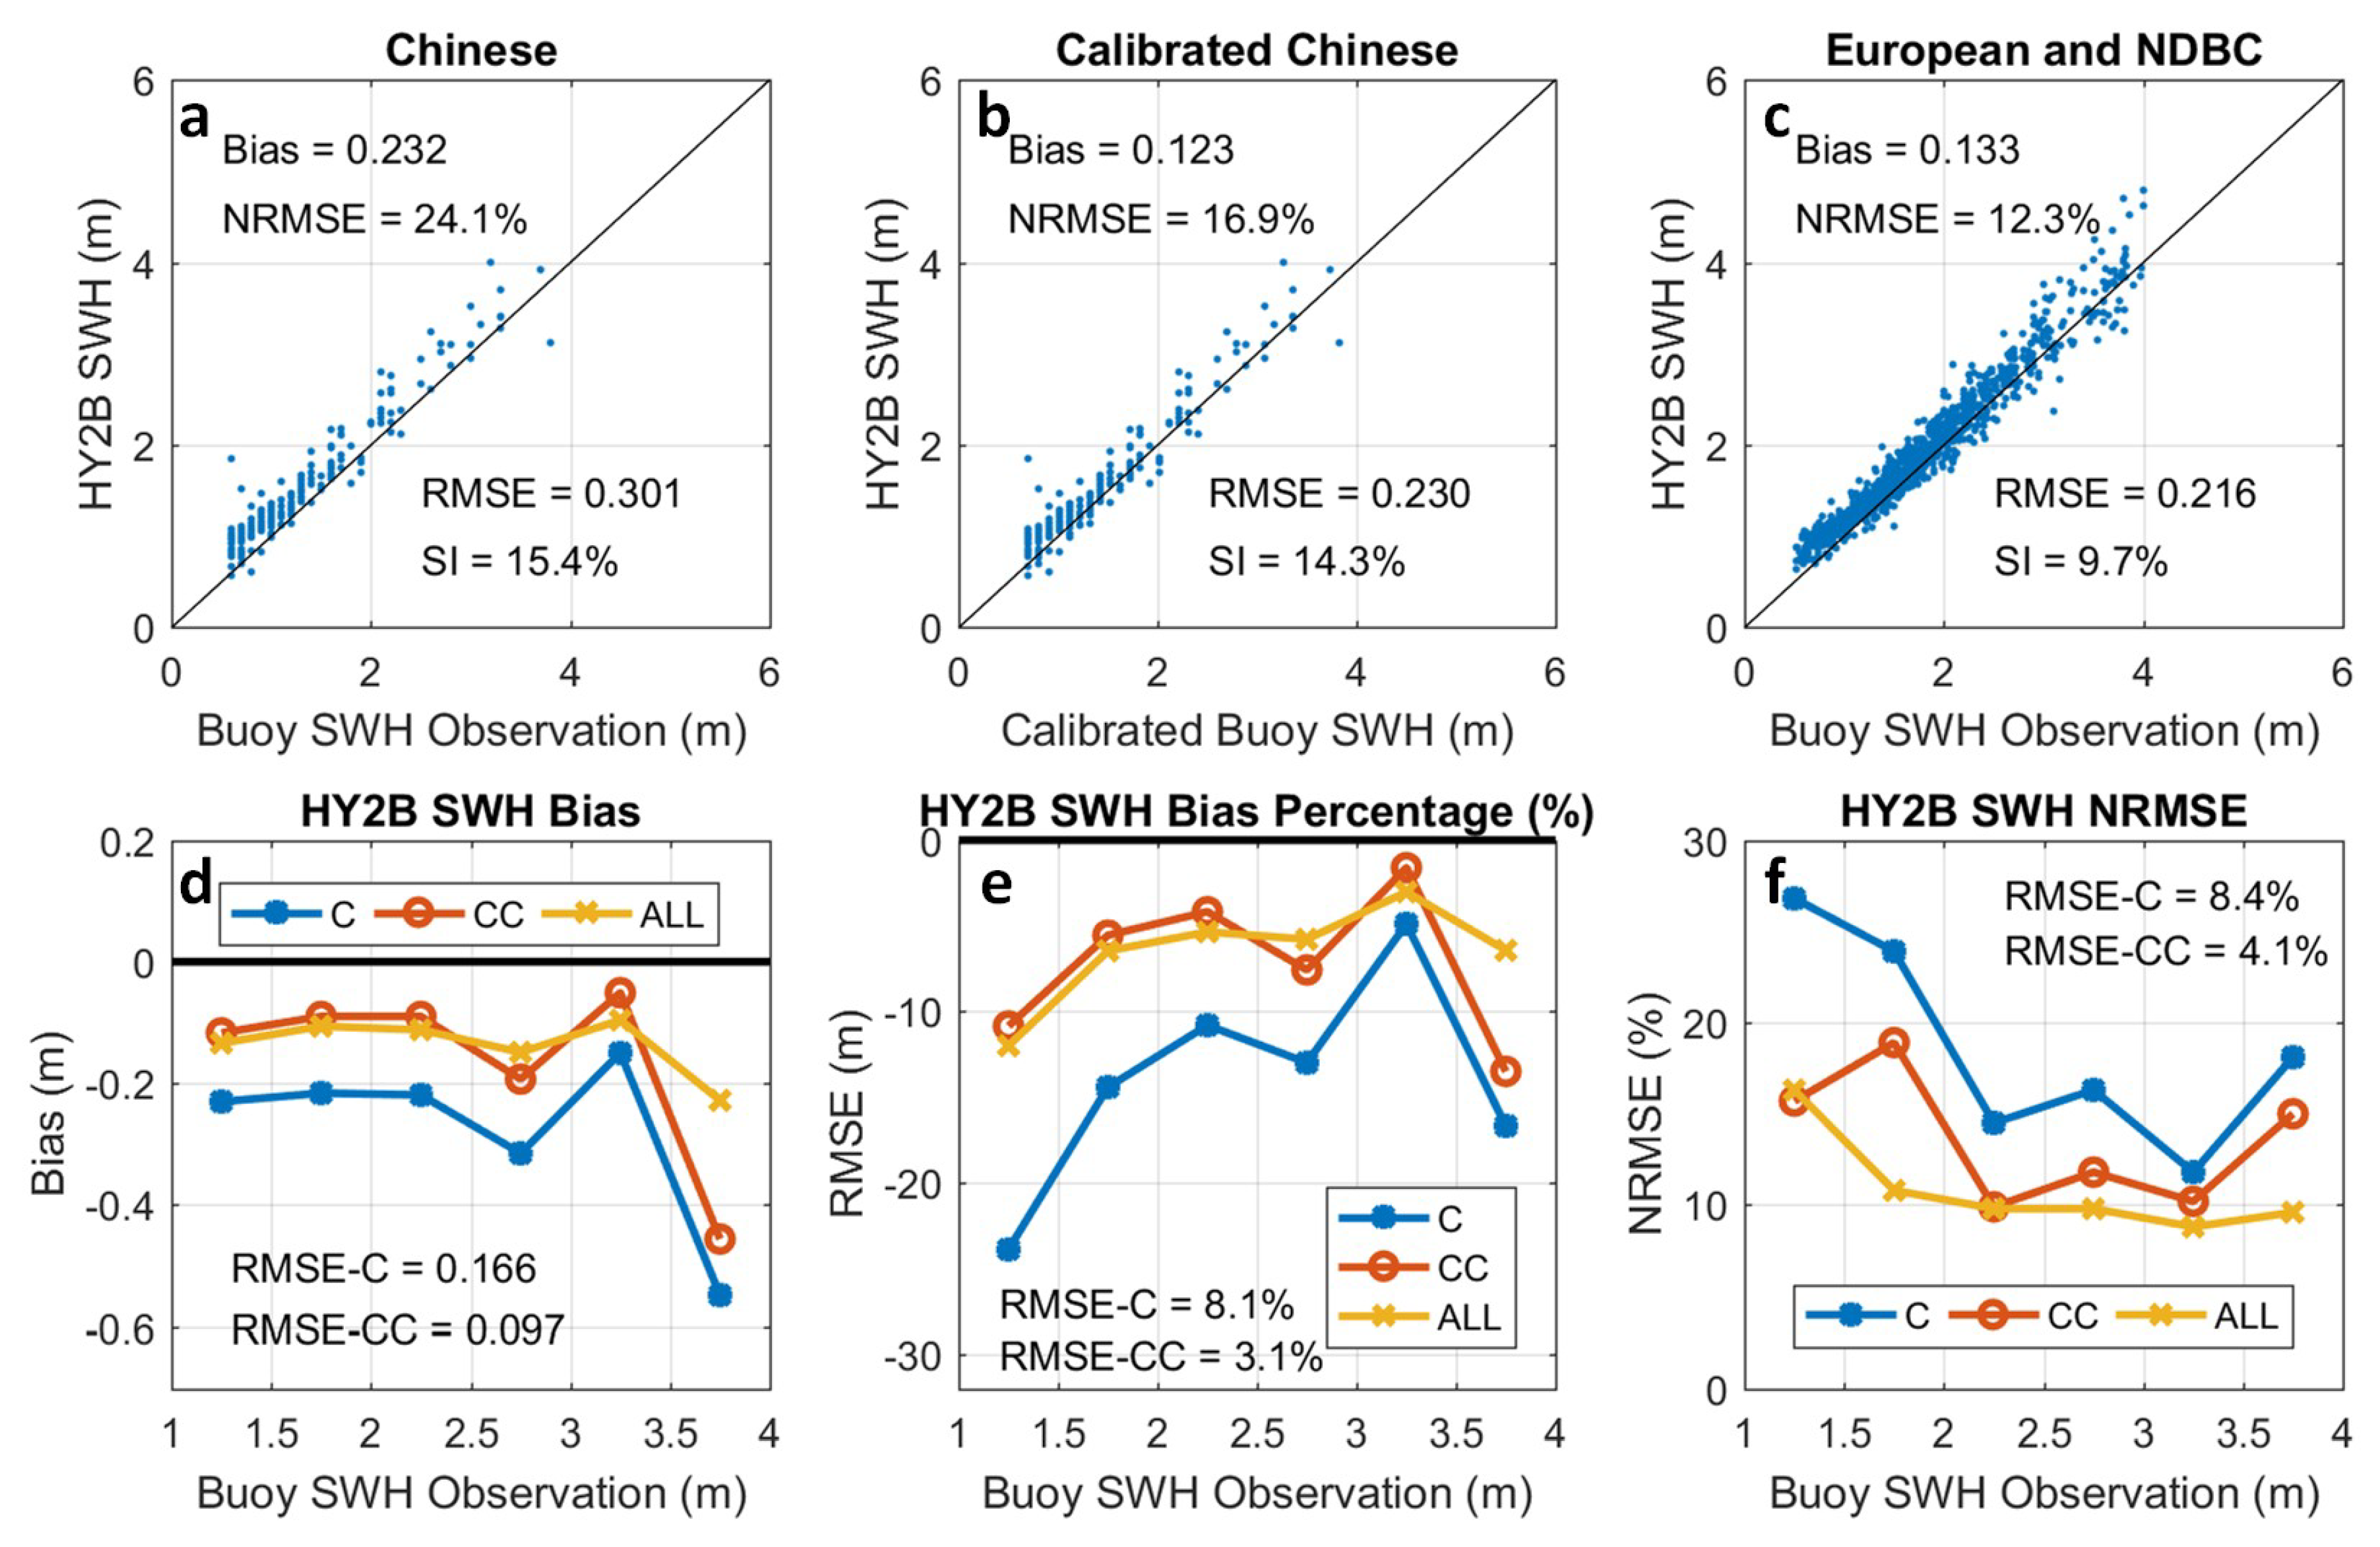
Table 1, obvious discrepancies can be found in the bias, RMSE, and scatter index between the Chinese buoys and the European/NDBC buoys. New validation of the HY2B SWH was performed based on the calibrated Chinese buoys using Equation (11) and compared to the original Chinese buoys and European/NDBC buoys. The results are shown in
Figure 6.
From
Figure 6a–c, one of the most significant improvements after the calibration of the Chinese buoy SWH was the reduction of the bias difference between the original Chinese buoy SWH and the European/NDBC network value. Because of the decreases in the bias, the RMSE also decreased to 0.230 m from the original 0.301 m which led to a decrease in the NRMSE from 24.1% to 16.9%, which is closer to the value of 12.3% from the European/NDBC buoys. The scatter index also decreased to 14.3% from 15.4% but was still greater than that from European/NDBC buoys. This is mainly because the majority of the collocated SWHs from Chinese buoys are less than 2.5 m, which results in a large scatter index, as shown in
Figure 6f. There was also significant improvement when looking at the bias distribution with the SWH. As indicated in
Figure 6d, the bias distribution curve from the calibrated Chinese buoy achieves much more consistency than the original data. The same conclusion for the bias percentage is also revealed in
Figure 6e. The discrepancy above 3.5 m is mainly due to the limited number of collocated SWHs above 3.5 m. Significant consistency improvement in NRMSE is also shown in
Figure 6f, although the calibration does not remove the inconsistency completely. In order to quantitatively measure the correlations between European/NDBC buoys and Chinese buoys with/without calibration, the RMSEs of the error parameters at each SWH ranges were introduced by using the error estimations of European/NDBC buoy SWH as a reference. A lower RMSE means a decrease in the difference between the Chinese and European/NDBC buoy. These RMSEs are indicated in
Figure 6d–f. One can note that all the RMSEs of bias, bias percentage and NRMSE after the calibration significantly decreased compared to those without calibration, which are 0.097 m to 0.166 m, 3.1% to 8.1% and 4.1% to 8.4%. Therefore, the calibration of Chinese buoys does significantly improve consistency with the European/NDBC buoys.
The improvement in the consistency distribution with the mean wave period was also investigated, and the results are shown in
Figure 7. The calibration method works well for the bias distribution with the mean wave period. The bias of HY2B against calibrated Chinese buoys showed good consistency with European/NDBC buoys in both short and long mean wave periods, which indicate dominant windsea and swell wave regimes, respectively.
5. Conclusions and Discussion
5.1. Conclusions
Wave buoy data are the most commonly used observations to verify the performance of wave models in different ocean regions. For global wave forecasting, there is a need to obtain consistent SWHs provided by different national buoy networks. Consistency among buoys is extremely important because the insitu SWH from a buoy is always seen as the observed truth. Therefore, the internal calibrations of the buoys are performed to maintain the consistency of the whole buoy network, which usually contains different types of buoys. However, because of the limitations of cost and implementation, comparisons or cross-calibrations are rarely performed between different national buoy networks. Such comparisons generally require simultaneous parallel observation experiments using buoys from different countries. The cross-calibration is critical because SWH inconsistency between buoy networks would lead to serious misinterpretation in the conclusions of regional wave studies.
Unfortunately, significant inconsistency between the buoy networks is found during the validation of operational altimeter SWH observations. The altimeters obtain different bias, RMSE and SI against the Chinese buoy network compared to those against the NDBC and European buoy networks. The large weight and inadequate calibration of Chinese buoys may lead to negative bias with respect to the other buoy networks, especially under low sea state or wind sea dominant conditions.
A remote cross-calibration method has been implemented based on the collocations between altimeters and buoys from different networks. The collocated altimeter data were used to remotely connect the buoy networks. The method has the advantage of matching the buoys independent of the altimeter accuracy. The cross-calibration of Chinese buoys was achieved by least squares regression based on scatter diagrams from the buoy matchups with Jason-3, Sentinel-3A and SARAL. The cross-calibration was tested for the validation of SWH from altimeter HY2B. This test shows that the negative SWH bias of Chinese buoys is effectively removed, indicating a significant improvement in the consistency among the European/NDBC and Chinese buoy networks.
5.2. Discussion
The method presented in this study will be useful for applications analyzing the regional wave climate in the China Sea and establishing a benchmark for indicators of sea state forecasts. For operational use, such calibration is relevant to favor the assimilation of SWHs from the Chinese network into coastal wave models and thus improve the reliability of marine warning bulletins during the typhoon season.
Finally, we would like to emphasize that the cross-calibration of different national buoy networks still requires further experiments and studies.The remote cross-calibration method in this paper is cost effective but must be updated regularly by adequate collocations between buoys and altimeters. This method is suitable for estimating the consistency between buoy systems. Most importantly, the routine calibration or maintenance of buoys is critical to preserve their consistencies and to avoid serious issues occurring in Chinese buoys due to inadequate studies or calibrations. Among the methods of calibration, the parallel observation experiment is still the most direct way to obtain detailed cross-calibration because a buoy network always contains buoys of multiple types; of course, massive support would be needed.


