Color and Laser Data as a Complementary Approach for Heritage Documentation

Geomatics Department, Architecture and Planning Faculty, King Abdulaziz University, Jeddah 2158, Saudi Arabia
Remote Sens. 2020, 12(20), 3465; https://0-doi-org.brum.beds.ac.uk/10.3390/rs12203465
Submission received: 13 September 2020
/
Revised: 18 October 2020
/
Accepted: 19 October 2020
/
Published: 21 October 2020
(This article belongs to the Special Issue Sensors & Methods in Cultural Heritage)
Abstract
:Heritage recording has received much attention and benefits from recent developments in the field of range and imaging sensors. While these methods have often been viewed as two different methodologies, data integration can achieve different products, which are not always found in a single technique. Data integration in this paper can be divided into two levels: laser scanner data aided by photogrammetry and photogrammetry aided by scanner data. At the first level, superior radiometric information, mobility and accessibility of imagery can be actively used to add texture information and allow for new possibilities in terms of data interpretation and completeness of complex site documentation. In the second level, true orthophoto is generated based on laser data, the results are rectified images with a uniform scale representing all objects at their planimetric position. The proposed approaches enable flexible data fusion and allow images to be taken at an optimum time and position for radiometric information. Data fusion usually involves serious distortions in the form of a double mapping of occluded objects that affect the product quality. In order to enhance the efficiency of visibility analysis in complex structures, a proposed visibility algorithm is implemented into the developed methods of texture mapping and true orthophoto generation. The algorithm filters occluded areas based on a patch processing using a grid square unit set around the projected vertices. The depth of the mapped triangular vertices within the patch neighborhood is calculated to assign the visible one. In this contribution, experimental results from different historical sites in Jordan are presented as a validation of the proposed algorithms. Algorithms show satisfactory performance in terms of completeness and correctness of occlusion detection and spectral information mapping. The results indicate that hybrid methods could be used efficiently in the representation of heritage structures.
1. Introduction
The 3D recording of heritage contributes to a wide range of products needed for innovative analyses, interpretations, and conservation studies. Producing large-scale 3D models requires portable and flexible techniques that deliver high geometric accuracy and realistic appearance. The Terrestrial Laser Scanner (TLS) and photogrammetry techniques are now commonly used in heritage recording because of their potential to generate 3D point clouds efficiently and reliably [1,2,3].
Laser Scanner records the surface geometry directly, providing reliable and high-density 3D point clouds representations with defined measurement uncertainty in a given field of view. Despite their high cost, weight and usual lack of good texture, the technique finds its primary fields in landscape and urban planning [4,5], topographic mapping [6], archeology [7], reverse engineering and building information modeling (BIM) [8,9,10], structure monitoring and analysis [11,12,13], etc. Due to the scale, shape, and occlusion of the object, multiple scans are required from different locations to cover the entire surface [14]. The processing of data starts by aligning the scans with a common coordinate system to create a single point cloud of the scene. Typically, when a point cloud is available, a polygon model is generated to provide the best visual representation of the object being surveyed. Despite the proven potential of TLS, data collected using these tools cannot be used solely for the purpose of accurate and complete 3D heritage recording [15]. Even with cameras installed into the unit, TLS still has limitations on capturing the cloud colors. The use of color data obtained by terrestrial scanners may not be of the desired quality, the optimal conditions for their use may not be compatible with the position of the laser scanners. Moreover, the large time intervals between the scans in outdoor applications can also results in different lighting and shadow conditions. This problem may have an effect on the appearance of the resulting textured model [16]. While TLS allows for high-detail environment recording that can reach several million 3D points, this quantity of clouds can also be a constraint as it creates large data files. Systems can also include occlusions which also render the point clouds incomplete [17].
On the other hand, image sensors are a highly flexible technique for obtaining high–resolution spatial data that is suitable for modeling objects [18]. Images can be acquired by terrestrial, aerial or satellite sensors that enable the use of photogrammetry for applications in topographic survey [19,20], landslide and structure assessment [21,22], virtual reality [23,24], industrial applications [25,26], archeology [27], etc. The processing pipeline has now become powerful with significant improvements in photogrammetry and computer vision algorithms. However, the available software frequently impose demands on the quality of images and their geometric configuration [28,29]. The efficiency of the processing algorithms may be affected by shadow and texture–less objects. Furthermore, close–spaced images needed to be successfully matched, which can be difficult for large and complex buildings. Long image sequences of large–scale structure result in error propagation and noisy point clouds. In addition, radiometric variations in different images can also cause matching failures [30,31,32]. To date, no practical results have been available for large-complex structures or performance evaluations using image-based modeling [33].
The combination of images and TLS has been recommended by several researchers, benefiting from the complementary characteristics of both datasets [34,35,36,37,38]. However, the techniques developed still lack the algorithms used to manage such integration in large and complex structures [39]. All commercial algorithms and software available are tailored to aerial applications [40], whereas the software available for architecture representation and heritage surfaces are only effective for relatively flat or predefined regular shapes [41].
This work was motivated by the need to develop efficient data fusion algorithms to create products which are important for heritage databases. Integration can be approached in two levels: TLS aided by photogrammetric data and photogrammetry aided by TLS data. At the first level, superior radiometric imaging information can be actively used to create photorealistic impressions of surfaces produced using laser data. Even at this level, in a complex scene with occlusive elements, imagery data enables different scale surveys and offers new data completeness assurance for TLS modeling. A typical example of the second level of data fusion is the production of true-orthophotos using a surface model based on Laser Scanner data. Useful information is derived from the available true-orthophoto, which enables the user to position objects, measure distances, calculate areas and quantify changes in heritage structures. Since geometry and images are independently acquired for better results, the most important prerequisite for the data fusion process is identifying of visibility in the captured images. To improve the visibility analysis performance in complex structures compared to the current approaches, our proposed algorithm filters the occluded areas based on grid patch searching in image plan. The methods show satisfactory performance in terms of completeness and correctness of occlusion detection and color mapping in complex and massive data structures.
In brief, this paper provides the following main contributions:
- -
- Proposes a method of visibility analysis to effectively filter out occluded areas within complex and massive structures.
- -
- Texture mapping and Laser–based True–orthophoto approaches for complex buildings.
- -
- Multi-scalar approach for heritage documentation.
The article is structured as follows: Section 2 gives a brief summary of the preceding works. Section 3 discusses data acquisition and sensors configuration. Section 4 describes data fusion involving camera mathematical model and visibility analysis. Section 5 presents texture mapping and multi-scale data fusion approaches. The true-orthophoto method is addressed in Section 6. Section 7 and Section 8 address discussion of results and conclusions.
2. Related Works
2.1. Texture Mapping
Various approaches are proposed to integrate the benefits of laser scanners with those of photogrammetry using texture mapping process. [42,43]. The basic idea is to attach image information to the geometric data. First, the triangulate model surface should be obtained from the point cloud collected. An automatic back projection is then performed for the triangular vertices from 3D object–space to 2D image–space coordinate system using camera mathematical model. The mathematical model involves parameters for the camera’s interior and exterior orientation [44]. The former can be obtained from the pre-calibration of the camera. The latter can be determined using a space resection process, which requires at least three visible control points in imagery and 3D model. Space resection process is non-linear, and its computation usually require more points to increase the redundancy of observations.
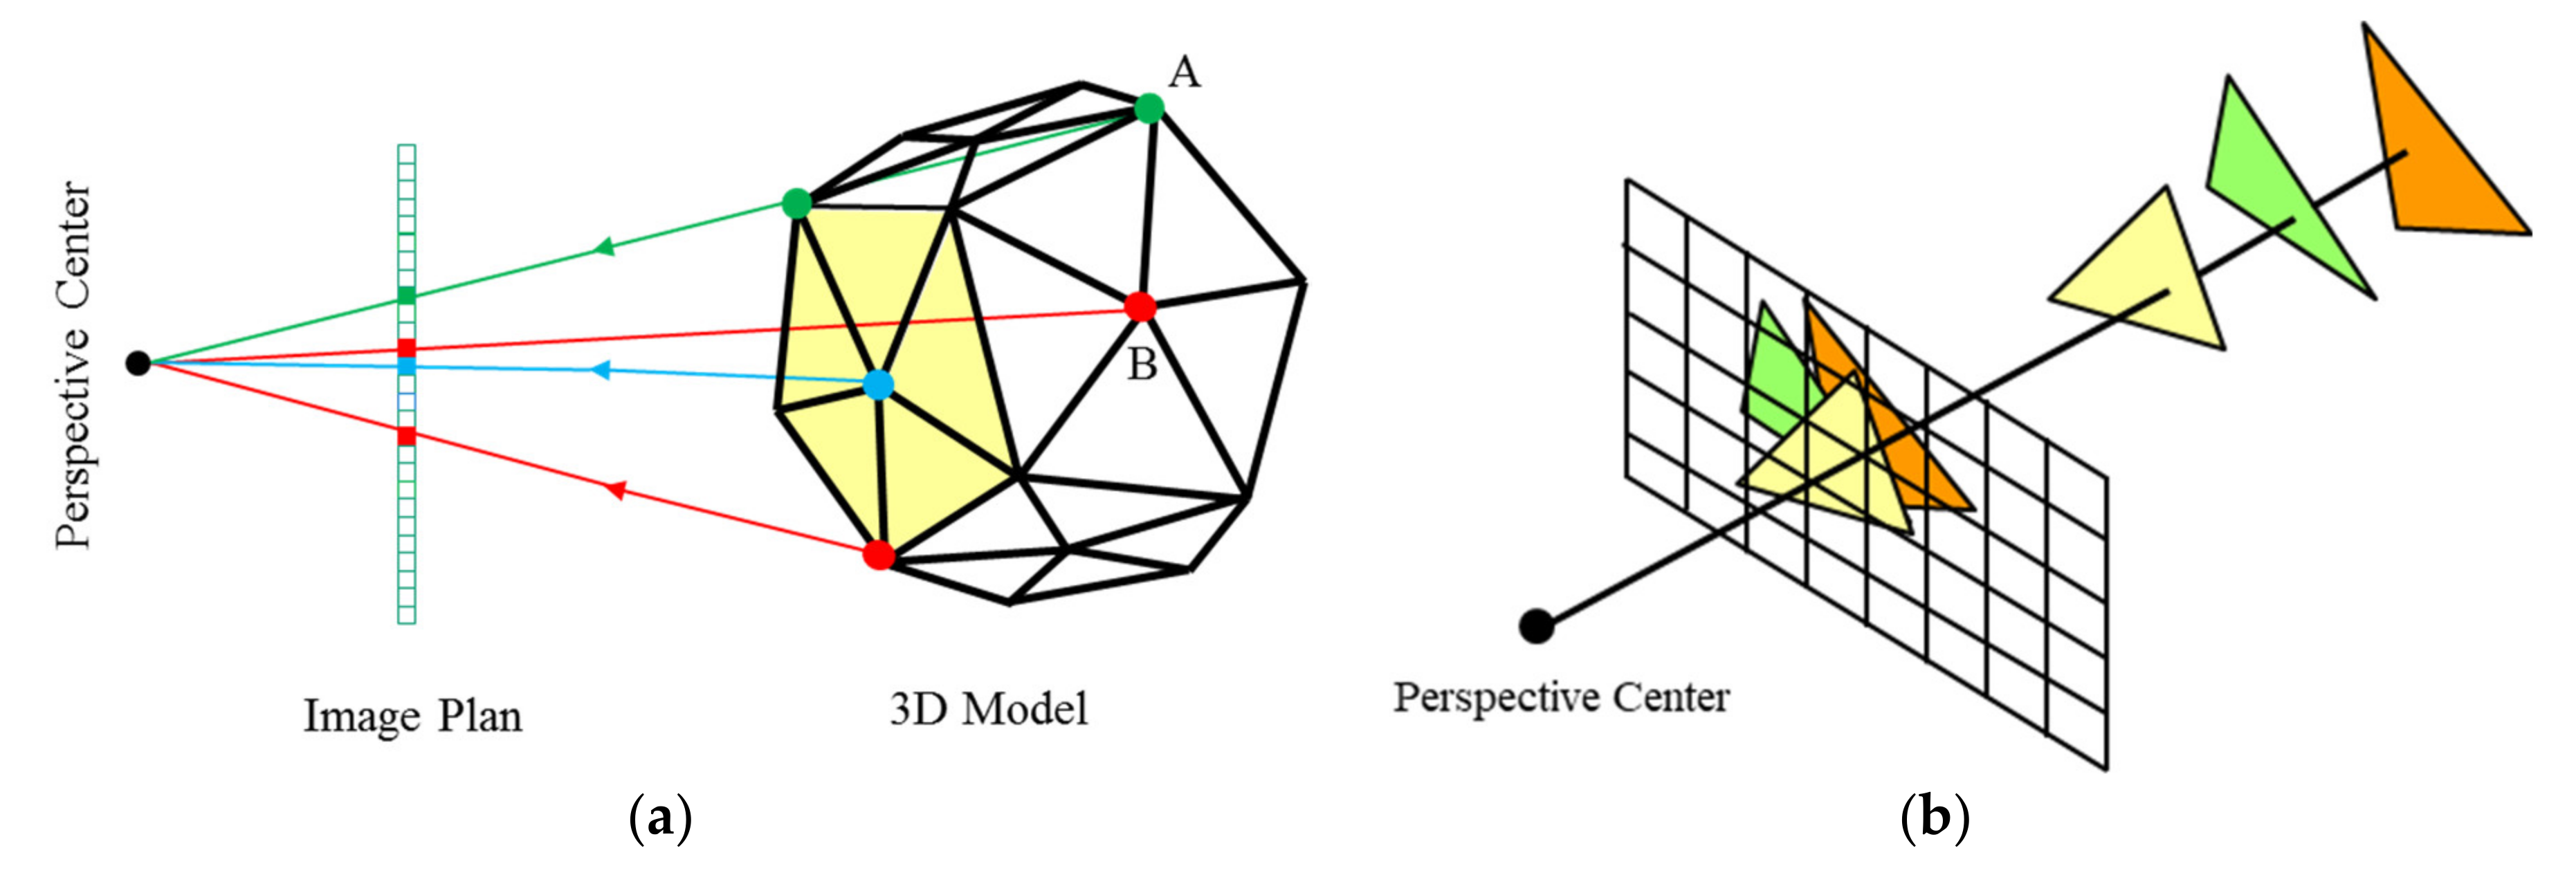
As a result of the above registration procedure, the color information can be directly mapped to the model triangles. However, some object triangles may overlap, which means they can be projected onto the same part of the image. These double mapped areas result in a significant defect that degrades the quality of the produced textured model [45]. Figure 1a demonstrates the double mapping problem where the visible triangles in the camera view are in yellow. The texture mapping process is used to project all vertices in the meshed model back to the image. The A and B vertices correspond to the occluded triangles, which are not visible in the imagery, will receive spectral information from the conjugate pixels in the textured model.
Texture mapping is a challenge in complex heritage structures, removing the effect of occlusion usually involves subdividing the overall geometry into small sections to map different textures [46]. Commercial software applications require a high amount of manual editing in order to achieve satisfactory results. Manual retouching of unoccluded pixels is indeed a costly method that can take up to a few days to obtain good results [47].
In order to solve the problems of occlusion, further steps are needed to improve the results and to produce accurate texture mapping. The triangular vertices occluded in each image must be identified by means of a visibility analysis. In that case, the texture will be mapped correctly to the nearest triangle [48]. Many recent studies used visibility algorithms to identify the double mapped areas. Methods of Z-buffer and ray–tracing were widely used by the photogrammetric community, the advantages of both algorithms are their simple implementation, and they do not require polygons pre–sorting [49]. The basic concept of Z-buffer, depicted in Figure 1b, is to rasterize any input polygon, the corresponding z value is determined for each pixel in the polygon by interpolation process. The algorithm then tracks the depth values of the nearest polygon (smallest z) at each pixel location on the projection plane, only the polygon in which the z value is nearest to the image plan will be colored [50,51,52]. On another hand, the ray–tracing algorithm uses the inner and outer camera parameters to define a ray that is projected from the projection center to the object space for each pixel in the image plan, the first object that intersects the ray is the visible one [53,54,55]. However, since both approaches perform pixel–by– pixel tasks, a considerable amount of computer memory and costly computation time are required. Moreover, if the image and model resolutions are not compatible, the results may have pseudo-visibility and incorrect occlusion [56]. Because of these limitations, many innovative frameworks and algorithms have been developed to improve their performance. For example, Karras et al. [57] and Zhang et al. [58] accelerate the search process in Z–buffer algorithms by testing the textured area of the image with large grid cells compared to the original image. Kim et al. [59] utilizes the major benefits of 2D ray tracing and 3D Z-buffering techniques for automatic, as well as realistic façade texturing of building models. Although these methods provide better detection of occlusion compared to the conventional approach, they cannot reliably and effectively recognize occlusion problems in complex scenes [60].
Previtali et al. [61] proposed an automated texture mapping workflow for 3D models created from active or passive sensors. Visibility analysis is performed by projecting the triangles in the image area. Next, reciprocal distance is determined between the triangle vertices and the center of the image projection. When two triangles intersect, the nearest is the visible one to the camera. Three different methods have been implemented to minimize the number of triangles to be examined, including frustum view, back-facing, and triangle distance culling. Hanusch [62] used a visibility algorithm based entirely on the vector algebra to provide an independent image resolution analysis appropriate for simultaneous handling of sparse and dense data sets. Zalama et al. [63] proposed a 2D voxelization visibility approach in texture mapping process in order to reduce computing time. The plane of the image is subdivided into 2D voxels by a square grid, so each 2D-voxel is given a list of triangles. Only triangles corresponding to the current voxel were computed. However, the accuracy of the results is very sensitive to the selected 2D voxels.
2.2. True Orthophoto
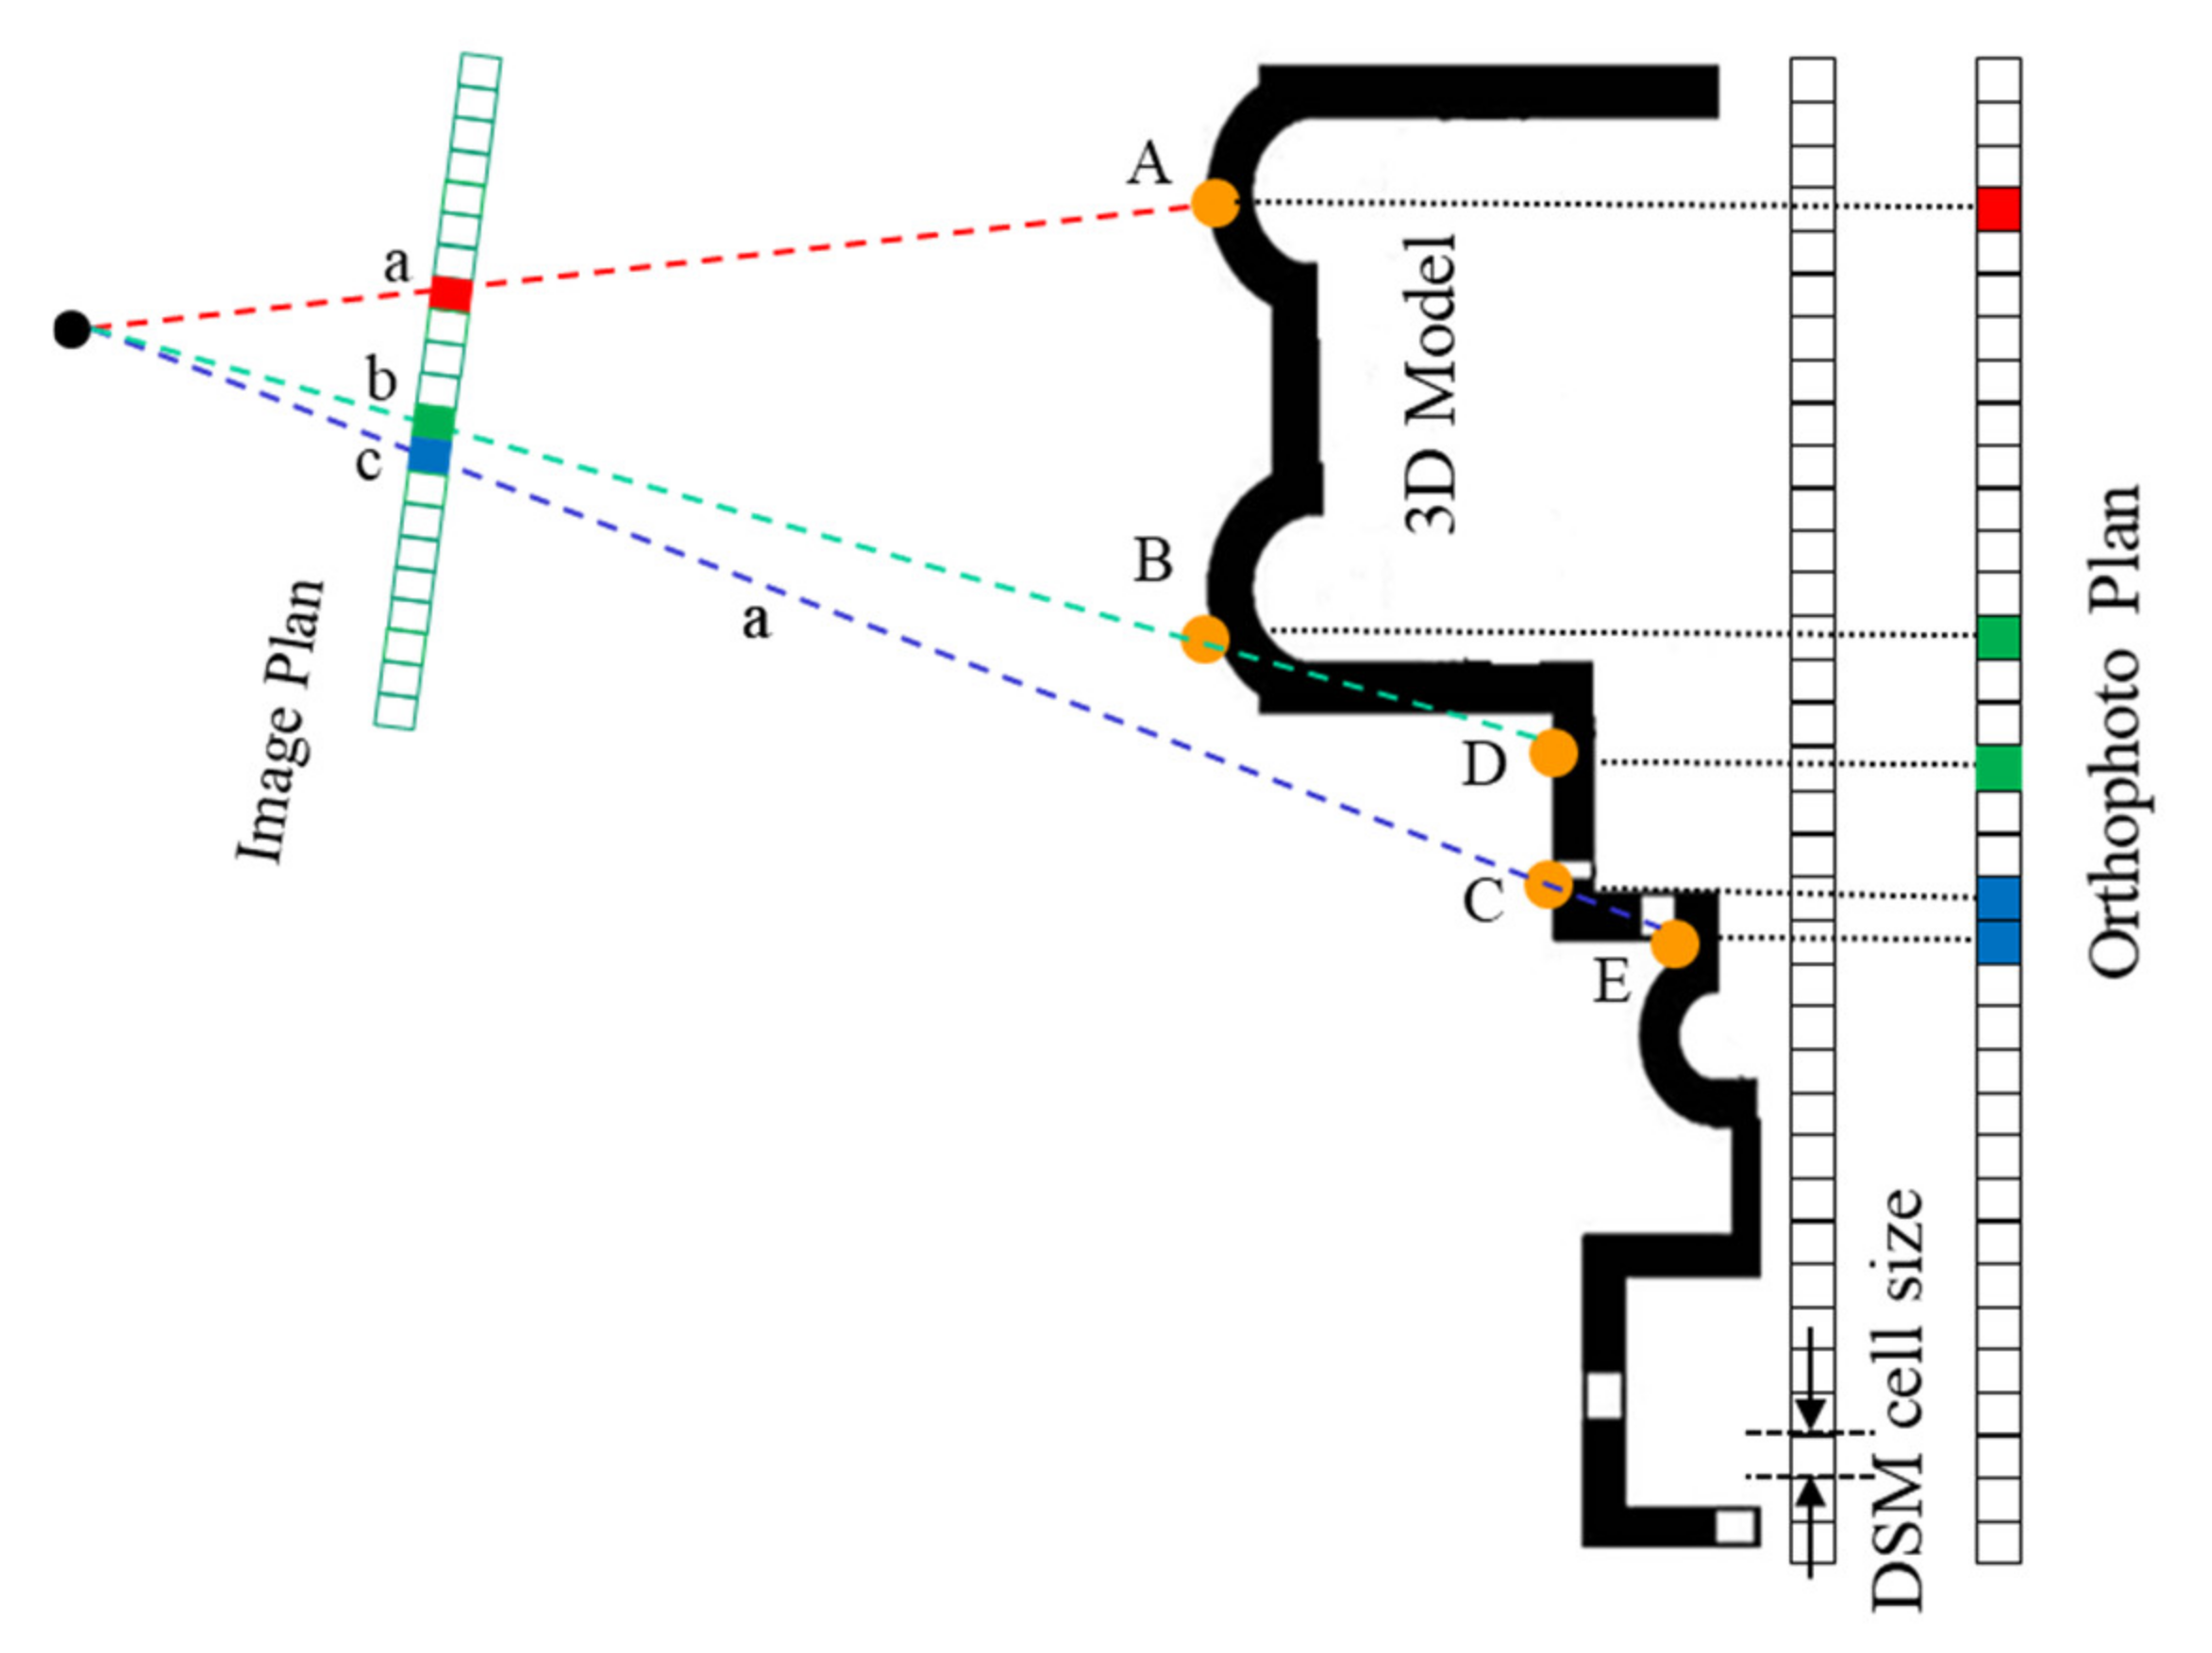
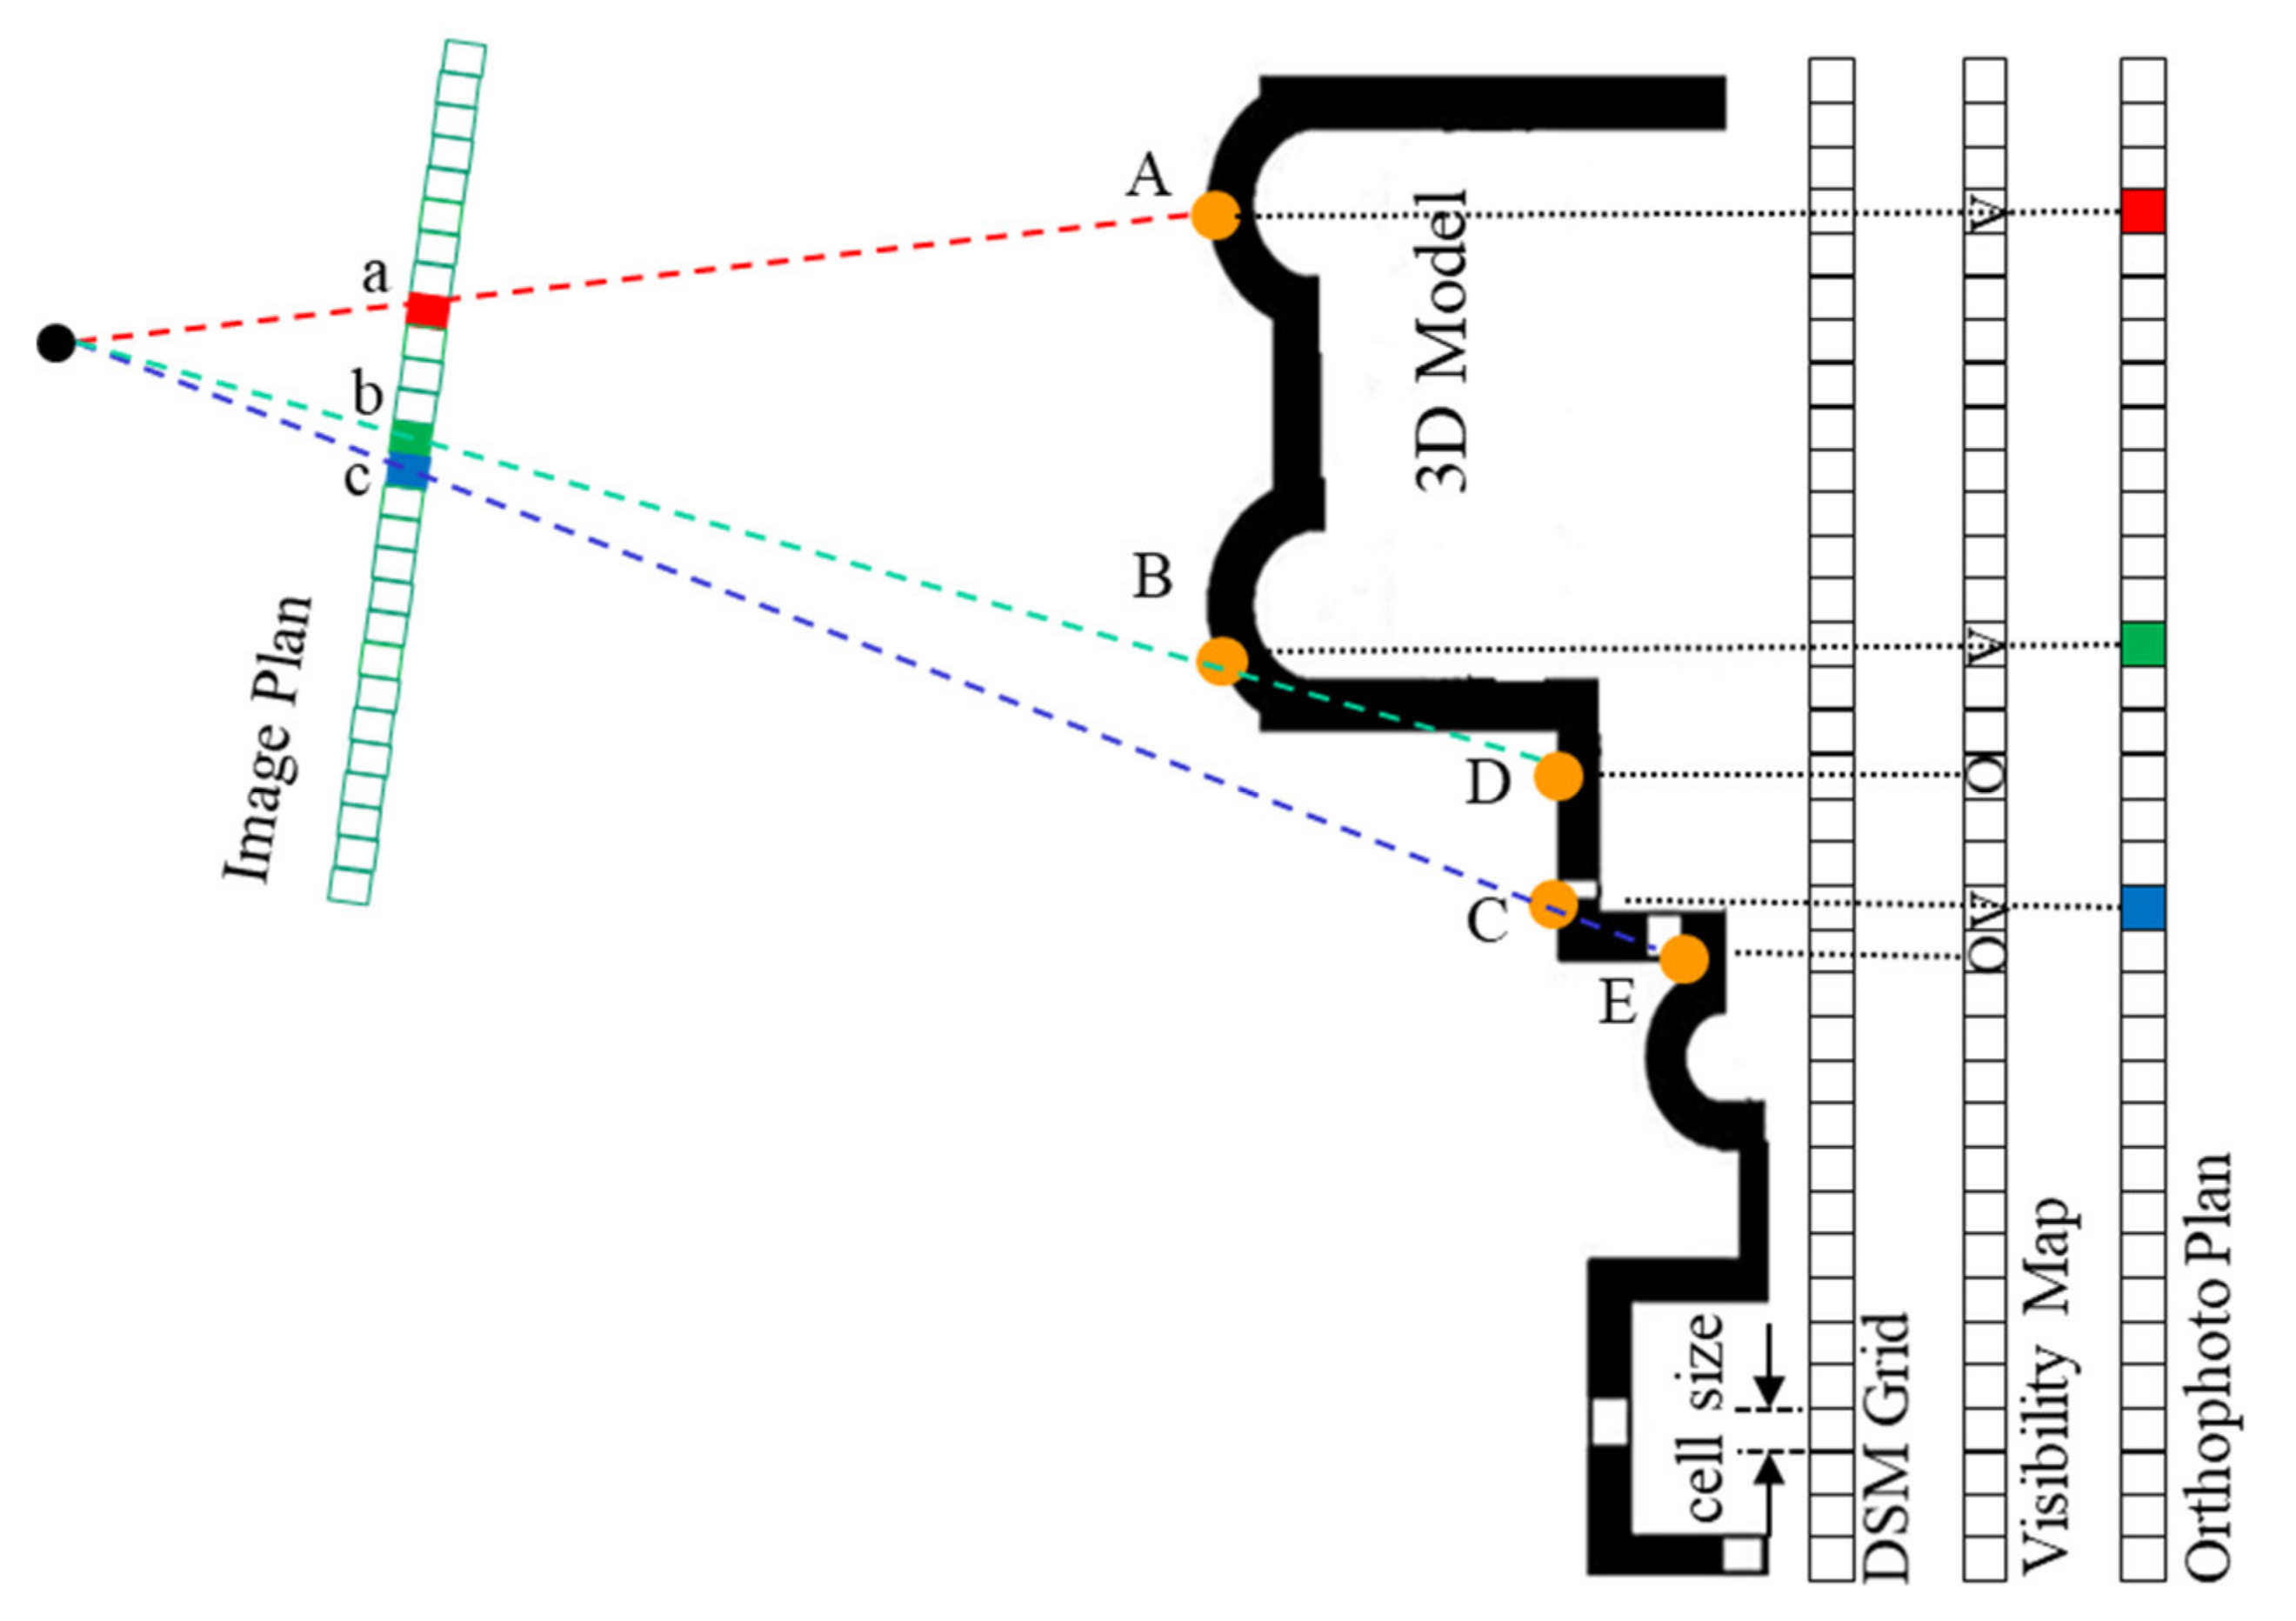
Orthophoto has a uniform scale displaying all surface features in their correct planimetric position. Most of the available orthophoto algorithms and commercial software are tailored to aerial applications; however, there are a few investigations in close–range applications, particularly in the field of cultural heritage [64,65]. Developing orthophotos includes a reference imagery and 3D surface model, along with the sensor internal and external parameters. The most conventional method of orthophoto is called differential rectification, which can yield acceptable results in environments where the surface of the object varies smoothly [66]. As seen in Figure 2, the method begins by converting the point cloud data into a Digital Surface Model (DSM), i.e., Depth Map. The process involves sampling 3D points in a regular grid where each cell is uniquely connected to the model point. Another grid of the same pixel size and dimension is created to store spectral orthophoto information. The DSM cells are projected back to the respective imagery using collinearity equations. The relevant imagery data is then assigned to the cell and the corresponding orthophoto pixel.
The main limitation of the approach occurs when applied to complex buildings. Differential-rectified orthophotos also have a double mapping in the occluded areas [67]. Figure 2 illustrates this problem within the context of the differential rectification method. In the reference optical imagery, the cells (A, B, C) in the grid are visible and mapped to positions (a, b, c), respectively, the orthophoto pixels are then allocated their spectral data. DSM occluded cells (D, E) are also projected to imagery position (b, c), respectively. As a result, the spectral information provided in the orthophotograph pixels at (D, E) is duplicated.
The scientific community is still investigating orthophoto free from double mapping problem, known as true orthophoto. Research efforts focused on the main bottleneck in the production of true ortho: identification of occluded areas. For either aerial or terrestrial applications, most of the existing true orthophoto methods use the Z-buffer algorithm. The Z-buffer algorithm computes the distance between the perspective center (PC) of the camera and the DSM cells assigned to the same pixel of image and labels the nearest cell as visible. Although the Z-buffer approach is widely used, this process produces false visibility or false occlusion where images and DSM resolutions are not consistent [68]. Zhou et al. [67] improve Z-buffer performance by using a combination of DBM and DTM for occlusion detection rather than a raster DSM. Xie and Zhou [69] Minimize the search area within the Z-buffer algorithim by setting a minimum bounding sector.
Ray’s tracing algorithm, on the other hand, is limited by the fact that their iterative calculations do not converge into complex DSM [70]. Habib et al. [71] proposed angle–based technique for improving the quality of orthophotos when handling urban area images. The technique utilizes the nadir angle to define the occlusion or visibility of the DSM cells. This angle is determined by the direction of the nadir and the line connecting the camera PC and the selected cell. The procedure ensures high accuracy for the detection of occluded areas, whereas the choice of angle increment value and the frequency of angle calculation decreases the algorithm ’s efficiency [72]. Occlusions are detected in the approach suggested in De Oliveira et al. [73] by analysis of height gradients over radial DSM profiles. Calculating the initial height therefore requires extra numerical work and decreases the degree of efficiency of the whole procedure [74].
3. Data Collection and Sensors Configuration
3.1. Data Collection
The data used in our investigations have been collected from three heritage sites in Jordan: the Northern Theater and the Artemis Temple of Gerasa city and from Qusayr ’Amra, one of the most famous desert palaces.
3.1.1. Gerasa
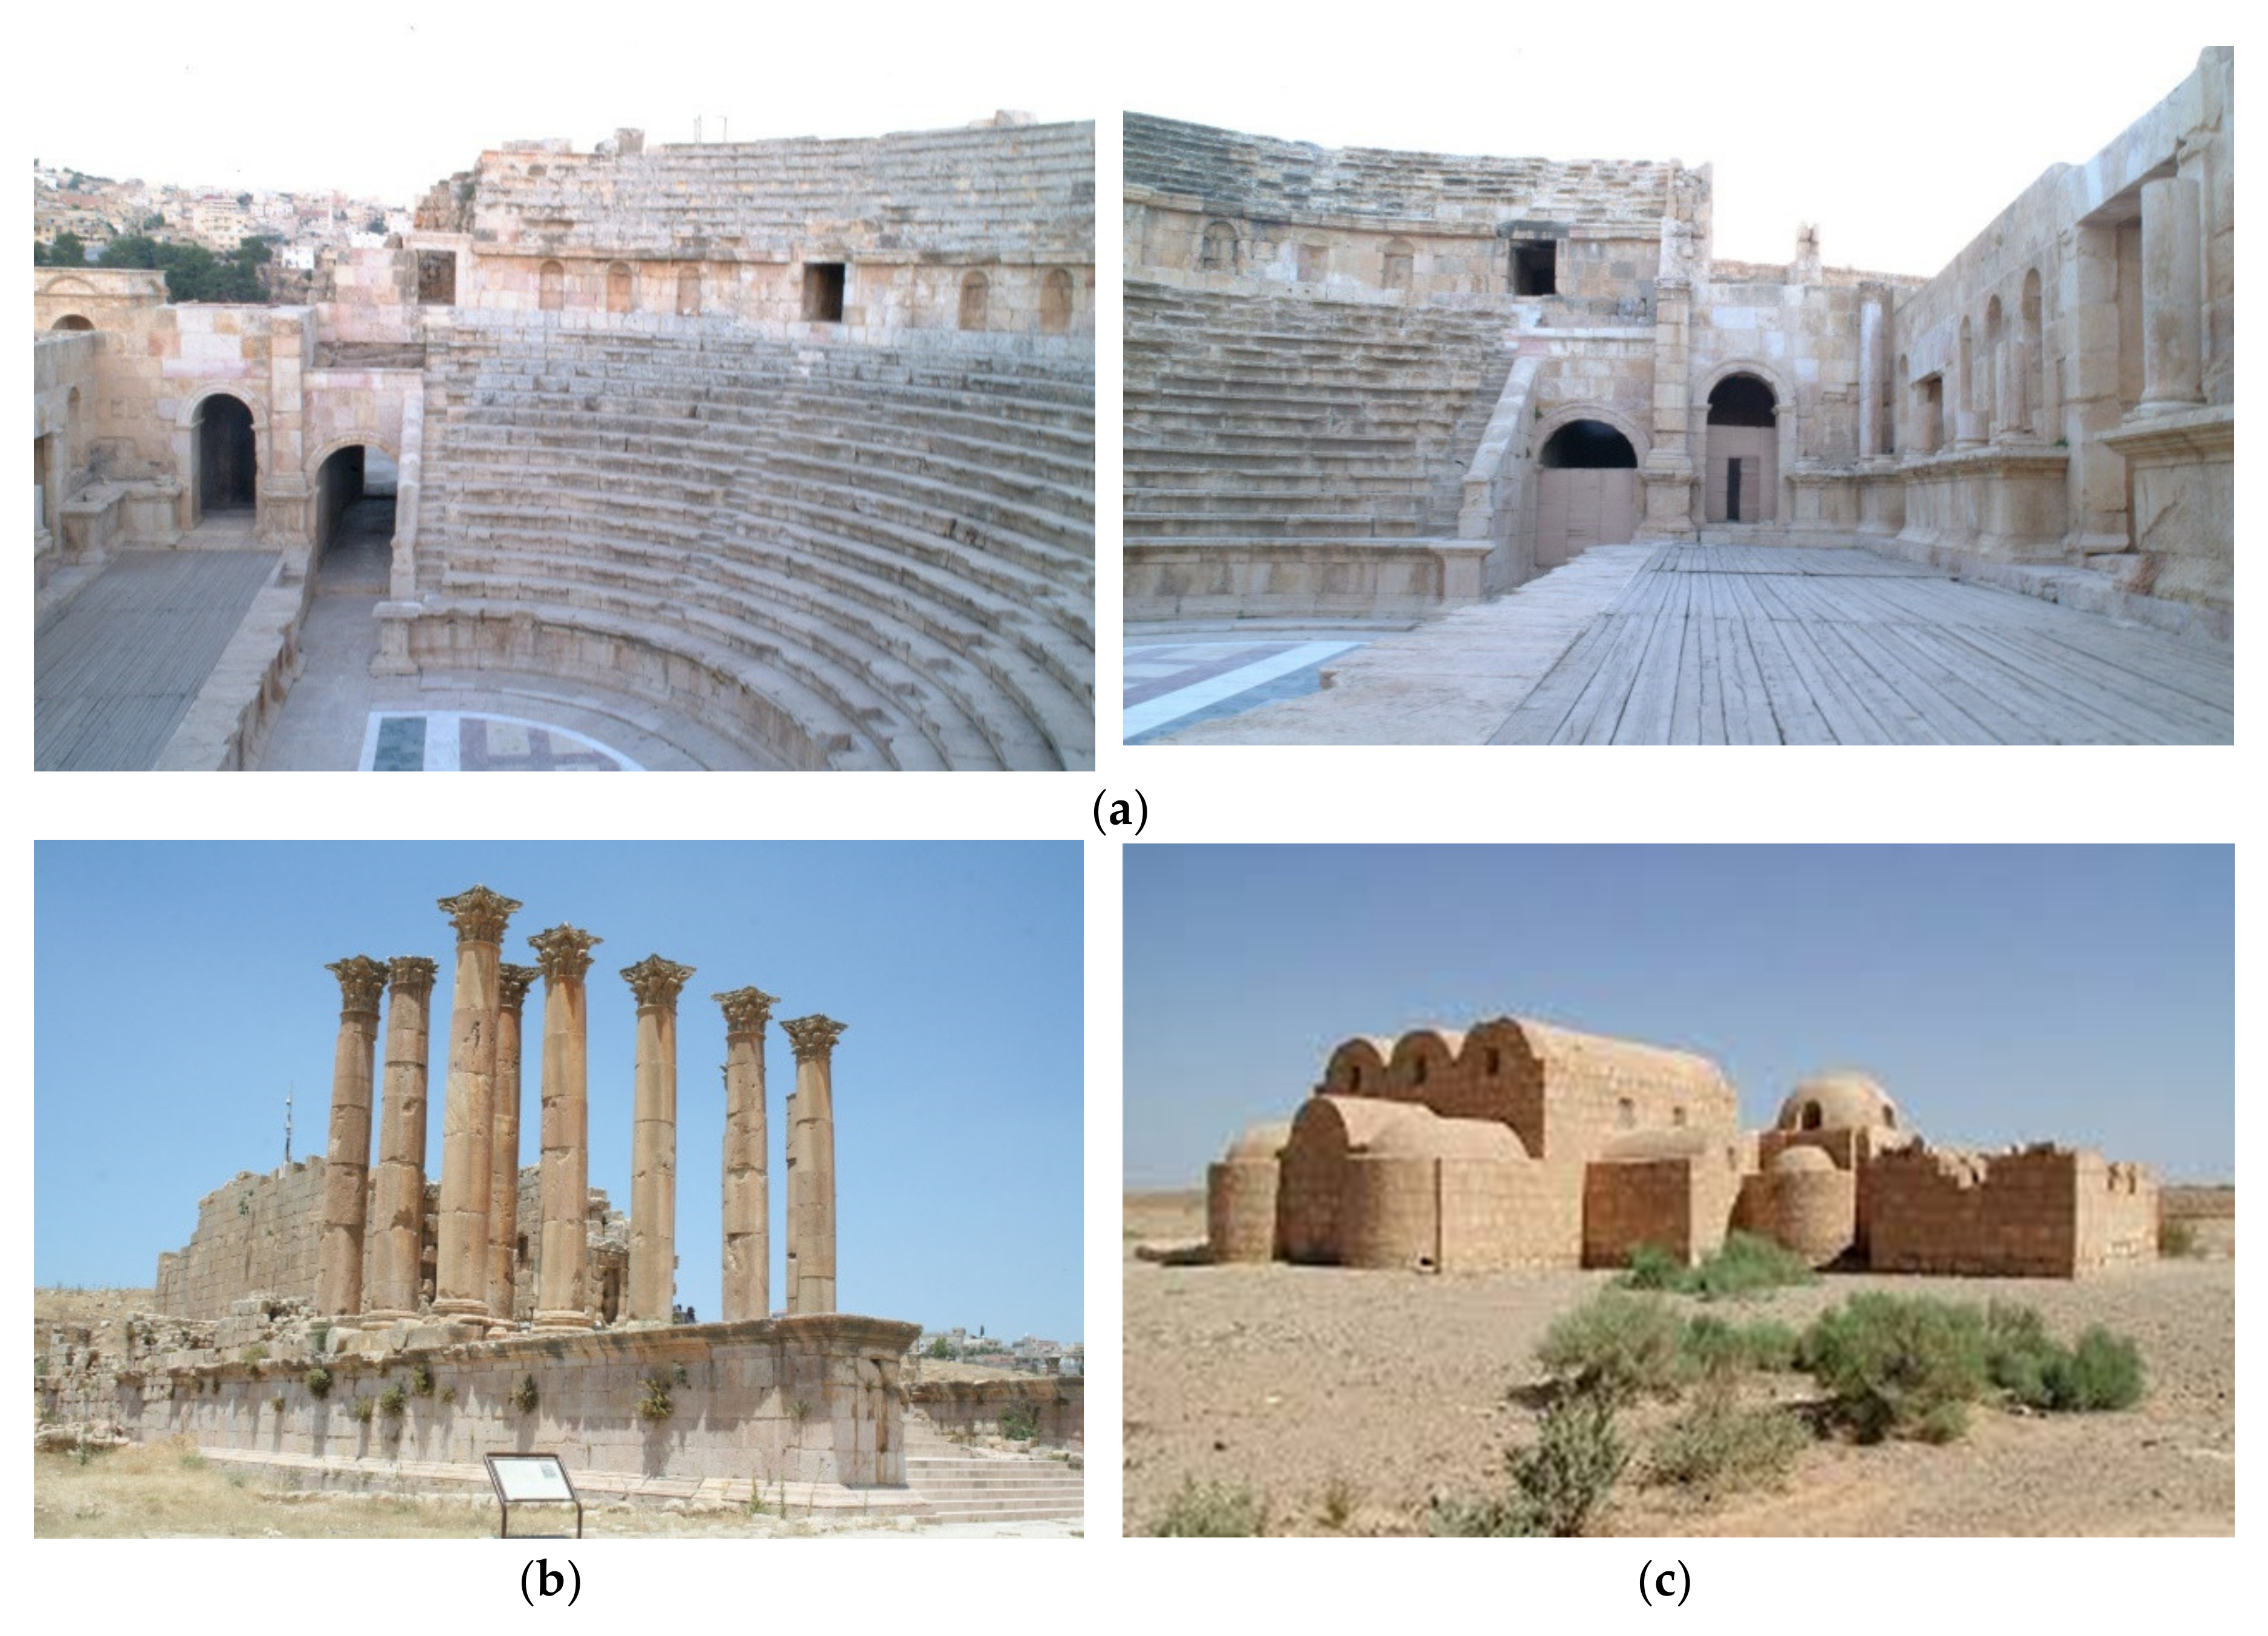
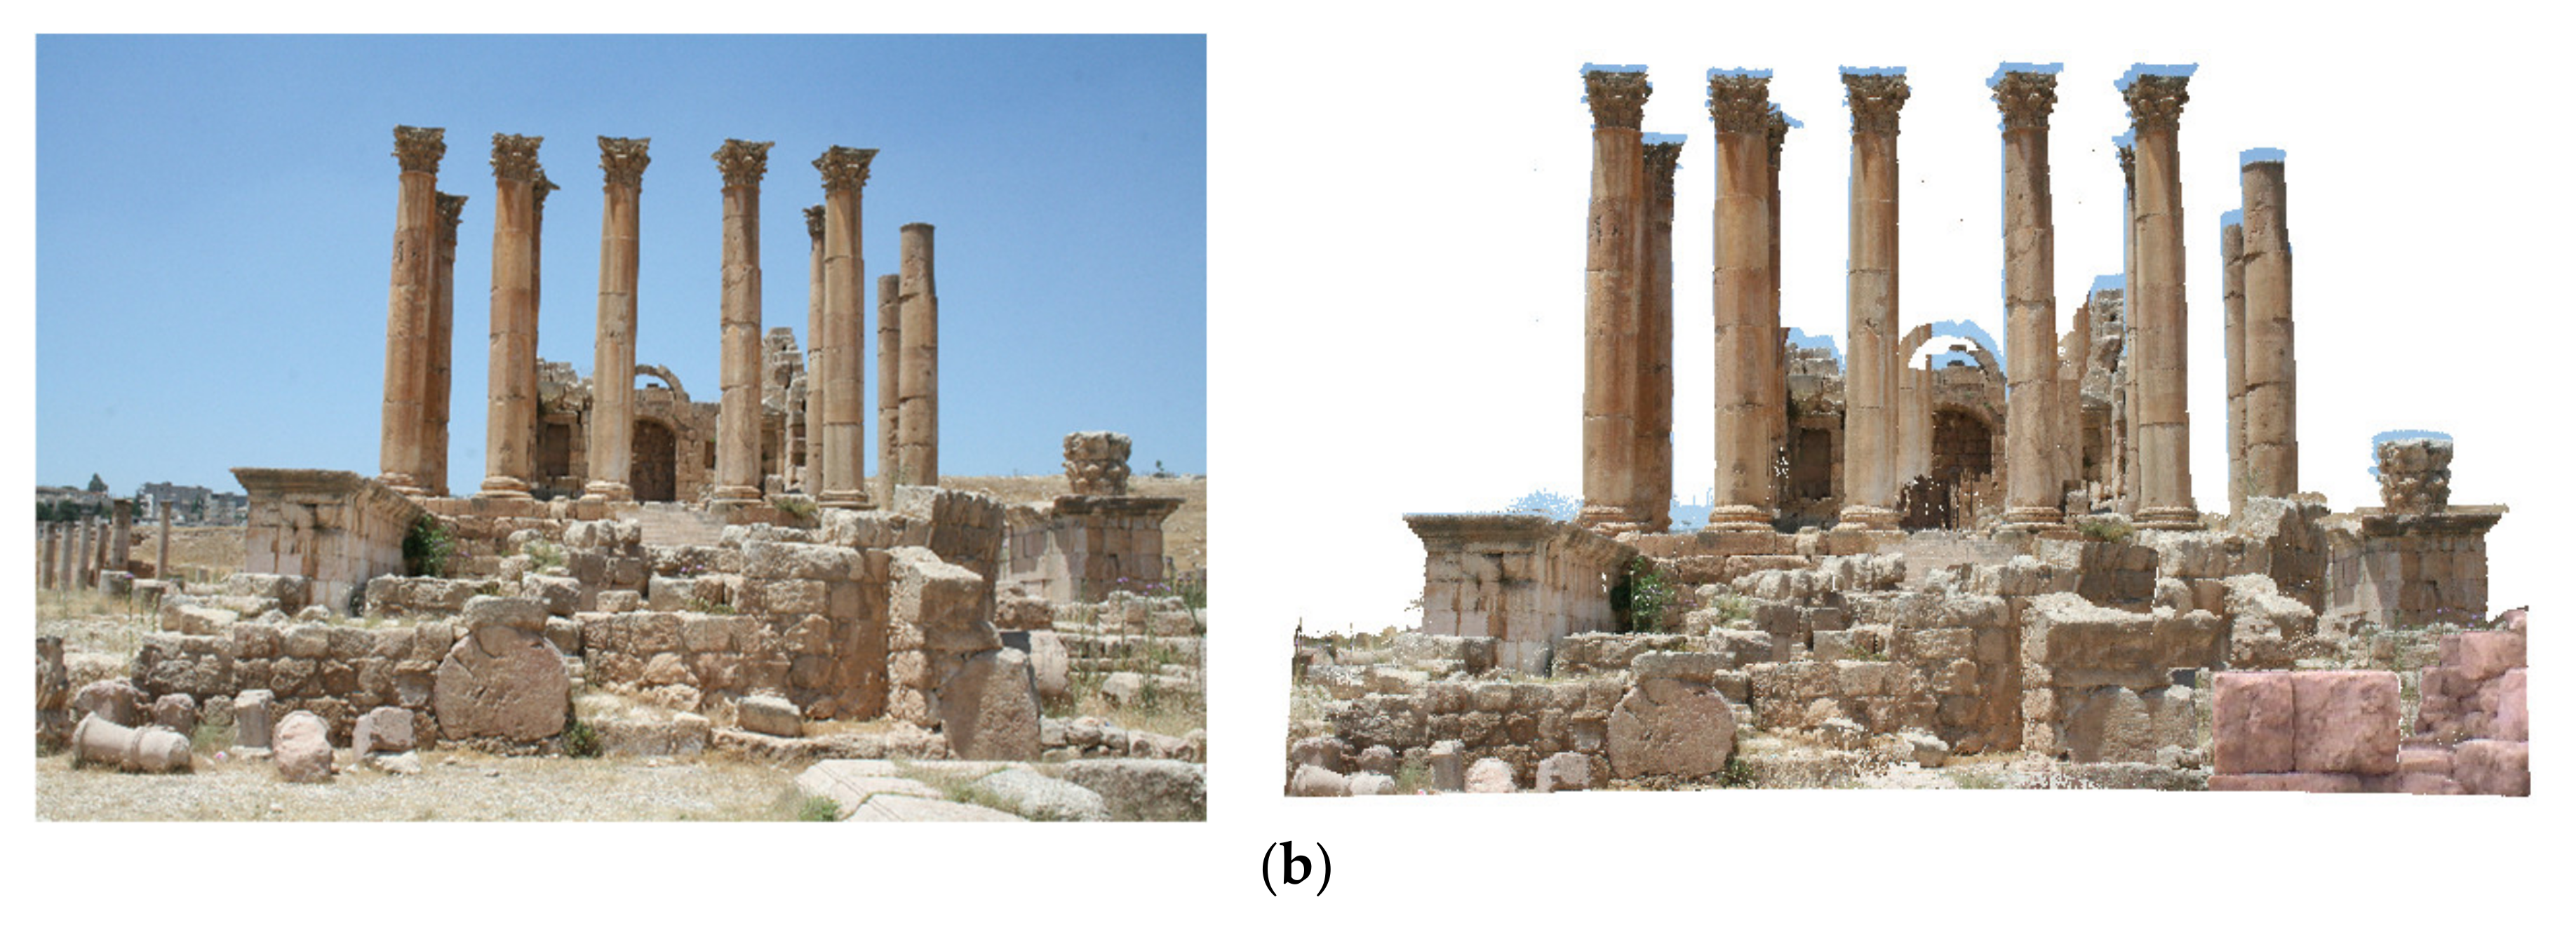
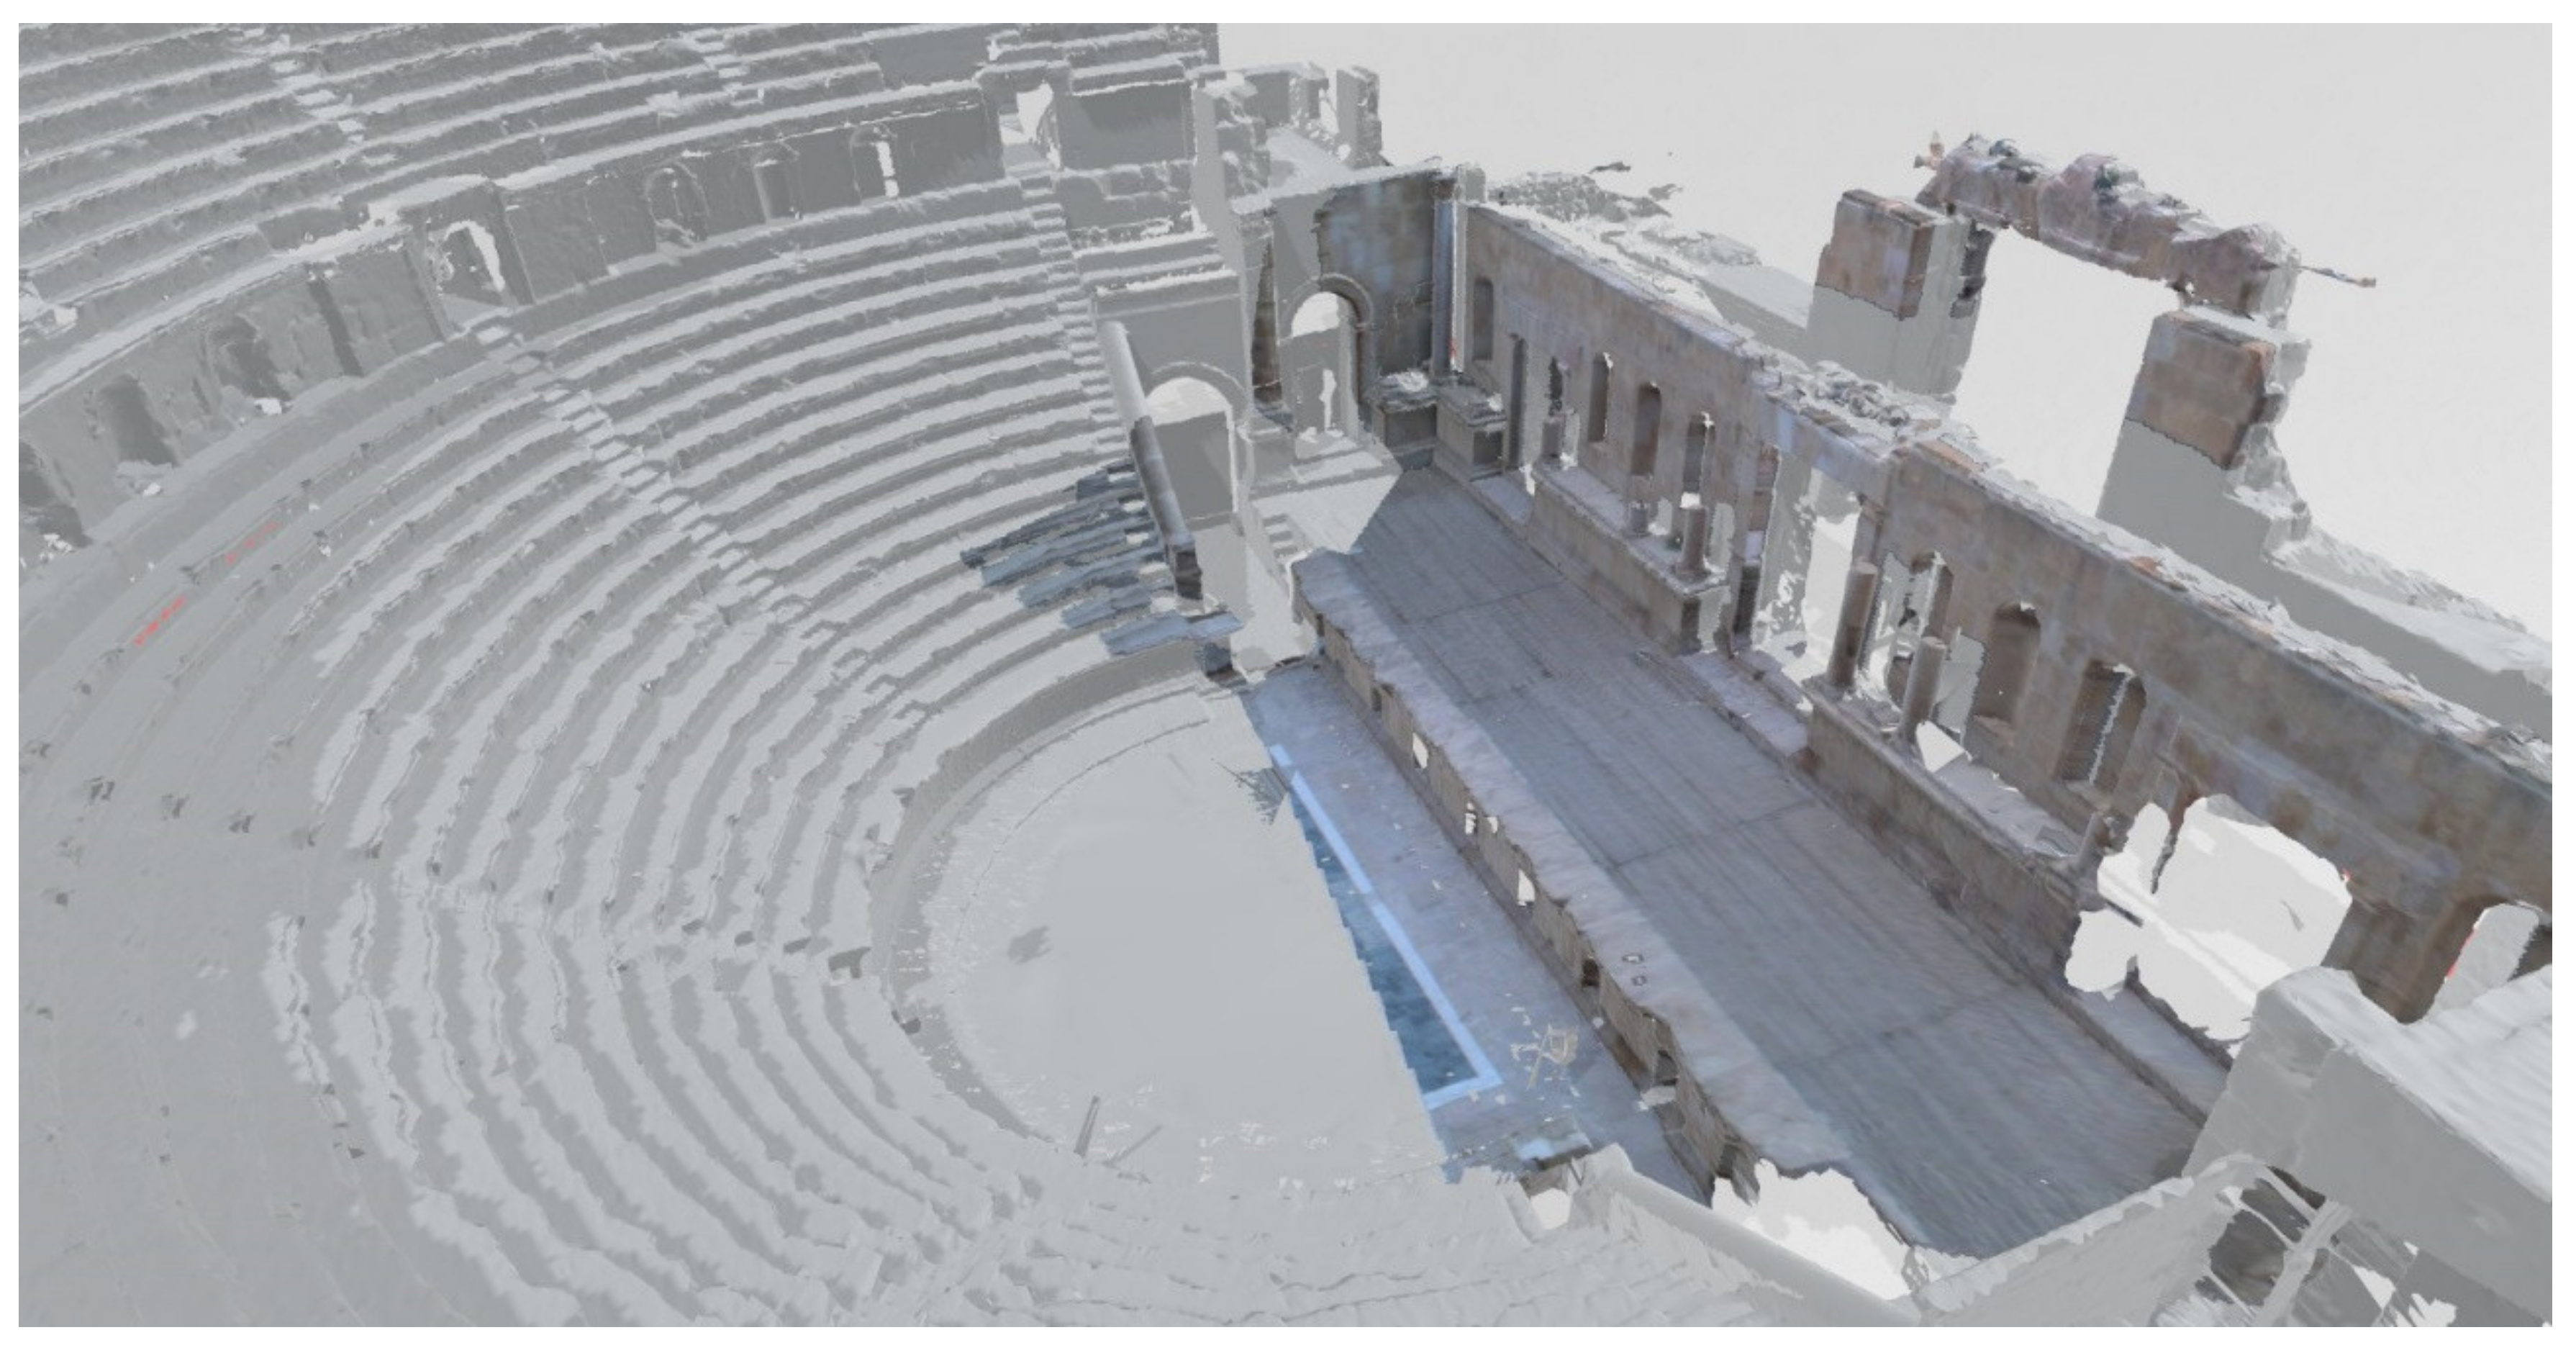
Gerasa, known today as Jarash, is considered to be one of the best preserved and most complete Roman cities in the world. It is located about 40 km north of the capital city of Amman. It was a member of the Decapolis group of cities; one of the ten largest cities in Rome. The city has several striking monuments: Gates, Arches, Forum, Baths, Temples, and Theaters. It has been inhabited since the Neolithic era, while the prosperity of the city was achieved mostly during the Roman period [75,76]. The Northern theatre depicted in Figure 3a was inaugurated in 165 A.D. and then extended to include the addition of eight rows of seats in the first quarter of the third century A.D., increasing its size to about 1600 people. Originally, there were 14 rows of seats, with two vaulted passageways leading to the front of the theater, as well as five internal arched corridors leading to the upper rows. The inscription carved on the seats of the lower Cavea was interpreted to denote the names of different municipal groups, indicating that the odeion may have doubled as a chamber of the council at that time [77]. In addition to the theatres, there are two large sanctuaries dominated the well–known Roman city: the Zeus Olympios sanctuary and the Artemis sanctuary, both of which occupied prominent locations in the city. Our second experimental data was collected from the Temple of Artemis, shown in Figure 3b. Artemis was the Greek goddess of nature, the goddess of transition and initiation [78]. The temple was built in the center of the ancient town between 150 and 170 A.D., in the middle of the highest of the two sanctuary terraces. The complex is accessible from the Cardo via the propylaeum and the entrance to the monumental staircase leading to the terrace of the altar and the Temenos. The portico around the cella was built with six by eleven columns, only eleven of which are still standing in the pronaos [79,80].
3.1.2. Qusayr ‘Amra
Jordanian desert palaces are rare masterpieces scattered throughout the desert as symbol of past cultures. Umayyad qusur, or "palaces" of the desert, are known for their complex architectural styles and decoration. One example is Qusayr ‘Amra, 85 kilometers east of Amman; in 1985, it was listed on the World Heritage List due to its distinctive wall paintings [81]. This red limestone palace, seen in Figure 3c, was built between 705–715 A.D. during the reign of Caliph Walid I. It was a vacation residence or a rest house. The plan for the building includes a rectangular audience space, triple–vaulted ceiling bath complex and hydraulic structures. Qusayr Amra’s main attraction are the extensive frescoes depicting of a range of topics like hunting scenes, astronomical depictions and sports events [82,83].
3.2. Sensors Applied
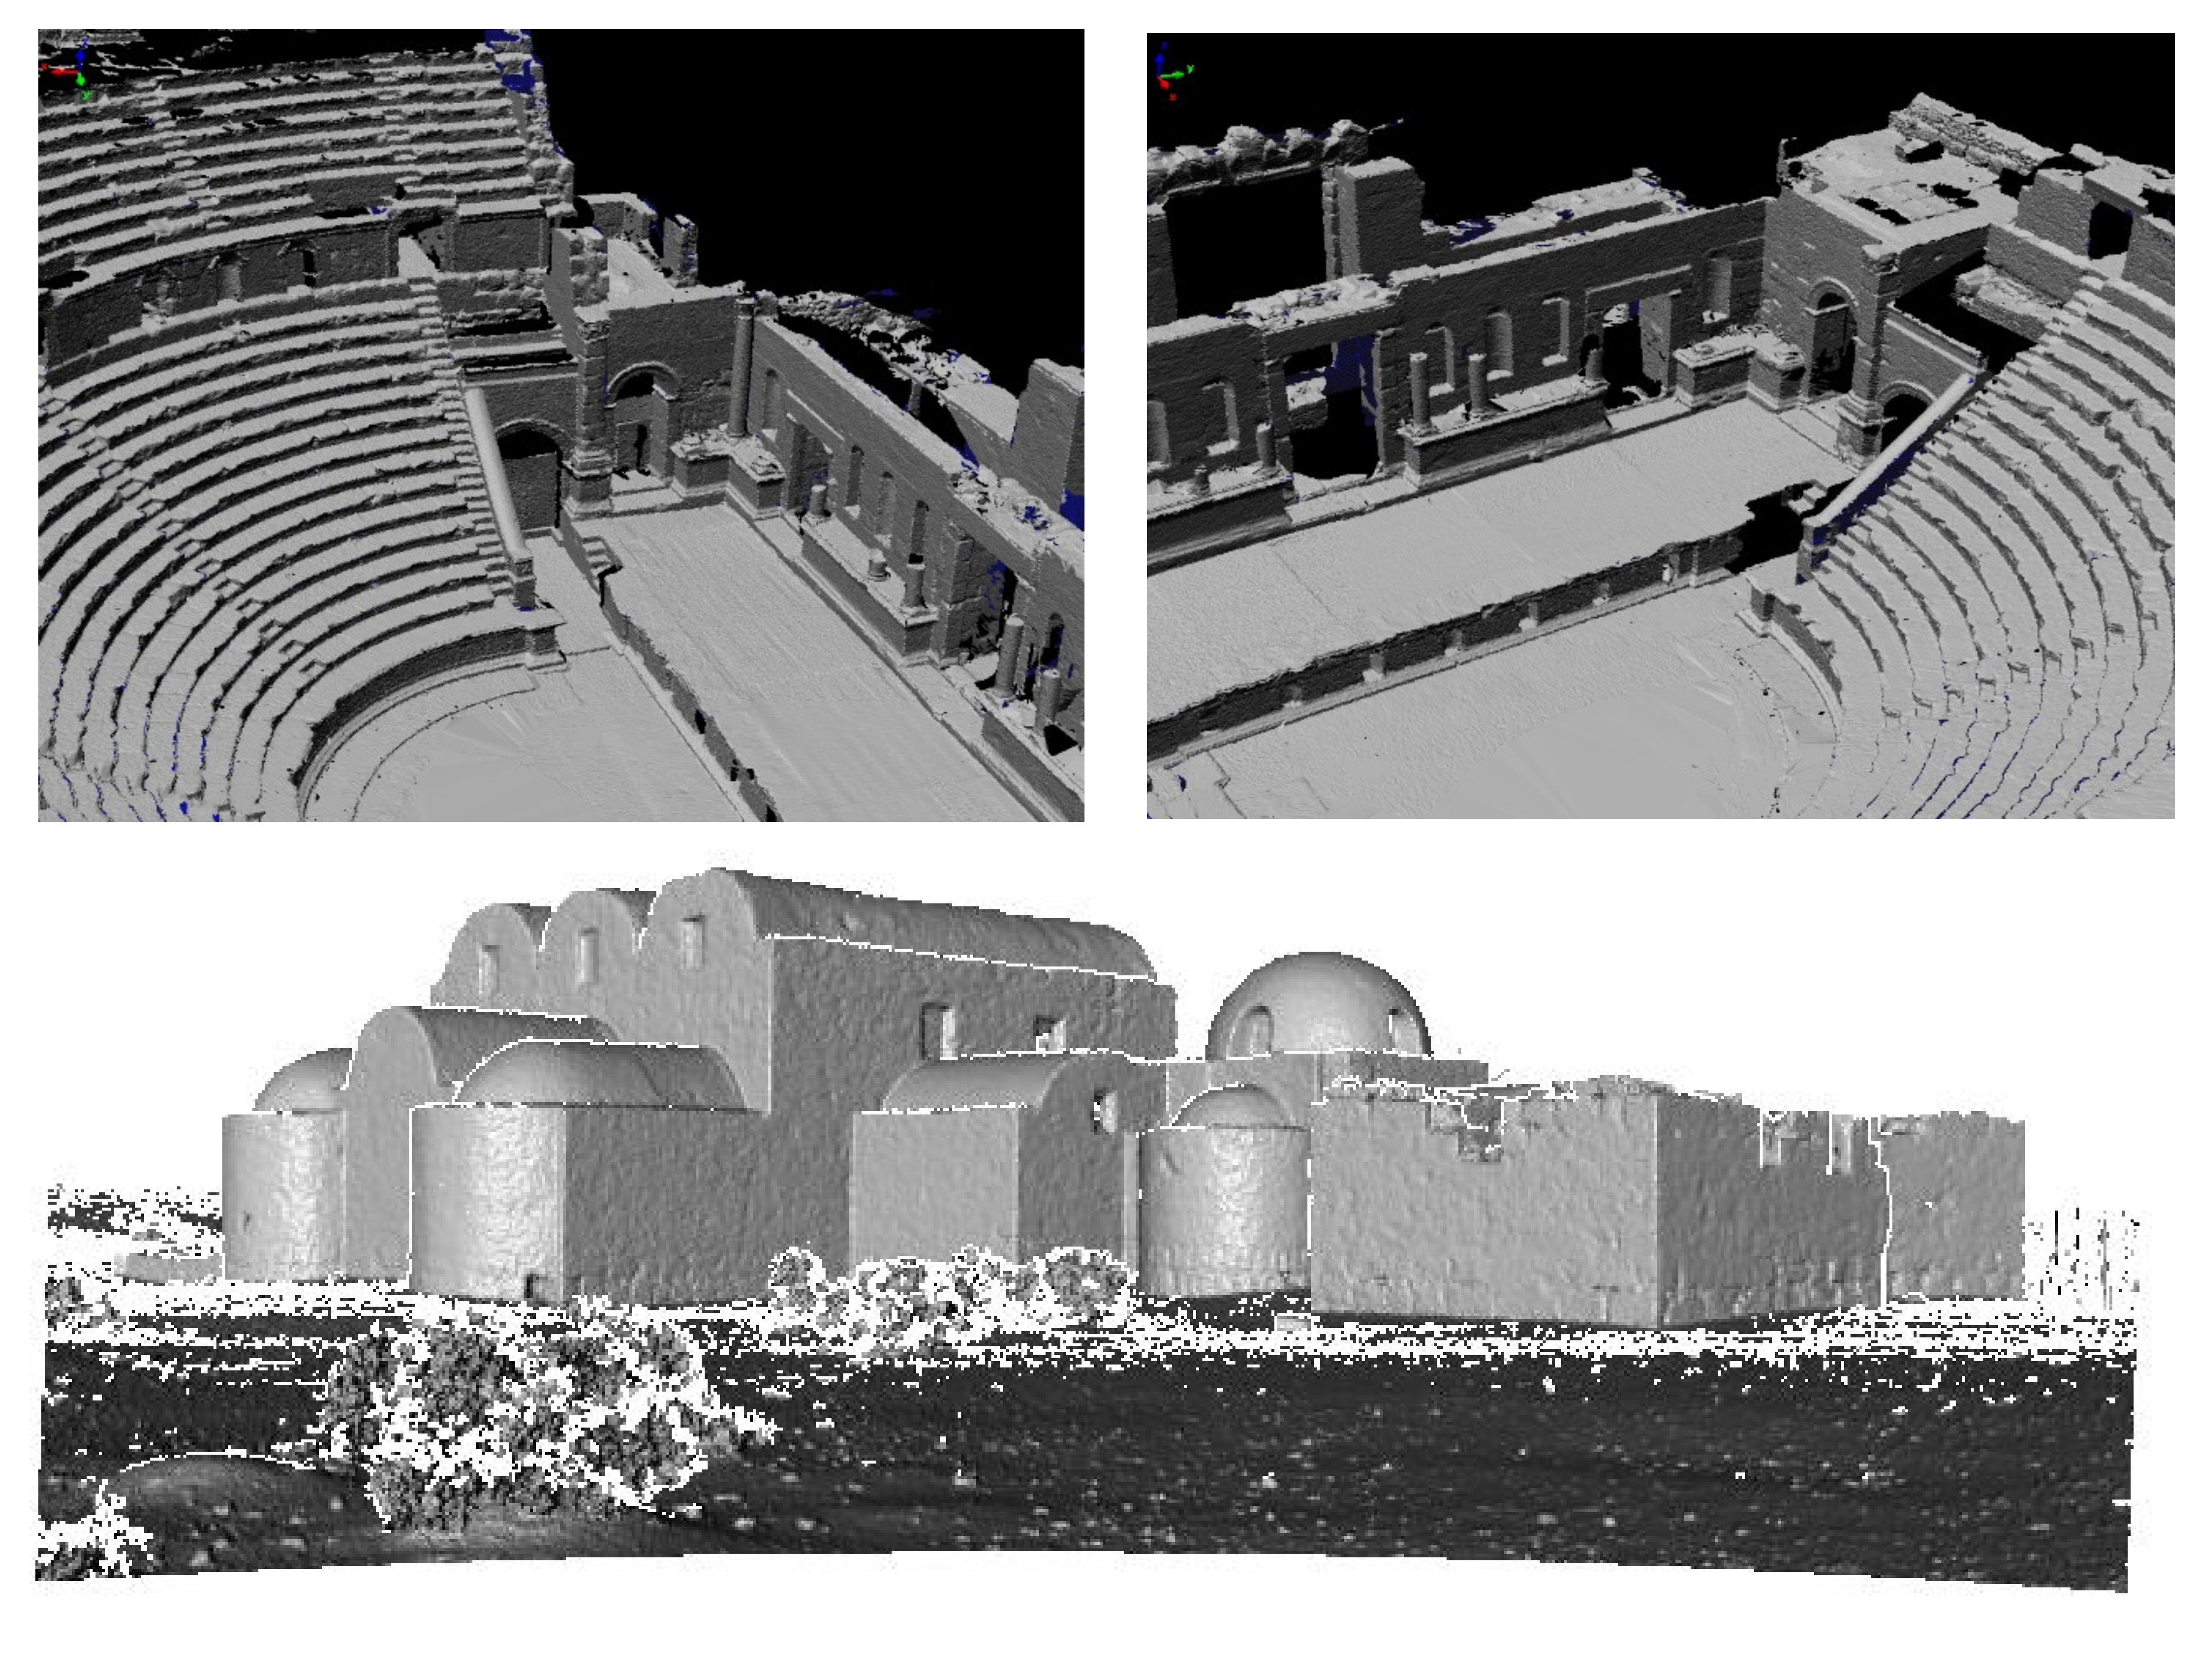
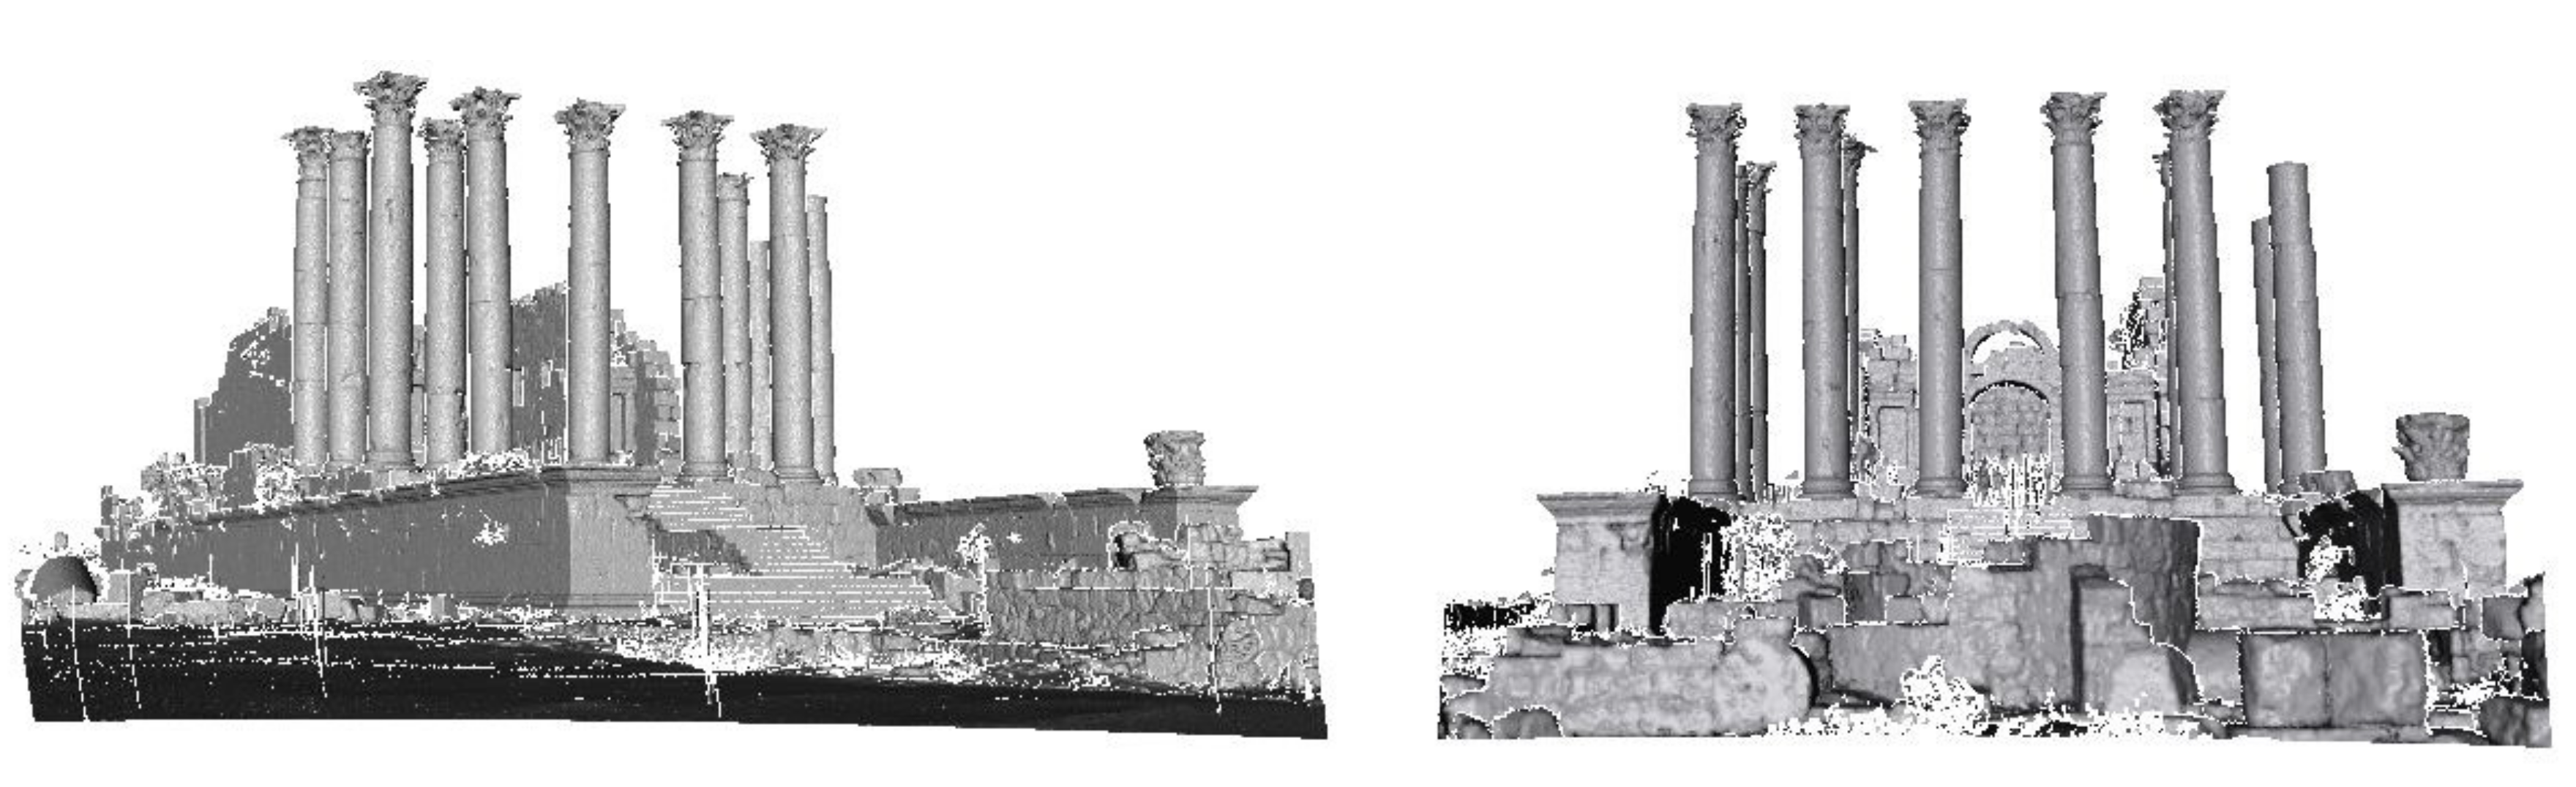
The Mensi GS100 Laser Scanner had been used for our investigations to acquire the surface point cloud. The system’s measuring scanning distance is between 2–100 meters, with a precision of 3 mm at a distance of 50 meters. The flight time scanner acquires five thousand points per second. The system is equipped with a 768x576 pixel resolution camera., which is used to map the color to the relevant points. Terrestrial laser scanners have been used to create point clouds at medium distances. Choosing viewpoints is an essential phase of the survey, since the available sensor locations are restricted by the nature of the scene. In order to provide 3D coverage of Qusayr ‘Amra, eight different scanner viewpoints have been chosen, whereas seven scans were created for both the North Theater and the Temple of Artemis. For a complete description of the scene, the scans obtained must be merged into one reference to create a single point cloud. In our case, artificial targets are used, at least three targets should be used in each pair of scans, their 3D position is determined to calculate the scan transformation parameters. Additional data processing, such as meshing, is needed to transform point–based data into a more intuitive visual representation. Figure 4 shows the 3D meshed models. The Amra meshed model has an overall 2 cm resolution with 6 million triangles, the Northern Theater model has a resolution of 5 cm with 4.6 million triangles, while the meshing process was done only for some individual scans of Artemis temple.
For photogrammetric processing, digital images were taken using a 3888x2592 resolution Canon 400D camera, and a Nikon D2x camera with resolution 4288x2848. These images were taken almost simultaneously in order to have the same lighting conditions, resulting in similar radiometric properties as required for the laser data coloring. The availability of images for ortho–photo production, almost orthogonal to the object surface, improves the subsequent processing and minimizes occlusions. However, a further set of converging images is needed to remove TLS occlusions and assist the photogrammetric processing when estimation images orientation parameters.
4. Data Fusion and Visibility Analysis
4.1. Camera Mathematical Model
The registration of imagery and TLS model in a common reference is a pre requisite for using the complementary characteristics of both data sets. Usually, registration occurred in two methods: manual or automatic [84]. The manual approach is carried out by defining conjugate control points from the image and TLS point cloud [85]. Automated methods are usually performed using a feature-based approach [86,87]. However, in close range applications, further problems occur with the automated detection and matching of the two different data types [88].
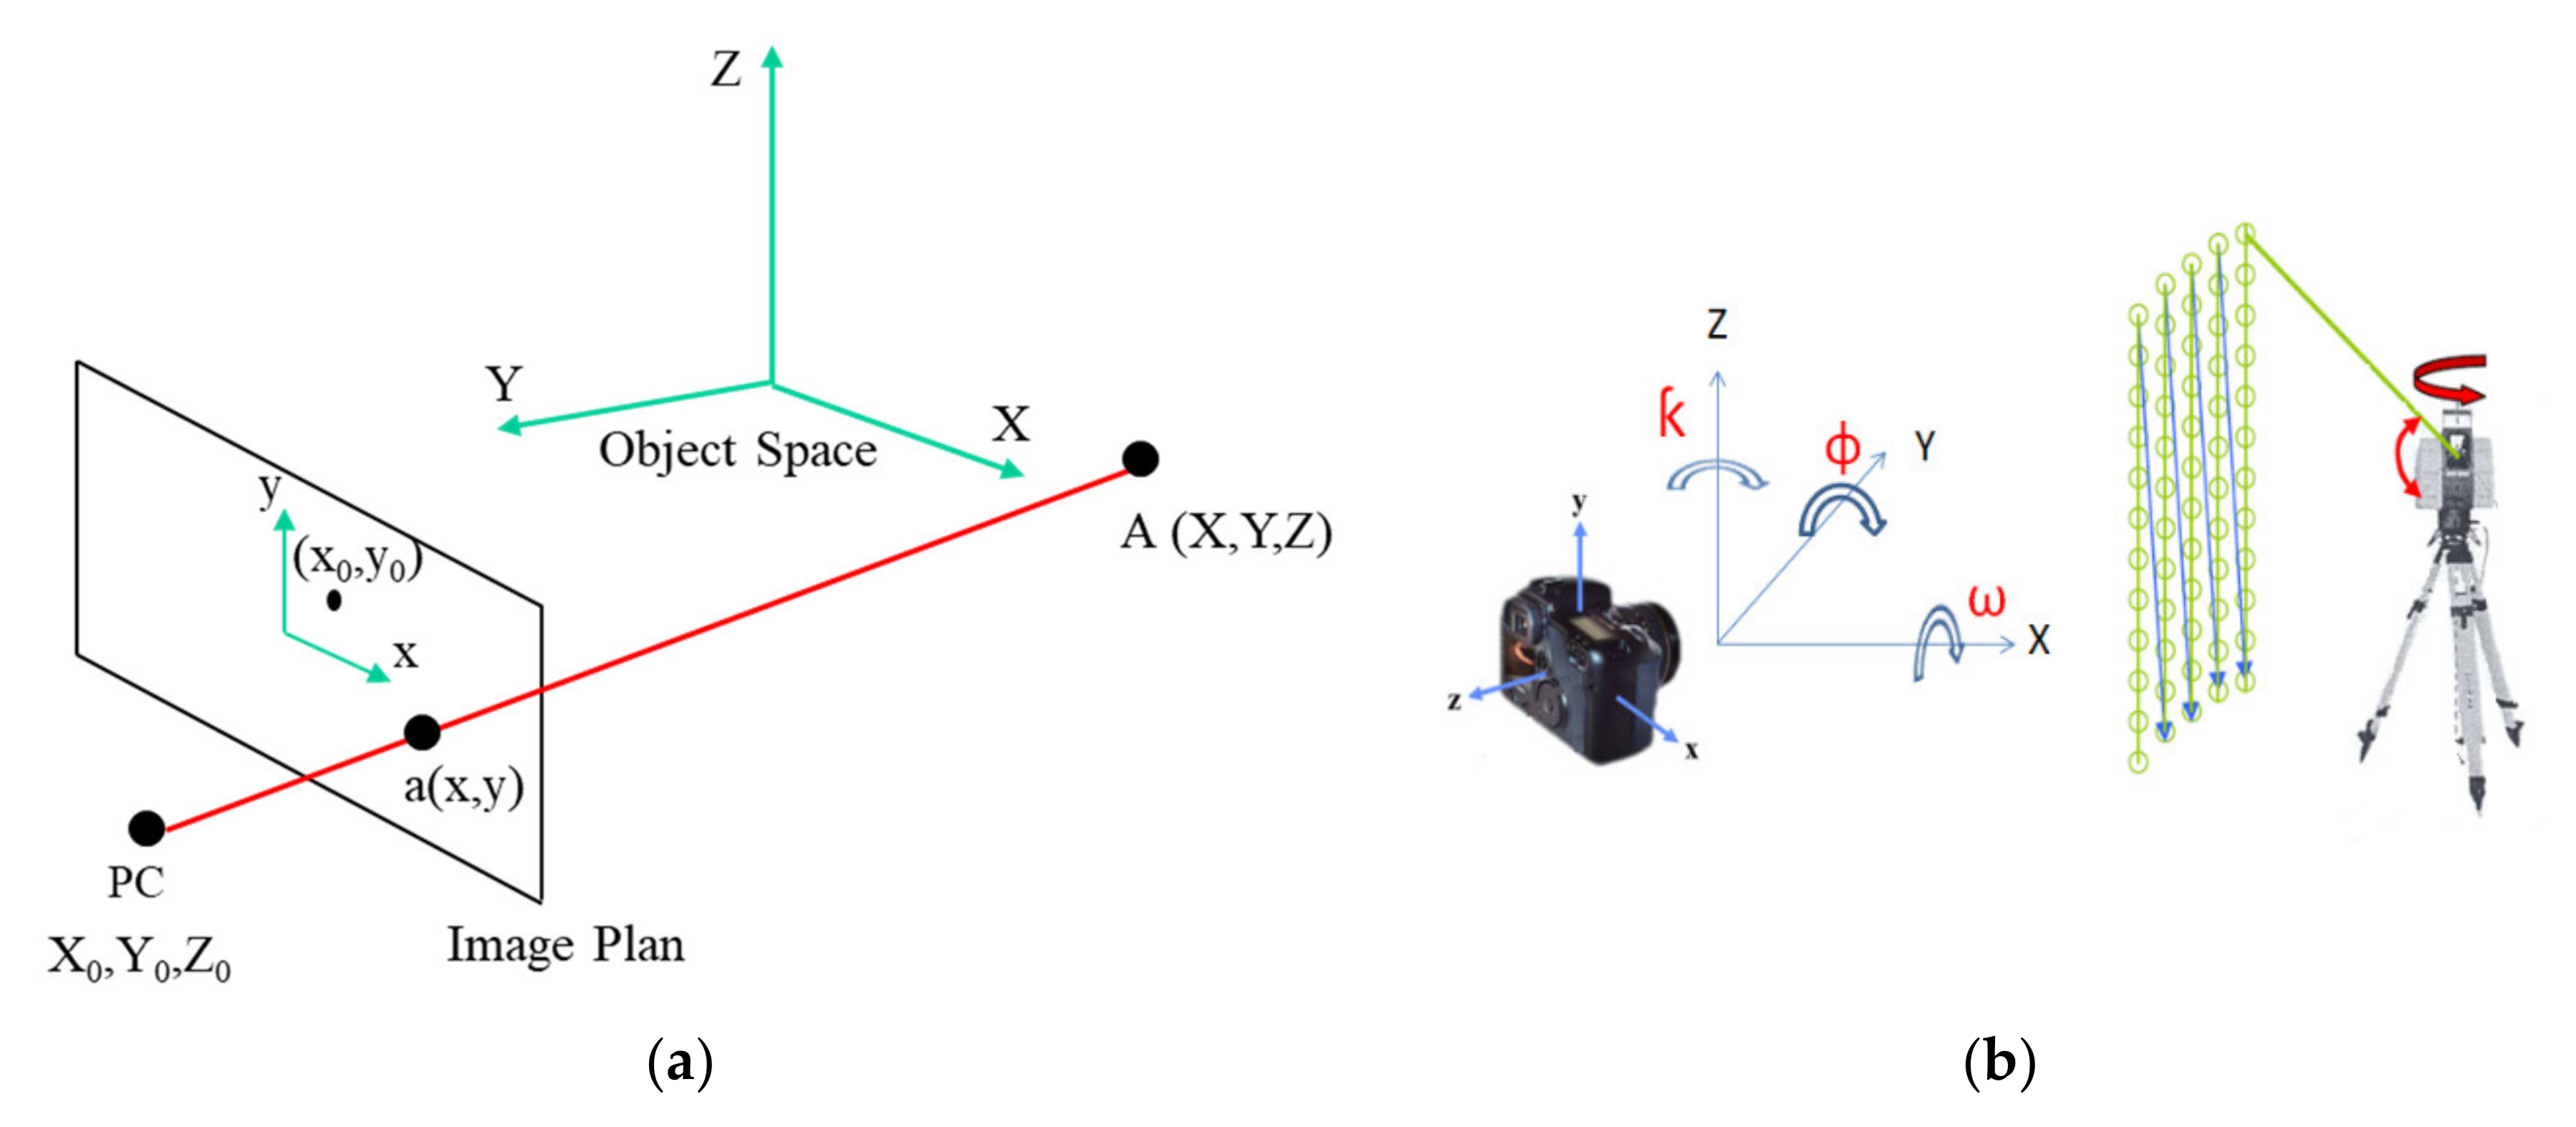
The registration is still preferred as a manual process for large and complex practical projects. Collinearity condition equations are applied in our matching strategy to solve camera resection using corresponding pixel–model coordinates as input data. These equations derive from the central projection of an object point through sensor plane to the camera’s perspective center (PC), as seen in Figure 5a. Homologous points are manually specified in order to compute the translation and attitude angle registration parameters (Tx, Ty, Tz, ω ɸ ƙ), depicted in Figure 5b. The resulting parameters are represented within the equations (Equations (1) and (2)) by rotation matrix R (3 × 3) and translation vector parameters, where (xa, ya) are the known image coordinates, (XA, YA, ZA) are the object’s known laser scanner coordinates, rij are the unknown elements of rotation matrix, and (X0, Y0, Z0) are the unknown camera position coordinates. The camera ’s internal orientation parameters include: (x0, y0) as the principle point coordinates, and (c) as the camera focal length. Once camera registration parameters are calculated, the collinearity equation is then used for model texturing and orthophoto mapping.
4.2. Visibility Algorithm
In some contexts, our visibility algorithm can be seen as the reverse action of the ray tracing algorithm, in which discrete rays are transmitted from the object point to the image plan using camera parameters and collinearity equations. The algorithm begins by checking the frustum occlusion to eliminate geometric elements that are not within the range of the optical image from the computation process. The triangle vertices within camera view are stored in a matrix with their computed depth values from camera perspective center (PC). In practice, vertices cannot be occluded from each other unless they accidentally fall along the same ray from the view point; therefore, no point is actually hidden. In the proposed algorithm, a search patch with (nxn) pixels is used around the projected vertex P in the image space, the value n corresponds to the sampling triangle length in pixels. The patch records all of the mapped vertices within its pyramid range in object space and sorts them according to the depth values, as depicted in Figure 6. The above evaluation should only be carried out against vertices within the set corresponding to the current voxel. If the computation has been completed, the vertex P is assigned as visible if it is nearest to the image plane, otherwise it will be assigned as occluded. Furthermore, other nearest vertices which are supposed to belong to the same triangle of the visible vertex P would be assigned as visible using a simpler criterion; if vertex depth deviation ∆D from visible point P do not exceed a threshold value equal (T). The threshold value is assumed as the triangle length of the processed 3D model. The process is repeated for all non-labeled vertices in the model. The flowchart of the proposed algorithm is shown in Figure 7.
| Algorithm 1 The proposed visibility analysis |
| Input: Triangular vertices, selected scene image, image size in pixels, patch width (n) in pixels, triangle length T (mm, cm, or m) based on the model unit. |
| Output: Labeling the triangular vertices as visible or occluded. |
| 1. Considering the meshed vertices model in ASCII or WRL format. |
| 2. Calculate camera registration parameters. |
| 3. Checks the frustum occlusion using image size. |
| 4. The triangles vertices within camera view are stored in the matrix with their depth values D from the perspective center PC. |
| 5. Project the vertex P to the image plane and set the patch (nxn) centered at the image point p. |
| 6. Sort the vertices within the patch depending on the D values and calculate their depth differences ∆D from P. |
| 7. The vertex P is assigned as visible if it is the closest to the image plane, otherwise it is assigned as occluded. |
| 8. If the vertex is assigned as visible, the neighboring vertices within the patch would be assigned as visible if ∆D does not exceed threshold value T. |
| 9. The process repeated for non-labeled vertices. |
| 10. All visible vertices will get their ID required for further texture processing and true orthophoto mapping. |
5. Laser Scanning Aided by Photogrammetry
5.1. Texture Mapping of the Laser Data
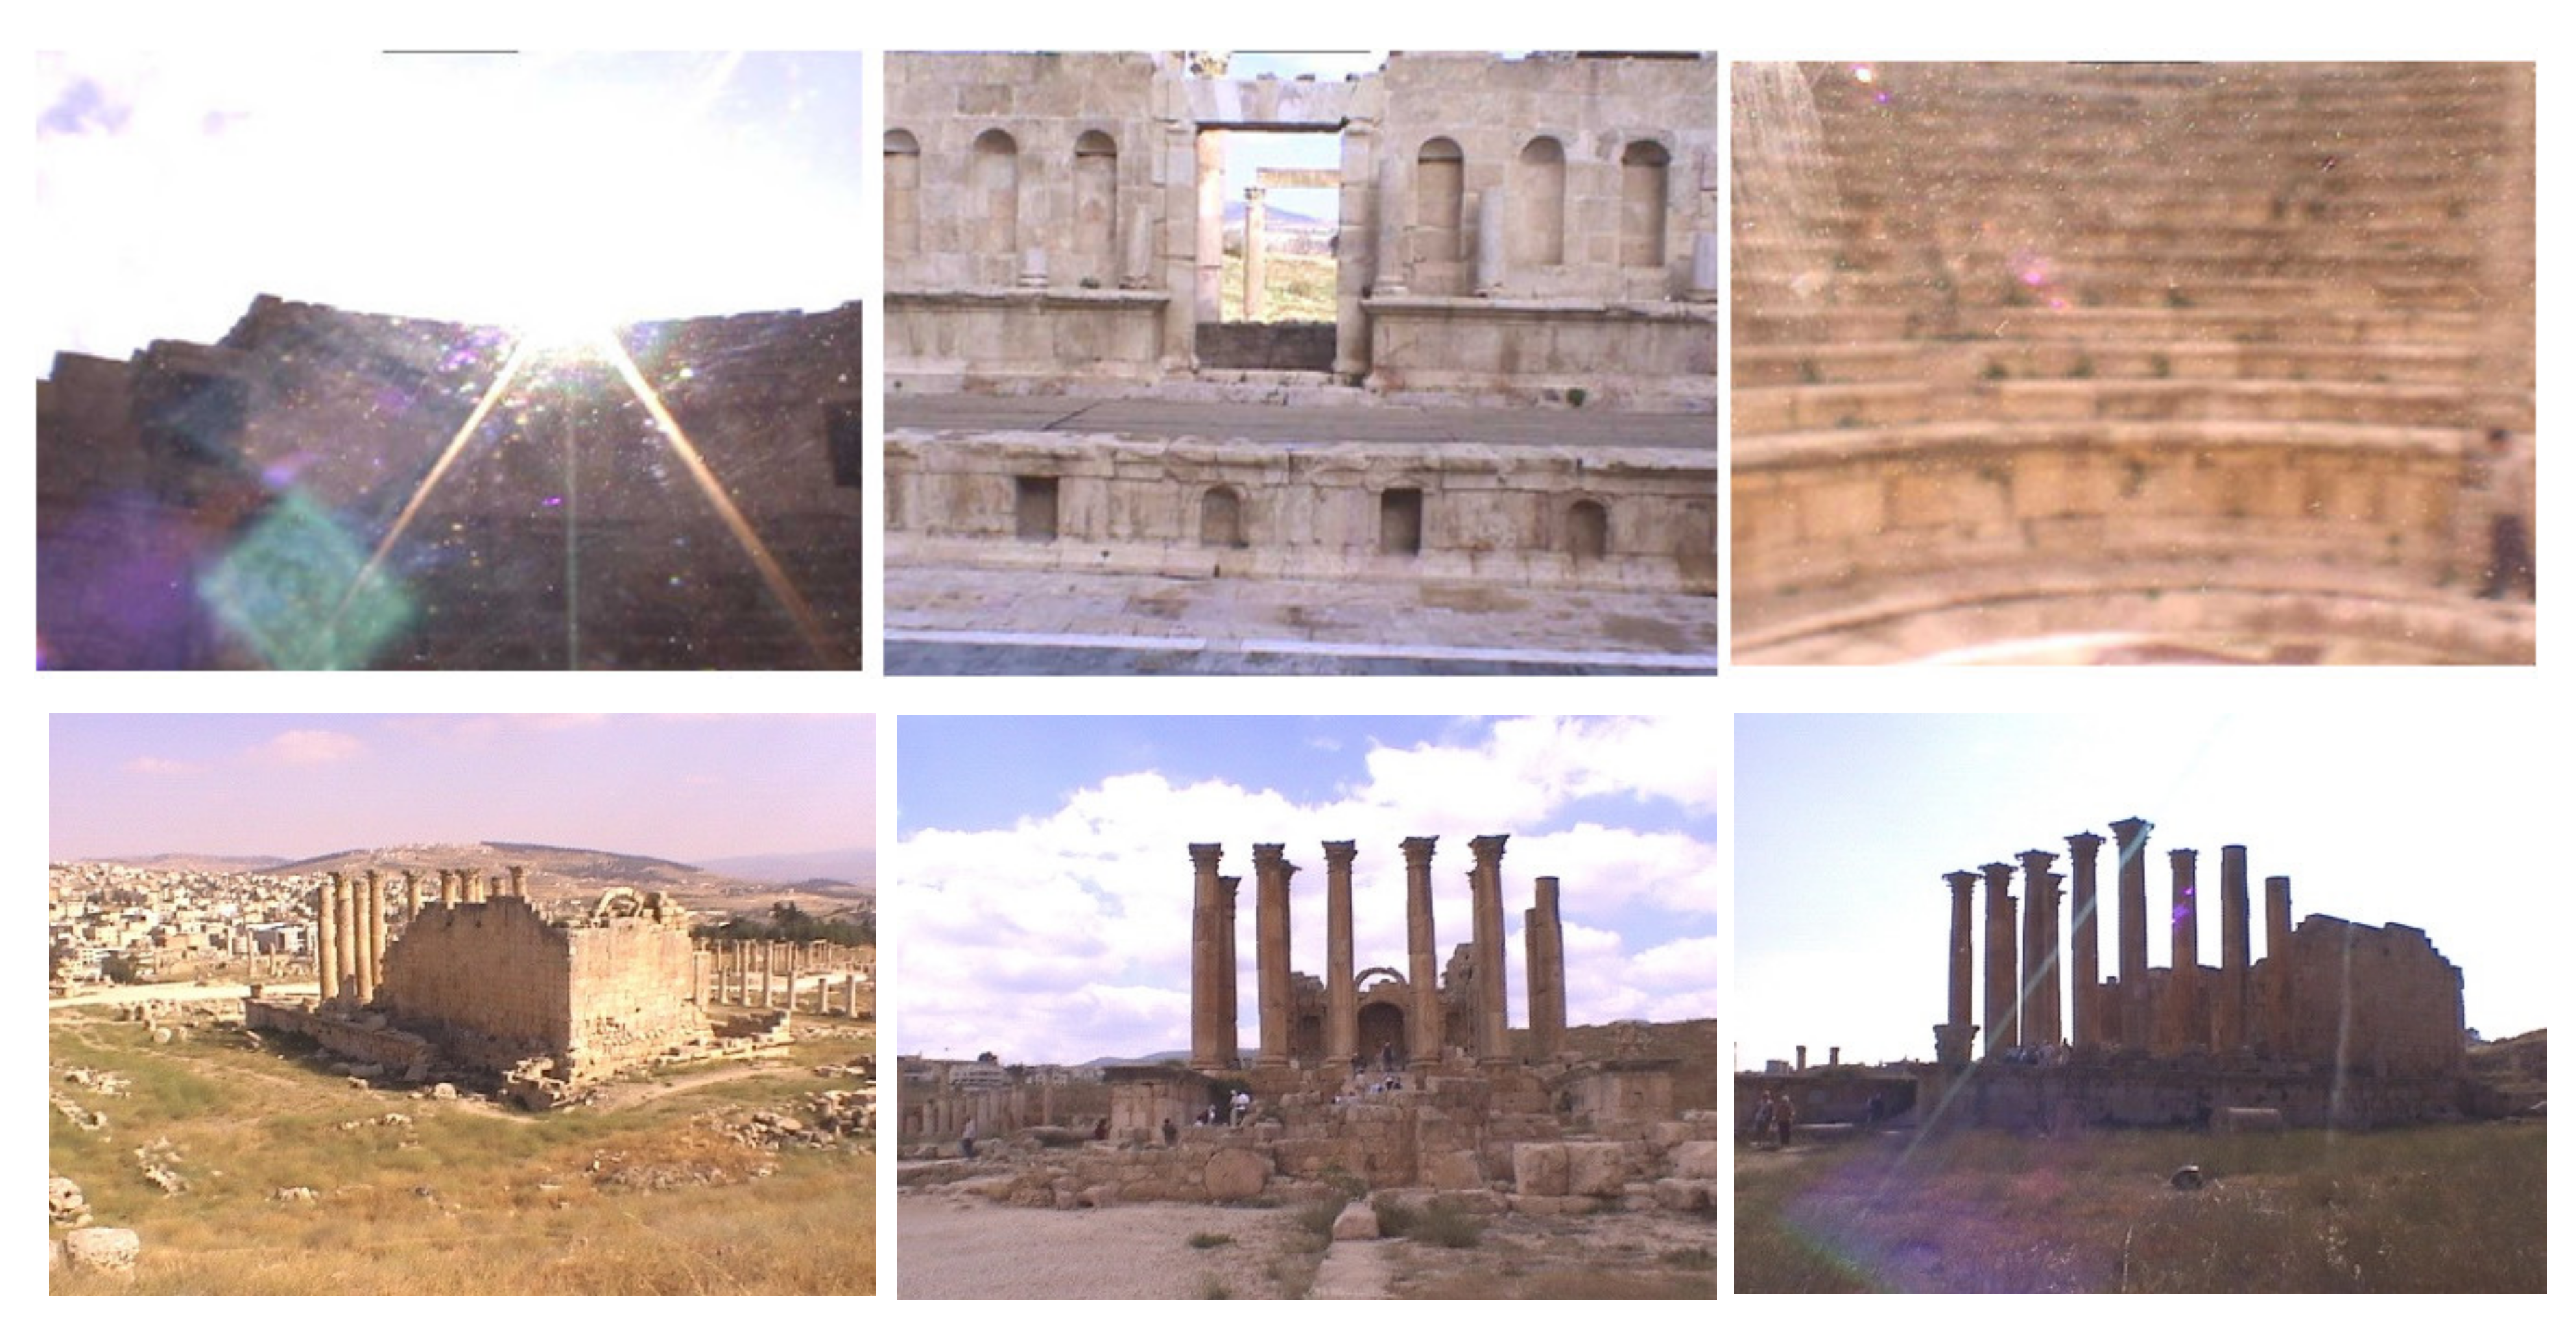
Most 3D sensors provide model–recorded texture with a camera installed in the device to capture the RGB values of each captured point. However, in outdoor applications, laser scanning from many points of view, as it is necessary to capture complex structures, is still relatively time consuming. The large time intervals between the scans can also results in different lighting and shadow conditions. Models obtained by assembling the various scans will have poor homogeneity and jumping in color. Figure 8 shows examples of images taken from the installed TLS camera. Nevertheless, acquisition from far distance to minimize number of required scans and reduce the field time will lead to low resolution textured model as depicted in Figure 9.
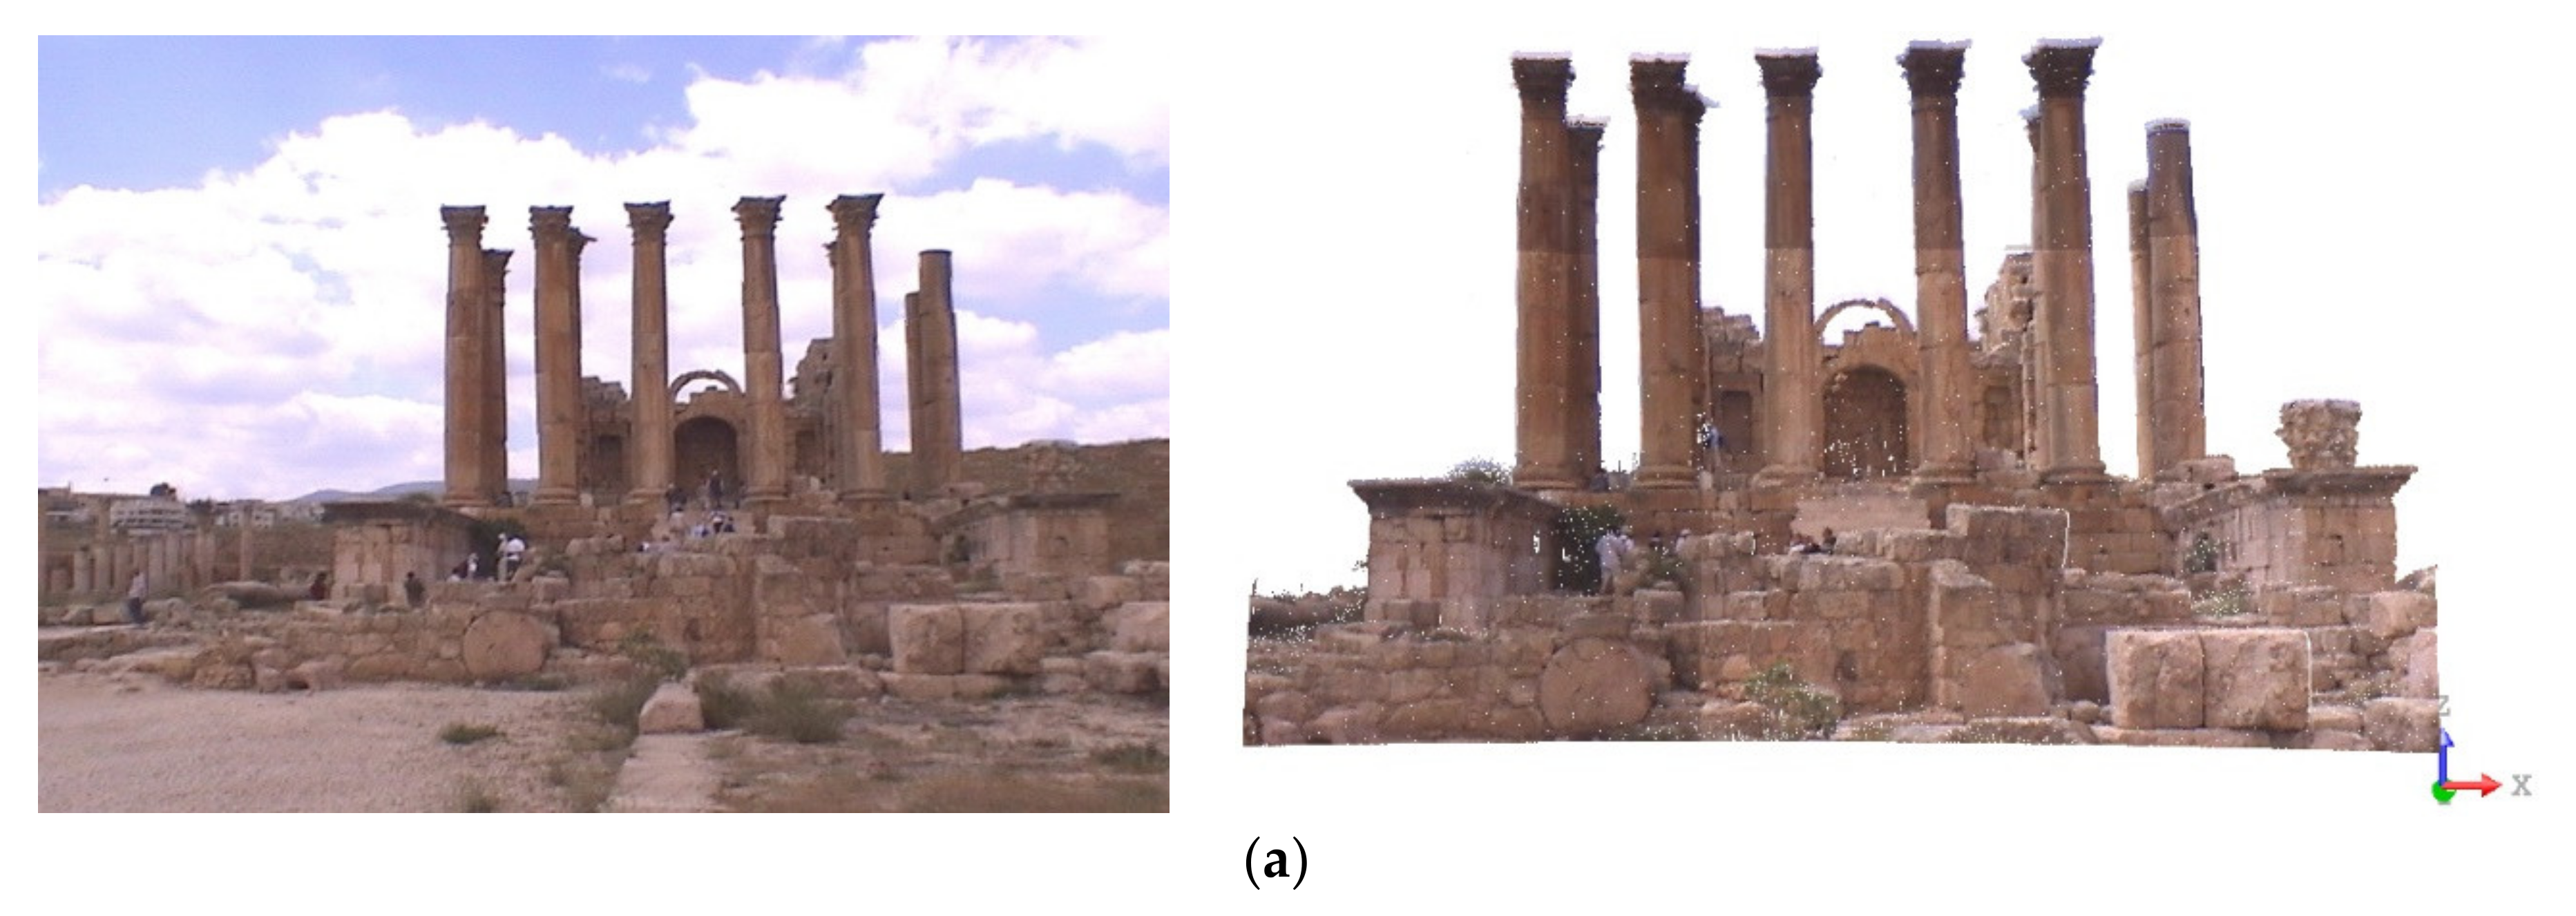
In general, photo-realism using an independent image is necessary and can be performed through the mapping process. The mapping algorithm should primarily identify the correspondence between the geometry and the optical image, assigning some coordinates to each map that link the surface point to the texture pixel. In texture mapping method, the color values (RGB) are acquired from the selected imagery and applied to the 3D laser points using collinearity equations (Equations (1) and (2)). In order to mitigate problems of occlusion, the TLS data and photographs are captured from the same location. This is usually sufficient for the purpose of interpreting the condition of the structure as shown in Figure 10.
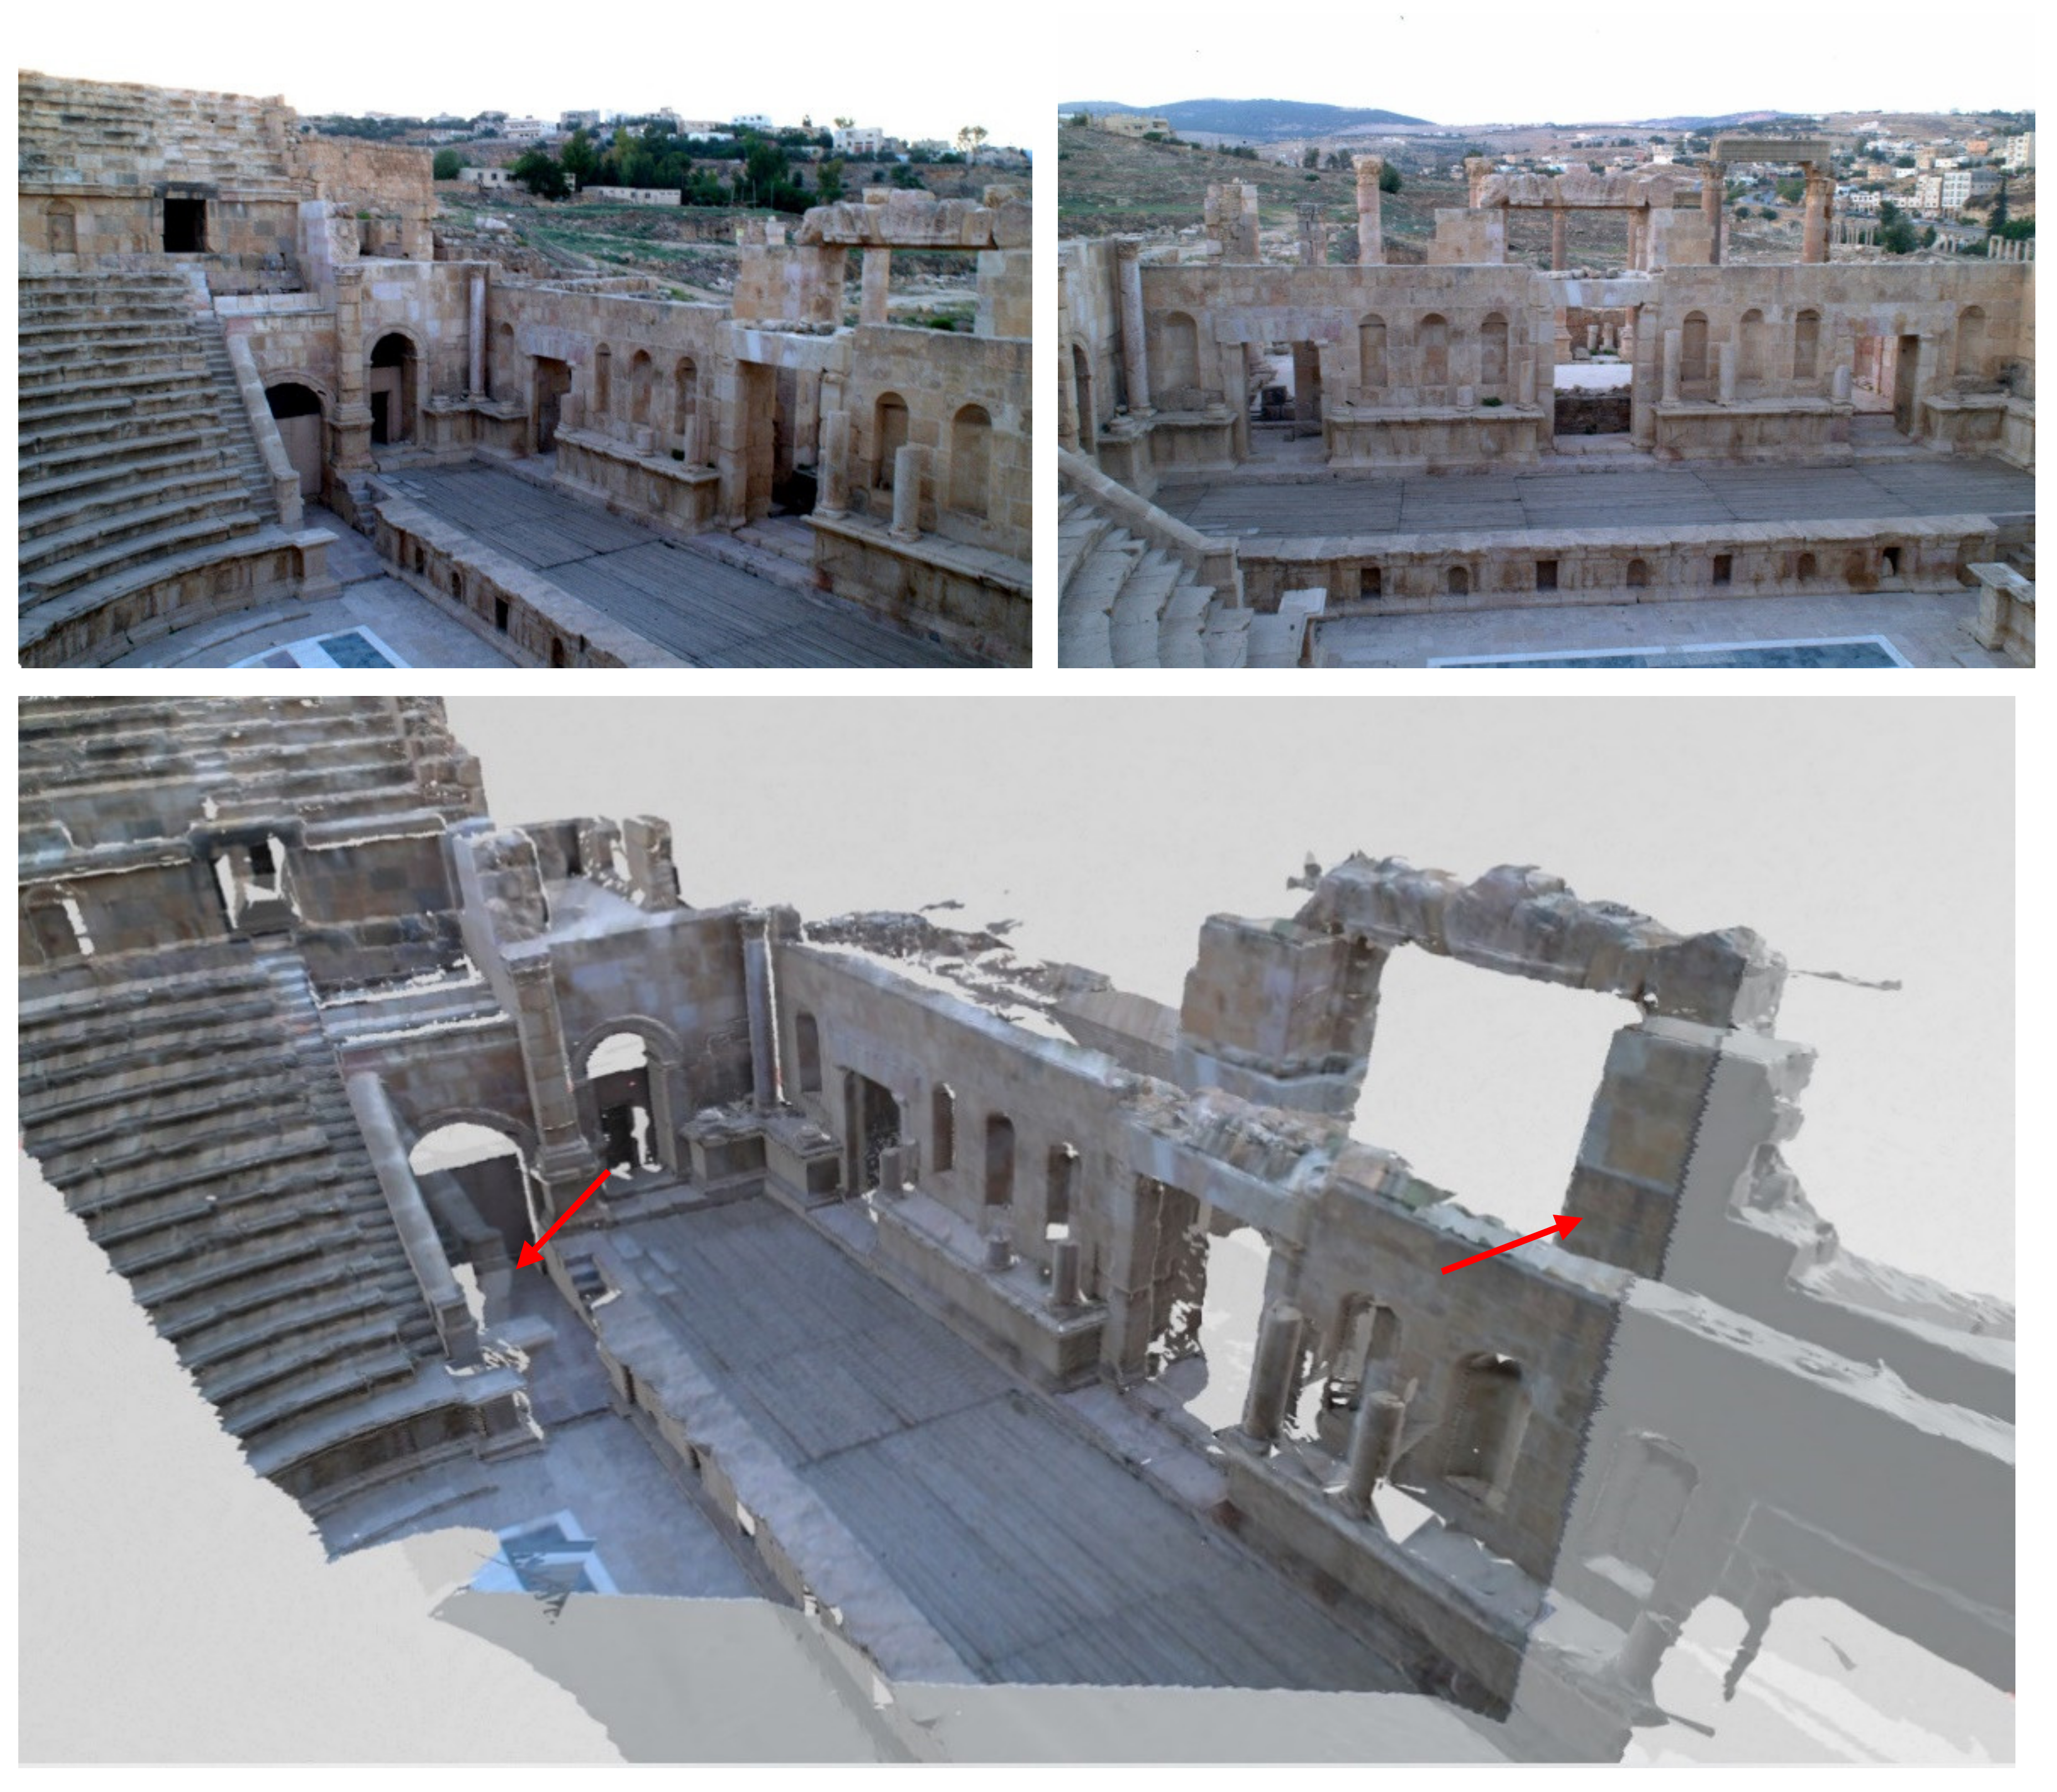
However, in many cases where there is a difference in optical images and TLS viewpoints, a significant editing phase is required to resolve occlusion-related problem. As the imagery is warped over the meshed model, each triangle vertex receives RGB from the color image; the texture pierces through the geometry and is mapped to all the occluded polygons along the projected ray path. Figure 11 illustrates this problem in which each polygon vertices from the selected image were allocated spectral information regardless of whether the vertex is visible in the imagery or not. In the figure, the red arrows indicate the double mapping problem, which fills the occluded areas.
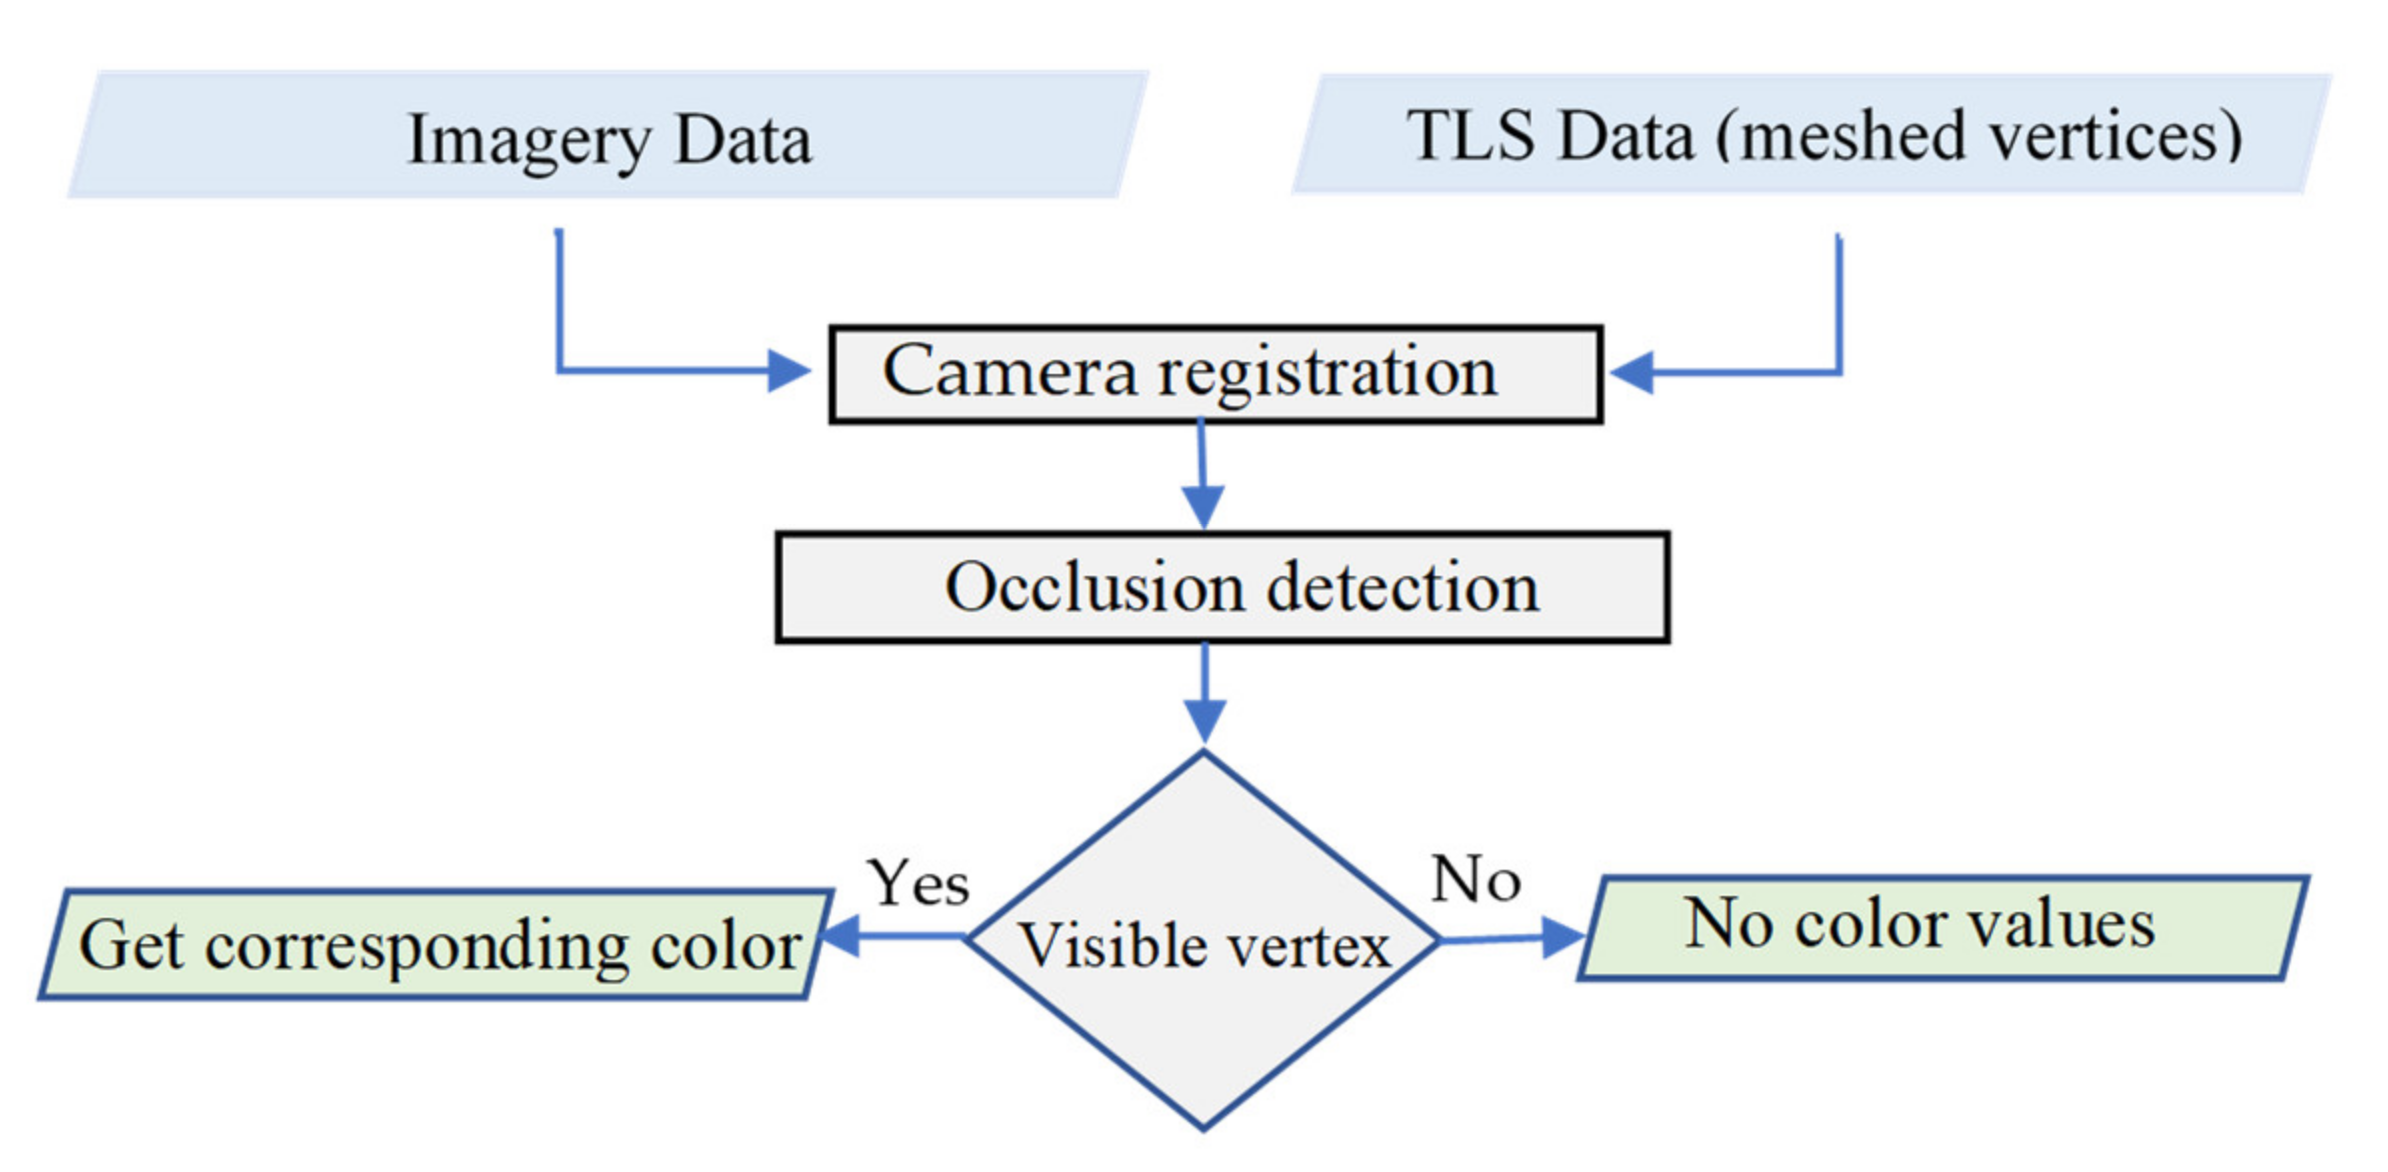
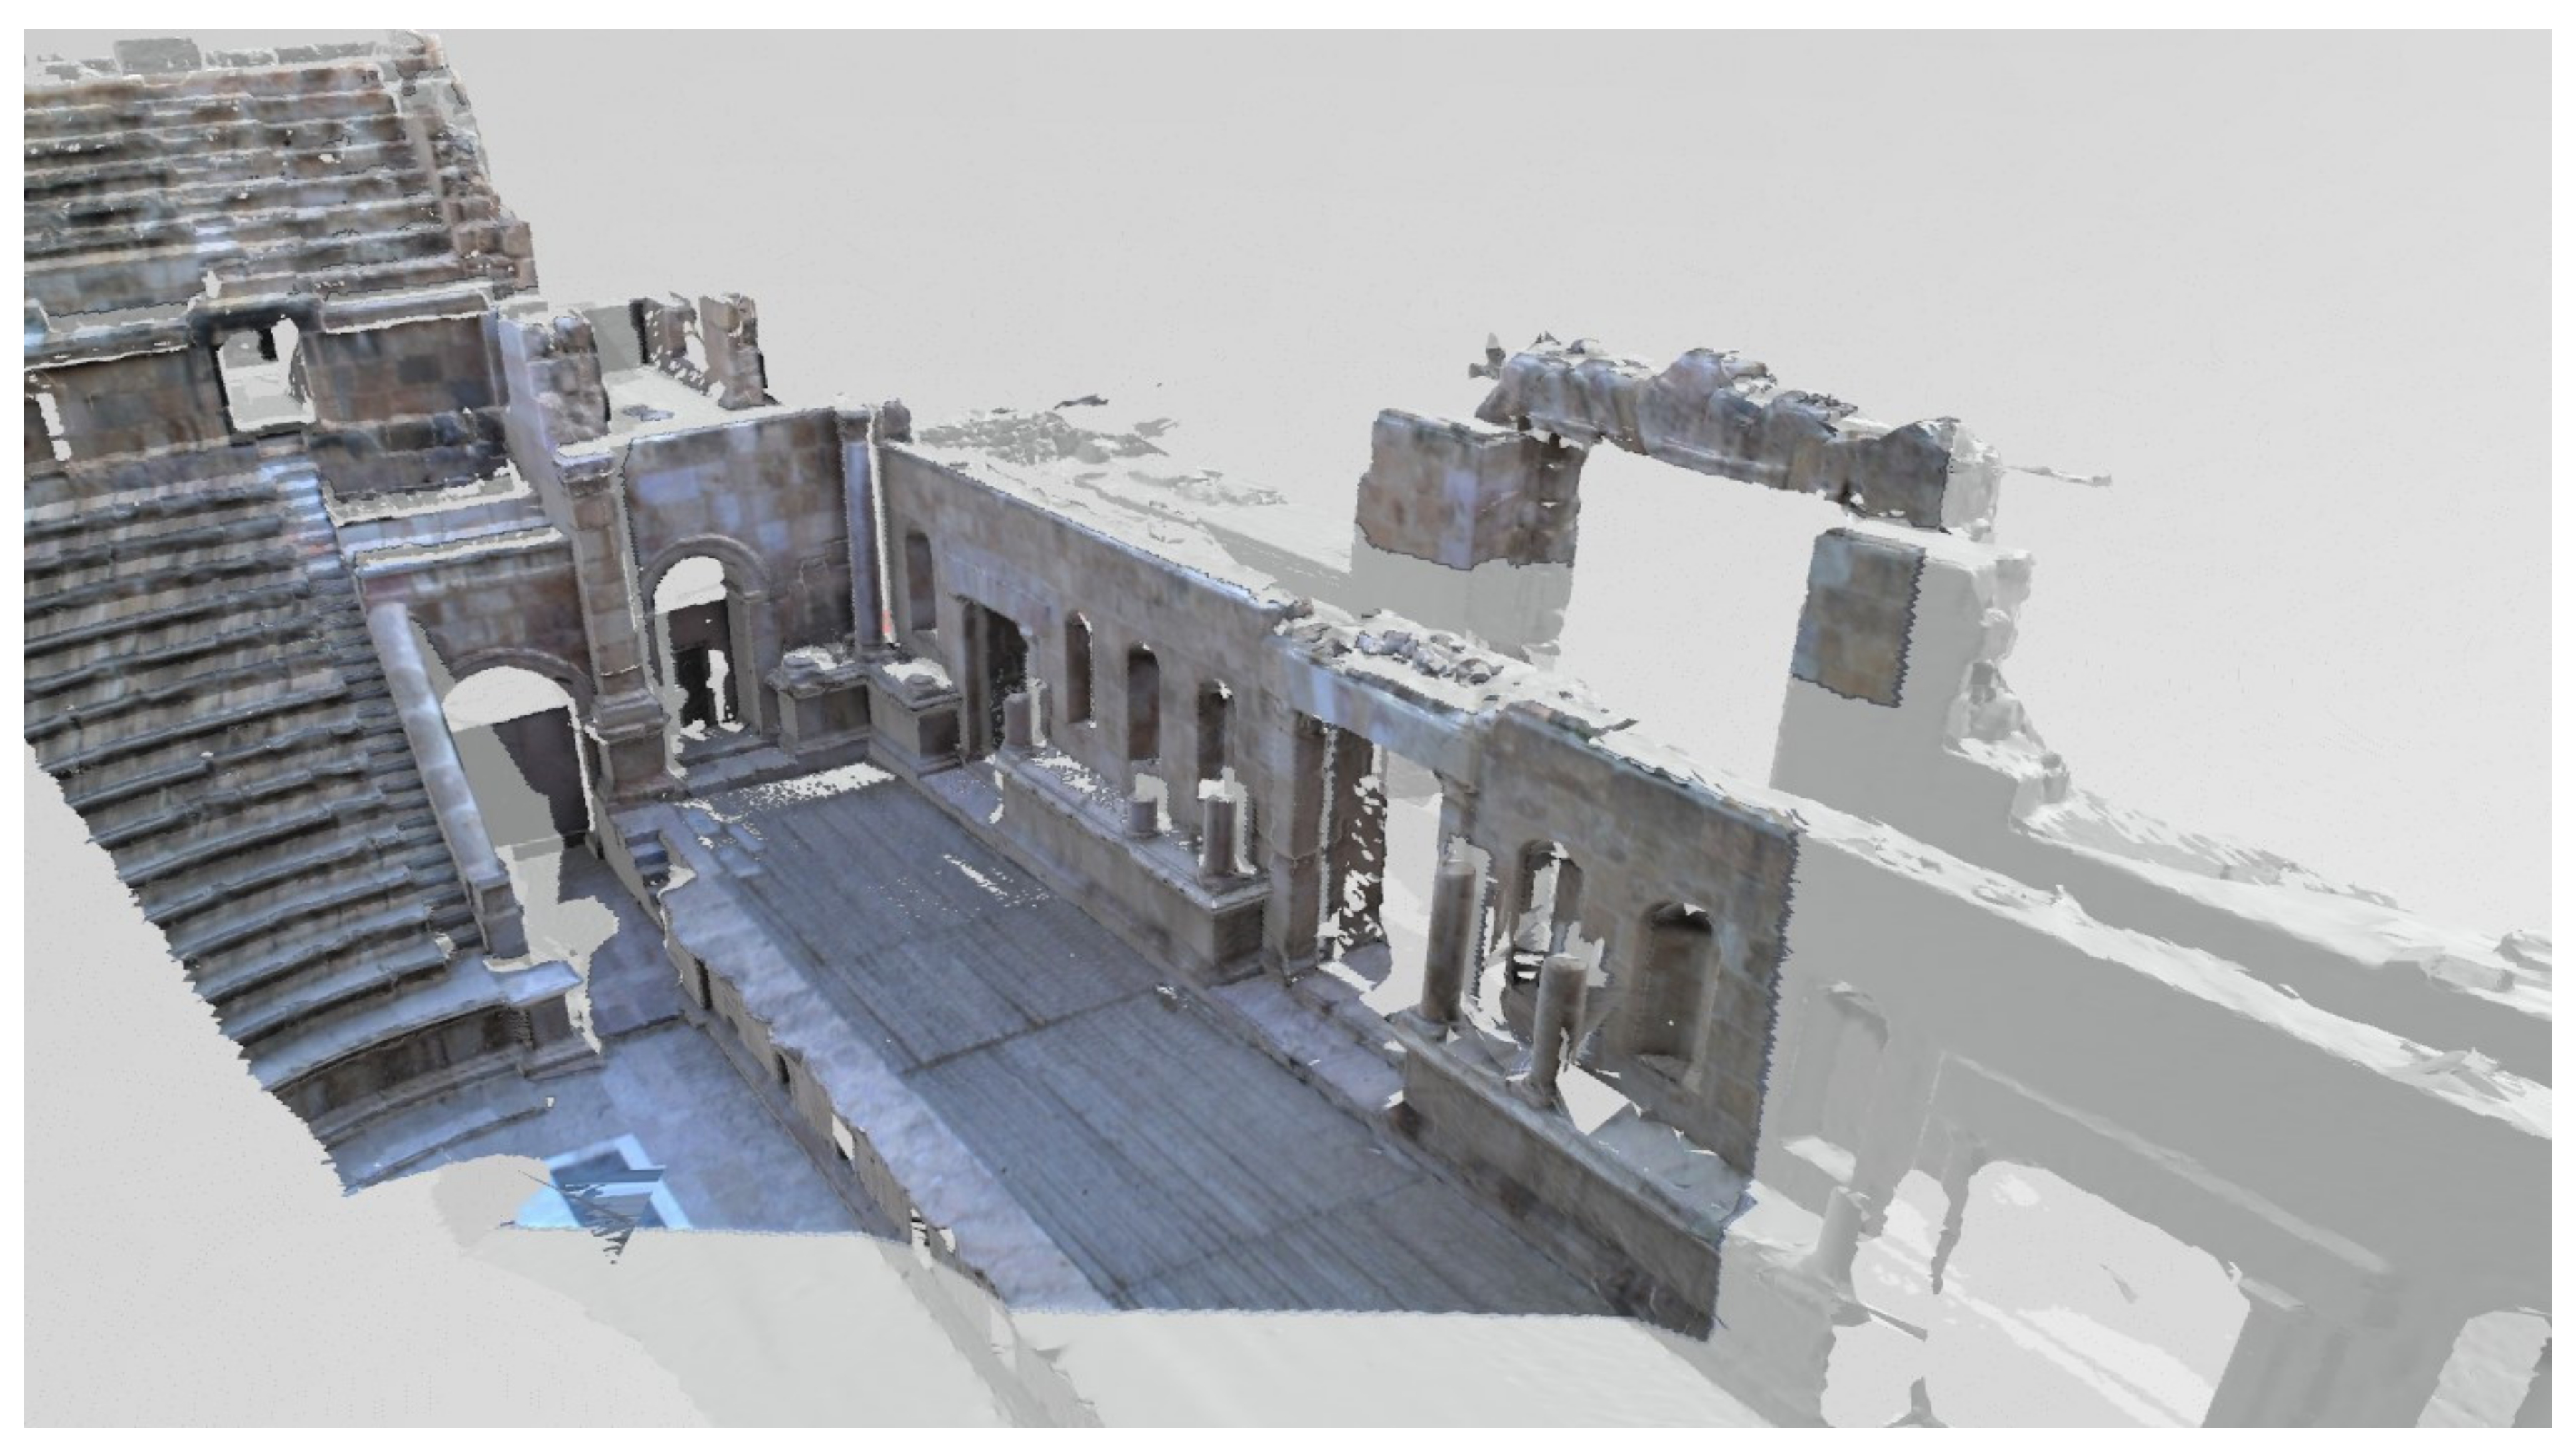
The proposed approach for texture mapping aimed particularly in filtering occluded areas effectively from the texture phase. The analysis of visibility is calculated using the algorithm mentioned in Section 4.2, the approach flowchart is depicted in Figure 12. The texture coordinates G(xi,yi) are computed only for the visible triangle vertices, then the color values are interpolated throughout the meshed model. Figure 13 shows that the occlusion effect was successfully removed, ensuring reliability and completeness of the reconstructed the texture model. The model textured data is stored in WRL file, a common text file format for 3D graphics, which allows interpolated of the texture within the triangle facets. The file contains data defining 3D information, such as vertices, polygon edges, image–mapped textures, mapping light, and transparency. Our texturing approach can be described briefly in the following steps:
| Algorithm 2 Texturing mapping of triangular mesh |
| Input: Triangular vertices as a text or WRL file and selected images of the scene |
| Output: Textured model in WRL format |
| 1. Considering triangles vertices coordinates (Xi, Yi, Zi). |
| 2. Calculate camera registration parameters. |
| 3. Filter the occlusion triangles vertices using the proposed visibility algorithm. |
| 4. Assign color coordinates G(xi, yi) for every visible vertex, the occluded vertices are allocated with no texture values. |
| 5. The data is stored in the WRL format where the color is interpolated through the mesh. |
5.2. Multi-Scalar Recording Method
TLS and imagery characteristics may complement each other during the recording of large heritage sites. Heritage sites are relatively large, open and complex. It is difficult to record the entire site solely with a terrestrial laser scan, as the occlusions may render the final point cloud incomplete [89]. TLS enables high-detailed environment recording reach several million 3D points, but data still does not have adequate resolution to create the surface features of the scanned object, such as cracks, finding features in point clouds was not easy [90]. In addition, this abundance of data can also be a drawback, because it creates huge files of point clouds. On the other hand, photographs usually have a better interpretation of surface linear features, image-based modeling and computer vision techniques are adequate to achieve high-resolution spatial data useful for modeling small–scale artifacts. The main challenges are the lack of scale information and the close spaced images required for an efficient matching process [33].
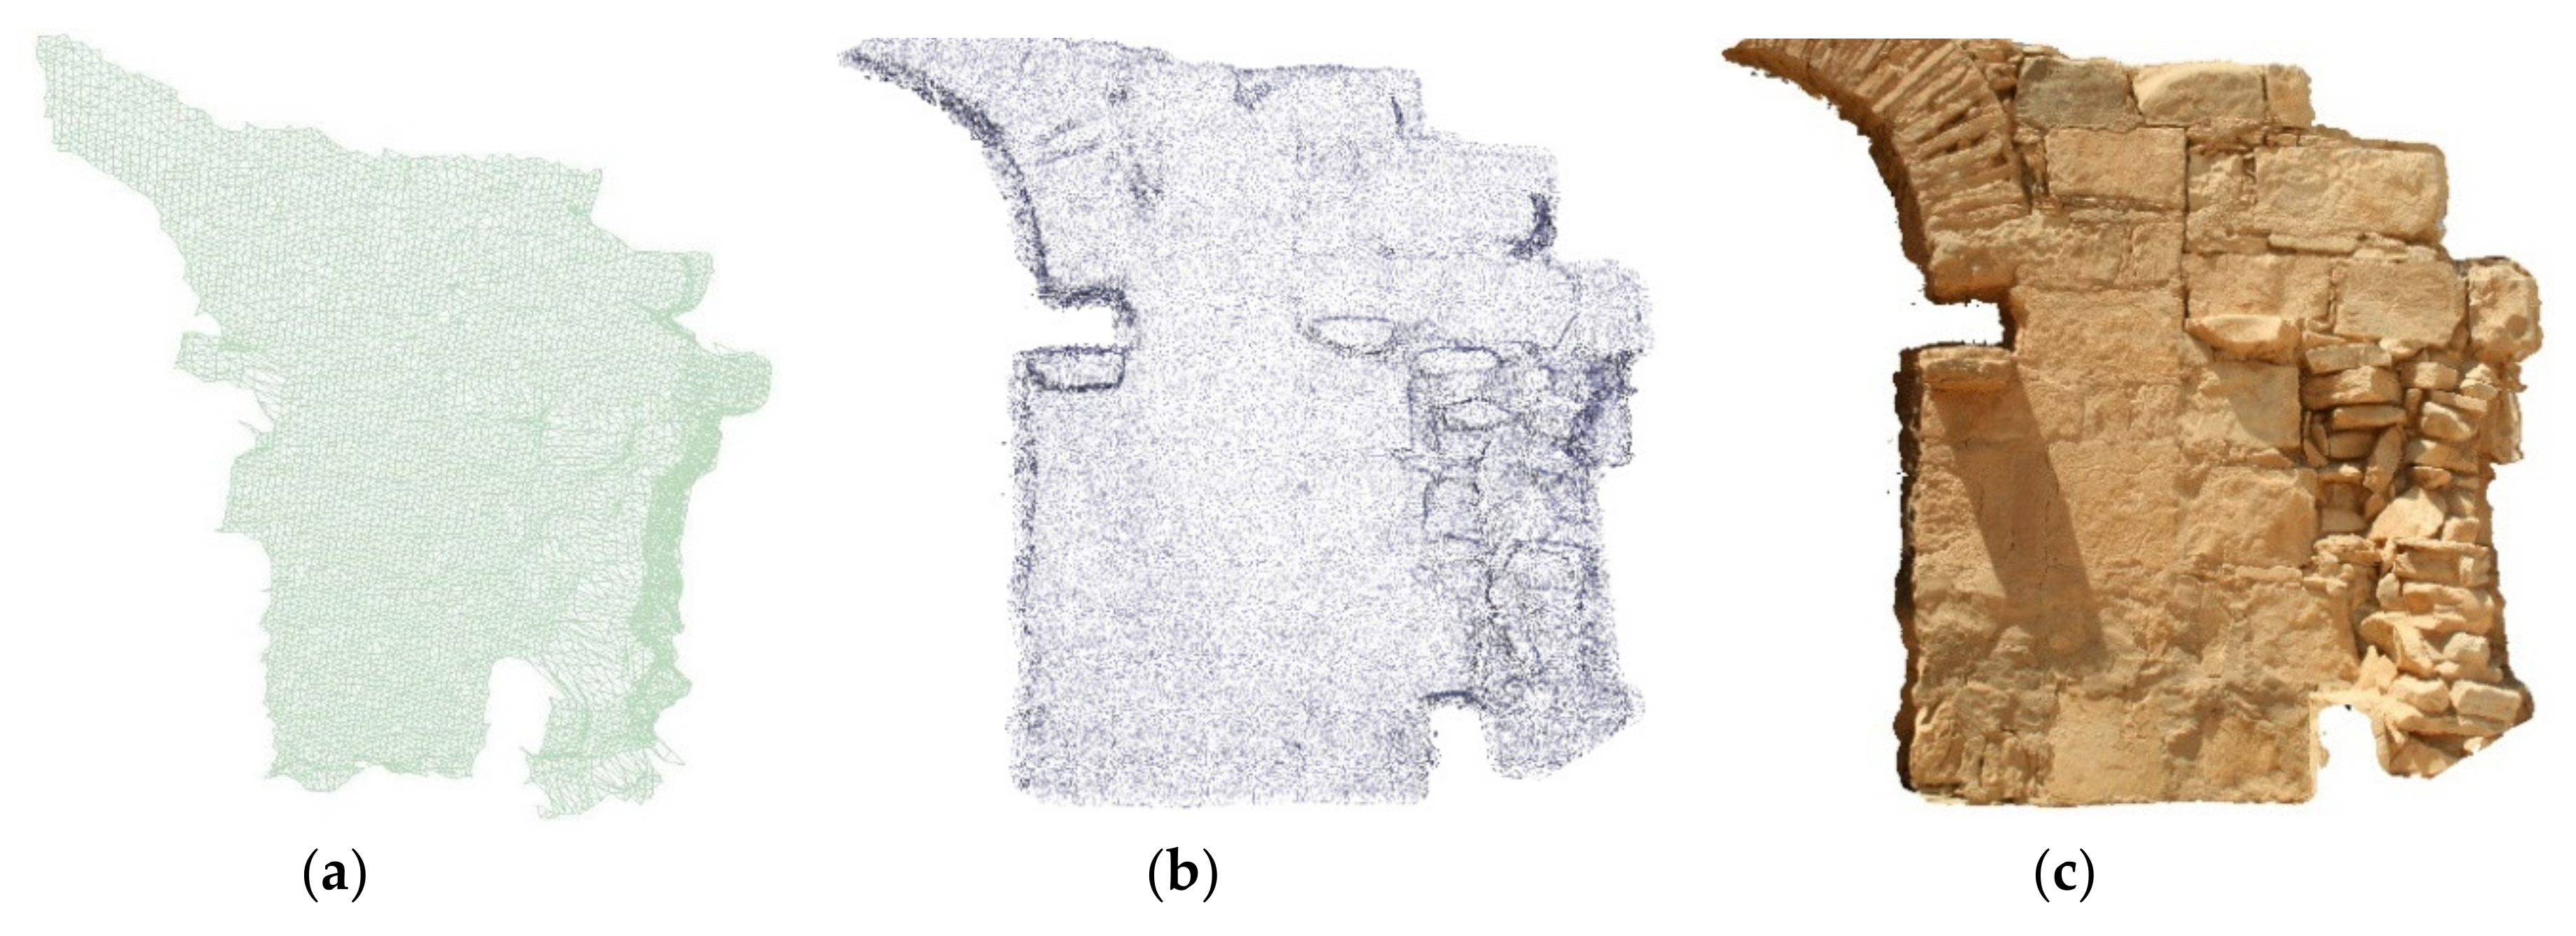
Digital multi–scalar recording means multiple sensors are used to cover each step of the structure scale. In our example depicted in Figure 14, the entire historic sites of Qusayr’Amra were captured using TLS. Additional closely spaced images are acquired for internal (occluded) walls and structures that are degraded and have cracks to be monitored, as shown in the red arrow in Figure 14. The camera gradually bypassing a circle around the structure so that the images overlapped more than 80 percent for effective model processing. Structure from motion algorithm (SfM) is used to provide external orientation parameters for each photograph. Using camera position and orientation parameters, automatic image matching is performed to generate pixel-wise 3D points. The output is a dense point cloud of around 50 million points. Geometric data is sufficient to model the fine geometric details of the surface structures, including the edges and facade cracks, as seen in Figure 15. Coordinates or dimensional measurements should also be carried out so that the resulting 3D model can be scaled and geo-referenced.
6. Photogrammetry Aided by Laser Scanning
The second level of integration is photogrammetry supported by TLS. The production of orthophotos is a typical example. The true ortho–projection of complex surfaces with rough curved surfaces are still an issue compared to traditional algorithms. The challenges relate to the surface descriptions, the Digital Model Surface DSM, and the hidden areas. As all available commercial algorithms are tailored to aerial applications, DSM generation using image processing is a well–known method. However, it is difficult for complex architecture. The dense DSM produced by the TLS system can therefore be considered an ideal option for a 3D surface description of large–scale monuments. Even with a detailed DSM, typical orthorectification algorithm doesn’t produce the desired result, being unable to handle visibility of the image and occlusions of the model.
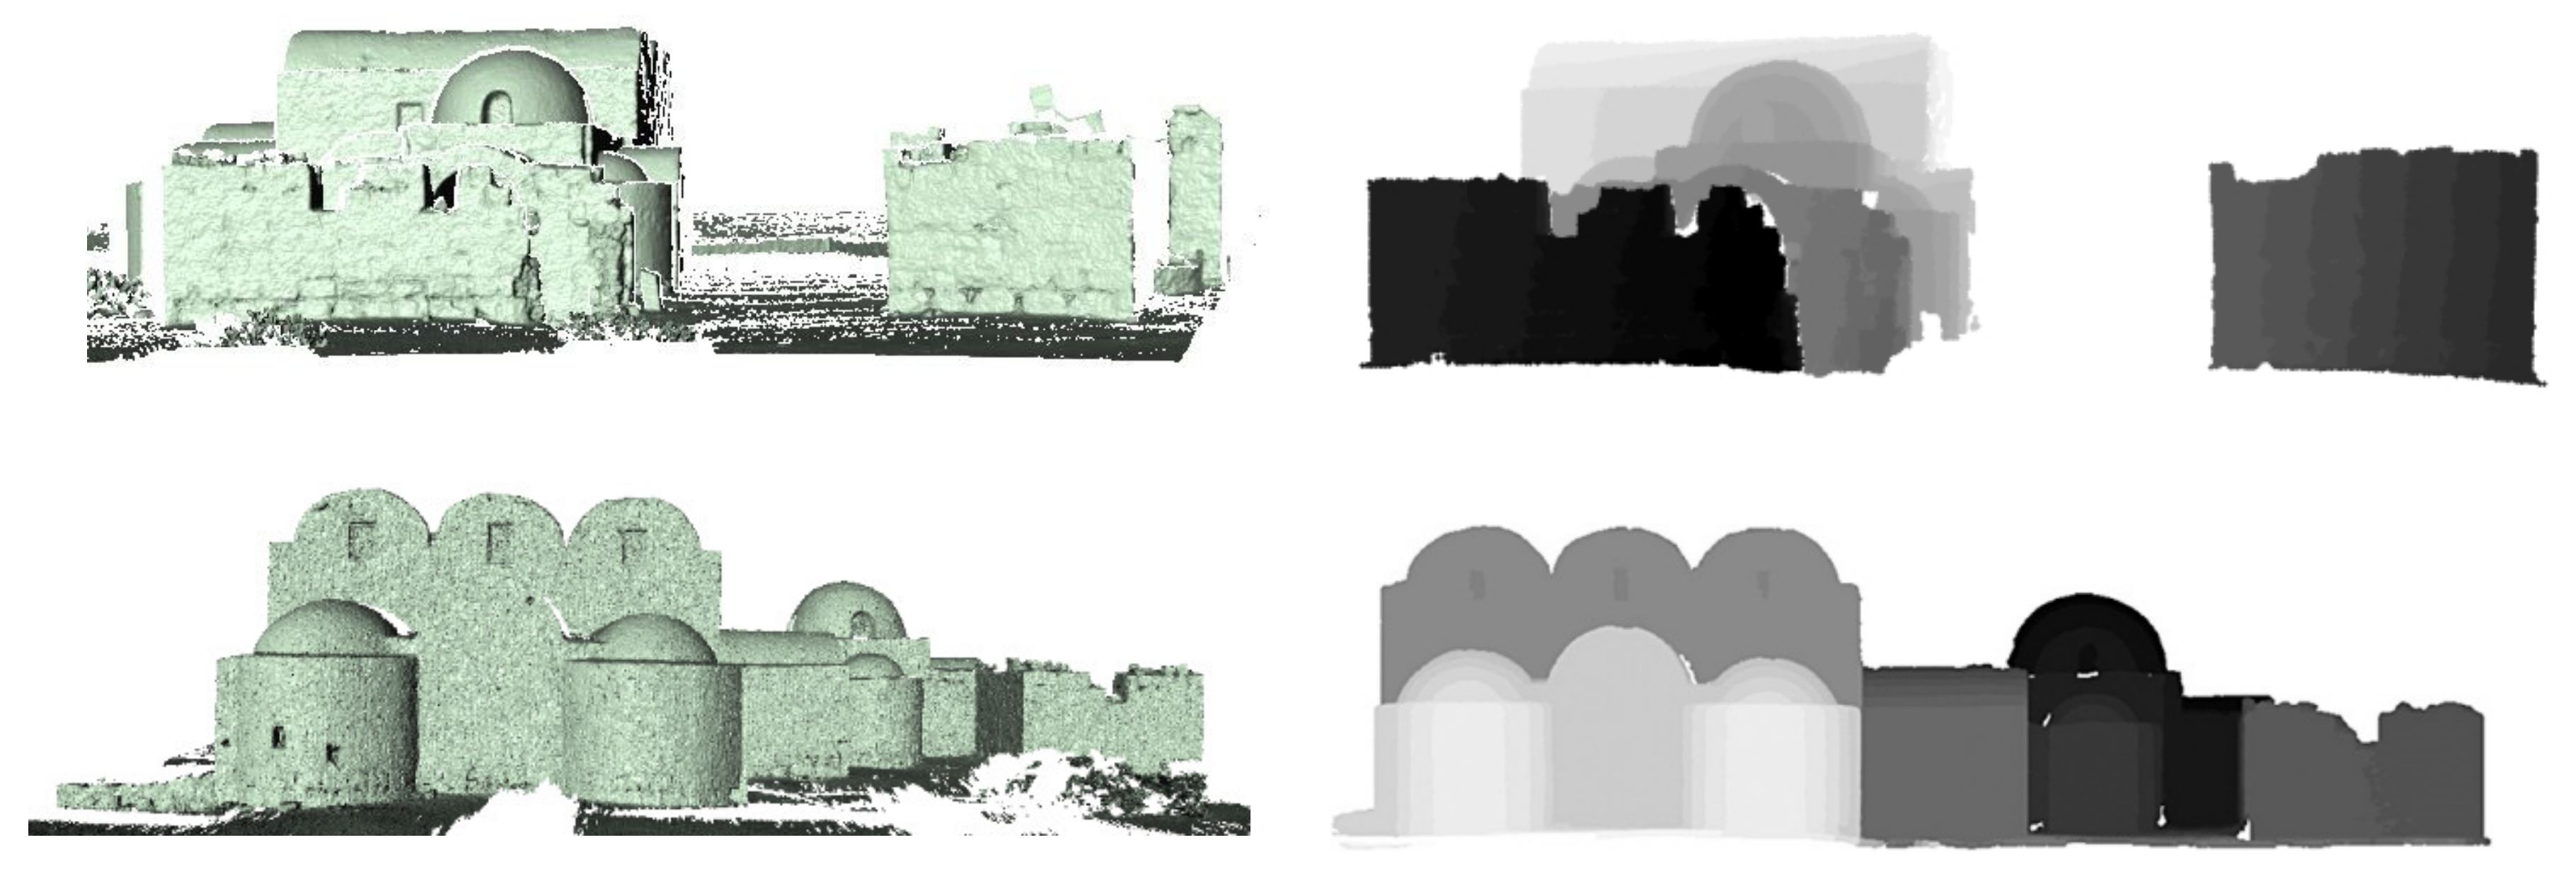
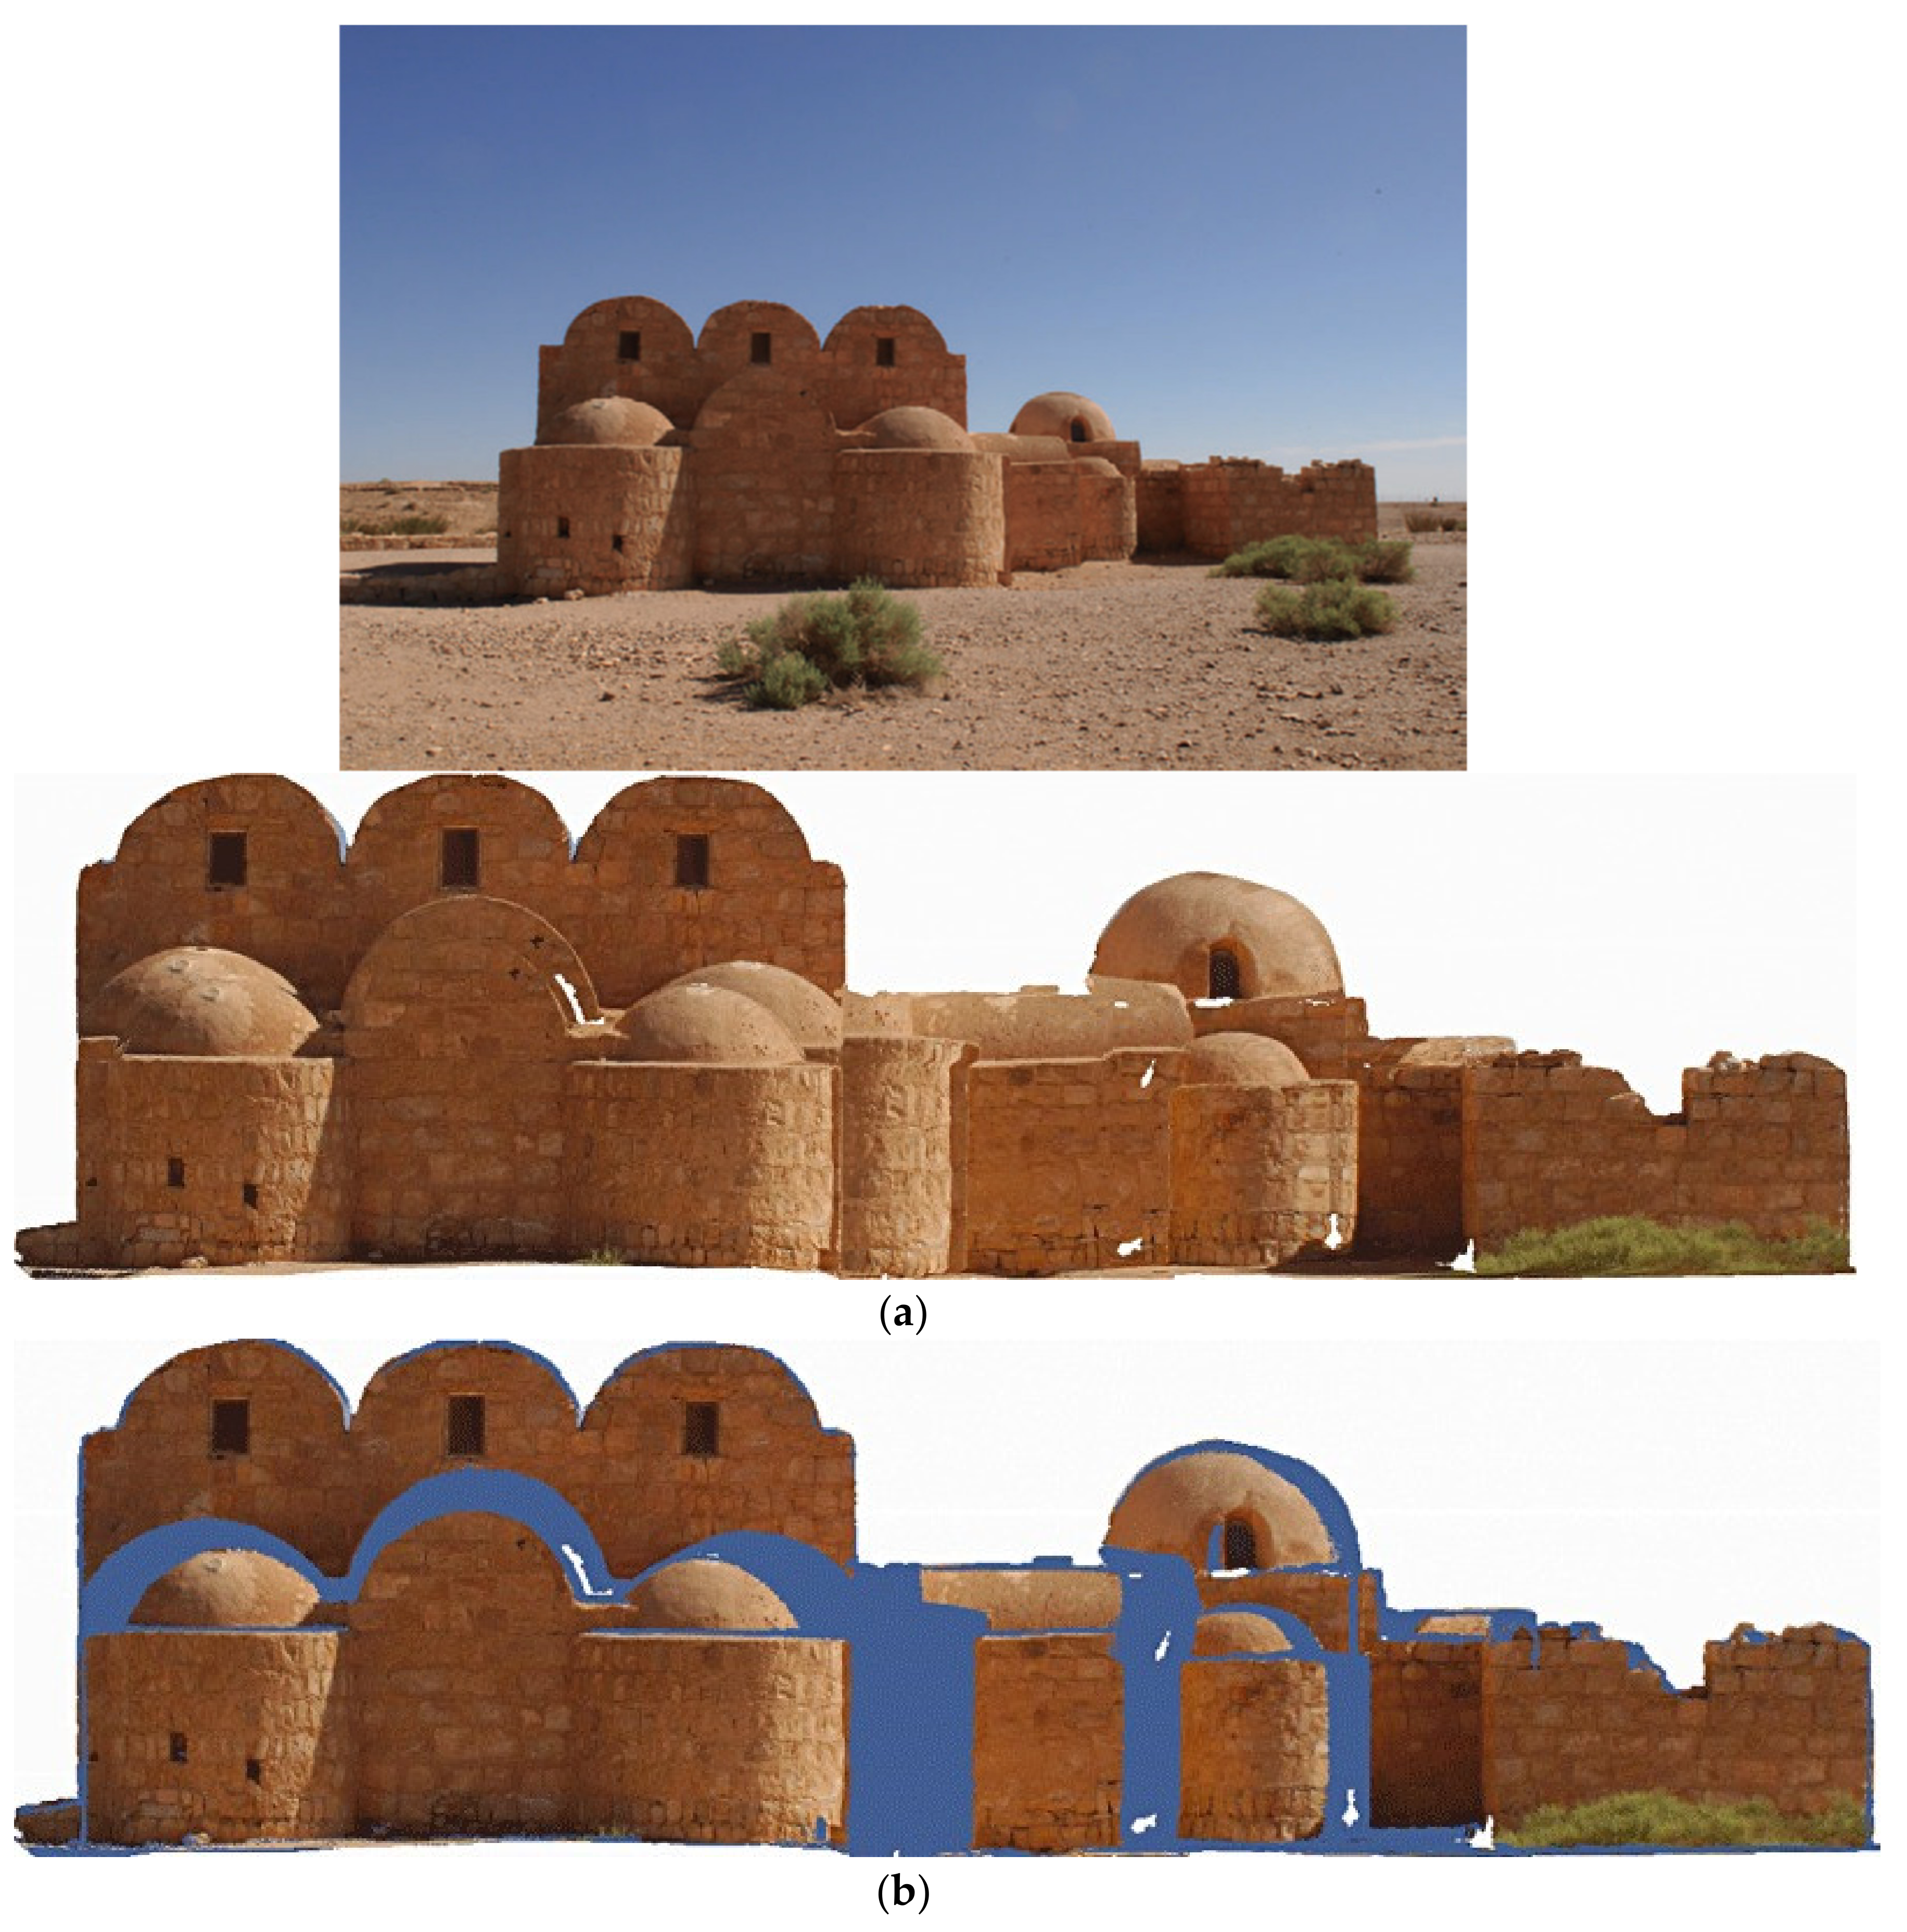
Our approach highlights the contribution of laser scanning in large–scale orthophotography production using the principle outlined in Figure 16 and the flowchart in Figure 17. The input is the DSM acquired using the TLS, and the selected images needed to be rectified. The image and the TLS position information are linked through the registration process mentioned in Section 4.1. The regular DSM grid is first created by sampling TLS point cloud as shown in Figure 18. The pixel depth value is determined using neighbor’s nearest re-sampling techniques. Another grid is generated with the same dimension and pixel size to store spectral orthophoto information. Then all the DSM cells are projected on the respective imagery by the collinearity equations (Equations (1) and (2)). The relevant spectral information is mapped to the cell and to the corresponding pixel in the orthophoto. Previous approach for orthophotography is commonly known as differential rectification, which can provide reliable results for only nearly flat surfaces. Figure 19 shows the orthophotography of Qusayr ’Amra inner wall, the smooth areas of the wall were mapped to the correct location, as the corresponding region is almost flat without complicated occludes, whereas some artifacts occur in the irregular portion of the wall.
This technique main drawback occurs when applied to complex structures. In such cases, the rectified image suffers from occlusion and double mapping problems, e.g., both DSM cells (B, D) in Figure 16 compete for the same imagery pixel (b). Figure 20a depicts the double–mapping effect on orthophoto generated for Amra façade using the differential rectification technique. Therefore, our visibility technique is used to detect occlusion area by tracking of the DSM cells which are projected at the same imagery pixel. On the indexed visibility map the position of cell B is indicated as a visible, the second cell, D, is defined as an occluded cell. When drawing true–orthophoto, the pixels of DSM grid which belong to the visible cells are used, whereas invalid pixels belonging to the shadow polygons are detected and labeled without any texture value. Figure 20b shows true orthophotos for the Qusayr ‘Amra façade. In this figure, the surfaces appear in their correct planimetric positions, there are no double-mapped areas.
In brief, the following steps will define our True–orthophoto algorithm:
| Algorithm 3 Laser based True-orthophoto |
| Input: Triangular vertices as text file and selected images of the scene |
| Output: True–orthophoto in JPG format |
| 1. Considering triangles vertices coordinates (Xi, Yi, Zi). |
| 2. Calculate camera registration parameters. |
| 3. Produce the regular DSM grid from model vertices over the mapped area with (Xi, Yi). |
| 4. Interpolate the depth values (Zi) in the DSM. |
| 5. Re–project the grid cell with its (Xi, Yi, Zi) into the image using the camera model. |
| 6. Filter the occlusion cells using the proposed visibility algorithm. |
| 7. For visible cell, set the grey value G (x, y) at the pixel (Xi, Yi) in the orthophoto. |
| 8. For occluded vertices, set fixed grey value G (0, 0), e.g., blue color in our example, at the pixel (Xi, Yi) in the orthophoto. |
| 9. The output is stored in JPG format |
7. Discussion
As mentioned in Section 2, significant efforts were made within the research community to establish methods to automate the process of image and TLS data fusing. Methods are proposed primarily to enhance the reconstruction of texture and to handle true orthophoto output. All commercial algorithms and software packages available are tailored to aerial images (e.g., Trimble’s Inpho), the common ortho–projection software can handle only flat surfaces defined as DTM. Likewise, the software available for representation architectures and heritage surfaces (e.g., Faro’s PhoToPlan) is only useful for relatively flat or predefined regular shapes, such as unwrapped cylinder objects [41,59]. Compared to the existing methods, this paper proposed advanced texture mapping and true orthophoto techniques of complex heritage structures. Product quality depends heavily on the efficiency of the proposed visibility analysis algorithm. Two datasets are used to prove the validity of our methods, the first is the Northern theater of the ancient city of Jerash (Gerasea) and the second is Qusayr ‘Amra. After describing the methods proposed and evaluating the outcomes of the experiments, it is important to outline their contribution compared to other state–of–the–art approaches.
- The results showed in Figure 13 and Figure 20b presented a high degree of completeness and correctness of occlusion detection, this highlights the fact that our suggested algorithm has considerable advantages in dealing with complex scenes and massive triangular facets. The visibility analysis does not need a priori knowledge of the occluding surfaces, i.e., information on the connectivity of the triangles, and the mesh holes do not affect the performance.
- Abovementioned methods, Z-buffer and ray tracing, show drawback and low performance on complex surfaces [56]. They have a high cost of computation incurred in pixel-by-pixel neighborhood searching, which further needs iteration processing to address intersection points between the rays and the DSM. In comparison, the proposed approach identifies the occluded region without iterative computation, relying on a patch scan. In the other hand, the new technique is able to detect occluded areas with great precision and more competitive computing time.
- Some other methods used 2D voxelization visibility approach in texture mapping process in order to reduce computing time [63,67]. The image plane is subdivided into 2D grid voxels, and each 2D voxel is given a list of triangles. The proposed method is different, the size and boundaries of the search are computed on the basis of a patch that is guided by the model resolution, which typically has lower resolution than the image.
- In the methods developed in this paper, the occlusion detection algorithm is integrated and performed as a part of texture mapping and true orthophoto algorithms. In other words, spectral mapping can also be done in a flexible manner without handling the visibility problems for some occasions; true orthophoto algorithm is performed as differential rectification in the flattening surface as depicted in Figure 19 and texture mapping algorithm in the occasion that the camera has the same model view as depicted in Figure 10.
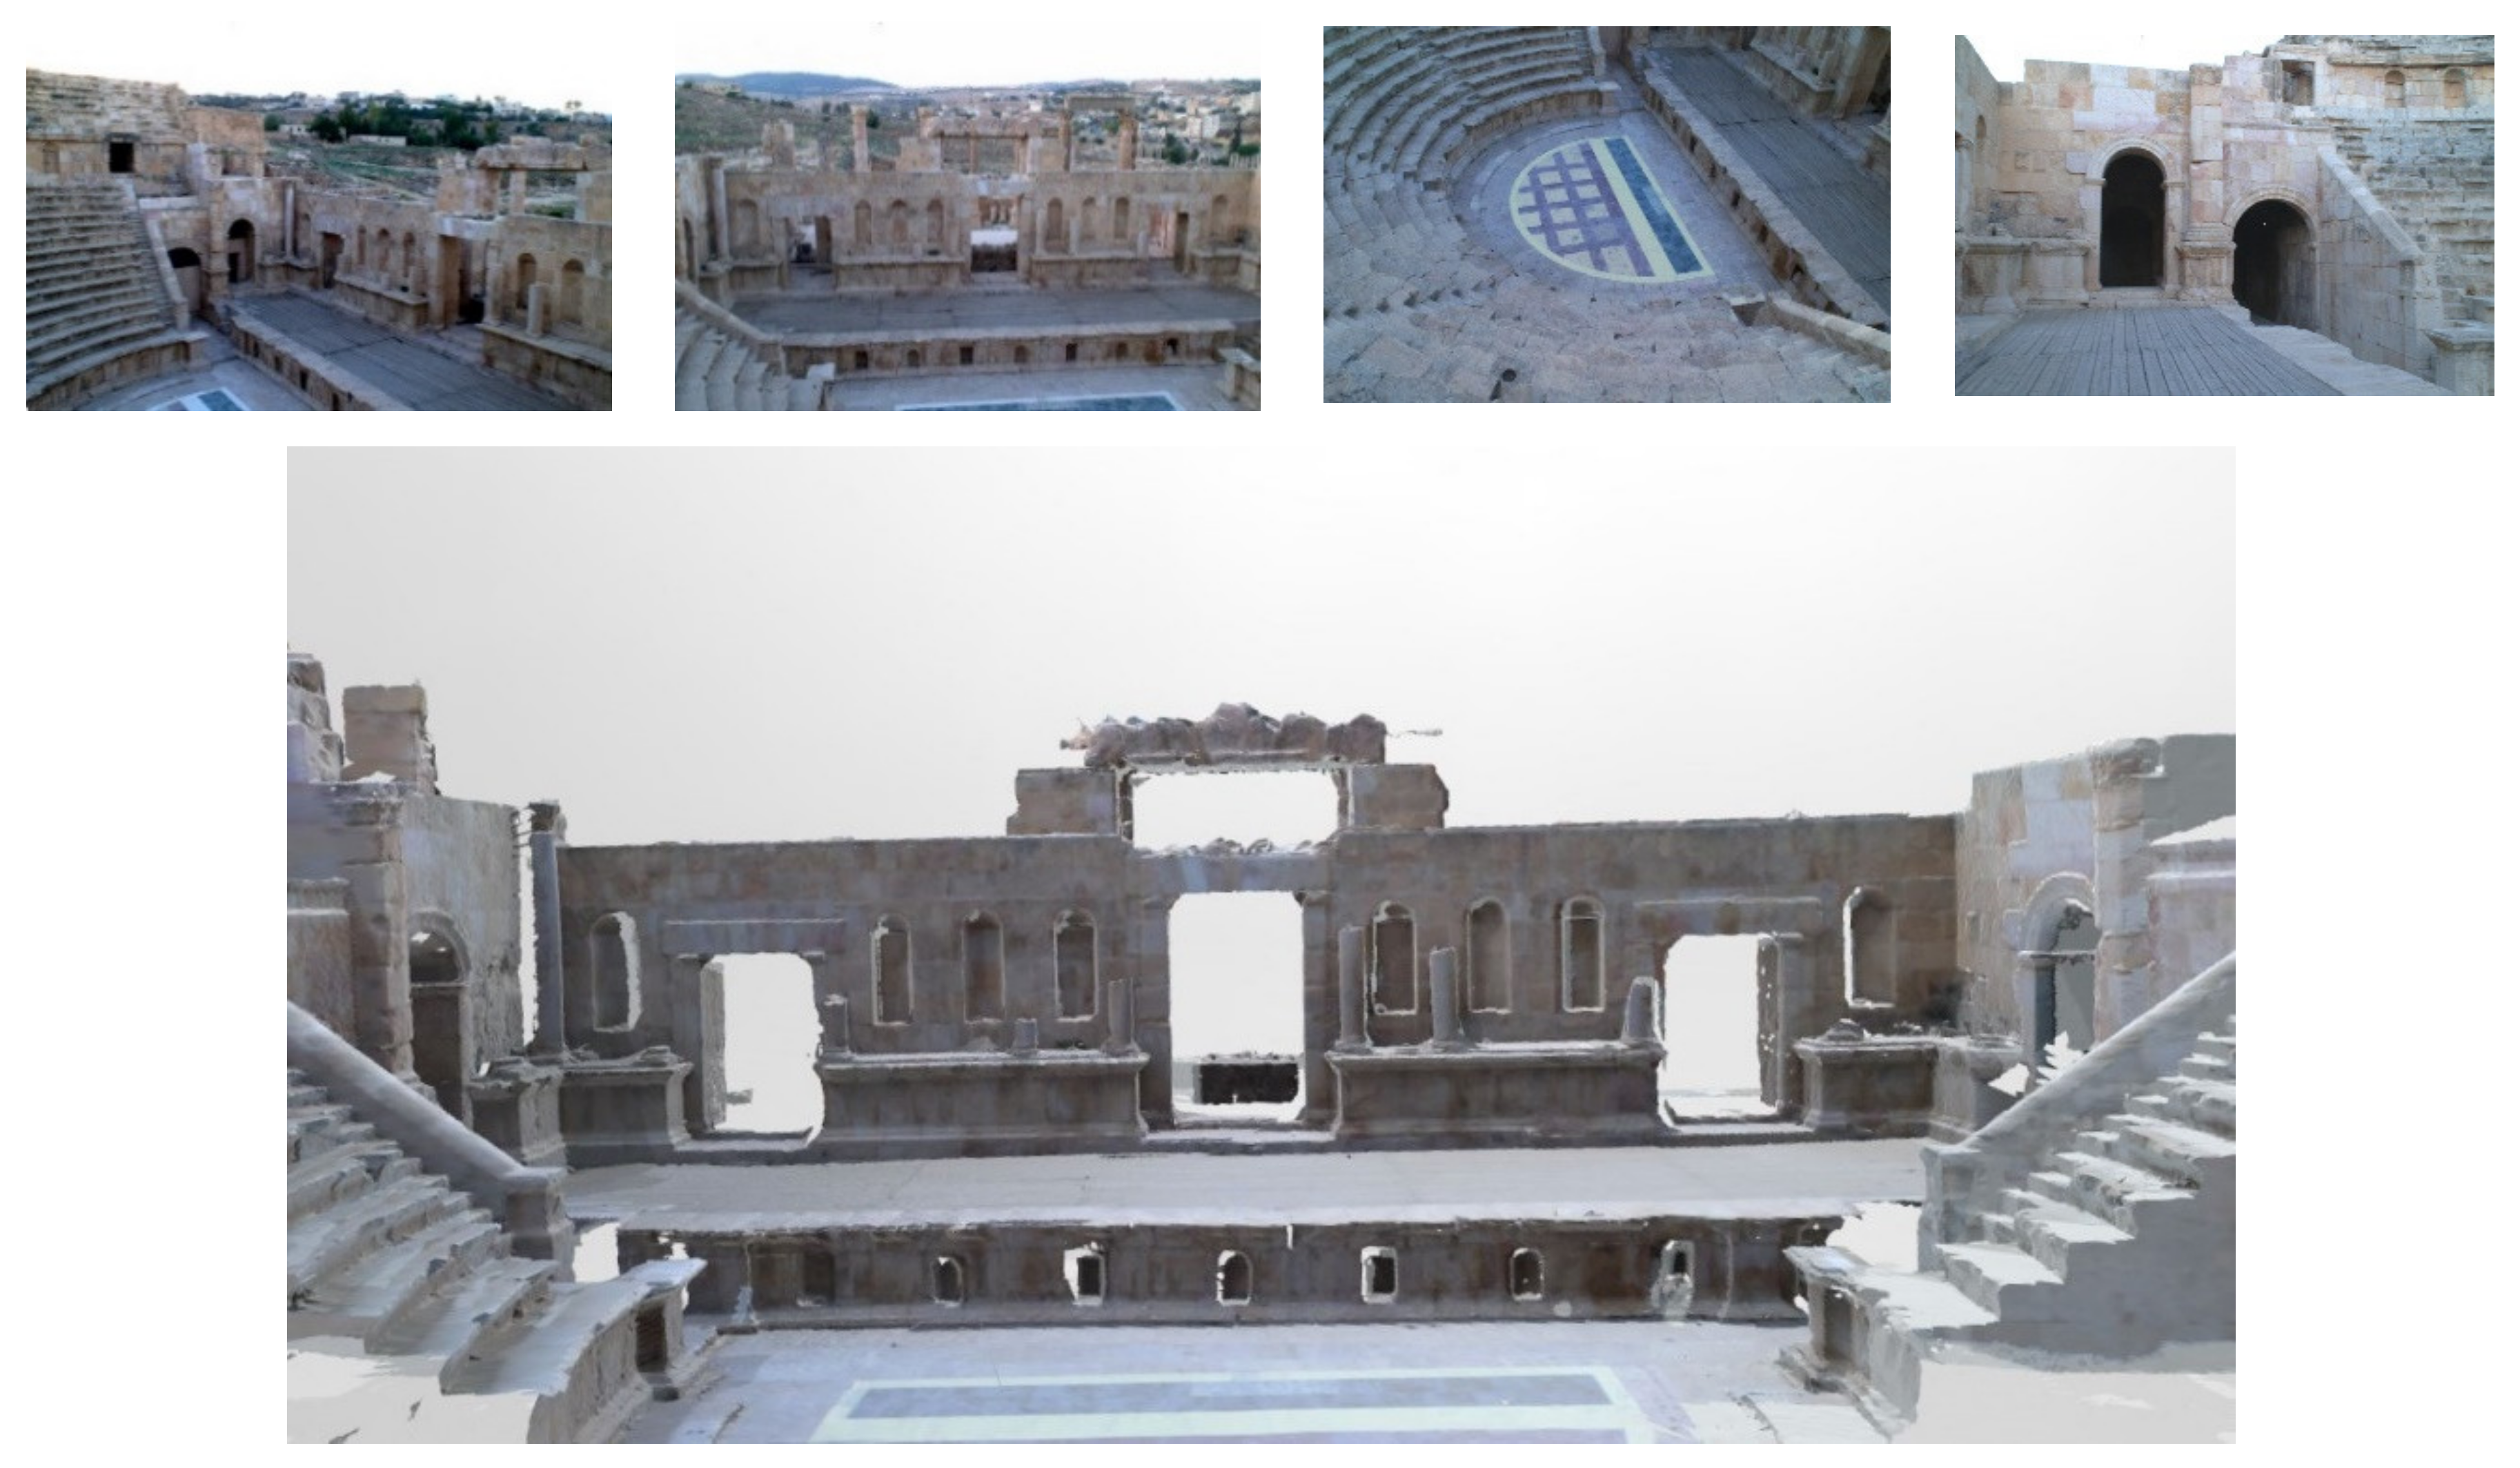
In practice, the identified occluded triangle may be mapped onto other acquired images to improve the results of texture mapping. Therefore, the other appropriate images could be selected in addition to the master image, image depicting most parts of an object, to texture the entire scene. For each selected image, the occluded triangles will be investigated till the scene is textured using the available images. Figure 21 shows the texture mapping of the Northern theatre stage textured from four different images.
Selecting the appropriate patch size is important in our approach. Large 2D patches result in increased processing time, as more vertices for each grid patch have to be inspected, while small patches can lead to false occlusion results. In practice, patch sizes twice the length of the projected triangle lead to good results.
8. Conclusions
Imaging and TLS sensors have distinct properties that make them superior in certain applications. Fusing their data can produce better performance than can be obtained with a single data source type. The article describes the data fusion in texture mapping and site modeling in terms of completeness. Orthophoto is also an efficient method of fusing imagery and TLS data, the valuable product is important for structure interpretation and monitoring. In the methods developed, a proposed visibility algorithm is integrated and performed as a part of texture mapping and true orthophoto algorithms. The proposed algorithm filtering out the occluded areas based on patch processing unit using square grid set around the projected vertices. Massive data were collected from complex heritage sites to show the capabilities of the proposed approaches. The visibility algorithm presents a high degree of completeness and correctness of occlusion detection, and as a result, the approaches indicate high quality products. The algorithm has a significant advantage in dealing with complex scenes and massive triangular facets, as well as the visibility analysis that does not require a priori knowledge of the occluding surfaces. In the texture mapping and true orthophoto generation pipeline, the proposed algorithm can easily be implemented to perform occlusion detection and color mapping simultaneously. Future research may also focus on developing a visible images priority algorithm to select the high-priority texture for each triangle facet. The methods would then choose the most suitable spectral information to reconstruct the texture mapping and true orthophotos of the scene using multiple images.
Funding
This research received no external funding
Conflicts of Interest
The authors declare no conflict of interest.
References
- Porras-Amores, C.; Mazarrón, F.R.; Cañas, I.; Villoria Sáez, P. Terrestial Laser Scanning Digitalization in Underground Constructions. J. Cult. Herit. 2019, 38, 213–220. [Google Scholar] [CrossRef]
- Aicardi, I.; Chiabrando, F.; Maria Lingua, A.; Noardo, F. Recent Trends in Cultural Heritage 3D Survey: The Photogrammetric Computer Vision Approach. J. Cult. Herit. 2018, 32, 257–266. [Google Scholar] [CrossRef]
- Hoon, Y.J.; Hong, S. Three–Dimensional Digital Documentation of Cultural Heritage Site Based on the Convergence of Terrestrial Laser Scanning and Unmanned Aerial Vehicle Photogrammetry. ISPRS Int. J. Geo–Inf. 2019, 8, 53. [Google Scholar] [CrossRef] [Green Version]
- Urech, P.R.W.; Dissegna, M.A.; Girot, C.; Grêt–Regamey, A. Point Cloud Modeling as a Bridge between Landscape Design and Planning. Landsc. Urban Plan. 2020. [Google Scholar] [CrossRef]
- Balado, J.; Díaz–Vilariño, L.; Arias, P.; González–Jorge, H. Automatic Classification of Urban Ground Elements from Mobile Laser Scanning Data. Autom. Constr. 2018, 86, 226–239. [Google Scholar] [CrossRef] [Green Version]
- Šašak, J.; Gallay, M.; Kaňuk, J.; Hofierka, J.; Minár, J. Combined Use of Terrestrial Laser Scanning and UAV Photogrammetry in Mapping Alpine Terrain. Remote Sens. 2019, 11, 2154. [Google Scholar] [CrossRef] [Green Version]
- Risbøl, O.; Gustavsen, L. LiDAR from Drones Employed for Mapping Archaeology–Potential, Benefits and Challenges. Archaeol. Prospect. 2018, 25, 329–338. [Google Scholar] [CrossRef]
- Murphy, M.; Mcgovern, E.; Pavia, S. Historic Building Information Modelling (HBIM). Struct. Surv. 2009, 27, 311–327. [Google Scholar] [CrossRef] [Green Version]
- Banfi, F. HBIM, 3D Drawing and Virtual Reality for Archaeological Sites and Ancient Ruins. Virtual Archaeol. Rev. 2020, 11, 16–33. [Google Scholar] [CrossRef]
- Roca, D.; Armesto, J.; Lagüela, S.; Díaz–Vilariño, L. LIDAR–Equipped UAV for Building Information Modelling. Int. Arch. Photogramm. Remote Sens. Spat. Inf. Sci. ISPRS Arch. 2014, 40, 523–527. [Google Scholar] [CrossRef] [Green Version]
- Abellán, A.; Calvet, J.; Vilaplana, J.M.; Blanchard, J. Detection and Spatial Prediction of Rockfalls by Means of Terrestrial Laser Scanner Monitoring. Geomorphology 2010, 119, 162–171. [Google Scholar] [CrossRef]
- Fortunato, G.; Funari, M.F.; Lonetti, P. Survey and Seismic Vulnerability Assessment of the Baptistery of San Giovanni in Tumba (Italy). J. Cult. Herit. 2017, 26, 64–78. [Google Scholar] [CrossRef]
- Balletti, C.; Ballarin, M.; Faccio, P.; Guerra, F.; Saetta, A.; Vernier, P. 3D Survey and 3D Modelling for Seismic Vulnerability Assessment of Historical Masonry Buildings. Appl. Geomat. 2018, 10, 473–484. [Google Scholar] [CrossRef]
- Barrile, V.; Fotia, A.; Bilotta, G. Geomatics and Augmented Reality Experiments for the Cultural Heritage. Appl. Geomat. 2018, 10, 569–578. [Google Scholar] [CrossRef]
- Gines, J.L.C.; Cervera, C.B. Toward Hybrid Modeling and Automatic Planimetry for Graphic Documentation of the Archaeological Heritage: The Cortina Family Pantheon in the Cemetery of Valencia. Int. J. Archit. Herit. 2019, 14, 1210–1220. [Google Scholar] [CrossRef]
- Dostal, C.; Yamafune, K. Photogrammetric Texture Mapping: A Method for Increasing the Fidelity of 3D Models of Cultural Heritage Materials. J. Archaeol. Sci. Rep. 2018, 18, 430–436. [Google Scholar] [CrossRef]
- Murtiyoso, A.; Grussenmeyer, P.; Suwardhi, D.; Awalludin, R. Multi–Scale and Multi–Sensor 3D Documentation of Heritage Complexes in Urban Areas. ISPRS Int. J. Geo–Inf. 2018, 7. [Google Scholar] [CrossRef] [Green Version]
- Sapirstein, P. Accurate Measurement with Photogrammetry at Large Sites. J. Archaeol. Sci. 2016, 66, 137–145. [Google Scholar] [CrossRef]
- Forlani, G.; Dall’Asta, E.; Diotri, F.; di Cella, U.M.; Roncella, R.; Santise, M. Quality Assessment of DSMs Produced from UAV Flights Georeferenced with On–Board RTK Positioning. Remote Sens. 2018, 10, 311. [Google Scholar] [CrossRef] [Green Version]
- Agüera–Vega, F.; Carvajal–Ramírez, F.; Martínez–Carricondo, P.; Sánchez–Hermosilla López, J.; Mesas–Carrascosa, F.J.; García–Ferrer, A.; Pérez–Porras, F.J. Reconstruction of Extreme Topography from UAV Structure from Motion Photogrammetry. Measurement 2018, 121, 127–138. [Google Scholar] [CrossRef]
- Lucieer, A.; de Jong, S.M.; Turner, D. Mapping Landslide Displacements Using Structure from Motion (SfM) and Image Correlation of Multi–Temporal UAV Photography. Prog. Phys. Geogr. 2014, 38, 97–116. [Google Scholar] [CrossRef]
- Stepinac, M.; Gašparović, M. A Review of Emerging Technologies for an Assessment of Safety and Seismic Vulnerability and Damage Detection of Existing Masonry Structures. Appl. Sci. 2020, 10, 5060. [Google Scholar] [CrossRef]
- Mohammadi, M.; Eskola, R.; Mikkola, A. Constructing a Virtual Environment for Multibody Simulation Software Using Photogrammetry. Appl. Sci. 2020, 10, 4079. [Google Scholar] [CrossRef]
- Poux, F.; Valembois, Q.; Mattes, C.; Kobbelt, L.; Billen, R. Initial User–Centered Design of a Virtual Reality Heritage System: Applications for Digital Tourism. Remote Sens. 2020, 12, 2583. [Google Scholar] [CrossRef]
- Fernández–Reche, J.; Valenzuela, L. Geometrical Assessment of Solar Concentrators Using Close–Range Photogrammetry. Energy Procedia 2012, 30, 84–90. [Google Scholar] [CrossRef] [Green Version]
- Luhmann, T. Close Range Photogrammetry for Industrial Applications. ISPRS J. Photogramm. Remote Sens. 2010, 65, 558–569. [Google Scholar] [CrossRef]
- Campana, S. Drones in Archaeology. State–of–the–Art and Future Perspectives. Archaeol. Prospect. 2017, 24, 275–296. [Google Scholar] [CrossRef]
- Tscharf, A.; Rumpler, M.; Fraundorfer, F.; Mayer, G.; Bischof, H. On the Use of Uavs in Mining and Archaeology–Geo–Accurate 3d Reconstructions Using Various Platforms and Terrestrial Views. ISPRS Ann. Photogramm. Remote Sens. Spat. Inf. Sci. 2015, 2, 15–22. [Google Scholar] [CrossRef] [Green Version]
- Mikita, T.; Balková, M.; Bajer, A.; Cibulka, M.; Patočka, Z. Comparison of Different Remote Sensing Methods for 3d Modeling of Small Rock Outcrops. Sensors 2020, 20, 1663. [Google Scholar] [CrossRef] [Green Version]
- Arza–García, M.; Gil–Docampo, M.; Ortiz–Sanz, J. A Hybrid Photogrammetry Approach for Archaeological Sites: Block Alignment Issues in a Case Study (the Roman Camp of A Cidadela). J. Cult. Herit. 2019, 38, 195–203. [Google Scholar] [CrossRef]
- Remondino, F.; Nocerino, E.; Toschi, I.; Menna, F. A Critical Review of Automated Photogrammetric Processing of Large Datasets. Int. Arch. Photogramm. Remote Sens. Spat. Inf. Sci. ISPRS Arch. 2017, 42, 591–599. [Google Scholar] [CrossRef] [Green Version]
- Schonberger, J.L.; Frahm, J.M. Structure–from–Motion Revisited. In Proceedings of the IEEE Computer Society Conference on Computer Vision and Pattern Recognition, IEEE, Las Vegas, NV, USA, 27–30 June 2016; pp. 4104–4113. [Google Scholar] [CrossRef]
- Alessandri, L.; Baiocchi, V.; Del Pizzo, S.; Di Ciaccio, F.; Onori, M.; Rolfo, M.F.; Troisi, S. A Flexible and Swift Approach for 3D Image–Based Survey in a Cave. Appl. Geomat. 2020. [Google Scholar] [CrossRef]
- Rönnholm, P.; Honkavaara, E.; Litkey, P.; Hyyppä, H.; Hyyppä, J. Integration of Laser Scanning and Photogrammetry. IAPRS 2007, 36, 355–362. [Google Scholar]
- Nex, F.; Rinaudo, F. Photogrammetric and Lidar Integration for the Cultural Heritage Metric Surveys. Int. Arch. Photogramm. Remote Sens. Spat. Inf. Sci. 2010, 38, 490–495. [Google Scholar]
- Remondino, F. Heritage Recording and 3D Modeling with Photogrammetry and 3D Scanning. Remote Sens. 2011, 3, 1104–1138. [Google Scholar] [CrossRef] [Green Version]
- Pepe, M.; Ackermann, S.; Fregonese, L.; Achille, C. 3D Point Cloud Model Color Adjustment by Combining Terrestrial Laser Scanner and Close Range Photogrammetry Datasets. Int. J. Comput. Electr. Autom. Control Inf. Eng. 2016, 10, 1889–1895. [Google Scholar]
- Sánchez–Aparicio, L.J.; Del Pozo, S.; Ramos, L.F.; Arce, A.; Fernandes, F.M. Heritage Site Preservation with Combined Radiometric and Geometric Analysis of TLS Data. Autom. Constr. 2018, 85, 24–39. [Google Scholar] [CrossRef]
- Chiabrando, F.; Sammartano, G.; Spanò, A.; Spreafico, A. Hybrid 3D Models: When Geomatics Innovations Meet Extensive Built Heritage Complexes. ISPRS Int. J. Geo–Inf. 2019, 8, 124. [Google Scholar] [CrossRef] [Green Version]
- Liu, Y.; Zheng, X.; Ai, G.; Zhang, Y.; Zuo, Y. Generating a High–Precision True Digital Orthophoto Map Based on UAV Images. ISPRS Int. J. Geo–Inf. 2018, 7, 333. [Google Scholar] [CrossRef] [Green Version]
- Soycan, A.; Soycan, M. Perspective Correction of Building Facade Images for Architectural Applications. Eng. Sci. Technol. Int. J. 2019, 22, 697–705. [Google Scholar] [CrossRef]
- Pintus, R.; Gobbetti, E.; Callieri, M.; Dellepiane, M. Techniques for Seamless Color Registration and Mapping on Dense 3D Models. In Sensing the Past. Geotechnologies and the Environment; Masini, N., Soldovieri, F., Eds.; Springer: Cham, Switzerland, 2017; pp. 355–376. [Google Scholar] [CrossRef]
- Altuntas, C.; Yildiz, F.; Scaioni, M. Laser Scanning and Data Integration for Three–Dimensional Digital Recording of Complex Historical Structures: The Case of Mevlana Museum. ISPRS Int. J. Geo–Inf. 2016, 5, 18. [Google Scholar] [CrossRef] [Green Version]
- Davelli, D.; Signoroni, A. Automatic Mapping of Uncalibrated Pictures on Dense 3D Point Clouds. Int. Symp. Image Signal Process. Anal. ISPA 2013, 576–581. [Google Scholar] [CrossRef]
- Luo, Q.; Zhou, G.; Zhang, G.; Huang, J. The Texture Extraction and Mapping of Buildings with Occlusion Detection. In Proceedings of the 2015 IEEE International Geoscience and Remote Sensing Symposium (IGARSS), Milan, Italy, 26–31 July 2015; pp. 3002–3005. [Google Scholar] [CrossRef]
- Kersten, T.P.; Stallmann, D. Automatic Texture Mapping of Architectural and Archaeological 3D Models. ISPRS Int. Arch. Photogramm. Remote Sens. Spat. Inf. Sci. 2012, 39, 273–278. [Google Scholar] [CrossRef] [Green Version]
- Koska, B.; Křemen, T. The Combination of Laser Scanning and Structure From Motion Technology for Creation of Accurate Exterior and Interior Orthophotos of St. Nicholas Baroque Church. ISPRS Int. Arch. Photogramm. Remote Sens. Spat. Inf. Sci. 2013, 40, 133–138. [Google Scholar] [CrossRef] [Green Version]
- Pagés, R.; Berjõn, D.; Morán, F.; García, N. Seamless, Static Multi–Texturing of 3D Meshes. Comput. Graph. Forum 2015, 34, 228–238. [Google Scholar] [CrossRef] [Green Version]
- Li, M.; Guo, B.; Zhang, W. An Occlusion Detection Algorithm for 3D Texture Reconstruction of Multi–View Images. Int. J. Mach. Learn. Comput. 2017, 7, 152–155. [Google Scholar] [CrossRef]
- Amhar, F.; Jansa, J.; Ries, C. The Generation of True Orthophotos Using a 3D Building Model in Conjunction With a Conventional Dtm. IAPRS 1998, 32, 16–22. [Google Scholar]
- Chen, L.C.; Chan, L.L.; Chang, W.C. Integration Of Images and Lidar Point Clouds for Building Faç Ade Texturing. Int. Arch. Photogramm. Remote Sens. Spat. Inf. Sci. ISPRS Arch. 2016, 41, 379–382. [Google Scholar] [CrossRef]
- Kang, J.; Denga, F.; Li, X.; Wan, F. Automatic Texture Reconstruction of 3D City Model from Oblique Images. Int. Arch. Photogramm. Remote Sens. Spat. Inf. Sci. ISPRS Arch. 2016, 41, 341–347. [Google Scholar] [CrossRef]
- Lensch, H.P.A.; Heidrich, W.; Seidel, H.P. Automated Texture Registration and Stitching for Real World Models. In Proceedings of the Eighth Pacific Conference on Computer Graphics and Applications, Hong Kong, China, 5 October 2000. [Google Scholar] [CrossRef] [Green Version]
- Poullis, C.; You, S.; Neumann, U. Generating High–Resolution Textures for 3d Virtual Environments Using View–Independent Texture Mapping Charalambos Poullis, Suya You, Ulrich Neumann University of Southern California Integrated Media Systems Center Charles Lee Powell Hall 3737 Watt Way. In Proceedings of the Nternational Conference on Multimedia & Expo, Beijing, China, 2–5 July 2007; pp. 1295–1298. [Google Scholar]
- Waechter, M.; Moehrle, N.; Goesele, M. Let There Be Color! Large–Scale Texturing of 3D Reconstructions BT–Computer Vision–ECCV 2014. In Computer Vision–ECCV; Fleet, D., Pajdla, T., Schiele, B., Tuytelaars, T., Eds.; Springer: Cham, Switzerland, 2014; pp. 836–850. [Google Scholar]
- Huang, X.; Zhu, Q.; Jiang, W. GPVC: Graphics Pipeline–Based Visibility Classification for Texture Reconstruction. Remote Sens. 2018, 10, 1725. [Google Scholar] [CrossRef] [Green Version]
- Karras, G.E.; Grammatikopoulos, L.; Kalisperakis, I.; Petsa, E. Generation of Orthoimages and Perspective Views with Automatic Visibility Checking and Texture Blending. Photogramm. Eng. Remote Sens. 2007, 73, 403–411. [Google Scholar] [CrossRef]
- Zhang, W.; Li, M.; Guo, B.; Li, D.; Guo, G. Rapid Texture Optimization of Three–Dimensional Urban Model Based on Oblique Images. Sensors 2017, 17, 911. [Google Scholar] [CrossRef] [PubMed] [Green Version]
- Kim, C.; Rhee, E. Realistic Façade Texturing of Digital Building Models. Int. J. Softw. Eng. Appl. 2014, 8, 193–202. [Google Scholar] [CrossRef]
- Lari, Z.; El–Sheimy, N.; Habib, A. A New Approach for Realistic 3D Reconstruction of Planar Surfaces from Laser Scanning Data and Imagery Collected Onboard Modern Low–Cost Aerial Mapping Systems. Remote Sens. 2017, 9, 212. [Google Scholar] [CrossRef] [Green Version]
- Previtali, M.; Barazzetti, L.; Scaioni, M. An Automated and Accurate Procedure for Texture Mapping from Images. In Proceedings of the 2012 18th International Conference on Virtual Systems and Multimedia, IEEE, Milan, Italy, 2–5 September 2012; pp. 591–594. [Google Scholar] [CrossRef]
- Hanusch, T. A New Texture Mapping Algorithm for Photorealistic Reconstruction of 3D Objects. Int. Arch. Photogramm. Remote Sens. Spat. Inf. Sci. 2008, 37, 699–705. [Google Scholar]
- Zalama, E.; Gómez–García–Bermejo, J.; Llamas, J.; Medina, R. An Effective Texture Mapping Approach for 3D Models Obtained from Laser Scanner Data to Building Documentation. Comput. Civ. Infrastruct. Eng. 2011, 26, 381–392. [Google Scholar] [CrossRef]
- Grammatikopoulos, L.; Kalisperakis, I.; Karras, G.; Petsa, E. Automatic Multi–View Texture Mapping of 3d Surface Projections. In 2nd ISPRS International Workshop 3D–Arch; ETH Zurich: Zurich, Switzerland, 2007; pp. 1–6. [Google Scholar]
- Chiabrando, F.; Donadio, E.; Rinaudo, F. SfM for Orthophoto Generation: Awinning Approach for Cultural Heritage Knowledge. Int. Arch. Photogramm. Remote Sens. Spat. Inf. Sci. ISPRS Arch. 2015, 40, 91–98. [Google Scholar] [CrossRef] [Green Version]
- Bang, K.-I.; Kim, C.-J. A New True Ortho–Photo Generation Algorithm for High Resolution Satellite Imagery. Korean J. Remote Sens. 2010, 26, 347–359. [Google Scholar]
- Zhou, G.; Wang, Y.; Yue, T.; Ye, S.; Wang, W. Building Occlusion Detection from Ghost Images. IEEE Trans. Geosci. Remote Sens. 2017, 55, 1074–1084. [Google Scholar] [CrossRef]
- De Oliveira, H.C.; Poz, A.P.D.; Galo, M.; Habib, A.F. Surface Gradient Approach for Occlusion Detection Based on Triangulated Irregular Network for True Orthophoto Generation. IEEE J. Sel. Top. Appl. Earth Obs. Remote Sens. 2018, 11, 443–457. [Google Scholar] [CrossRef]
- Xie, W.; Zhou, G. Experimental Realization Of Urban Large–Scale True Orthoimage Generation. In Proceedings of the ISPRS Congress, Beijing, China, 3–11 July 2008; pp. 879–884. [Google Scholar]
- Wang, X.; Jiang, W.; Bian, F. Occlusion Detection Analysis Based on Two Different DSM Models in True Orthophoto Generation. In Proceedings of the SPIE 7146, Geoinformatics 2008 and Joint Conference on GIS and Built Environment: Advanced Spatial Data Models and Analyses, Guangzhou, China, 10 November 2008. [Google Scholar]
- Habib, A.F.; Kim, E.M.; Kim, C.J. New Methodologies for True Orthophoto Generation. Photogramm. Eng. Remote Sens. 2007, 73, 25–36. [Google Scholar] [CrossRef] [Green Version]
- Zhong, C.; Li, H.; Huang, X. A Fast and Effective Approach to Generate True Orthophoto in Built–up Area. Sens. Rev. 2011, 31, 341–348. [Google Scholar] [CrossRef]
- De Oliveira, H.C.; Galo, M.; Dal Poz, A.P. Height–Gradient–Based Method for Occlusion Detection in True Orthophoto Generation. IEEE Geosci. Remote Sens. Lett. 2015, 12, 2222–2226. [Google Scholar] [CrossRef]
- Gharibi, H.; Habib, A. True Orthophoto Generation from Aerial Frame Images and LiDAR Data: An Update. Remote Sens. 2018, 10, 581. [Google Scholar] [CrossRef] [Green Version]
- Bowsher, J.M.C. An Early Nineteenth Century Account of Jerash and the Decapolis: The Records of William John Bankes. Levant 1997, 29, 227–246. [Google Scholar] [CrossRef]
- Lichtenberger, A.; Raja, R.; Stott, D. Mapping Gerasa: A New and Open Data Map of the Site. Antiquity 2019, 93, 1–7. [Google Scholar] [CrossRef]
- Balderstone, S.M. Archaeology in Jordan—The North Theatre AtJerash. Hist. Environ. 1985, 4, 38–45. [Google Scholar]
- Lichtenberger, A.; Raja, R. Management of Water Resources over Time in Semiarid Regions: The Case of Gerasa/Jerash in Jordan. WIREs Water 2020, 7, 1–19. [Google Scholar] [CrossRef] [Green Version]
- Parapetti, R. The Architectural Significance of the Sanctuary of Artemis at Gerasa. SHAJ Stud. Hist. Archaeol. Jordan 1982, 1, 255–260. [Google Scholar]
- Brizzi, M. The Artemis Temple Reconsidered. The Archaeology and History of Jerash. 110 Years of Excavations; Lichtenberger, A., Raja, R., Eds.; Brepols: Turnhout, Belgium, 2018. [Google Scholar]
- Ababneh, A. Qusair Amra (Jordan) World Heritage Site: A Review of Current Status of Presentation and Protection Approaches. Mediterr. Archaeol. Archaeom. 2015, 15, 27–44. [Google Scholar] [CrossRef]
- Aigner, H. Athletic Images in the Umayyid Palace of Qasr ‘Amra in Jordan: Examples of Body Culture or Byzantine Representation in Early Islam? Int. J. Phytoremediat. 2000, 21, 159–164. [Google Scholar] [CrossRef]
- Bianchin, S.; Casellato, U.; Favaro, M.; Vigato, P.A. Painting Technique and State of Conservation of Wall Paintings at Qusayr Amra, Amman–Jordan. J. Cult. Herit. 2007, 8, 289–293. [Google Scholar] [CrossRef]
- Zhang, J.; Lin, X. Advances in Fusion of Optical Imagery and LiDAR Point Cloud Applied to Photogrammetry and Remote Sensing. Int. J. Image Data Fusion 2017, 8, 1–31. [Google Scholar] [CrossRef]
- Pu, S.; Vosselman, G. Building Facade Reconstruction by Fusing Terrestrial Laser Points and Images. Sensors 2009, 9, 4525–4542. [Google Scholar] [CrossRef] [Green Version]
- Parmehr, E.; Fraser, C.S.; Zhang, C.; Leach, J. Automatic Registration of Optical Imagery with 3D LiDAR Data Using Statistical Similarity. ISPRS J. Photogramm. Remote Sens. 2014, 88, 28–40. [Google Scholar] [CrossRef]
- Morago, B.; Bui, G.; Le, T.; Maerz, N.H.; Duan, Y. Photograph LIDAR Registration Methodology for Rock Discontinuity Measurement. IEEE Geosci. Remote Sens. Lett. 2018, 15, 947–951. [Google Scholar] [CrossRef]
- González–Aguilera, D.; Rodríguez–Gonzálvez, P.; Gómez–Lahoz, J. An Automatic Procedure for Co–Registration of Terrestrial Laser Scanners and Digital Cameras. ISPRS J. Photogramm. Remote Sens. 2009, 64, 308–316. [Google Scholar] [CrossRef]
- Aicardi, I.; Chiabrando, F.; Grasso, N.; Lingua, A.M.; Noardo, F.; Spanó, A. UAV Photogrammetry with Oblique Images: First Analysis on Data Acquisition and Processing. Int. Arch. Photogramm. Remote Sens. Spat. Inf. Sci. ISPRS Arch. 2016, 41, 835–842. [Google Scholar] [CrossRef]
- Alshawabkeh, Y. Linear Feature Extraction from Point Cloud Using Color Information. Herit. Sci. 2020, 8, 1–13. [Google Scholar] [CrossRef]
Figure 1.
(a) Double mapping in texturing process, points A and B get spectral information while they are in shadow; (b) principle of Z–buffer algorithm.
Figure 1.
(a) Double mapping in texturing process, points A and B get spectral information while they are in shadow; (b) principle of Z–buffer algorithm.

Figure 2.
Differential rectification method and double mapping effect.

Figure 3.
(a) The Northern theatre; (b) Artemis Temple; (c) Qusayr ‘Amra.

Figure 4.
Three-dimensional meshed models of the experimental data.


Figure 5.
(a) Collinearity projection model; (b) camera registration parameters.

Figure 6.
Visible data filtering, projection of vertex P to image plane with a grid patch centered at p, V is visible, O is occluded.
Figure 6.
Visible data filtering, projection of vertex P to image plane with a grid patch centered at p, V is visible, O is occluded.

Figure 7.
The flowchart of the visibility algorithm.

Figure 8.
Images captured using the camera installed on the Terrestrial Laser Scanner (TLS) device.

Figure 9.
The distant acquisition of TLS data leads to low resolution color information.

Figure 10.
Point cloud coloring of the Artemis façade: (a) using a scanner camera; (b) using an independent image taken close to the view of the scanner.
Figure 10.
Point cloud coloring of the Artemis façade: (a) using a scanner camera; (b) using an independent image taken close to the view of the scanner.


Figure 11.
Double mapping effect in texturing the Northern theater.

Figure 12.
The flowchart of texture mapping.

Figure 13.
True texture mapping after filtering out the occlusion parts.


Figure 14.
Three-dimensional meshed model of Qusayr ‘Amra façade using TLS.

Figure 15.
Experimental area from Qusayr ‘Amra that suffering degradation: (a) 3D wireframe using TLS; (b) 3D wireframe using image–based modeling; (c) 3D textured model using image-based modeling.
Figure 15.
Experimental area from Qusayr ‘Amra that suffering degradation: (a) 3D wireframe using TLS; (b) 3D wireframe using image–based modeling; (c) 3D textured model using image-based modeling.

Figure 16.
Principle of true orthophoto projection.

Figure 17.
The flowchart of true-orthophoto.

Figure 18.
Digital Surface Model (DSM) and gridded DSM (depth images).

Figure 19.
Differential rectification can only produce satisfactory results for a flat part of the surface.
Figure 19.
Differential rectification can only produce satisfactory results for a flat part of the surface.

Figure 20.
Qusayr ‘Amra façade: (a) Differential rectification and double mapping problem; (b) true orthophoto with occluded areas in blue.
Figure 20.
Qusayr ‘Amra façade: (a) Differential rectification and double mapping problem; (b) true orthophoto with occluded areas in blue.

Figure 21.
Texture mapping of Northern Theatre using multiple images.

Publisher’s Note: MDPI stays neutral with regard to jurisdictional claims in published maps and institutional affiliations. |
© 2020 by the author. Licensee MDPI, Basel, Switzerland. This article is an open access article distributed under the terms and conditions of the Creative Commons Attribution (CC BY) license (http://creativecommons.org/licenses/by/4.0/).
Share and Cite
MDPI and ACS Style
Alshawabkeh, Y. Color and Laser Data as a Complementary Approach for Heritage Documentation. Remote Sens. 2020, 12, 3465. https://0-doi-org.brum.beds.ac.uk/10.3390/rs12203465
AMA Style
Alshawabkeh Y. Color and Laser Data as a Complementary Approach for Heritage Documentation. Remote Sensing. 2020; 12(20):3465. https://0-doi-org.brum.beds.ac.uk/10.3390/rs12203465
Chicago/Turabian StyleAlshawabkeh, Yahya. 2020. "Color and Laser Data as a Complementary Approach for Heritage Documentation" Remote Sensing 12, no. 20: 3465. https://0-doi-org.brum.beds.ac.uk/10.3390/rs12203465
Note that from the first issue of 2016, this journal uses article numbers instead of page numbers. See further details here.