On the Land-Sea Contrast in the Surface Solar Radiation (SSR) in the Baltic Region

 , , , and
Abstract
: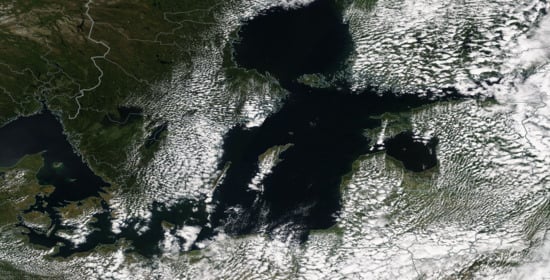
1. Introduction
2. Materials and Methods
2.1. Satellite SSR
- CLARA-A2 (CM SAF cLoud, Albedo and surface RAdiation dataset from AVHRR data—Edition 2; doi:10.5676/EUM_SAF_CM/CLARA_AVHRR/V002), a data record based on measurements by the AVHRR sensor onboard a series of polar-orbiting satellites
- SARAH-2 (Surface Radiation Data Set-Heliosat (SARAH)—Edition 2; doi:10.5676/EUM_SAF_CM/SARAH/V002), a data record derived from satellite-observations of the visible channels of the Meteosat Visible Infra-Red Imager (MVIRI) and the Spinning Enhanced Visible and Infrared Imager (SEVIRI) instruments onboard the geostationary Meteosat satellites
2.2. Coastline Information
2.3. Ground-Based Pyranometer Measurements
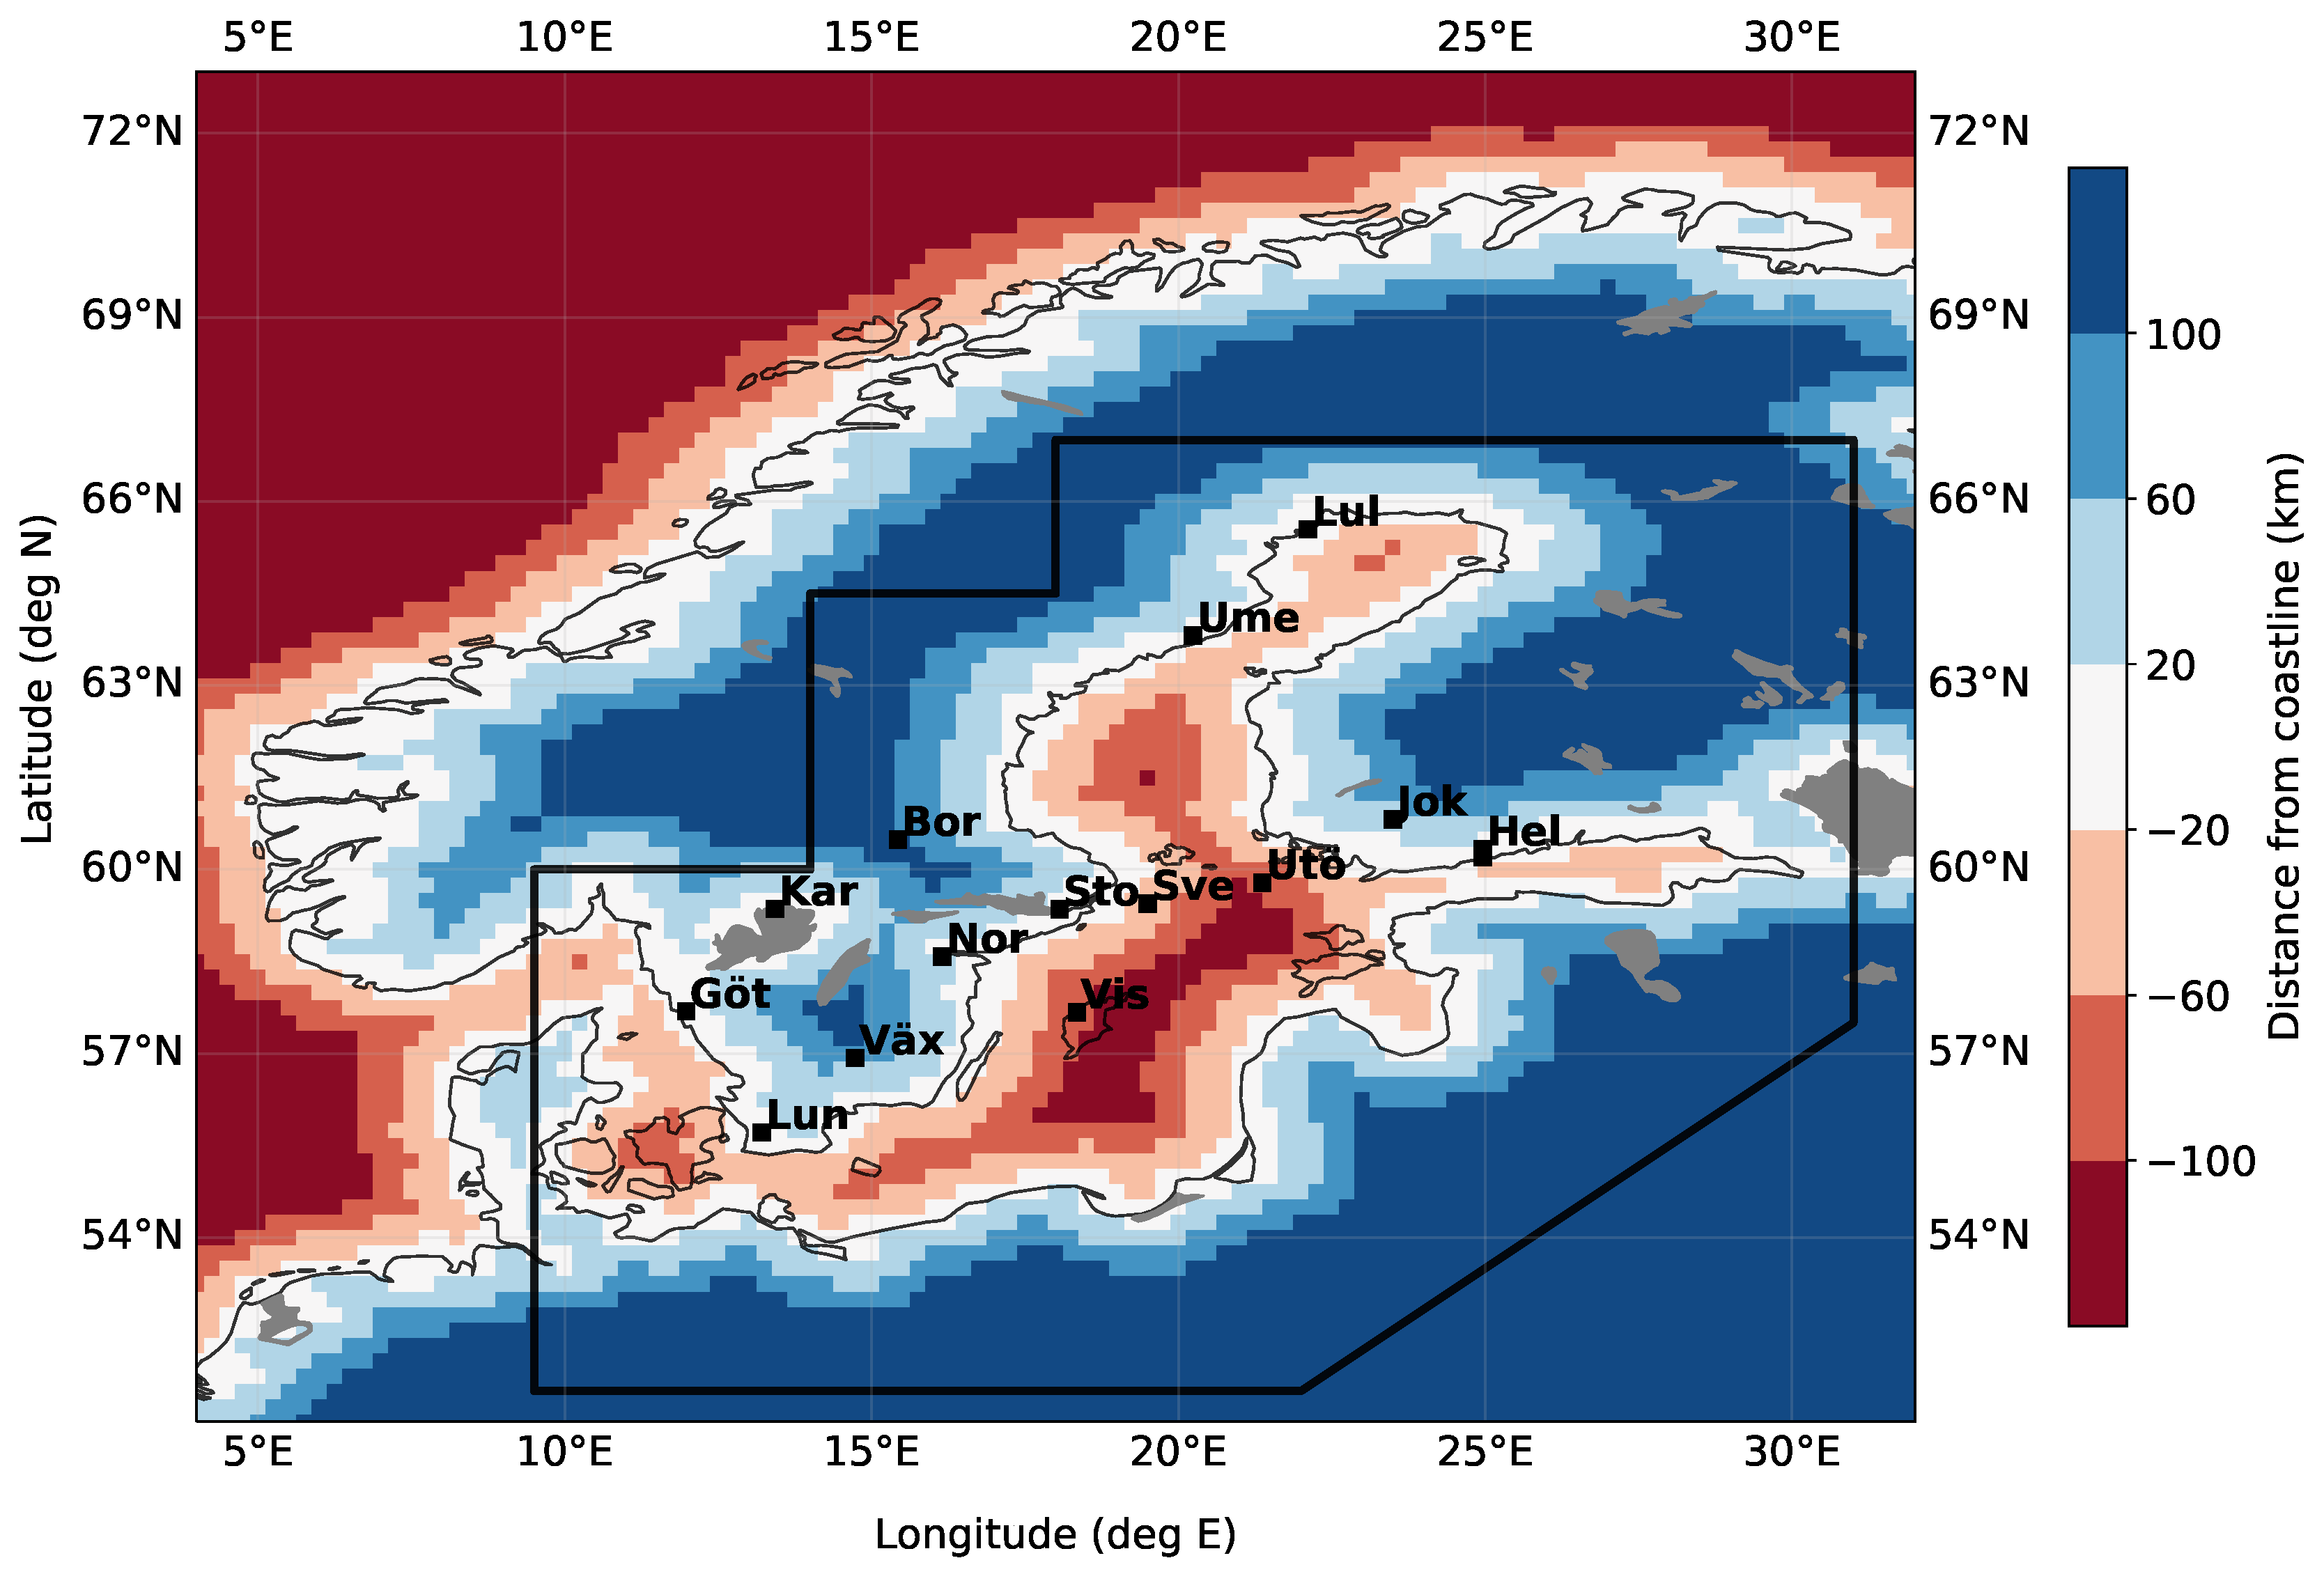
2.4. Distance to the Coastline
2.5. Period of Analysis
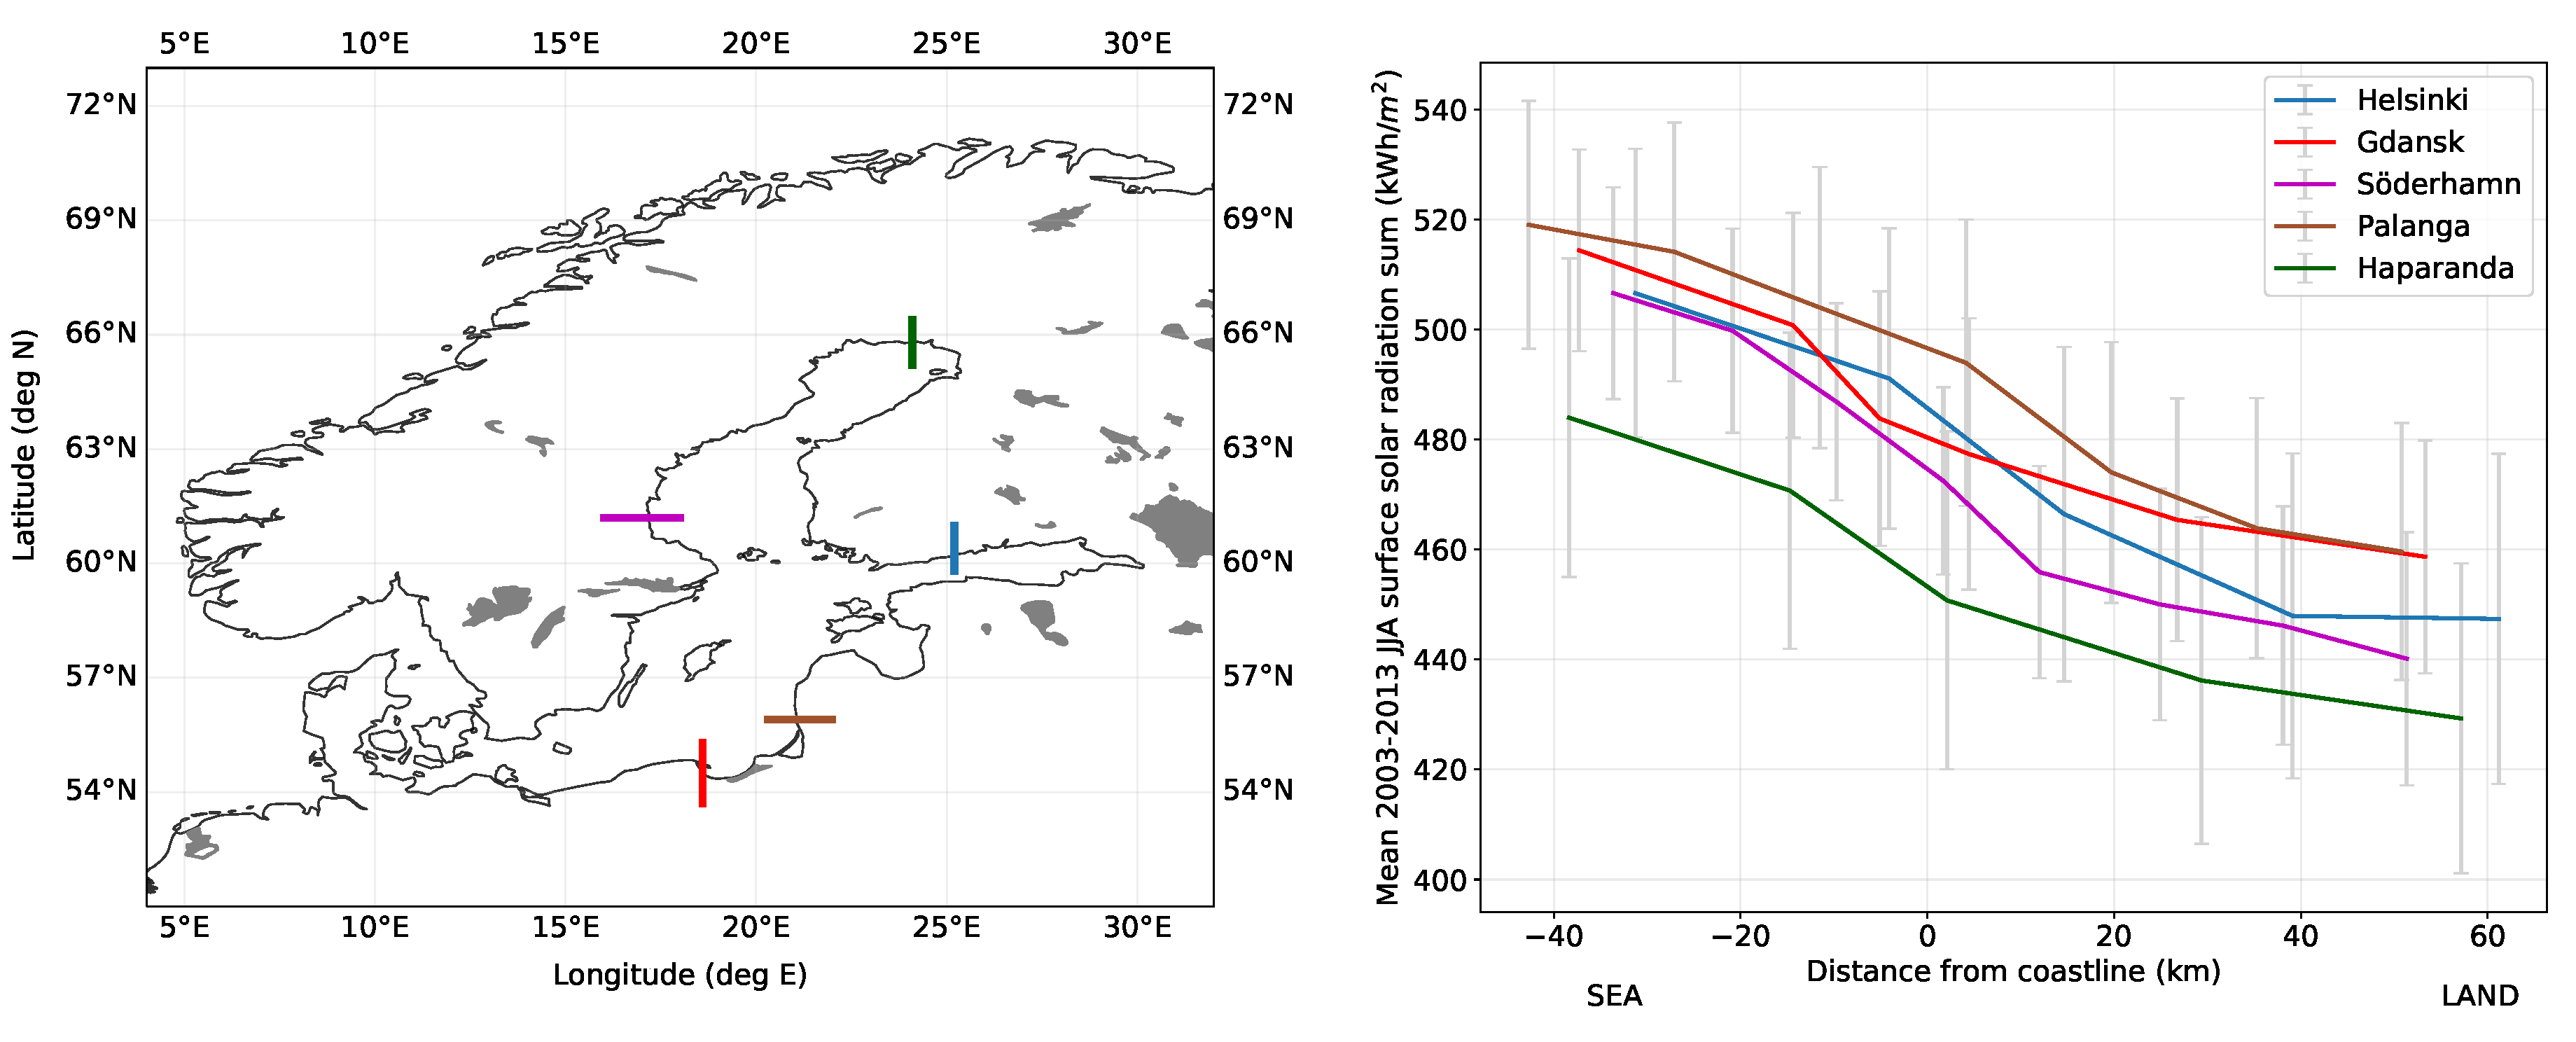
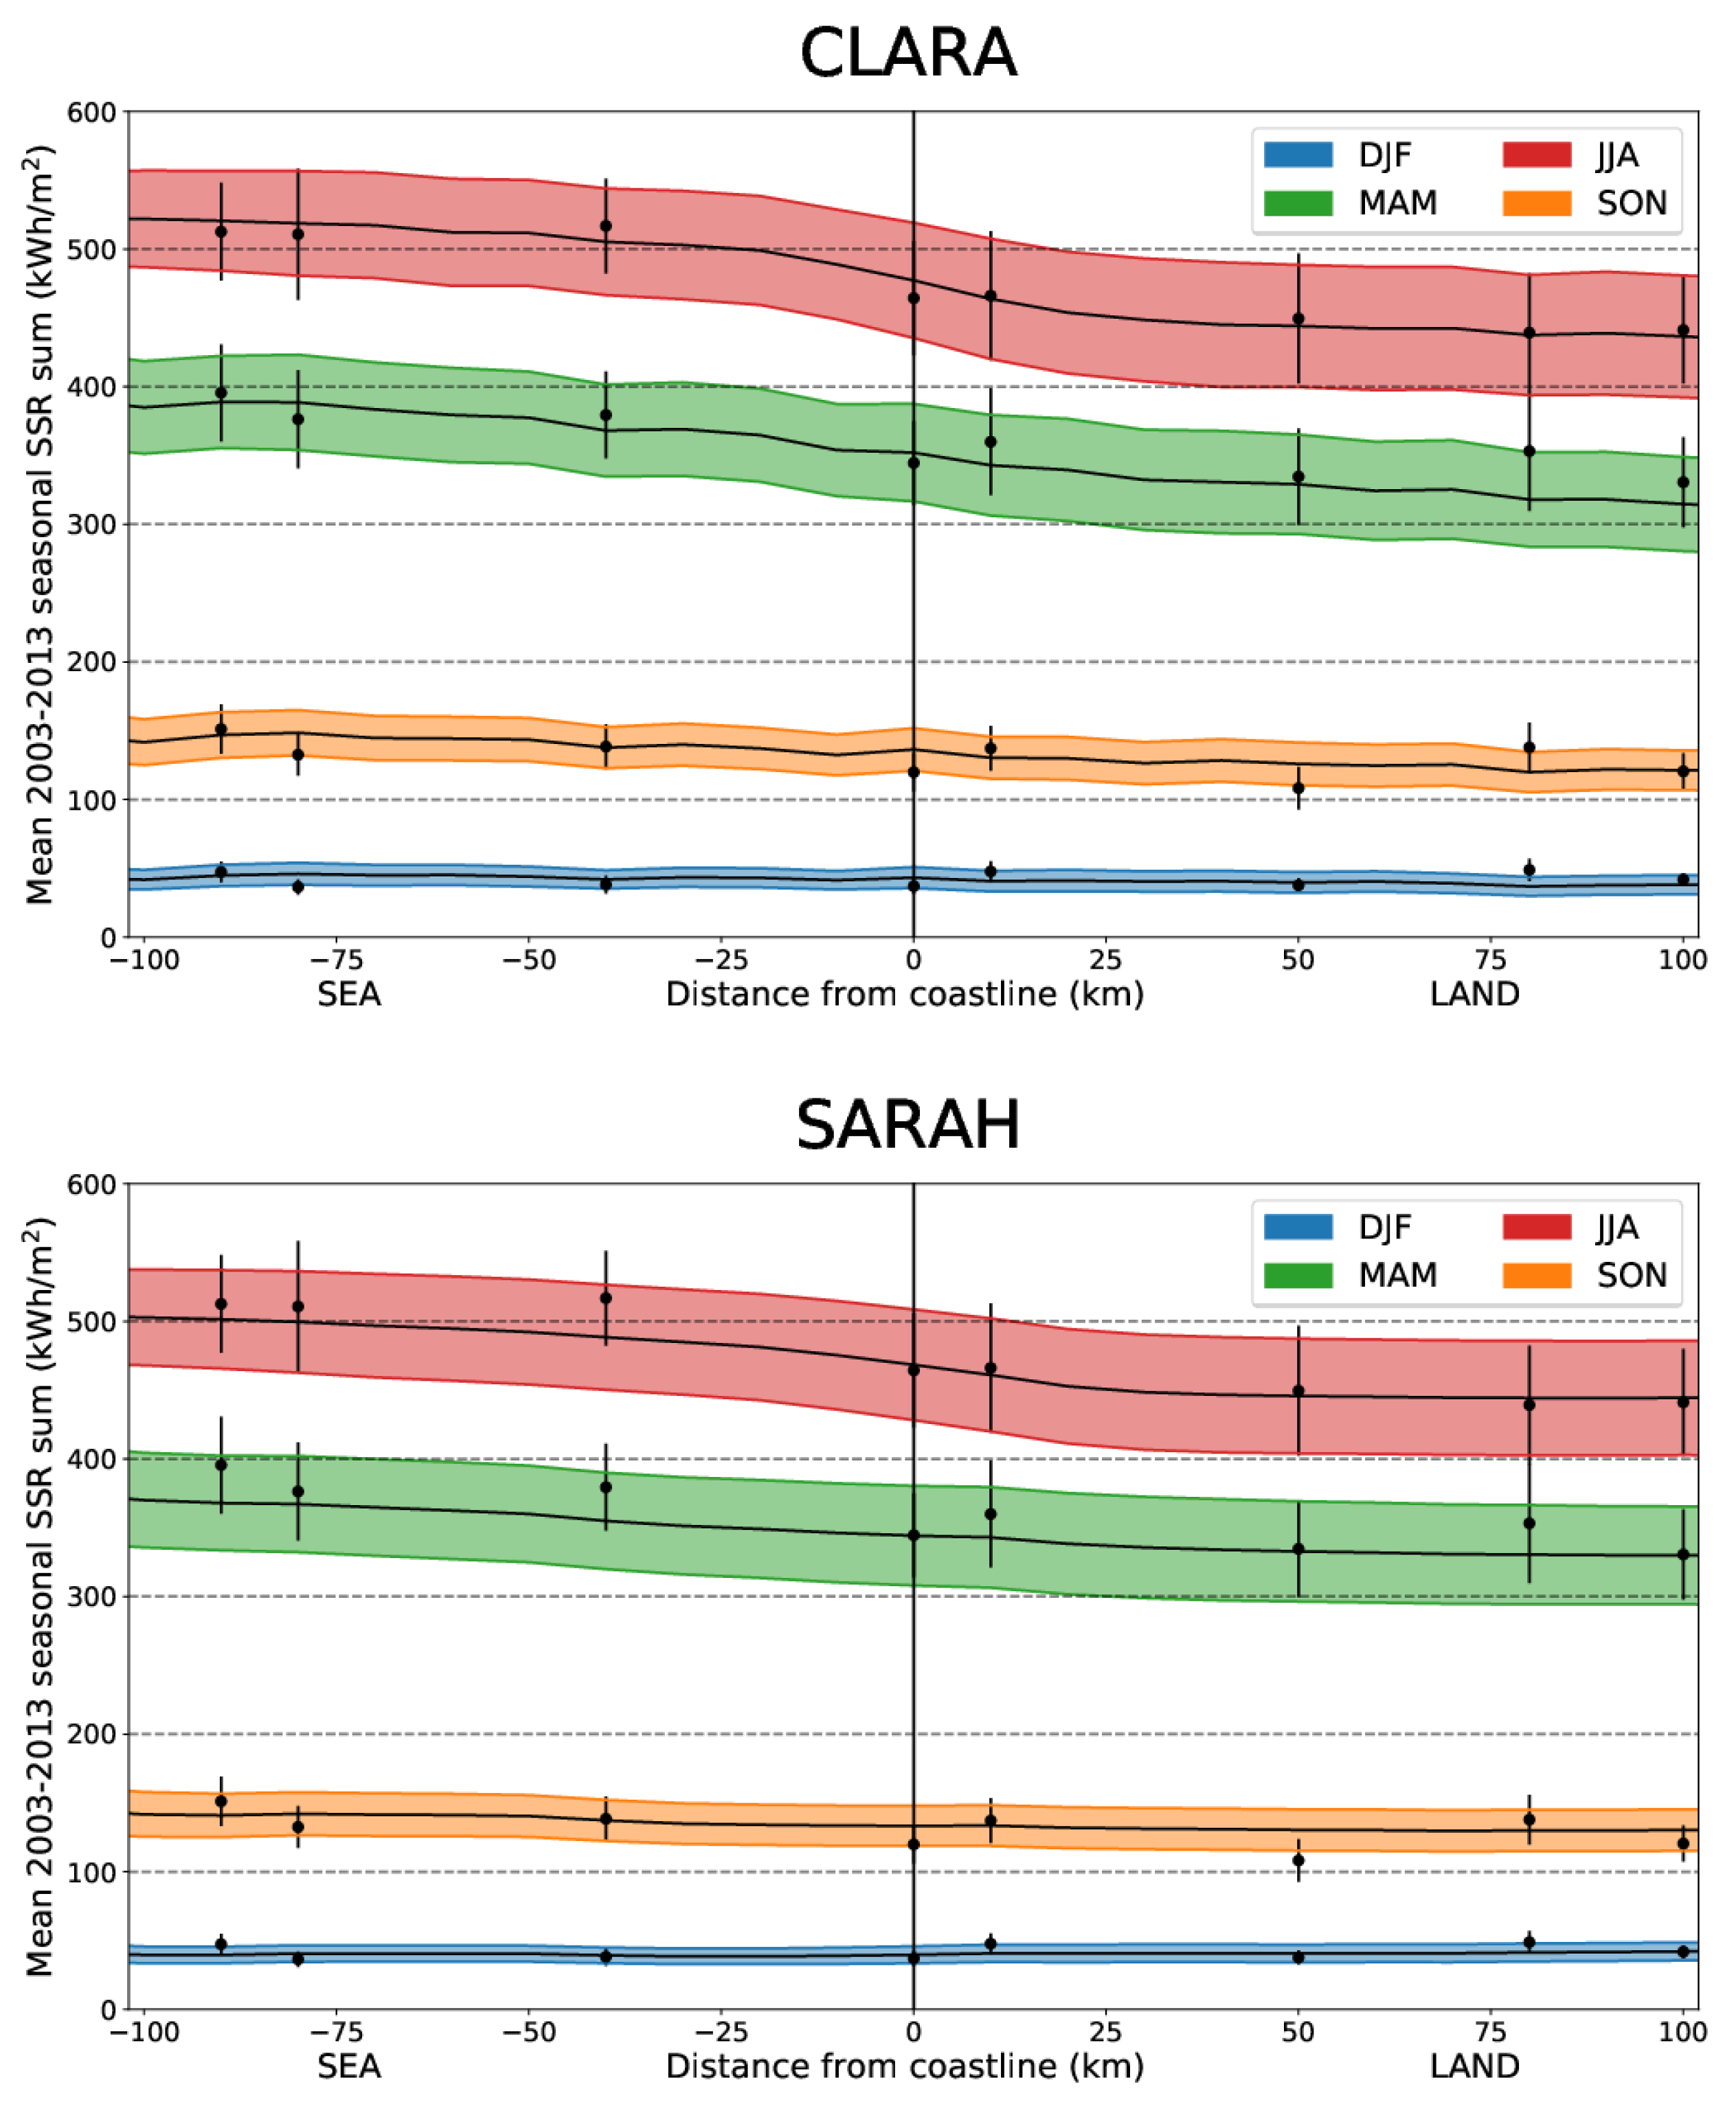
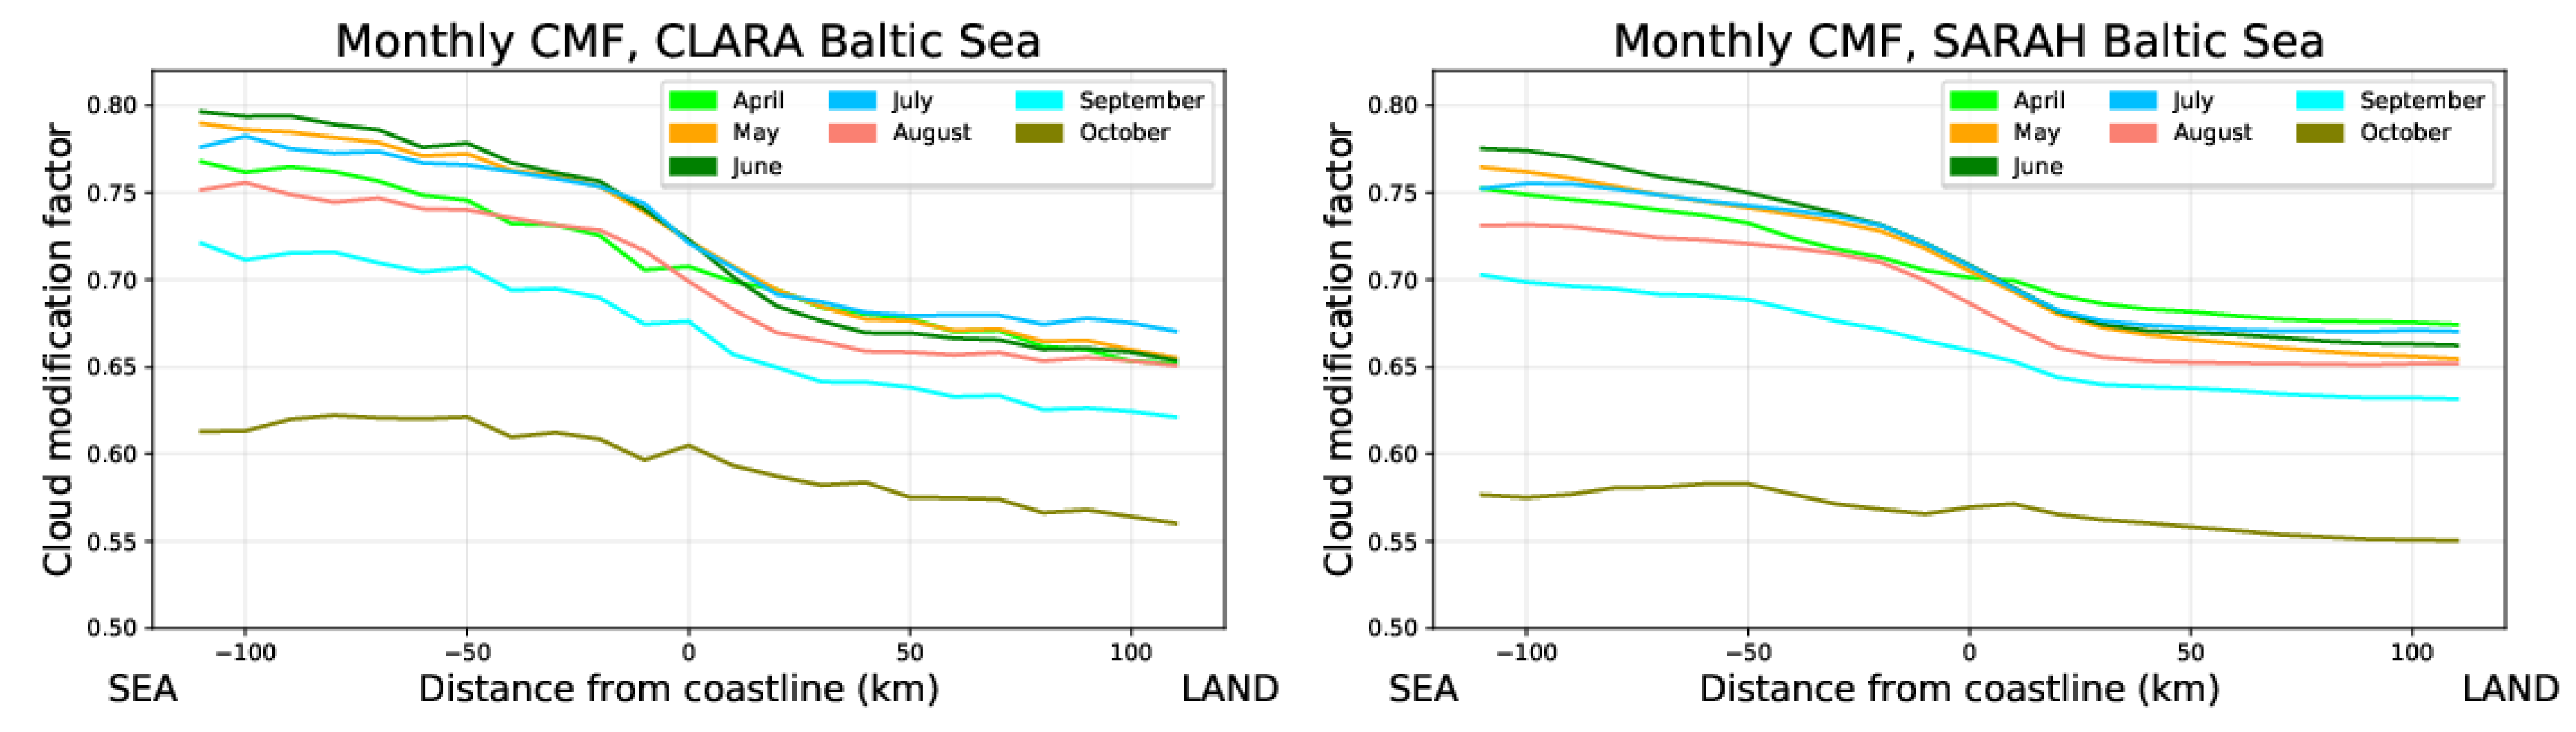
3. Results
4. Discussion
Author Contributions
Funding
Acknowledgments
Conflicts of Interest
References
- Rossow, W.; Schiffer, R. Advances in understanding clouds from ISCCP. Bull. Am. Meteorl. Soc. 1999, 80, 2261–2284. [Google Scholar] [CrossRef] [Green Version]
- Stubenrauch, C.J.; Chedin, A.; Rädel, G.; Scott, N.A.; Serrar, S. Cloud Properties and Their Seasonal and Diurnal Variability from TOVS Path-B. J. Clim. 2006, 19, 5531–5553. [Google Scholar] [CrossRef]
- Hahn, C.; Warren, S. A Gridded Climatology of Clouds over Land (1971–96) and Ocean (1954-97) from Surface Observations Worldwide; Technical Report Numeric Data Product NDP-026E; Carbon Dioxide Information Analysis Center, Oak Ridge National Laboratory: Oak Ridge, TN, USA, 2007. [Google Scholar] [CrossRef] [Green Version]
- Ångström, A. Solstrålning Och Ljus På Den Svenska Västkusten; Lundbergs Boktryckeri: Göteborg, Sweden, 1928. [Google Scholar]
- Lunelund, H. Über die Sonnenscheindauer in Finnland. Soc. Scient. Fenn. Comm. Phys. Math. 1941, XI, 1–14. [Google Scholar]
- Karlsson, K. A 10 year cloud climatology over Scandinavia derived from NOAA advanced very high resolution radiometer imagery. Int. J. Climatol. 2003, 23, 1023–1044. [Google Scholar] [CrossRef]
- Persson, T. Solar radiation climate in Sweden. Phys. Chem. Earth Part B Hydrol. Ocean. Atmos. 1999, 24, 275–279. [Google Scholar] [CrossRef]
- Posselt, R.; Mueller, R.; Stöckli, R.; Trentmann, J. Remote sensing of solar surface radiation for climate monitoring—The CM-SAF retrieval in international comparison. Remote Sens. Environ. 2012, 118, 186–198. [Google Scholar] [CrossRef]
- Šúri, M.; Huld, T.A.; Dunlop, E.D. PV-GIS: A web-based solar radiation database for the calculation of PV potential in Europe. Int. J. Sustain. Energy 2005, 24, 55–67. [Google Scholar] [CrossRef]
- Riihelä, A.; Carlund, T.; Trentmann, J.; Müller, R.; Lindfors, A.V. Validation of CM SAF Surface Solar Radiation Datasets over Finland and Sweden. Remote Sens. 2015, 7, 6663–6682. [Google Scholar] [CrossRef] [Green Version]
- Karlsson, K.G.; Anttila, K.; Trentmann, J.; Stengel, M.; Fokke Meirink, J.; Devasthale, A.; Hanschmann, T.; Kothe, S.; Jääskeläinen, E.; Sedlar, J.; et al. CLARA-A2: The second edition of the CM SAF cloud and radiation data record from 34 years of global AVHRR data. Atmos. Chem. Phys. 2017, 17, 5809–5828. [Google Scholar] [CrossRef] [Green Version]
- Trentmann, J.; Pfeifroth, U. Algorithm Theoretical Baseline Document, Meteosat Solar Surface Radiation and Effective Cloud Albedo, Climate Data Records—Heliosat, SARAH-2; Technical Report Issue 2.2; EUMETSAT: Darmstadt, Germany, 2017. [Google Scholar]
- Wessel, P.; Smith, W. A global, self-consistent, hierarchical, high-resolution shoreline database. J. Geophys. Res. Solid Earth 1996, 101, 8741–8743. [Google Scholar] [CrossRef] [Green Version]
- GSHHG. Global Self-Consistent Hierarchical High-Resolution Geography (GSHHG). Available online: http://www.soest.hawaii.edu/pwessel/gshhg/index.html (accessed on 16 October 2020).
- Müller, B.; Wild, M.; Driesse, A.; Behrens, K. Rethinking solar resource assessments in the context of global dimming and brightening. Sol. Energy 2014, 99, 272–282. [Google Scholar] [CrossRef]
- Tuononen, M.; O’Connor, E.J.; Sinclair, V.A. Evaluating solar radiation forecast uncertainty. Atmos. Chem. Phys. 2019, 19, 1985–2000. [Google Scholar] [CrossRef] [Green Version]
- Calbo, J.; Pages, D.; Gonzalez, J.A. Empirical studies of cloud effects on UV radiation: A review. Rev. Geophys. 2005, 43. [Google Scholar] [CrossRef] [Green Version]
- Lindfors, A.; Arola, A. On the wavelength-dependent attenuation of UV radiation by clouds. Geophys. Res. Lett. 2008, 35. [Google Scholar] [CrossRef]
- Mäkelä, A.; Enno, S.E.; Haapalainen, J. Nordic Lightning Information System: Thunderstorm climate of Northern Europe for the period 2002–2011. Atmos. Res. 2014, 139, 46–61. [Google Scholar] [CrossRef]
- Taszarek, M.; Allen, J.; Pucik, T.; Groenemeijer, P.; Czernecki, B.; Kolendowicz, L.; Lagouvardos, K.; Kotroni, V.; Schulz, W. A Climatology of Thunderstorms across Europe from a Synthesis of Multiple Data Sources. J. Clim. 2019, 32, 1813–1837. [Google Scholar] [CrossRef]
- Radziemska, E. The effect of temperature on the power drop in crystalline silicon solar cells. Renew. Energy 2003, 28, 1–12. [Google Scholar] [CrossRef]


| Station | Distance [km] | Latitude [N] | Longitude [E] |
|---|---|---|---|
| Visby | −94 | 57.673 | 18.345 |
| Utö | −80 | 59.784 | 21.368 |
| Svenska Högarna | −41 | 59.442 | 19.502 |
| Karlstad | −2 | 59.359 | 13.427 |
| Luleå | 1 | 65.544 | 22.111 |
| Göteborg | 3 | 57.688 | 11.980 |
| Helsinki-Kumpula | 3 | 60.203 | 24.961 |
| Stockholm | 4 | 59.353 | 18.063 |
| Umeå | 5 | 63.811 | 20.240 |
| Norrköping | 7 | 58.582 | 16.148 |
| Lund | 10 | 55.714 | 13.212 |
| Helsinki-Vantaa | 11 | 60.327 | 24.957 |
| Jokioinen | 54 | 60.814 | 23.498 |
| Växjö | 84 | 56.927 | 14.731 |
| Borlänge | 98 | 50.488 | 15.430 |
| CLARA | SARAH | CLARA | SARAH | CLARA | SARAH | CLARA | SARAH | |
|---|---|---|---|---|---|---|---|---|
| DJF | 43.3 | 38.5 | 42.4 | 39.8 | 41.2 | 40.6 | 4.8 | −5.3 |
| MAM | 368.2 | 349.0 | 351.0 | 344.4 | 339.0 | 338.3 | 8.3 | 3.1 |
| JJA | 499.1 | 481.1 | 476.0 | 468.2 | 453.2 | 452.6 | 9.6 | 6.1 |
| SON | 137.5 | 134.2 | 134.6 | 133.5 | 129.9 | 131.9 | 5.6 | 1.7 |
| YEAR | 1042.0 | 997.0 | 998.3 | 980.1 | 957.8 | 957.9 | 8.4 | 4.0 |
Publisher’s Note: MDPI stays neutral with regard to jurisdictional claims in published maps and institutional affiliations. |
© 2020 by the authors. Licensee MDPI, Basel, Switzerland. This article is an open access article distributed under the terms and conditions of the Creative Commons Attribution (CC BY) license (http://creativecommons.org/licenses/by/4.0/).
Share and Cite
Lindfors, A.V.; Hertsberg, A.; Riihelä, A.; Carlund, T.; Trentmann, J.; Müller, R. On the Land-Sea Contrast in the Surface Solar Radiation (SSR) in the Baltic Region. Remote Sens. 2020, 12, 3509. https://0-doi-org.brum.beds.ac.uk/10.3390/rs12213509
Lindfors AV, Hertsberg A, Riihelä A, Carlund T, Trentmann J, Müller R. On the Land-Sea Contrast in the Surface Solar Radiation (SSR) in the Baltic Region. Remote Sensing. 2020; 12(21):3509. https://0-doi-org.brum.beds.ac.uk/10.3390/rs12213509
Chicago/Turabian StyleLindfors, Anders V., Axel Hertsberg, Aku Riihelä, Thomas Carlund, Jörg Trentmann, and Richard Müller. 2020. "On the Land-Sea Contrast in the Surface Solar Radiation (SSR) in the Baltic Region" Remote Sensing 12, no. 21: 3509. https://0-doi-org.brum.beds.ac.uk/10.3390/rs12213509