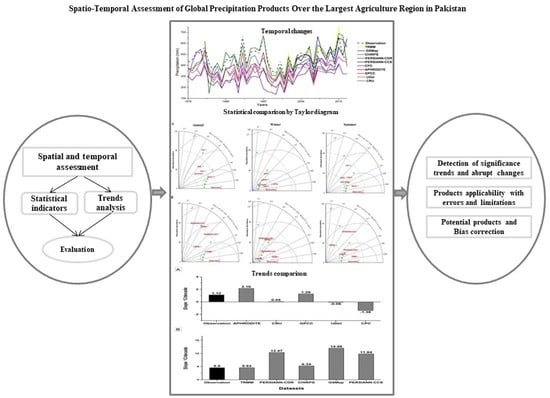
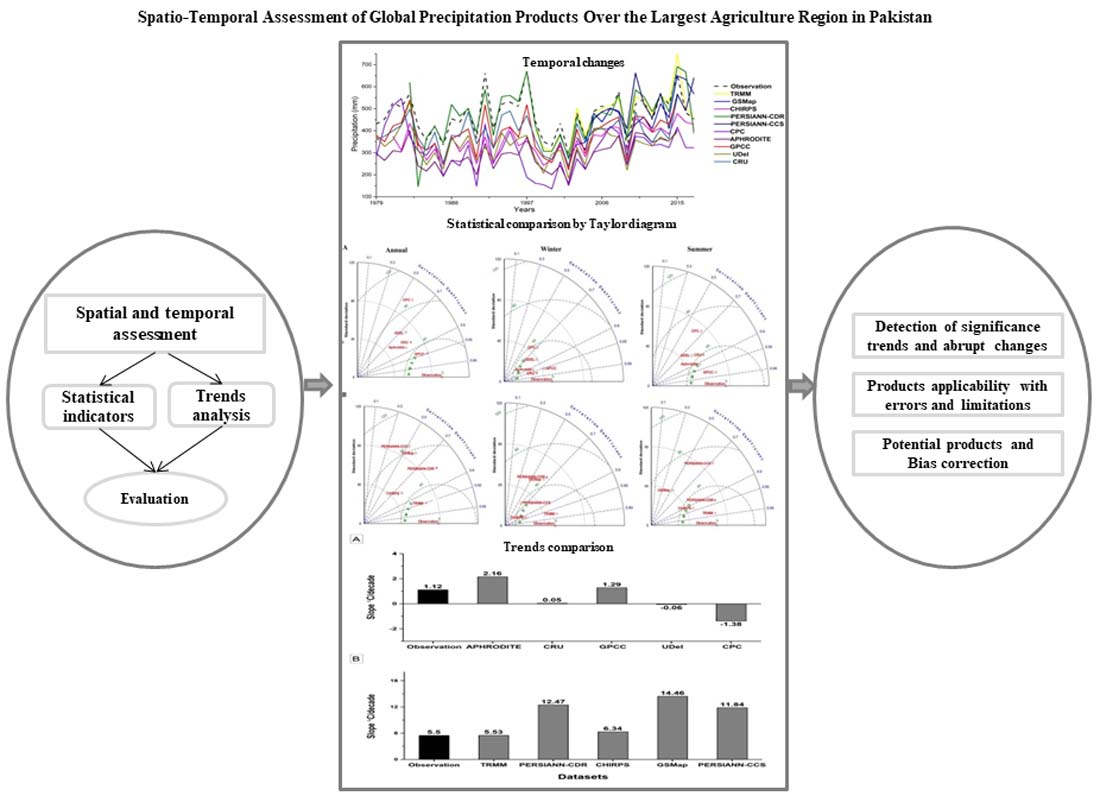
Spatio-Temporal Assessment of Global Precipitation Products over the Largest Agriculture Region in Pakistan

 , , ,
, , , 
Abstract
:
1. Introduction
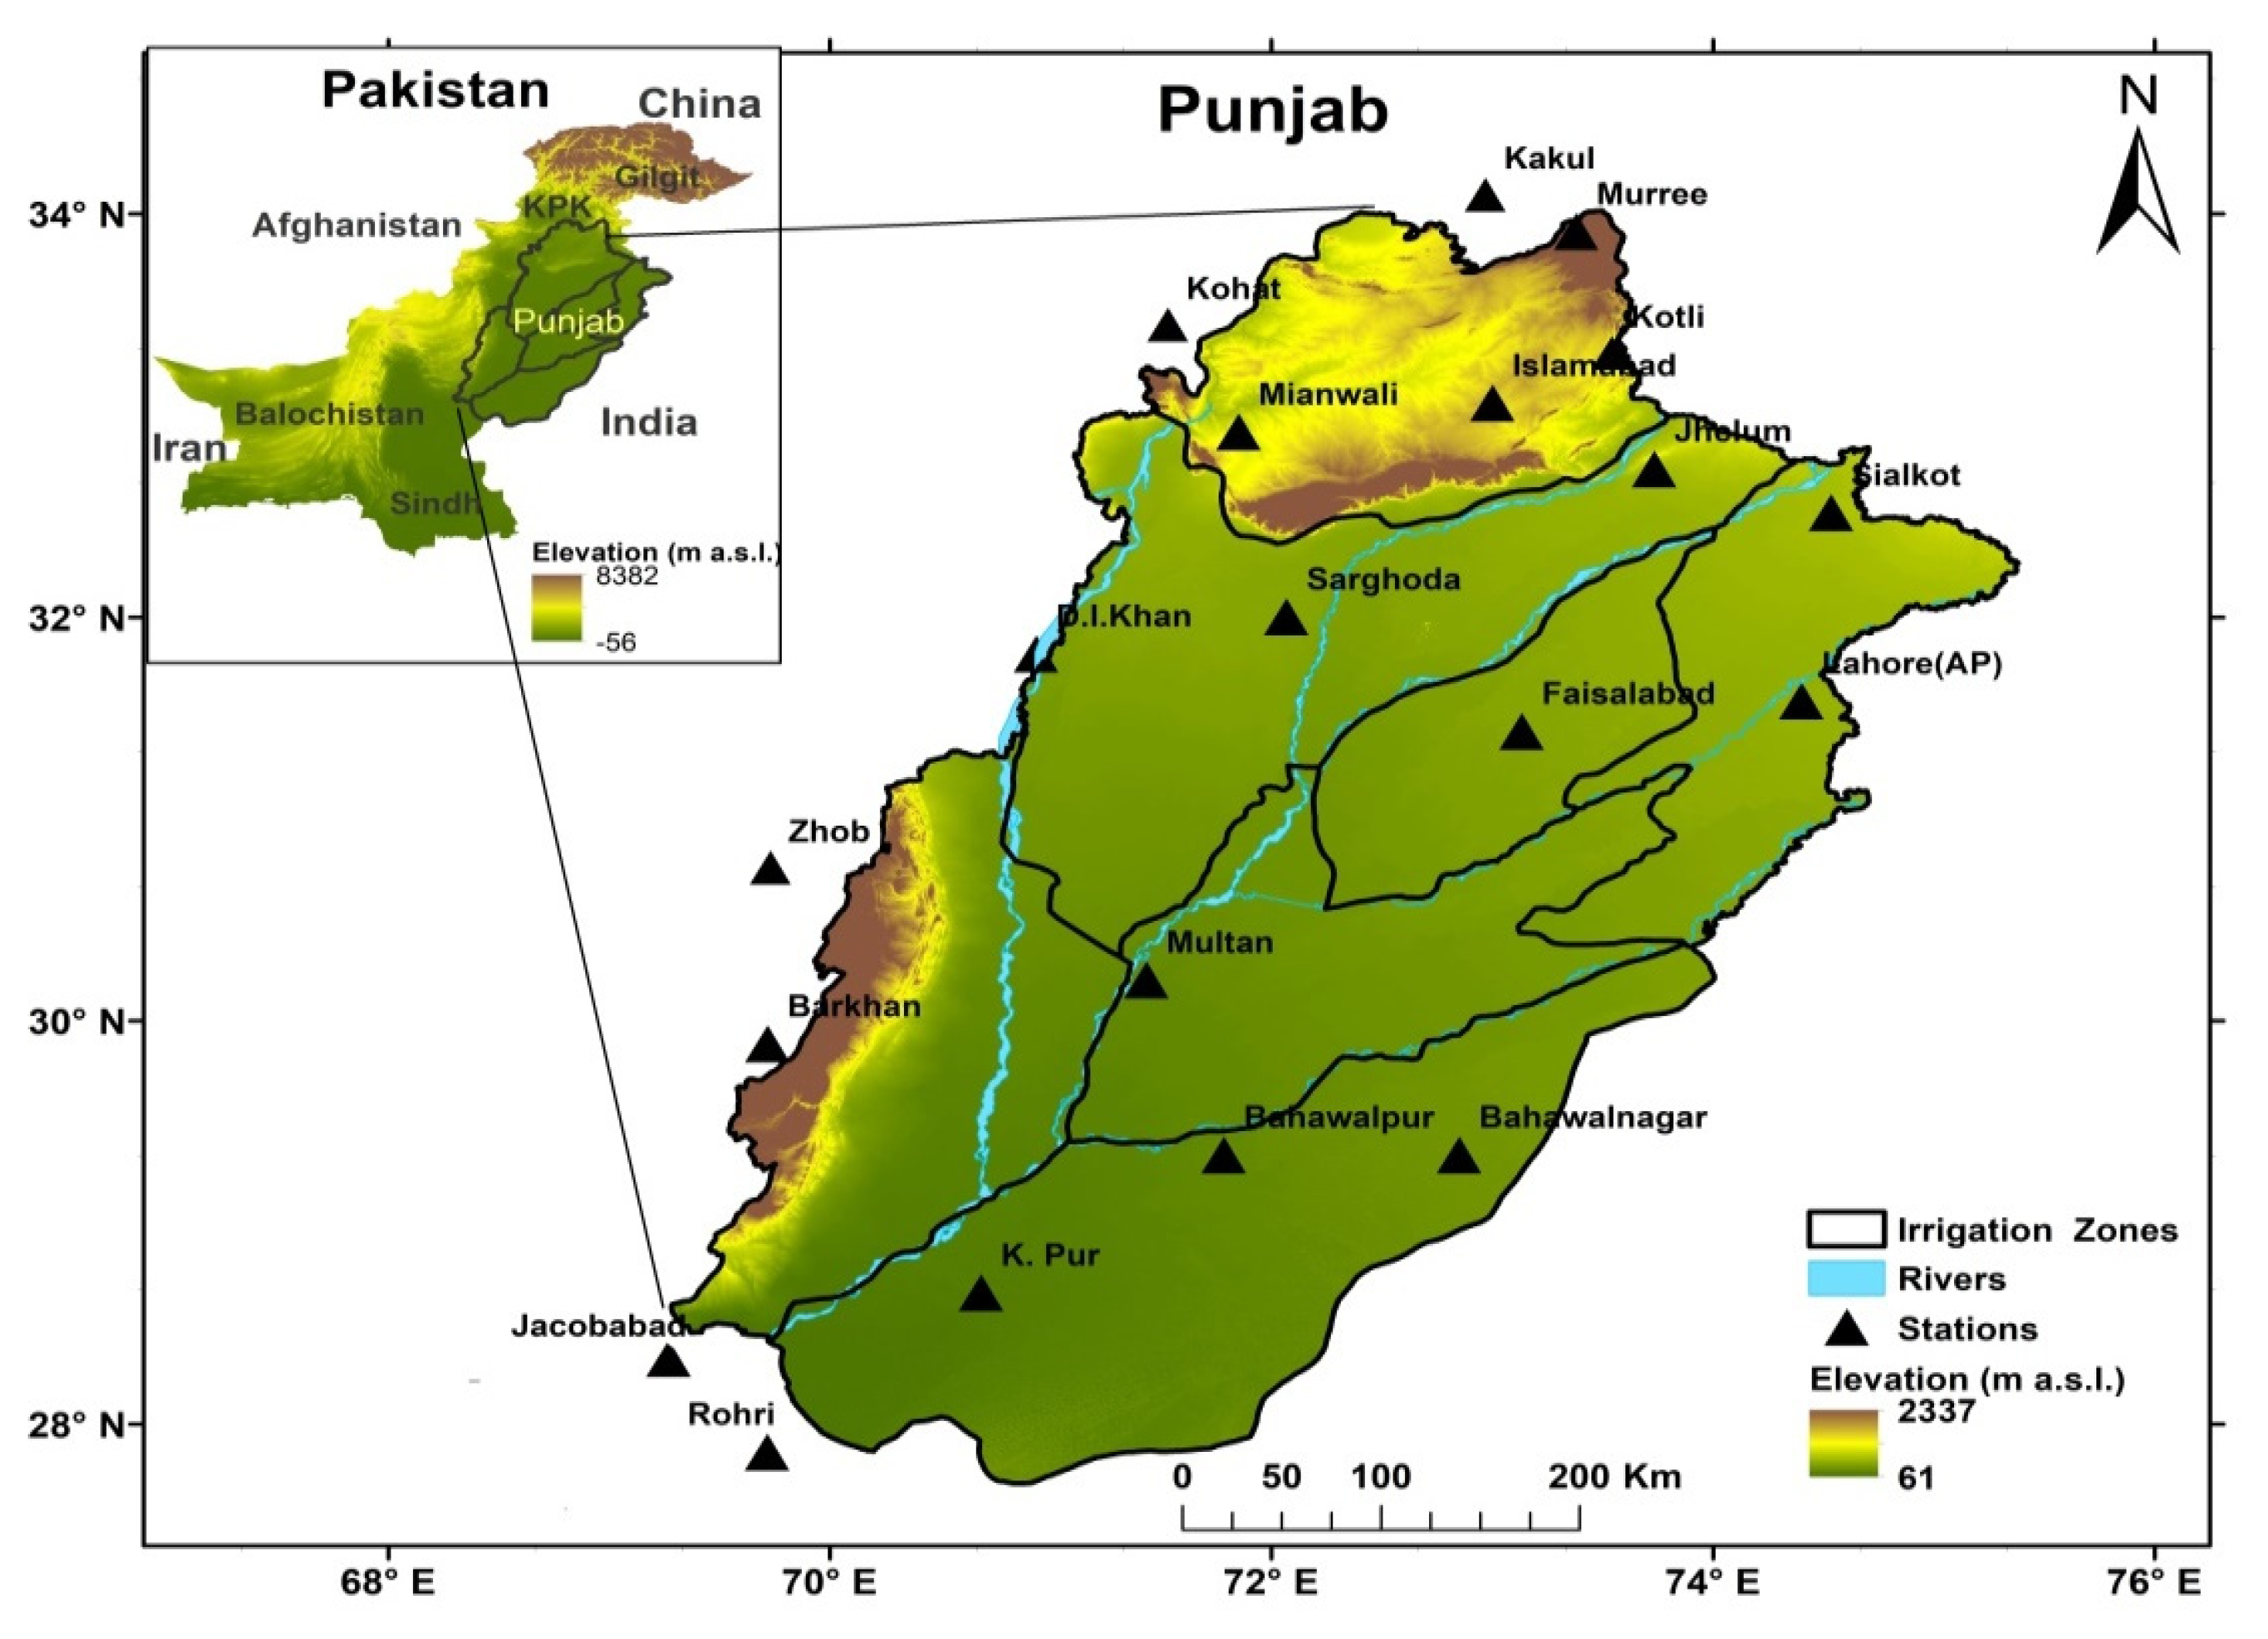
2. Study Area
3. Materials and Methods
3.1. In-Situ Records
3.2. Gridded Precipitation Products (GPPs)
3.2.1. Gauge-Based GPPs
3.2.2. Satellite-Based GPPs

| Datasets | Resolution | Frequency | Coverage | Study Period | Reference |
|---|---|---|---|---|---|
| APHRODITE | 0.5° | Monthly | Global land | 1979–2015 | [51] |
| CRU | 0.5° | Monthly | Global land | 1979–2015 | [50] |
| CPC | 0.5° | Monthly | Global land | 1979–2015 | [52] |
| GPCC | 0.5° | Monthly | Global land | 1979–2013 | [48] |
| UDel | 0.5° | Monthly | Global land | 1979–2015 | [49] |
| TRMM | 0.25° | Monthly | Global land | 2003–2017 | [53] |
| GSMap | 0.1° | Monthly | Global land | 2003–2017 | [59] |
| CHIRPS | 0.05° | Monthly | Global land | 2003–2017 | [58] |
| PERSIANN-CDR | 0.25° | Monthly | Global land | 2003–2017 | [55] |
| PERSIANN-CCS | 0.04° | Monthly | Global land | 2003–2017 | [57] |
3.3. Descriptive Methods
4. Results
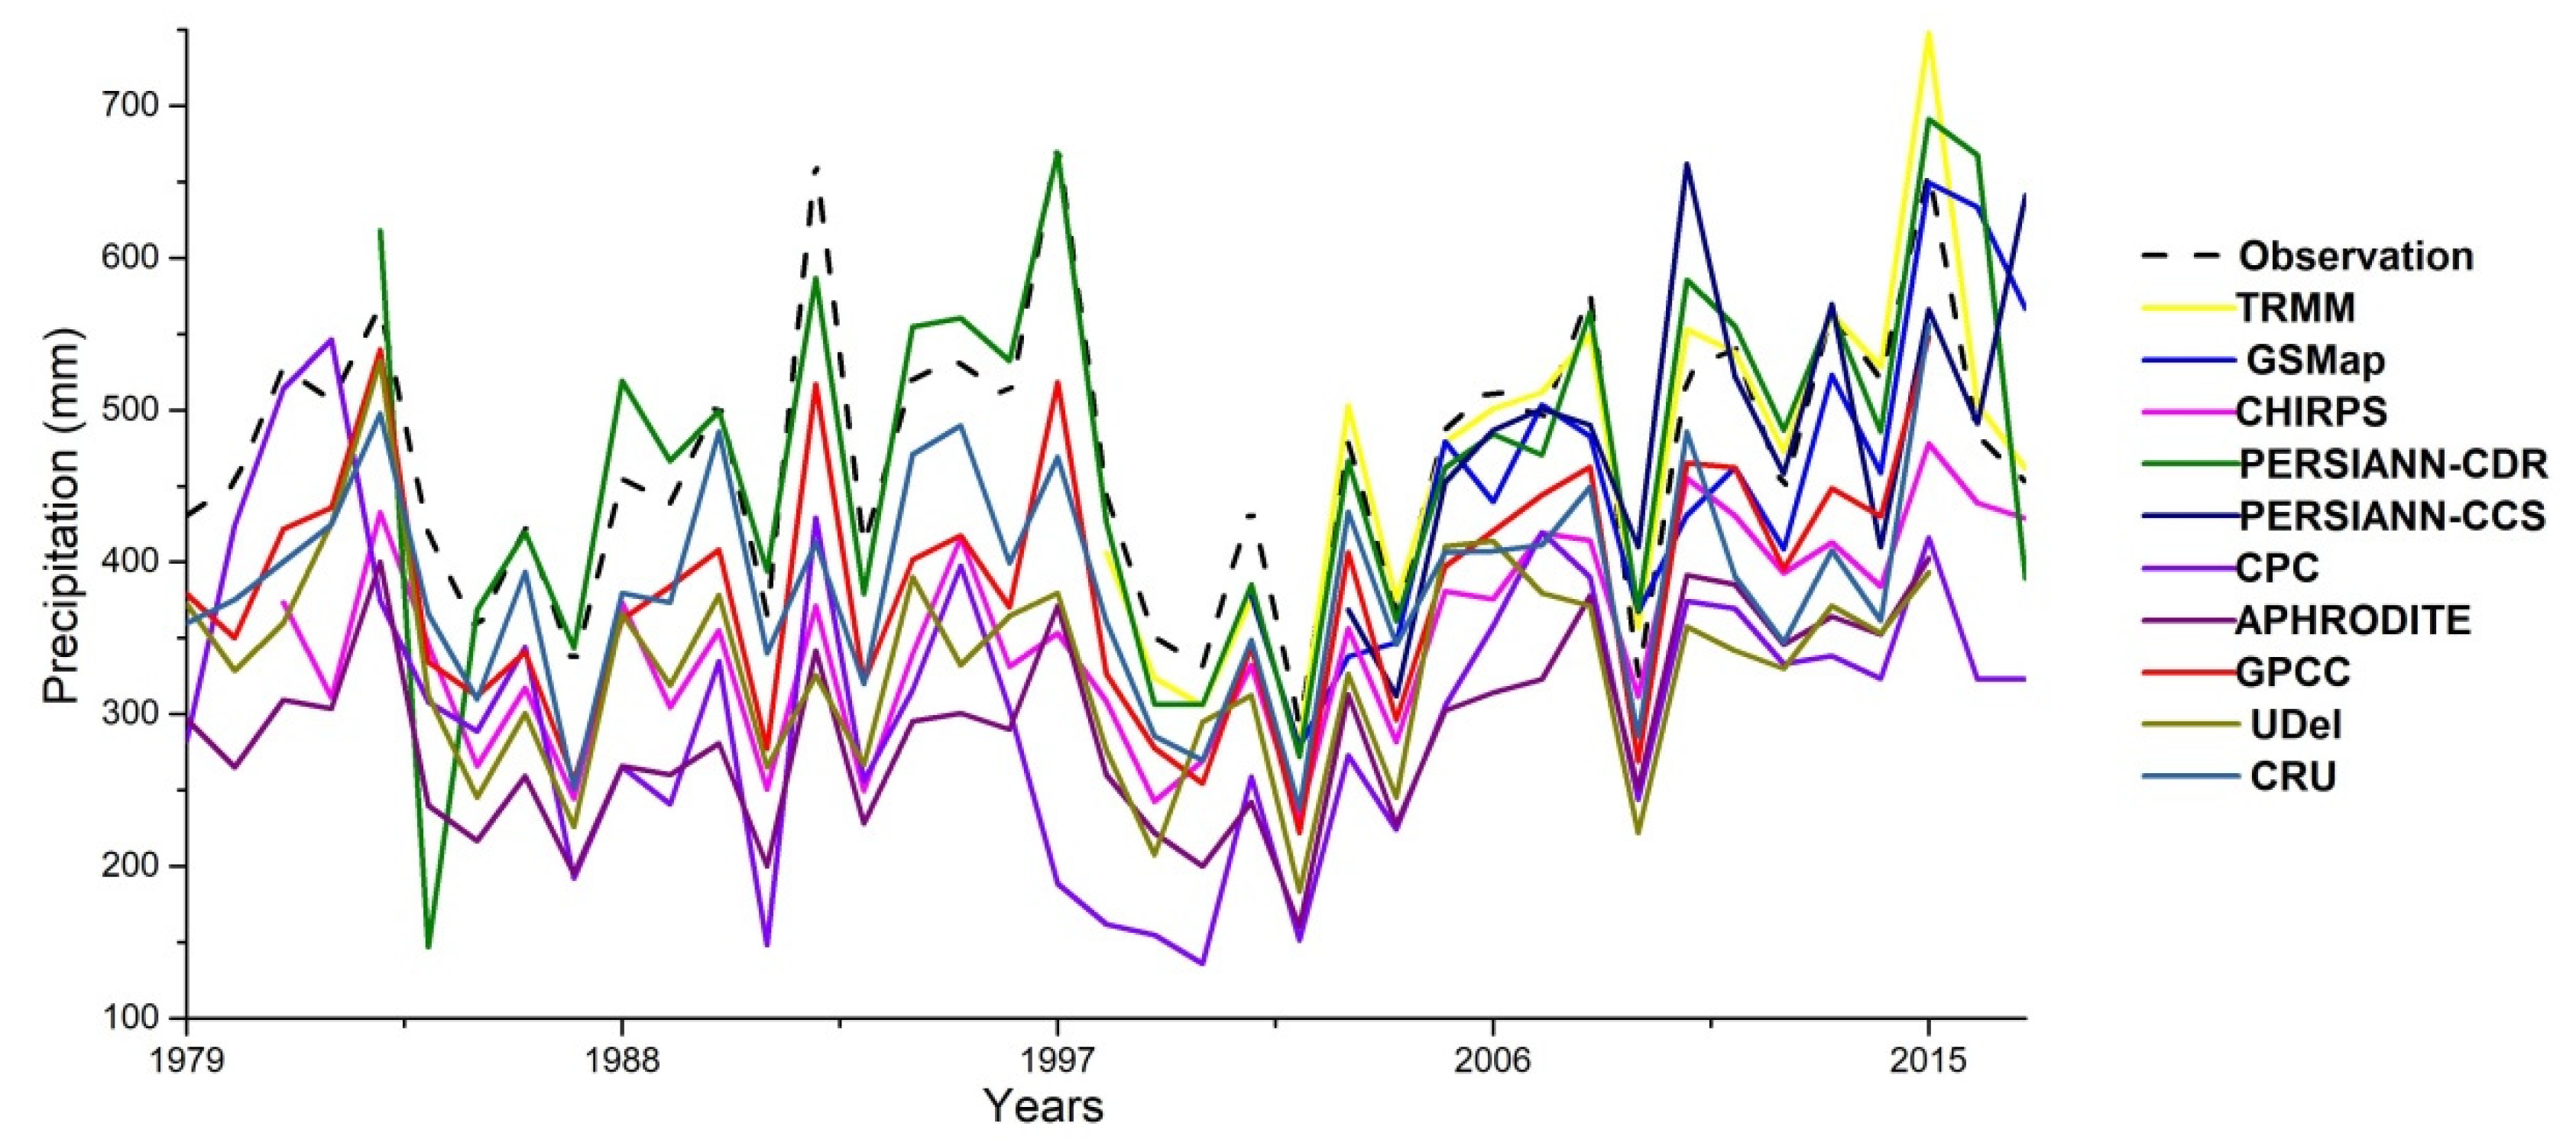
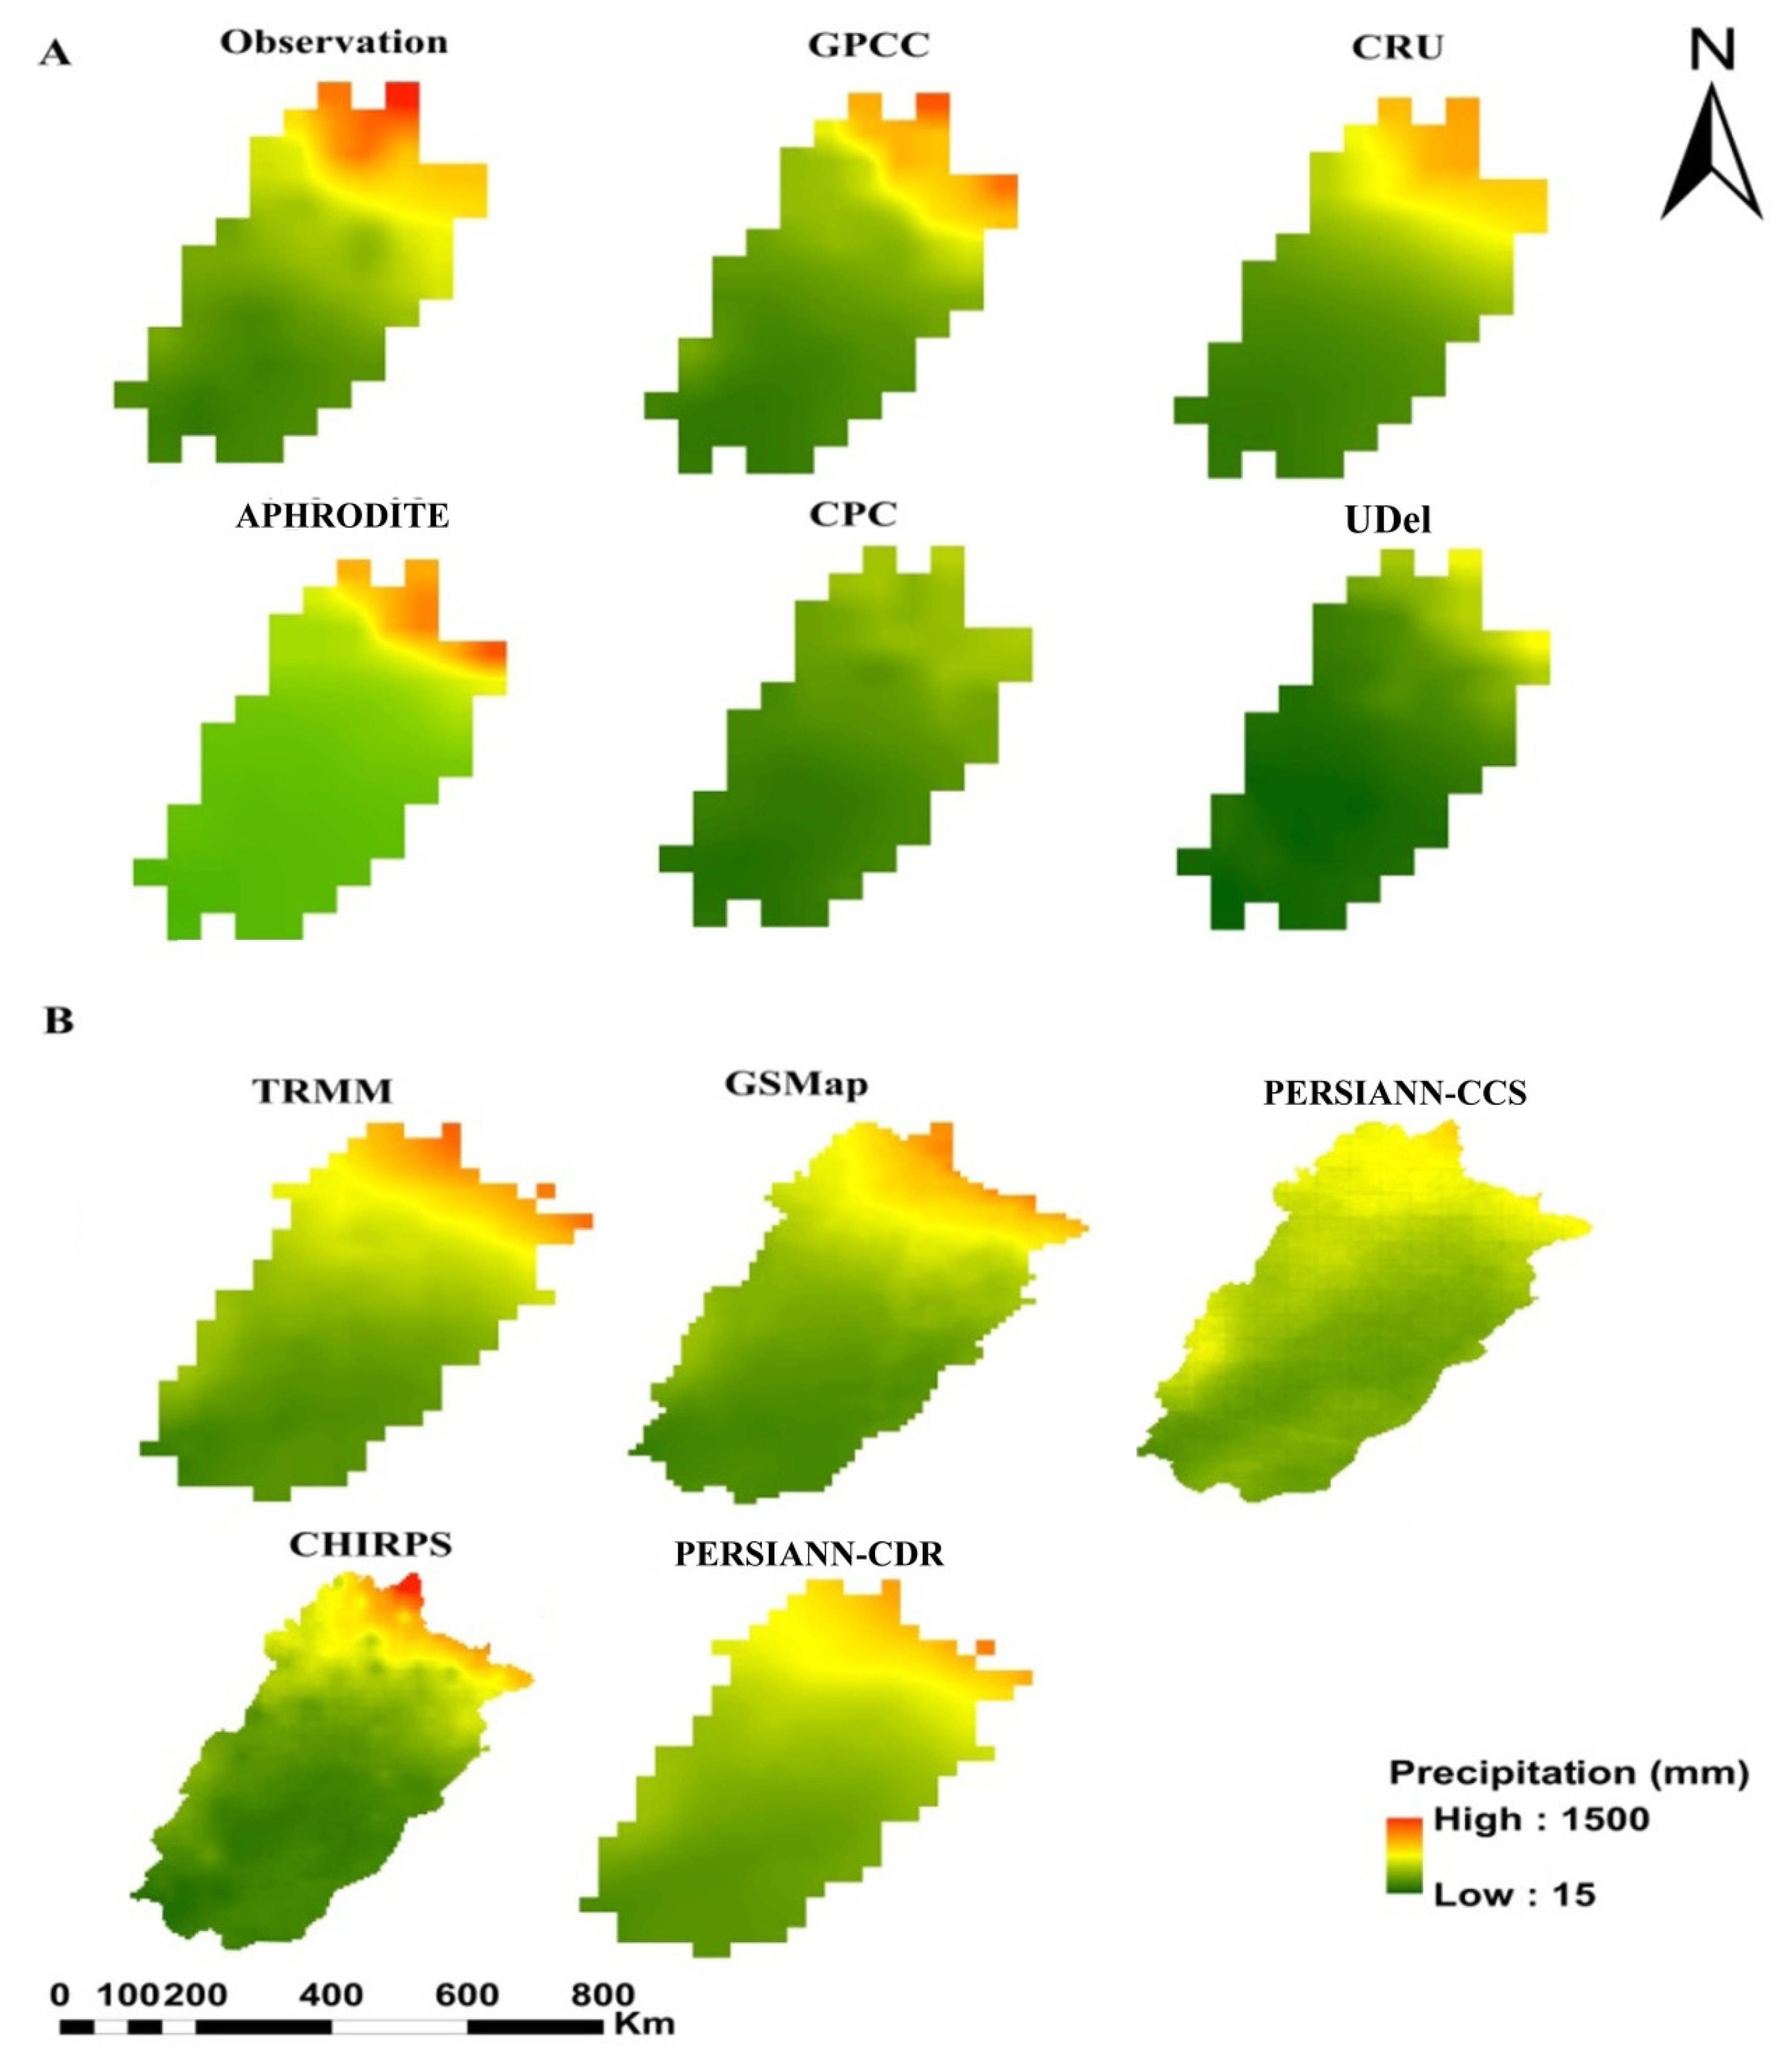
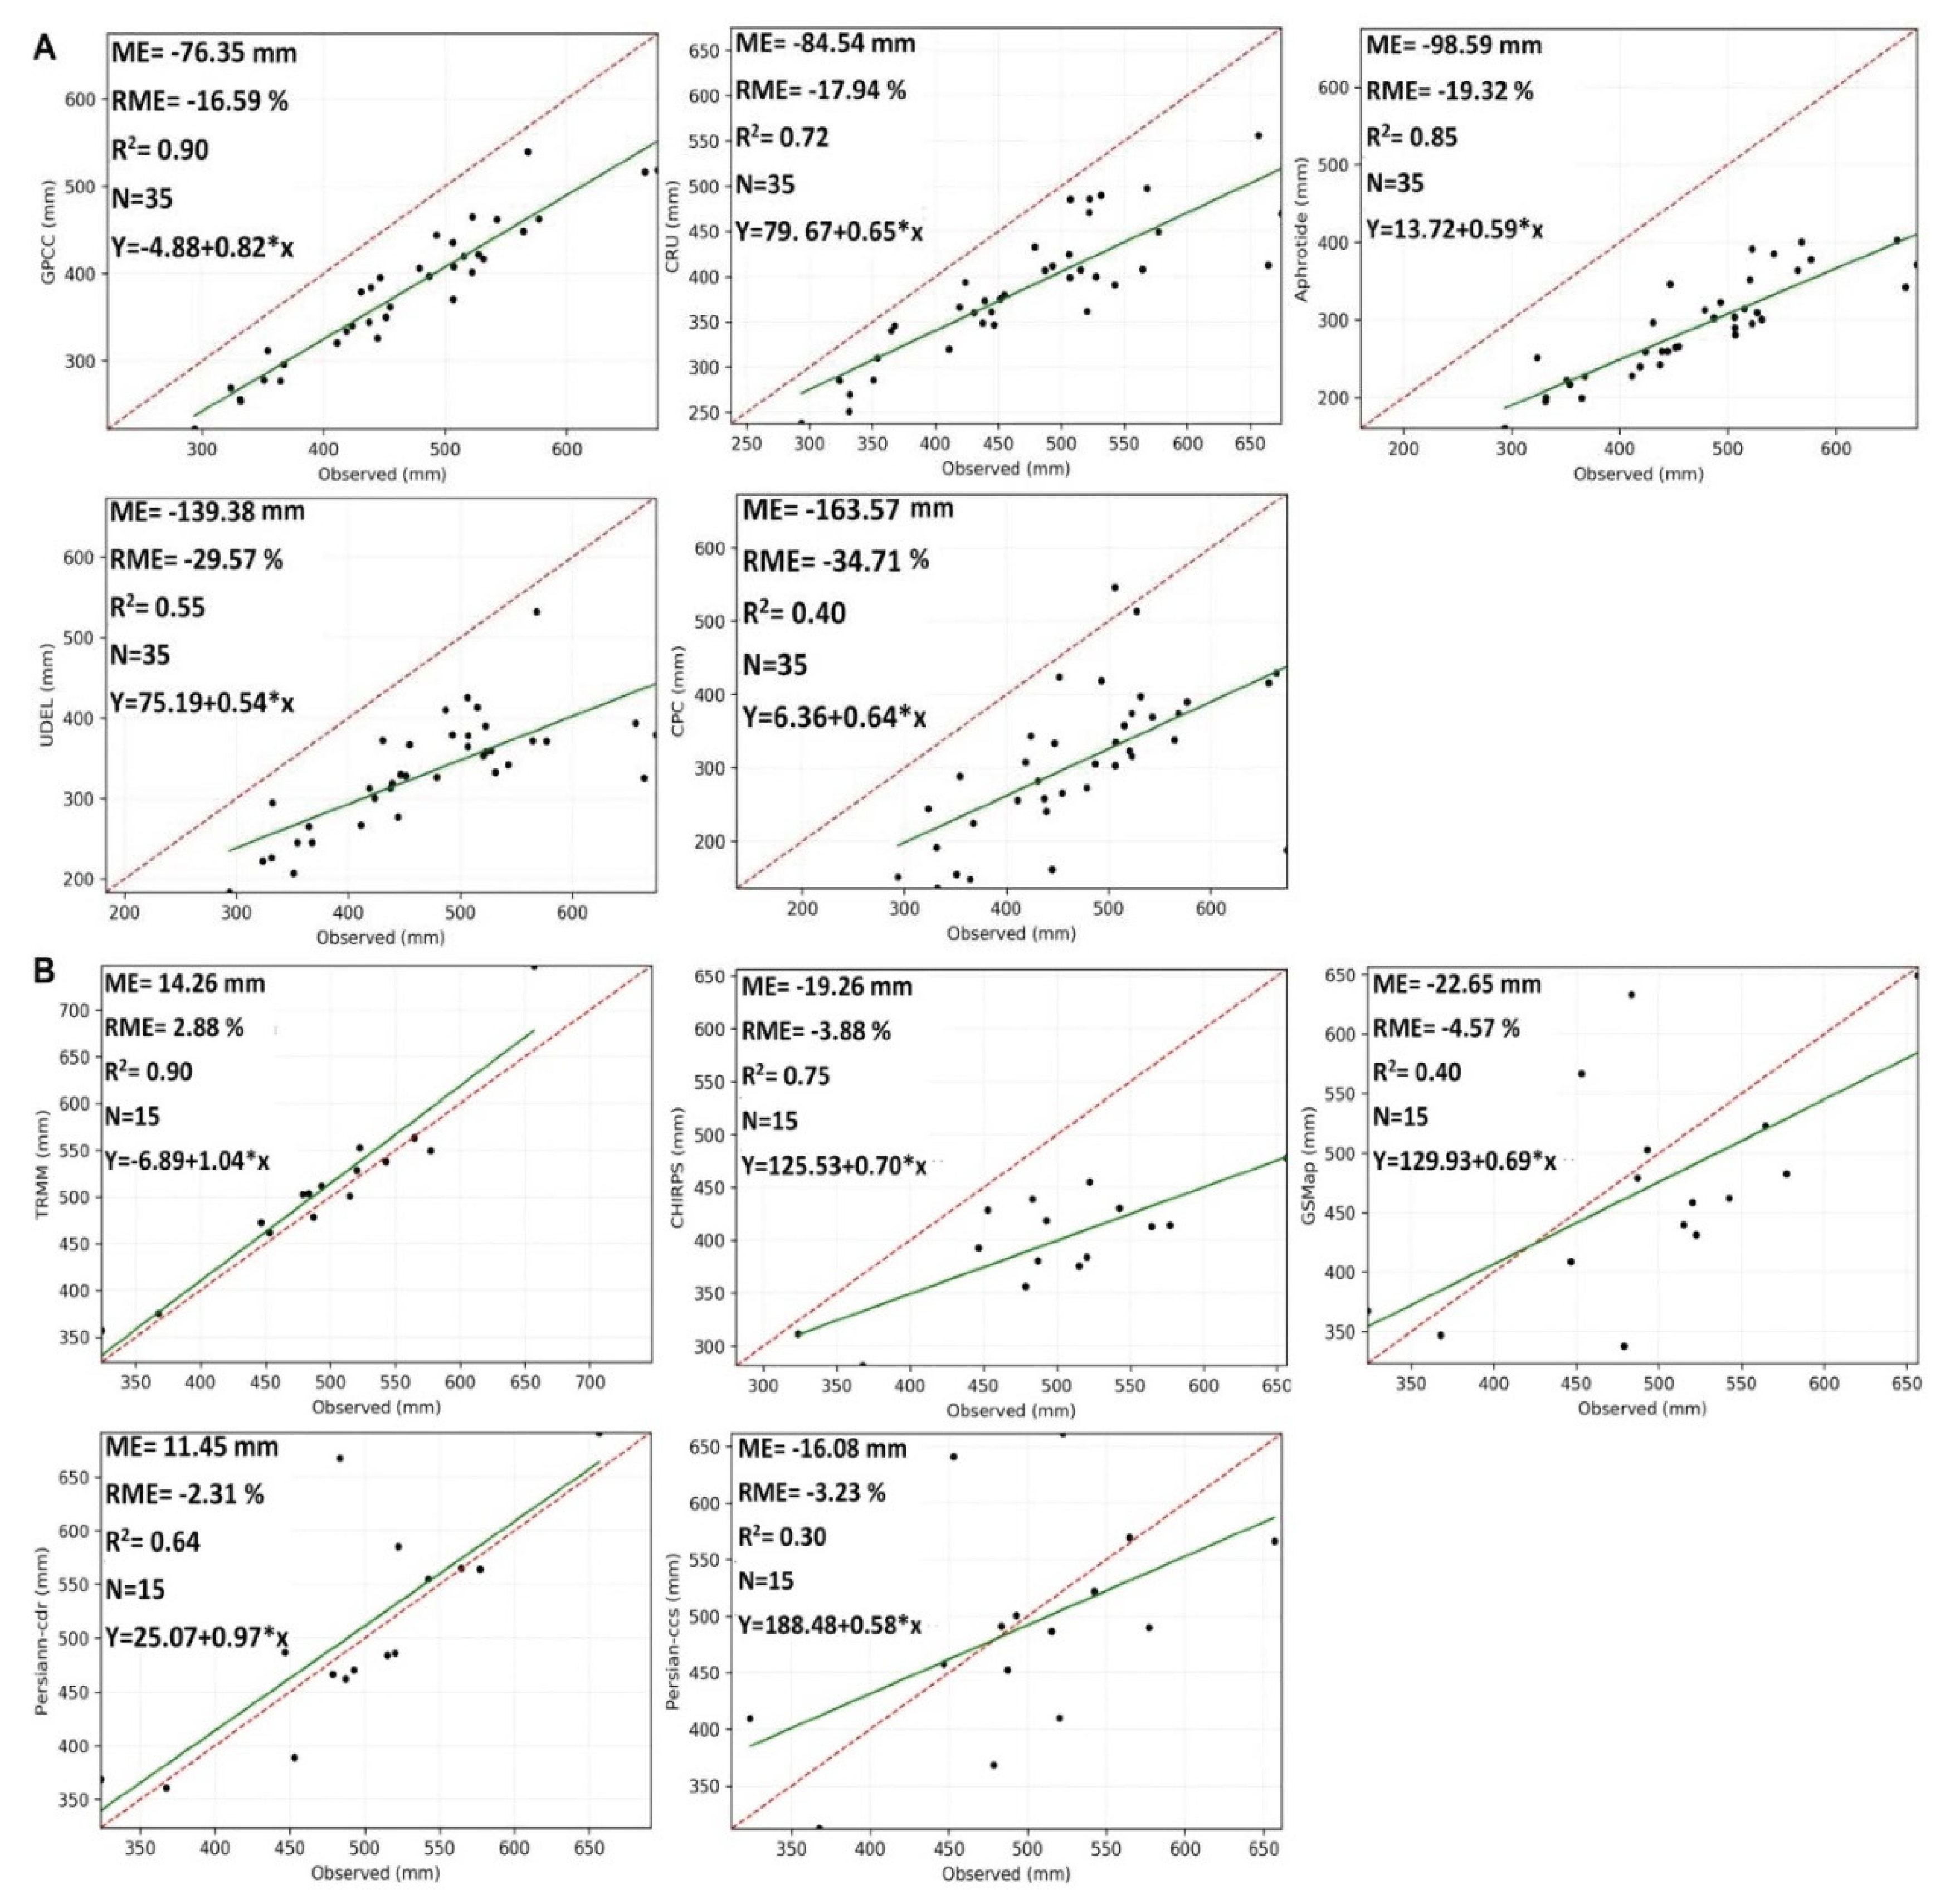
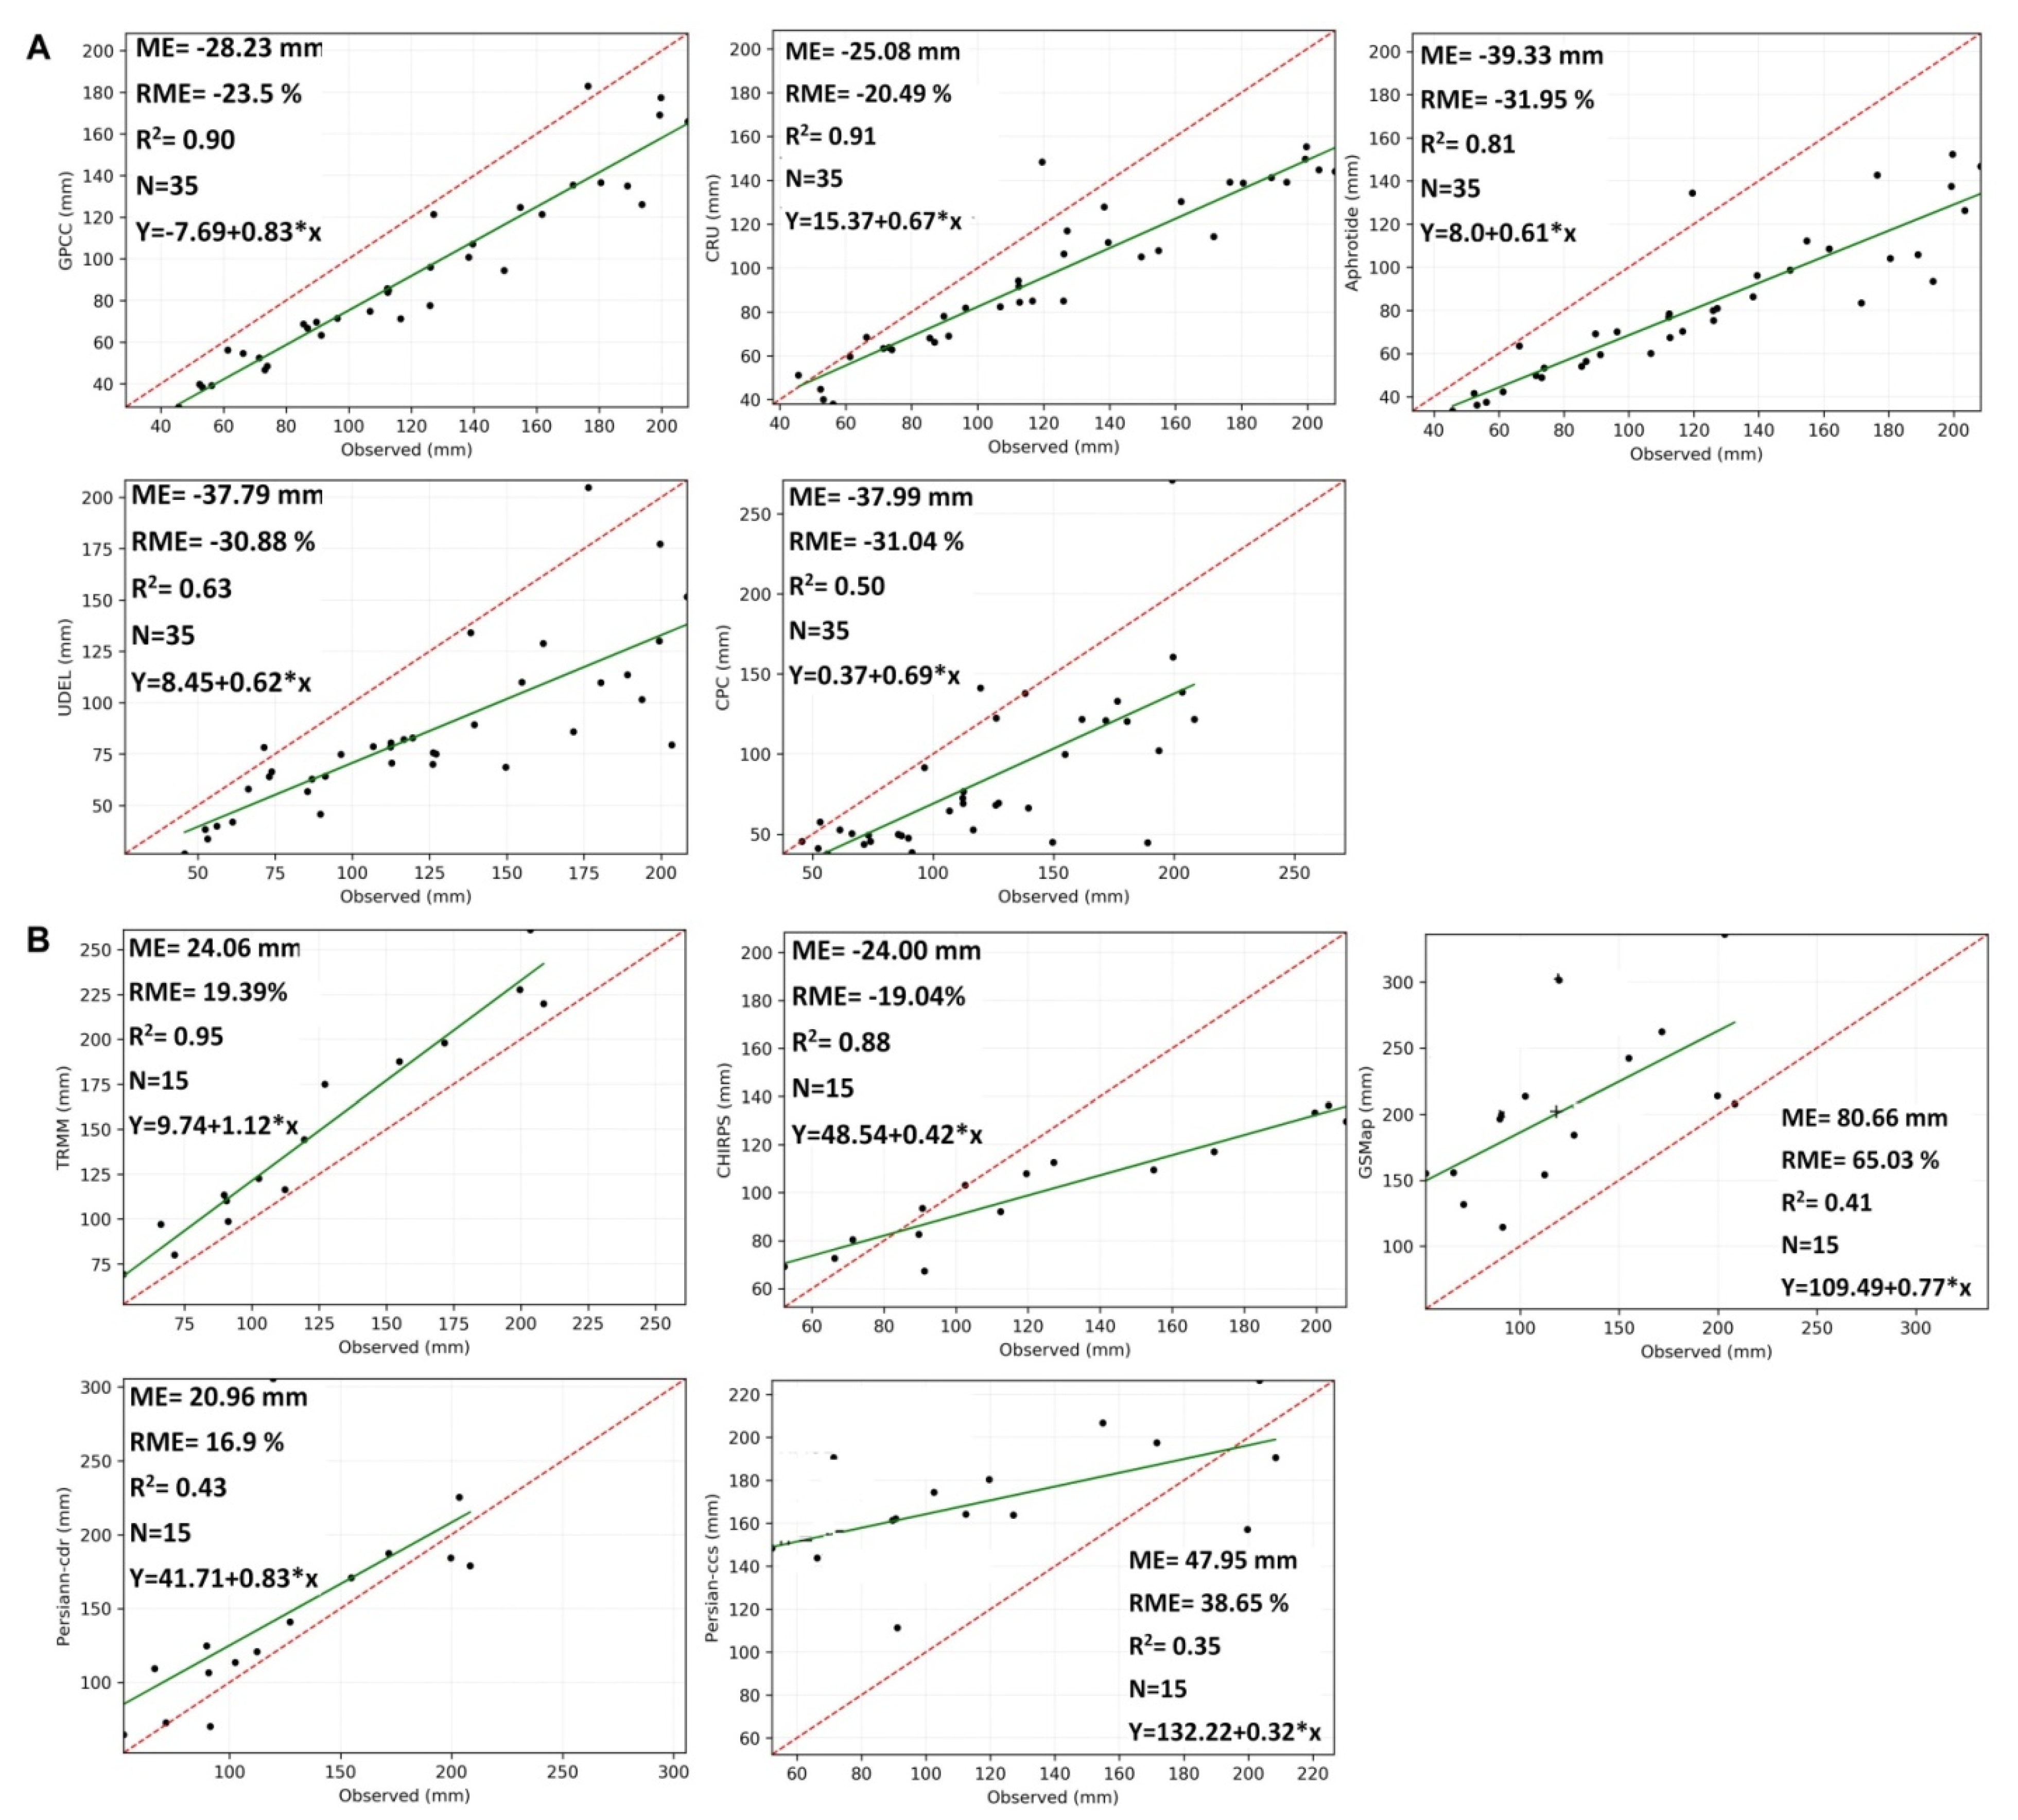
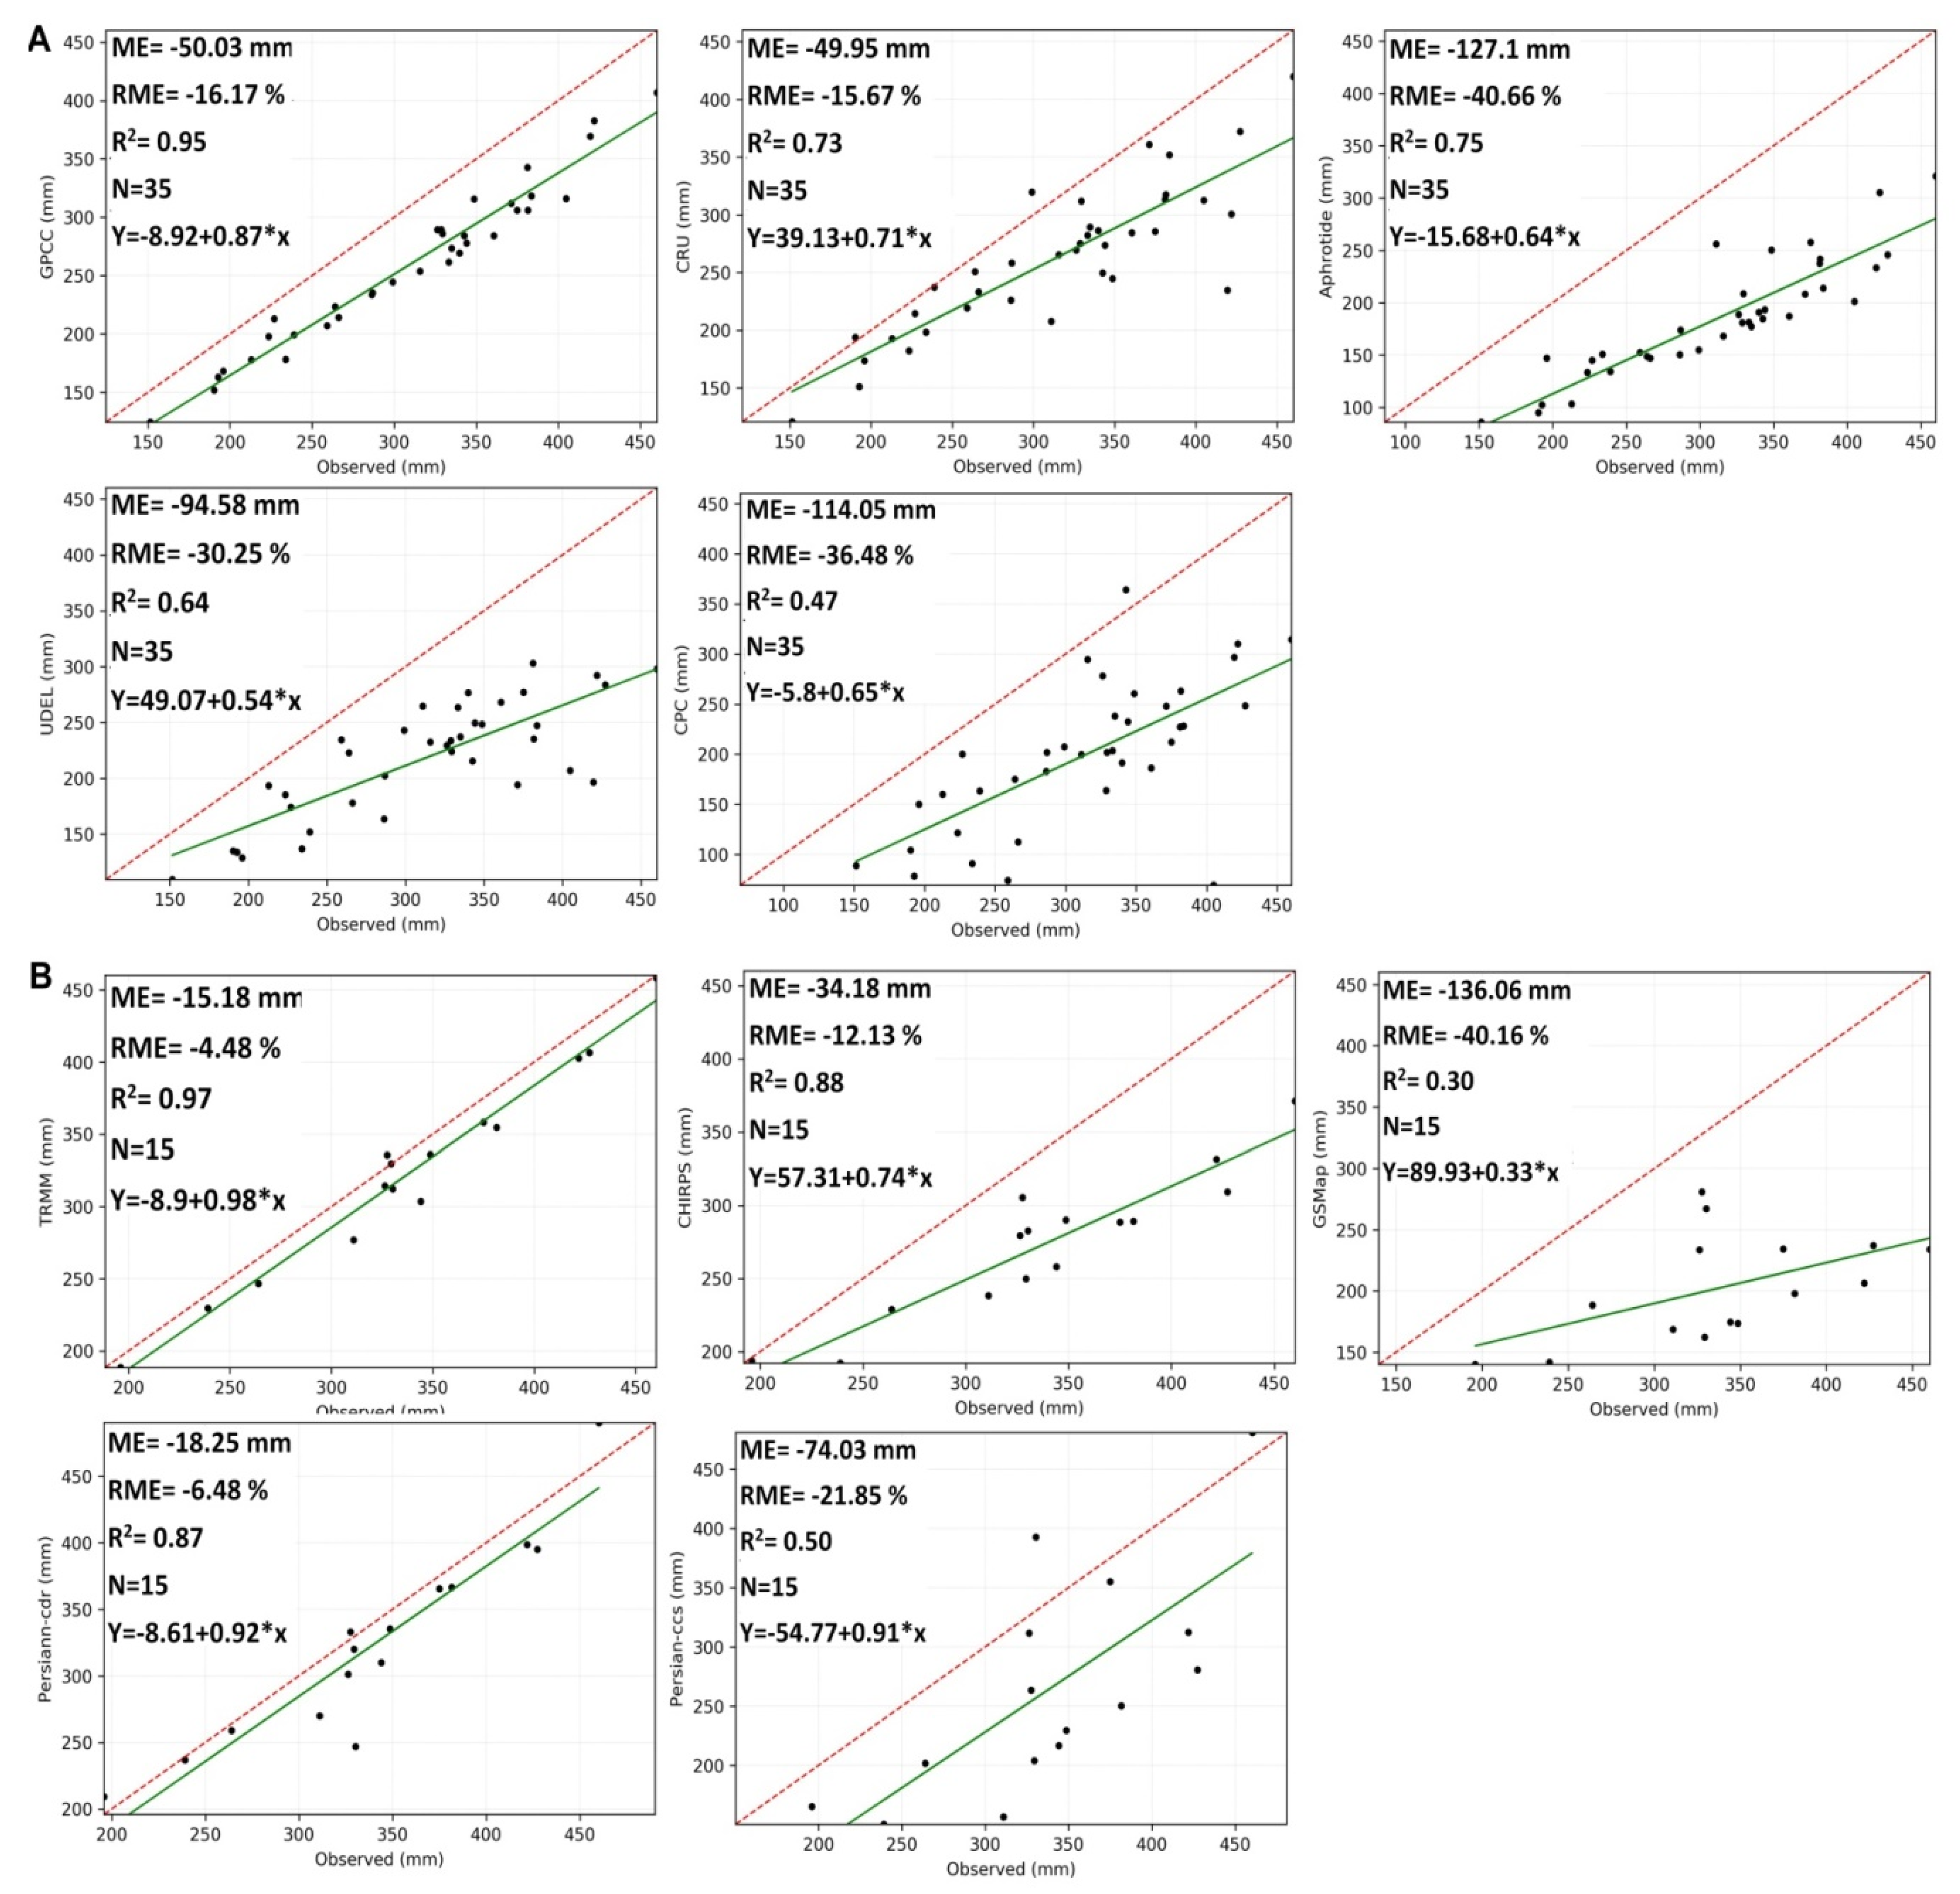
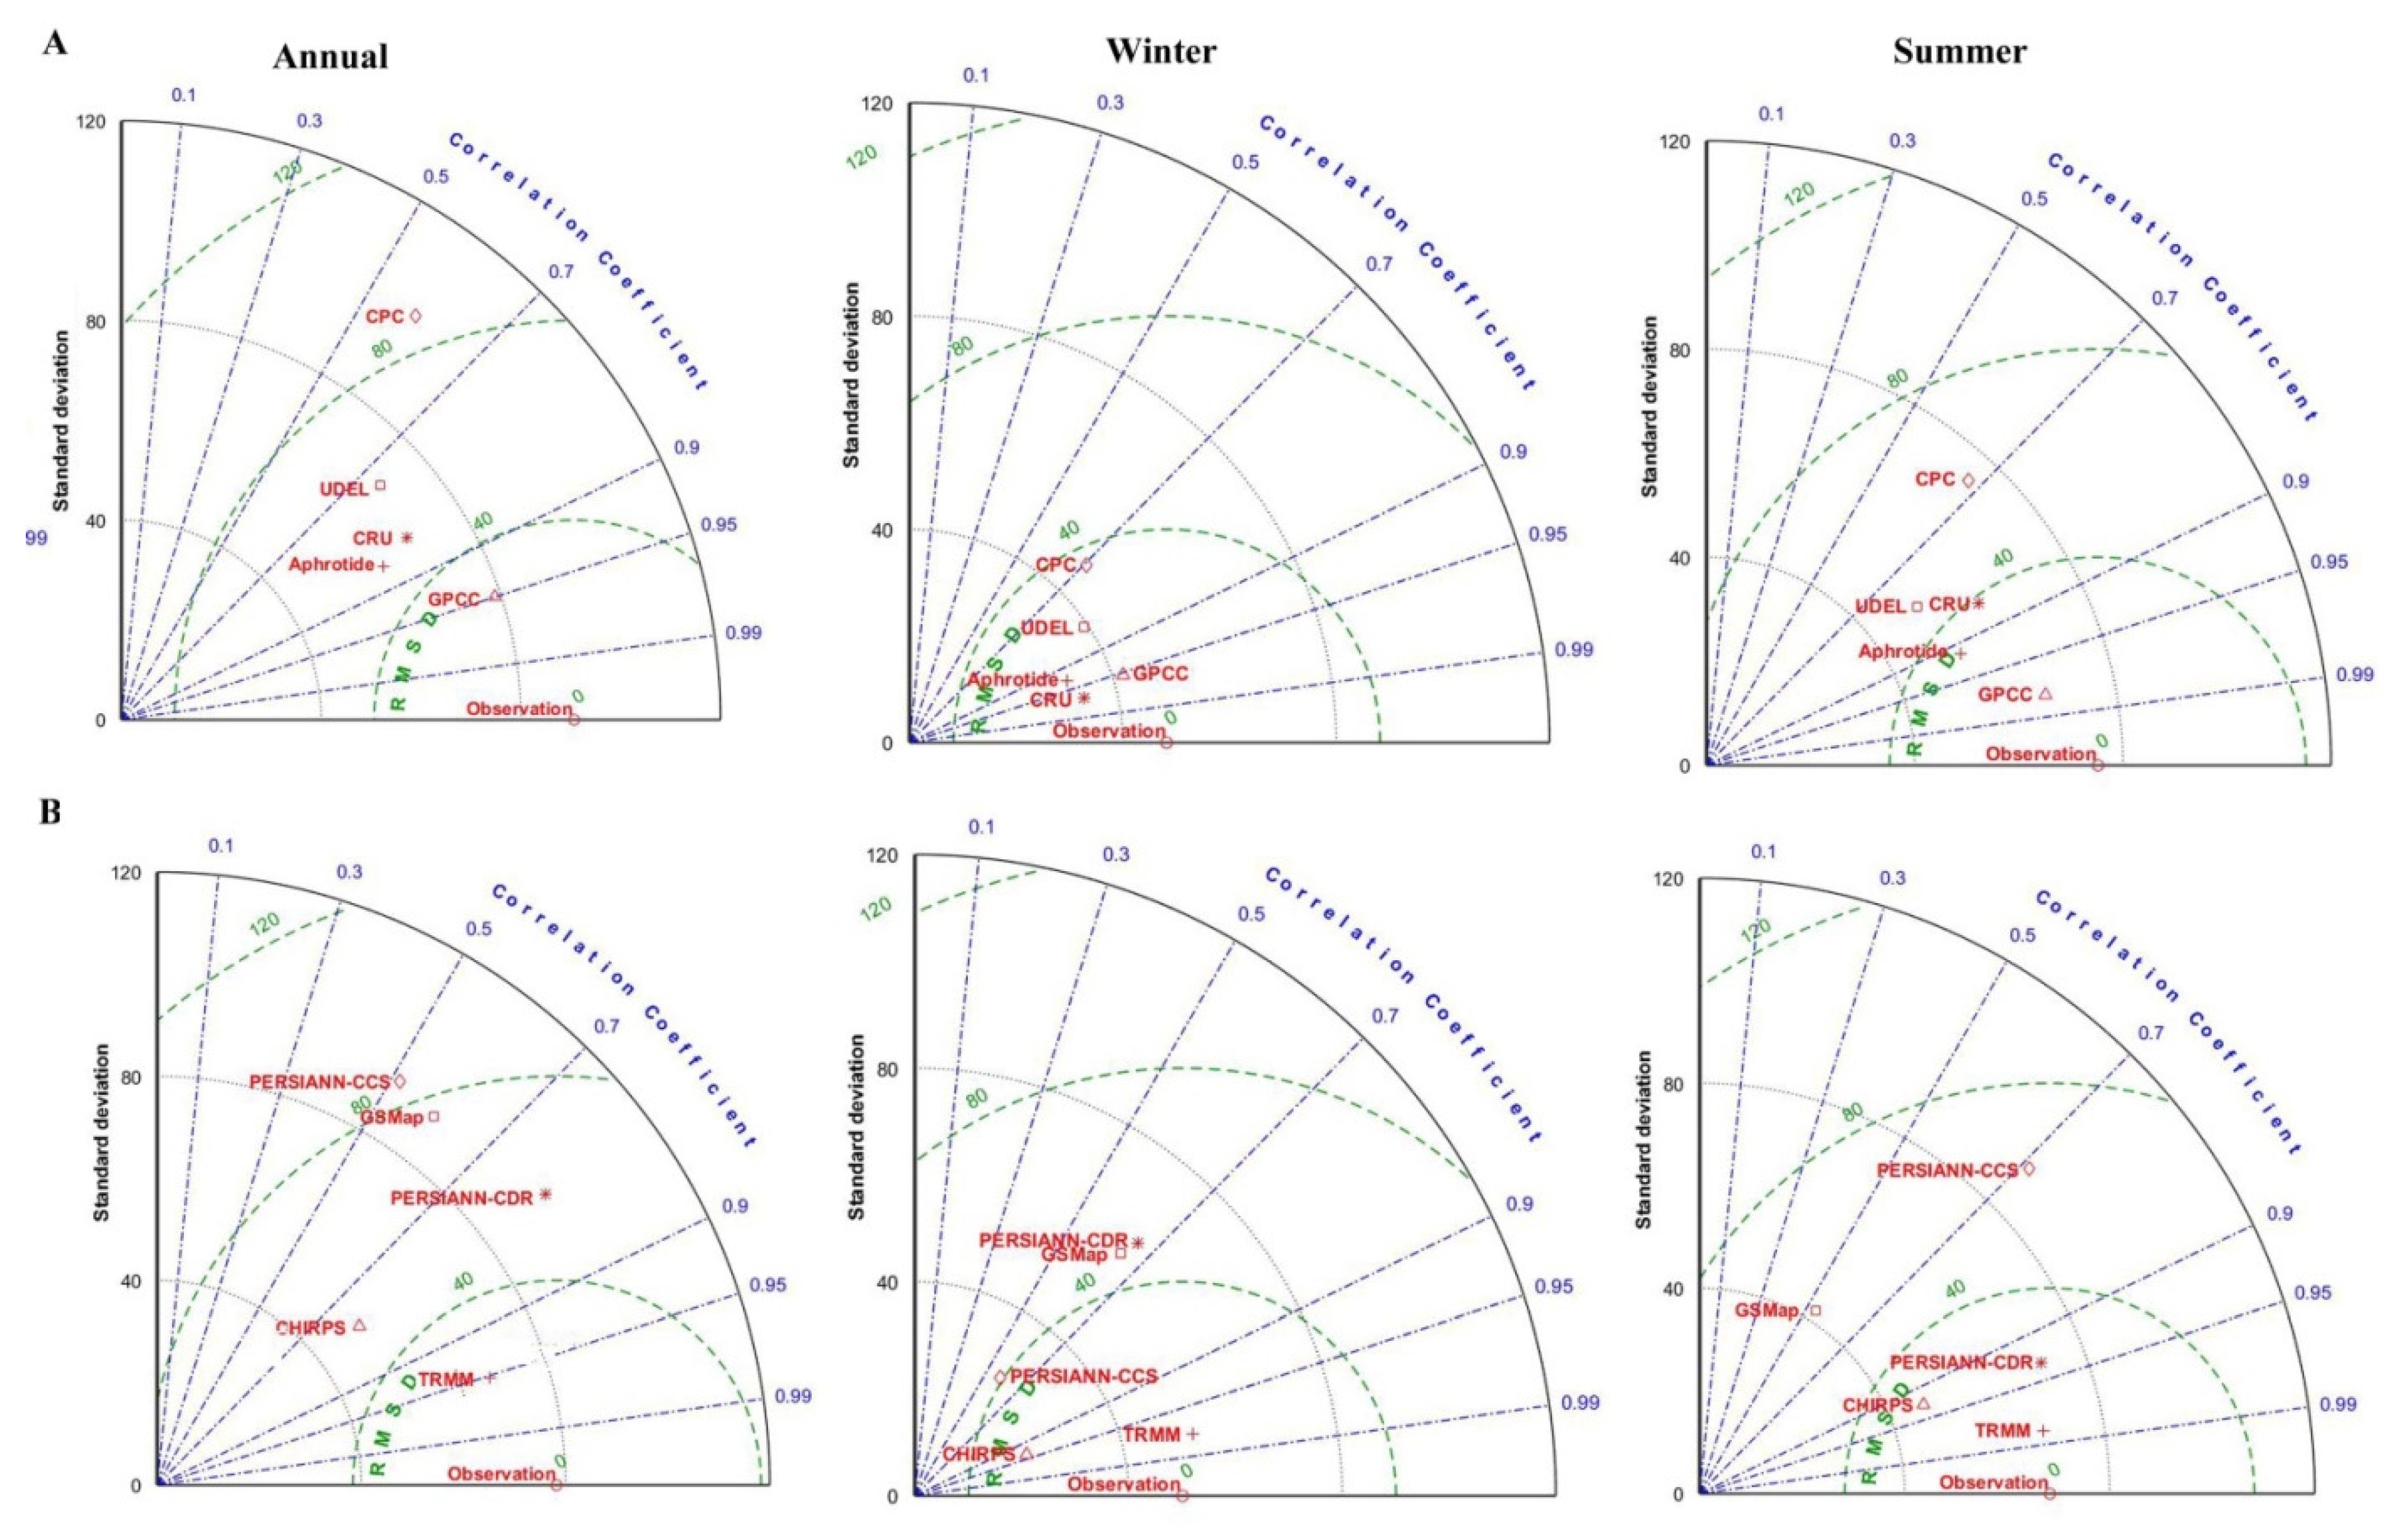
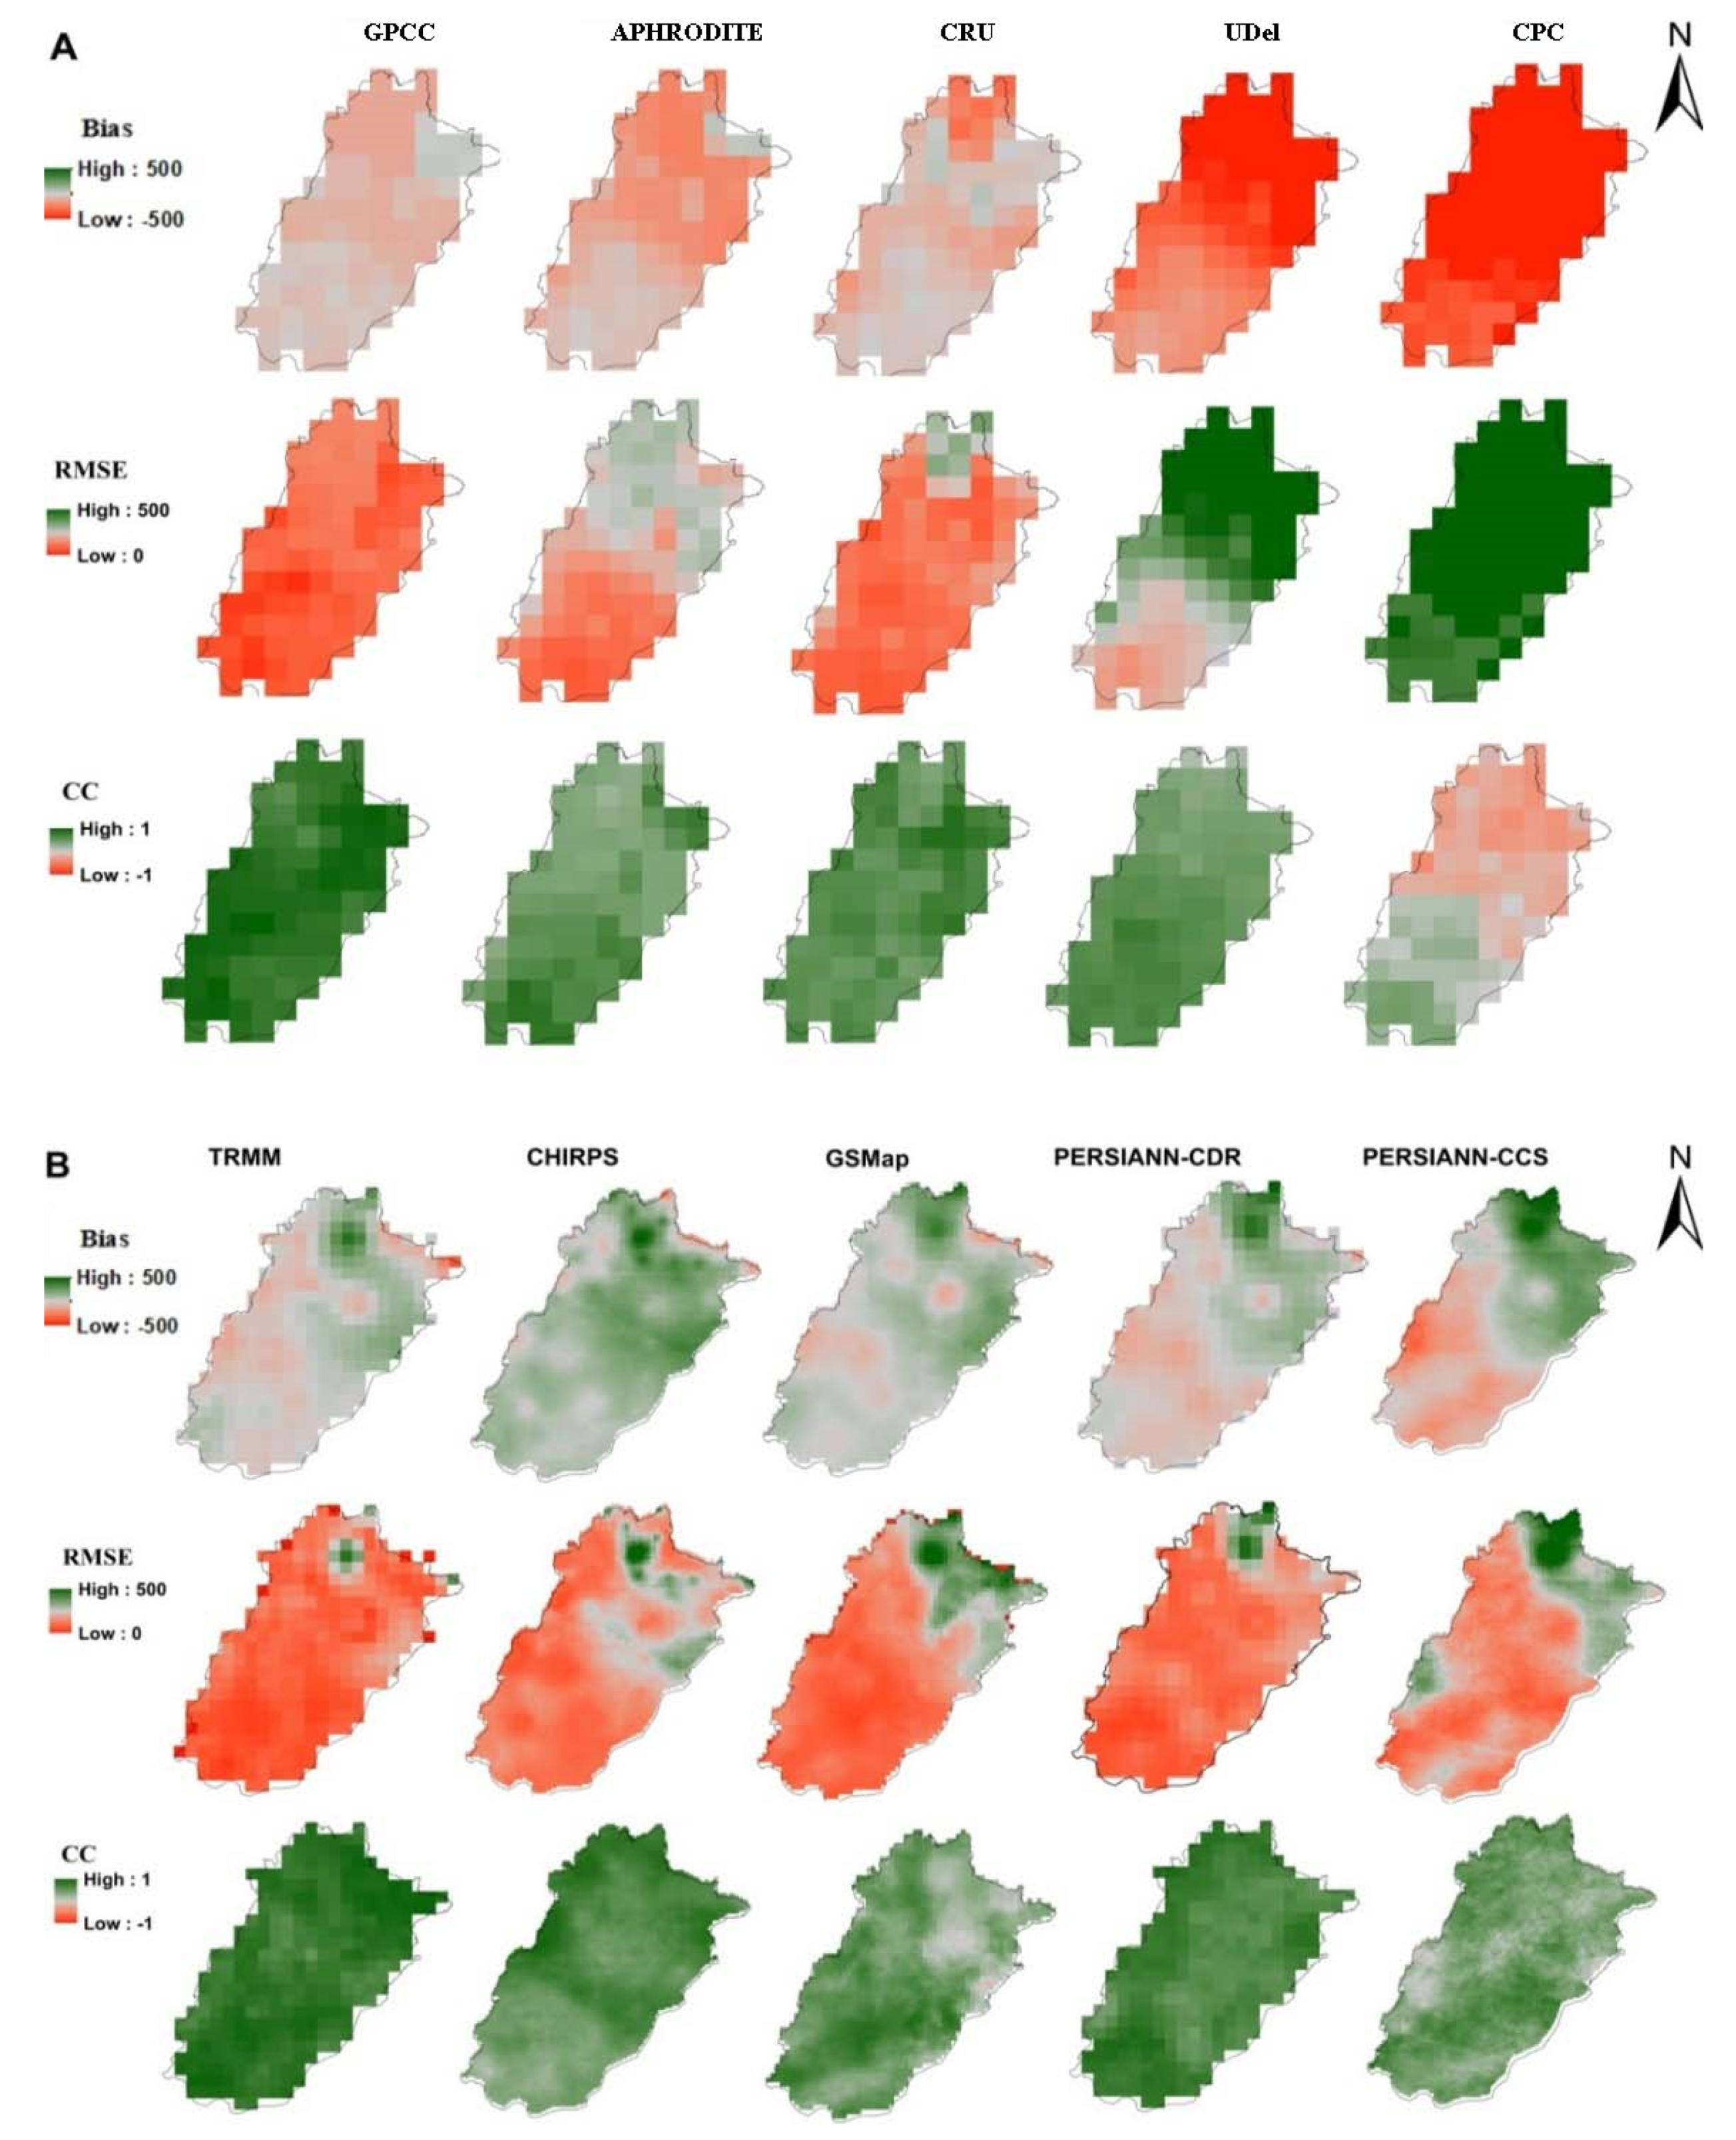
4.1. Evaluation of Temporal and Spatial Dynamics
Annual and Seasonal Scale
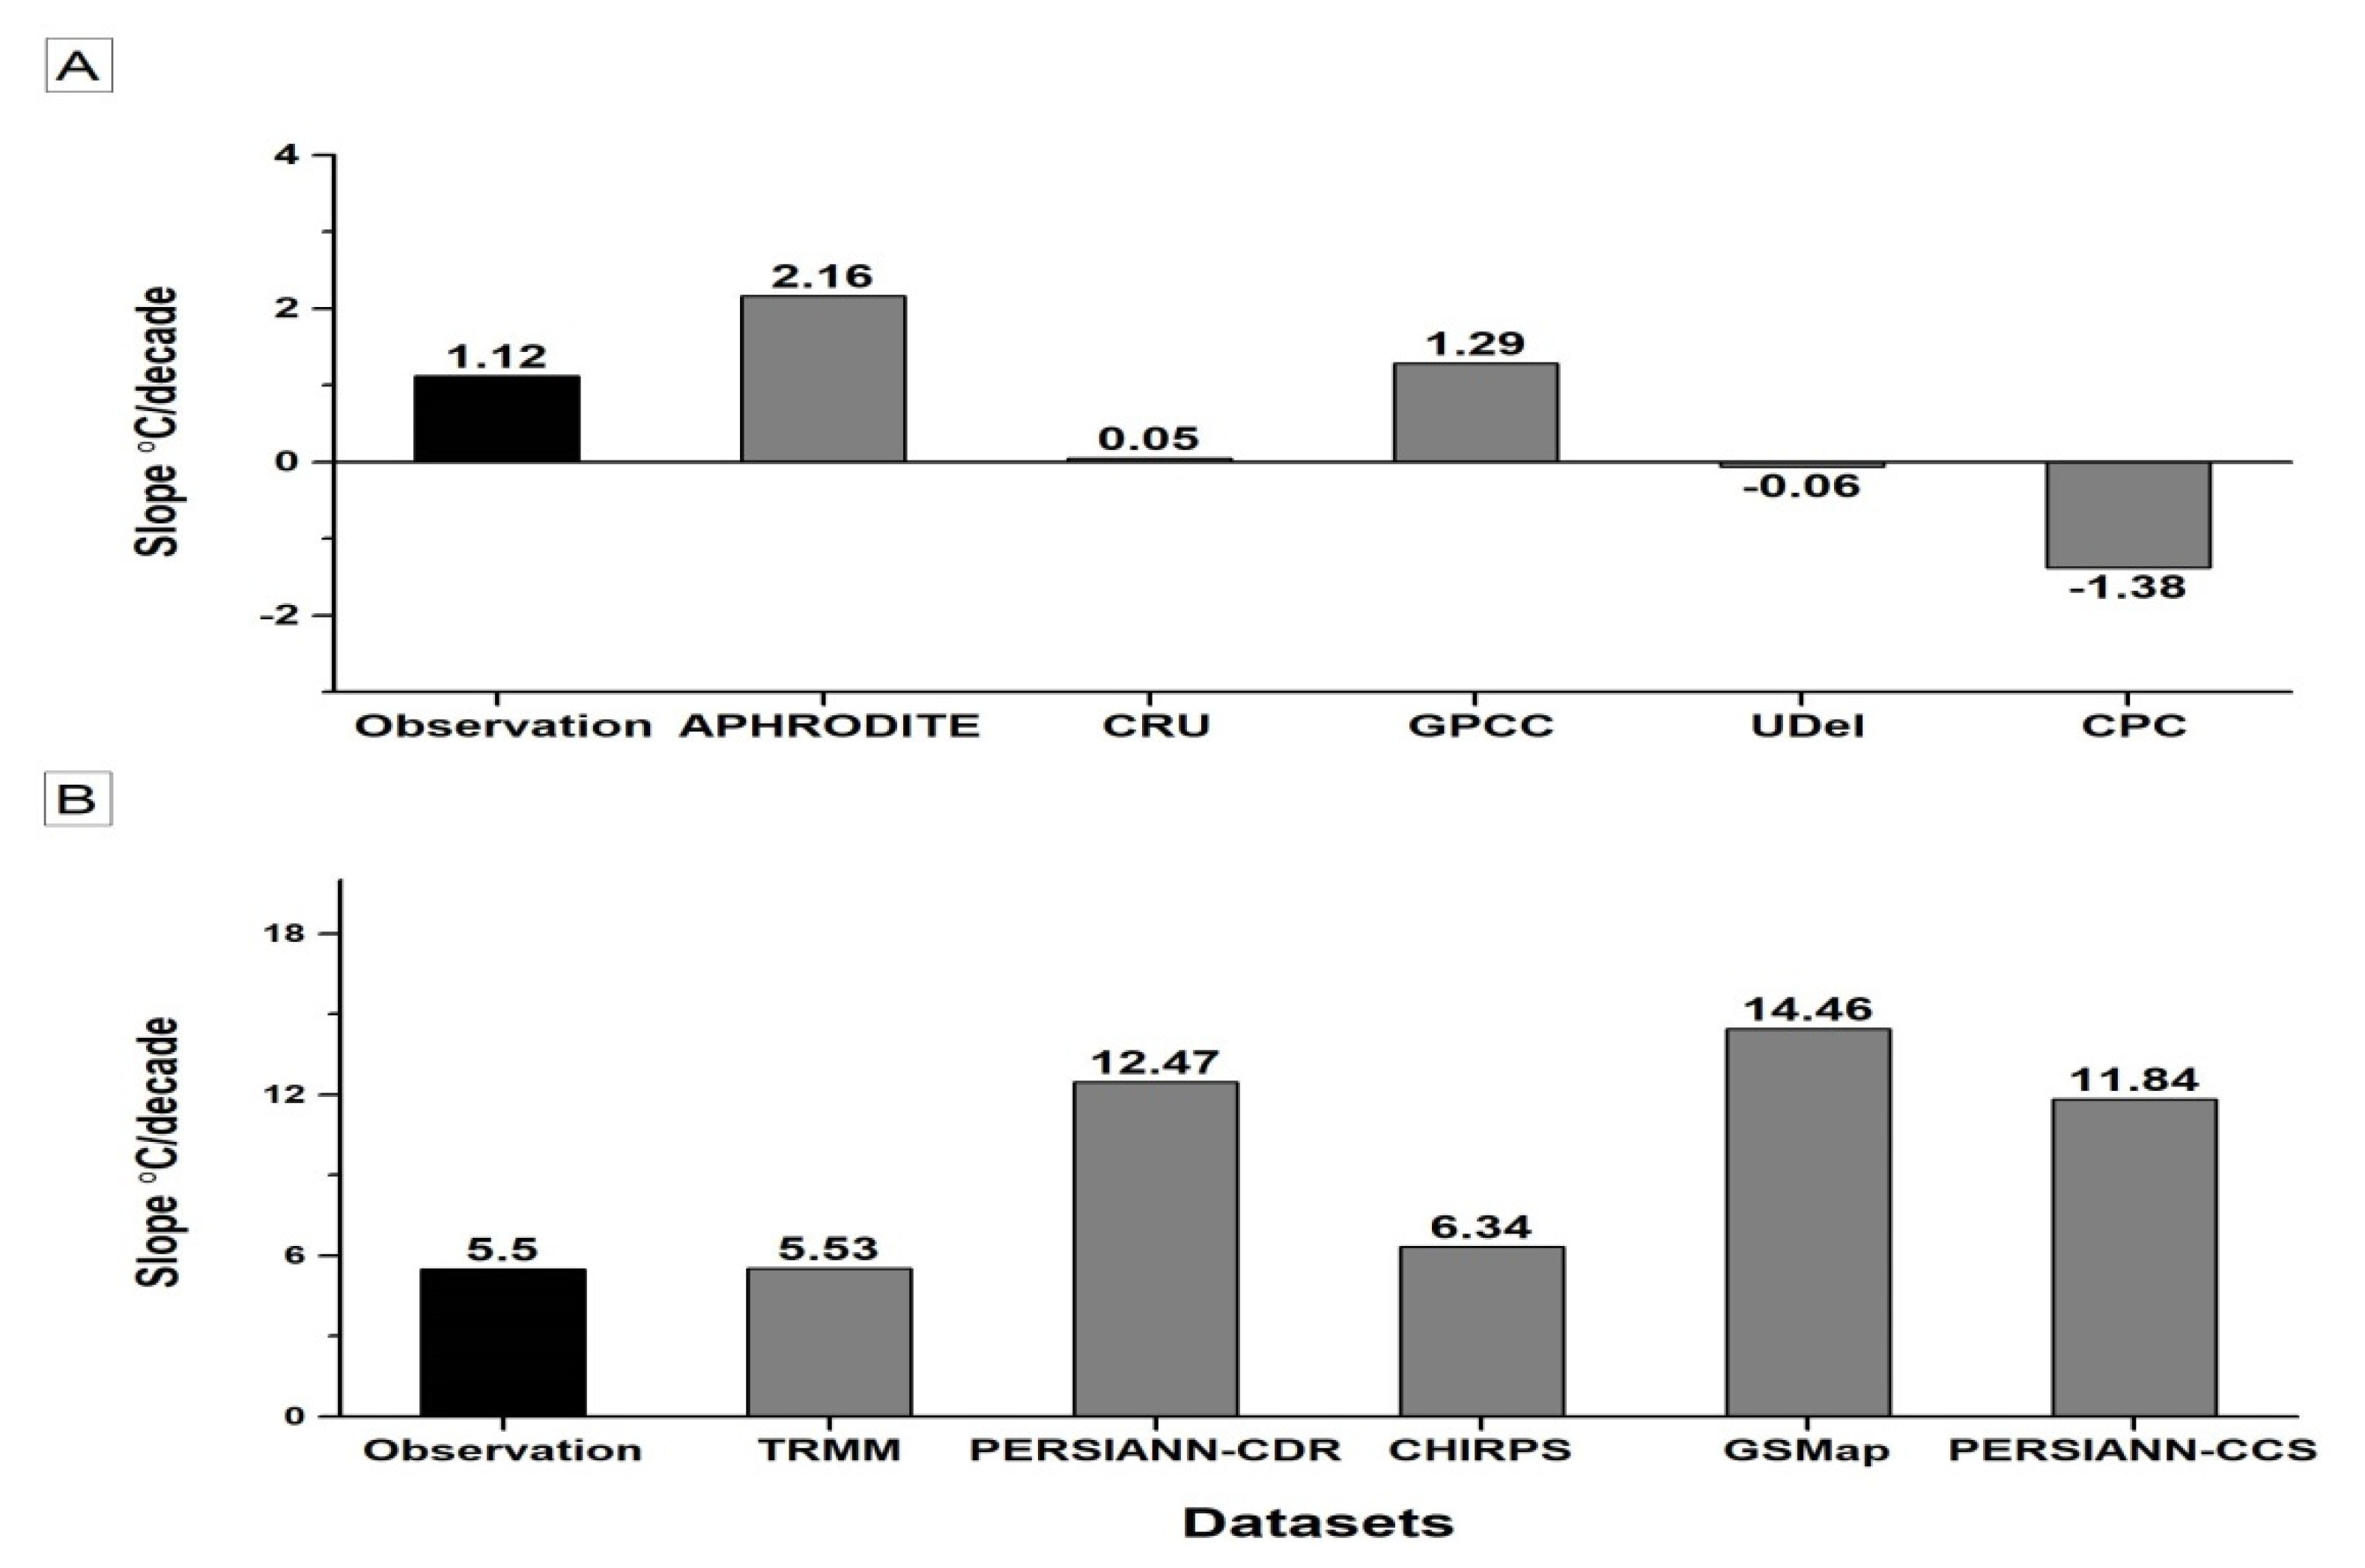
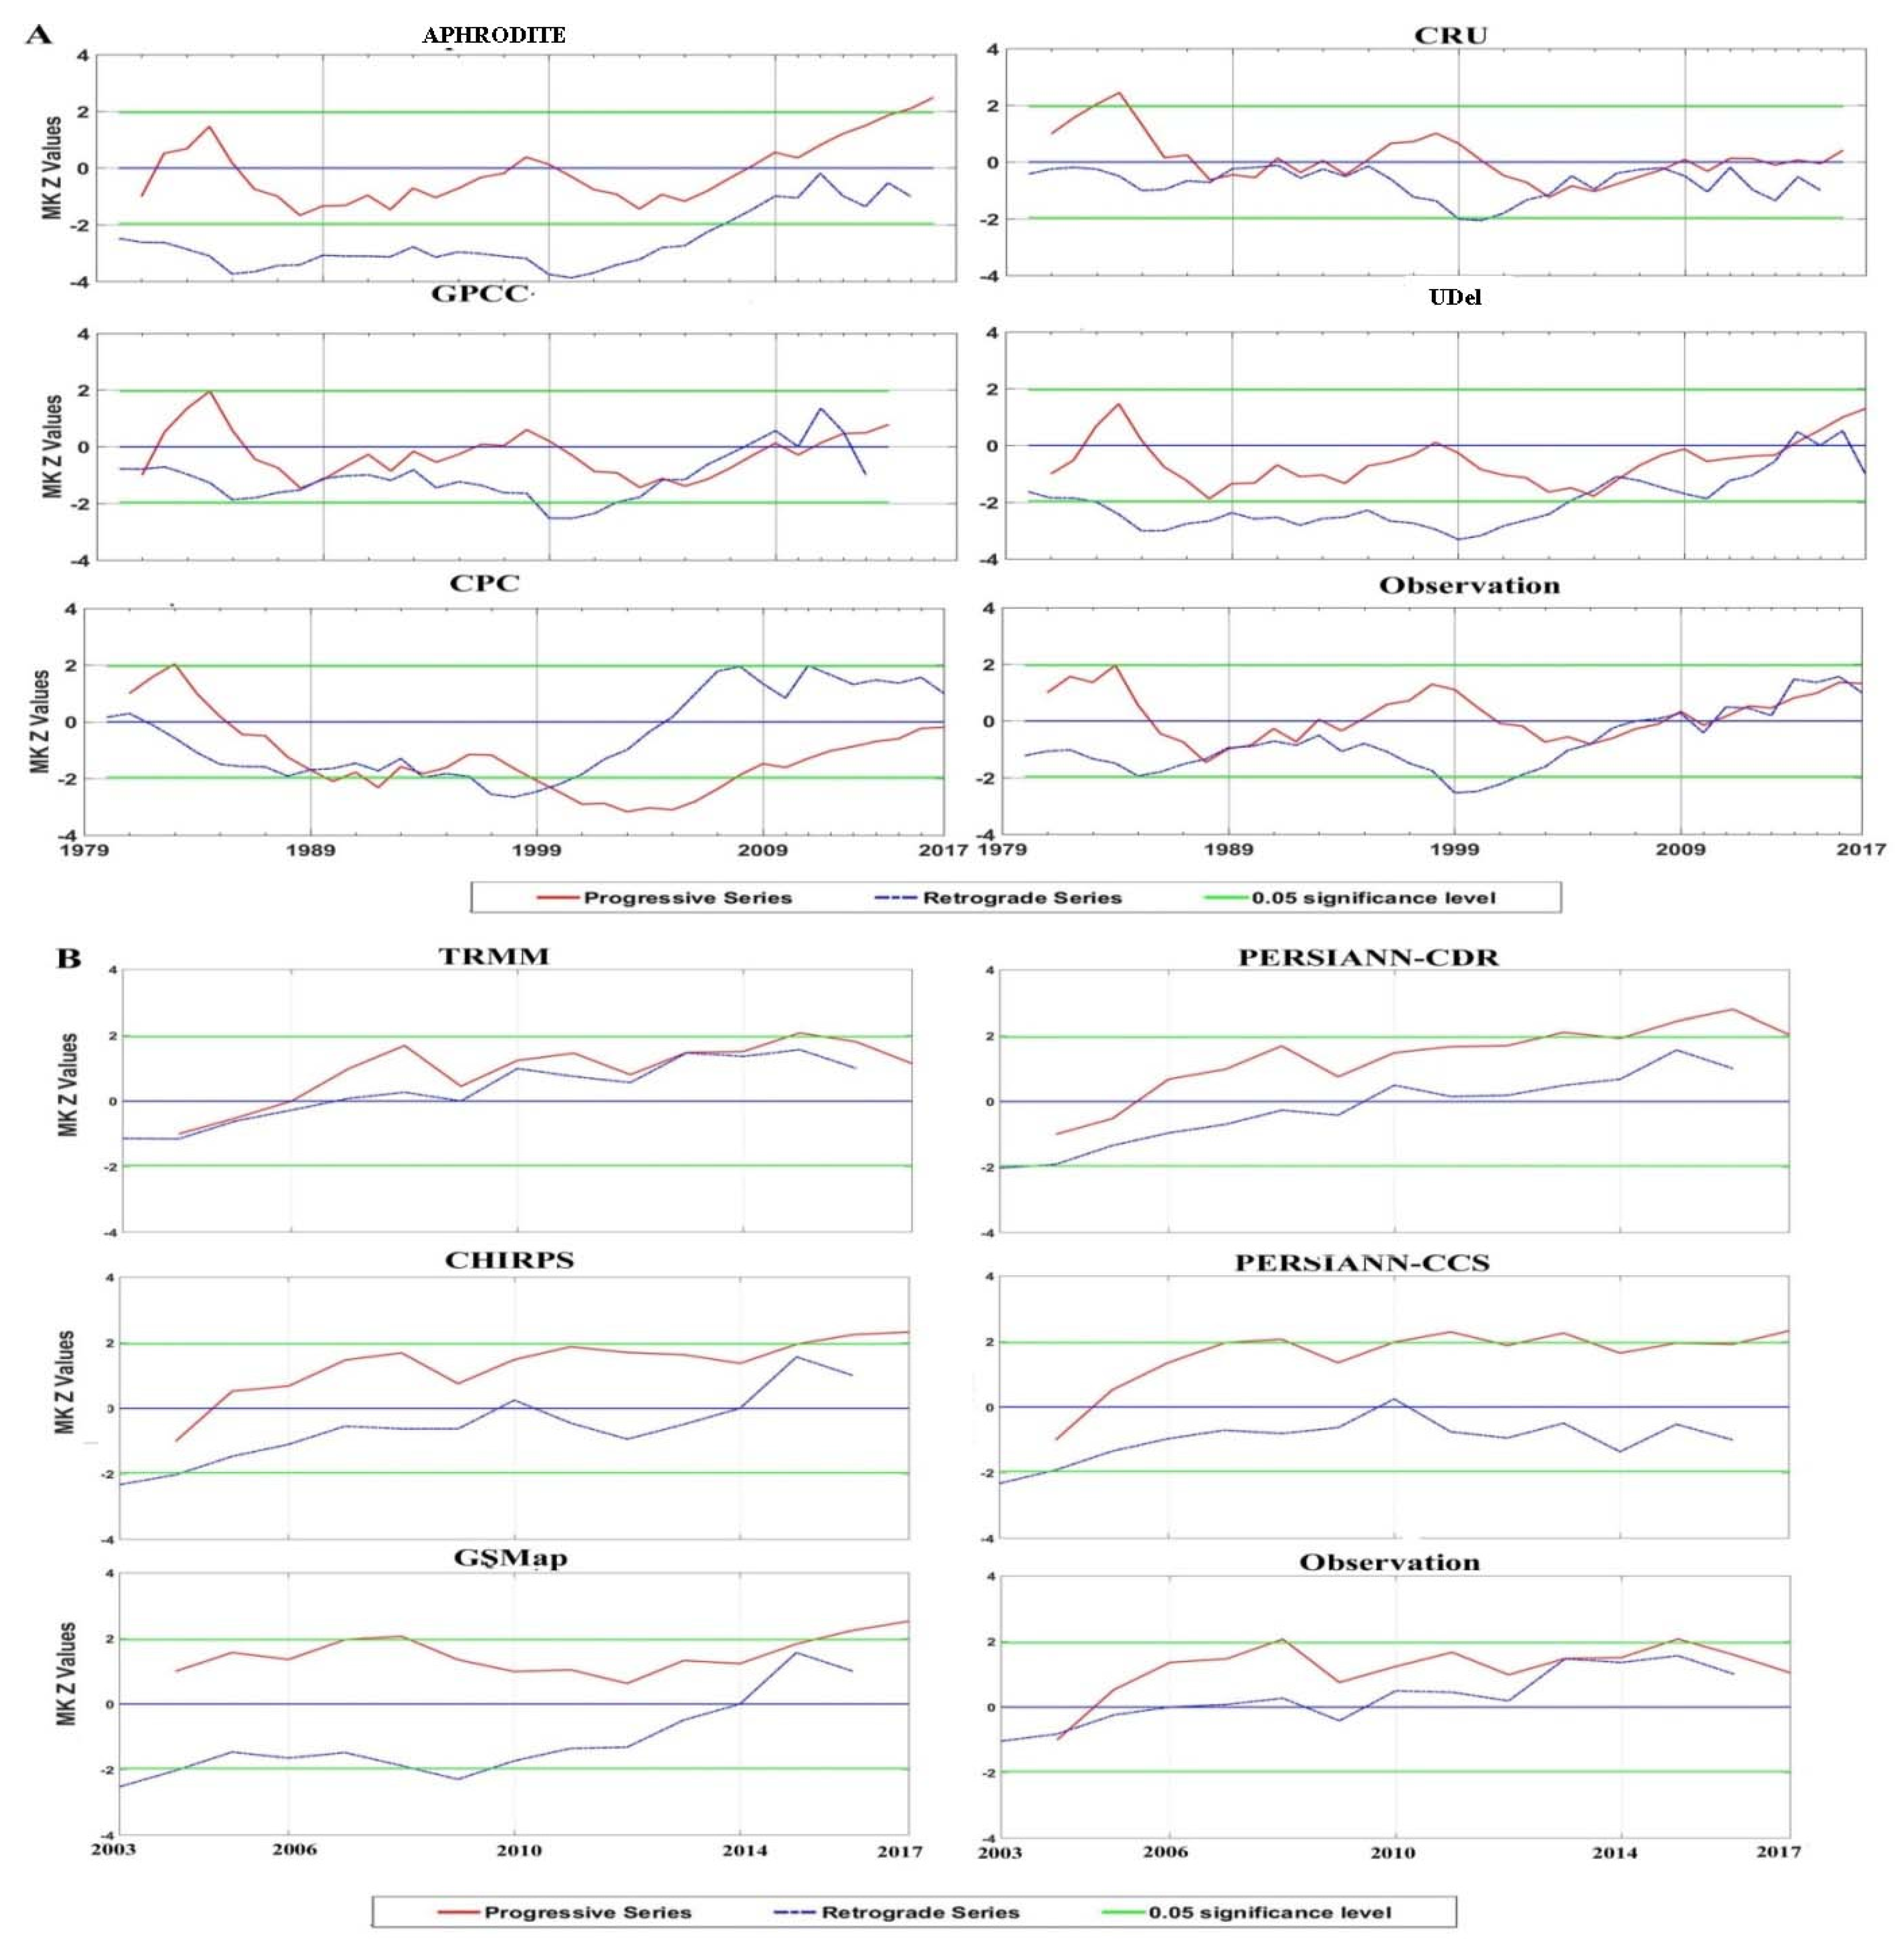
4.2. Evaluation of Changing Trends and Abrupt Transition:
5. Discussion
6. Conclusions
Author Contributions
Funding
Acknowledgments
Conflicts of Interest
References
- Nawaz, Z.; Li, X.; Chen, Y.; Guo, Y.; Wang, X.; Nawaz, N. Temporal and spatial characteristics of precipitation and temperature in Punjab, Pakistan. Water 2019, 11, 1916. [Google Scholar] [CrossRef] [Green Version]
- Jain, S.K.; Kumar, V.; Saharia, M. Analysis of rainfall and temperature trends in northeast India. Int. J. Climatol. 2013, 33, 968–978. [Google Scholar] [CrossRef]
- Beck, H.E.; Pan, M.; Roy, T.; Weedon, G.P.; Pappenberger, F.; van Dijk, A.I.J.M.; Huffman, G.J.; Adler, R.F.; Wood, E.F. Daily evaluation of 26 precipitation datasets using Stage-IV gauge-radar data for the CONUS. Hydrol. Earth Syst. Sci. 2019, 23, 207–224. [Google Scholar] [CrossRef] [Green Version]
- Hamdi, M.R.; Abu-Allaban, M.; Elshaieb, A.; Jaber, M.; Momani, N.M. Climate change in Jordan: A comprehensive examination approach. Am. J. Environ. Sci. 2009, 5, 740–750. [Google Scholar] [CrossRef]
- Matti, C.; Pauling, A.; Küttel, M.; Wanner, H. Winter precipitation trends for two selected European regions over the last 500 years and their possible dynamical background. Theor. Appl. Climatol. 2009, 95, 9–26. [Google Scholar] [CrossRef] [Green Version]
- Singh, P.; Kumar, V.; Thomas, T.; Arora, M. Basin-wide assessment of temperature trends in northwest and central India/Estimation par bassin versant de tendances de température au nord-ouest et au centre de l’Inde. Hydrol. Sci. J. 2008, 53, 421–433. [Google Scholar] [CrossRef]
- De la Casa, A.; Nasello, O. Breakpoints in annual rainfall trends in Córdoba, Argentina. Atmos. Res. 2010, 95, 419–427. [Google Scholar] [CrossRef]
- Gleick, P.H. Climate change, hydrology, and water resources. Rev. Geophys. 1989, 27, 329–344. [Google Scholar] [CrossRef]
- Feng, S.; Hu, Q.; Qian, W. Quality control of daily meteorological data in China, 1951–2000: A new dataset. Int. J. Climatol. A J. R. Meteorol. Soc. 2004, 24, 853–870. [Google Scholar] [CrossRef]
- Jiang, S.; Ren, L.; Hong, Y.; Yong, B.; Yang, X.; Yuan, F.; Ma, M. Comprehensive evaluation of multi-satellite precipitation products with a dense rain gauge network and optimally merging their simulated hydrological flows using the Bayesian model averaging method. J. Hydrol. 2012, 452, 213–225. [Google Scholar] [CrossRef]
- Liu, X.; Yang, T.; Hsu, K.; Liu, C.; Sorooshian, S. Evaluating the streamflow simulation capability of PERSIANN-CDR daily rainfall products in two river basins on the Tibetan Plateau. Hydrol. Earth Syst. Sci. 2017, 21, 169–181. [Google Scholar] [CrossRef] [Green Version]
- Tapiador, F.J.; Turk, F.J.; Petersen, W.; Hou, A.Y.; García-Ortega, E.; Machado, L.A.T.; Angelis, C.F.; Salio, P.; Kidd, C.; Huffman, G.J. Global precipitation measurement: Methods, datasets and applications. Atmos. Res. 2012, 104, 70–97. [Google Scholar] [CrossRef]
- Wang, W.; Lu, H.; Zhao, T.; Jiang, L.; Shi, J. Evaluation and comparison of daily rainfall from latest GPM and TRMM products over the Mekong River Basin. IEEE J. Sel. Top. Appl. Earth Obs. Remote Sens. 2017, 10, 2540–2549. [Google Scholar] [CrossRef]
- Nashwan, M.; Shahid, S.; Chung, E.-S.; Ahmed, K.; Song, Y. Development of climate-based index for hydrologic hazard susceptibility. Sustainability 2018, 10, 2182. [Google Scholar] [CrossRef] [Green Version]
- Albright, T.P.; Pidgeon, A.M.; Rittenhouse, C.D.; Clayton, M.K.; Wardlow, B.D.; Flather, C.H.; Culbert, P.D.; Radeloff, V.C. Combined effects of heat waves and droughts on avian communities across the conterminous United States. Ecosphere 2010, 1, 1–22. [Google Scholar] [CrossRef]
- Nkiaka, E.; Nawaz, N.R.; Lovett, J.C. Evaluating global reanalysis precipitation datasets with rain gauge measurements in the Sudano-Sahel region: Case study of the Logone catchment, Lake Chad Basin. Meteorol. Appl. 2017, 24, 9–18. [Google Scholar] [CrossRef]
- Zhao, Y.; Xie, Q.; Lu, Y.; Hu, B. Hydrologic evaluation of TRMM multisatellite precipitation analysis for Nanliu river basin in Humid Southwestern China. Sci. Rep. 2017, 7, 2470. [Google Scholar] [CrossRef] [Green Version]
- Kunkel, K.E.; Vose, R.S.; Stevens, L.E.; Knight, R.W. Is the monthly temperature climate of the United States becoming more extreme? Geophys. Res. Lett. 2015, 42, 629–636. [Google Scholar] [CrossRef]
- Kunkel, K.E.; Andsager, K.; Easterling, D.R. Long-term trends in extreme precipitation events over the conterminous United States and Canada. J. Clim. 1999, 12, 2515–2527. [Google Scholar] [CrossRef] [Green Version]
- Rajah, K.; O’Leary, T.; Turner, A.; Petrakis, G.; Leonard, M.; Westra, S. Changes to the temporal distribution of daily precipitation. Geophys. Res. Lett. 2014, 41, 8887–8894. [Google Scholar] [CrossRef]
- Daly, C.; Slater, M.E.; Roberti, J.A.; Laseter, S.H.; Swift, L.W., Jr. High-resolution precipitation mapping in a mountainous watershed: Ground truth for evaluating uncertainty in a national precipitation dataset. Int. J. Climatol. 2017, 37, 124–137. [Google Scholar] [CrossRef] [Green Version]
- Hunziker, S.; Gubler, S.; Calle, J.; Moreno, I.; Andrade, M.; Velarde, F.; Ticona, L.; Carrasco, G.; Castellón, Y.; Oria, C. Identifying, attributing, and overcoming common data quality issues of manned station observations. Int. J. Climatol. 2017, 37, 4131–4145. [Google Scholar] [CrossRef]
- Khairul, I.; Mastrantonas, N.; Rasmy, M.; Koike, T.; Takeuchi, K. Inter-comparison of gauge-corrected global satellite rainfall estimates and their applicability for effective water resource management in a transboundary river basin: The case of the Meghna River basin. Remote Sens. 2018, 10, 828. [Google Scholar] [CrossRef] [Green Version]
- Samadi, S.; Carbone, G.J.; Mahdavi, M.; Sharifi, F.; Bihamta, M.R. Statistical downscaling of climate data to estimate streamflow in a semi-arid catchment. Hydrol. Earth Syst. Sci. Discuss. 2012, 9, 4869–4918. [Google Scholar] [CrossRef]
- Buytaert, W.; Friesen, J.; Liebe, J.; Ludwig, R. Assessment and management of water resources in developing, semi-arid and arid regions. Water Resour. Manag. 2012, 26, 841–844. [Google Scholar] [CrossRef] [Green Version]
- Ahmad, W.; Fatima, A.; Awan, U.K.; Anwar, A. Analysis of long term meteorological trends in the middle and lower Indus Basin of Pakistan—A non-parametric statistical approach. Glob. Planet. Chang. 2014, 122, 282–291. [Google Scholar] [CrossRef]
- Dahri, Z.H.; Ludwig, F.; Moors, E.; Ahmad, B.; Khan, A.; Kabat, P. An appraisal of precipitation distribution in the high-altitude catchments of the Indus basin. Sci. Total Environ. 2016, 548, 289–306. [Google Scholar] [CrossRef] [Green Version]
- Ullah, W.; Wang, G.; Ali, G.; Tawia Hagan, D.F.; Bhatti, A.S.; Lou, D. Comparing multiple precipitation products against in-situ observations over different climate regions of Pakistan. Remote Sens. 2019, 11, 628. [Google Scholar] [CrossRef] [Green Version]
- Krakauer, N.Y.; Lakhankar, T.; Dars, G.H. Precipitation trends over the Indus basin. Climate 2019, 7, 116. [Google Scholar] [CrossRef] [Green Version]
- Iqbal, M.F.; Athar, H. Validation of satellite based precipitation over diverse topography of Pakistan. Atmos. Res. 2018, 201, 247–260. [Google Scholar] [CrossRef]
- Khattak, M.S.; Reman, N.U.; Sharif, M.; Khan, M.A. Analysis of streamflow data for trend detection on major rivers of the Indus Basin. J. Himal. Earth Sci. 2015, 48, 87. [Google Scholar]
- Ashiq, M.W.; Zhao, C.; Ni, J.; Akhtar, M. GIS-based high-resolution spatial interpolation of precipitation in mountain–plain areas of Upper Pakistan for regional climate change impact studies. Theor. Appl. Climatol. 2010, 99, 239. [Google Scholar] [CrossRef] [Green Version]
- Abbas, F. Analysis of a historical (1981–2010) temperature record of the Punjab province of Pakistan. Earth Interact. 2013, 17, 1–23. [Google Scholar] [CrossRef]
- Khan, S.U.; Hasan, M.U.; Khan, F.K.; Bari, A. Climate classification of Pakistan. In Proceedings of the Fourth International Scientific Conference BALWOIS 2010, Ohrid, North Macedonia, 25–29 May 2010. [Google Scholar]
- Asmat, U.; Athar, H.; Nabeel, A.; Latif, M. An AOGCM based assessment of interseasonal variability in Pakistan. Clim. Dyn. 2018, 50, 349–373. [Google Scholar] [CrossRef]
- Nawaz, Z.; Li, X.; Chen, Y.; Wang, X.; Zhang, K.; Nawaz, N.; Guo, Y.; Meerzhan, A. Spatiotemporal assessment of temperature data products for the detection of warming trends and abrupt transitions over the largest irrigated area of Pakistan. Adv. Meteorol. 2020, 2020, 3584030. [Google Scholar] [CrossRef]
- Chen, Y.; Ebert, E.E.; Walsh, K.J.E.; Davidson, N.E. Evaluation of TRMM 3B42 precipitation estimates of tropical cyclone rainfall using PACRAIN data. J. Geophys. Res. Atmos. 2013, 118, 2184–2196. [Google Scholar] [CrossRef]
- Habib, E.; Henschke, A.; Adler, R.F. Evaluation of TMPA satellite-based research and real-time rainfall estimates during six tropical-related heavy rainfall events over Louisiana, USA. Atmos. Res. 2009, 94, 373–388. [Google Scholar] [CrossRef]
- Iqbal, M.; Wen, J.; Wang, X.; Lan, Y.; Tian, H.; Anjum, M.N.; Adnan, M. Assessment of air temperature trends in the source Region of Yellow River and its sub-basins. Asia Pac. J. Atmos. Sci. 2018, 54, 111–123. [Google Scholar] [CrossRef]
- Mitchell, J.M.; Dzerdzeevskii, B.; Flohn, H.; Hofmeyr, W.L.; Lamb, H.H.; Rao, K.N.; Wallén, C.C. Climatic Change; Technical Note, No. 79; World Meteorological Organization: Geneva, Switzerland, 1966; Volume 99. [Google Scholar]
- Peterson, T.C.; Easterling, D.R.; Karl, T.R.; Groisman, P.; Nicholls, N.; Plummer, N.; Torok, S.; Auer, I.; Boehm, R.; Gullett, D. Homogeneity adjustments of in situ atmospheric climate data: A review. Int. J. Climatol. A J. R. Meteorol. Soc. 1998, 18, 1493–1517. [Google Scholar] [CrossRef]
- Kohler, M.A. On the Use of Double-Mass Analysis for Testing the Consistency of Meteorological Records and for Making Required Adjustments. Bull. Am. Meteorol. Soc. J. 1949, 30, 188–195. [Google Scholar] [CrossRef]
- Craven, P.; Wahba, G. Smoothing noisy data with spline functions. Numer. Math. 1978, 31, 377–403. [Google Scholar] [CrossRef]
- Hutchinson, M.F.; Gessler, P.E. Splines—More than just a smooth interpolator. Geoderma 1994, 62, 45–67. [Google Scholar] [CrossRef]
- Partal, T. Wavelet transform-based analysis of periodicities and trends of Sakarya basin (Turkey) streamflow data. River Res. Appl. 2010, 26, 695–711. [Google Scholar] [CrossRef]
- Sonali, P.; Kumar, D.N. Review of trend detection methods and their application to detect temperature changes in India. J. Hydrol. 2013, 476, 212–227. [Google Scholar] [CrossRef]
- Sayemuzzaman, M.; Jha, M.K. Seasonal and annual precipitation time series trend analysis in North Carolina, United States. Atmos. Res. 2014, 137, 183–194. [Google Scholar] [CrossRef]
- Sun, Q.; Miao, C.; Duan, Q.; Ashouri, H.; Sorooshian, S.; Hsu, K. A review of global precipitation data sets: Data sources, estimation, and intercomparisons. Rev. Geophys. 2018, 56, 79–107. [Google Scholar] [CrossRef] [Green Version]
- Willmott, C.J.; Matsuura, K. Smart interpolation of annually averaged air temperature in the United States. J. Appl. Meteorol. 1995, 34, 2577–2586. [Google Scholar] [CrossRef]
- Harris, I.; Jones, P.D.; Osborn, T.J.; Lister, D.H. Updated high-resolution grids of monthly climatic observations–the CRU TS3. 10 Dataset. Int. J. Climatol. 2014, 34, 623–642. [Google Scholar] [CrossRef] [Green Version]
- Yatagai, A.; Kamiguchi, K.; Arakawa, O.; Hamada, A.; Yasutomi, N.; Kitoh, A. Aphrodite constructing a long-term daily gridded precipitation dataset for Asia based on a dense network of rain gauges. Bull. Am. Meteorol. Soc. 2012, 93, 1401–1415. [Google Scholar] [CrossRef]
- Xie, P.; Chen, M.; Shi, W. CPC unified gauge-based analysis of global daily precipitation. In Proceedings of the 24th Conference on Hydrology, Atlanta, GA, USA, 16–21 January 2010. [Google Scholar]
- Huffman, G.J.; Bolvin, D.T.; Nelkin, E.J.; Wolff, D.B.; Adler, R.F.; Gu, G.; Hong, Y.; Bowman, K.P.; Stocker, E.F. The TRMM multisatellite precipitation analysis (TMPA): Quasi-global, multiyear, combined-sensor precipitation estimates at fine scales. J. Hydrometeorol. 2007, 8, 38–55. [Google Scholar] [CrossRef]
- Li, W.; Sun, W.; He, X.; Scaioni, M.; Yao, D.; Chen, Y.; Gao, J.; Li, X.; Cheng, G. Improving CHIRPS daily satellite-precipitation products using coarser ground observations. IEEE Geosci. Remote Sens. Lett. 2019, 16, 1678–1682. [Google Scholar] [CrossRef]
- Ashouri, H.; Hsu, K.-L.; Sorooshian, S.; Braithwaite, D.K.; Knapp, K.R.; Cecil, L.D.; Nelson, B.R.; Prat, O.P. PERSIANN-CDR: Daily precipitation climate data record from multisatellite observations for hydrological and climate studies. Bull. Am. Meteorol. Soc. 2015, 96, 69–83. [Google Scholar] [CrossRef] [Green Version]
- Adler, R.F.; Huffman, G.J.; Chang, A.; Ferraro, R.; Xie, P.-P.; Janowiak, J.; Rudolf, B.; Schneider, U.; Curtis, S.; Bolvin, D. The version-2 global precipitation climatology project (GPCP) monthly precipitation analysis (1979–present). J. Hydrometeorol. 2003, 4, 1147–1167. [Google Scholar] [CrossRef]
- Hong, Y.; Gochis, D.; Cheng, J.; Hsu, K.; Sorooshian, S. Evaluation of PERSIANN-CCS rainfall measurement using the NAME event rain gauge network. J. Hydrometeorol. 2007, 8, 469–482. [Google Scholar] [CrossRef] [Green Version]
- Funk, C.; Peterson, P.; Landsfeld, M.; Pedreros, D.; Verdin, J.; Shukla, S.; Husak, G.; Rowland, J.; Harrison, L.; Hoell, A. The climate hazards infrared precipitation with stations—A new environmental record for monitoring extremes. Sci. Data 2015, 2, 1–21. [Google Scholar] [CrossRef] [Green Version]
- Ushio, T.; Sasashige, K.; Kubota, T.; Shige, S.; Okamoto, K.; Aonashi, K.; Inoue, T.; Takahashi, N.; Iguchi, T.; Kachi, M. A Kalman filter approach to the Global Satellite Mapping of Precipitation (GSMaP) from combined passive microwave and infrared radiometric data. J. Meteorol. Soc. Japan. Ser. II 2009, 87, 137–151. [Google Scholar] [CrossRef] [Green Version]
- Taylor, K.E. Summarizing multiple aspects of model performance in a single diagram. J. Geophys. Res. Atmos. 2001, 106, 7183–7192. [Google Scholar] [CrossRef]
- Chen, Y.; Guan, Y.; Shao, G.; Zhang, D. Investigating trends in streamflow and precipitation in Huangfuchuan Basin with wavelet analysis and the Mann-Kendall test. Water 2016, 8, 77. [Google Scholar] [CrossRef] [Green Version]
- Yang, P.; Xia, J.; Zhang, Y.; Hong, S. Temporal and spatial variations of precipitation in Northwest China during 1960–2013. Atmos. Res. 2017, 183, 283–295. [Google Scholar] [CrossRef]
- Zamani, R.; Mirabbasi, R.; Abdollahi, S.; Jhajharia, D. Streamflow trend analysis by considering autocorrelation structure, long-term persistence, and Hurst coefficient in a semi-arid region of Iran. Theor. Appl. Climatol. 2017, 129, 33–45. [Google Scholar] [CrossRef]
- Sen, P.K. Estimates of the regression coefficient based on Kendall’s tau. J. Am. Stat. Assoc. 1968, 63, 1379–1389. [Google Scholar] [CrossRef]
- Zhang, X.; Zwiers, F.W.; Li, G. Monte Carlo experiments on the detection of trends in extreme values. J. Clim. 2004, 17, 1945–1952. [Google Scholar] [CrossRef]
- Sneyers, R. On the Statistical Analysis of Series of Observations; World Meteorological Organization: Geneva, Switzerland, 1990; ISBN 9263104158. [Google Scholar]
- Zarenistanak, M.; Dhorde, A.G.; Kripalani, R.H. Trend analysis and change point detection of annual and seasonal precipitation and temperature series over southwest Iran. J. Earth Syst. Sci. 2014, 123, 281–295. [Google Scholar] [CrossRef]
- Mann, H.B. Non-parametric tests against trend. Econmetrica 1945, 13, 245–259. [Google Scholar] [CrossRef]
- Mantua, N.J.; Hare, S.R.; Zhang, Y.; Wallace, J.M.; Francis, R.C. A Pacific interdecadal climate oscillation with impacts on salmon production. Bull. Amer. Meteor. Soc. 1997, 78, 1069–1080. [Google Scholar] [CrossRef]
- Kendall, M.G. Rank Correlation Measures; Charles Griffin: London, UK, 1975; Volume 202, p. 15. [Google Scholar]
- Ullah, S.; You, Q.; Ullah, W.; Ali, A. Observed changes in precipitation in China-Pakistan economic corridor during 1980–2016. Atmos. Res. 2018, 210, 1–14. [Google Scholar] [CrossRef]
- Ahmed, K.; Shahid, S.; Wang, X.; Nawaz, N.; Khan, N. Evaluation of gridded precipitation datasets over arid regions of Pakistan. Water 2019, 11, 210. [Google Scholar] [CrossRef] [Green Version]
- Khan, S.I.; Hong, Y.; Gourley, J.J.; Khattak, M.U.K.; Yong, B.; Vergara, H.J. Evaluation of three high-resolution satellite precipitation estimates: Potential for monsoon monitoring over Pakistan. Adv. Sp. Res. 2014, 54, 670–684. [Google Scholar] [CrossRef]
- Xu, M.; Kang, S.; Wu, H.; Yuan, X. Detection of spatio-temporal variability of air temperature and precipitation based on long-term meteorological station observations over Tianshan Mountains, Central Asia. Atmos. Res. 2018, 203, 141–163. [Google Scholar] [CrossRef]
- Rashid, M.M.; Beecham, S.; Chowdhury, R.K. Assessment of trends in point rainfall using continuous wavelet transforms. Adv. Water Resour. 2015, 82, 1–15. [Google Scholar] [CrossRef]
- Priya, P.; Mujumdar, M.; Sabin, T.P.; Terray, P.; Krishnan, R. Impacts of Indo-Pacific sea surface temperature anomalies on the summer monsoon circulation and heavy precipitation over northwest India–Pakistan region during 2010. J. Clim. 2015, 28, 3714–3730. [Google Scholar] [CrossRef] [Green Version]
- Gampe, D.; Ludwig, R. Evaluation of gridded precipitation data products for hydrological applications in complex topography. Hydrology 2017, 4, 53. [Google Scholar] [CrossRef] [Green Version]
- Naveed, M.; Ding, Y.; Shangguan, D.; Ahmad, I. Performance evaluation of latest integrated multi-satellite retrievals for Global Precipitation Measurement (IMERG) over the northern highlands of Pakistan. Atmos. Res. 2018, 205, 134–146. [Google Scholar]
- Bharti, V.; Singh, C. Evaluation of error in TRMM 3B42V7 precipitation estimates over the Himalayan region. J. Geophys. Res. Atmos. 2015, 120, 12458–12473. [Google Scholar] [CrossRef]
- Kaufman, Y.J.; Tanré, D.; Boucher, O. A satellite view of aerosols in the climate system. Nature 2002, 419, 215–223. [Google Scholar] [CrossRef] [PubMed]
- Tahir, A.A.; Adamowski, J.F.; Chevallier, P.; Haq, A.U.; Terzago, S. Comparative assessment of spatiotemporal snow cover changes and hydrological behavior of the Gilgit, Astore and Hunza River basins (Hindukush–Karakoram–Himalaya region, Pakistan). Meteorol. Atmos. Phys. 2016, 128, 793–811. [Google Scholar] [CrossRef]
- Palazzi, E.; von Hardenberg, J.; Provenzale, A. Precipitation in the Hindu-Kush Karakoram Himalaya: Observations and future scenarios. J. Geophys. Res. Atmos. 2013, 118, 85–100. [Google Scholar] [CrossRef]
- Ren, G.; Zhou, Y. Urbanization effect on trends of extreme temperature indices of national stations over Mainland China, 1961–2008. J. Clim. 2014, 27, 2340–2360. [Google Scholar] [CrossRef]
- Kripalani, R.H.; Oh, J.H.; Kulkarni, A.; Sabade, S.S.; Chaudhari, H.S. South Asian summer monsoon precipitation variability: Coupled climate model simulations and projections under IPCC AR4. Theor. Appl. Climatol. 2007, 90, 133–159. [Google Scholar] [CrossRef]
- Latif, M.; Syed, F.S.; Hannachi, A. Rainfall trends in the South Asian summer monsoon and its related large-scale dynamics with focus over Pakistan. Clim. Dyn. 2017, 48, 3565–3581. [Google Scholar] [CrossRef]
- Wang, P.X.; Wang, B.; Cheng, H.; Fasullo, J.; Guo, Z.; Kiefer, T.; Liu, Z. The global monsoon across time scales: Mechanisms and outstanding issues. Earth Sci. Rev. 2017, 174, 84–121. [Google Scholar] [CrossRef]
- Xie, H.; Ringler, C.; Zhu, T.; Waqas, A. Droughts in Pakistan: A spatiotemporal variability analysis using the Standardized Precipitation Index. Water Int. 2013, 38, 620–631. [Google Scholar] [CrossRef]
- Jamro, S.; Dars, G.H.; Ansari, K.; Krakauer, N.Y. Spatio-temporal variability of drought in Pakistan using standardized precipitation evapotranspiration index. Appl. Sci. 2019, 9, 4588. [Google Scholar] [CrossRef] [Green Version]
- Lutz, A.F.; Immerzeel, W.W.; Shrestha, A.B.; Bierkens, M.F.P. Consistent increase in High Asia’s runoff due to increasing glacier melt and precipitation. Nat. Clim. Chang. 2014, 4, 587–592. [Google Scholar] [CrossRef] [Green Version]
- Fu, G.; Yu, J.; Yu, X.; Ouyang, R.; Zhang, Y.; Wang, P.; Liu, W.; Min, L. Temporal variation of extreme rainfall events in China, 1961–2009. J. Hydrol. 2013, 487, 48–59. [Google Scholar] [CrossRef]
- McEvoy, D.J.; Mejia, J.F.; Huntington, J.L. Use of an observation network in the Great Basin to evaluate gridded climate data. J. Hydrometeorol. 2014, 15, 1913–1931. [Google Scholar] [CrossRef]
- Rodger, J.A.; George, J.A. Triple bottom line accounting for optimizing natural gas sustainability: A statistical linear programming fuzzy ILOWA optimized sustainment model approach to reducing supply chain global cybersecurity vulnerability through information and communications t. J. Clean. Prod. 2017, 142, 1931–1949. [Google Scholar] [CrossRef]


| GPPs | Annual | Winter-Monsoon | Summer-Monsoon |
|---|---|---|---|
| CRU | 1.19 | 1.24 | 1.17 |
| GPCC | 1.18 | 1.31 | 1.15 |
| APHRODITE | 1.61 | 1.48 | 1.71 |
| CPC | 1.53 | 1.47 | 1.57 |
| UDel | 1.20 | 1.33 | 1.38 |
| TRMM | 0.99 | 0.84 | 1.06 |
| CHIRPS | 1.34 | 1.37 | 1.3 |
| GSMap | 1.05 | 0.61 | 2.33 |
| PERSIANN-CDR | 1.01 | 0.92 | 1.08 |
| PERSIANN-CCS | 1.01 | 0.72 | 1.79 |
Publisher’s Note: MDPI stays neutral with regard to jurisdictional claims in published maps and institutional affiliations. |
© 2020 by the authors. Licensee MDPI, Basel, Switzerland. This article is an open access article distributed under the terms and conditions of the Creative Commons Attribution (CC BY) license (http://creativecommons.org/licenses/by/4.0/).
Share and Cite
Nawaz, Z.; Li, X.; Chen, Y.; Nawaz, N.; Gull, R.; Elnashar, A. Spatio-Temporal Assessment of Global Precipitation Products over the Largest Agriculture Region in Pakistan. Remote Sens. 2020, 12, 3650. https://0-doi-org.brum.beds.ac.uk/10.3390/rs12213650
Nawaz Z, Li X, Chen Y, Nawaz N, Gull R, Elnashar A. Spatio-Temporal Assessment of Global Precipitation Products over the Largest Agriculture Region in Pakistan. Remote Sensing. 2020; 12(21):3650. https://0-doi-org.brum.beds.ac.uk/10.3390/rs12213650
Chicago/Turabian StyleNawaz, Zain, Xin Li, Yingying Chen, Naima Nawaz, Rabia Gull, and Abdelrazek Elnashar. 2020. "Spatio-Temporal Assessment of Global Precipitation Products over the Largest Agriculture Region in Pakistan" Remote Sensing 12, no. 21: 3650. https://0-doi-org.brum.beds.ac.uk/10.3390/rs12213650