Spatio-Temporal Evolution, Future Trend and Phenology Regularity of Net Primary Productivity of Forests in Northeast China

Abstract
:
1. Introduction
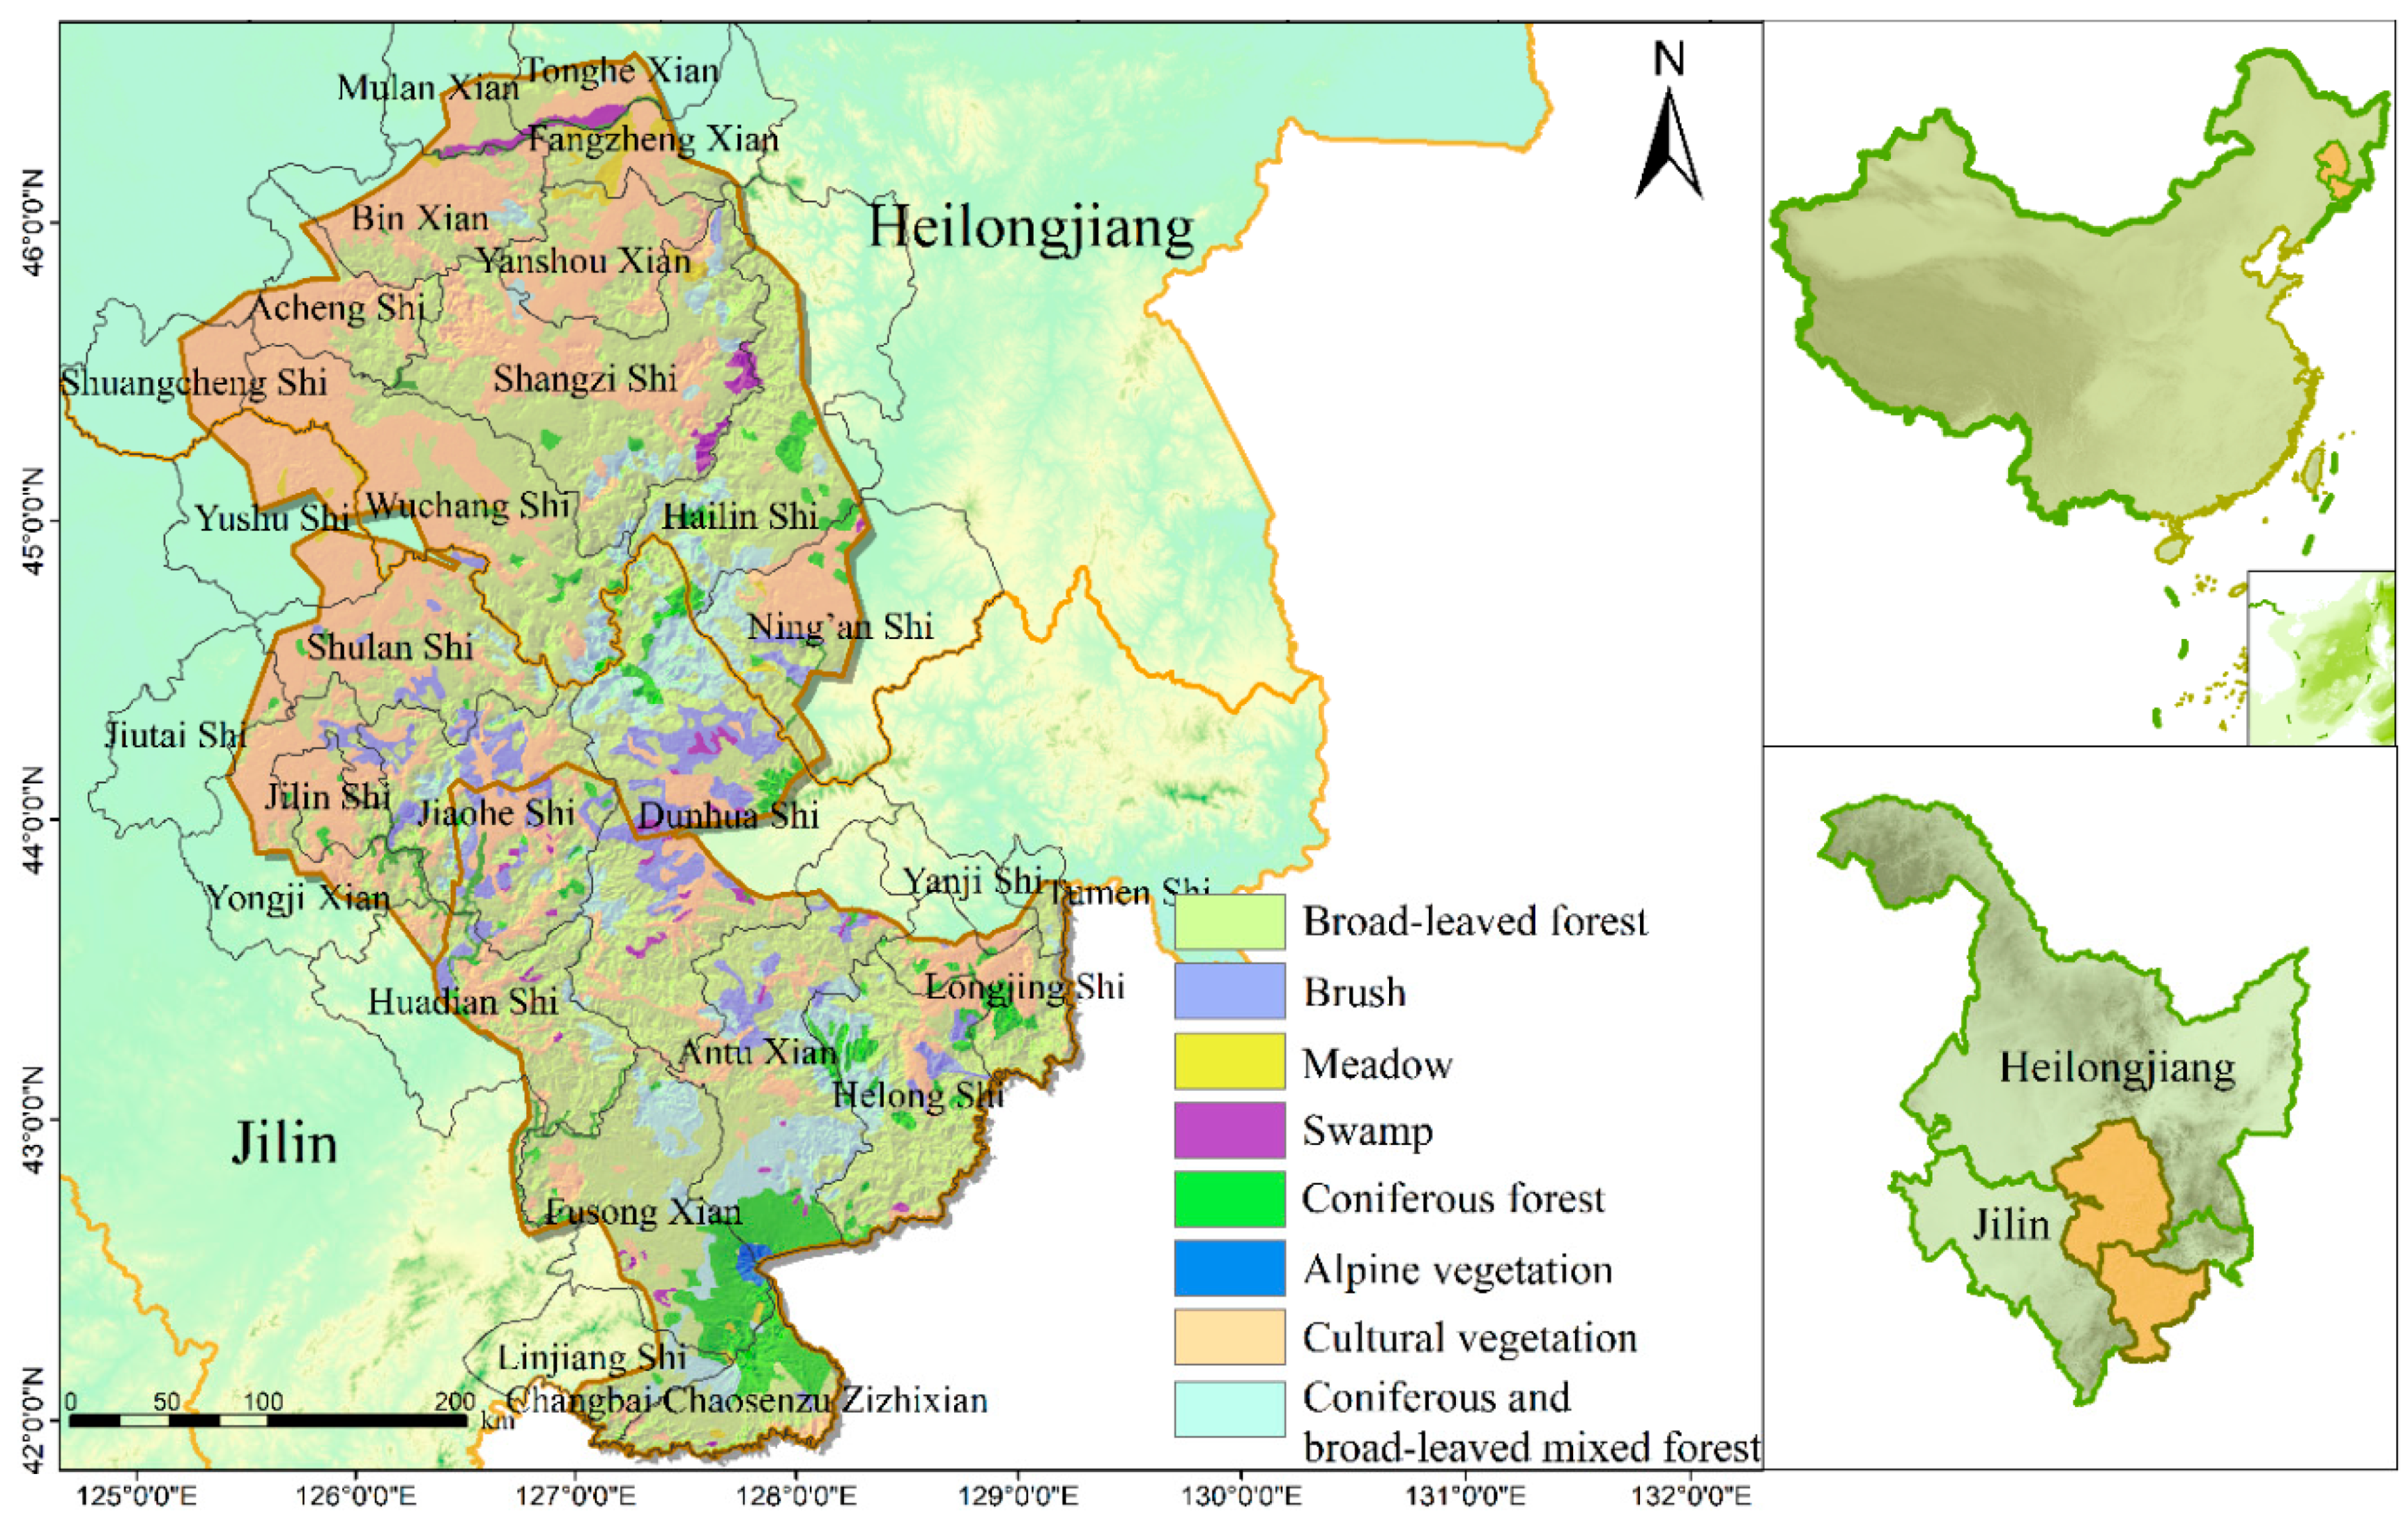
2. Study Area
3. Data and Methodology
3.1. Data Source and Processing
3.1.1. Modis Data
3.1.2. Meteorological Data
3.1.3. Land-Use and Land-Cover Data
3.2. Methodology
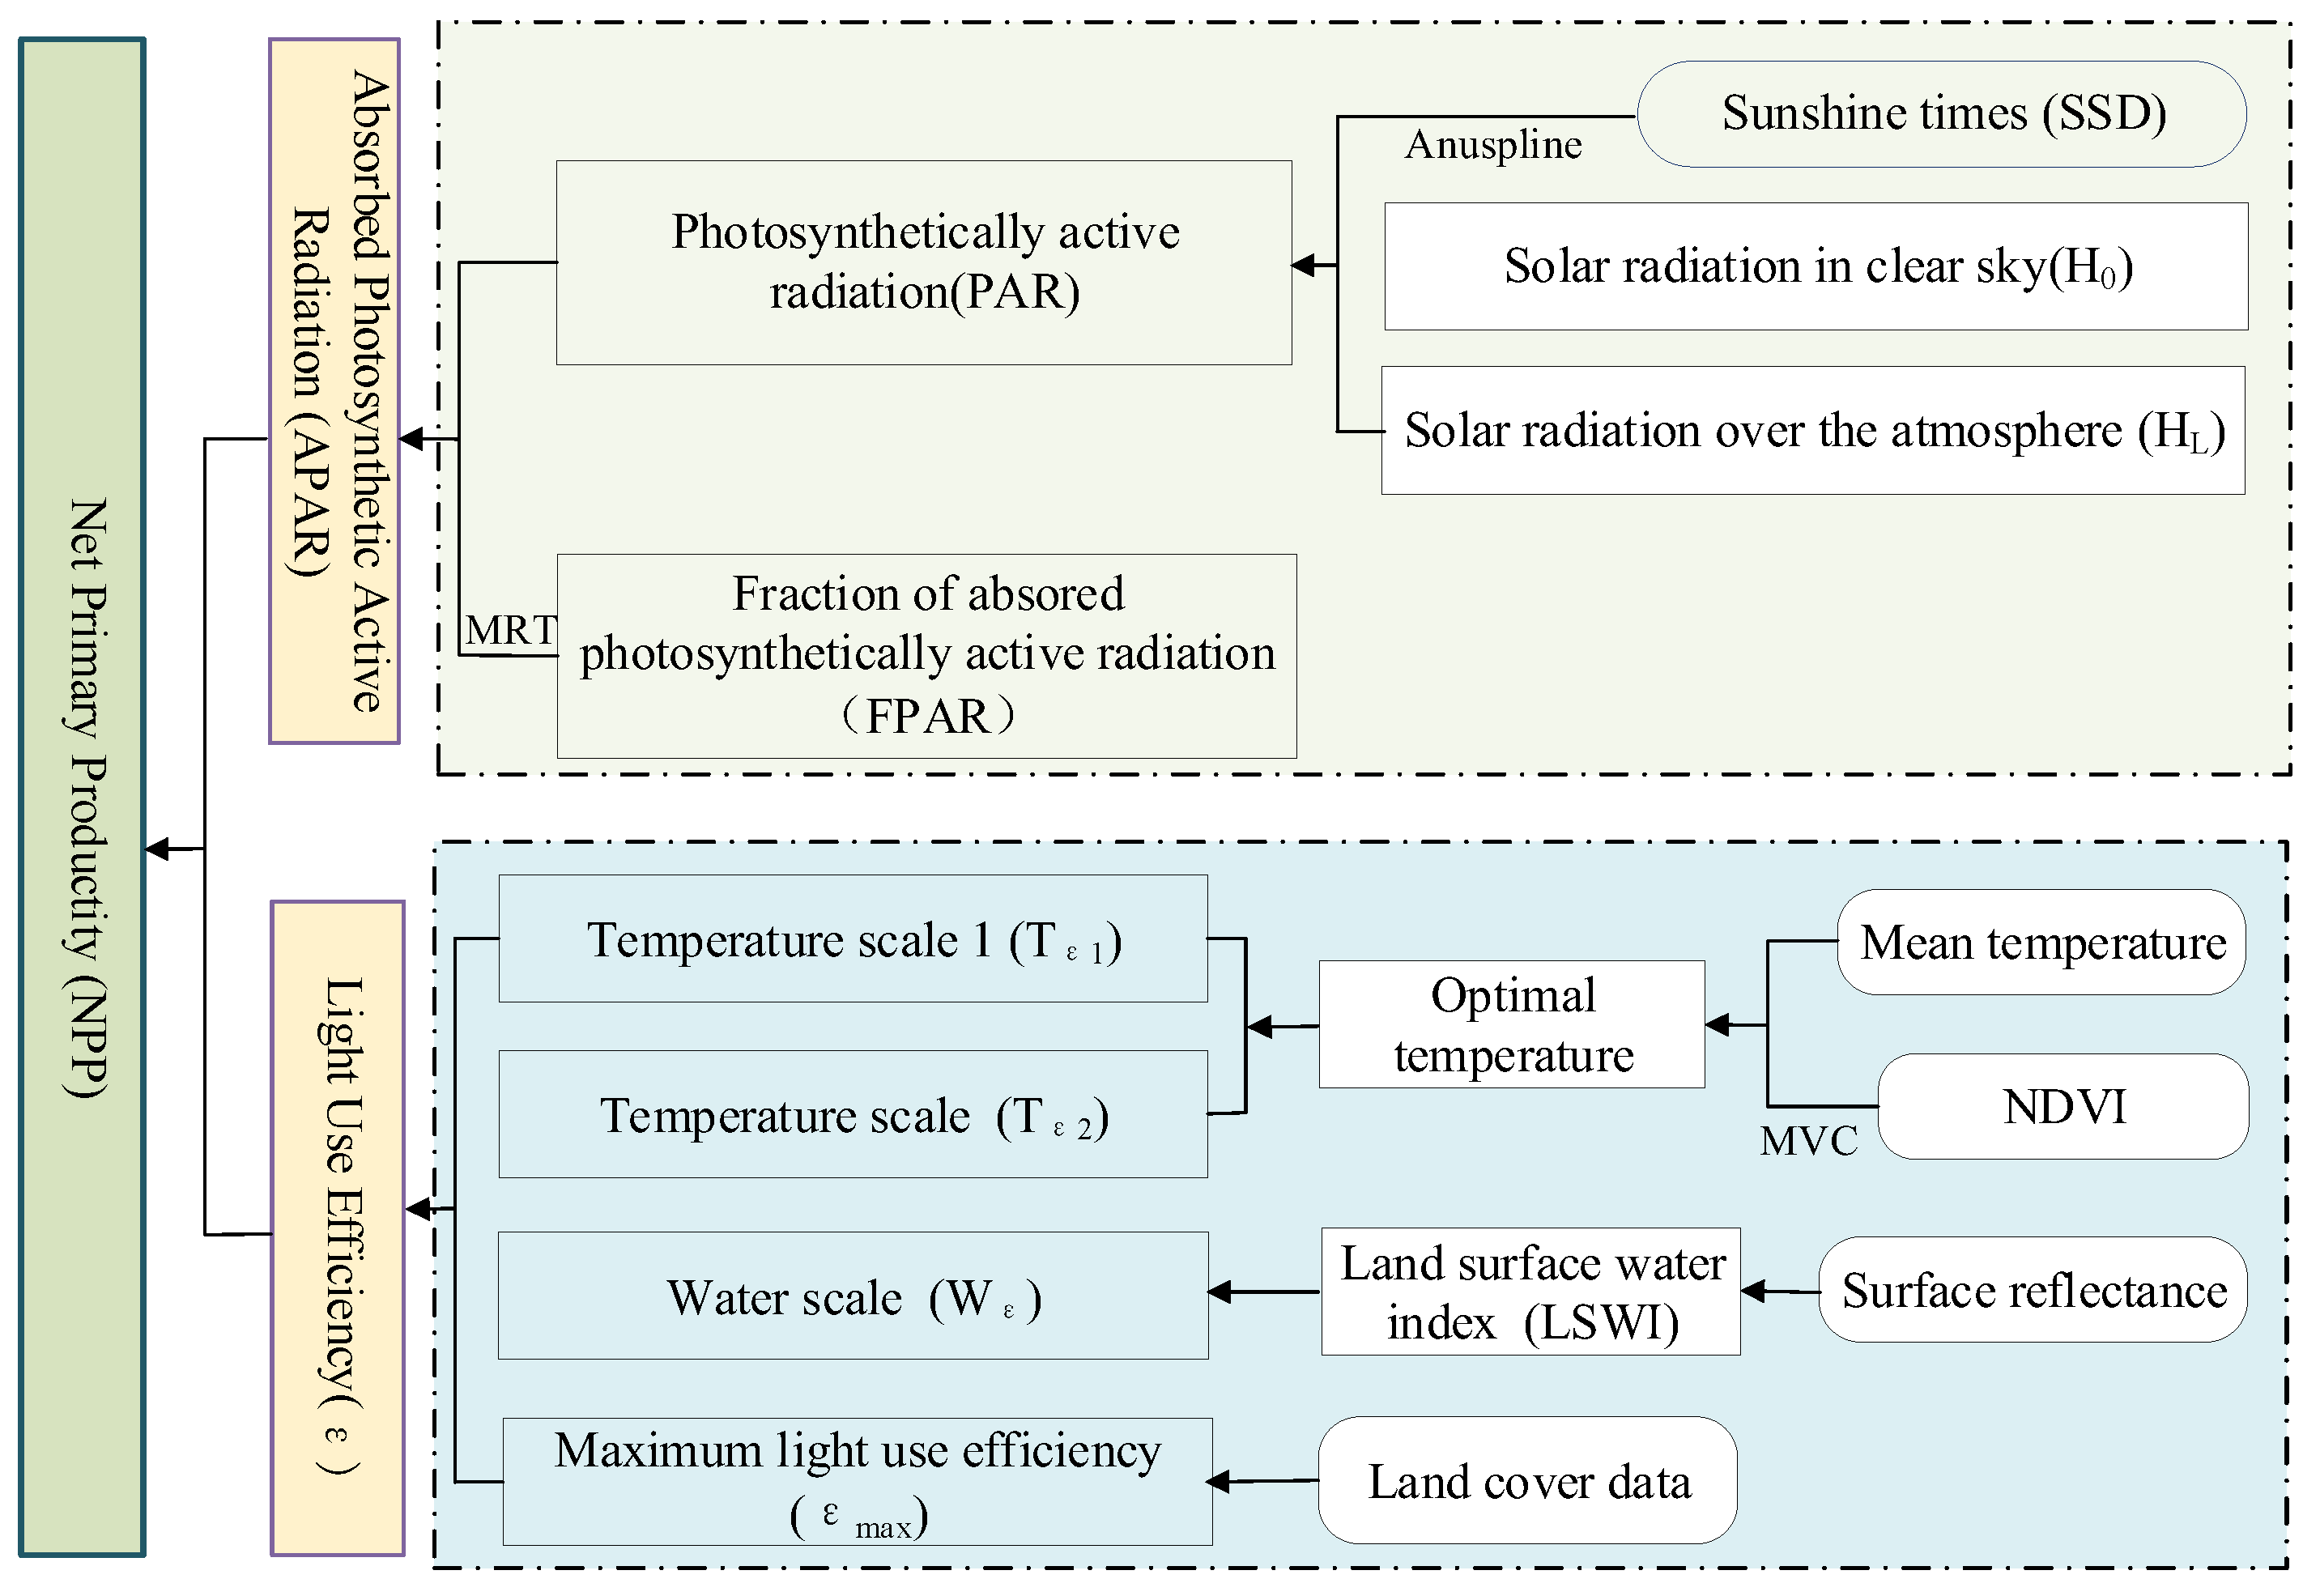
3.2.1. GLO-PEM
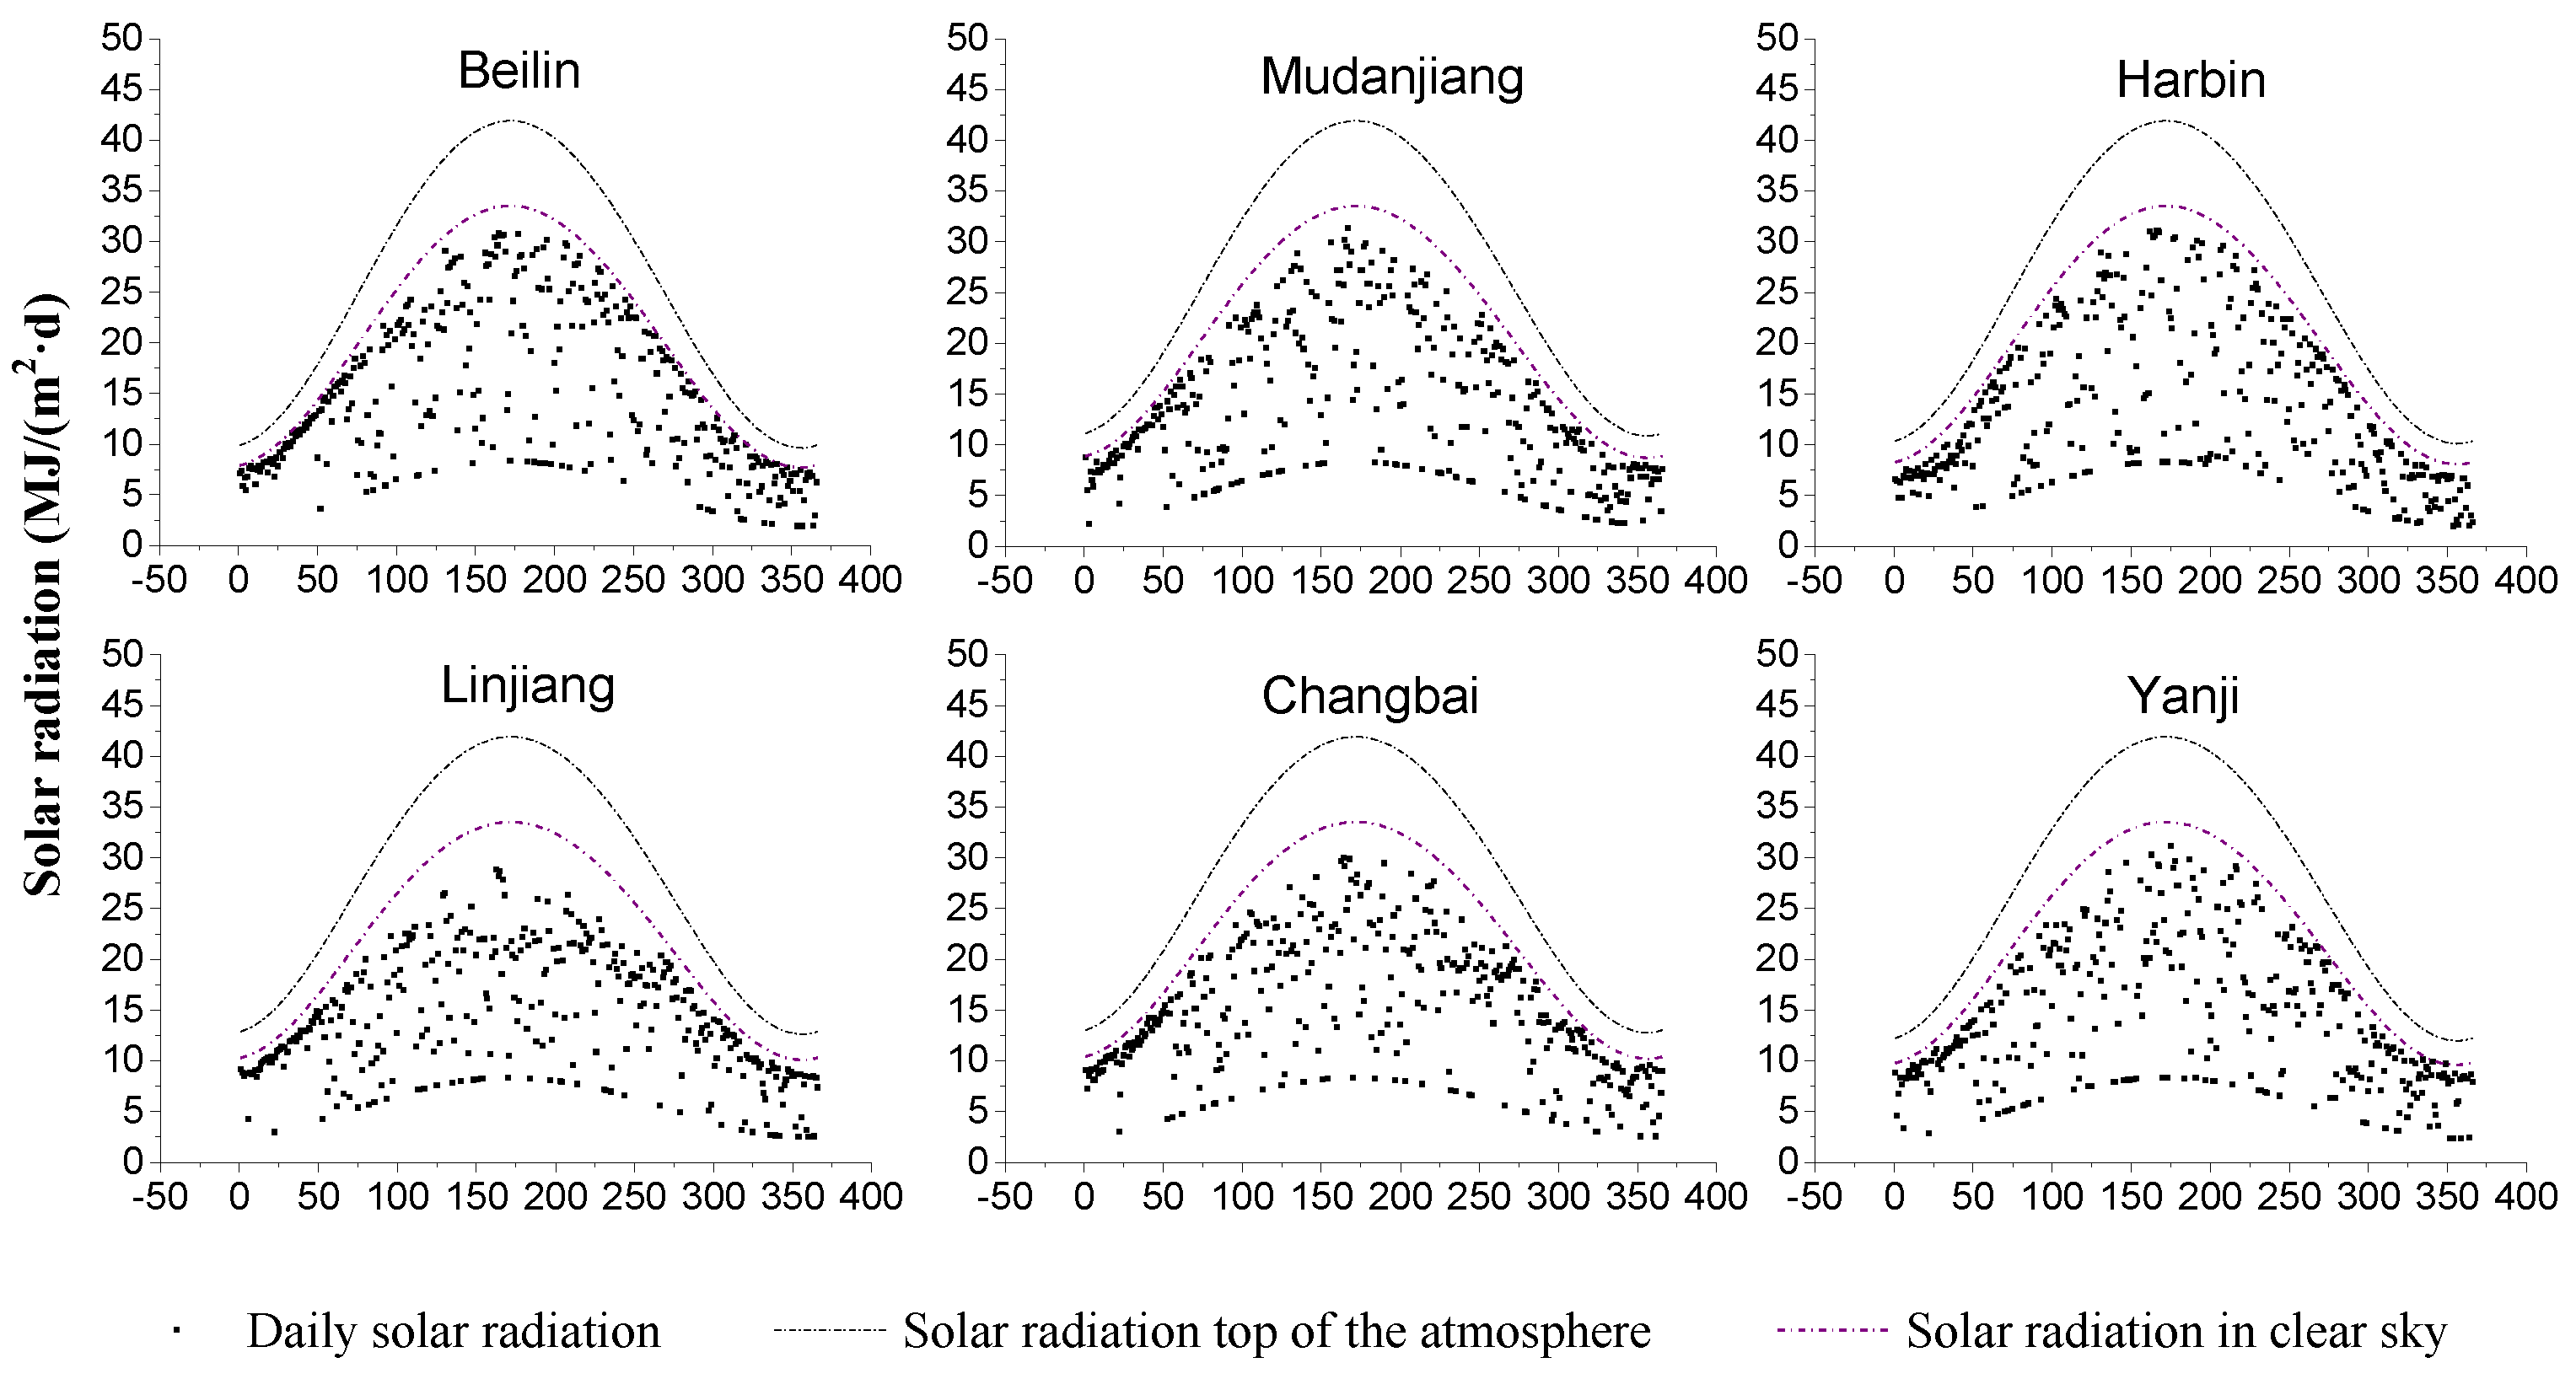
- (1)
- Solar radiation top of atmosphere (H0)
- (2)
- Solar radiation in clear sky (HL)
- (3)
- Daily solar radiation (H)
3.2.2. Sen–Mann–Kendall Trend
3.2.3. Hurst Index
4. Model Validation
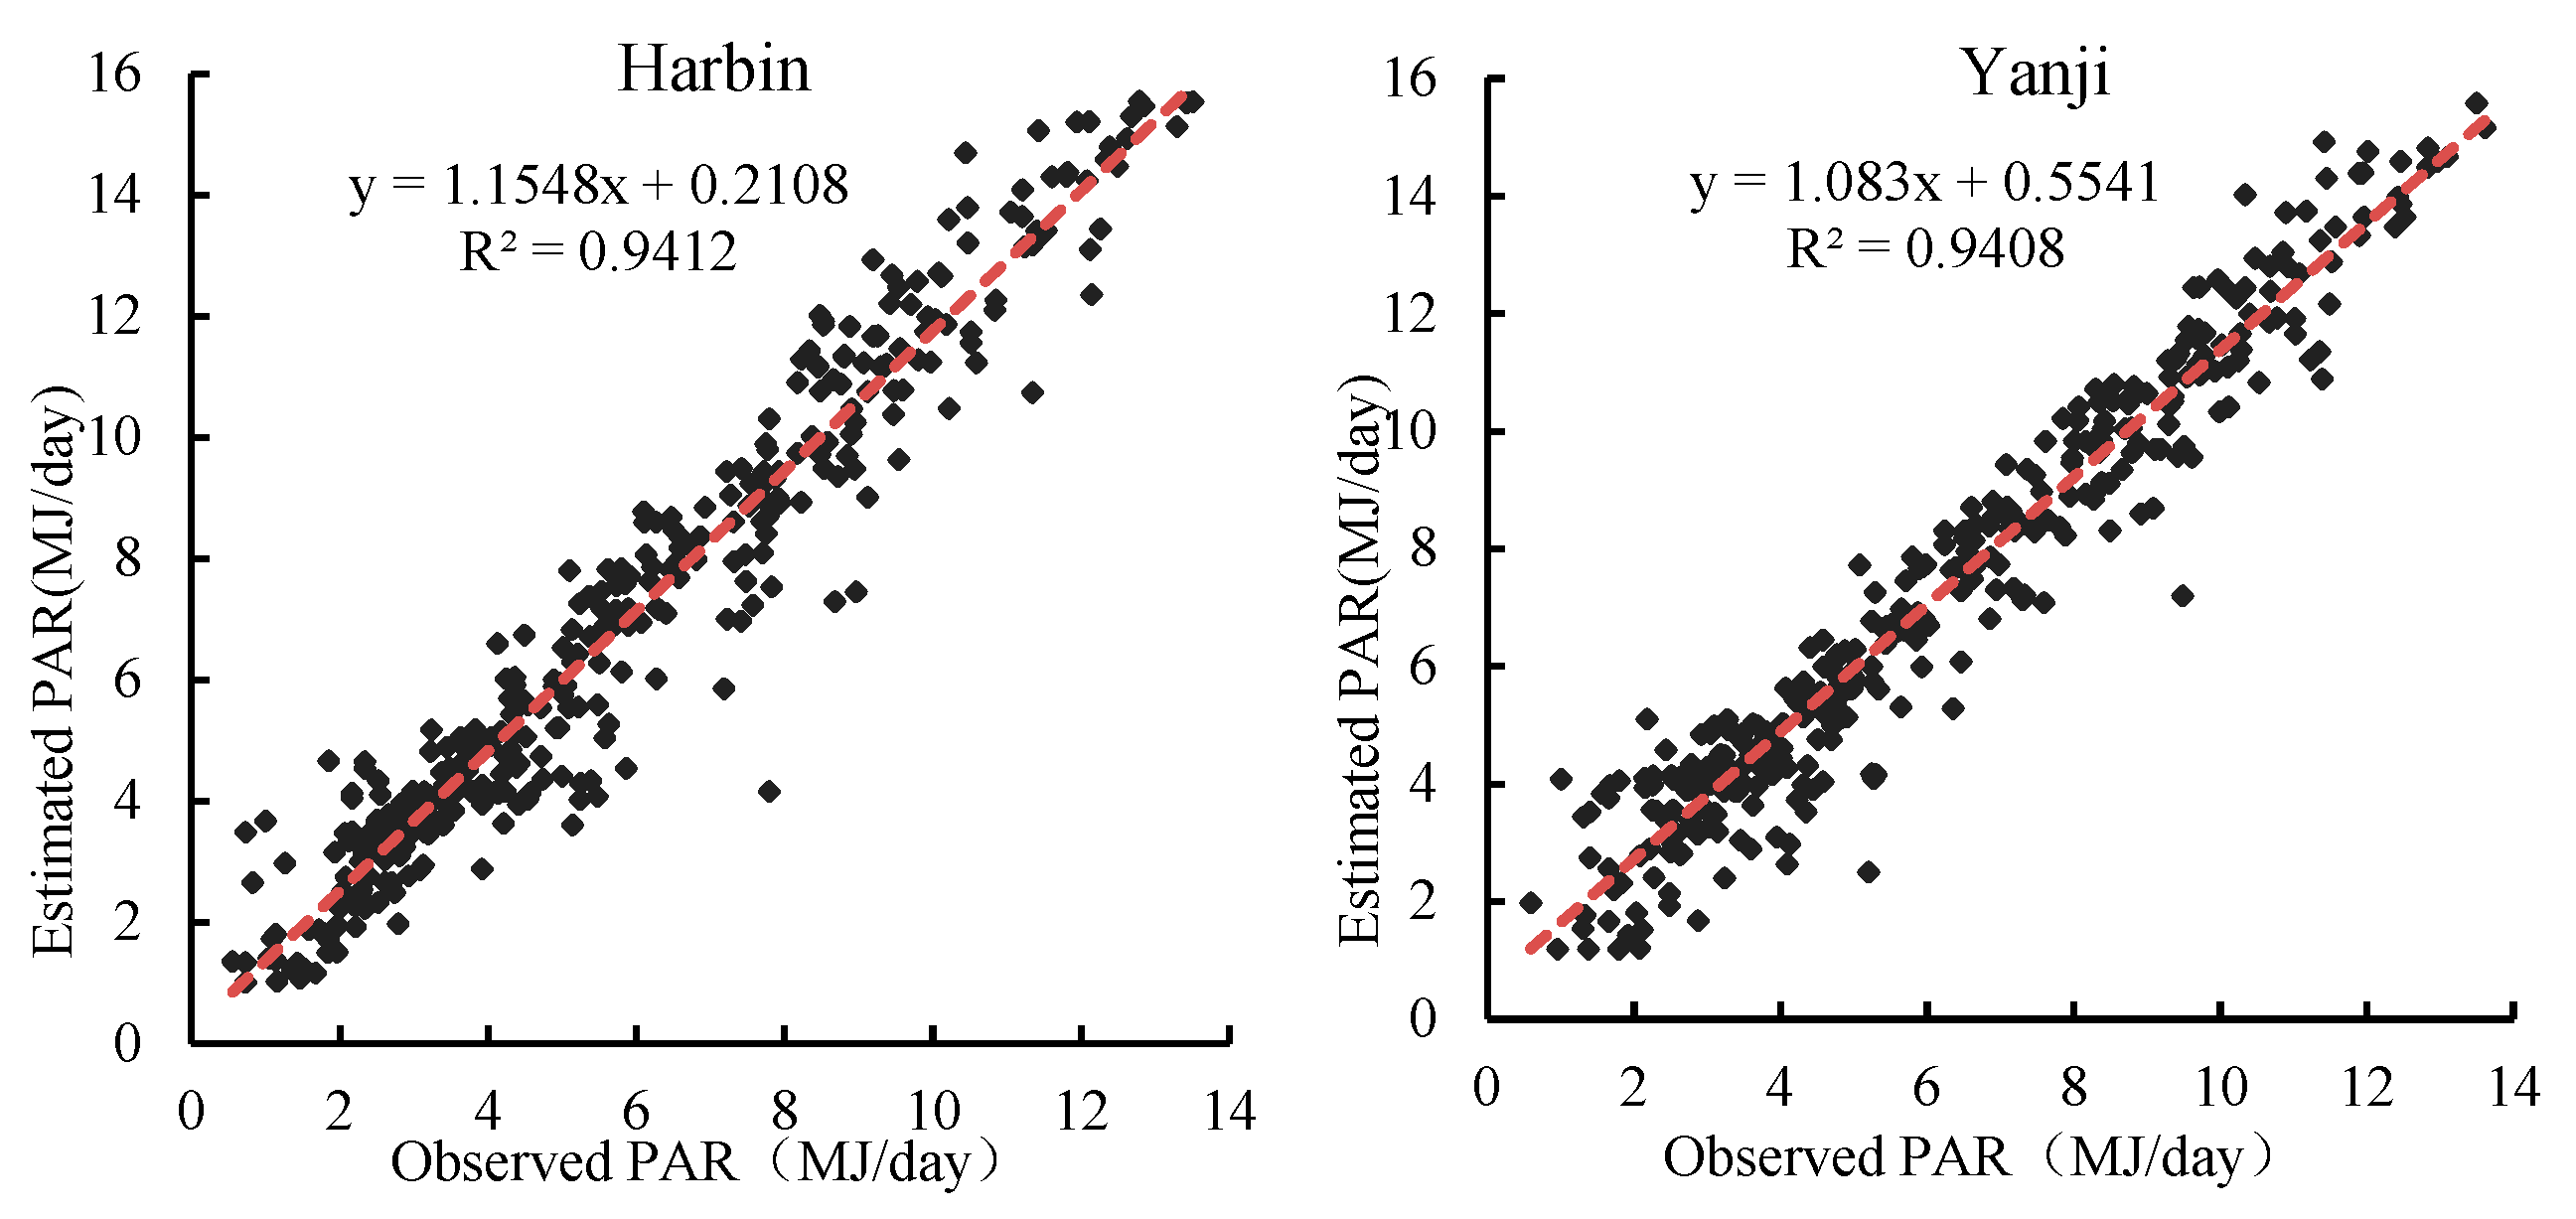
4.1. Comparisons of Solar Radiation and PAR Variation of Different Research Sites
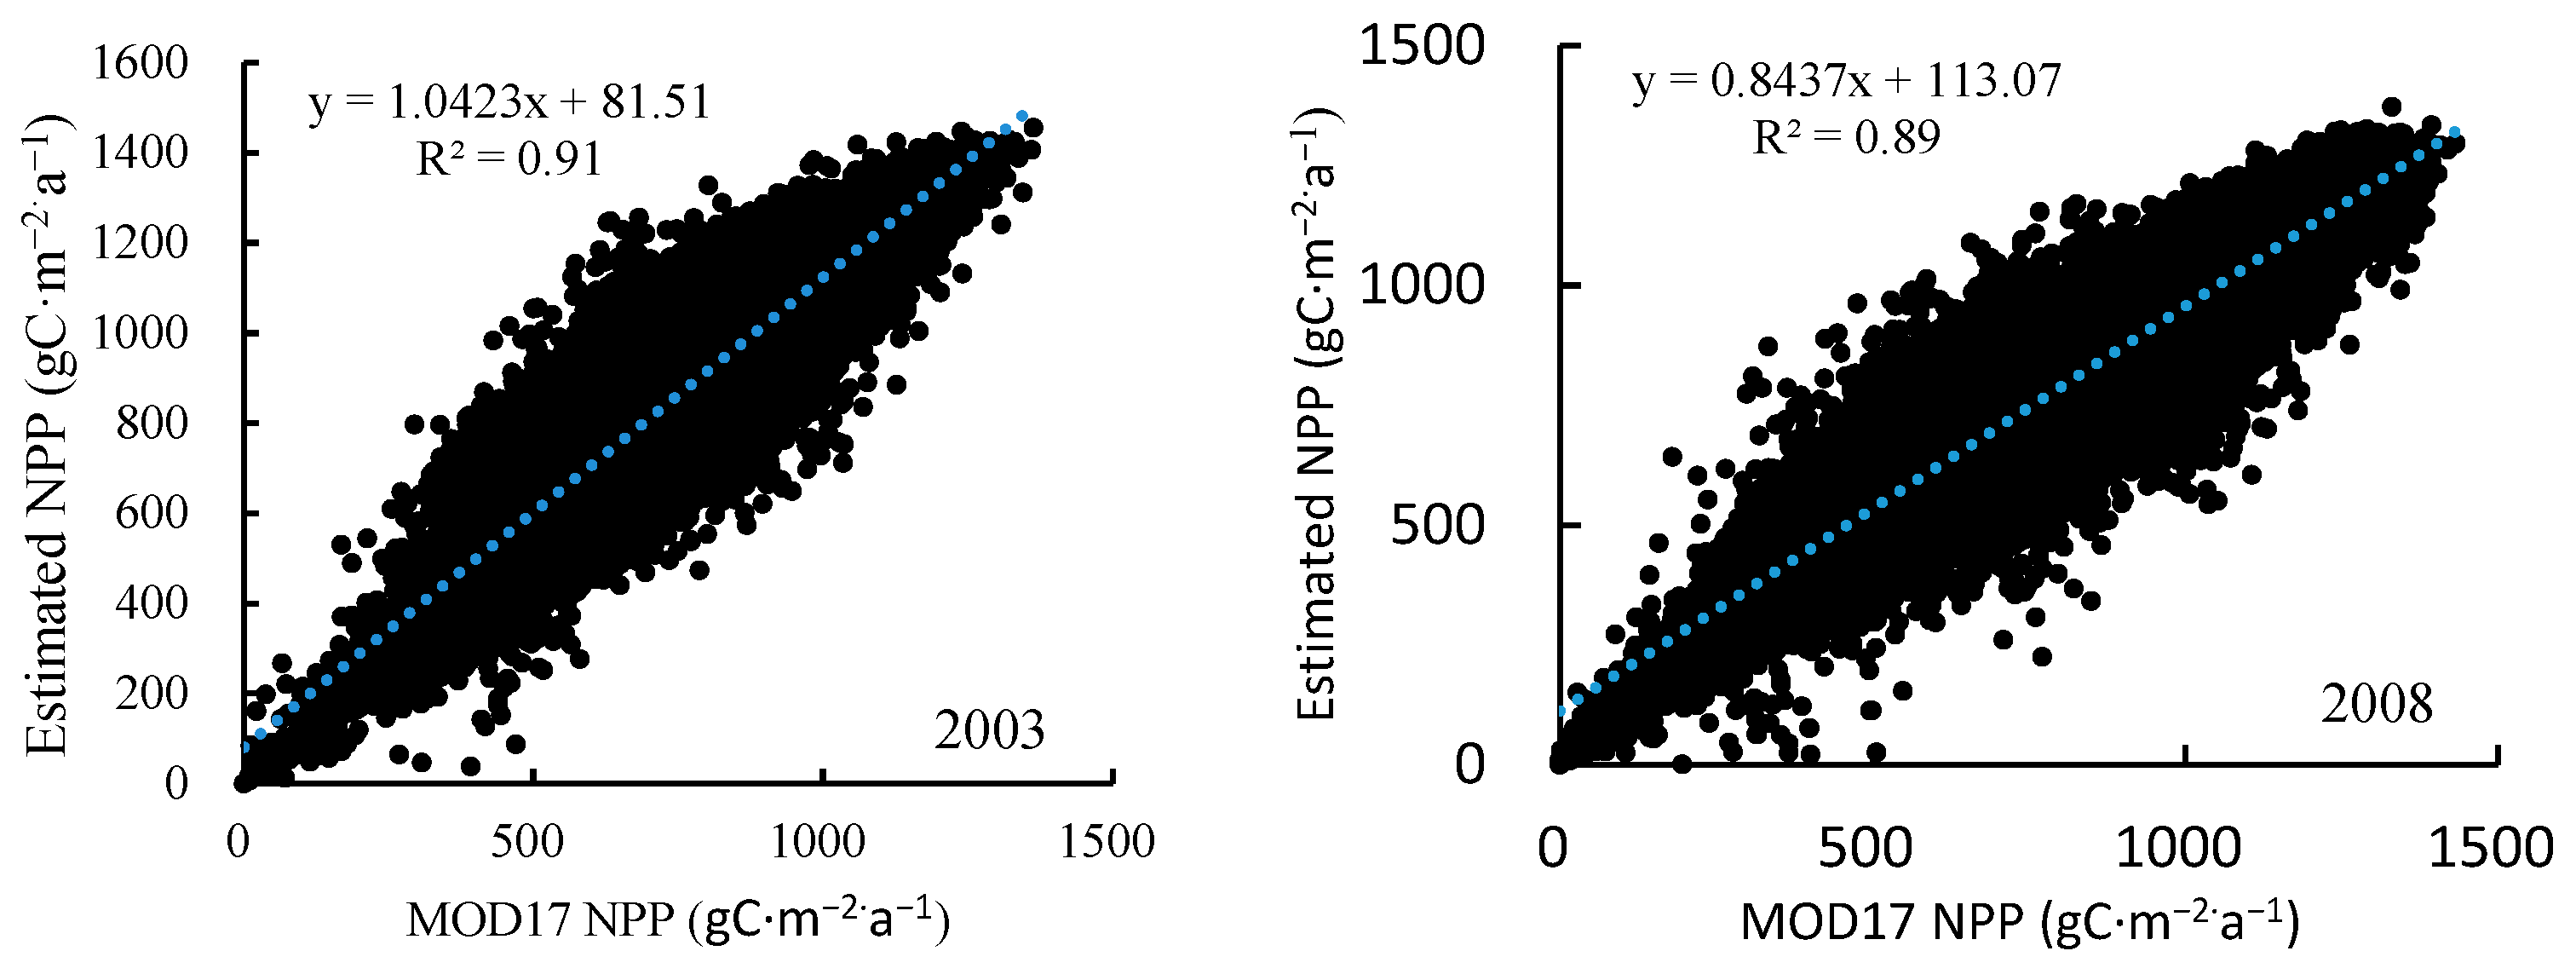
4.2. NPP Validation between Simulated NPP and MOD17 NPP
5. Results
5.1. Spatio-Temporal Evolution of NPP in Northeast China
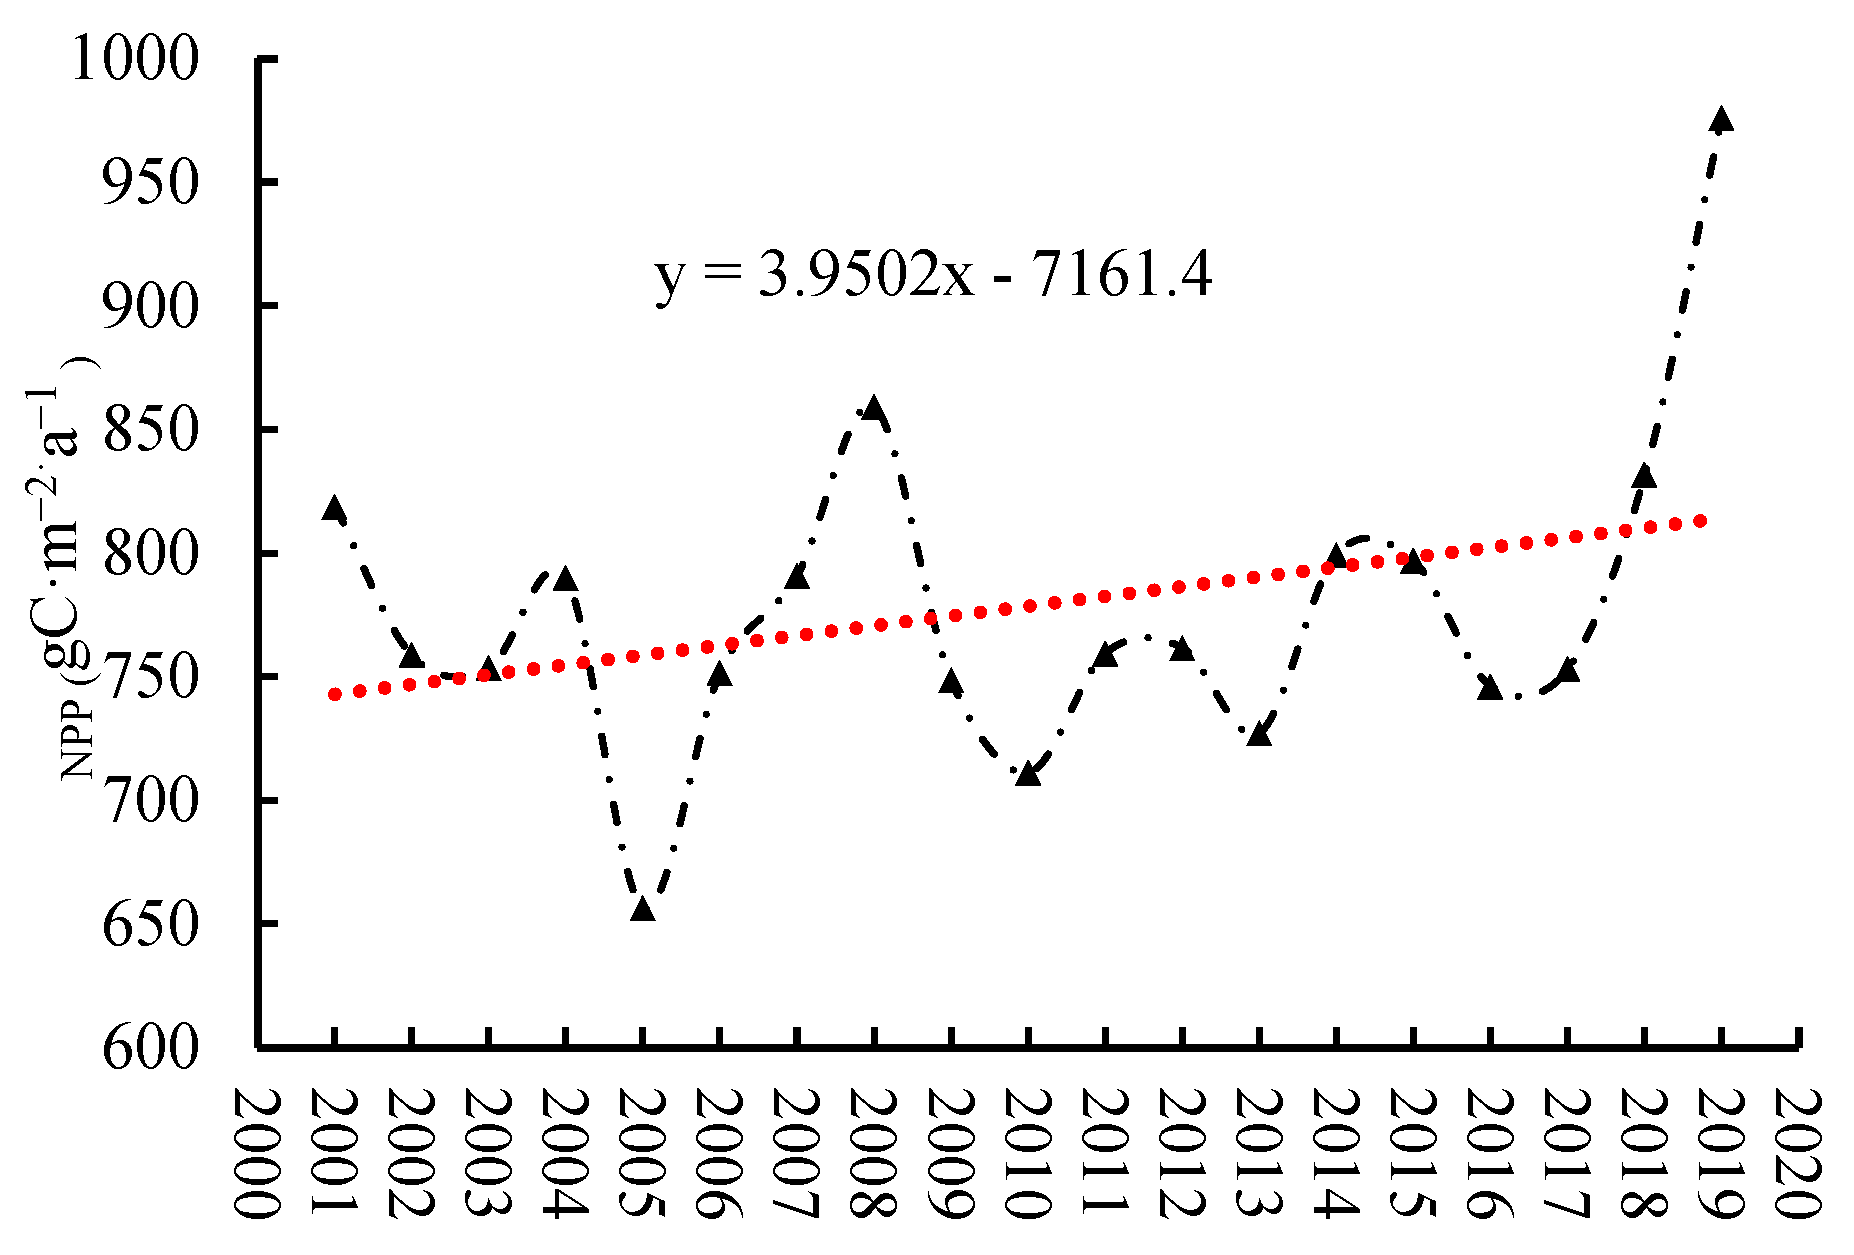
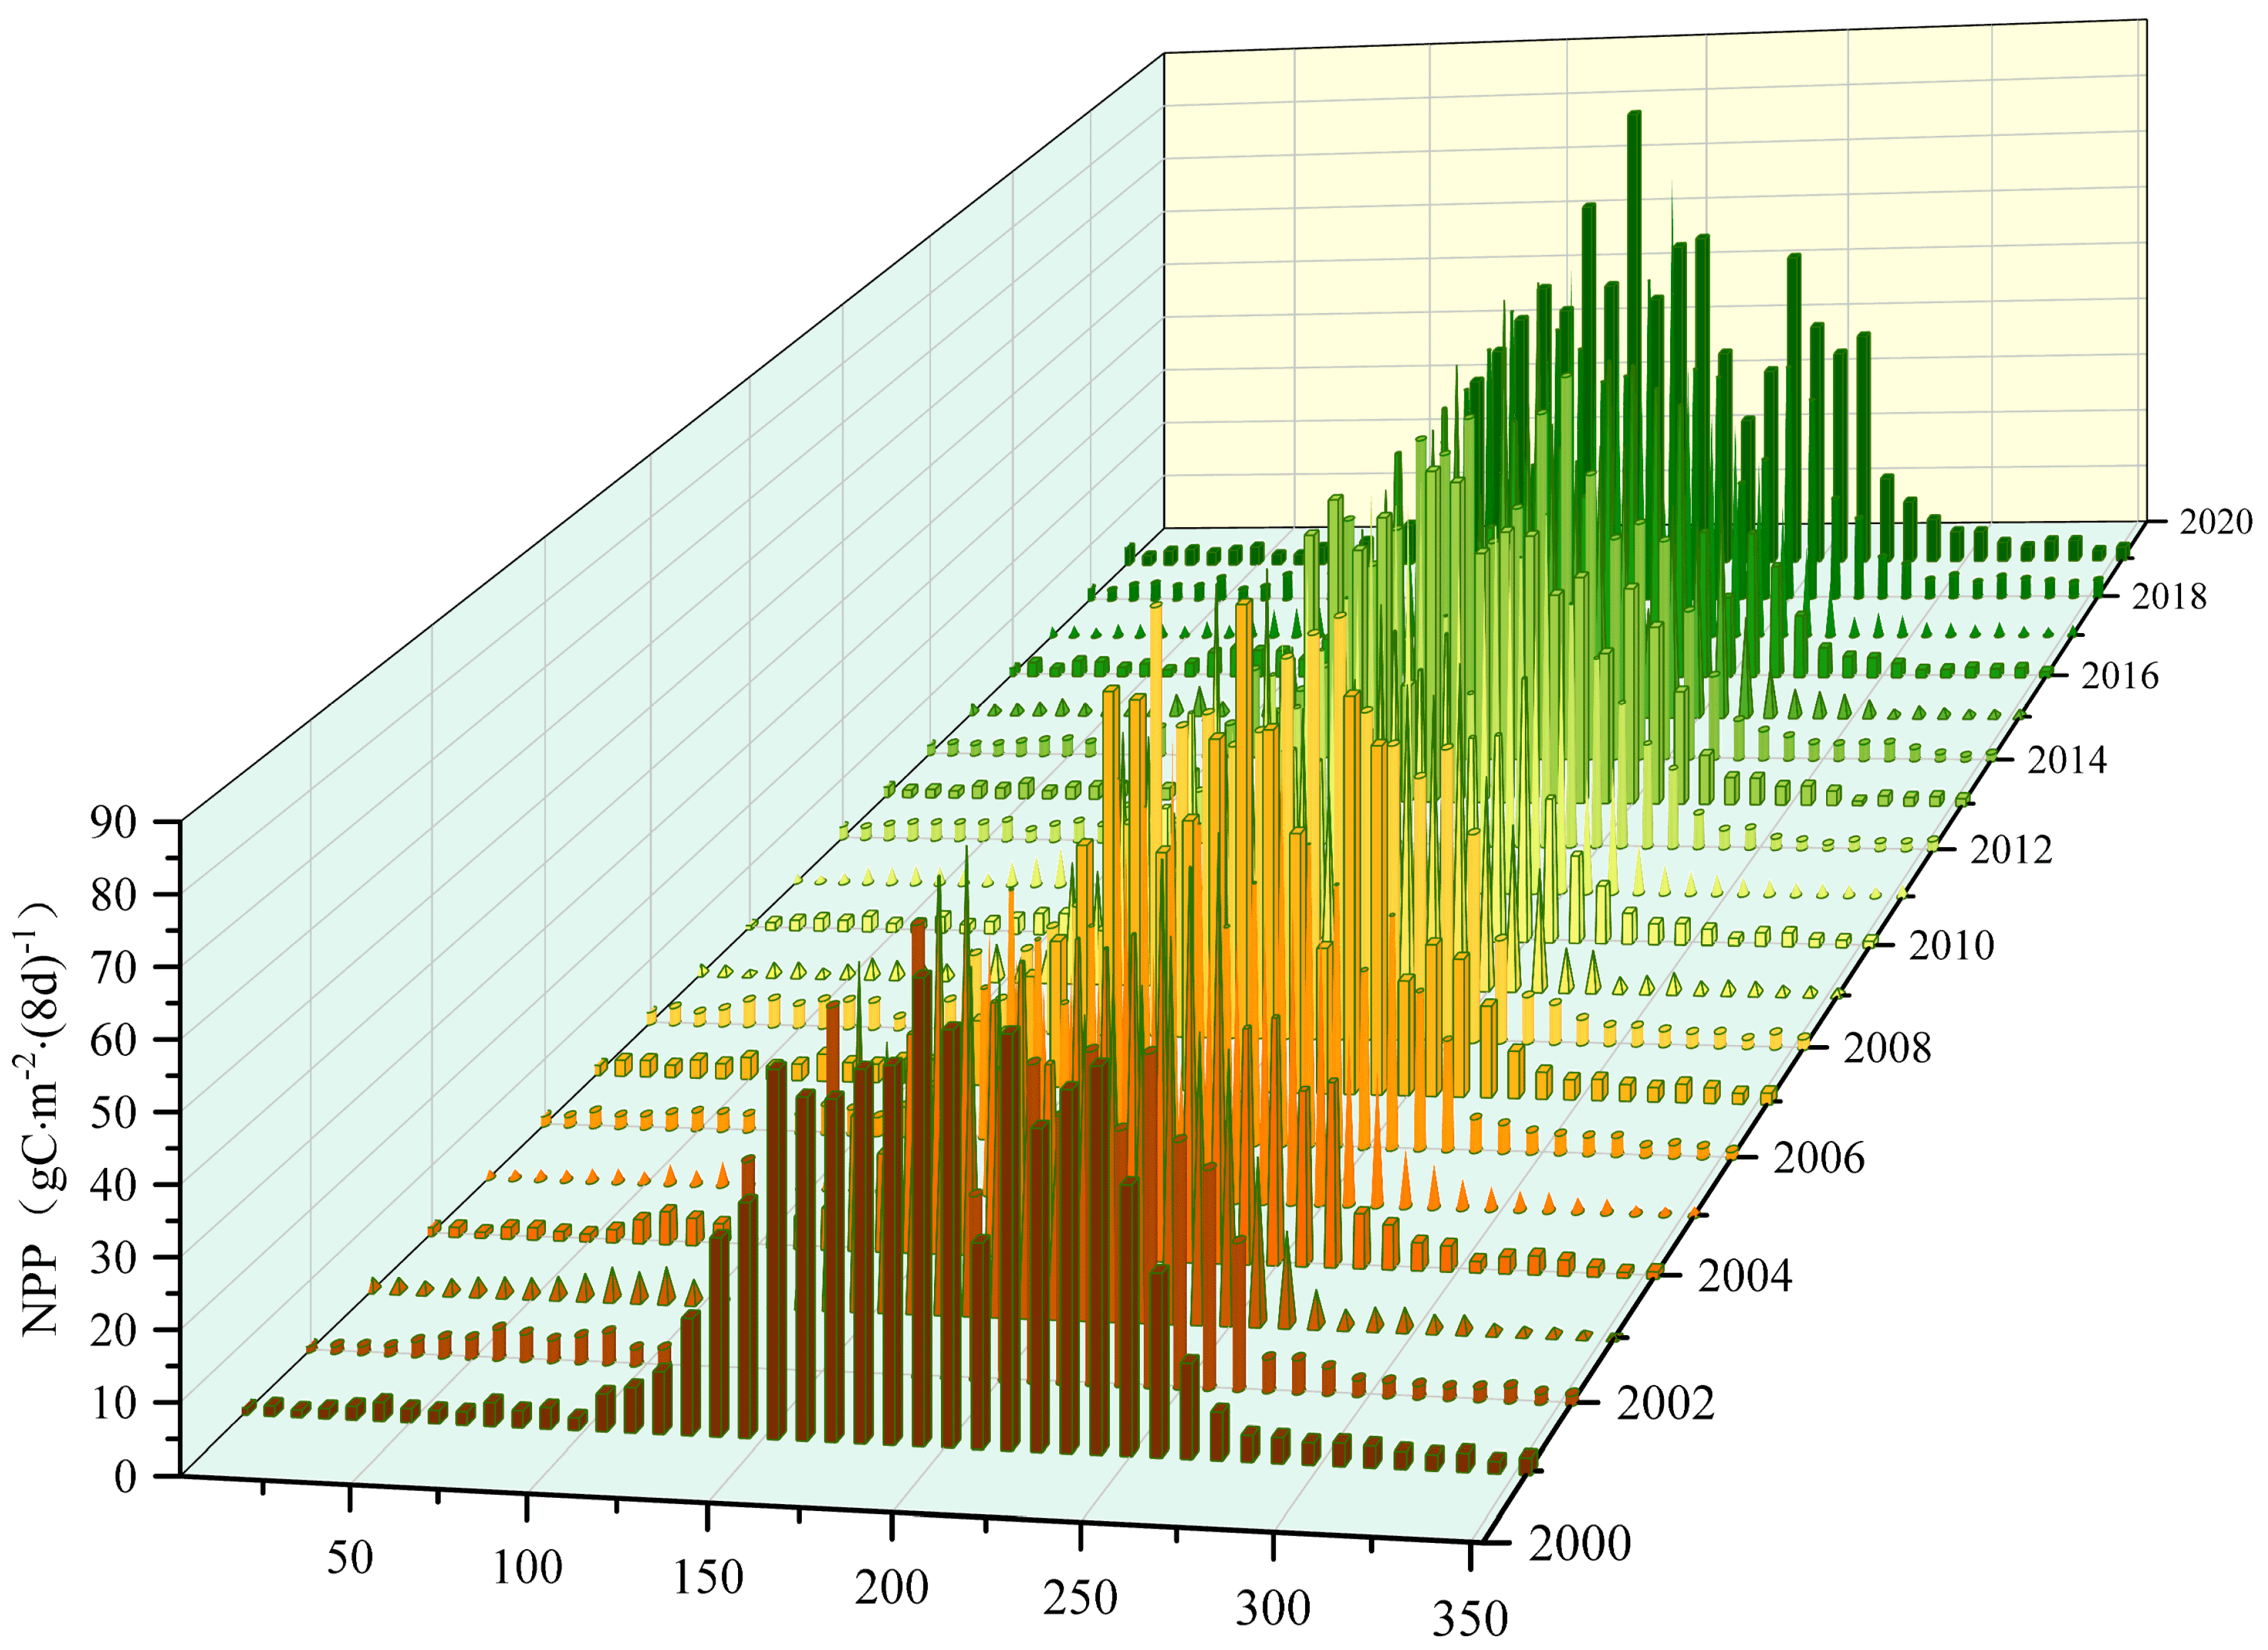
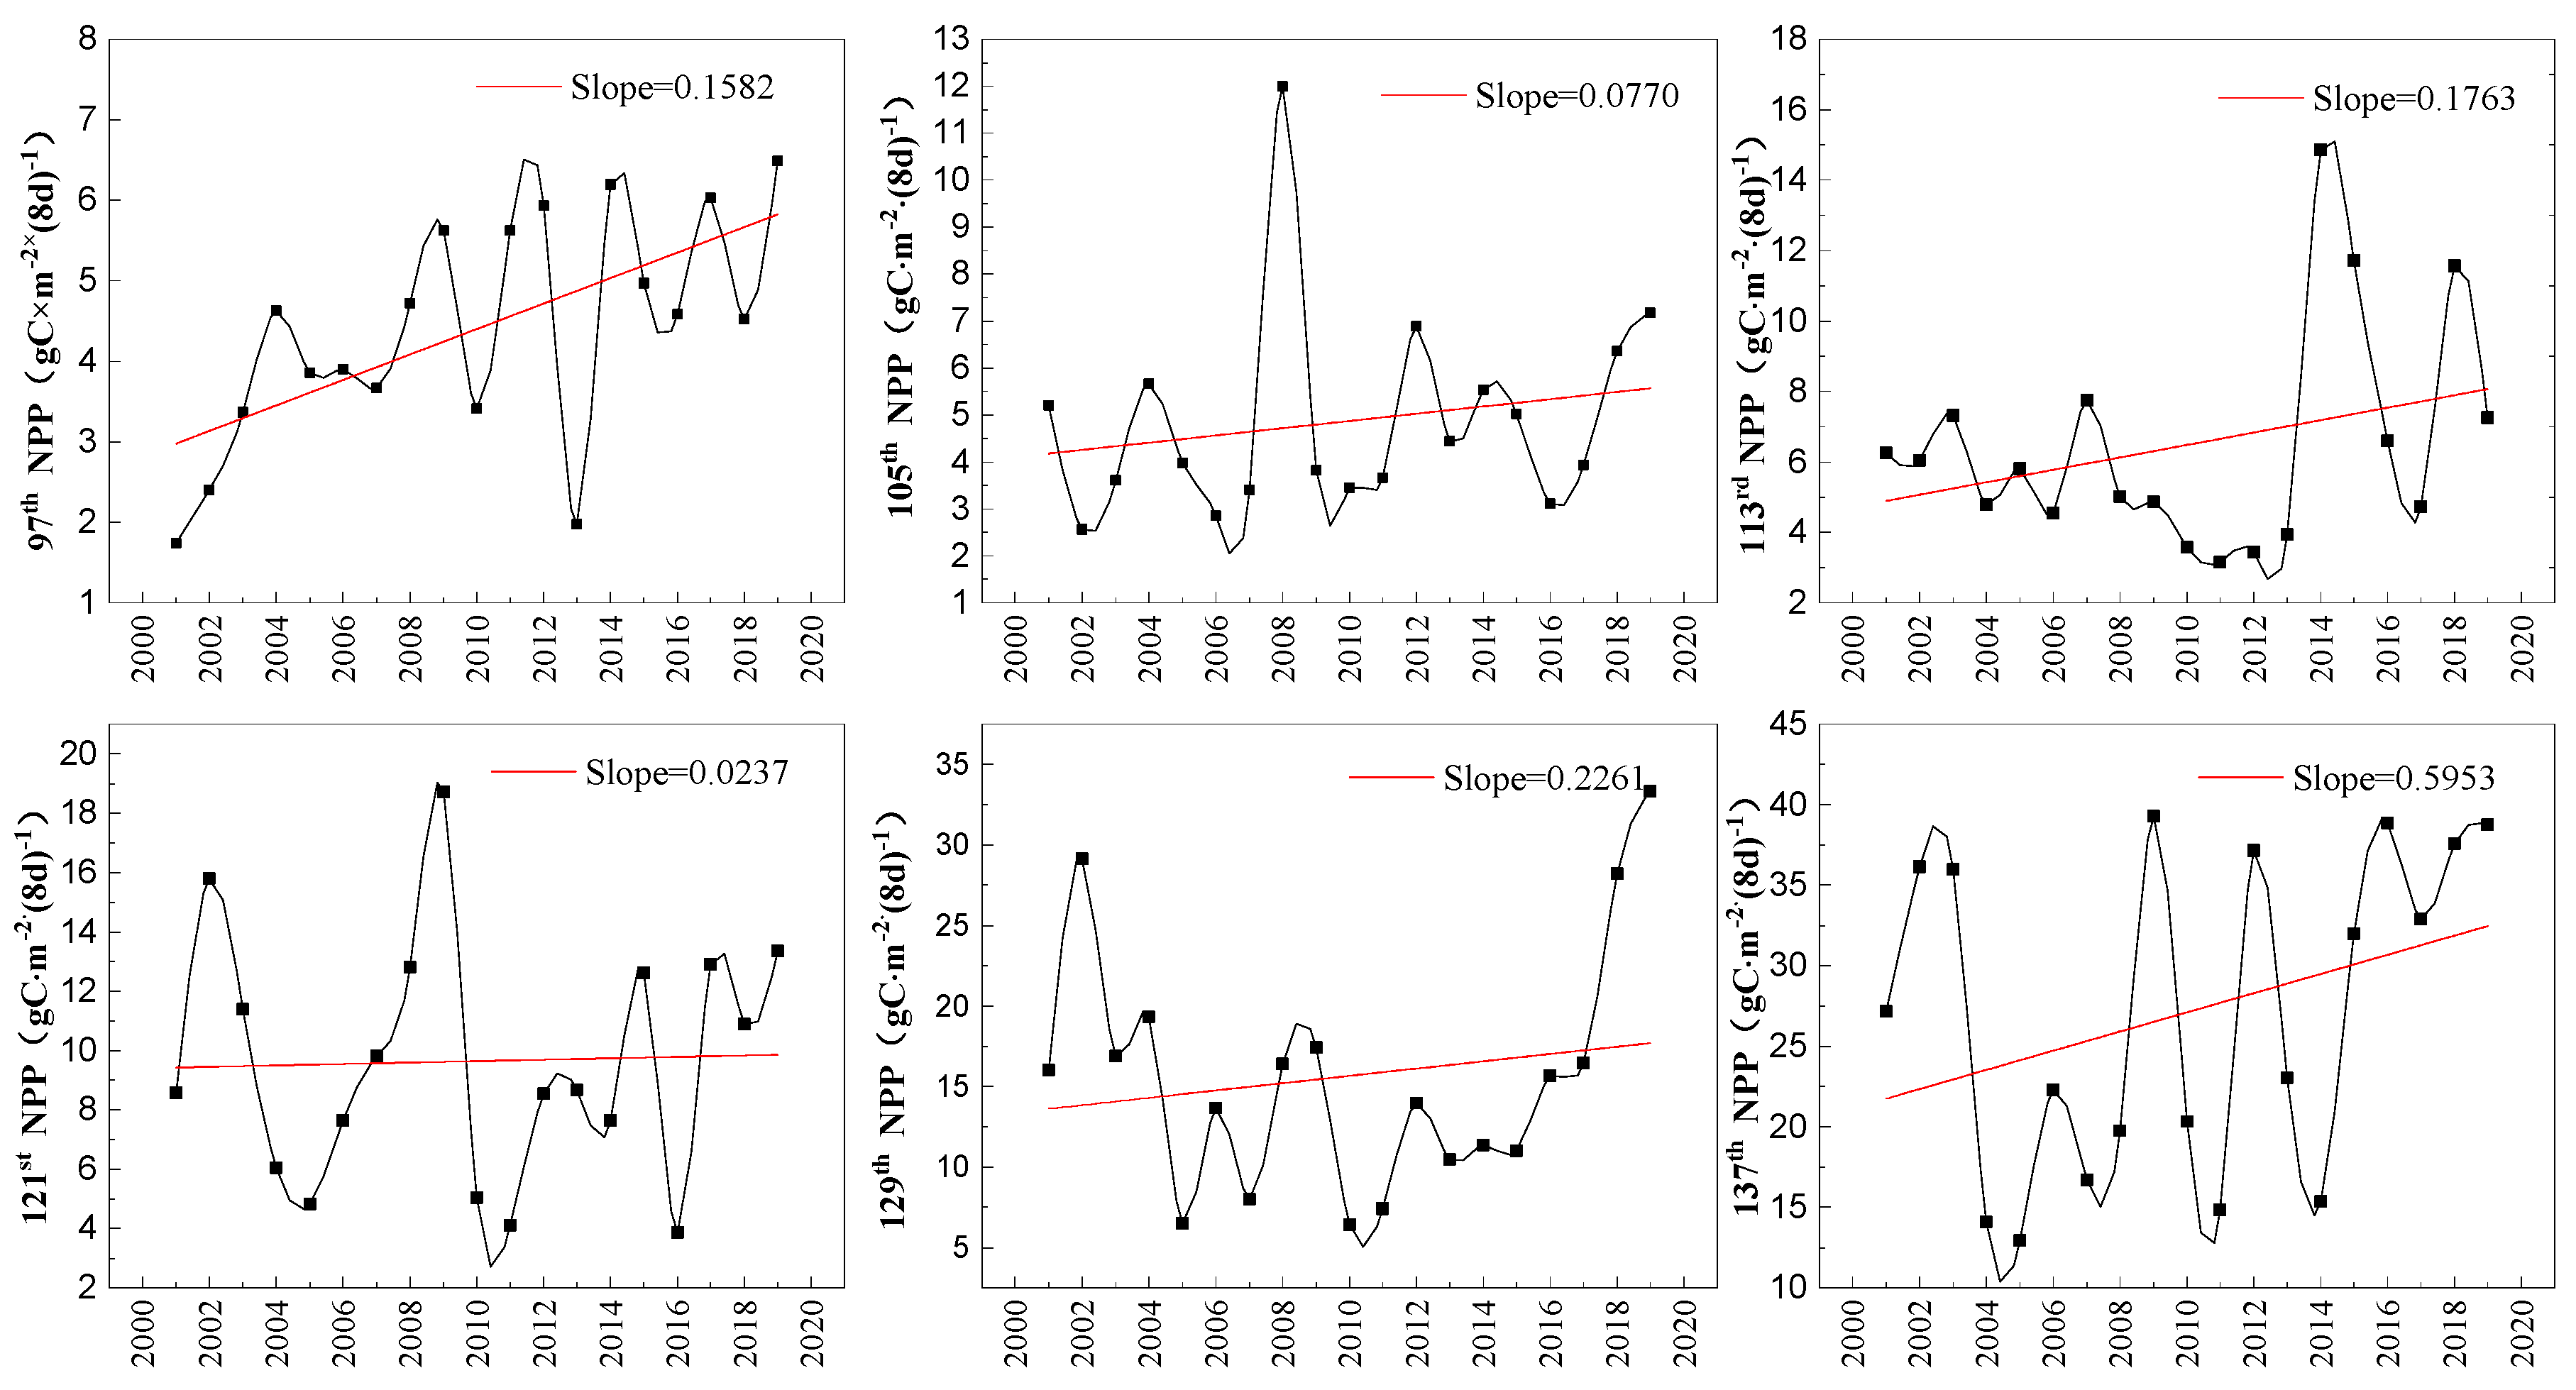
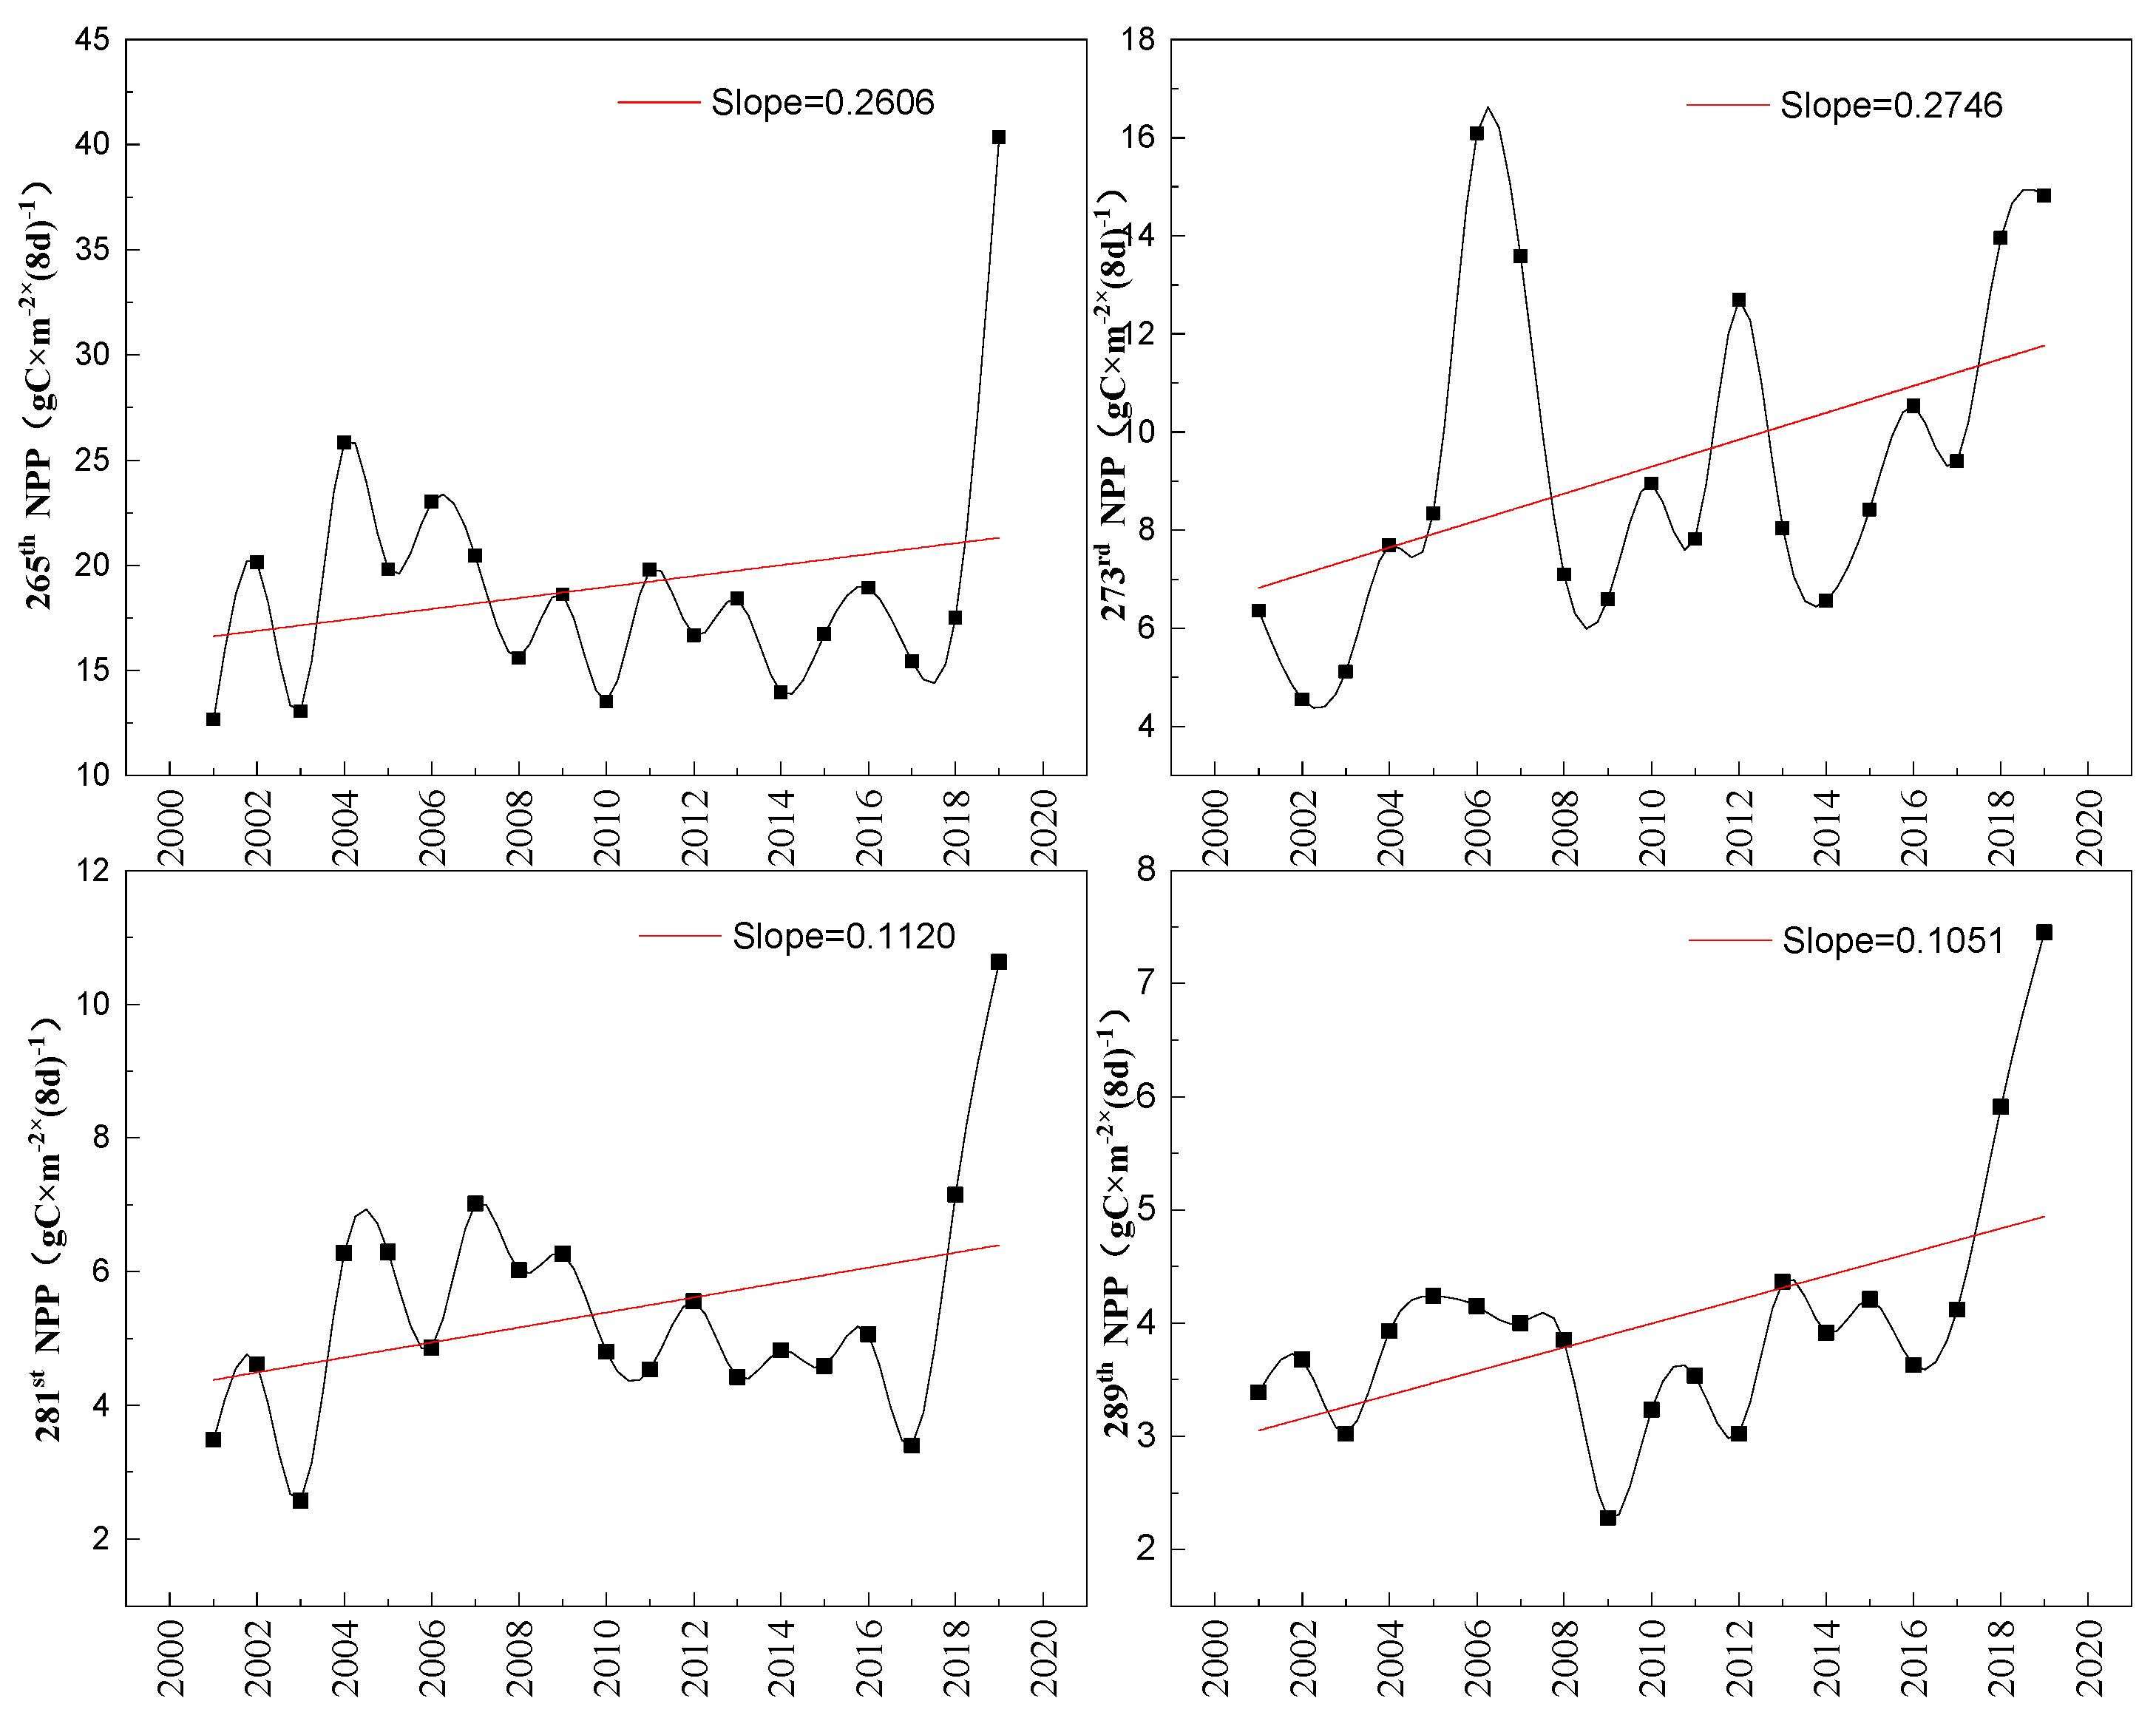
5.1.1. Variation Characteristics of Forests NPP from 2001 to 2019
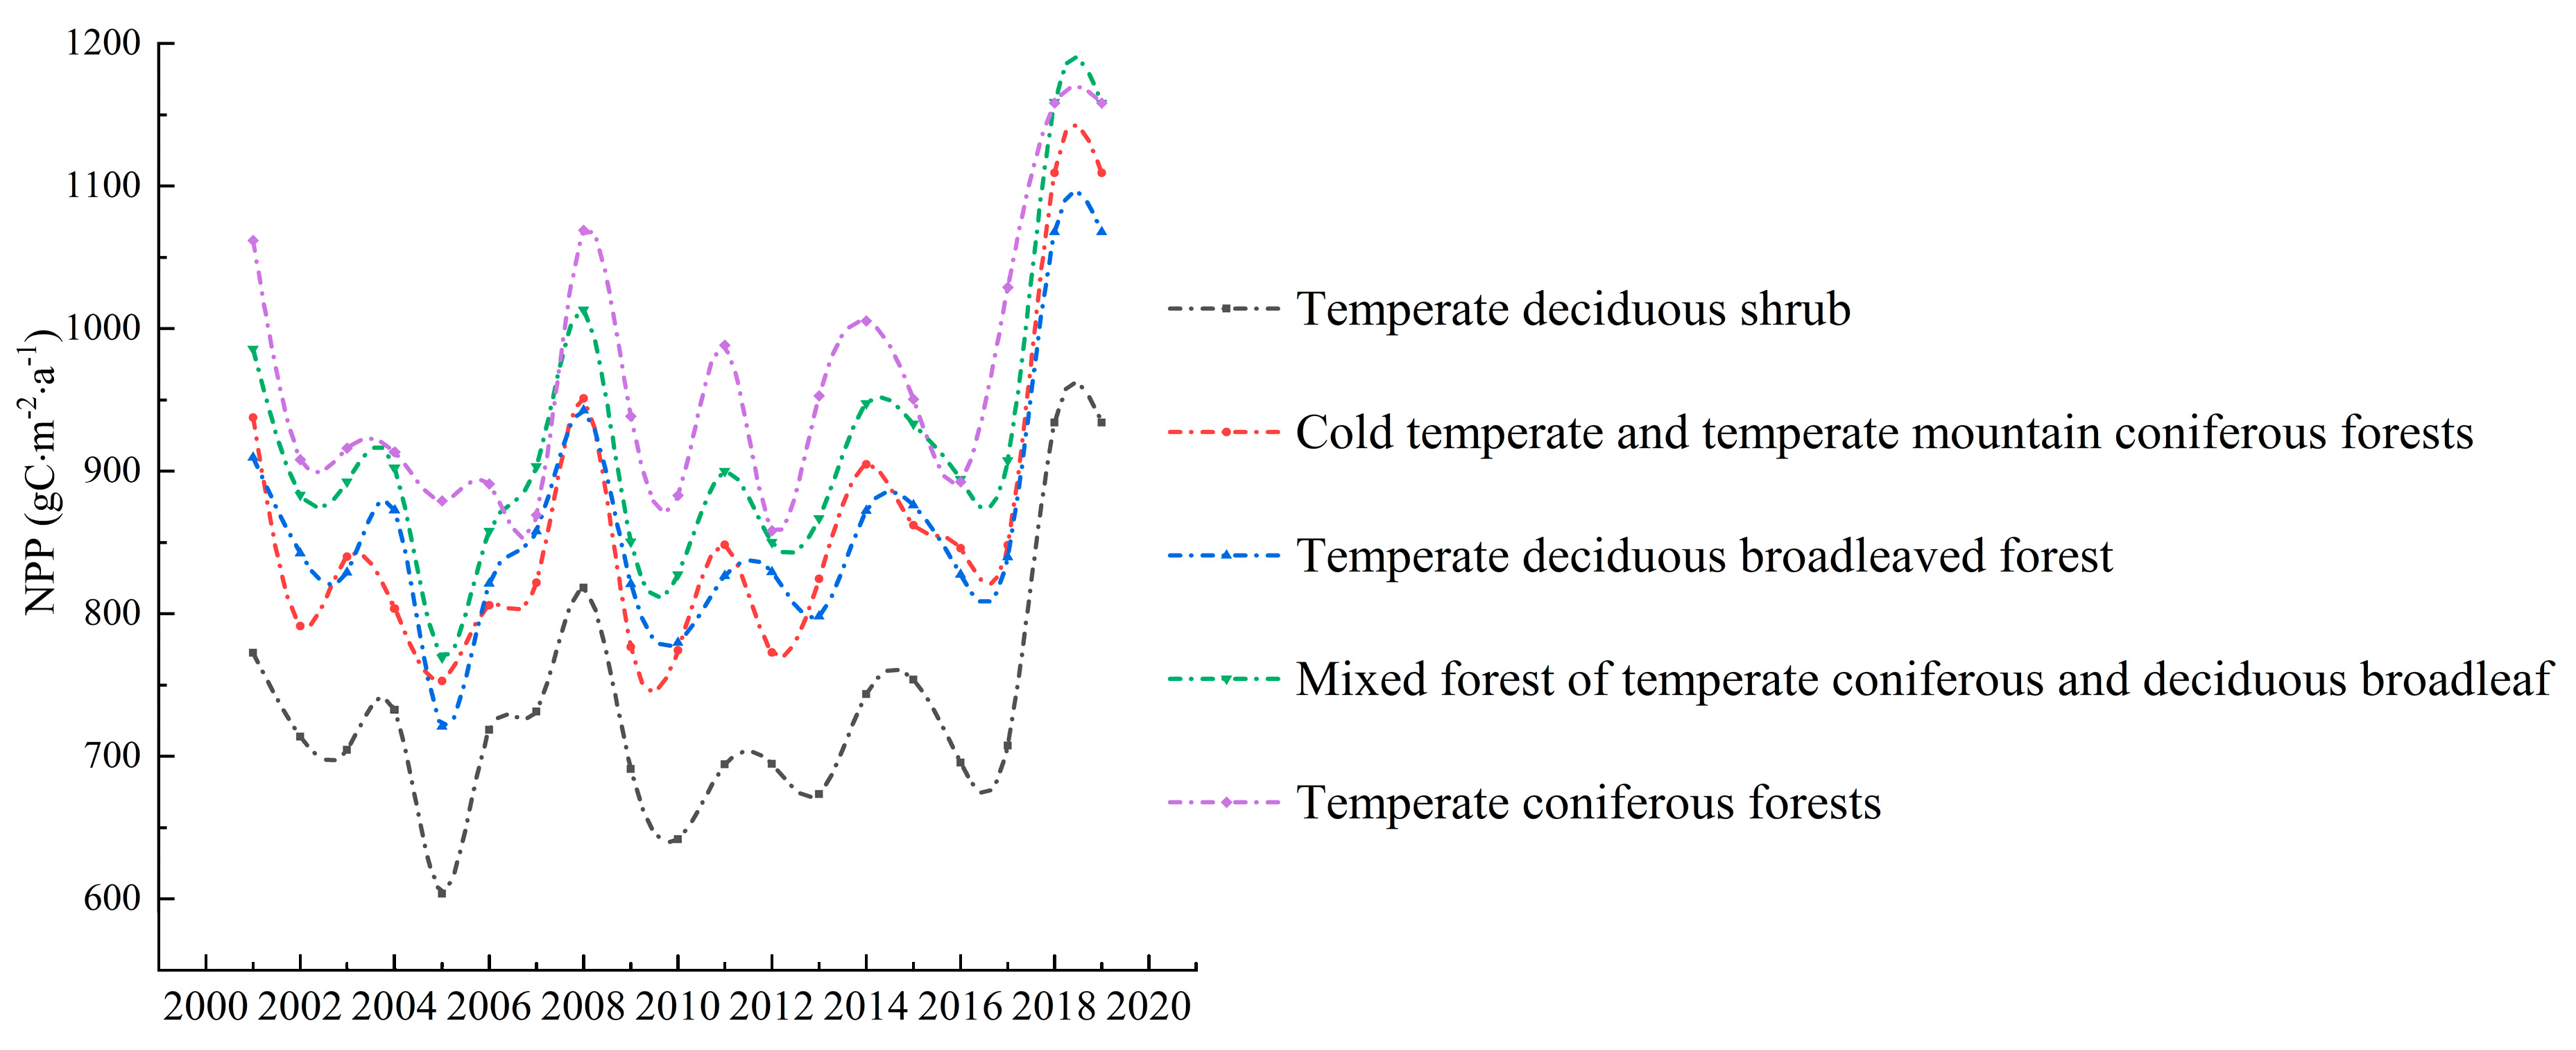
5.1.2. Inter-Annual Variation of NPP of Different Forests Types
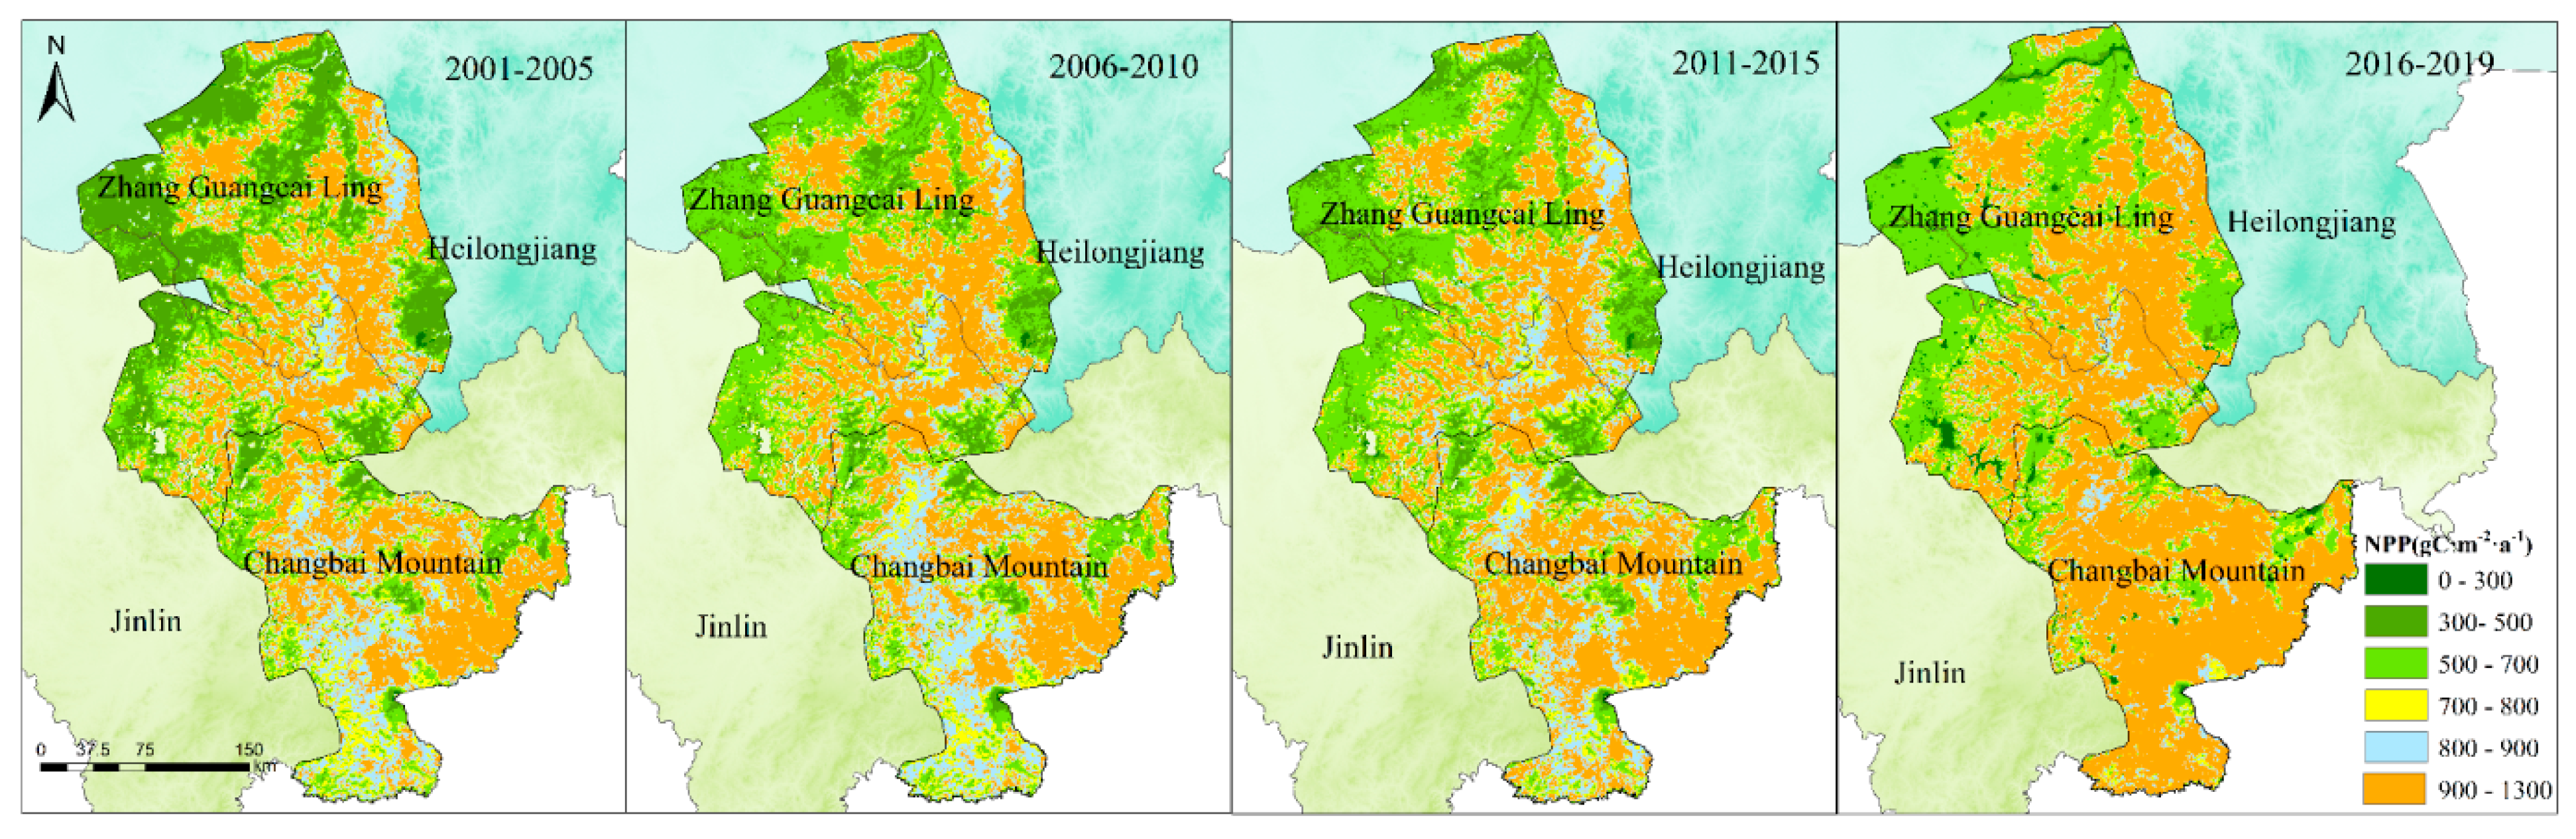
5.1.3. Spatial Evolution of NPP, from 2001 to 2019, in Northeast China, in Different Periods
5.2. Future Trend of Forests NPP in Northeast China
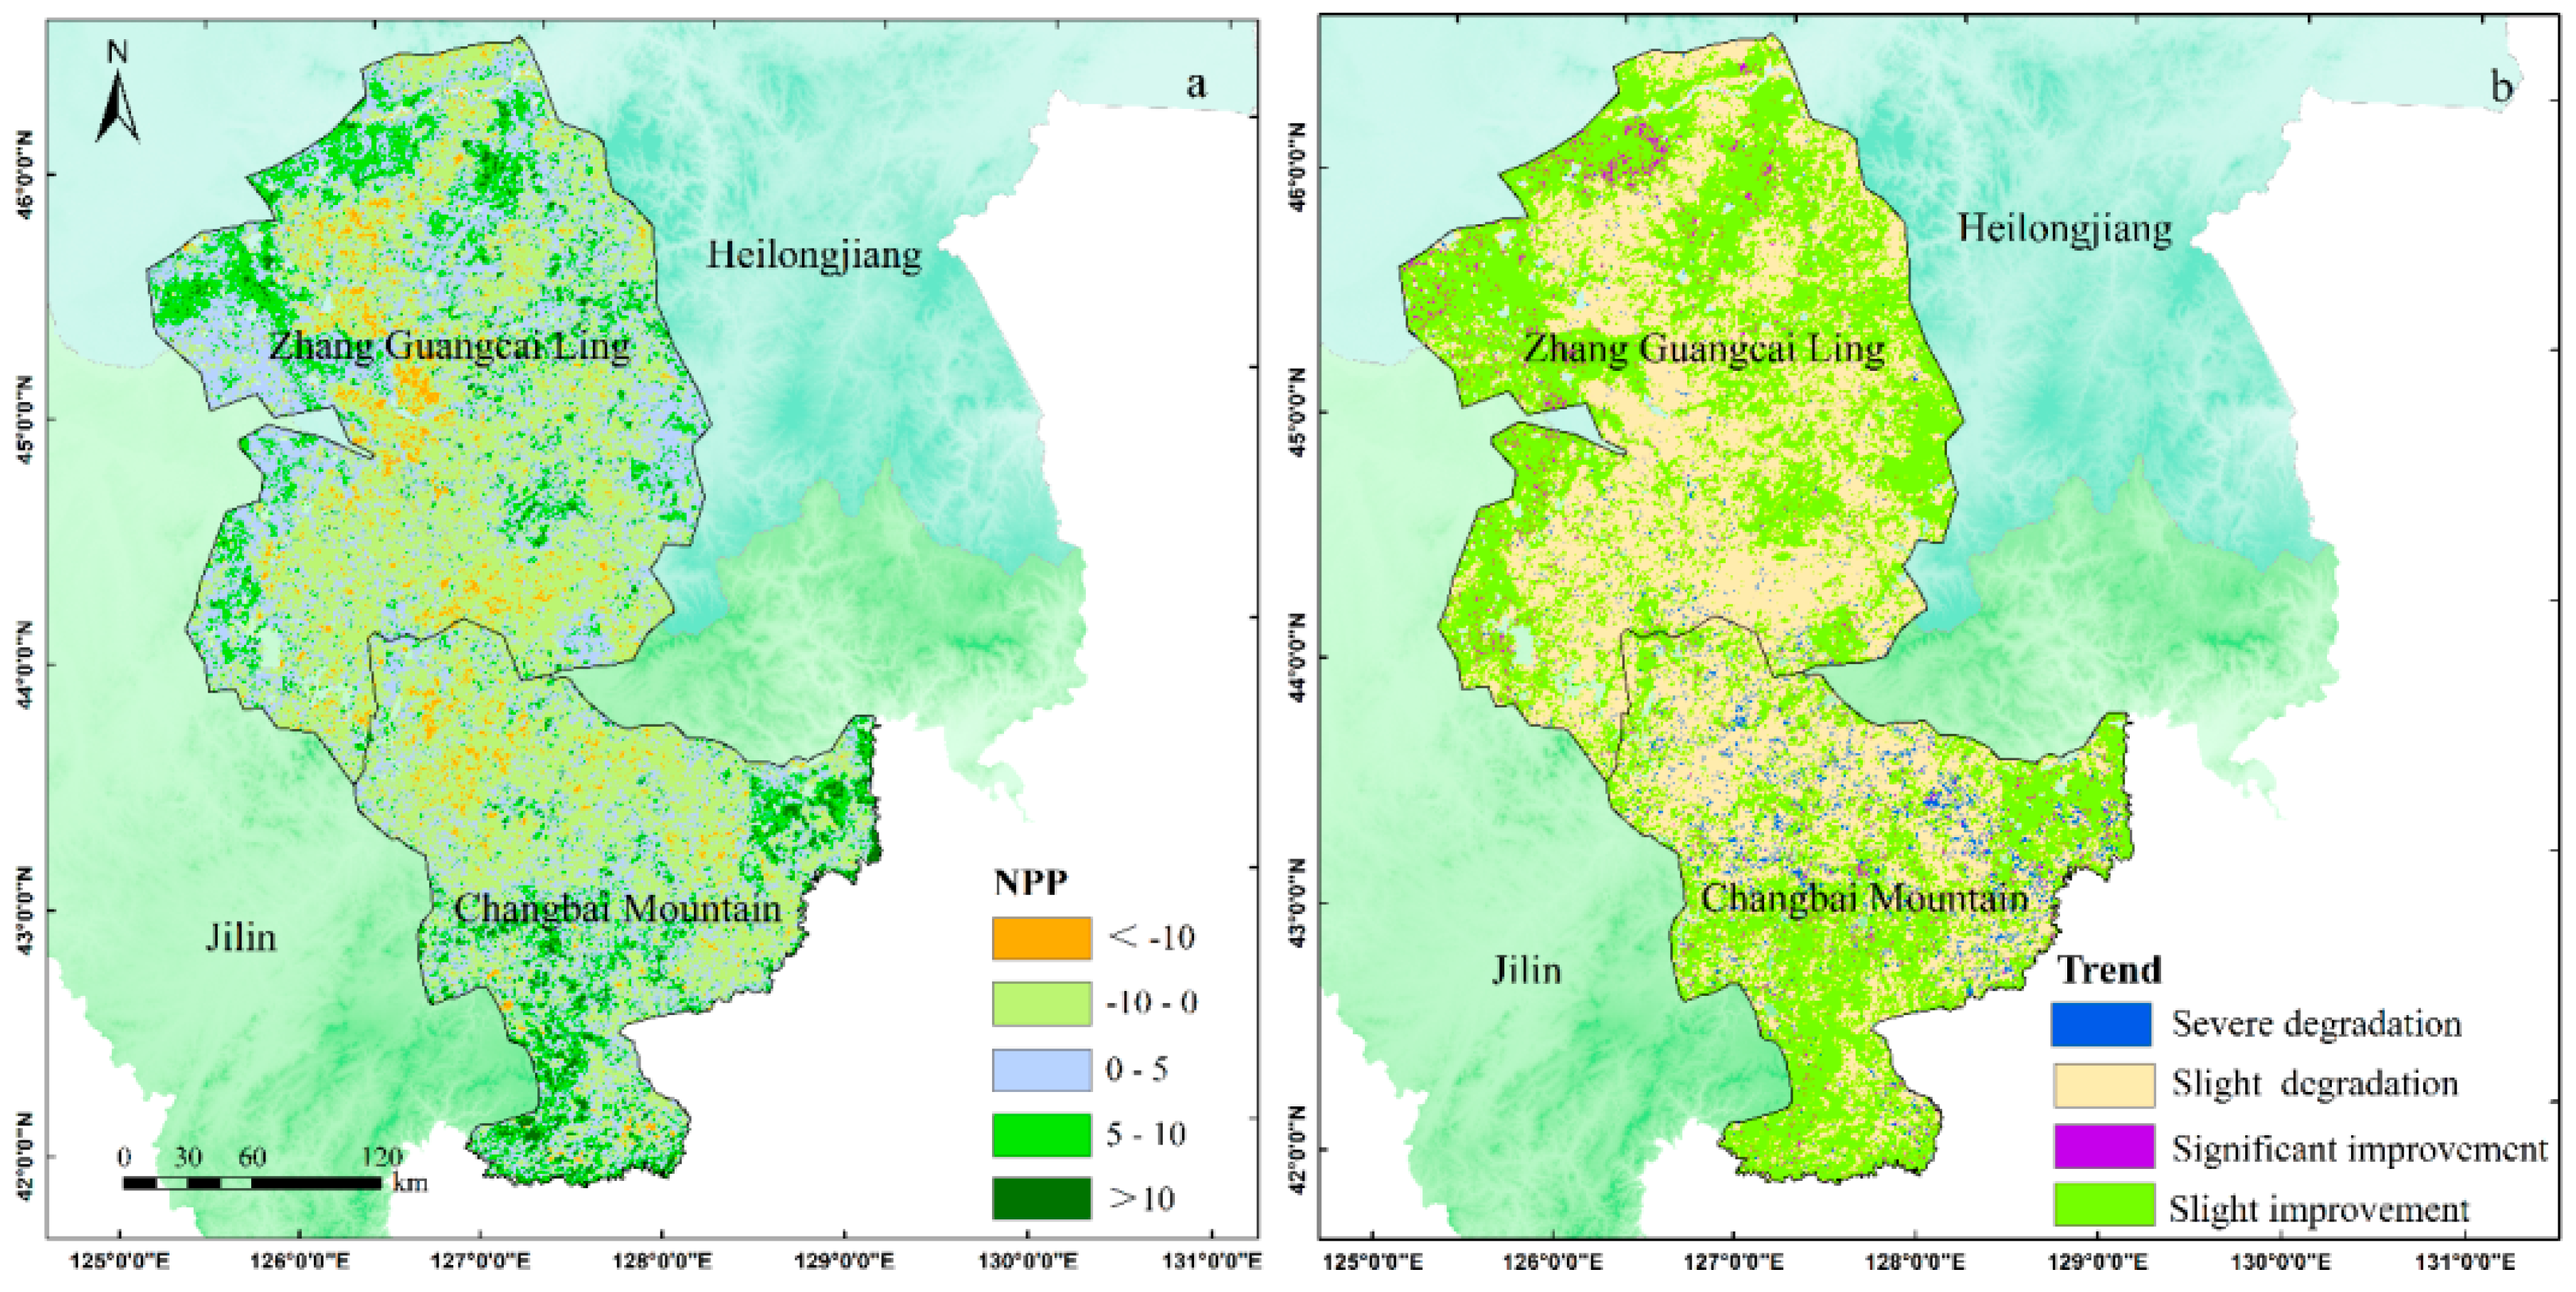
5.2.1. Analysis on Spatial Changing Trend of NPP, from 2001 to 2019, in Northeast China
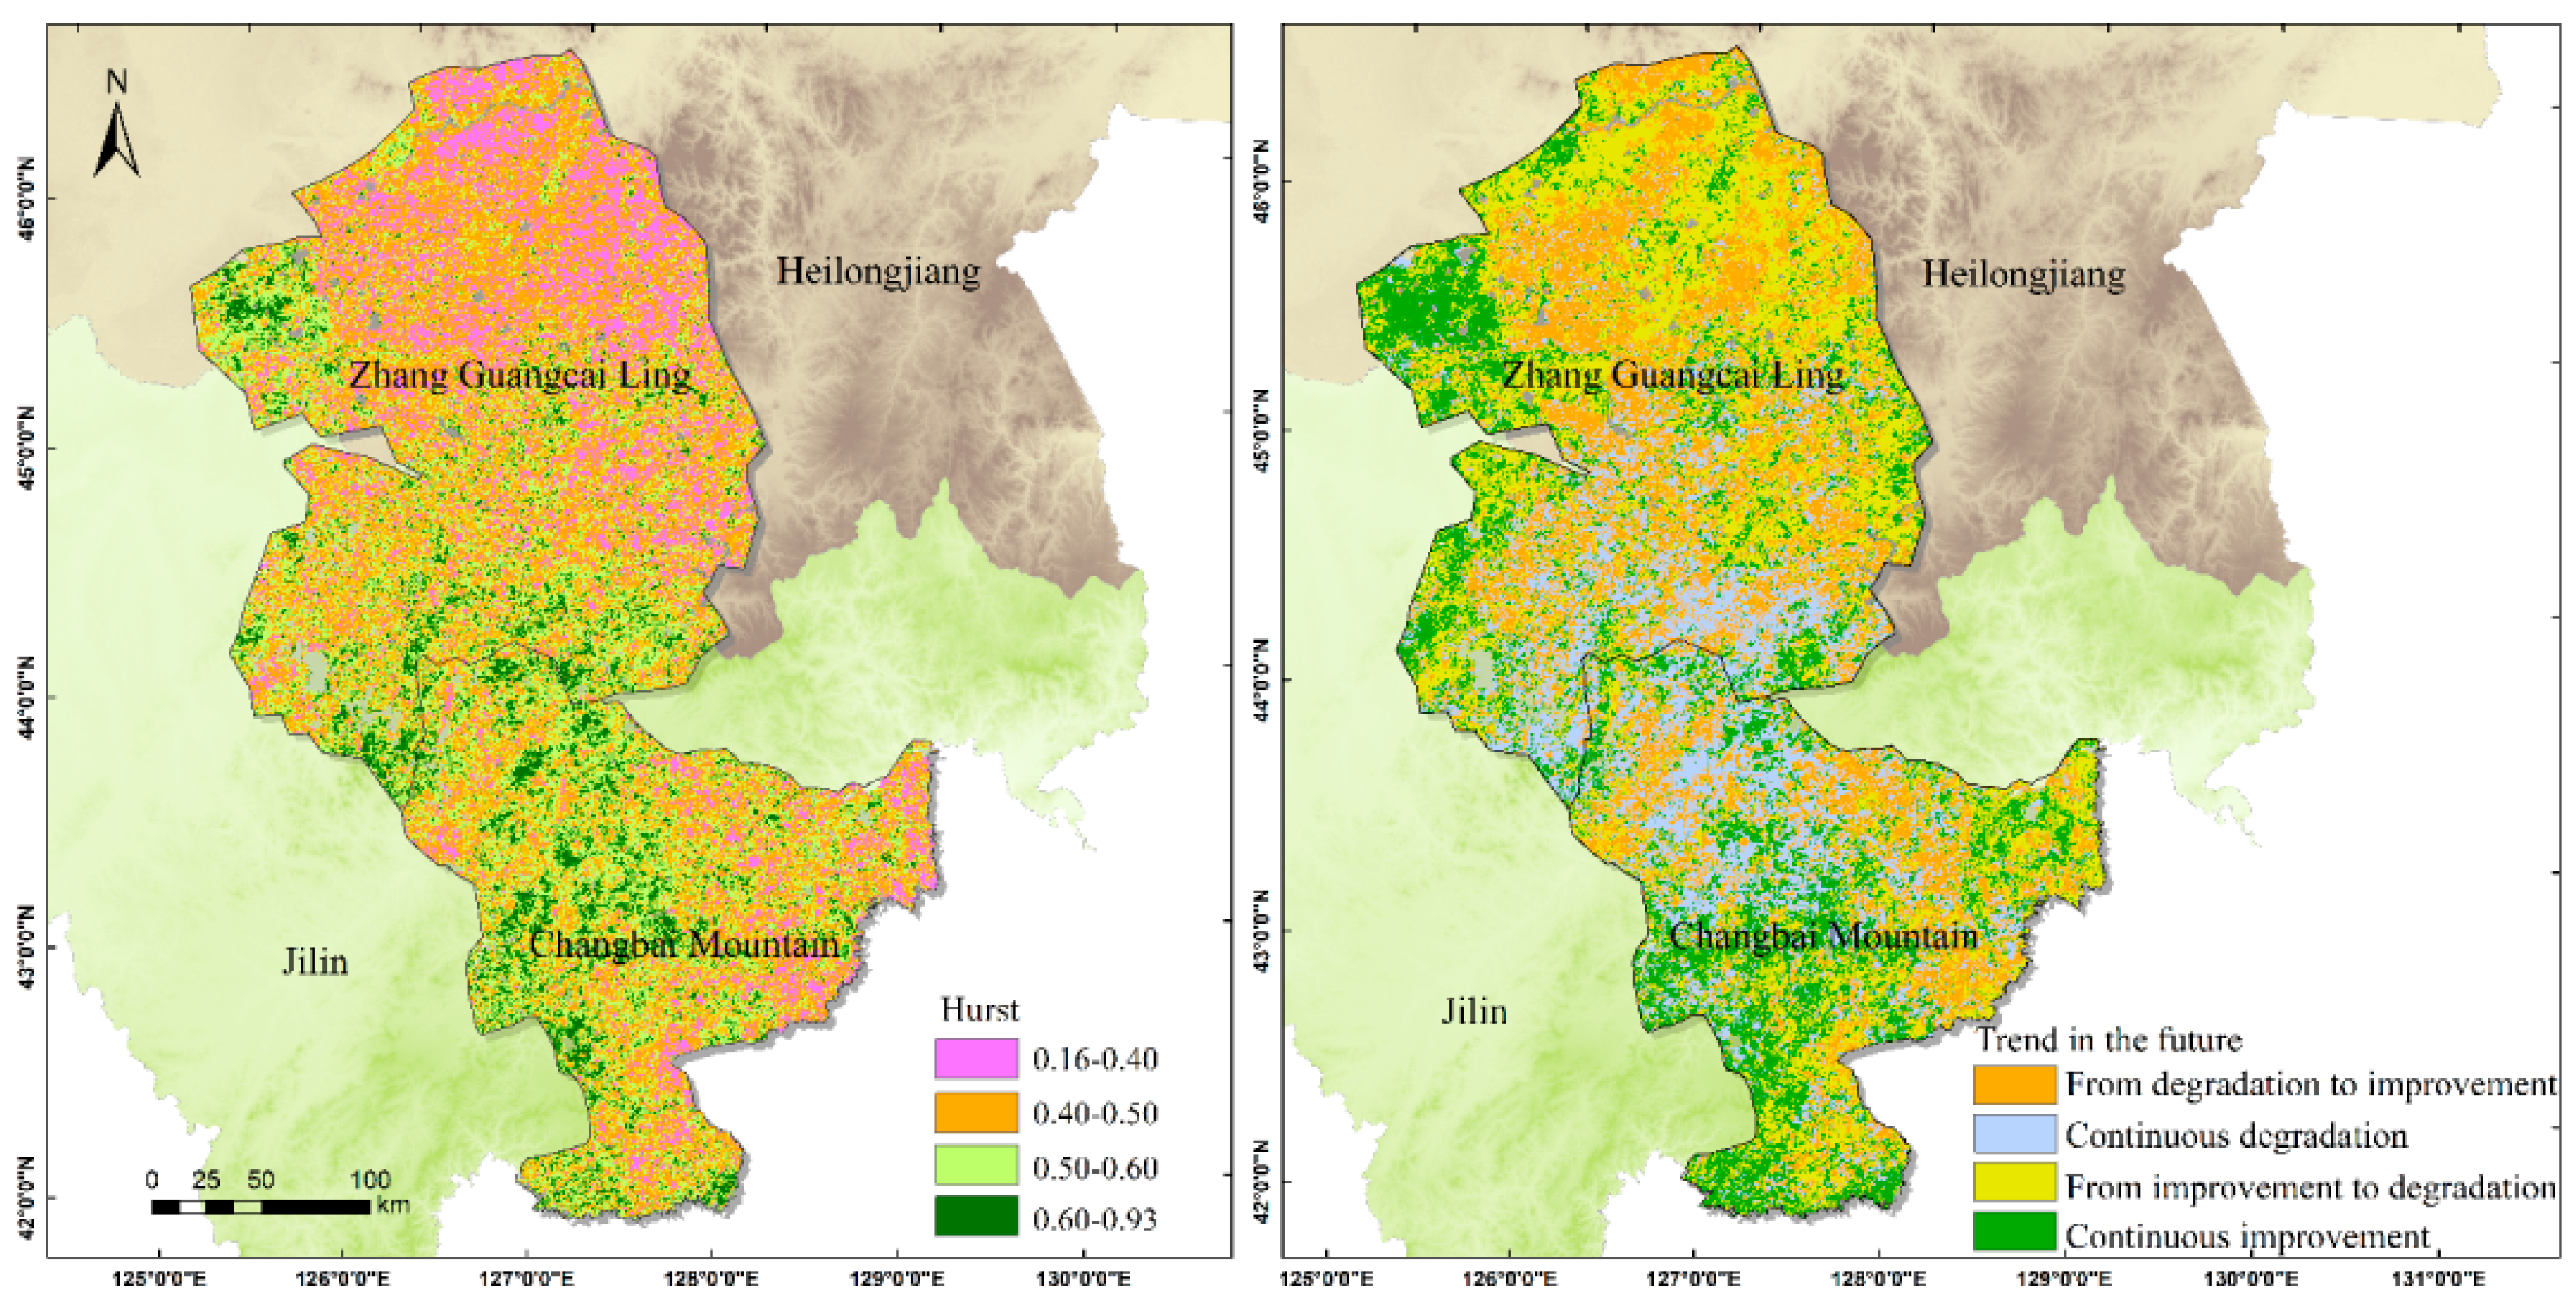
5.2.2. Future Trend of NPP in Northeast China
5.3. Phenology Regularity of Forests over Time in Northeast China
5.3.1. Phenology Regularity of Forest at the Start of the Vegetation Growth Season (SOS)
5.3.2. Phenology Regularity of Forest at the End of the Vegetation Growth Season (EOS)
6. Discussion
6.1. Optimization about Station-Temporal Regularity Exploration
6.2. Summaries of and Sustainability Exploration of Forests and the Outlook for Future Ecological Environment
6.3. Uncertainty Discussions for Phenology Regularity in Northeast China
6.4. Limitations in the NPP Estimation of GLO-PEM and Verification
7. Conclusions
Author Contributions
Funding
Acknowledgments
Conflicts of Interest
References
- Hansen, M.H.; Li, H.; Svarverud, R. Ecological civilization: Interpreting the Chinese past, projecting the global future. Glob. Environ. Chang. 2018, 53, 195–203. [Google Scholar] [CrossRef]
- Zhang, M.; Liu, Y.; Wu, J.; Wang, T. Index system of urban resource and environment carrying capacity based on ecological civilization. Environ. Impact Assess. Rev. 2018, 68, 90–97. [Google Scholar] [CrossRef]
- Pacala, S.W.; Hurtt, G.C.; Baker, D.; Peylin, P.; Houghton, R.A.; Birdsey, R.A.; Heath, L.; Sundquist, E.T.; Stallard, R.F.; Ciais, P.; et al. Consistent Land- and Atmosphere-Based U.S. Carbon Sink Estimates. Science 2001, 292, 2316–2320. [Google Scholar] [CrossRef] [PubMed] [Green Version]
- Peng, C.; Zhou, X.; Zhao, S.; Wang, X.; Zhu, B.; Piao, S.; Fang, J. Quantifying the response of forest carbon balance to future climate change in Northeastern China: Model validation and prediction. Glob. Planet. Chang. 2009, 66, 179–194. [Google Scholar] [CrossRef]
- Schulze, E.D.; Heimann, M.; Harrison, S.; Holland, E.; Lloyd, J.; Prentice, I.C.; Schimel, D.S. Global Biogeochemical Cycles in the Climate System; Academic Press: Cambridge, MA, USA, 2001. [Google Scholar] [CrossRef]
- Alexandra, M.; Olschewski, R.; Unterberger, C.; Knoke, T. The valuation of forest ecosystem services as a tool for management planning–a choice experiment. J. Environ. Manag. 2020, 271, 111008. [Google Scholar]
- Choi, S.-D.; Lee, K.; Chang, Y.-S. Large rate of uptake of atmospheric carbon dioxide by planted forest biomass in Korea. Glob. Biogeochem. Cycles 2002, 16, 36-1–36-5. [Google Scholar] [CrossRef]
- Fang, J.Y.; Oikawa, T.; Kato, W.M.; Wang, Z. Biomass carbon accumulation by Japan’s forests from 1947 to 1995. Glob. Biogeochem. Cycles 2005, 19. [Google Scholar] [CrossRef]
- Griffiths, P.; Kuemmerle, T.; Baumann, M.; Radeloff, V.C.; Abrudan, I.V.; Lieskovský, J.; Munteanu, C.; Ostapowicz, K.; Hostert, P. Forest disturbances, forest recovery, and changes in forest types across the Carpathian ecoregion from 1985 to 2010 based on Landsat image composites. Remote Sens. Environ. 2014, 151, 72–88. [Google Scholar] [CrossRef]
- Hopkinson, C.; Chasmer, L.; Barr, A.; Kljun, N.; Black, T.A.; McCaughey, J. Monitoring boreal forest biomass and carbon storage change by integrating airborne laser scanning, biometry and eddy covariance data. Remote Sens. Environ. 2016, 181, 82–95. [Google Scholar] [CrossRef] [Green Version]
- Tan, L.M.; Arbabi, H.; Brockway, P.; Tingley, D.D.; Mayfield, M. An ecological-thermodynamic approach to urban metabolism: Measuring resource utilization with open system network effectiveness analysis. Appl. Energy 2019, 254, 254. [Google Scholar] [CrossRef]
- Baeza, S.; Paruelo, J.M. Spatial and temporal variation of human appropriation of net primary production in the Rio de la Plata grasslands. ISPRS J. Photogramm. Remote Sens. 2018, 145, 238–249. [Google Scholar] [CrossRef]
- Buchholz, T.; Keeton, W.S.; Gunn, J.S. Economics of integrated harvests with biomass for energy in non-industrial forests in the northeastern US forest. For. Policy Econ. 2019, 109, 102023. [Google Scholar] [CrossRef]
- Yan, Y.; Liu, X.; Wang, F.; Li, X.; Ou, J.; Wen, Y.; Liang, X. Assessing the impacts of urban sprawl on net primary productivity using fusion of Landsat and MODIS data. Sci. Total Environ. 2018, 1417–1429. [Google Scholar] [CrossRef] [PubMed]
- Miyazaki, S.; Ishikawa, M.; Baatarbileg, N.; Damdinsuren, S.; Ariuntuya, N.; Jambaljav, Y. Interannual and seasonal variations in energy and carbon exchanges over the larch forests on the permafrost in northeastern Mongolia. Polar Sci. 2014, 8, 166–182. [Google Scholar] [CrossRef] [Green Version]
- Yuan, M.; Zhao, L.; Lin, A.; Wang, L.; Li, Q.; She, D.; Qu, S. Impacts of preseason drought on vegetation spring phenology across the Northeast China Transect. Sci. Total Environ. 2020, 738, 140297. [Google Scholar] [CrossRef]
- Bandaru, V.; West, T.O.; Ricciuto, D.M.; Izaurralde, R.C. Estimating crop net primary production using national inventory data and MODIS-derived parameters. ISPRS J. Photogramm. Remote Sens. 2013, 80, 61–71. [Google Scholar] [CrossRef]
- Abdi, A.M.; Seaquist, J.; Tenenbaum, D.E.; Eklundh, L.; Ardö, J. The supply and demand of net primary production in the Sahel. Environ. Res. Lett. 2014, 9, 094003. [Google Scholar] [CrossRef]
- DeLucia, E.H.; Drake, J.E.; Thomas, R.B.; Gonzalez-Meler, M. Forest carbon use efficiency: Is respiration a constant fraction of gross primary production? Glob. Chang. Biol. 2007, 13, 1157–1167. [Google Scholar] [CrossRef] [Green Version]
- Chen, A.; Li, R.; Wang, H.; He, B. Quantitative assessment of human appropriation of aboveground net primary production in China. Ecol. Model. 2015, 312, 54–60. [Google Scholar] [CrossRef] [Green Version]
- Wang, G.; Guan, D.; Xiao, L.; Peart, M. Forest biomass-carbon variation affected by the climatic and topographic factors in Pearl River Delta, South China. J. Environ. Manag. 2019, 232, 781–788. [Google Scholar] [CrossRef]
- Forrester, D.I.; Tang, X. Analysing the spatial and temporal dynamics of species interactions in mixed-species forests and the effects of stand density using the 3-PG model. Ecol. Model. 2016, 319, 233–254. [Google Scholar] [CrossRef]
- Zhao, M.; Yang, J.; Zhao, N.; Liu, Y.; Wang, Y.; Wilson, J.P.; Yue, T. Estimation of China’s forest stand biomass carbon sequestration based on the continuous biomass expansion factor model and seven forest inventories from 1977 to 2013. For. Ecol. Manag. 2019, 448, 528–534. [Google Scholar] [CrossRef]
- Van Holsbeeck, S.; Srivastava, S.K. Feasibility of locating biomass-to-bioenergy conversion facilities using spatial information technologies: A case study on forest biomass in Queensland, Australia. Biomass Bioenergy 2020, 139, 105620. [Google Scholar] [CrossRef]
- Matsushita, B.; Xu, M.; Chen, J.; Kameyama, S.; Tamura, M. Estimation of regional net primary productivity (NPP) using a process-based ecosystem model: How important is the accuracy of climate data? Ecol. Model. 2004, 178, 371–388. [Google Scholar] [CrossRef]
- Gustavsson, L.; Haus, S.; Ortiz, C.A.; Sathre, R.; Le Truong, N. Climate effects of bioenergy from forest residues in comparison to fossil energy. Appl. Energy 2015, 138, 36–50. [Google Scholar] [CrossRef]
- Zhang, R.; Liang, T.; Guo, J.; Xie, H.; Feng, Q.; Aimaiti, Y. Grassland dynamics in response to climate change and human activities in Xinjiang from 2000 to 2014. Sci. Rep. 2018, 8, 1–11. [Google Scholar] [CrossRef]
- Xiao, X.; Hollinger, D.; Aber, J.; Goltz, M.; Davidson, E.A.; Zhang, Q.; Moore, B. Satellite-based modeling of gross primary production in an evergreen needleleaf forest. Remote Sens. Environ. 2004, 89, 519–534. [Google Scholar] [CrossRef]
- Xiao, X.; Zhang, Q.; Braswell, B.; Urbanski, S.; Boles, S.; Wofsy, S. Modeling gross primary production of temperate deciduous broadleaf forest using satellite images and climate data. Remote Sens. Environ. 2004, 91, 256–270. [Google Scholar] [CrossRef]
- Potter, C.; Randerson, J.T.; Field, C.B.; Matson, P.A.; Vitousek, P.M.; Mooney, H.A.; Klooster, S.A. Terrestrial ecosystem production: A process model based on global satellite and surface data. Glob. Biogeochem. Cycles 1993, 7, 811–841. [Google Scholar] [CrossRef]
- Prince, S.D.; Goward, S.N. Global Primary Production: A Remote Sensing Approach. J. Biogeogr. 1995, 22, 815. [Google Scholar] [CrossRef]
- Running, S.W.; Thornton, P.E.; Nemani, R.; Glassy, J.M. Global Terrestrial Gross and Net Primary Productivity from the Earth Observing System. Methods Ecosyst. Sci. 2000, 44–57. [Google Scholar] [CrossRef]
- Huang, C.-Y.; Asner, G.P.; Barger, N.N. Modeling regional variation in net primary production of pinyon–juniper ecosystems. Ecol. Model. 2012, 227, 82–92. [Google Scholar] [CrossRef]
- Li, J.; Cui, Y.; Liu, J.; Shi, W.; Qin, Y. Estimation and analysis of net primary productivity by integrating MODIS remote sensing data with a light use efficiency model. Ecol. Model. 2013, 252, 3–10. [Google Scholar] [CrossRef]
- Zhang, G.Q.; Zhu, J.J.; Li, R.P. Estimation of photosynthetically active radiation (par) using sunshine duration. Chin. J. Ecol. 2015, 34, 3560. [Google Scholar]
- Zhang, L.-X.; Zhou, D.-C.; Fan, J.-W.; Hu, Z.-M. Comparison of four light use efficiency models for estimating terrestrial gross primary production. Ecol. Model. 2015, 300, 30–39. [Google Scholar] [CrossRef] [Green Version]
- Che, T.; Dai, L.; Zheng, X.; Li, X.; Zhao, K. Estimation of snow depth from passive microwave brightness temperature data in forest regions of northeast China. Remote Sens. Environ. 2016, 183, 334–349. [Google Scholar] [CrossRef]
- Xiao, J.; Chevallier, F.; Gomez, C.; Guanter, L.; Hicke, J.A.; Huete, A.R.; Ichii, K.; Ni, W.; Pang, Y.; Rahman, A.F.; et al. Remote sensing of the terrestrial carbon cycle: A review of advances over 50 years. Remote Sens. Environ. 2019, 233, 111383. [Google Scholar] [CrossRef]
- White, K.; Pontius, J.; Schaberg, P.G. Remote sensing of spring phenology in northeastern forests: A comparison of methods, field metrics and sources of uncertainty. Remote Sens. Environ. 2014, 148, 97–107. [Google Scholar] [CrossRef]
- Song, K.; Ma, J.; Wen, Z.; Fang, C.; Shang, Y.; Zhao, Y.; Wang, M.; Du, J. Remote estimation of Kd (PAR) using MODIS and Landsat imagery for turbid inland waters in Northeast China. ISPRS J. Photogramm. Remote Sens. 2017, 123, 159–172. [Google Scholar] [CrossRef]
- Wang, Y.B.; Zhao, Y.H.; Han, L.; Ao, Y. Spatio temporal variation of vegetation net primary productivity and its driving factors from 2000 to 2015 in Qinling-Daba Mountains China. Chin. J. Appl. Ecol. 2018, 29, 2373–2381. [Google Scholar]
- Wang, X.Y.; Zhao, C.Y.; Jia, Q.Y. Impacts of climate change on forest ecosystems in Northeast China. Adv. Clim. Chang. Res. 2013, 4, 230–241. [Google Scholar]
- Shi, M.; Yin, R.; Lv, H. An empirical analysis of the driving forces of forest cover change in northeast China. For. Policy Econ. 2017, 78, 78–87. [Google Scholar] [CrossRef] [Green Version]
- Xu, X.; Yang, B.; Wang, H.; Cao, Y.; Li, K.; Gao, S. Temperature sensitivity of soil heterotrophic respiration is altered by carbon substrate along the development of Quercus Mongolica forest in northeast China. Appl. Soil Ecol. 2019, 133, 52–61. [Google Scholar] [CrossRef]
- Potter, C. Continental-scale comparisons of terrestrial carbon sinks estimated from satellite data and ecosystem modeling 1982–1998. Glob. Planet. Chang. 2003, 39, 201–213. [Google Scholar] [CrossRef]
- Potter, C.; Klooster, S.; Steinbach, M.; Tan, P.-N.; Kumar, V.; Shekhar, S.; De Carvalho, C.R. Understanding global teleconnections of climate to regional model estimates of Amazon ecosystem carbon fluxes. Glob. Chang. Biol. 2004, 10, 693–703. [Google Scholar] [CrossRef]
- Huang, N.; Niu, Z.; Wu, C.; Tappert, M.C. Modeling net primary production of a fast-growing forest using a light use efficiency model. Ecol. Model. 2010, 221, 2938–2948. [Google Scholar] [CrossRef]
- Yin, K.; Tian, Y.C.; Chao, Y.; Zhang, F. NPP spatial and temporal pattern of vegetation in Beijing and its factor explanation based on CASA model. Remote Sens. Land Resour. 2015, 27, 133–139. [Google Scholar]
- Kuchar, L.; Hunt, L.; Swanton, C. Estimation of Missing Solar Radiation Data for use in Agricultural Modelling. IFAC Proc. Vol. 1997, 30, 221–225. [Google Scholar] [CrossRef]
- Meenal, R.; Kumar, K.V. Estimation of global solar radiation using sunshine duration and temperature in Chennai. In Proceedings of the 2016 International Conference on Emerging Trends in Engineering, Technology and Science (ICETETS), Institute of Electrical and Electronics Engineers (IEEE), Pudukkottai, India, 24–26 February 2016; pp. 1–6. [Google Scholar]
- Tang, W.; Qin, J.; Yang, K.; Niu, X.; Min, M.; Liang, S. An efficient algorithm for calculating photosynthetically active radiation with MODIS products. Remote Sens. Environ. 2017, 194, 146–154. [Google Scholar] [CrossRef]
- Podestá, G.; Núñez, L.; Villanueva, C.A.; Skansi, M.A. Estimating daily solar radiation in the Argentine Pampas. Agric. For. Meteorol. 2004, 123, 41–53. [Google Scholar] [CrossRef]
- Wu, Z.; Du, H.; Zhao, N.; Li, M.; Meng, X.; Zong, S. Estimating daily global solar radiation during the growing season in Northeast China using the Ångström–Prescott model. Theor. Appl. Clim. 2011, 108, 495–503. [Google Scholar] [CrossRef]
- Da Silva, R.M.; Santos, C.A.G.; Moreira, M.; Corte-Real, J.; Silva, V.C.L.; Medeiros, I.C. Rainfall and river flow trends using Mann–Kendall and Sen’s slope estimator statistical tests in the Cobres River basin. Nat. Hazards 2015, 77, 1205–1221. [Google Scholar] [CrossRef]
- Aswad, F.K.; Yousif, A.A.; Ibrahim, S.A. Trend Analysis Using Mann-Kendall and Sen’s Slope Estimator Test for Annual and Monthly Rainfall for Sinjar District, Iraq. ICRIE Conf. 2020, 9, 30–36. [Google Scholar] [CrossRef]
- Wang, Y.; Zhou, G.; Jia, B. Modeling SOC and NPP responses of meadow steppe to different grazing intensities in Northeast China. Ecol. Model. 2008, 217, 72–78. [Google Scholar] [CrossRef]
- Ma, X.; Li, H.; Xiaoyan, M.; Hongguang, L. An Approach to Dynamic Asymptotic Estimation for Hurst Index of Network Traffic. Int. J. Commun. Netw. Syst. Sci. 2010, 3, 167–172. [Google Scholar] [CrossRef] [Green Version]
- Zhu, W.; Chen, Y.; Xu, D.; Li, J. Advances in terrestrial net primary productivity (npp) estimation models. Chin. J. Ecol. 2005, 24, 296–300. [Google Scholar]
- Wang, X.; Ouyang, S.; Sun, O.J.; Fang, J. Forest biomass patterns across northeast China are strongly shaped by forest height. For. Ecol. Manag. 2013, 293, 149–160. [Google Scholar] [CrossRef]
- Xie, Y.; Wang, H.; Lei, X. Simulation of climate change and thinning effects on productivity of Larix olgensis plantations in northeast China using 3-PGmix model. J. Environ. Manag. 2020, 261, 110249. [Google Scholar] [CrossRef]
- Lindholm, E.-L.; Berg, S.; Hansson, P.-A. Energy efficiency and the environmental impact of harvesting stumps and logging residues. Eur. J. For. Res. 2010, 129, 1223–1235. [Google Scholar] [CrossRef]
- Fang, J.Y.; Piao, S.L.; Field, C.; Pan, Y.; Guo, Q.; Zhou, L.; Peng, C.H.; Tao, S. Increasing net primary production in China from 1982 to 1999. Front. Ecol. Environ. 2003, 1, 293–297. [Google Scholar] [CrossRef]
- Ni, J.; Zhang, X.-S.; Scurlock, J.M. Synthesis and analysis of biomass and net primary productivity in Chinese forests. Ann. For. Sci. 2001, 58, 351–384. [Google Scholar] [CrossRef]
- Santi, E.; Paloscia, S.; Pettinato, S.; Fontanelli, G.; Mura, M.; Zolli, C.; Maselli, F.; Chiesi, M.; Bottai, L.; Chirici, G. The potential of multifrequency SAR images for estimating forest biomass in Mediterranean areas. Remote Sens. Environ. 2017, 200, 63–73. [Google Scholar] [CrossRef]
- Rehman, S. Study of Saudi Arabian climatic conditions using Hurst exponent and climatic predictability index. Chaos Solitons Fractals. 2009, 39, 499–509. [Google Scholar] [CrossRef]
- Garcin, M. Estimation of time-dependent Hurst exponents with variational smoothing and application to forecasting foreign exchange rates. Phys. A Stat. Mech. Appl. 2017, 483, 462–479. [Google Scholar] [CrossRef]
- Nguyen, M.D.; Ancev, T.; Randall, A. Forest governance and economic values of forest ecosystem services in Vietnam. Land Use Policy 2020, 97, 103297. [Google Scholar] [CrossRef]
- Wu, C.; Gonsamo, A.; Zhang, F.; Chen, J.M. The potential of the greenness and radiation (GR) model to interpret 8-day gross primary production of vegetation. ISPRS J. Photogramm. Remote Sens. 2014, 88, 69–79. [Google Scholar] [CrossRef]
- Gang, C.; Zhang, Y.; Wang, Z.; Chen, Y.; Yang, Y.; Li, J.; Cheng, J.; Qi, J.; Odeh, I. Modeling the dynamics of distribution, extent, and NPP of global terrestrial ecosystems in response to future climate change. Glob. Planet. Chang. 2017, 148, 153–165. [Google Scholar] [CrossRef]
- Berra, E.F.; Gaulton, R.; Barr, S. Assessing spring phenology of a temperate woodland: A multiscale comparison of ground, unmanned aerial vehicle and Landsat satellite observations. Remote Sens. Environ. 2019, 223, 229–242. [Google Scholar] [CrossRef]
- Xin, Q.; Li, J.; Li, Z.; Li, Y.; Zhou, X. Evaluations and comparisons of rule-based and machine-learning-based methods to retrieve satellite-based vegetation phenology using MODIS and USA National Phenology Network data. Int. J. Appl. Earth Obs. Geoinf. 2020, 93, 102189. [Google Scholar] [CrossRef]
- Siraj, M. Forest carbon stocks in woody plants of Chilimo-Gaji Forest, Ethiopia: Implications of managing forests for climate change mitigation. S. Afr. J. Bot. 2019, 127, 213–219. [Google Scholar] [CrossRef]
- Wang, C.; Jiang, Q.; Engel, B. Analysis on net primary productivity change of forests and its multi–level driving mechanism–A case study in Changbai Mountains in Northeast China. Techno. Forecast. Soc. Chang. 2020, 153, 11939. [Google Scholar] [CrossRef]
- Shen, X.; Liu, B.; Xue, Z.; Jiang, M.; Lu, X.; Zhang, Q. Spatiotemporal variation in vegetation spring phenology and its response to climate change in freshwater marshes of Northeast China. Sci. Total Environ. 2019, 666, 1169–1177. [Google Scholar] [CrossRef]


Publisher’s Note: MDPI stays neutral with regard to jurisdictional claims in published maps and institutional affiliations. |
© 2020 by the authors. Licensee MDPI, Basel, Switzerland. This article is an open access article distributed under the terms and conditions of the Creative Commons Attribution (CC BY) license (http://creativecommons.org/licenses/by/4.0/).
Share and Cite
Wang, C.; Jiang, Q.; Deng, X.; Lv, K.; Zhang, Z. Spatio-Temporal Evolution, Future Trend and Phenology Regularity of Net Primary Productivity of Forests in Northeast China. Remote Sens. 2020, 12, 3670. https://0-doi-org.brum.beds.ac.uk/10.3390/rs12213670
Wang C, Jiang Q, Deng X, Lv K, Zhang Z. Spatio-Temporal Evolution, Future Trend and Phenology Regularity of Net Primary Productivity of Forests in Northeast China. Remote Sensing. 2020; 12(21):3670. https://0-doi-org.brum.beds.ac.uk/10.3390/rs12213670
Chicago/Turabian StyleWang, Chunli, Qun’ou Jiang, Xiangzheng Deng, Kexin Lv, and Zhonghui Zhang. 2020. "Spatio-Temporal Evolution, Future Trend and Phenology Regularity of Net Primary Productivity of Forests in Northeast China" Remote Sensing 12, no. 21: 3670. https://0-doi-org.brum.beds.ac.uk/10.3390/rs12213670