Article

Detecting Change at Archaeological Sites in North Africa Using Open-Source Satellite Imagery

1
School of History, Classics and Archaeology, Newcastle University, Newcastle upon Tyne NE1 7RU, UK
2
School of Archaeology and Ancient History, University of Leicester, Leicester LE1 7RH, UK
3
Department of Antiquities, Hun, Libya
4
Faculty of Arts, Az-Zaytuna University, 325 As-Salam Street, Tarhuna, Libya
*
Author to whom correspondence should be addressed.
Remote Sens. 2020, 12(22), 3694; https://0-doi-org.brum.beds.ac.uk/10.3390/rs12223694
Submission received: 5 October 2020 / Revised: 8 November 2020 / Accepted: 9 November 2020 / Published: 11 November 2020

Abstract

:
Our paper presents a remote sensing workflow for identifying modern activities that threaten archaeological sites, developed as part of the work of the Endangered Archaeology of the Middle East and North Africa (EAMENA) project. We use open-source Sentinel-2 satellite imagery and the free tool Google Earth Engine to run a per-pixel change detection to make the methods and data as accessible as possible for heritage professionals. We apply this and perform validation at two case studies, the Aswan and Kom-Ombo area in Egypt, and the Jufra oases in Libya, with an overall accuracy of the results ranging from 85–91%. Human activities, such as construction, agriculture, rubbish dumping and natural processes were successfully detected at archaeological sites by the algorithm, allowing these sites to be prioritised for recording. A few instances of change too small to be detected by Sentinel-2 were missed, and false positives were caused by registration errors, shadow and movements of sand. This paper shows that the expansion of agricultural and urban areas particularly threatens the survival of archaeological sites, but our extensive online database of archaeological sites and programme of training courses places us in a unique position to make our methods widely available.

Graphical Abstract

1. Introduction

This paper presents a remote sensing workflow for identifying landscape changes that threaten archaeological sites. The workflow has been developed as part of the work of the Endangered Archaeology of the Middle East and North Africa (EAMENA) project. We identify, document, and monitor archaeological sites across the MENA region, using a combination of remote sensing and fieldwork methodologies. EAMENA also works to support local heritage agencies and professionals in the region to develop strategies for heritage protection [1,2]. We use a standardised approach to recording and make data available in an open-access database using the Arches platform [3,4,5]. We are particularly concerned with promoting the use of open-source satellite data and technologies to make this methodology as accessible as possible, rather than higher-resolution data which is prohibitive in terms of cost and political sanctions.
In this paper, we demonstrate the results of applying a bespoke change detection workflow using Google Earth Engine to two case studies (Figure 1); the Aswan and Kom-Ombo area in Egypt (collaborating with the Aswan-Kom Ombo Archaeological Project, AKAP, directed by Maria Gatto and Antonio Curci), and the Jufra oases in Libya (collaborating with the Trans-SAHARA project, directed by David Mattingly). These case studies were selected because they comprise a range of types and dates of sites in comparable arid/oasis environments, but also offer a diversity of context in terms of heritage management processes. The workflow can detect vegetation and settlement growth and also bulldozing, extraction and infrastructure projects.
Given that it allows rapid recording via a bird’s eye perspective, remote sensing has been an important part of archaeology in North Africa for several decades, although modern high-resolution imagery is underutilised [6]. Davis and Douglass’ recent review paper [7] (p. 11 Figure 1) describes this trajectory in detail and maps the geographical range of these studies. Tapete and Cigna’s review shows the recent expansion of scientific literature discussing satellite imagery for looting detection [8]. This activity has its roots in historical aerial photographs, which enabled early remote identification of sites, including the work along the Nile by Crawford [9] (1953). In the 1950s and 1960s, colonial regimes instigated national mapping programs using aerial photography that covered most of the inhabited regions of North Africa. This wealth of imagery has continued to be used by archaeologists up to the present day (see the work in Fazzan in Libya [10,11]).
In the twenty-first century, commercial high-resolution imagery has allowed detailed recording (spatial resolution of 0.3–0.5), but it is very expensive. Some archaeological projects have used it for recording damage, whether by image interpretation [12] or automation [13]. Due to EU and US embargos, licenses for this kind of imagery often cannot be obtained for use in the Middle East and North Africa [14]. Given these political restrictions, as well as the high cost, it does not represent a good solution for widespread change detection. Due to these problems many archaeologists take advantage of the high-resolution imagery available in a limited form for free via Google Earth, Google imagery imported into QGIS etc.; however, this is provided stripped of its original radiometric information. Google Earth has been used extensively by EAMENA, AKAP and Trans-SAHARA for image interpretation [2,15] as well by as other projects working in the region [16].
Moreover, the high-resolution imagery does not offer the same repeat-viewing perspective of other free satellite data of lower resolution, such as Sentinel and Landsat. Archaeologists have used Landsat since its early days as a source of overview information about landscapes in North Africa [17]. Despite its lower resolution, several recent projects have used this kind of imagery to successfully assess changes at archaeological sites [18,19]. The EAMENA project has already demonstrated the potential of this for our huge study region [1,20]. Most studies, whether using high- or medium-resolution imagery, are confined to drawing attention to problems at single, well-known sites and offer no solution for how remote sensing and automated approaches could protect sites. Bowen et al. [13] apply partially supervised classification algorithms to detecting change using high-resolution imagery of the pyramids in Egypt and propose that this could be valuable to archaeologists, but do not offer any concrete solutions for its widespread use in the country. EAMENA’s unique database of over 170,000 sites and network of trained heritage professionals offers an unprecedented opportunity to address this challenge.
In this paper, we apply our methodology to a case study in Egypt with the AKAP project. EAMENA team members Rayne and Sheldrick collaborated with AKAP on two field seasons (in November 2018 and January 2020), particularly focusing on recording the condition of sites and validating the initial results of change detection using remote sensing. Since 2005 AKAP has worked in selected areas north of the modern city of Aswan, both along the Nile and in the desert hinterland, recording a variety of sites dating from the Palaeolithic to the pre-modern era, and consisting of isolated finds, scatters, towns, temples, cemeteries, quarries, and rock art. The area corresponds to the region of the First Nile Cataract, an important crossroads in Northeastern Africa that for long periods marked the border between ancient Egypt and Nubia. Archaeological sites in the region are threatened by land reclamation, quarrying, and urban development, including the construction of a new city (New Aswan) on the west bank north of Aswan.
Our second case study for this paper is the Jufra area of Libya. EAMENA and Dr Muftah al-Haddad collaborated with the Trans-SAHARA project on the Jufra case study. The Trans-SAHARA project has recorded sites across a vast area of Saharan Africa and its periphery [21]. In 2013 al-Haddad undertook field survey to collect dating material, and Rayne and Sterry subsequently digitised the archaeological sites using satellite imagery. Rayne and Abdulaati have most recently worked on change detection applied to these sites.
Jufra consists of three Saharan oases in central Libya: Sukna, Hun, and Waddan. Each has an urban centre and a large area of irrigated oasis gardens of cereals and cultivated palms. Jufra has some of the earliest evidence for agriculture in the Central Sahara with two areas of foggaras (subterranean ground-water transporting channels) and associated settlements to the south of Hun and Waddan [15] (130–137). These probably date to the early first millennium AD (if not earlier). Slightly later in date are four nucleated settlements of densely packed rectilinear structures that sit within large and extensive field systems. Radiocarbon dating of material from the walls of these settlements suggest they date to the early medieval period and the expansion of trans-Saharan trade (seventh to ninth centuries AD) [15], but Roman pottery observed during a field survey in 2013 from at least one of these suggests an earlier origin. To the north of Hun is a late medieval walled town with a mosque and an attached cemetery. Finally, the most recent sites are the former towns of Sukna, Hun, and Waddan. The agricultural areas of this last phase are still detectable in modern land divisions and remained largely the same up until the 1970s.

2. Materials and Methods

2.1. Datasets

The change detection analysis and validation were performed on point data representing archaeological sites from the EAMENA database [4]. Verifiable users can obtain a registration for the database to access the exact location of the sites. The sites are named according to codes assigned during their initial identification, either through remote recording or field survey. For example, prefixed with ‘EAMENA’ for remote recording (Jufra), and with location-related codes for the AKAP field-identified sites, e.g. ‘WT’. Satellite imagery accessed through the Google Earth Engine catalogue was used to perform and validate the script (Table 1). For the change detection, we selected the Sentinel-2 L2A product (available back to 2017) which is provided already corrected to surface reflectance using the Dense Dark Vegetation algorithm (DDV) and Atmospheric Pre-corrected Differential Absorption (APDA) algorithm [22].
PlanetScope imagery offers exciting possibilities for regular monitoring of sites, but has not yet attracted significant attention in the archaeological remote sensing literature; few projects have adopted it. For example, Davis and Douglass’ recent review [7] neglects to mention it. It is not completely open-source, however a free license for a limited quantity of data per month is available for many types of stakeholder. With over 130 small satellites in the constellation, it is possible to obtain near-daily imagery for most locations at a resolution of c. 3.5–3.9 m (depending on how close to nadir the imaged location is). We have used it to verify specific instances of change detected from the Sentinel-2 imagery.
High-resolution imagery via free sources, such as Google Earth, has been used extensively by the EAMENA project [2]. It comprises imagery from commercial sensors, such as WorldView (resolution as high as 0.3 m in the panchromatic) and Pleiades (0.5 m). This has allowed rapid image interpretation comprising an identification of new sites and recording of known ones. In some cases, there is sufficient imagery on the Google Earth Pro platform to also identify changes, or validate changes detected by the change algorithm. Google and Bing imagery can also be obtained as a tile layer within QGIS. Unfortunately, it is not possible to query the original spectral properties of the free high-resolution imagery so it cannot be used for automated change detection, and purchasing the original data to do so is very expensive. We used only open-source satellite imagery because with prices of high-resolution data at £10 per km2, or higher, commercial imagery is prohibitively costly for monitoring archaeological sites. We are committed to making our workflows and data as available as possible to heritage professionals.

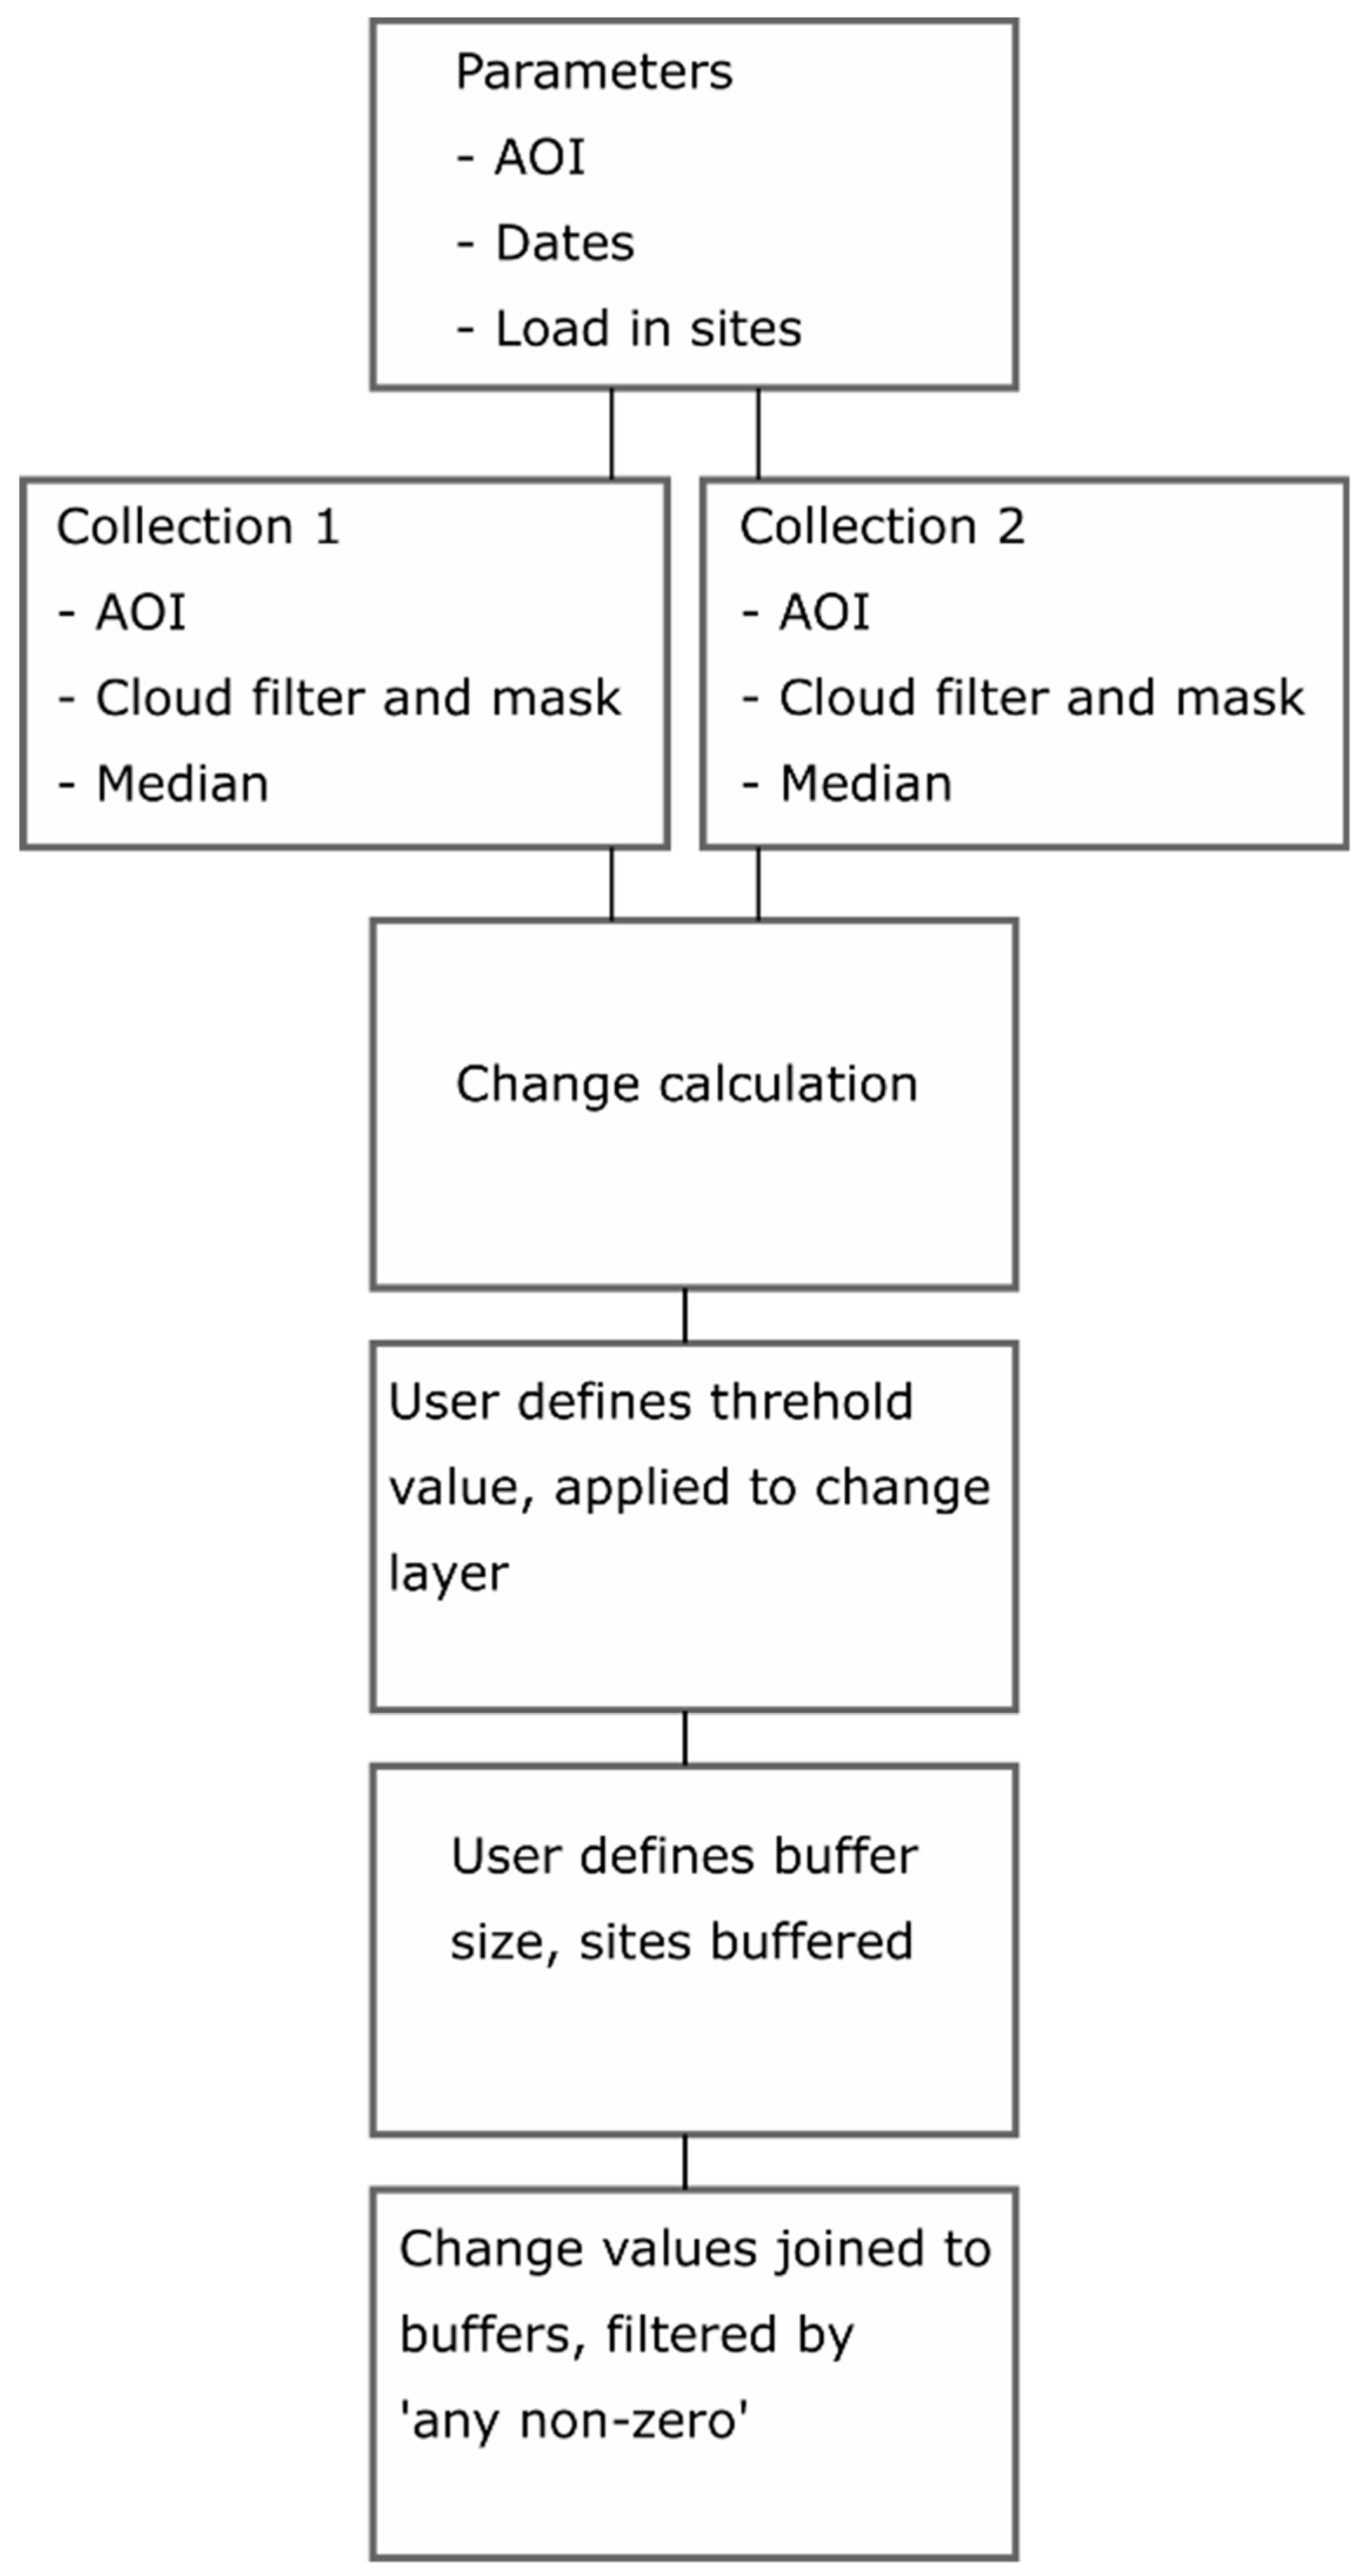
2.2. Change Detection

This project has developed an initial version of an automated workflow that uses free satellite data and high-performance computing power to monitor land-use changes around the archaeological sites recorded by EAMENA (Figure 2). This is applied to very recent and ongoing datasets, to alert heritage professionals to urgent threats to sites in their region, such as agricultural expansion and construction happening nearby. Google Earth Engine is used because it supplies regularly updated free satellite imagery and high-performance computing. This is a cloud-based platform freely accessible through the internet, which offers a code editor allowing access to a vast catalogue of open-source satellite image data (including Landsat and Sentinel imagery) [23]. Users’ own assets (for example, sites from the EAMENA database, or other imagery, such as PlanetScope) can be uploaded and processed within the platform.
The EAMENA workflow (Figure 2) comprises computing change between composite Sentinel-2 (Level 2A, surface-reflectance) satellite images using Google Earth Engine. Including other satellite data could improve the sophistication of future incarnations of our workflow, but at present, using just one sensor limits issues caused by radiometric and resolution differences [24]. We use a bespoke script (written in the JavaScript programming language) which the user can easily modify according to their needs (see Supplementary Material for code, archaeological sites not included). The user uploads site points (for example from the EAMENA database) which they want to monitor. They define date ranges and an area of interest. The date selection relies on a function which takes the user-defined date, a unit of change (an integer) and a unit of time (e.g., year). The unit of change is applied to count from the defined date based on the unit of time. For example, if the user selects the date 01-01-2018, the unit of change as −1 and the unit of time as a year, the function will select the time range 01-01-2017 to 01-01-2018. This will be applied to both the earlier and later dates selected by the user. Given this, the user could request changes between two different years to be compared, or two different months or days (from the same or different years). For Aswan, the periods of the start of October 2018–to the end of December 2018 and the start of October 2019–the end of December 2019 were compared. For Jufra, the March–May period for 2019 and 2020 were compared.
The Sentinel-2 imagery is split into two collections according to the date function, one representing the later date the user defined and another representing the earlier date they wanted to compare it to. Each collection is then filtered according to the area of interest the user defined and to limit cloud percentage to less than 10%, based on the imagery metadata. Pixels which pass the requirements will be retained in the collection. A cloud mask is applied using a quality assessment band provided by ESA with the data and takes into account dense cloud (high reflectance in blue) and cirrus (high reflectance in a cloud screening band, low reflectance in the blue band, see Reference [25]).
The composites are made by calculating the median values of each pixel (in all bands) in the collections. This uses the Google Earth Engine function ‘reducer’ to perform the compositing from the images in the collection, generating a single output image. We chose to use this method of preparing the imagery for analysis because using the median value reduces the effects of cloud (high values) and shadow (low values), and the resulting outputs are seamless mosaics appropriate for visualisation purposes required by a variety of users from the heritage community.
The algorithm then uses a per-pixel, layer arithmetic change detection algorithm which computes the amount of difference in reflectance values between the composites, across all bands at each pixel i. This method was selected because it is simple, unsupervised and fast to use and to understand for a variety of stakeholders, enabling them to modify the code to meet their needs. It does not require the preparation of training data. It is a well-established method in remote sensing studies of change using medium-resolution data [24,26]. The Google Earth Engine script sums the difference between each spectral band of the satellite image composites and generates a new ‘change’ layer, with values between 0 and 1;
√{∑I (image1i − image2i)2}
The user must then decide on a threshold value above which to retain information about the change, based on a manual examination of the values present in the change layer. The user also defines the radius of a buffer area around each site point in which to append the information from the change layer, and the scale. We used relatively ‘sensitive’ settings, taking into account even a single pixel, ‘any non-zero’ where change had been detected (see Table 2).
Using Google Earth Engine, huge collections of data can be processed. Downloading this imagery separately is time-consuming and processing it requires access to expensive software licenses and high-performance computing power out of reach of most archaeologists within the MENA region. Given this, Google Earth Engine is increasingly being used for archaeological research, including by EAMENA [1]. Other research has focused on using it for detection of sites and landscape features [27,28], with its potential for heritage management first raised by Agapiou [18]. There are limitations to Google Earth Engine, including restrictions on asset and download sizes, but at present, it offers the best option for heritage professionals to access data and analysis-power for change detection in a standardised and open-source way.
EAMENA is the only project to utilise Google Earth and Google Earth Engine to actively protect a wide-ranging, cross-regional dataset comprising sites of all types and periods. This is facilitated through our network of cultural heritage professionals from Libya and Tunisia who attended EAMENA CPF-funded courses during 2017–2020 [29] and who have been trained in the use of Google Earth Engine. Planned future courses will continue to develop this in line with updates to our workflow.

2.3. Validation and Field Condition Assessment
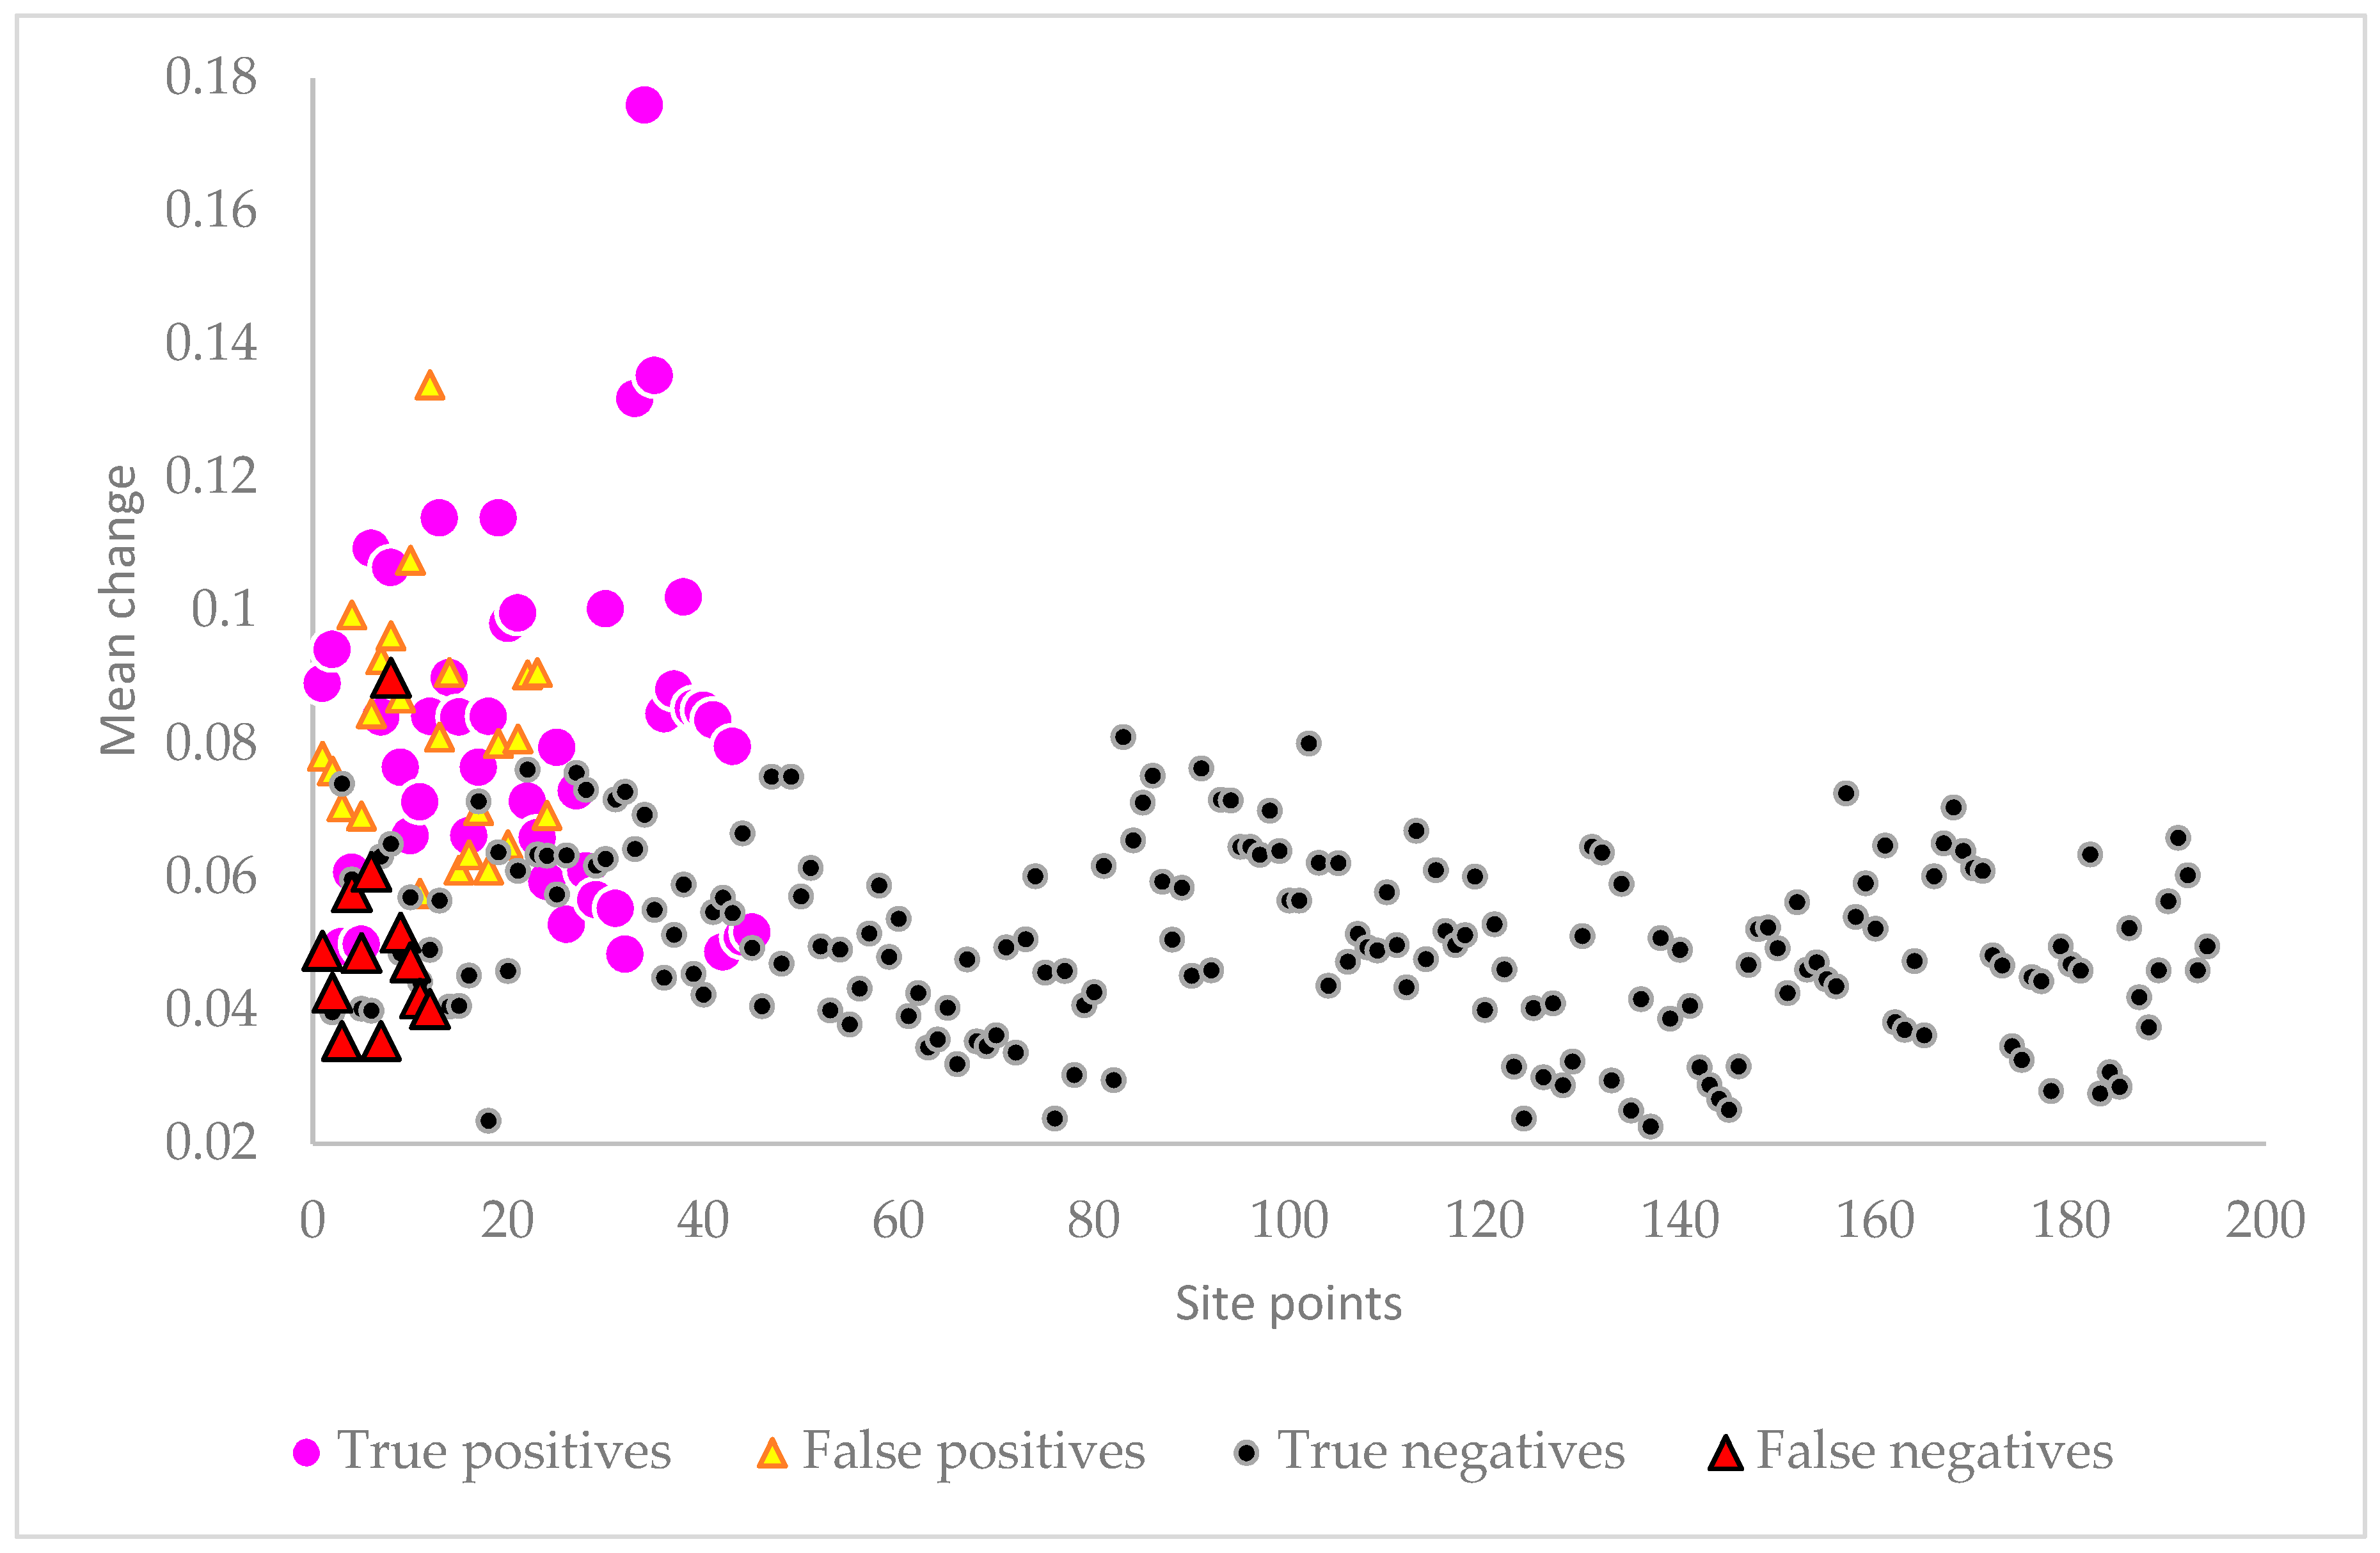
EAMENA uses a standardised recording methodology that allows information about a site and its condition to be recorded in the field and later entered directly into our open-source, online database [1]. This standardisation makes data comparable, both with other database records, but also with the results of the change detection workflow.
The results of the change detection were checked by comparing the Sentinel-2 composites manually with the change layer at each buffer and by checking Google Earth imagery from corresponding dates (see Table 2). In some cases, where there was no corresponding Google Earth imagery, we used PlanetScope imagery. An error matrix was prepared for each study area, allowing the proportions of false positives and missed instances of change to be quantified [30].
We visited a sample of the sites in the field in both Egypt and Libya in 2020 to validate the automated approach and adjusted the error matrices accordingly. Sites were selected for validation based on their accessibility and the urgency of their condition; for example, several sites in the Aswan area were in the process of being destroyed, due to construction work, but this work also meant that we could not get close enough to some sites. Validation fieldwork in the Aswan area was undertaken in January–February 2020 in collaboration with the AKAP project and local antiquities inspectors. In Libya, field validation was more limited, due to the Covid-19 pandemic, but a sample of sites was visited by EAMENA partner and controller of archaeology in the south of Libya, Lamin Abdulaati in June–July 2020.

3. Results

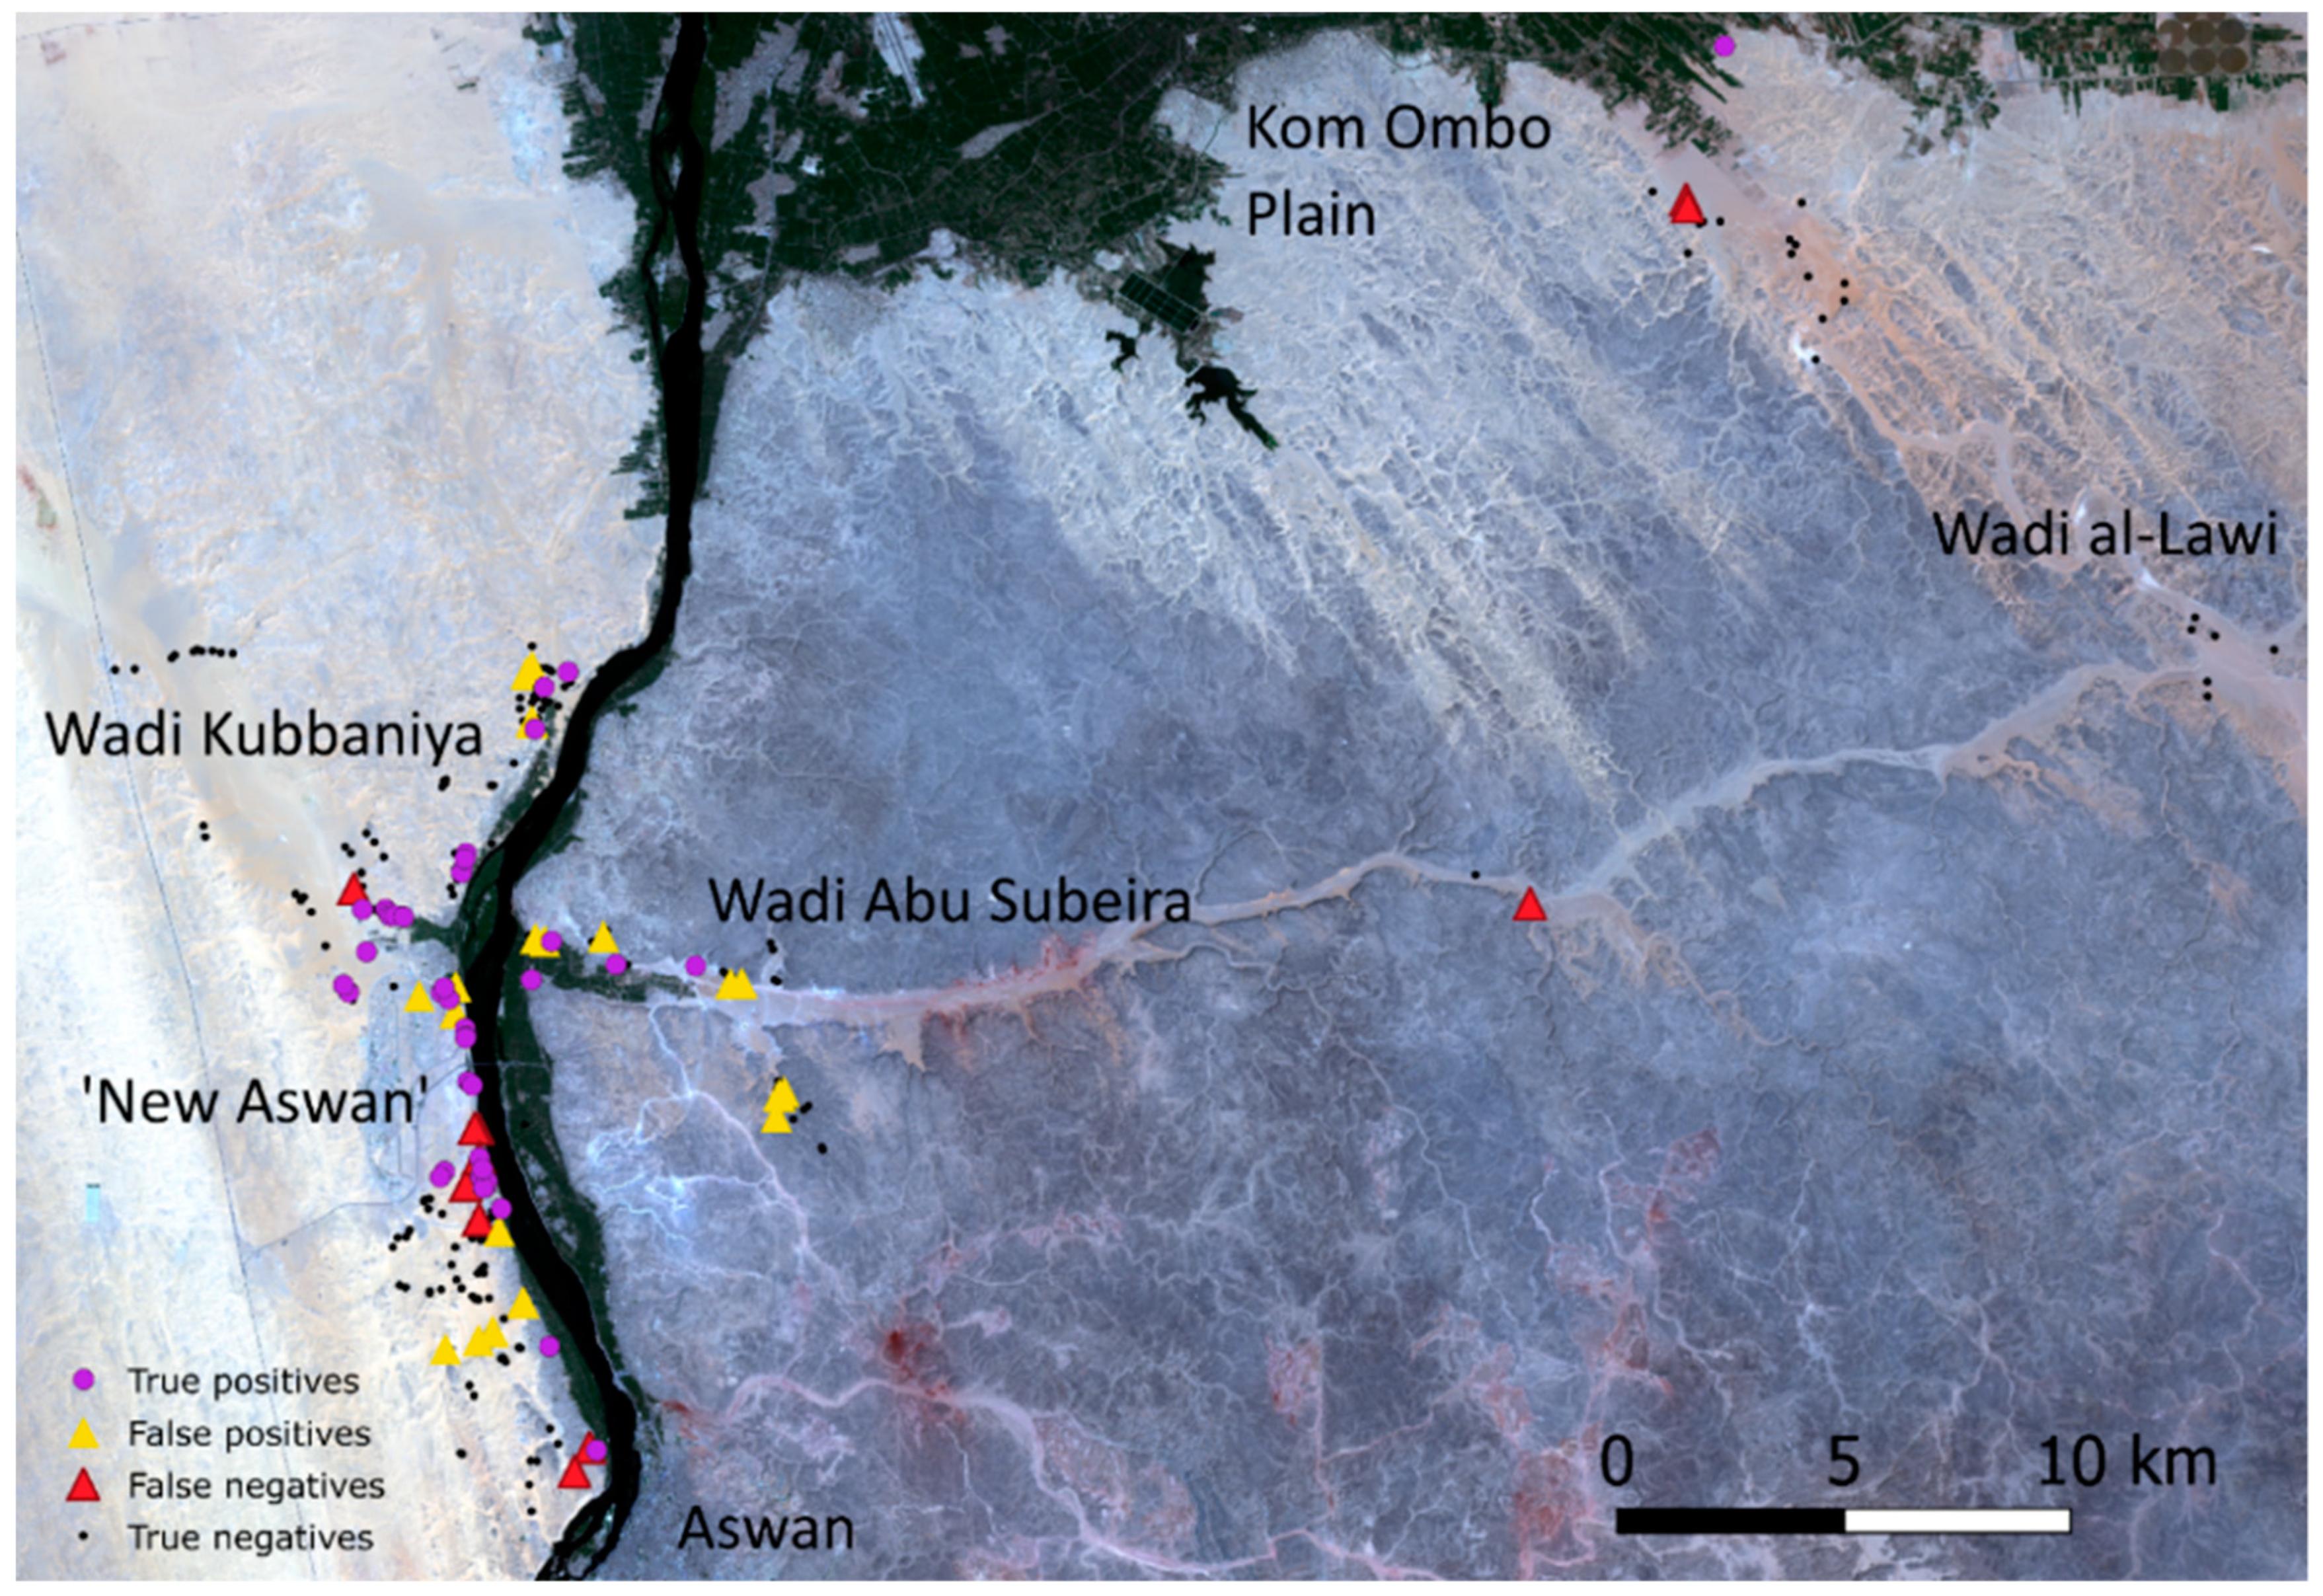
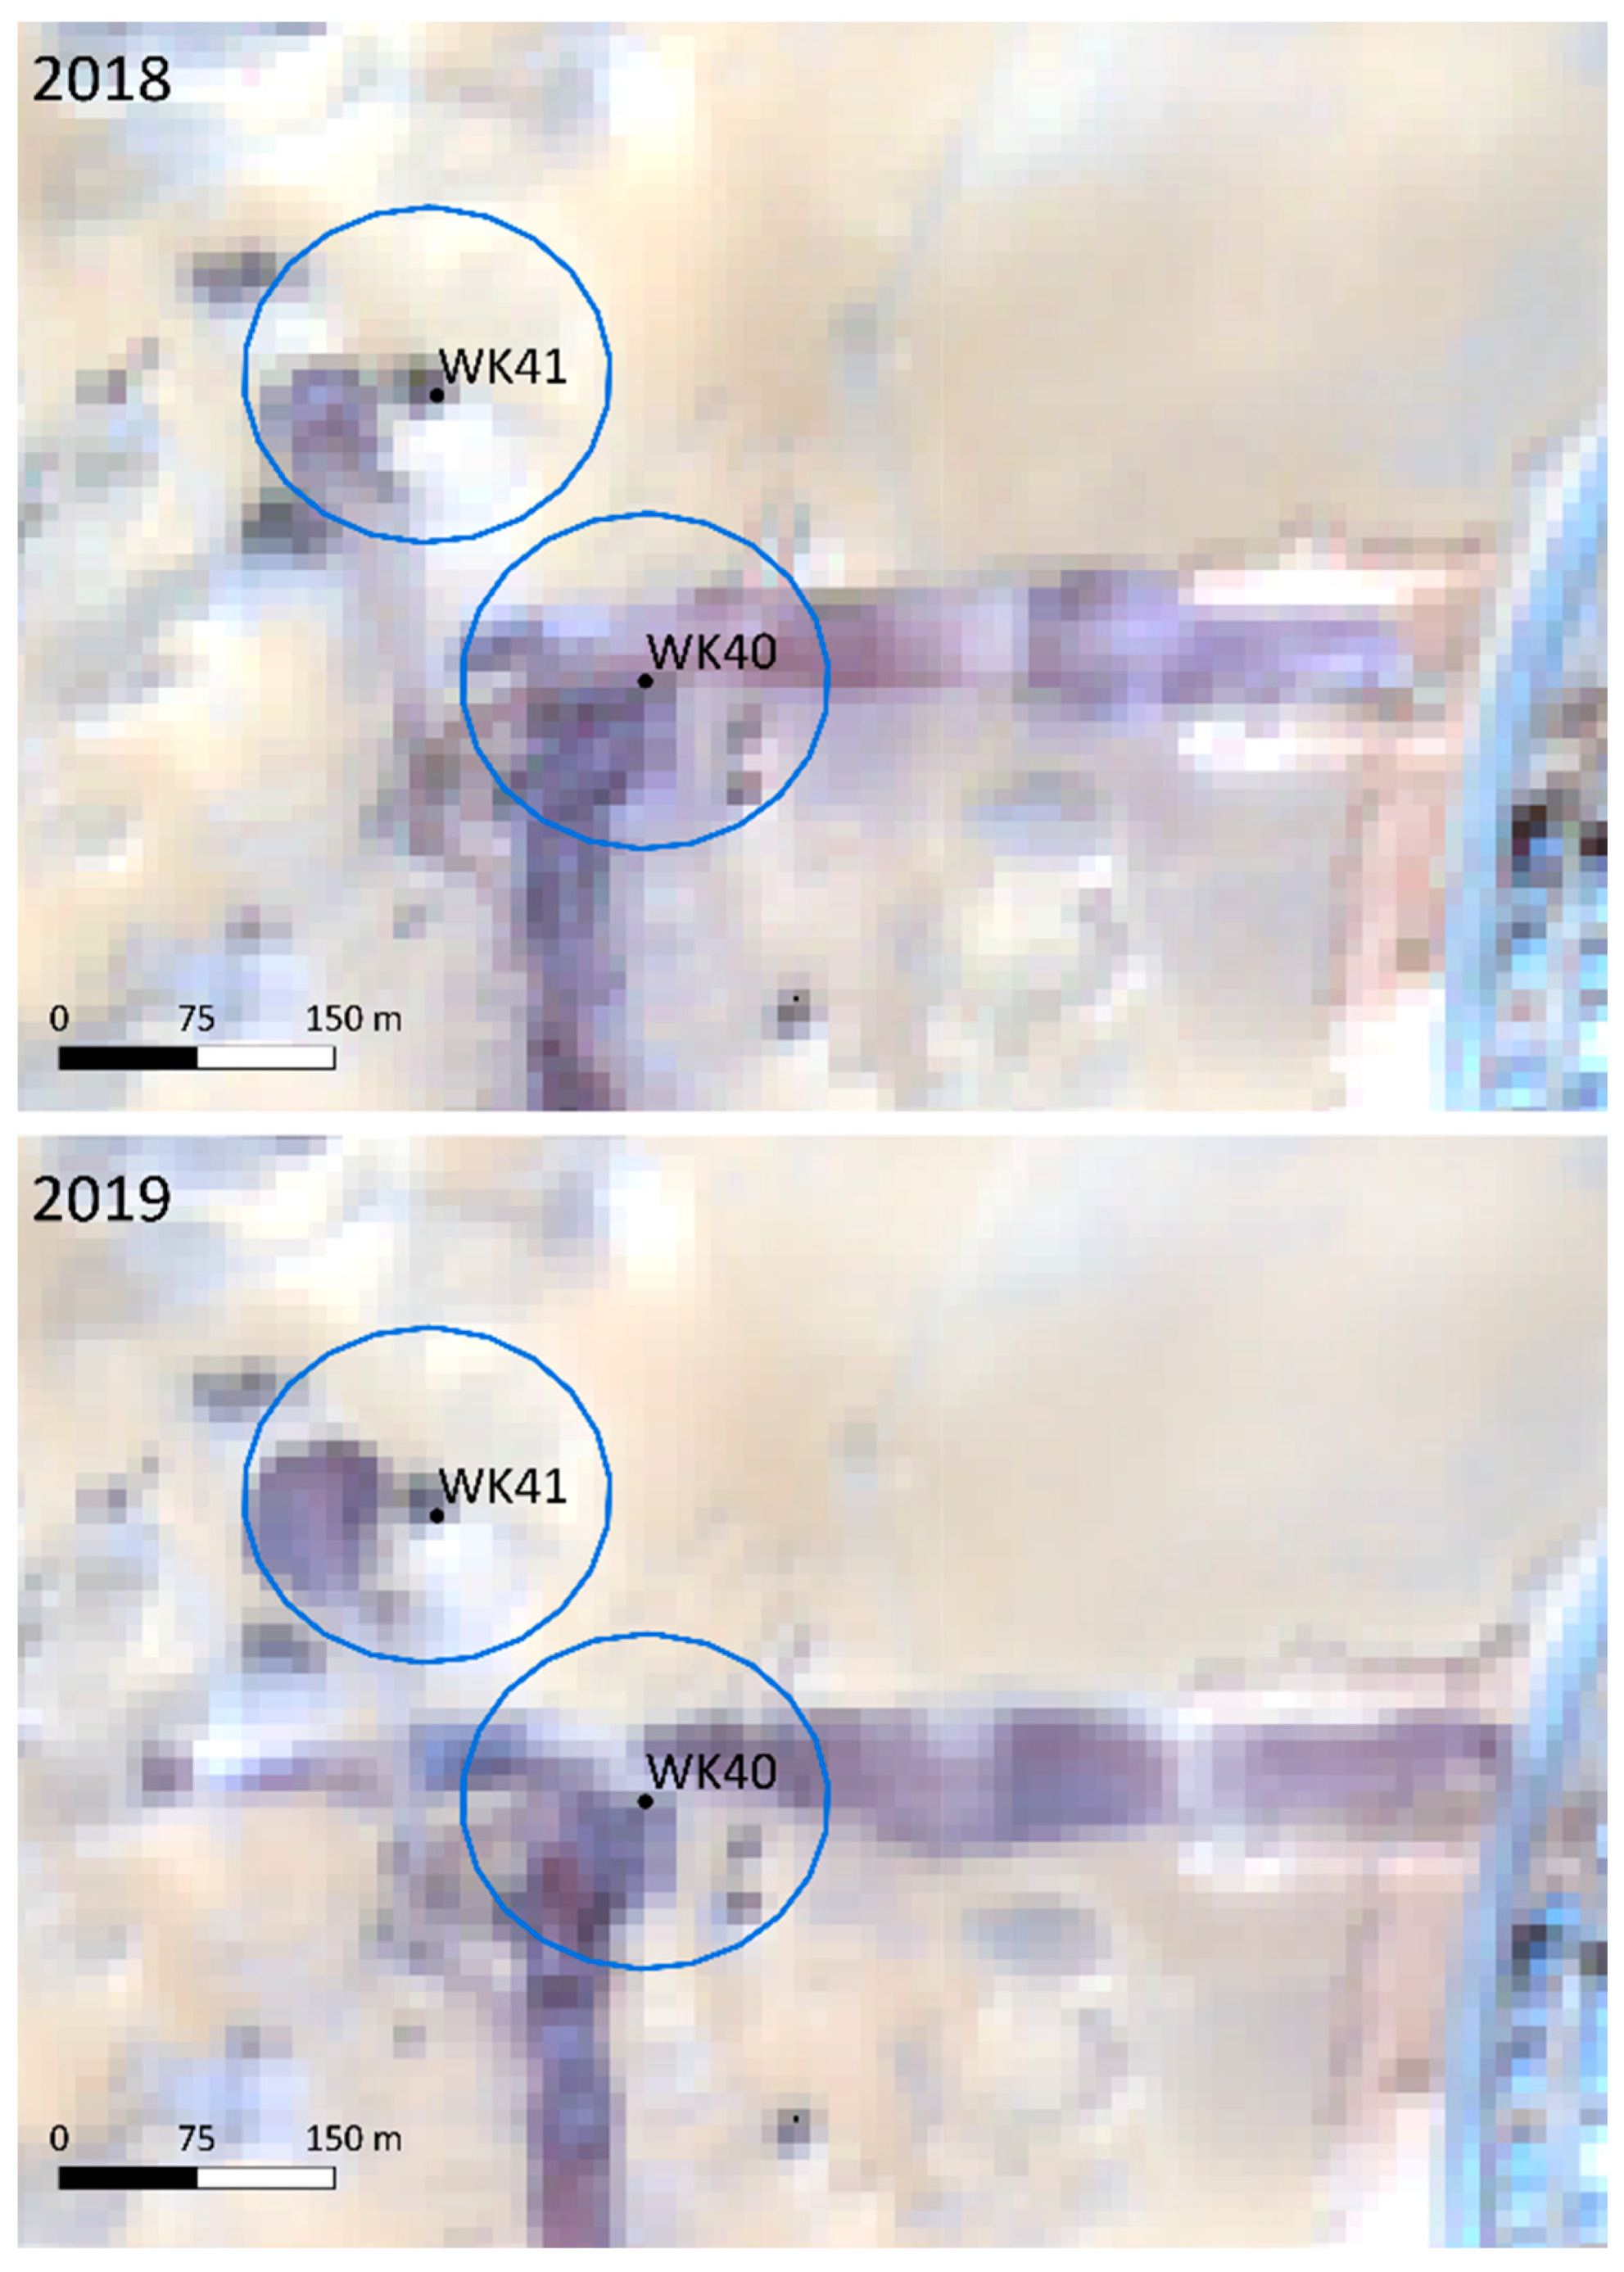
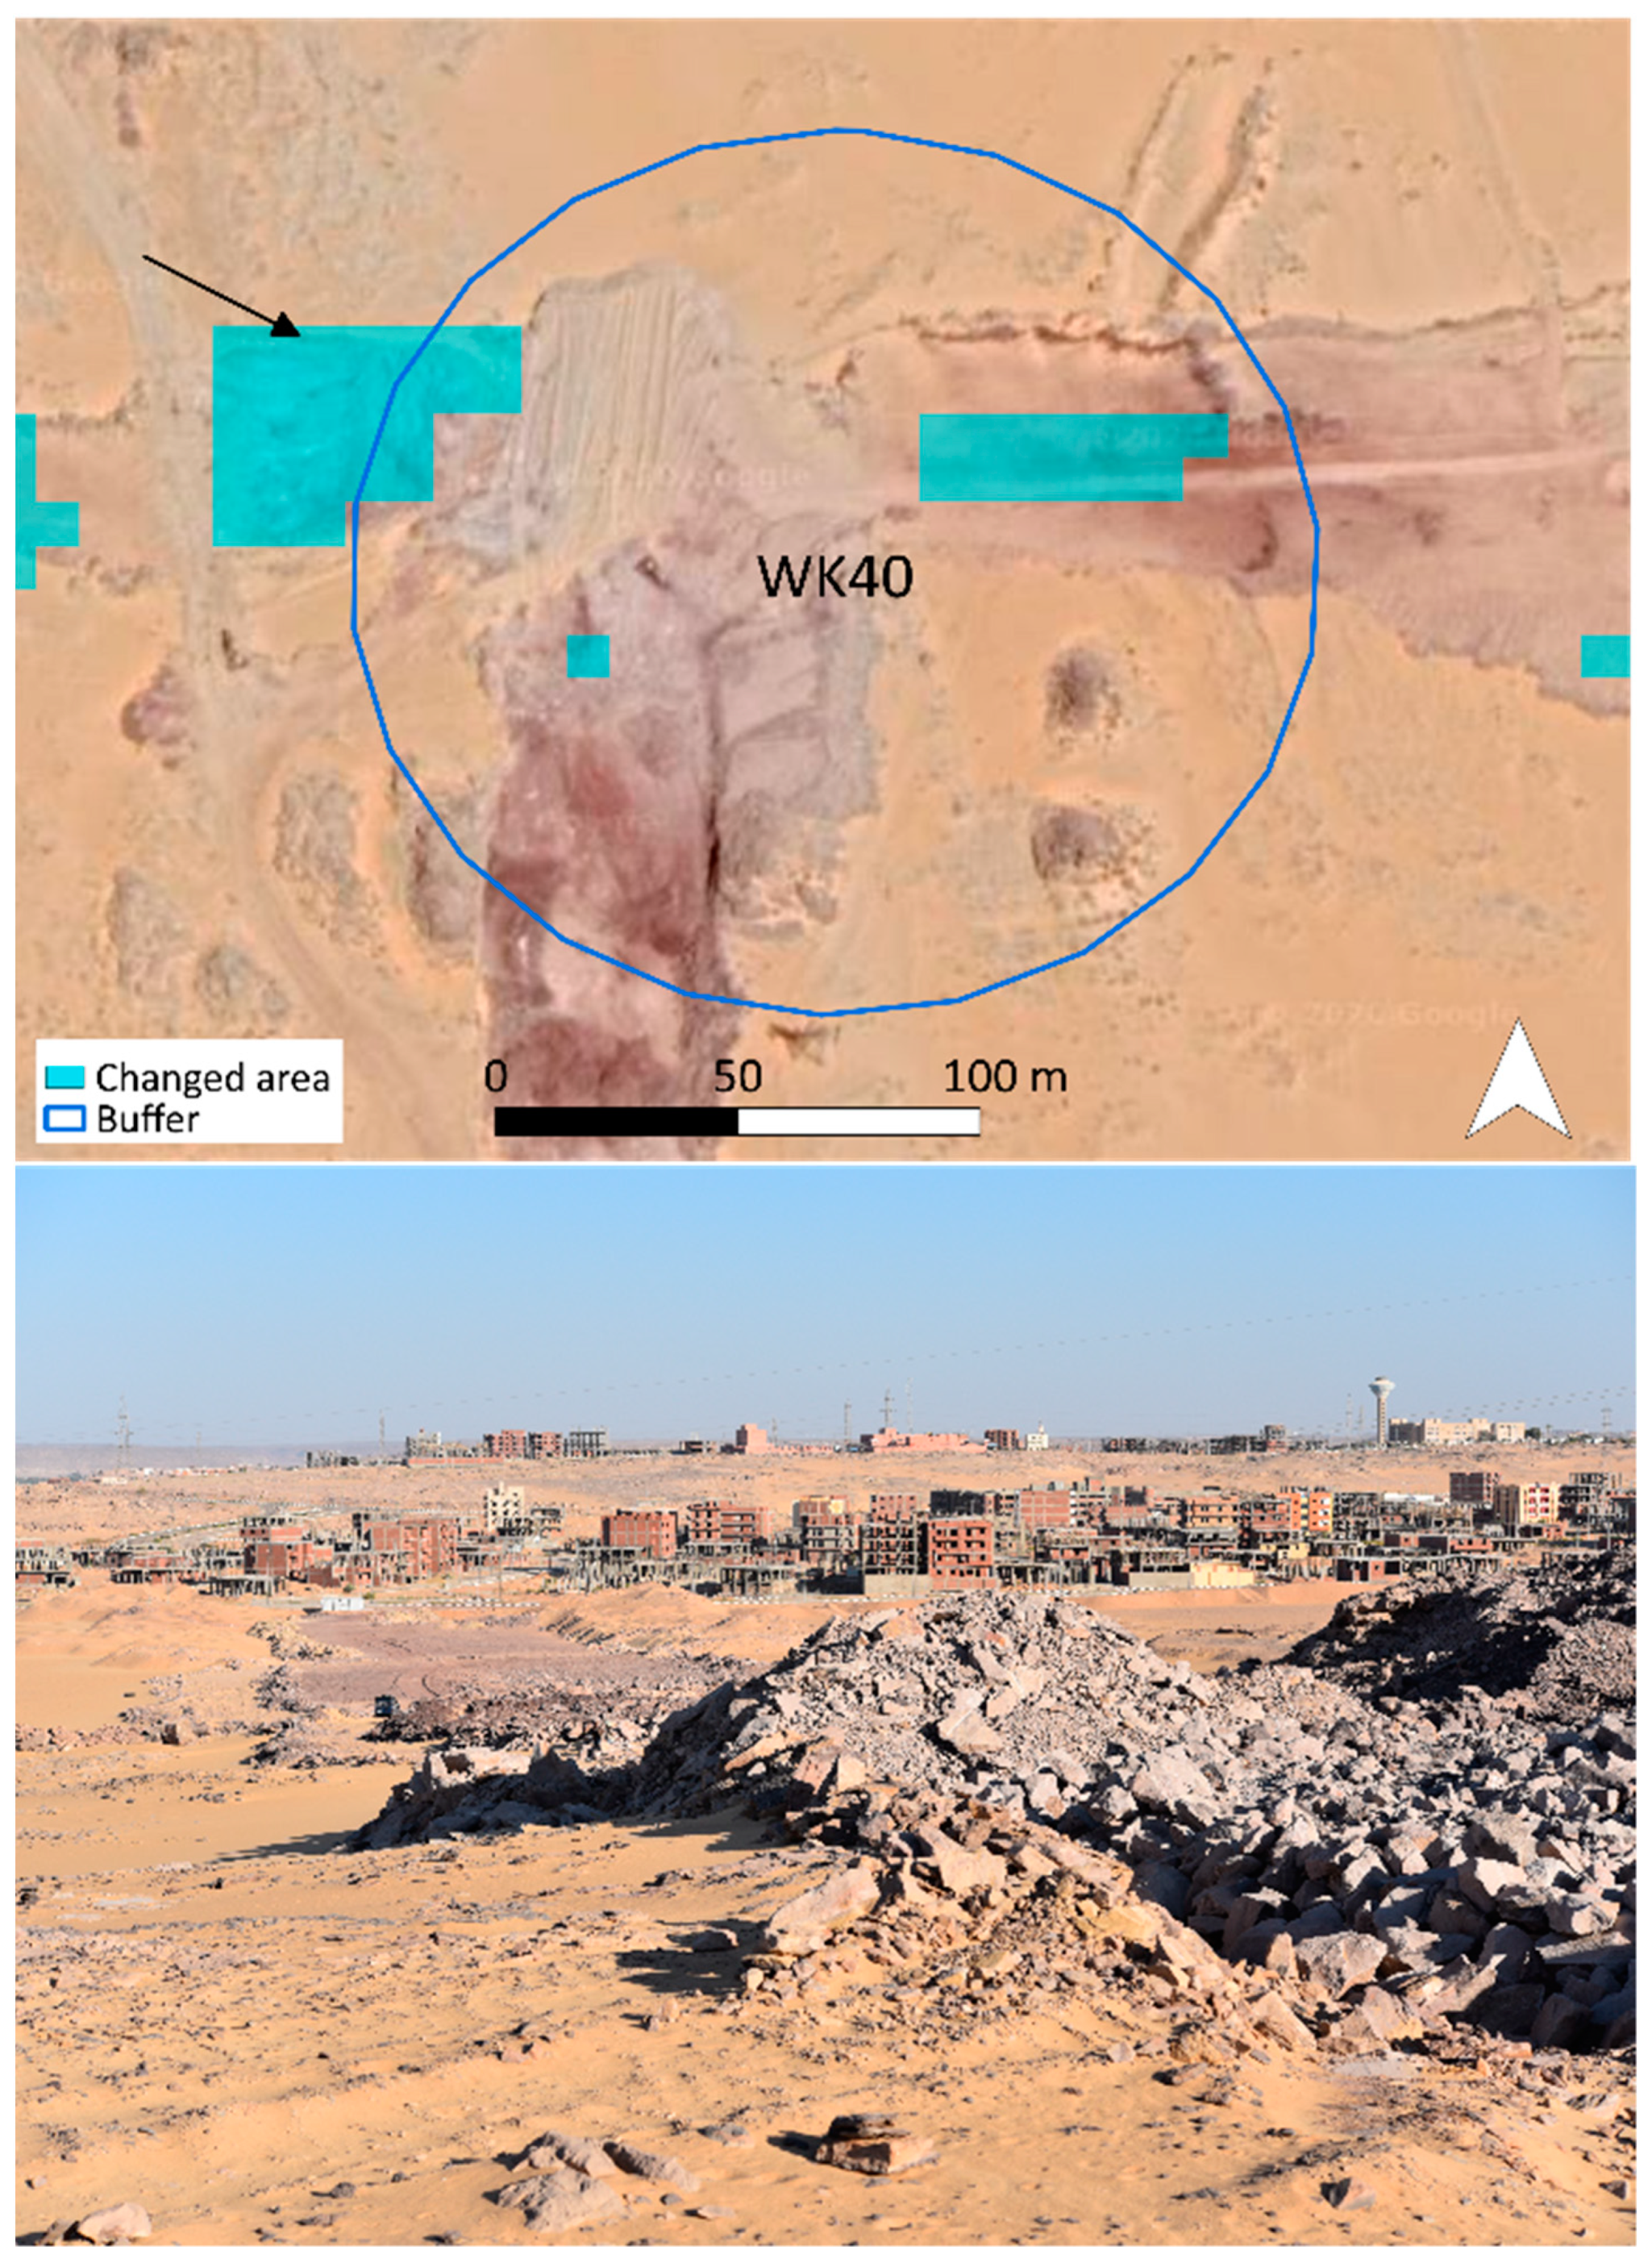
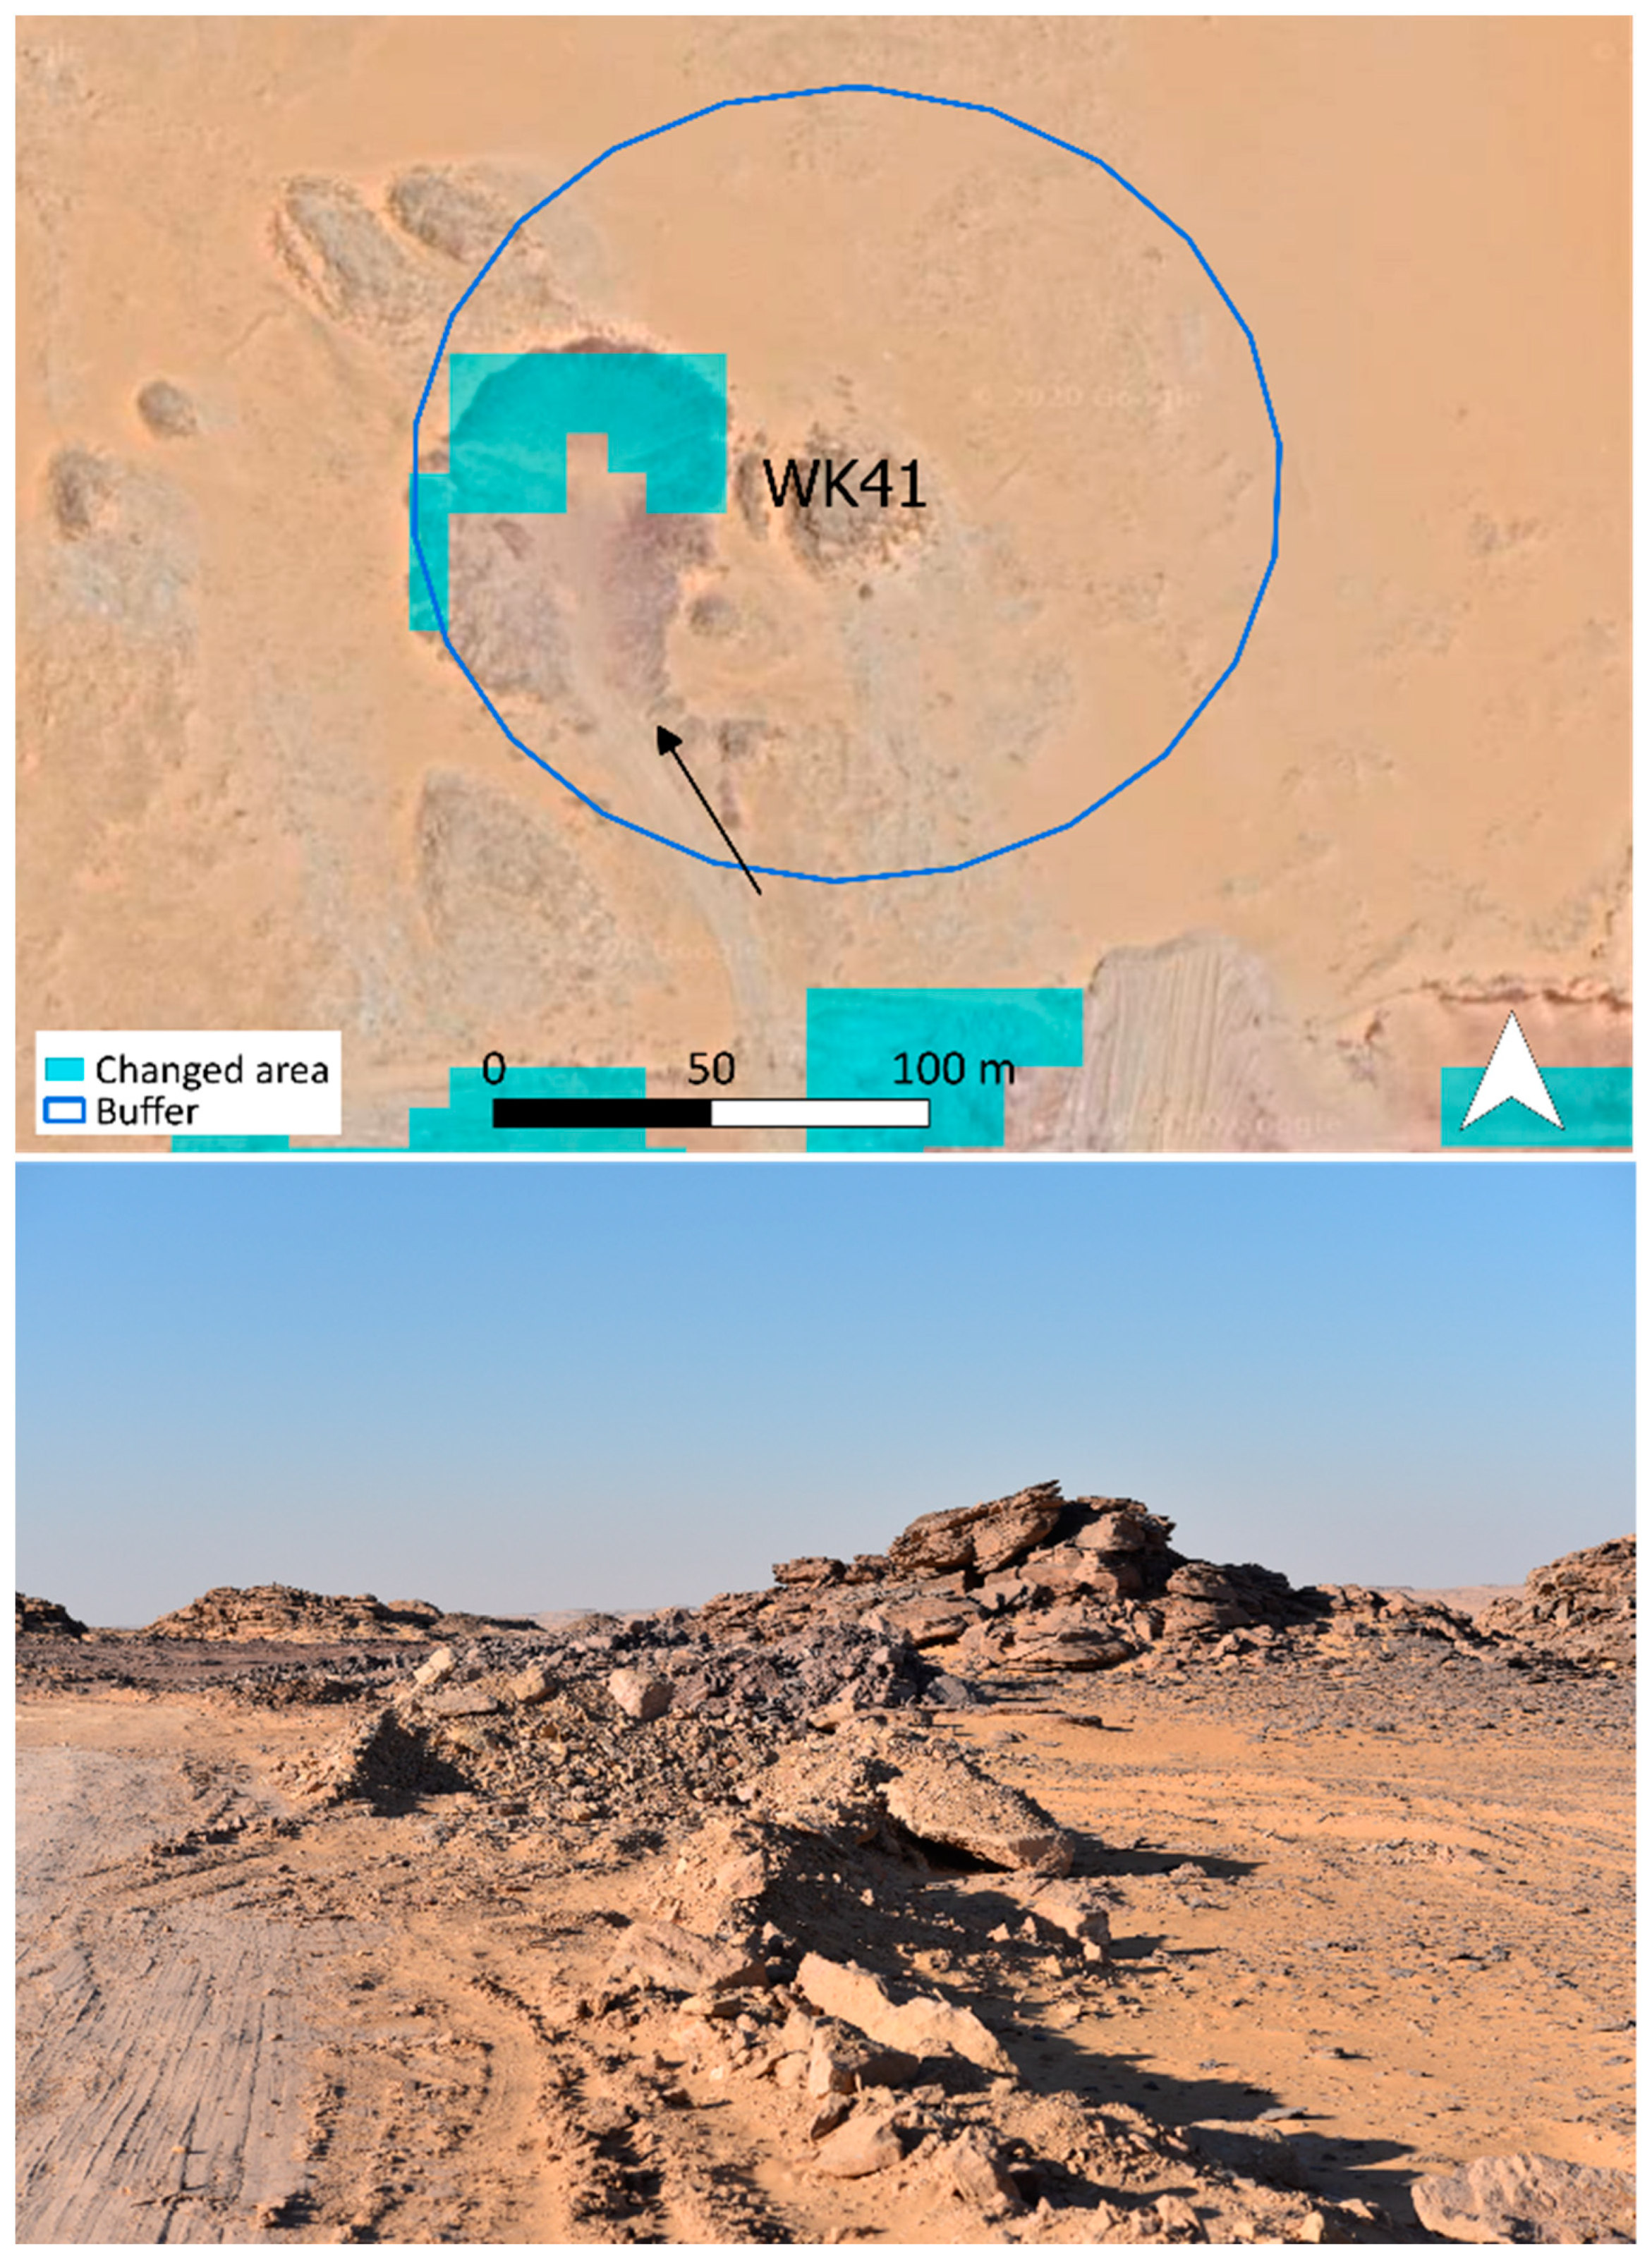
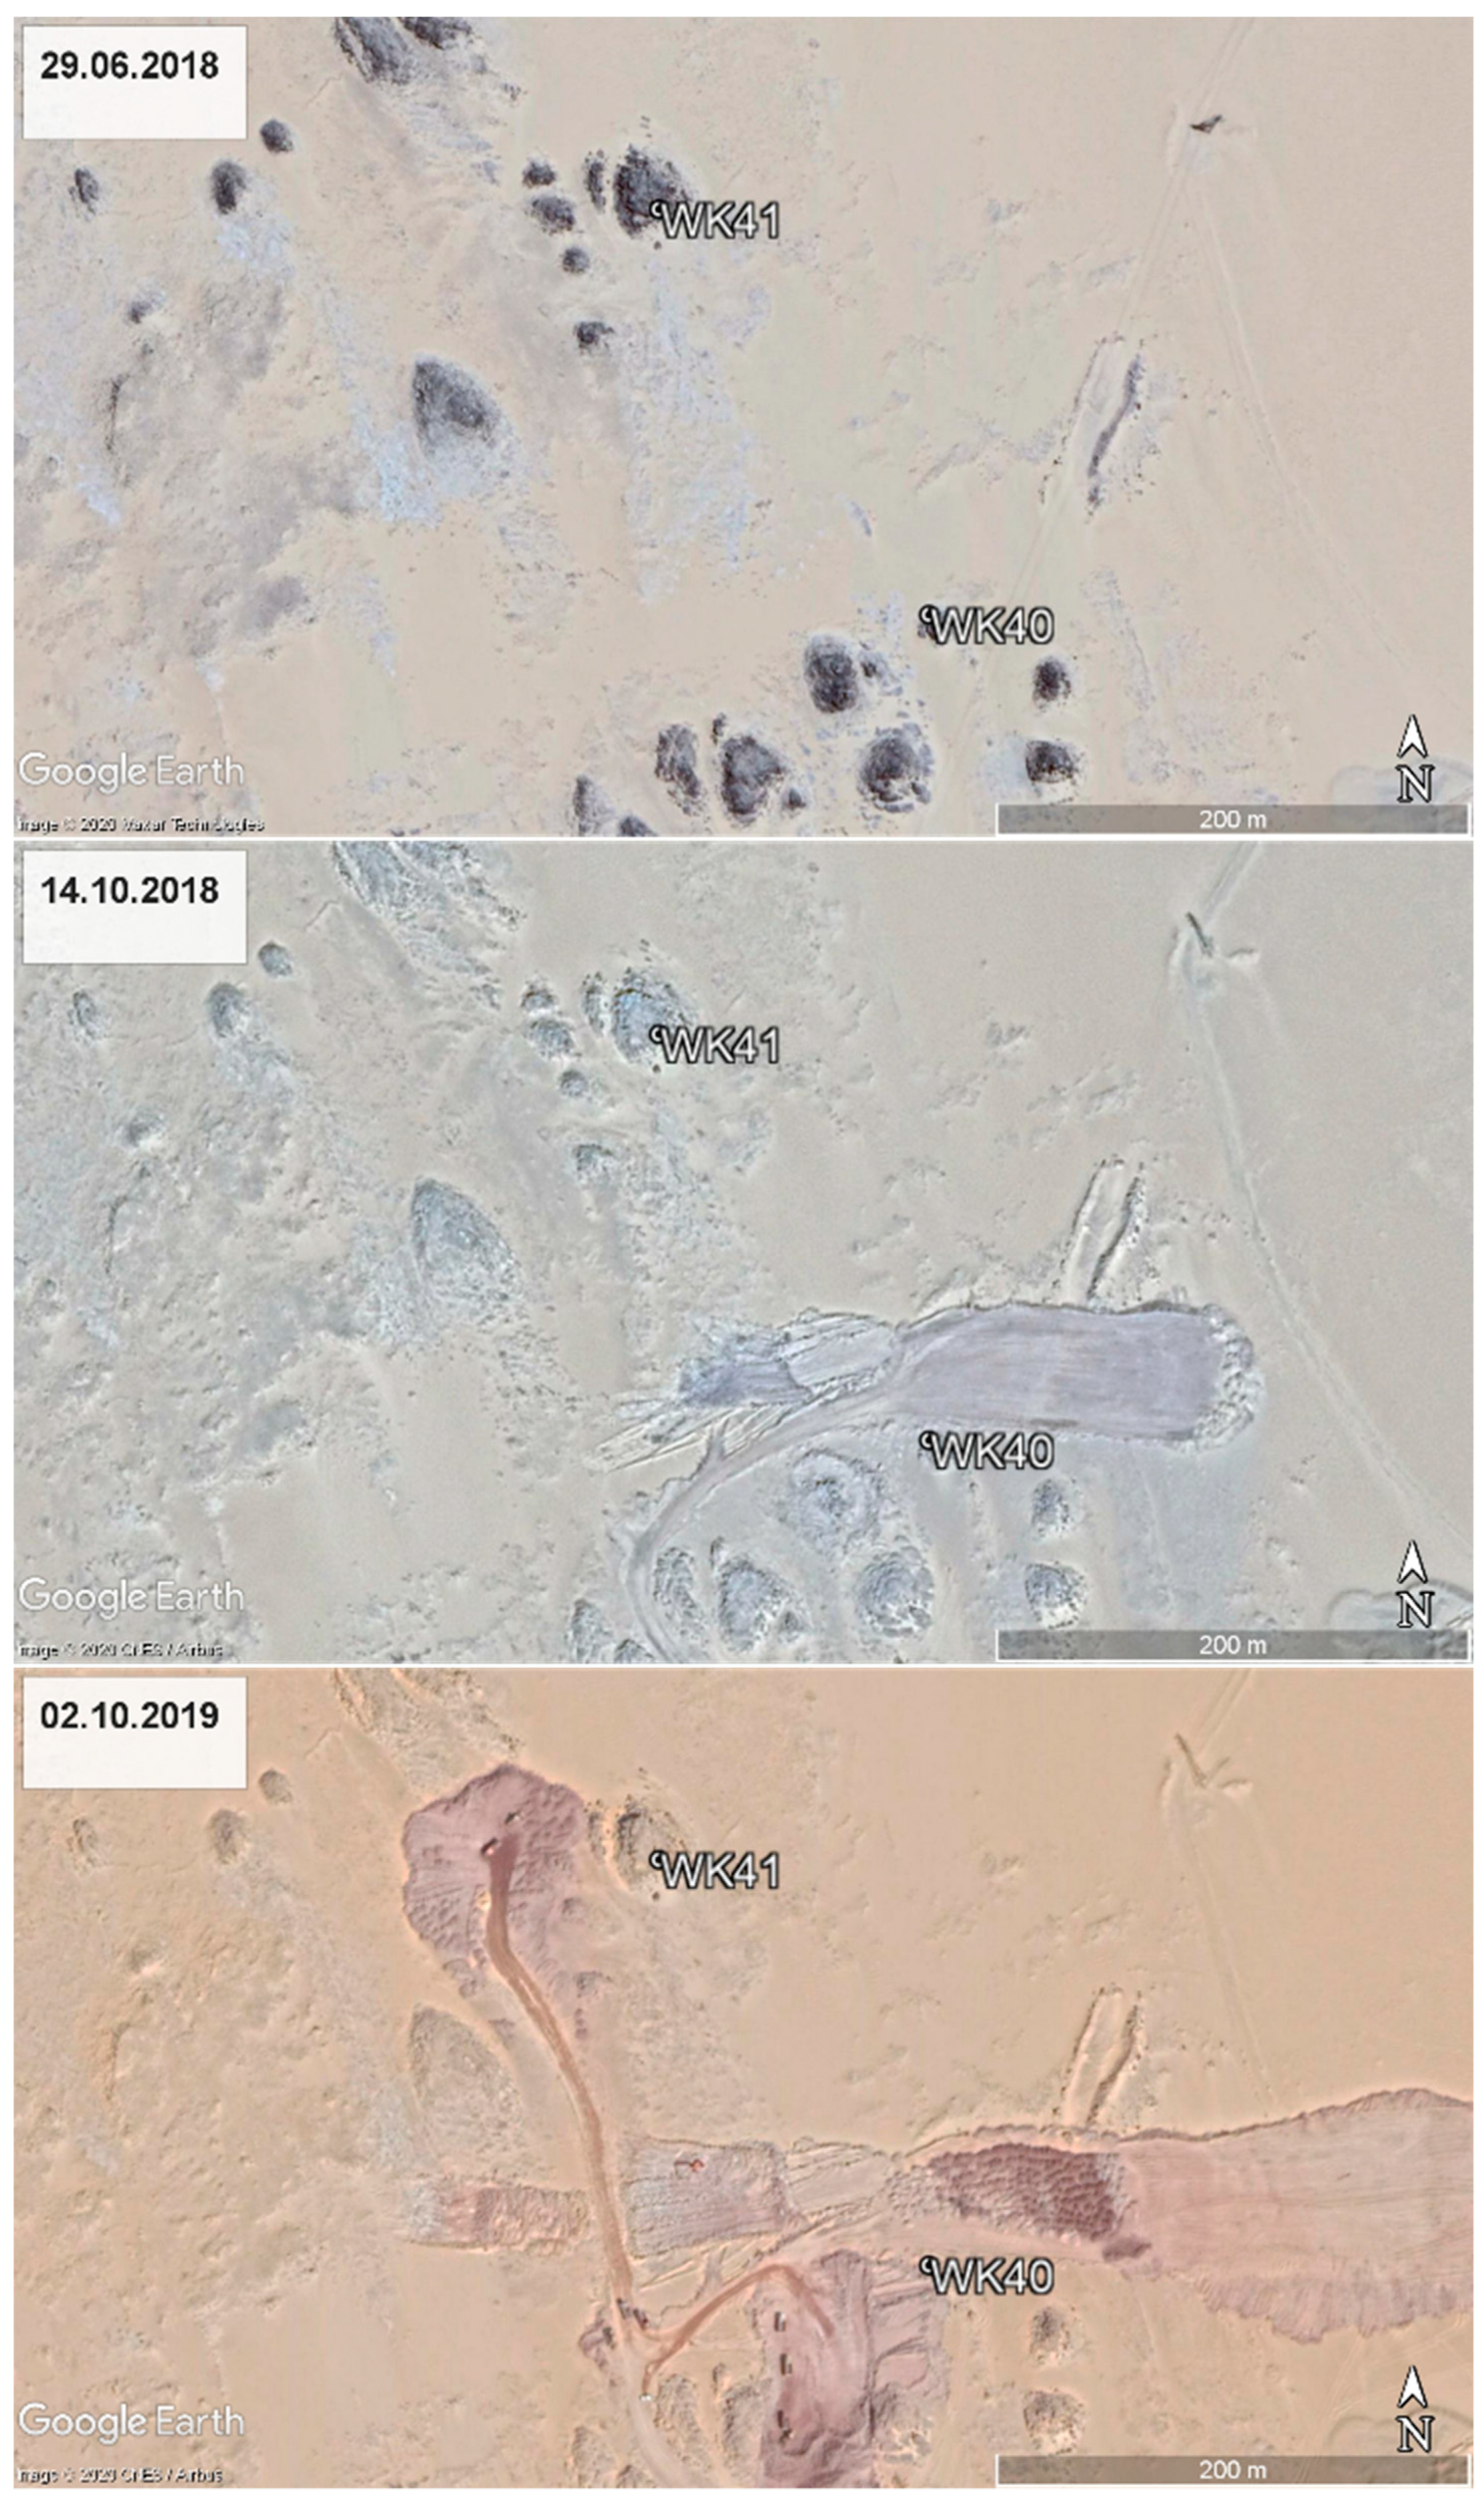
3.1. Aswan and Kom Ombo

The algorithm highlighted 73 of 279 sites in the Aswan and Kom Ombo area as having change within the buffered area, with an overall accuracy of 85% (Figure 3). Some of the sites had already been destroyed prior to the analysis period, although remaining subsurface material cannot be ruled out. A range of modern activities was represented, especially planned urban expansion, unplanned smaller scale construction, agricultural changes, and bulldozing. Table 3 shows the results of validating the data. The graph (Figure 4) shows the distribution of the mean pre-thresholded values for each buffer. The unaffected sites tend to have low mean change values, under 0.1. Some of the true positives are also under or close to 0.1 because the ‘any non zero’ parameter allows even small instances of change represented by a single pixel to be picked up. The graph also shows that the false positives were incorrectly labelled as changed due to relatively high values in the original change layer, while the false negatives had low values even though the change could be identified by examining other imagery and during fieldwork.

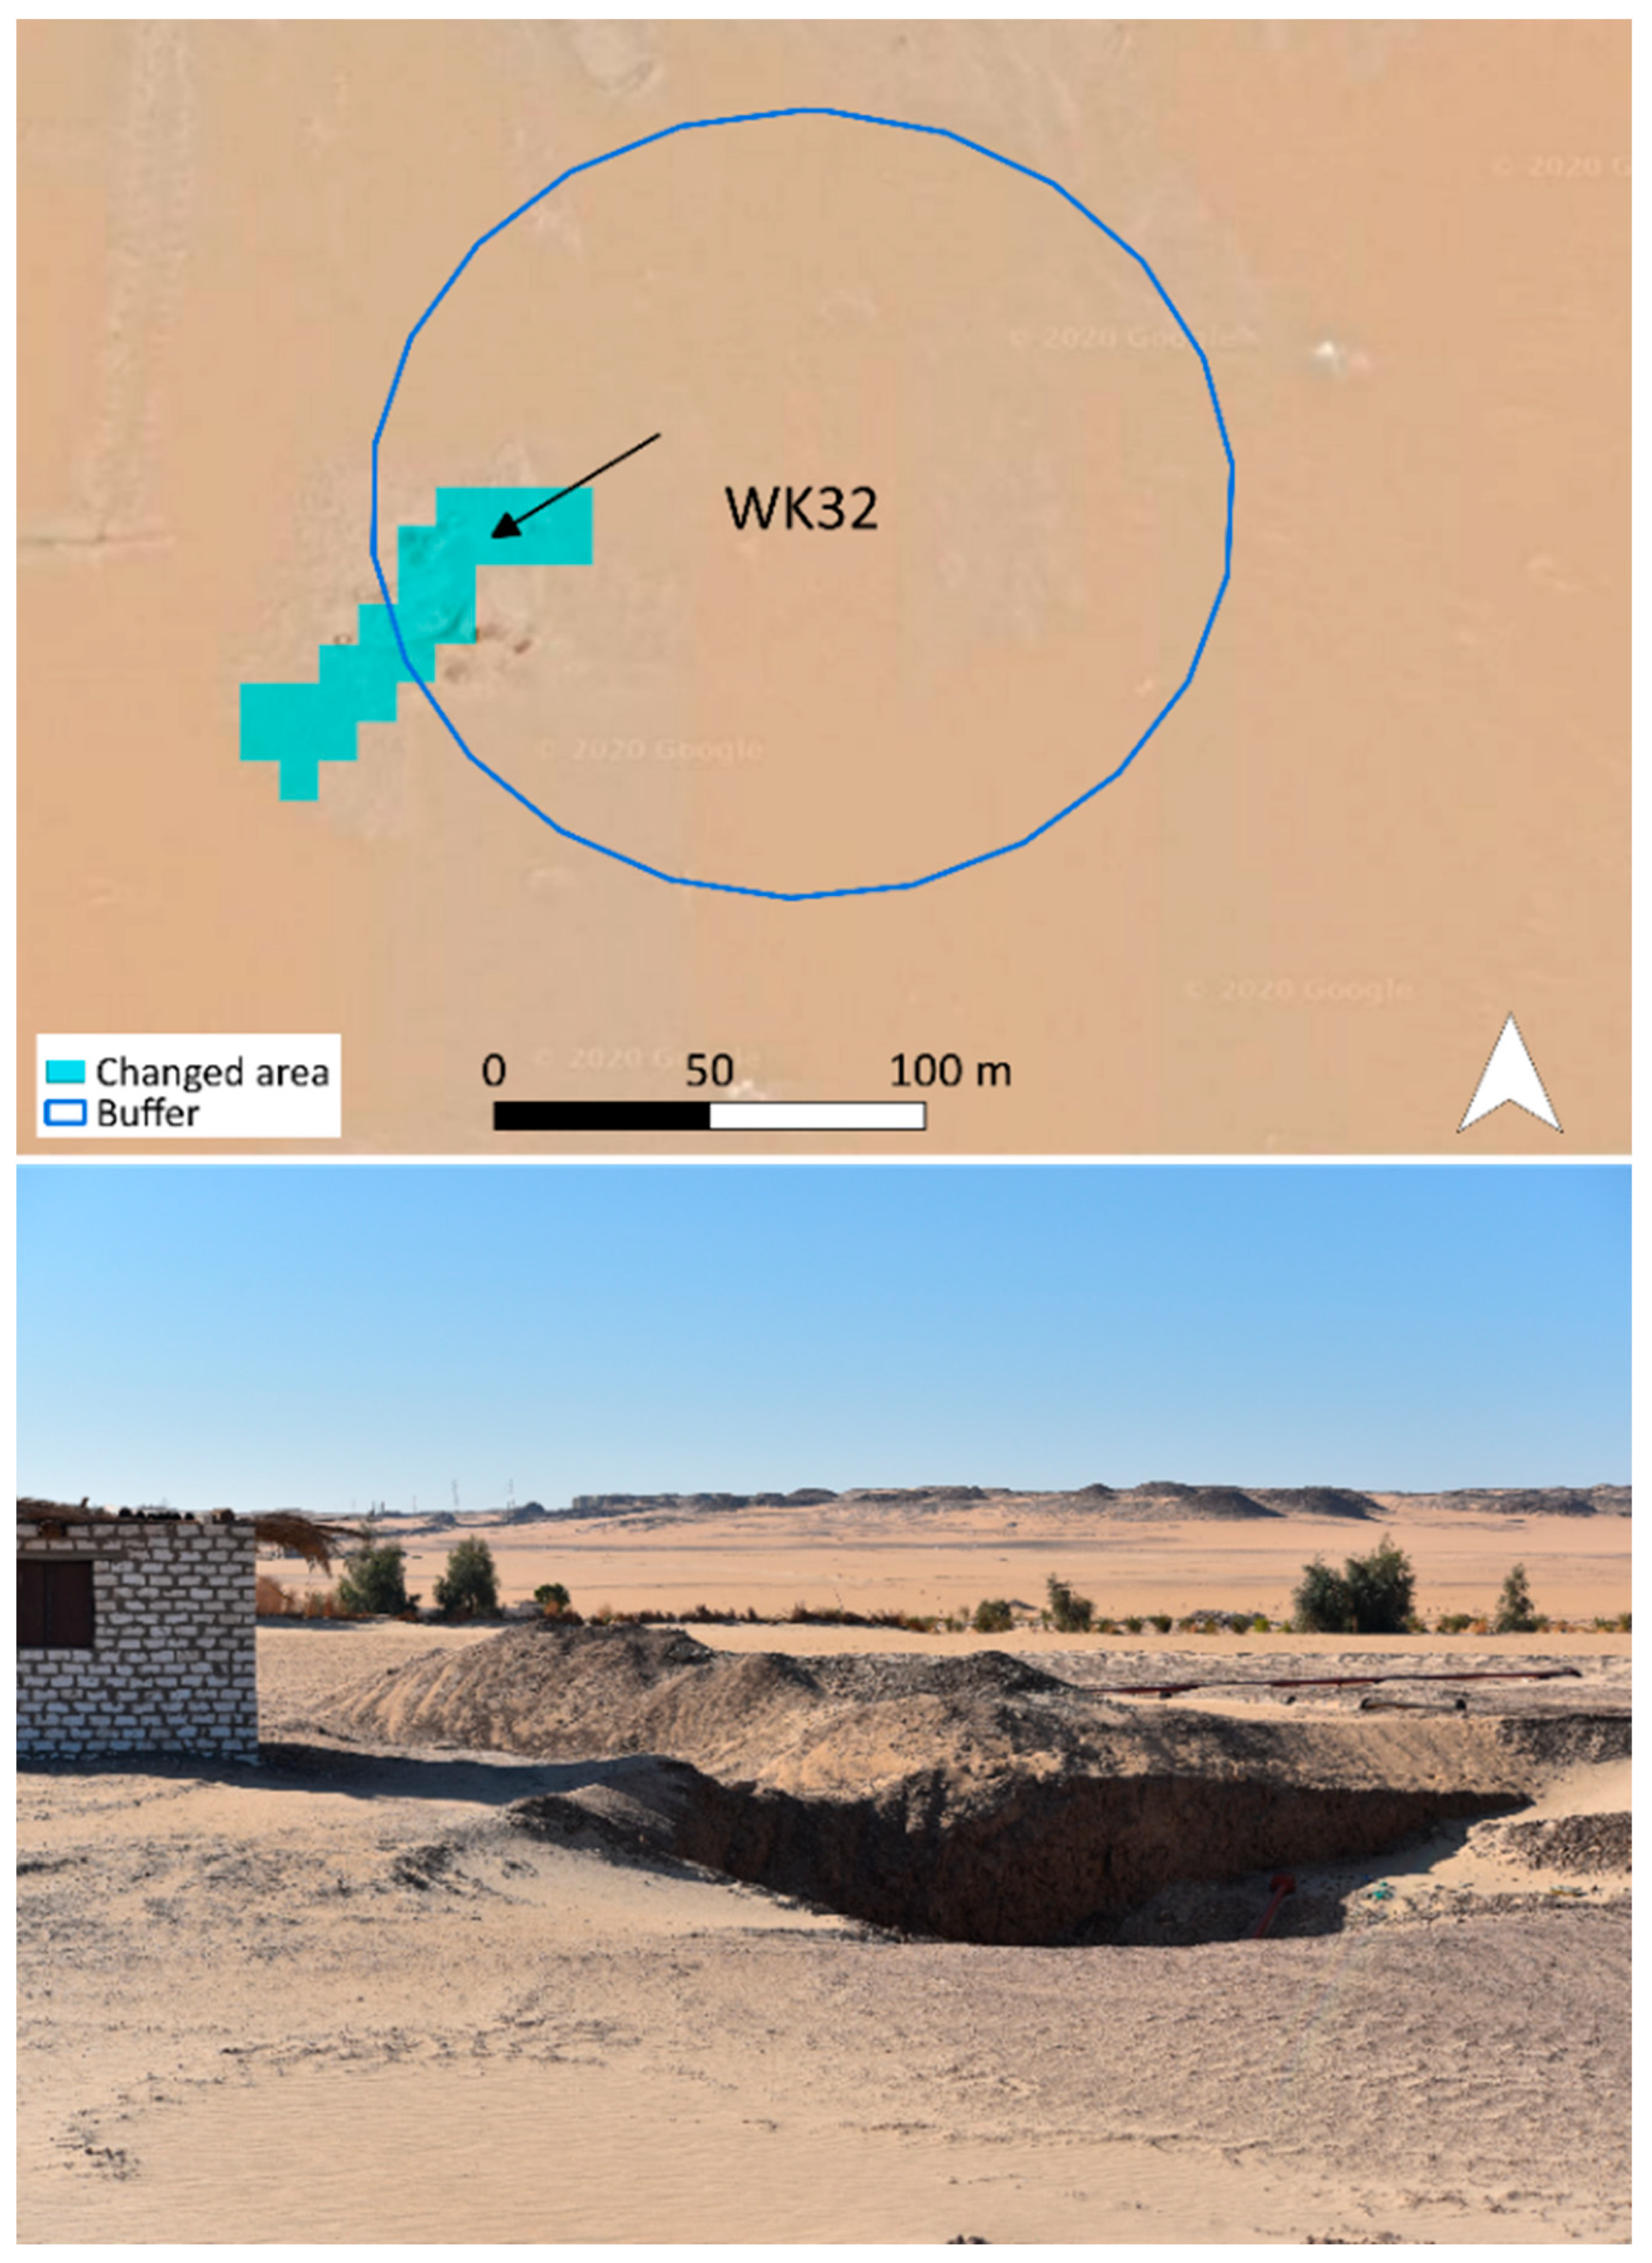
3.1.1. True Positives

With a producer’s accuracy of 78%, changes/threats were correctly identified by the algorithm at 45 sites. These were confirmed by manual examination of the imagery and during field visits. In particular, the algorithm results highlight the rapid pace of development of ‘New Aswan’. Although the construction of the new settlement has been ongoing, since the start of the twenty-first century, the work continues to threaten the remaining archaeological sites in the area. Several sites were identified by the algorithm as undergoing changes caused by this big construction project. The script highlighted the sites of WK40 (scatter of lithic artefacts, now destroyed) and WK41 (rock art) where road construction, bulldozing, and dumping of spoil were taking place (see Figure 5, Figure 6, Figure 7 and Figure 8). The sequence of satellite images from Google Earth shows in higher resolution how WK40 was damaged by these changes in 2018, and that WK41 is at urgent risk (Figure 8), and therefore, must be a priority for protection efforts.
Smaller-scale, localised, but equally damaging changes away from the ‘New Aswan’ project were also identified by the script and included construction and quarrying. At the lithic scatter site of WK32 (Figure 9), the algorithm detected recent digging of pits, spoil heaps, and the construction of a small agricultural building.
Another example of the local activity causing change can be seen at two sites in the Wadi el-Tawil. The algorithm found that WT1, a second millennium BC cemetery of Nubian nomads, is threatened by the expansion of a modern cemetery which comprises burials, planting, and a trackway (see Figure 10 and Figure 11). Given the potential archaeological significance of this site, these rapid changes make it’s recording an urgent priority before it is destroyed. Across the other side of the wadi at a rock art panel (WT7) the algorithm identified that a large pit was excavated, with spoil heaps surrounding it. This may have been dug for clay extraction.
Examination of daily 3 m resolution imagery from PlanetScope satellites allows the specific periods in which the change occurred to be narrowed down (in this case between December 2018 and January 2020, Figure 11). Because these kinds of changes are not part of a larger-scale, planned construction project like ‘New Aswan’, they are harder to predict. In such cases, the value of using automated remote sensing processes is clear.
Some agricultural differences were detected, for example, caused by changes in planting within already-existing fields (see WK31, 35, 36, 37, 38, Figure 12). Comparing matching time periods from different years reduces the influence of routine seasonality in cultivation on the algorithm, although this should be integrated into the script by examining the standard deviation over a longer period. Sometimes it was found that the fields had been laid out and ploughed prior to 2018, but were planted during the analysis period (as Figure 12 shows). The process of constructing and finally cultivating a new field took a long time in the Aswan area, and a similar pattern was observed in Jufra. In areas where this is occurring, it can be identified at an early stage using change detection and sites could be recorded and potentially protected before they are further damaged/destroyed.

3.1.2. False Positives

The user’s accuracy was relatively low at 61%; a manual examination of the imagery suggested that 28 of the ‘changed’ sites were, in fact, false positives, some located adjacent to cliffs casting a shadow which varied depending on the conditions under which the imagery was taken (Figure 13). Others may have been caused by natural movements of sand in areas where dunes were present (difficult to quantify in imagery or on the ground). Some discrepancies in image registration in Sentinel-2 data may also have caused errors.

3.1.3. True Negatives

For most of the sites, no changes were detected within the buffered areas, and this could be confirmed by visual examination of imagery and through field visits to a sample of these sites in January 2020. While many of these sites consisted of features relatively far from current human activity, for example, prehistoric sites further up Wadi Kubbaniya, others were in the vicinity of locations where changes were detected. Therefore, monitoring should continue, with sites with recent changes prioritised for field validation in future seasons. The change detection workflow gives an early warning of human activities and natural processes.

3.1.4. False Negatives
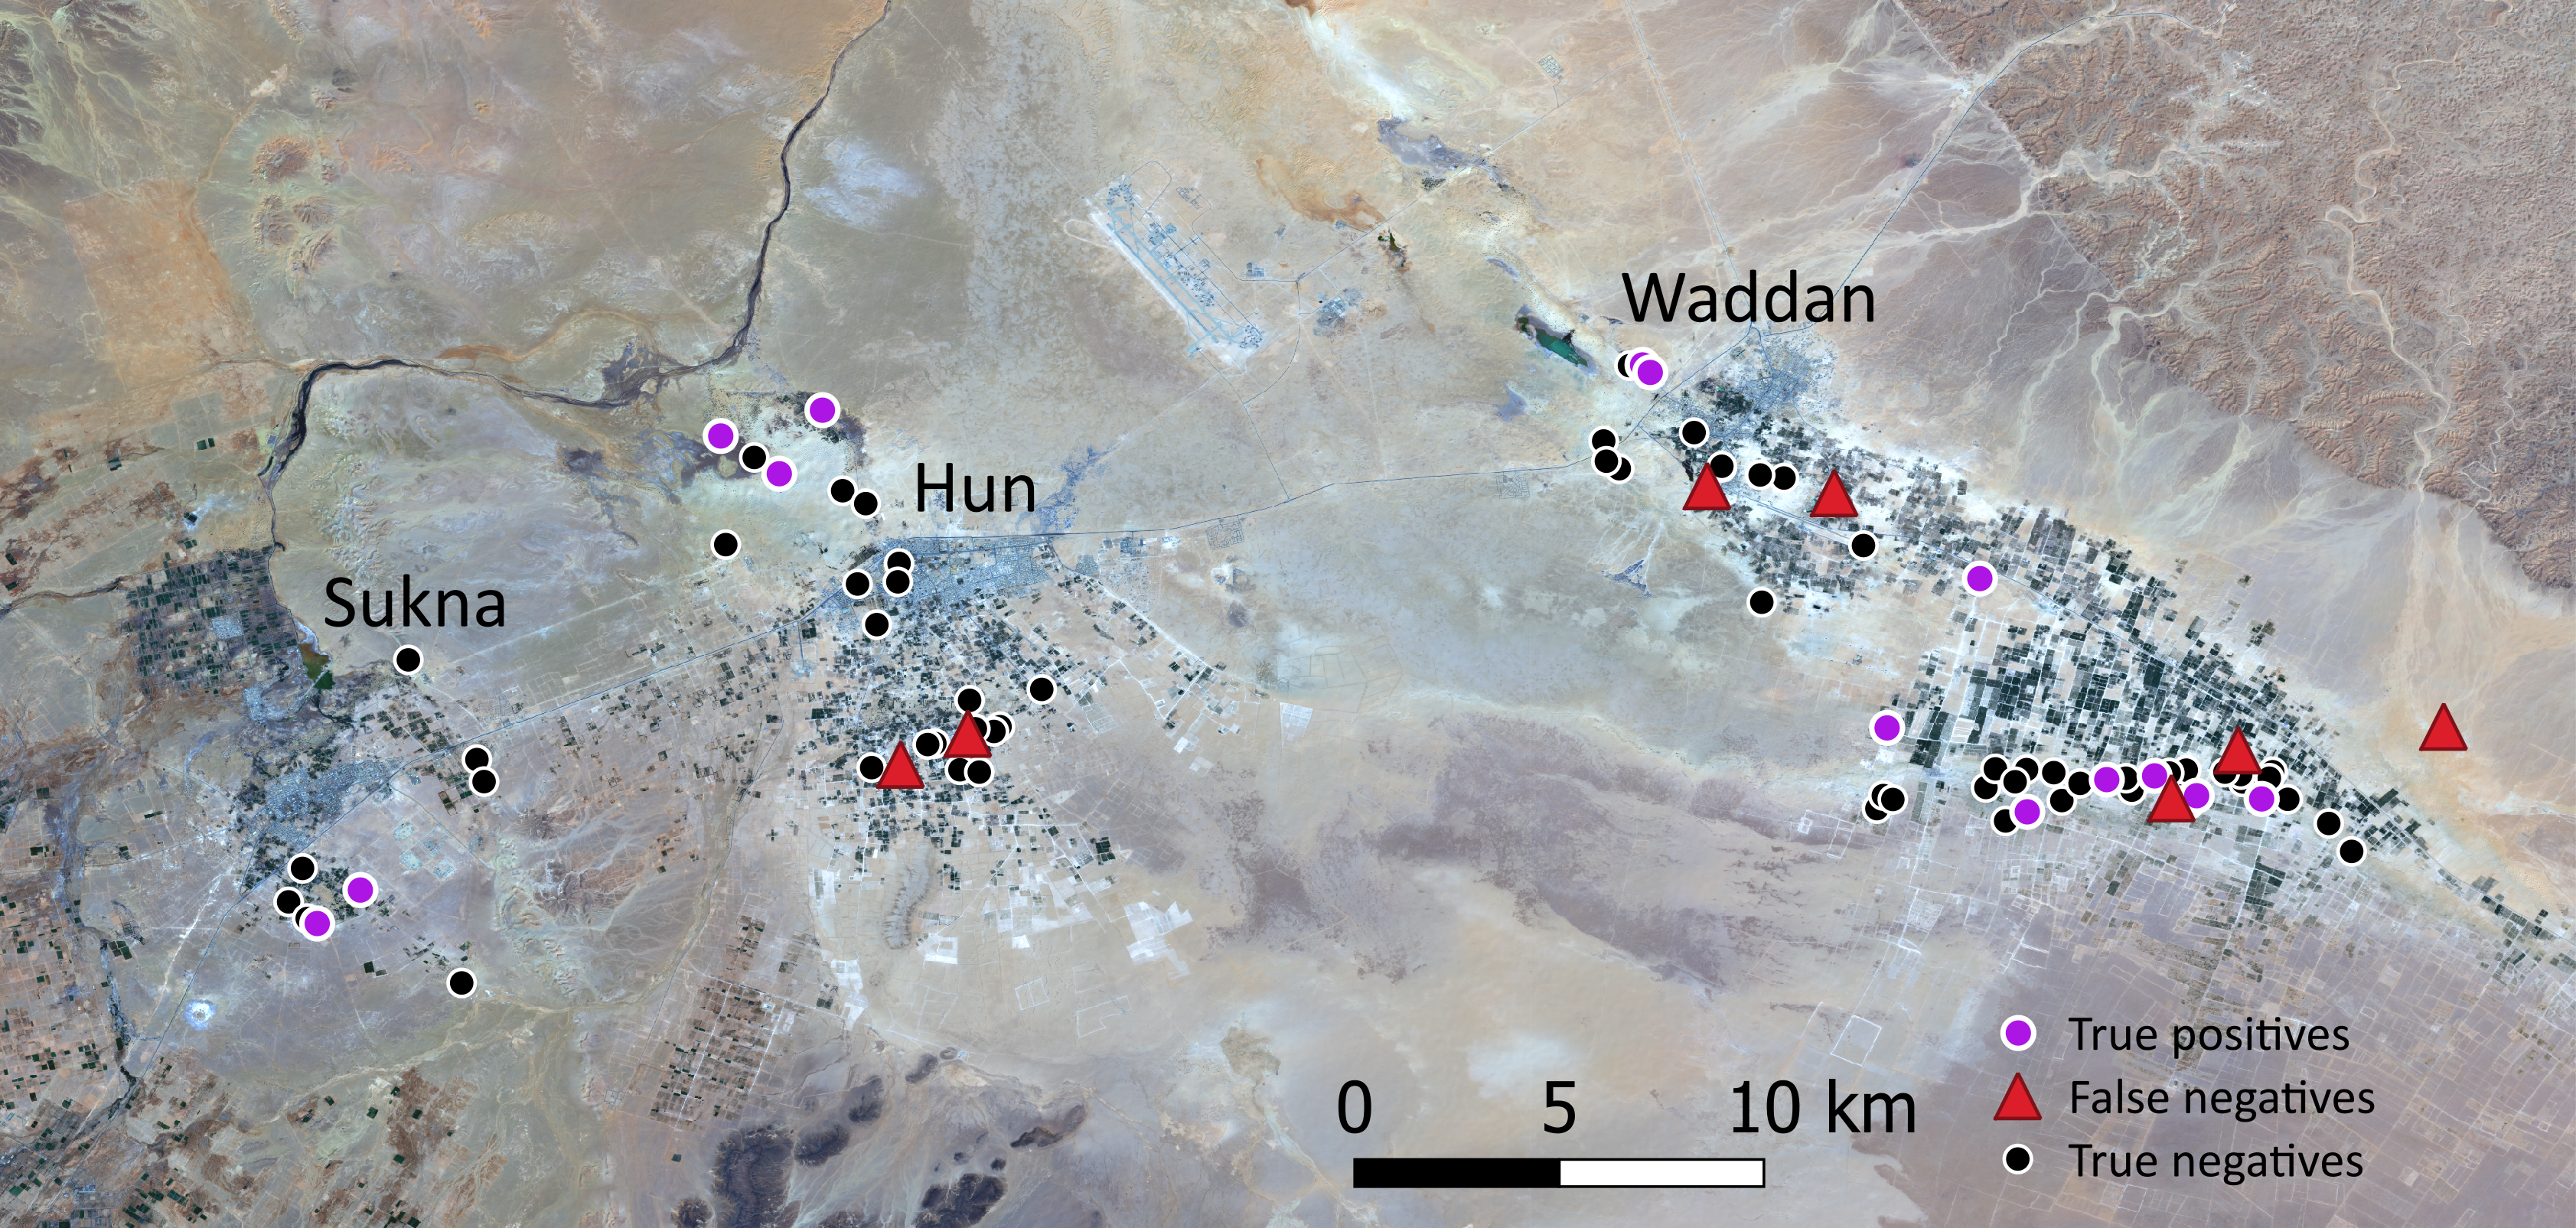
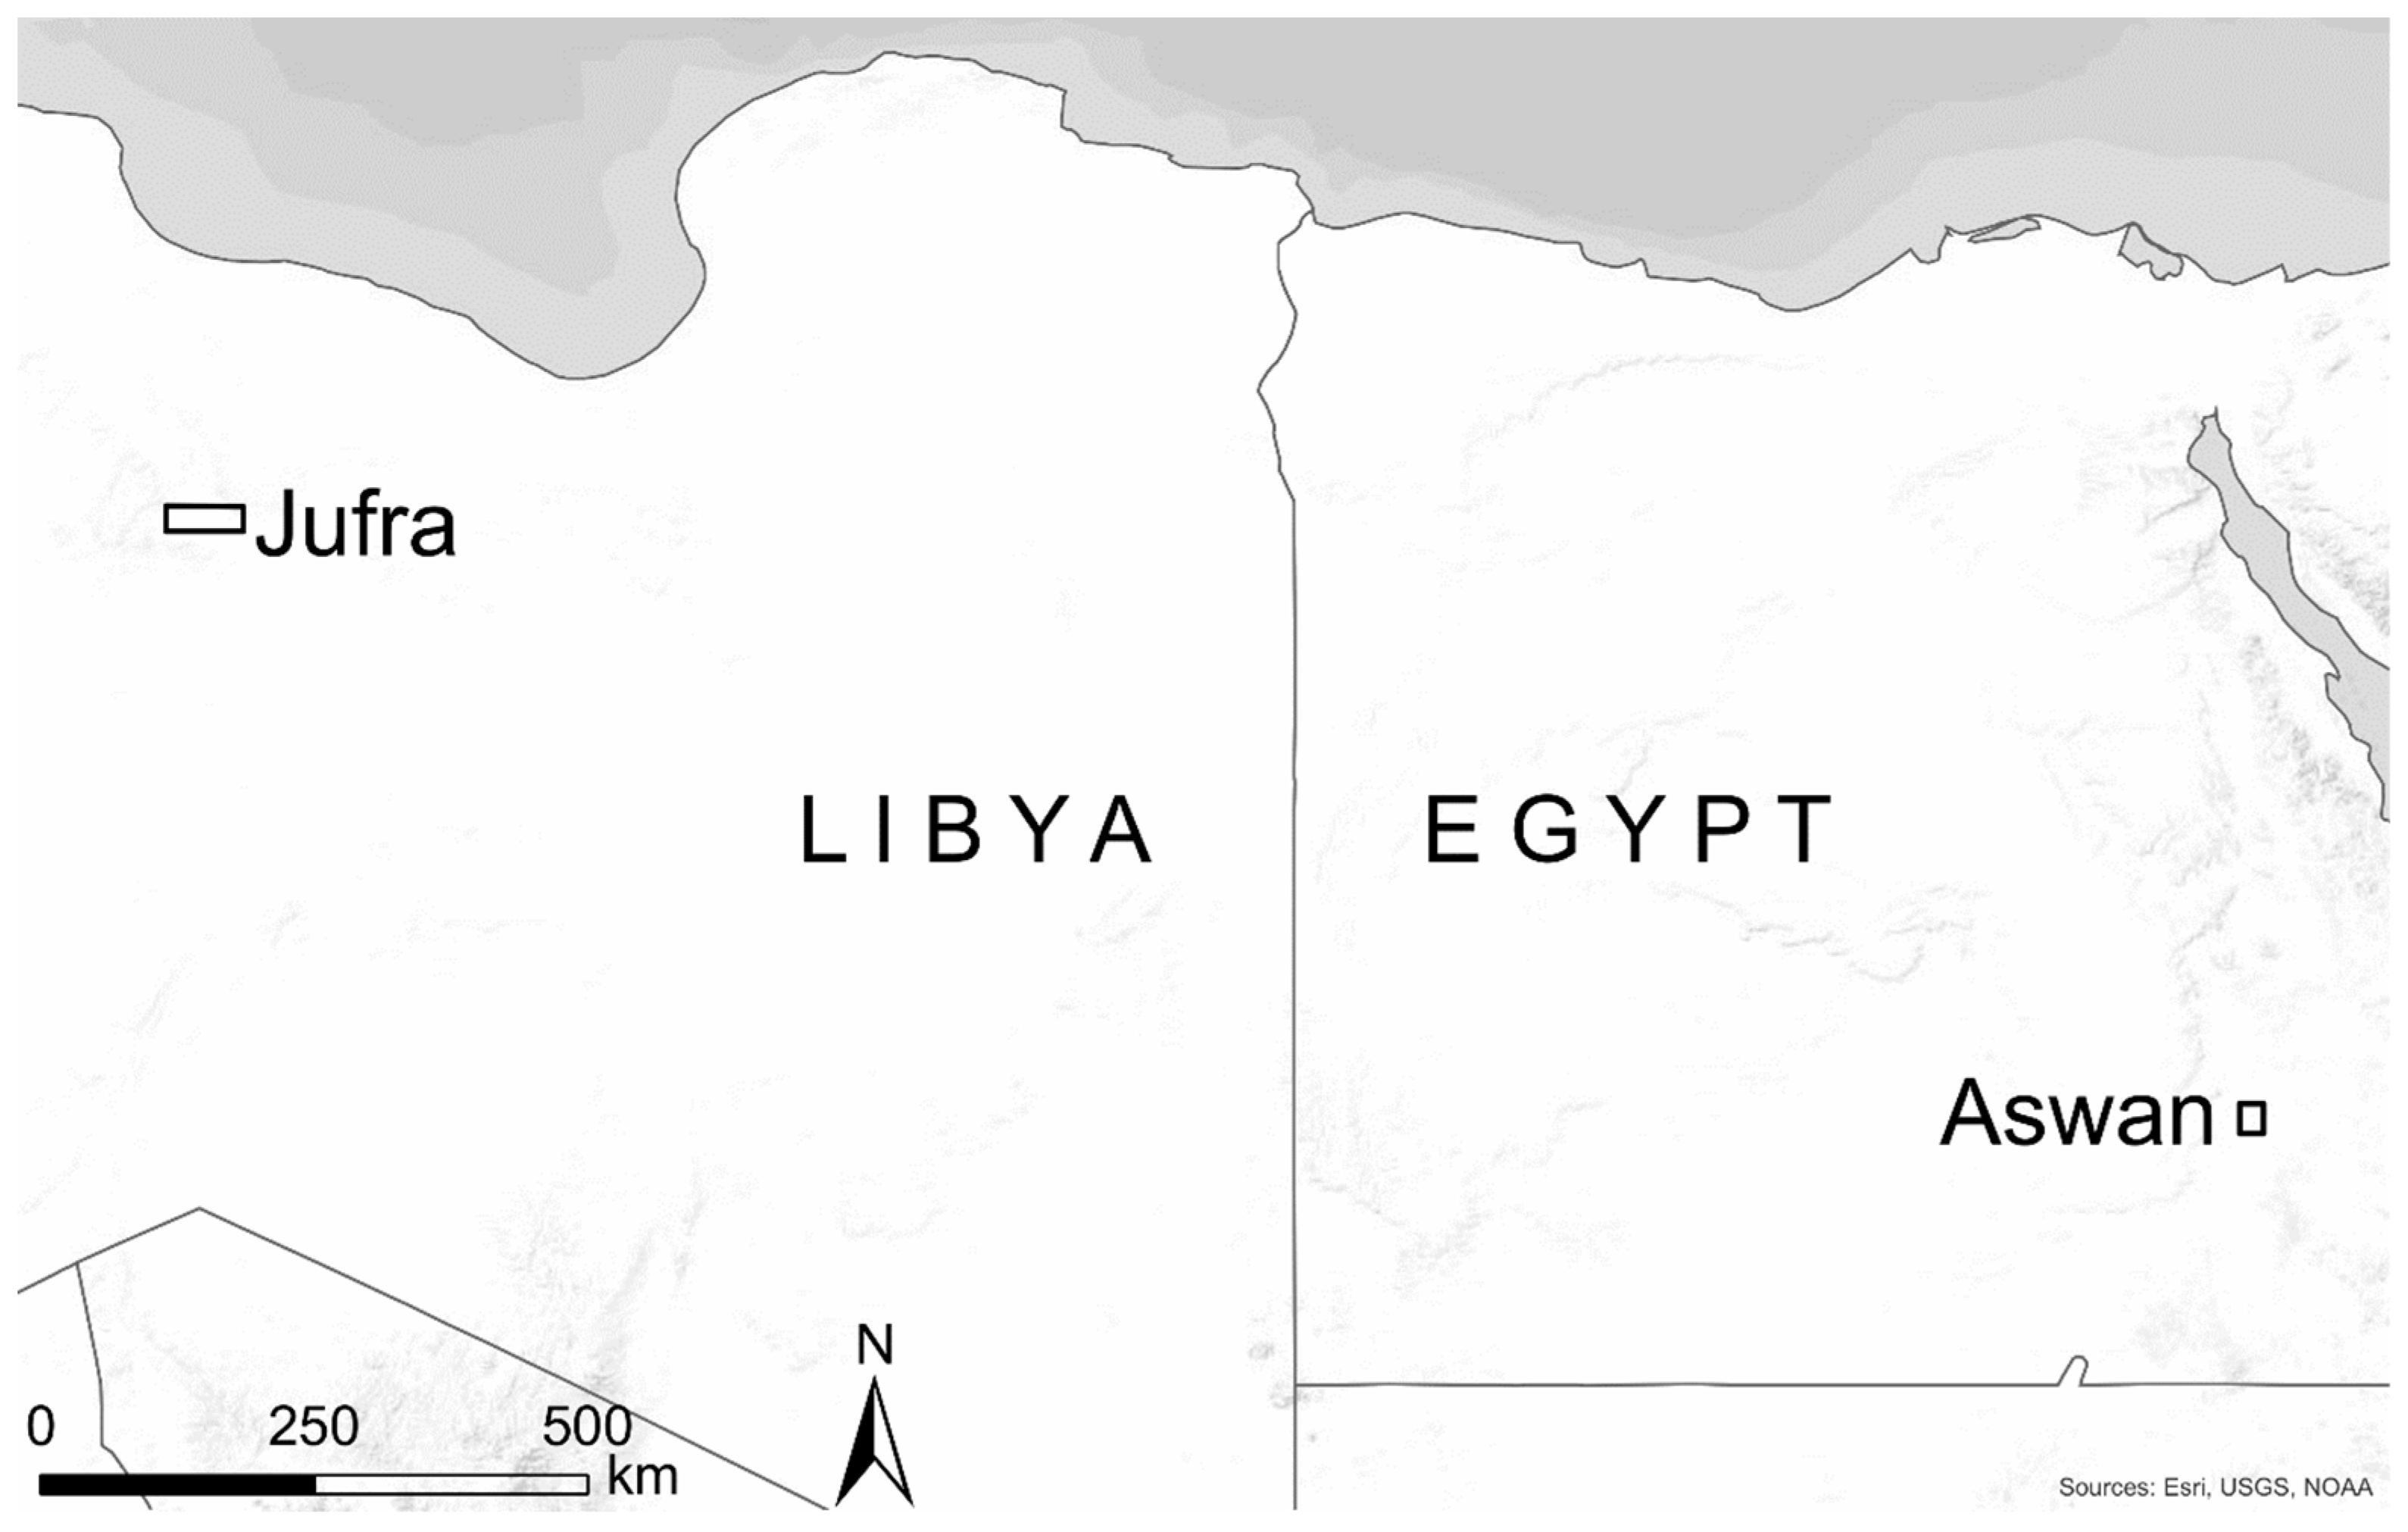
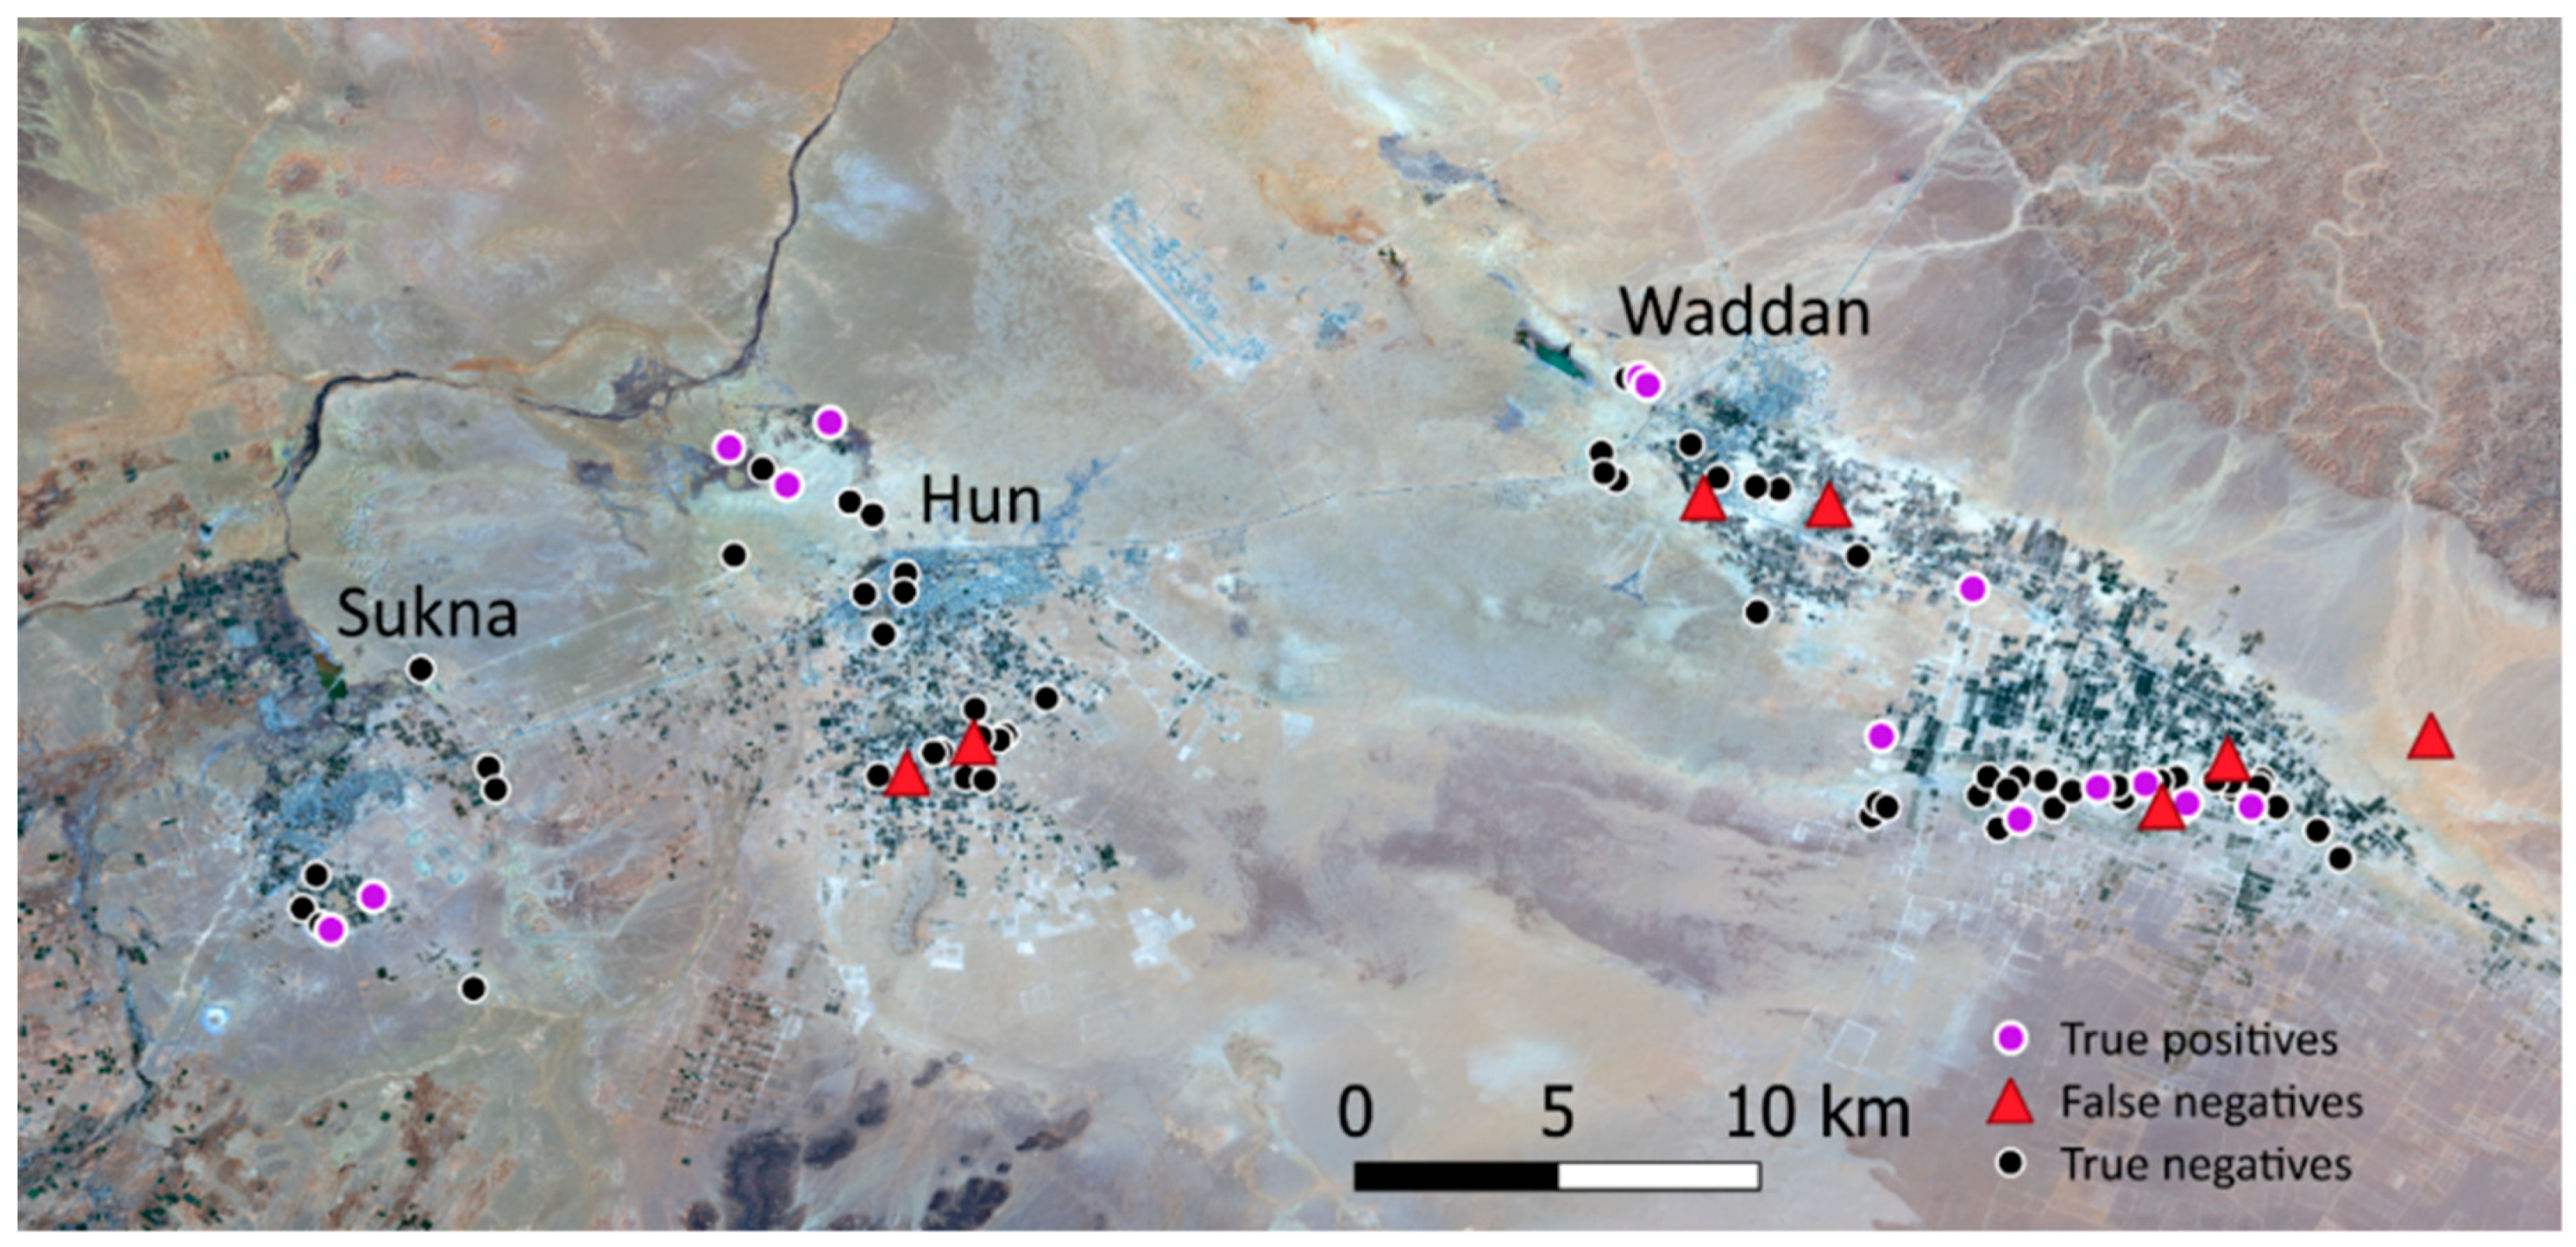
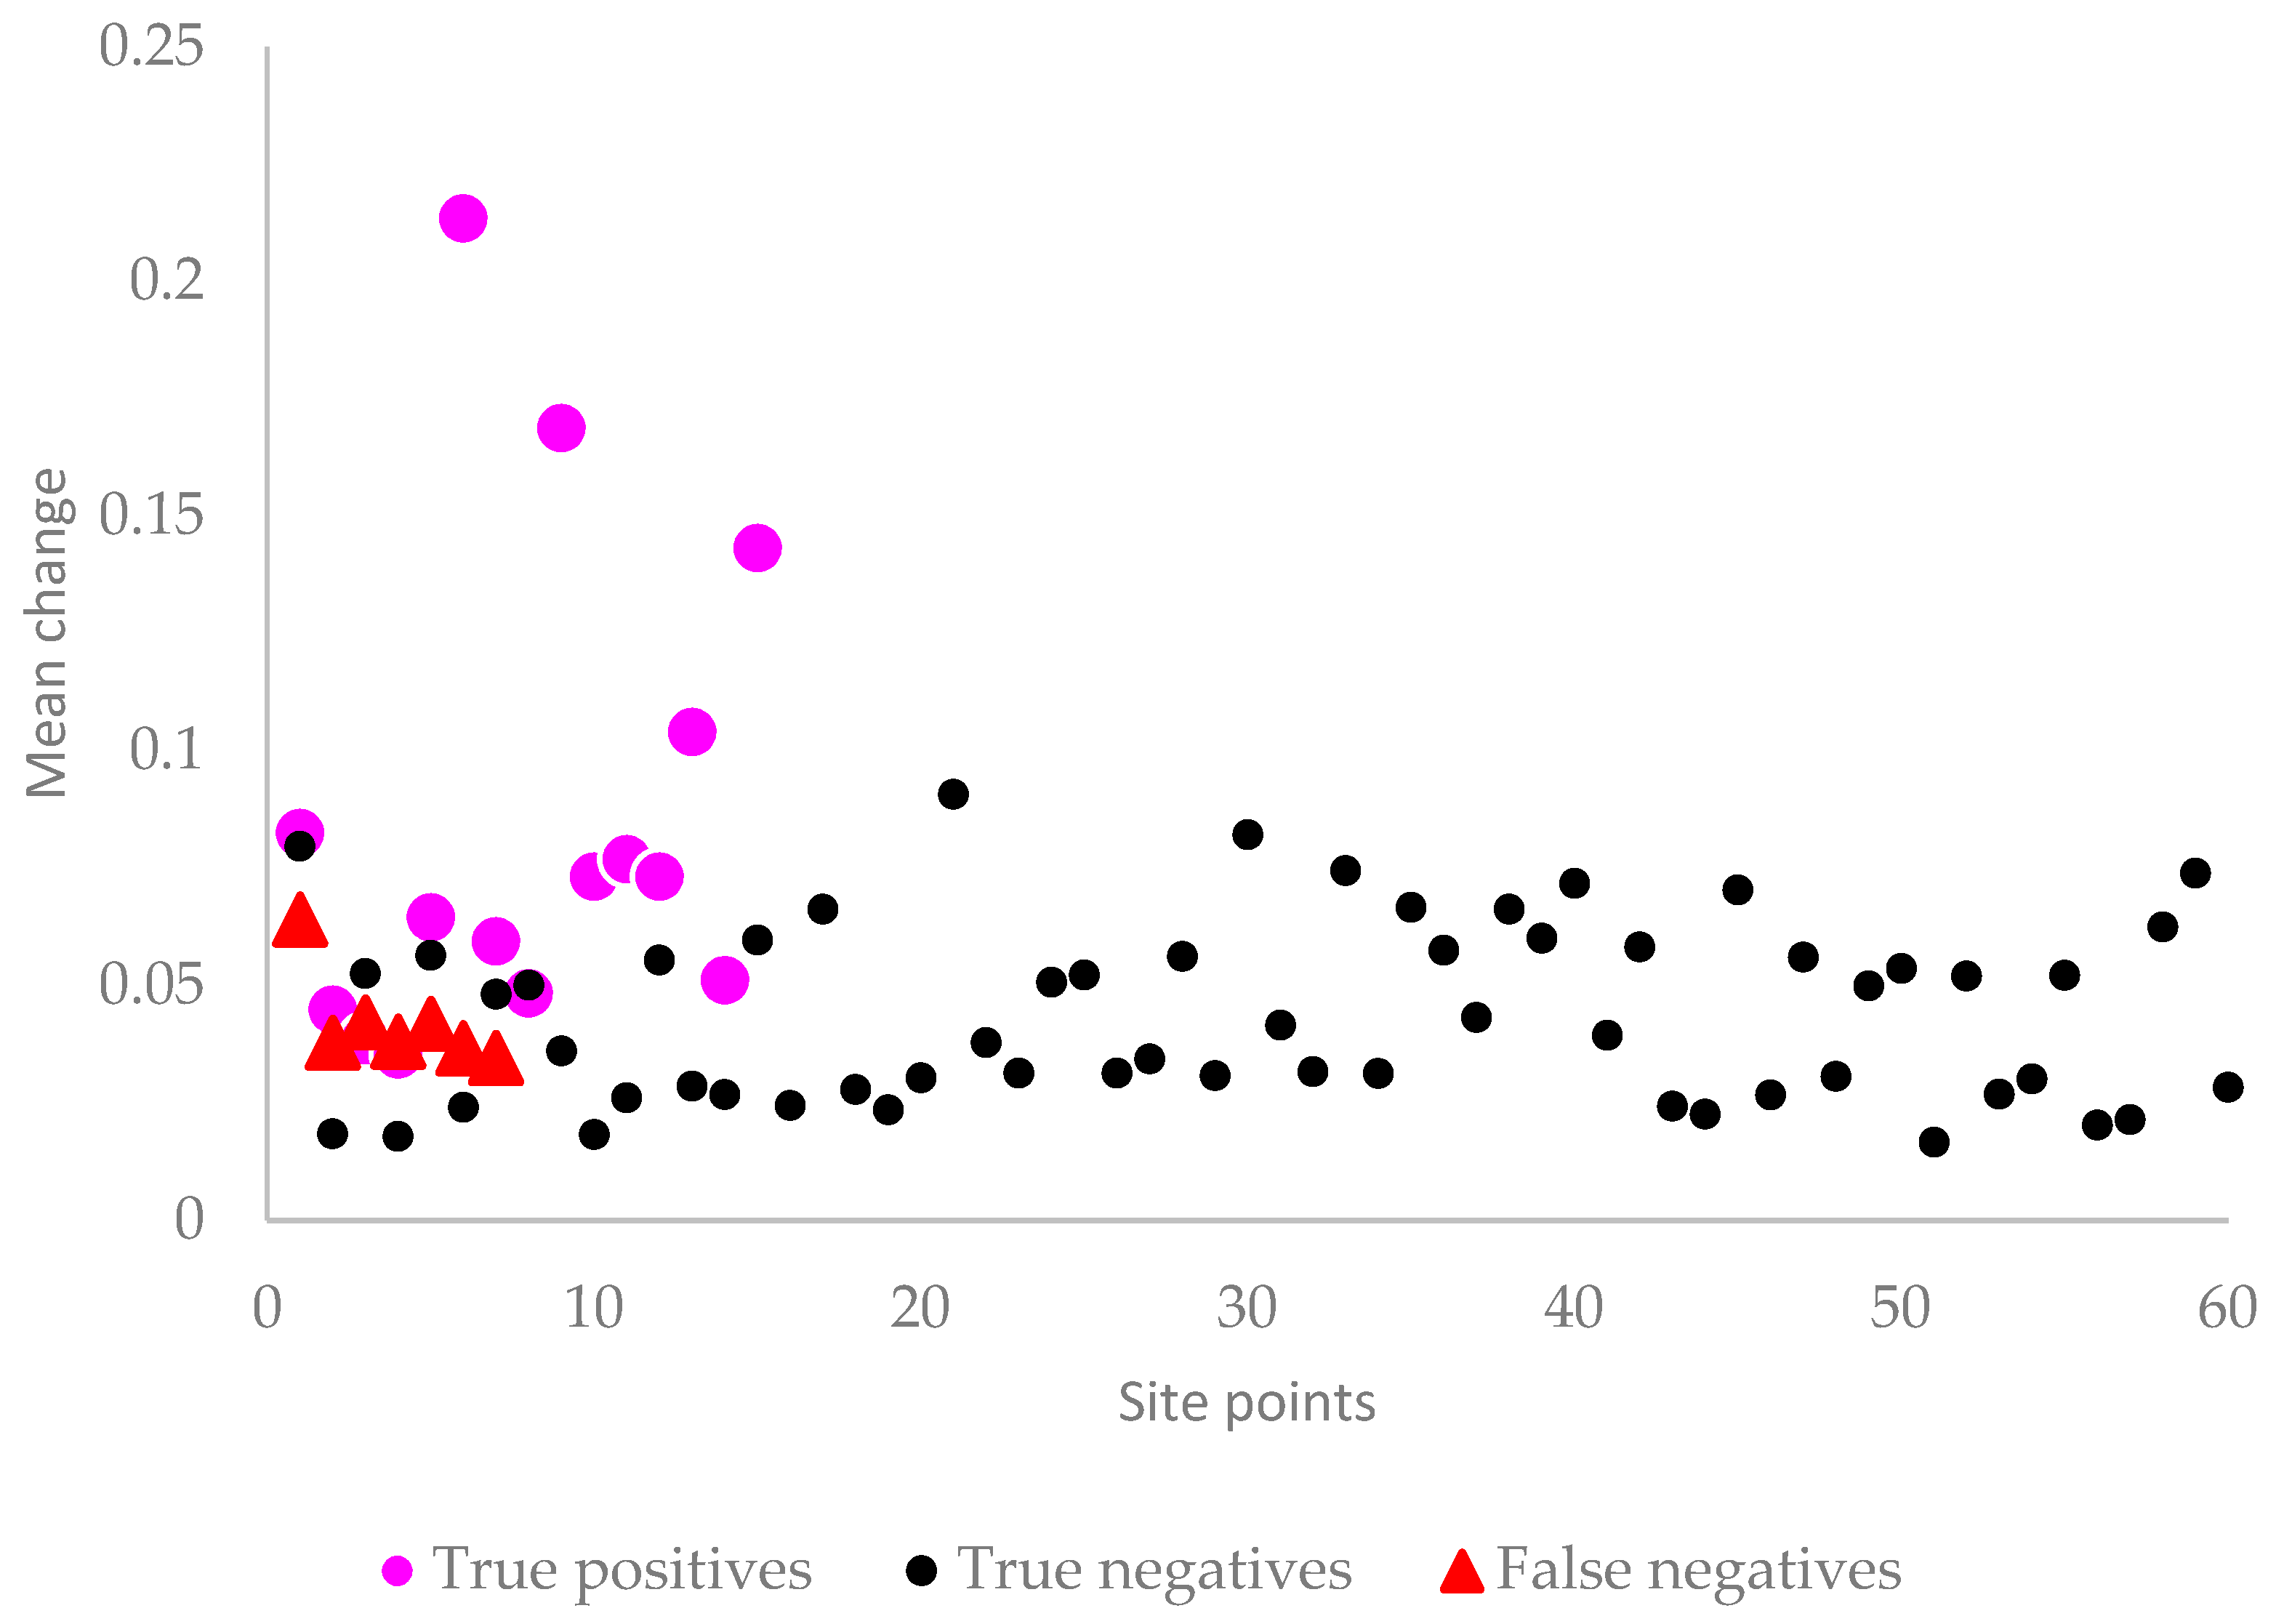
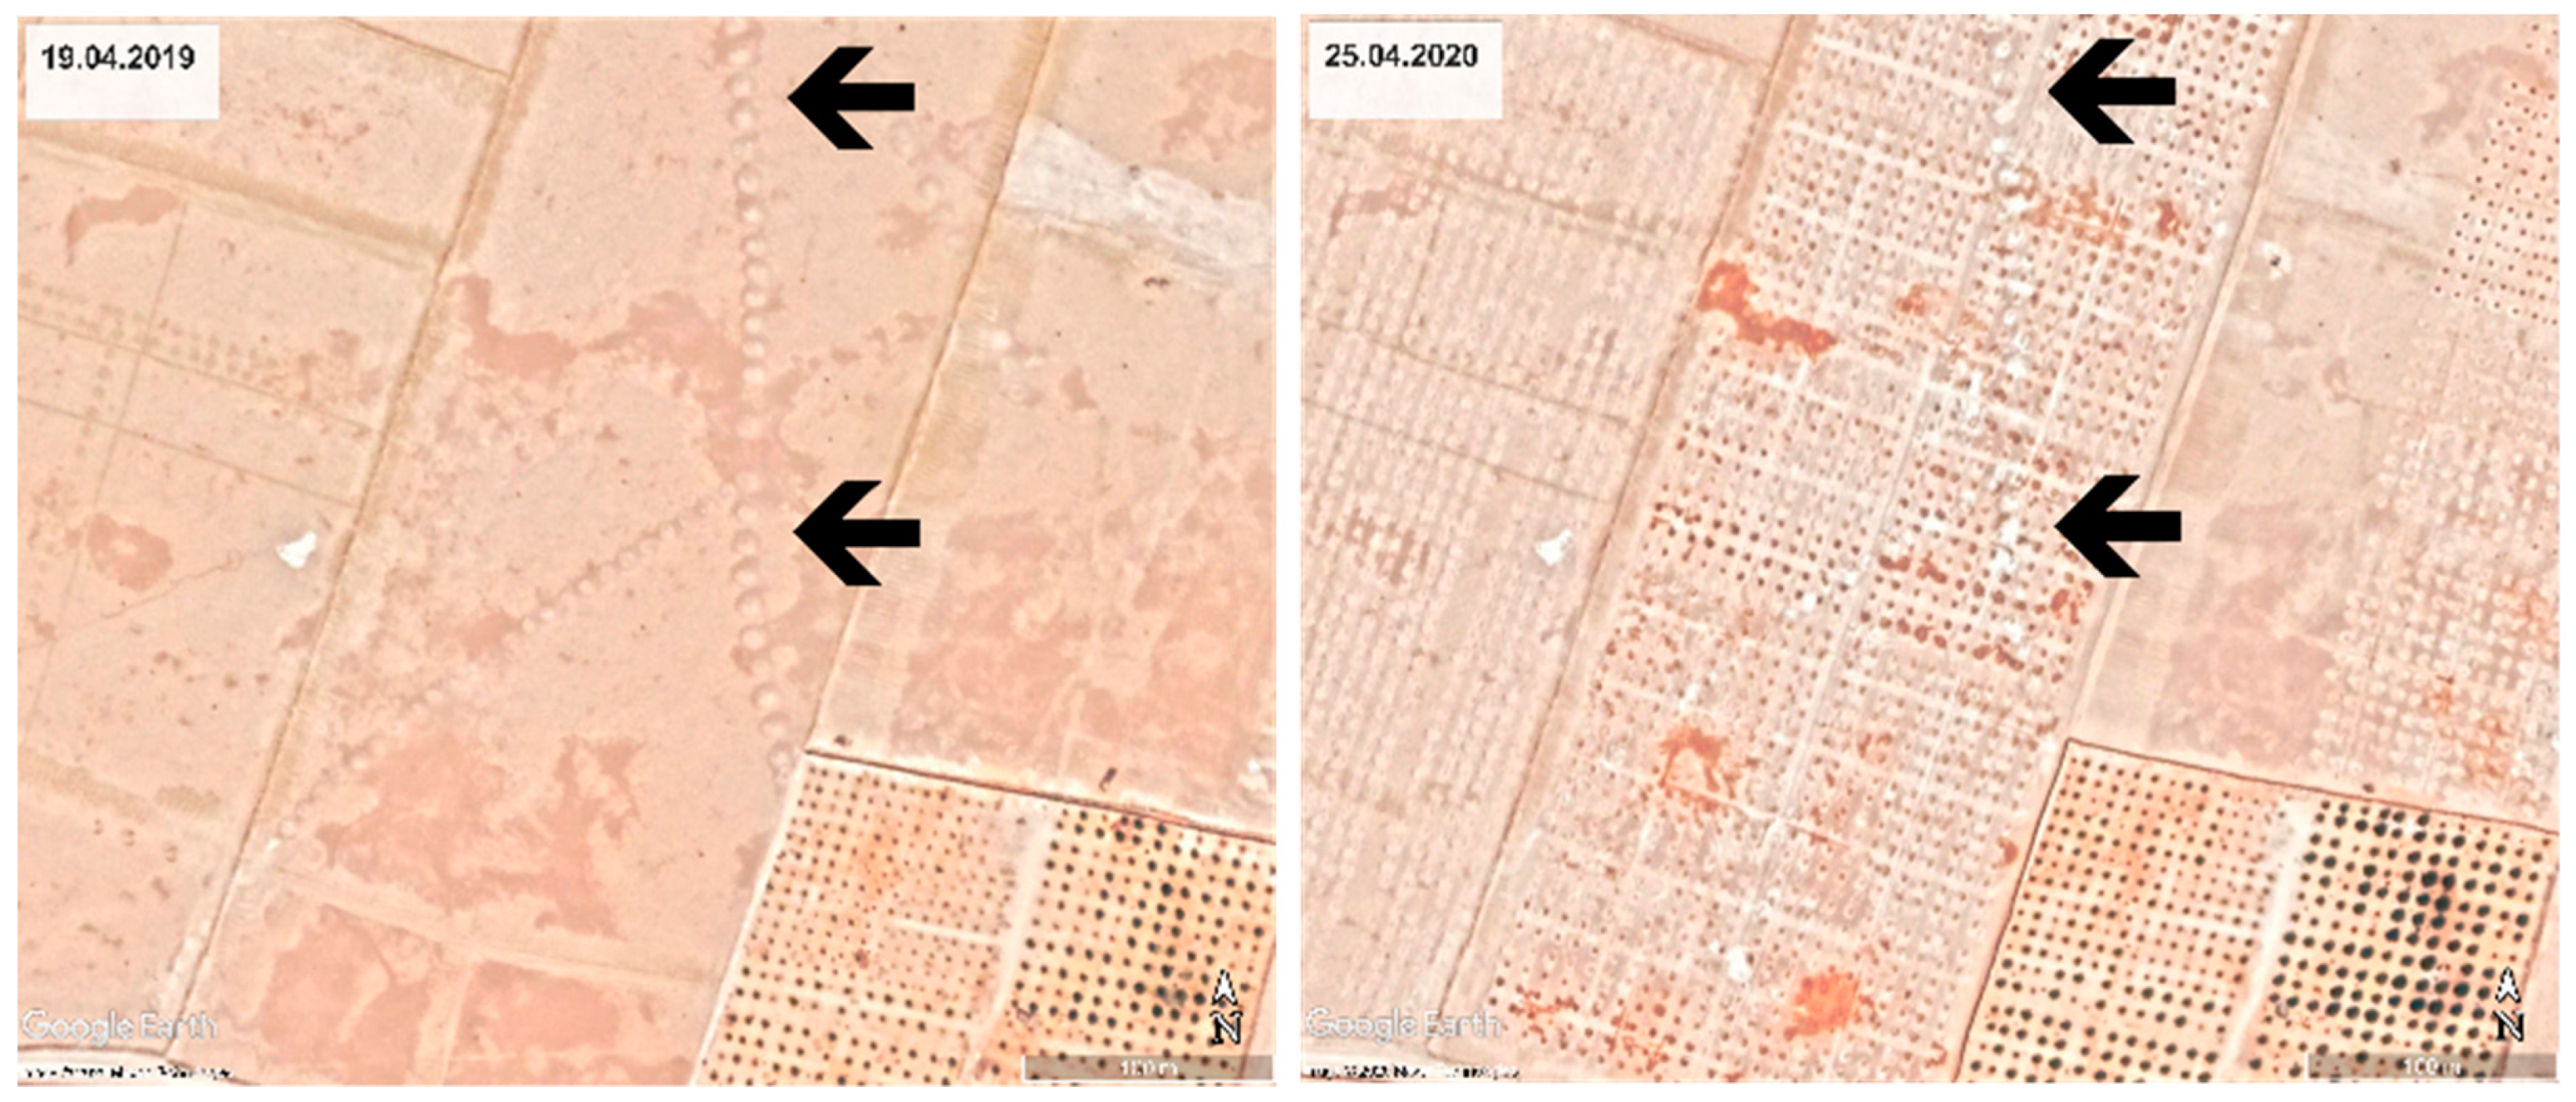
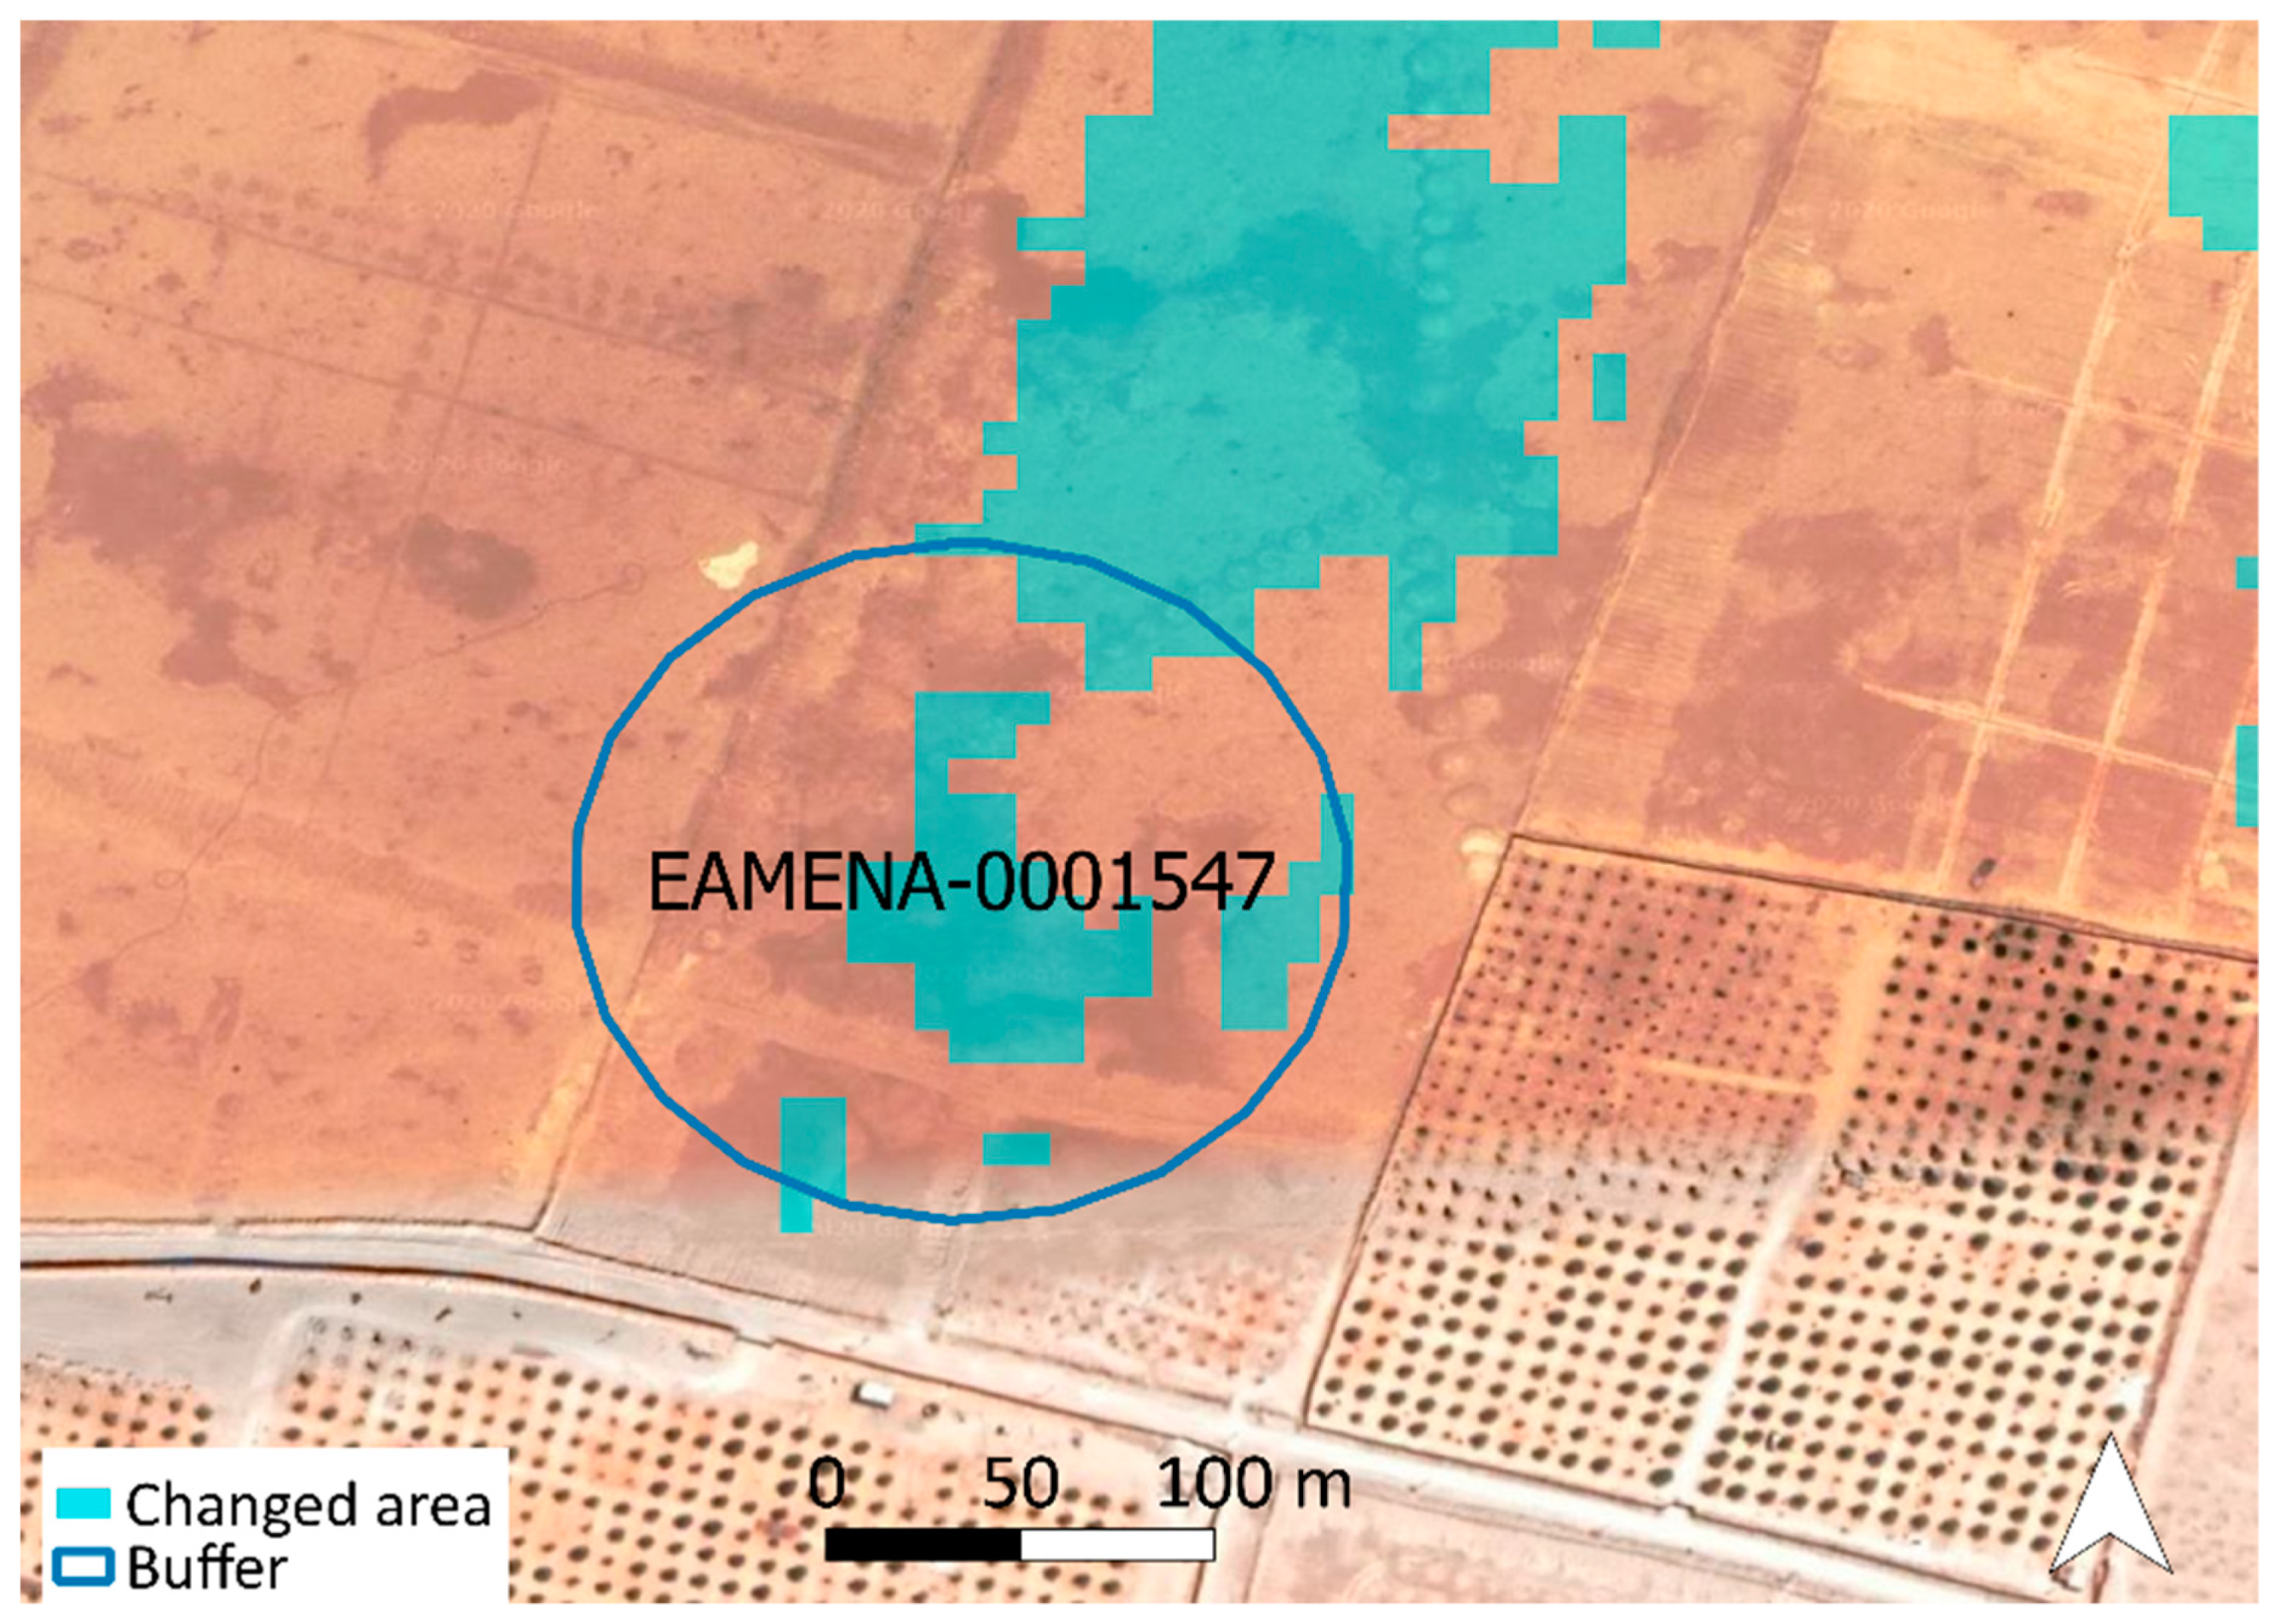
The producer’s accuracy of 78% reveals that changes at 12 sites were missed by the algorithm. Inevitably, instances of change which are too small to be visible in Sentinel-2 images were not detected, including graffiti and very small pits and spoil heaps.
Significantly, some changes near the standing remain of an important Coptic monastery were missed (SM12, Figure 14). The monastery, built on top of a Ptolemaic temple, is located on the riverside of the New Aswan city. It was excavated a hundred years ago, and since then, has been refilled by Aeolian sand. Since the 2011 revolution, and with the ongoing construction work for the new urban centre, the site has been repeatedly looted, and previously buried brick walls are now visible on the ground. These are also detectable from satellite imagery.
Between the two analysis periods, a tree adjacent to the structure was removed and an area of burning appeared. However, because there was another, surviving tree registered within the same Sentinel-2 pixels, the resolution of the imagery was too low for this change to be detected. This is an issue because even these relatively small changes could signify plans for extensive destruction. In this case, the site is in the path of planned construction along the New Aswan riverbank, and AKAP is working with the local authorities to deliver mitigating measures.
In one case (NT01-03, some tombs and a cluster of small stone structures) change was registered due to relatively minor changes, such as a new roof on an existing building and vehicle tracks, but within the buffered area a more significant change was missed (Figure 15). This was because the change occurred between the end of the period encompassed by the later composite (1 January 2020) and the day of the field visit (26 January 2020), showing how fast damage to sites can occur. The changes were visible as a few brighter pixels in the PlanetScope imagery and represented the ongoing construction of new buildings, confirmed during the field visit. AKAP has managed to produce basic documentation with photogrammetric reconstruction of the visible archaeological features.

3.2. Jufra

Eighty-two sites in the Jufra oases were analysed (Figure 16, Table 4). Our earlier research explored how many sites in Jufra had already been damaged over the course of the twentieth century [20]. At most sites, no change had occurred in the analysis period, and this was correctly identified by the change detection algorithm. A few sites where there had been changes were missed, but no false positives were detected (user’s accuracy of 100 %). The graph (Figure 17) shows the distribution of the mean pre-thresholded values for each buffer; some of the true positives are at the lower end because the ‘any non zero’ parameter allows even small instances of change represented by a single pixel to be picked up. The unaffected sites tend to have mean values below 0.1, and the false negatives were missed because their values were also low. A sample of sites was visited in the field by Lamin Abdulaati and the results checked.

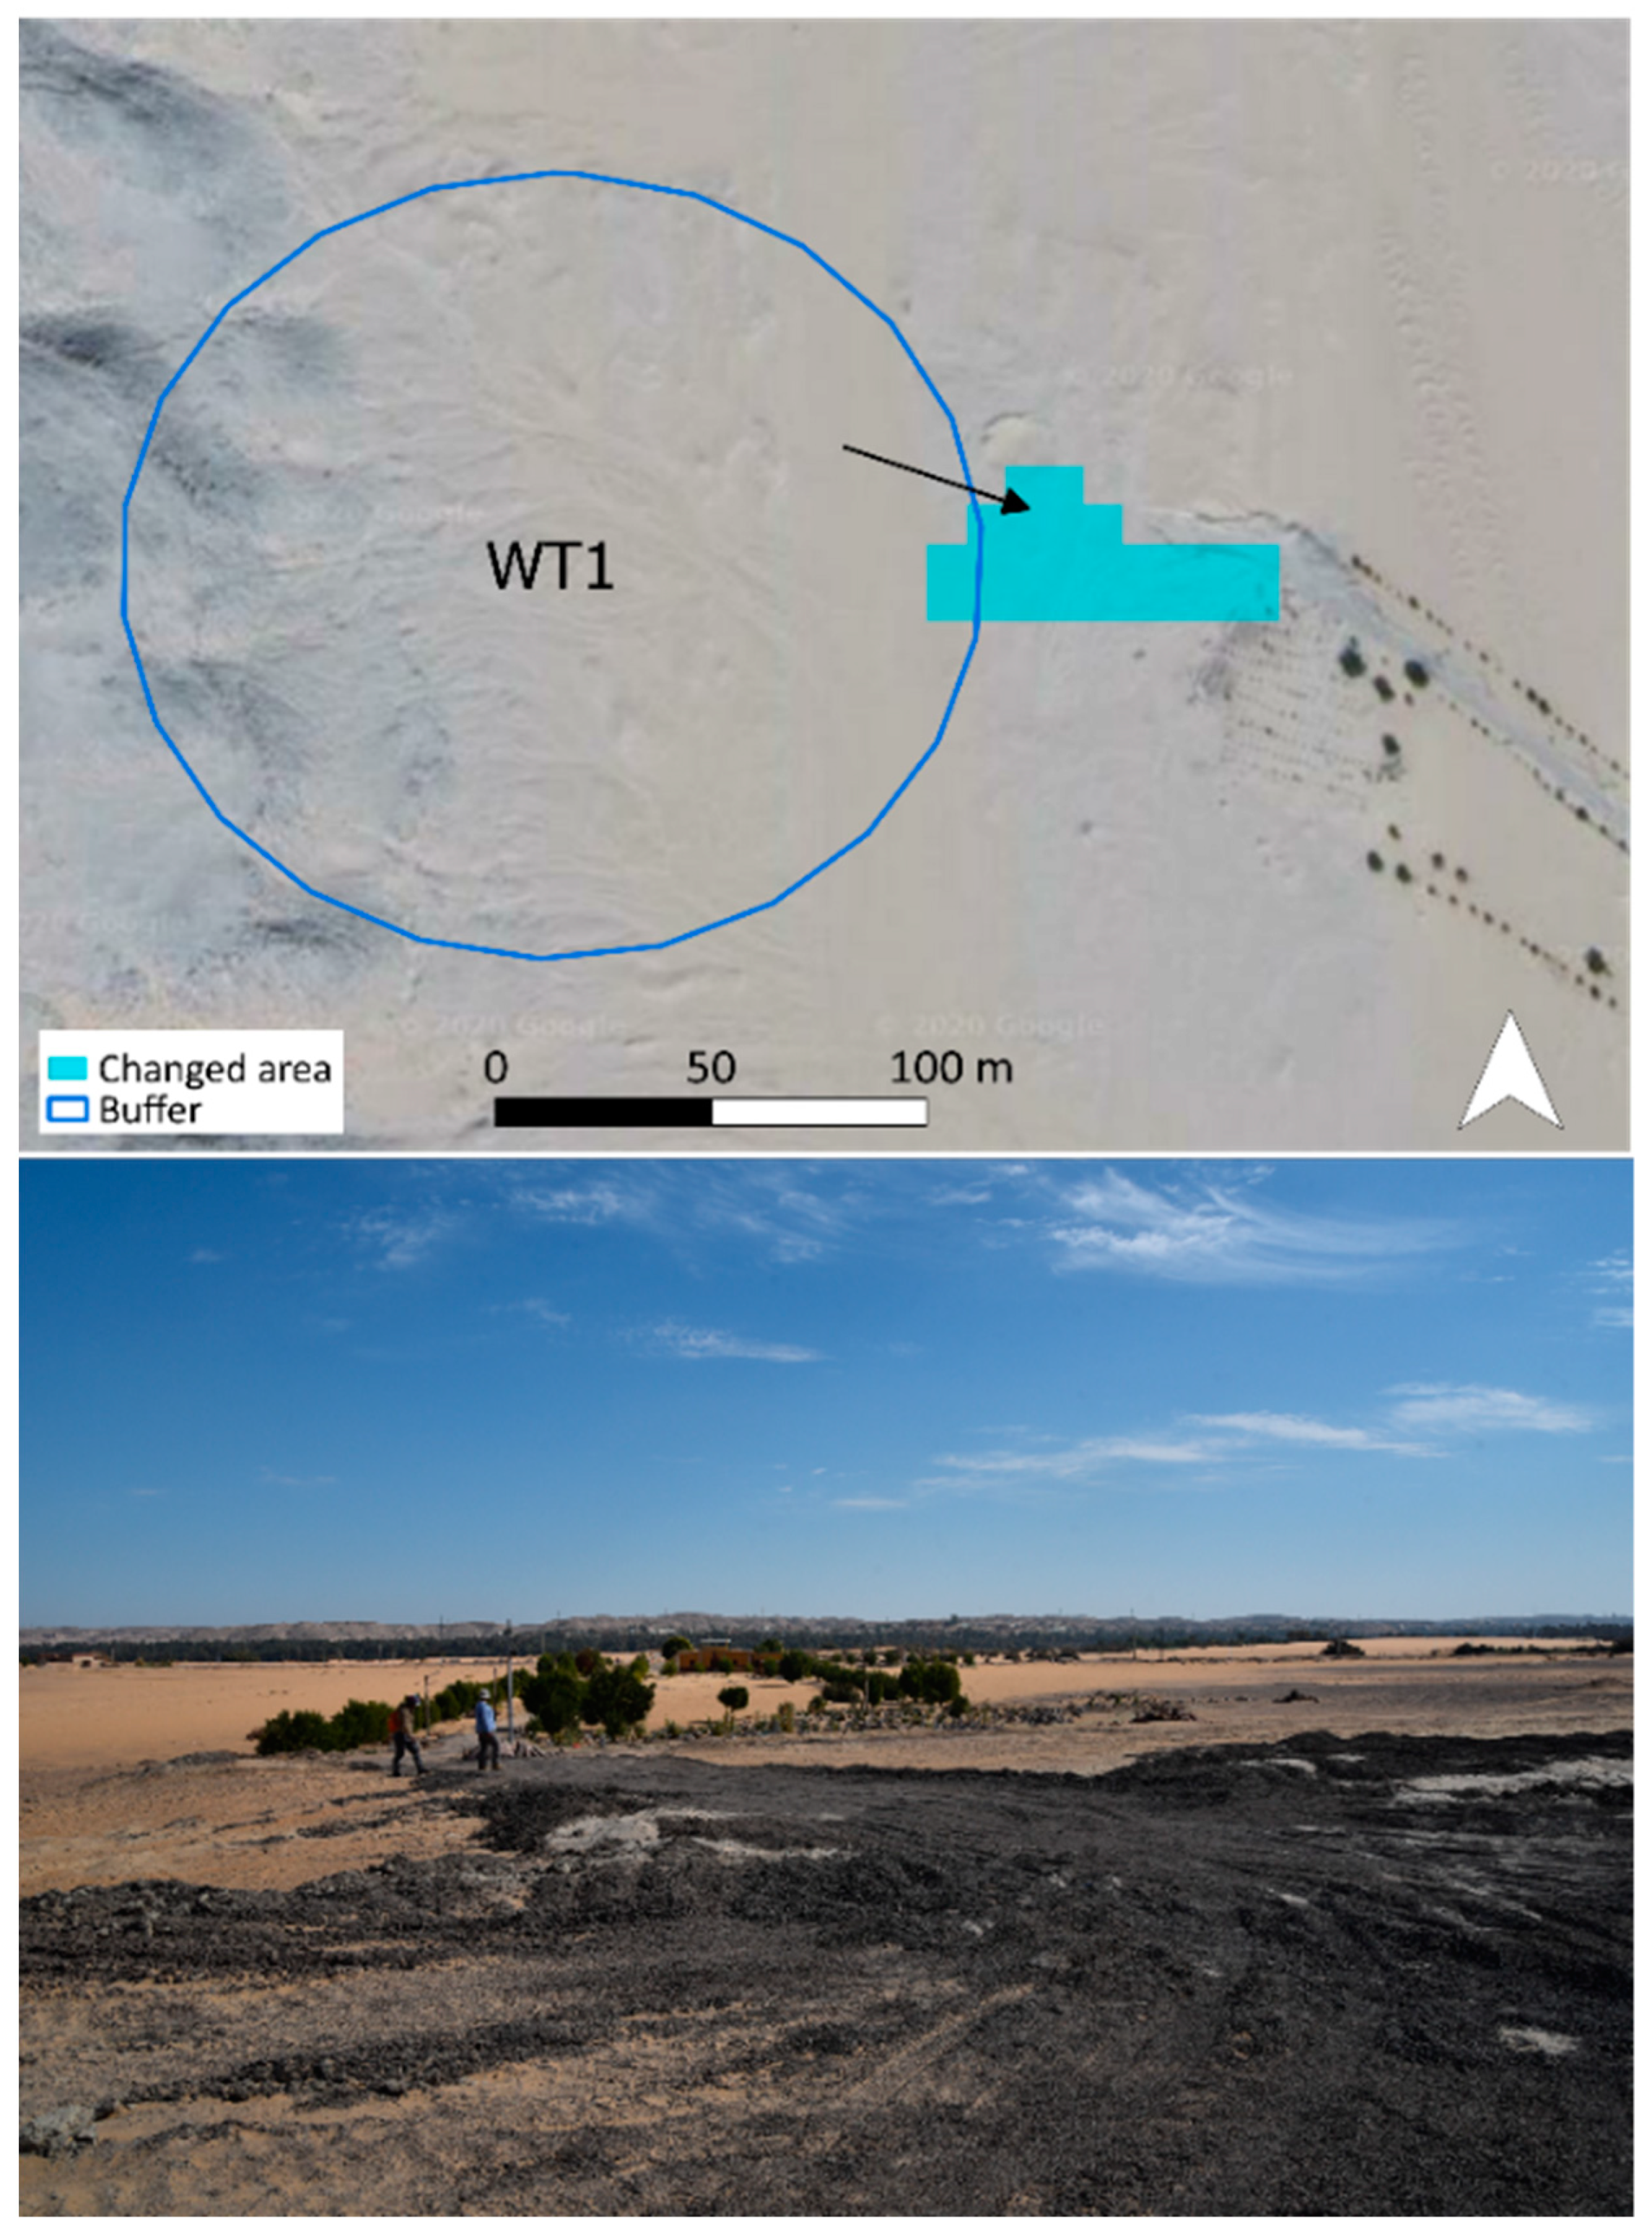
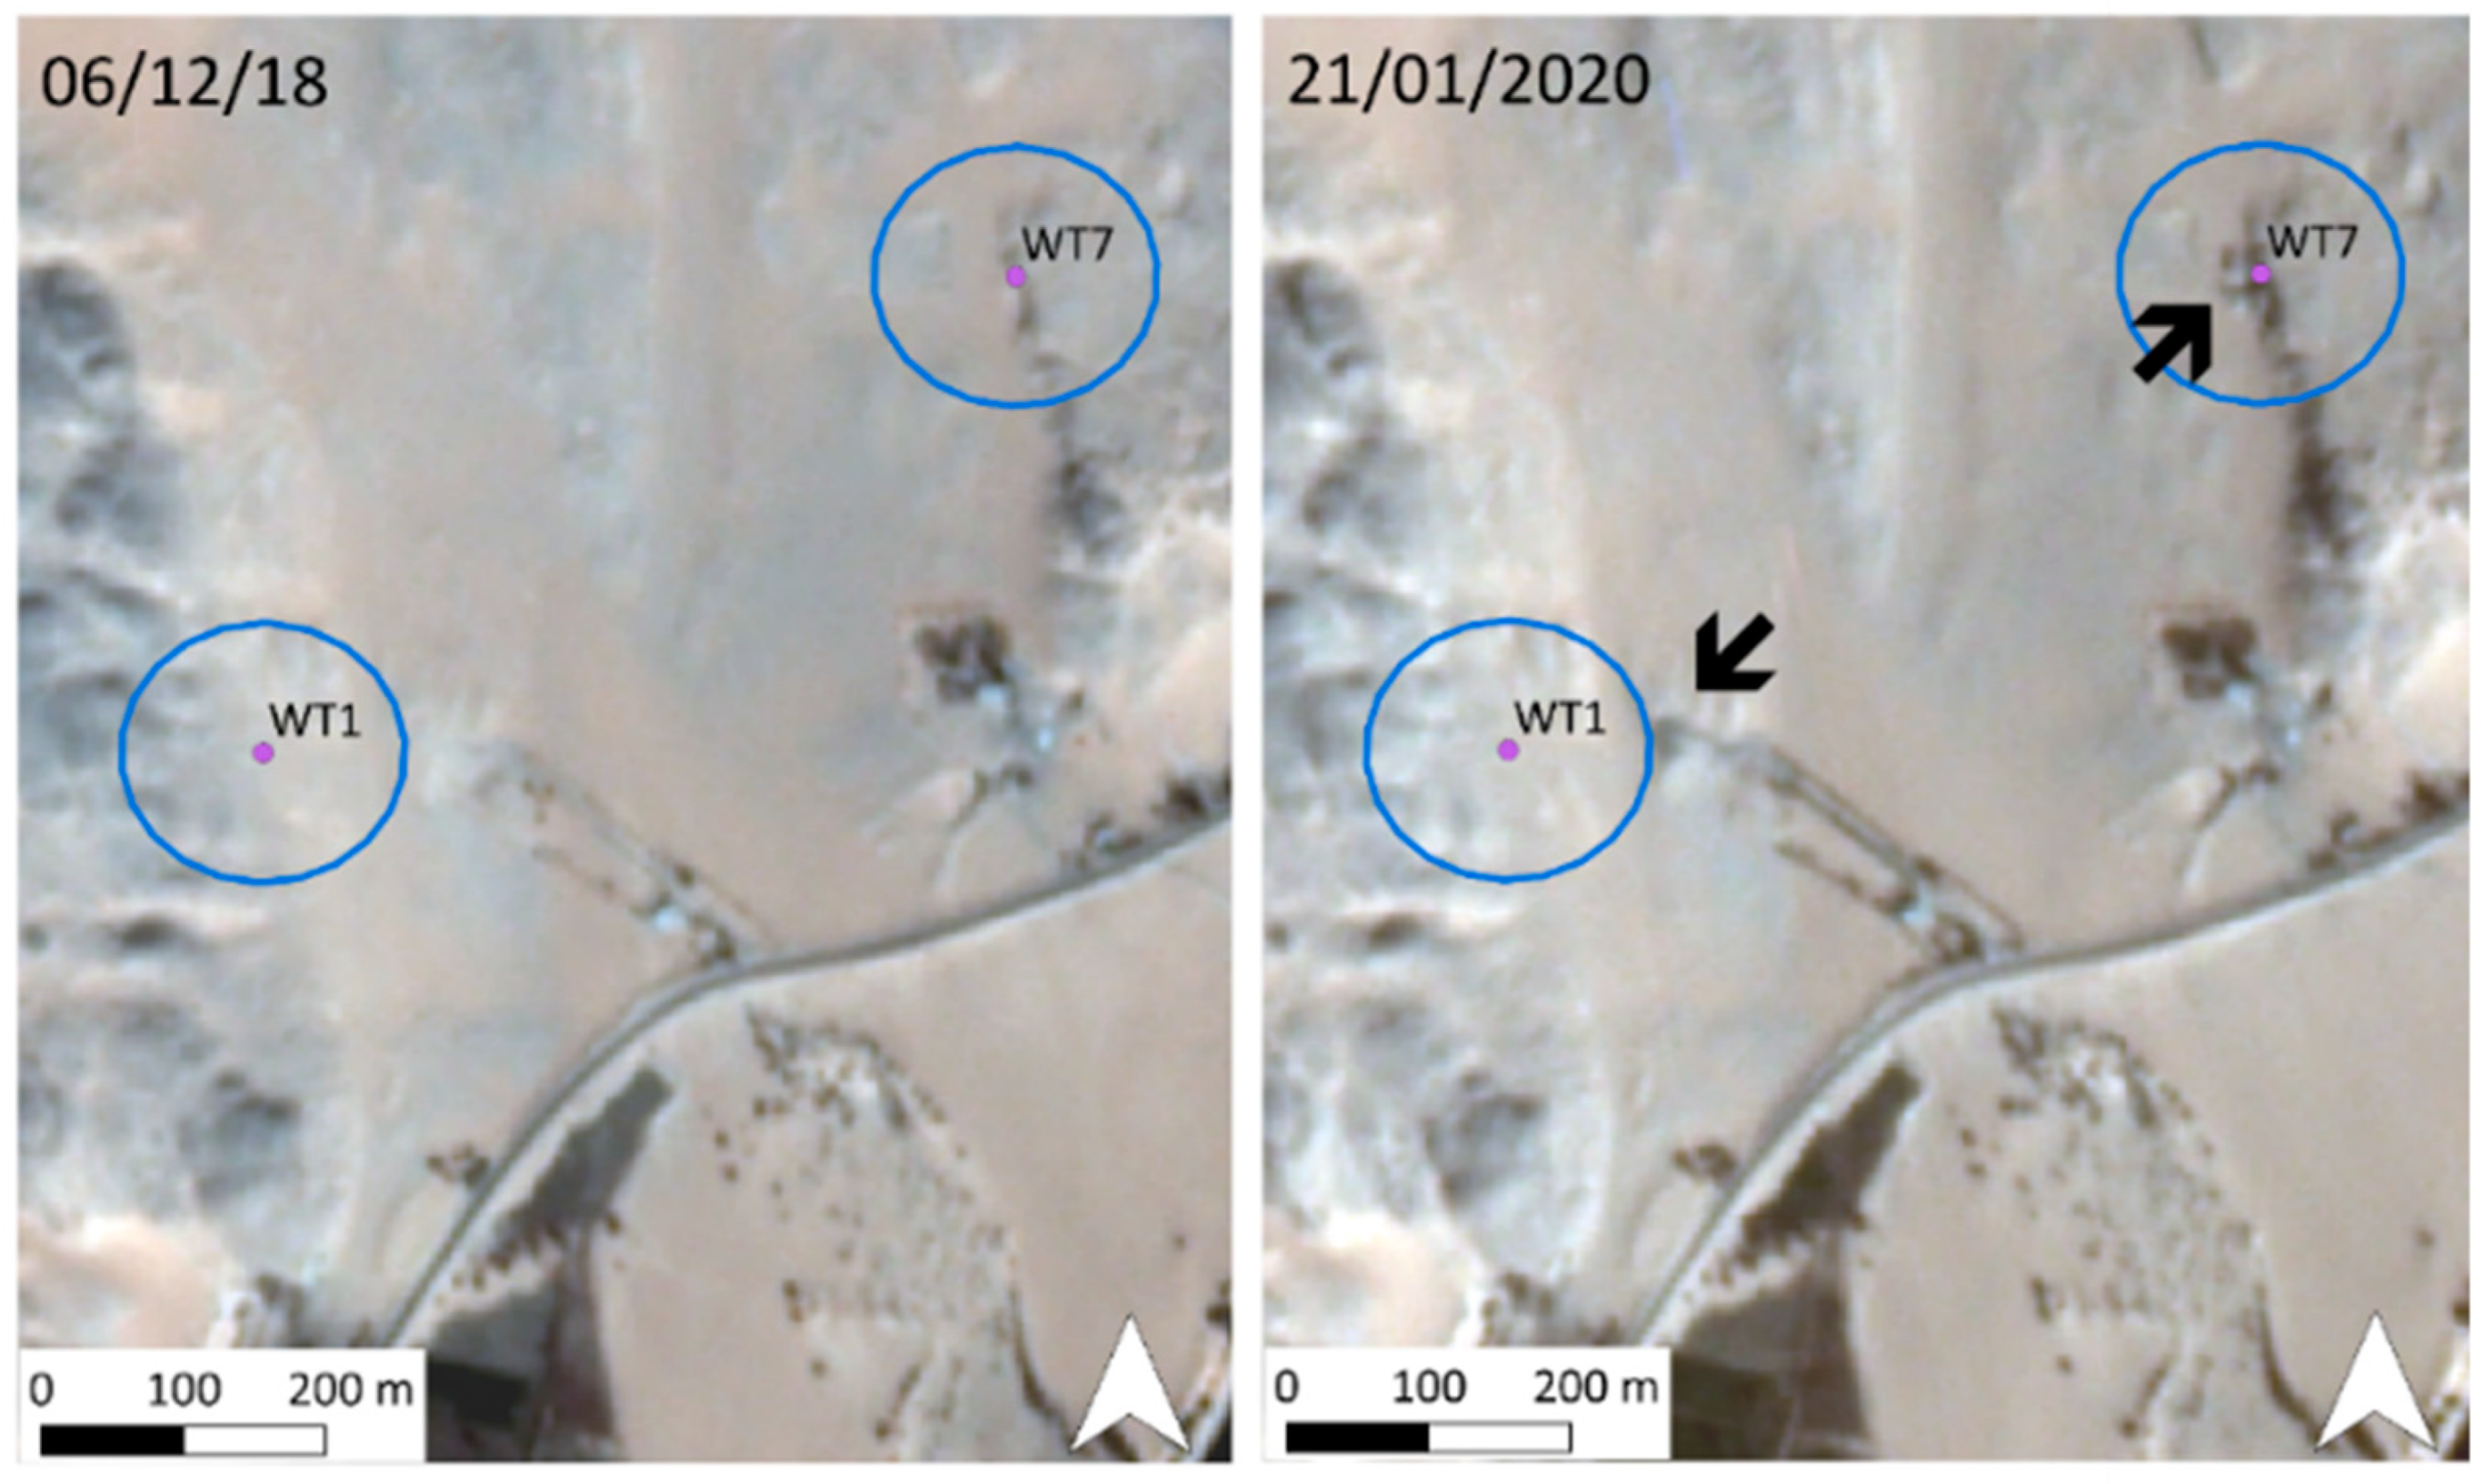
3.2.1. True Positives

The producer’s accuracy of 68% reflects 15 correct identifications of change which threaten the surviving sites in the Jufra oases, highlighting sites where urgent recording is a priority. Agricultural changes are the most pressing form of damage to archaeological sites in the region. The change detection found that a foggara to the south-east of Waddan, EAMENA-0001547, had been very badly damaged during the analysis period (Figure 18 and Figure 19), although the size of the changed area was underestimated (Figure 19). Many similar features have already been damaged in this way since 2011 [20].
In some cases, the damage had already been done, and relatively insignificant changes were detected. At EAMENA-0001544 (a structure), a field which had been fallow since 2016 was partially re-planted, and a tree cut down. An area of burning had eroded. A patch of recent discolouration at this site was missed, however. Non-seasonal changes in planting in existing fields and continued growth of existing palms was detected where traces of ancient agriculture and irrigation were recorded (EAMENA-0001500, EAMENA-0001563, EAMENA-0001550). Soil discolouration, which may represent moisture or dumping was detected, but underestimated at EAMENA-0001537 (foggara).
At several sites to the north of Hun, some or all of the positive change result related to minor surface moisture differences. These include settlement sites EAMENA-0095146 (Figure 20), EAMENA-0001488 and structure EAMENA-0001486. More concerning is a short-lived pool of water north of Waddan at EAMENA-0001513 and EAMENA-0001512 where there are a medieval town and an outlying rectangular structure. The water derives from a wadi draining the jebel to the north-east, and its flow is dammed by the modern road which truncates the edge of the site (Figure 21, Figure 22 and Figure 23). As well as moisture changes, bulldozing had also occurred within the changed area at EAMENA-0095146 (confirmed in the field in 2020).
Rubbish dumping affects several sites in Jufra, with a range of undesirable effects: Rubbish dumps are frequently the site of fires and are often bulldozed, are subject to pollution and the impact of multiple vehicle tracks. Although outside the buffered area of the site, an extensive dump was detected close to the medieval town of EAMENA-0001513. A change in the colour of an existing road which truncates an area of cairns (EAMENA-0095144) may also be due to dumping/burning of rubbish.

3.2.2. False Positives

No false positives were detected in the Jufra study area.

3.2.3. True Negatives

For most of the sites, there were no changes within the buffered areas during the analysis period, and this could be confirmed by visual examination of imagery and through field visits to a sample of these sites. For example, the algorithm found no change at EAMENA-0001515 (a well), which was confirmed in the field in June 2020 (Figure 24). Unfortunately, a subsequent visit in September 2020 after the analysis period found bulldozing.

3.2.4. False Negatives

The producer’s accuracy (68%) shows that the algorithm failed to detect change at seven sites. The most significant changes which the algorithm missed were caused by the construction of new fields at a foggara (EAMENA-0001554) and at an area of walls/field systems which were probably contemporaneous with the nearby foggaras (EAMENA-0001553, see Figure 25). At both sites, the change consisted of rows of planting holes for trees which gave low values in the change layer (between 0.04–0.05). Lowering the threshold value would still not have detected this without greatly increasing the rate of false positives. The planting holes were not detectable in the Sentinel-2 imagery, but visible in the PlanetScope images. The available PlanetScope imagery of sufficient quality suggests that the planting holes at the field walls were dug at some time between 16–26 March 2020 (Figure 26).
Some minor changes were too small to be identified by Sentinel-2 imagery, including single lines of vehicle tracks at EAMENA-0001494, a colour change on the surface sand at EAMENA-0001529, and a small extension to a building (c.6 × 6 m) at EAMENA-0001507, which was added in July 2019 and not identified by the algorithm. Part of a modern boundary wall at EAMENA-0001527 which was bulldozed during the analysis period was also missed. Discolouration, which may result from runoff, was missed at EAMENA-0001556.

4. Discussion

With the overall accuracy of the change detection in the case studies ranging between 85 to 91%, it is clear that medium-resolution data, such as Sentinel-2, can be used to identify the threats from modern land-use activities. When the proportions of false positives and false negatives are examined, however, the need for continued enhancements to the workflow are apparent. For the Aswan case study, false positives were a problem (user’s accuracy of 61%). Perhaps more significantly, false negatives were high for Jufra (producer’s accuracy of 68%). EAMENA will continue to develop this methodology in the next phase of its research, including introducing classification of the types of changes, as well as focusing on improved accuracy.
The causes of the error can be evaluated. The relatively low resolution of Sentinel-2 means some changes cannot be identified; high-resolution data, however, remains prohibitively expensive. The possibility of using PlanetScope imagery instead, applied just to the specific area each user is working in, should be explored. In addition, registration errors of about 10 m found between Sentinel-2 images can limit the accuracy of a per-pixel based approach. Limiting data to a single spacecraft and orbit does not significantly improve the co-registration error to offset the loss of data available for the compositing. If this issue is addressed by ESA, the accuracy of our workflow should be improved.
Experimenting with the selected threshold value for both case studies (0.2) did not lead to improvements. The user input, in this case, is necessary, but difficult and involves some degree of trial-and-error, especially if ground data is not available [24]. Automation of this value should be pursued, drawing on the considerable literature on this subject from the wider field of computer science (see [31]).
Different methods for change detection could be tested. There are some disadvantages to using a per-pixel spectral difference change detection approach, such as noise and co-registration problems [26] (p5). Use of a moving window could minimise these problems, including the registration error, although at the expense of significantly slowing down the script, a limitation when the script is run in countries with slow internet, such as Libya. The layer arithmetic approach which we are using could be further improved, for example by analysing texture as an additional unit of change [26] (p6) or the variance across a set of images representing a date range instead of comparing composites. Classification of the change-causing features should also be undertaken. Improved results for object-based over pixel-based methods for detecting archaeological features have been emphasised [7].
In addition, future analysis should be applied to polygons representing the extent of sites, rather than point data. More detailed data of this nature are increasingly being gathered by EAMENA and tested during our winter 2020 programme of training courses. The case studies described in this paper are arid areas where there is little seasonal variation in vegetation; most vegetation is present as a result of irrigation. To apply the workflow to moister parts of the EAMENA study area, it will need to be modified to account for seasonal/cyclical changes in vegetation, for example by integrating the trends in NDVI (Normalised Difference Vegetation Index) over as long a period as the imagery allows and using it to mask the change layer.

5. Conclusions

Damage to archaeology in North Africa from land-use activities, especially agricultural and urban expansion, is already demonstrated by our earlier research [1,20]. Countless instances of damage have been highlighted by recent publications [12,16,32], but no effective mitigation has yet resulted from this body of research. AKAP and EAMENA are amongst the only projects focused on detecting damage to sites of all types, not just the well-known monuments. Additionally, we combine remote sensing and ground validation to monitor sites that are not in themselves visible in imagery, such as the many lithic scatters in the Aswan area.
Our methodology described in the present paper combines a large dataset with an open-source, automated workflow that avoids restrictions caused by commercial imagery and software licenses. Most importantly, the expertise and dedication of our extensive network of partners in the MENA region are allowing monitoring work to be applied.
Although future enhancement is necessary to improve accuracy, this initial version of our change detection workflow highlights issues which are specific to each of the case study regions. In the Aswan area, the planned construction of the new town is increasingly responsible for the loss of many archaeological sites and will continue to threaten the remaining ones. In response to this, the AKAP project is currently working with local antiquities authorities and stakeholders to establish mitigation options, including preservation and display of the major sites located along the New Aswan riverbank, such as the Coptic monastery (SM12) previously discussed. Localised construction and extractive work, such as the modern cemetery at WT01, quarrying at WT07 and the buildings at NT01-03 is potentially even more damaging, because it is not part of a long-term plan, and therefore, is unpredictable. In this case, the antiquities’ inspector working with AKAP in 2020, Ms Nagat Amer, was able to speak to some of the perpetrators and we were able to carry out emergency recording at these sites. We were able to react quickly to this, due to the change detection workflow.
Although the agricultural expansion was not a significant cause of damage to sites in Aswan in recent years, it has been the principal cause of damage to archaeological sites in Jufra. A new field typically involves three steps that result in the systematic destruction of any archaeological remains: Construction of an enclosing embankment c.10 m across, levelling (destroying any remaining surface remains), and digging of holes for planting date palms (destroying any remaining subsurface archaeology). This modern agriculture is made possible by the digging of very deep wells so it can be used in previously barren areas and in areas that have long ago been abandoned due to changing hydrology. These are exactly the places where we find ancient water management systems that are of the earliest date, and it is these sites that have been disproportionally affected by modern agricultural intensification.
The change detection algorithm identified issues in Jufra such as levelling of fields and the laying out of pits for tree planting. Many fields had already been levelled, however, prior to the analysis period. Small changes, such as tree cutting were also picked up. Although minor now, this kind of change can be indicative of the early stages of more damaging land-use activities, such as bulldozing and pit-digging, so it is important to monitor it. The potential damage caused by runoff water was another issue identified by the change detection algorithm. This was exacerbated by modern structures blocking the flow. It had not occurred to us previously to focus on this as a cause of damage in the Jufra area.
Sites in both study areas had already been damaged prior to the analysis period. For example, in Jufra, most of post-medieval Waddan and an area of foggaras to the south of Hun had been destroyed by the 1970s. In Egypt, the construction of New Aswan has been ongoing since the start of the twenty-first century. The city is expected to offer social housing for potentially one million residents in the coming years, but it will also have a touristic and commercial ribbon along the Nile. The most important archaeological sites within the city limits are located along the river, and AKAP is actively working to have them included into the touristic circuit of the New Aswan corniche.
In much of North Africa heritage has already suffered widespread damage, but there are still many surviving sites which need urgent monitoring and protecting. EAMENA’s approach of combining the work of a team of full-time image interpreters with the expertise and efforts of many archaeologists based in the region has allowed an increasing number of sites to be located (over 170,000 and growing). Although this allows sites to be logged, many archaeological sites are rapidly disappearing more quickly than human archaeologists can work to regularly monitor them manually. The change detection workflow described in this paper, therefore, offers a way of addressing this. EAMENA’s change detection methodology allows the most at-risk sites to be identified rapidly and targeted for recording and preservation. Because the methodology uses open-source data and tools, it can easily be used by our network of heritage professionals who have been trained in its use and in remote sensing and GIS more generally. We urge other heritage management projects working in the region to also adopt open-source philosophies in the interests of democratising access to these technologies and preserving archaeological sites.

Supplementary Materials

The following are available online at https://0-www-mdpi-com.brum.beds.ac.uk/2072-4292/12/22/3694/s1, change detection script.

Author Contributions

Conceptualization, L.R.; methodology, L.R.; validation, L.R., M.C.G. and L.A.; formal analysis, L.R.; investigation, L.R., M.C.G., N.S., L.A., M.A.-H., M.S.; writing—original draft preparation, all.; writing—review and editing, all.; visualization, L.R. All authors have read and agreed to the published version of the manuscript.

Funding

The EAMENA research was funded by the Arcadia Fund, building on initial work in al-Jufra by the Trans-SAHARA project, with funding from the European Research Council (grant number 269418). AKAP was funded by the University of Bologna, the Italian Ministry of Foreign Affairs, EAMENA/Arcadia Fund.

Acknowledgments

The EAMENA Project is a partnership between the Universities of Oxford, Leicester and Durham under the leadership of Robert Bewley (Project Director, Oxford), Andrew Wilson (Principal Investigator, Oxford), David Mattingly (Co-Investigator, Leicester) and Graham Philip (Co-Investigator, Durham). We are funded by the Arcadia Fund for documentation, database development and fieldwork, as well as the British Council’s Cultural Protection Fund to train heritage professionals from eight countries in the EAMENA methodology. EAMENA’s research in North Africa is directed by David Mattingly and primarily based at the University of Leicester; we have thus been able to share data and expertise with the Leicester-based ERC-funded Trans-SAHARA and Leverhulme Trust-funded Peopling the Desert Projects, also directed by Professor Mattingly. We acknowledge the work of the wider EAMENA and AKAP teams and partners in recording archaeological sites within the two case studies. The AKAP project is directed by Maria Carmela Gatto (University of Leicester) and Antonio Curci (University of Bologna). We would also like to thank Nagat Amer, inspector of the Egyptian Ministry of Tourism and Antiquities, Aswan inspectorate, for her help with ground validation and with her skillful interaction with the local communities.

Conflicts of Interest

The authors declare no conflict of interest. The funders had no role in the design of the study; in the collection, analyses, or interpretation of data; in the writing of the manuscript, or in the decision to publish the results.

References

  1. Rayne, L.; Bradbury, J.; Mattingly, D.; Philip, G.; Bewley, R.; Wilson, A. From above and on the ground: Geospatial methods for recording endangered archaeology in the Middle East and North Africa. Geosciences 2017, 7. [Google Scholar] [CrossRef] [Green Version]
  2. Bewley, R.; Wilson, A.; Kennedy, D.; Mattingly, D.; Banks, R.; Bishop, M.; Bradbury, J.; Cunliffe, E.; Fradley, M.; Jennings, R. Endangered archaeology in the Middle East and North Africa: Introducing the EAMENA project. In CAA2015 Keep the Revolution Going: Proceedings of the 43rd Annual Conference on Computer Applications and Quantitative Methods in Archaeology, Siena, Italy, 31 March–2 April 2015; Archaeopress: Oxford, UK, 2016; p. 919. [Google Scholar]
  3. Zerbini, A. Developing a heritage database for the Middle East and North Africa. J. Field Archaeol. 2018, 43, S9–S18. [Google Scholar] [CrossRef] [Green Version]
  4. EAMENA. Available online: https://database.eamena.org/ (accessed on 27 September 2020).
  5. Arches. Available online: https://www.archesproject.org/ (accessed on 27 September 2020).
  6. Khalaf, N.; Insoll, T. Monitoring Islamic archaeological landscapes in Ethiopia using open source satellite imagery. J. Field Archaeol. 2019, 44, 401–419. [Google Scholar] [CrossRef]
  7. Davis, D.S.; Douglass, K. Aerial and spaceborne remote sensing in African archaeology: A review of current research and potential future avenues. Afr. Archaeol. Rev. 2020, 37, 1–16. [Google Scholar] [CrossRef]
  8. Tapete, D.; Cigna, F. Detection of archaeological looting from space: Methods, achievements and challenges. Remote Sens. 2019, 11, 2389. [Google Scholar] [CrossRef] [Green Version]
  9. Crawford, O.G.S. Castles and Churches in the Middle Nile Region; Sudan Antiquities Service Occasional Papers No. 2; Sudan Antiquities Service: Khartoum, Sudan, 1953. [Google Scholar]
  10. Mattingly, D.J.; Daniels, C.; Dore, J.N.; Edwards, D.N.; Hawthorne, J. The Archaeology of Fazzan Vol 2: Site Gazetteer, Pottery and Other Survey Finds; Society for Libyan Studies: London, UK, 2007. [Google Scholar]
  11. Edwards, D.N. The archaeology of the southern Fazzan and prospects for future research. Libyan Stud. 2001, 32, 49–66. [Google Scholar] [CrossRef]
  12. Al Raeid, F.; Di Valerio, E.; Di Antonio, M.G.; Menozzi, O.; El Mziene, M.A.A.; Tamburrino, C. The main issues of the Cyrene necropolis and the use of remote sensing for monitoring in the case of the eastern necropolis. Libyan Stud. 2016, 47, 7–30. [Google Scholar] [CrossRef]
  13. Bowen, E.F.; Tofel, B.B.; Parcak, S.; Granger, R. Algorithmic identification of looted archaeological sites from space. Front. ICT 2017, 4, 4. [Google Scholar] [CrossRef] [Green Version]
  14. Zerbini, A.; Fradley, M. Higher Resolution Satellite Imagery of Israel and Palestine: Reassessing the Kyl-Bingaman Amendment. Space Policy 2018, 44, 14–28. [Google Scholar] [CrossRef]
  15. Mattingly, D.J.; Sterry, M.; Rayne, L.; Al-Haddad, M. Pre-Islamic oasis settlements in the Eastern Sahara. In Urbanisation and State Formation in the Ancient Sahara and Beyond; Sterry, M.M., Mattingly, D.J., Eds.; Cambridge University Press: Cambridge, UK, 2020; pp. 112–146. [Google Scholar]
  16. Parcak, S.; Gathings, D.; Childs, C.; Mumford, G.; Cline, E. Satellite evidence of archaeological site looting in Egypt: 2002–2013. Antiquity 2016, 90, 188–205. [Google Scholar] [CrossRef] [Green Version]
  17. Allan, J.; Richards, T. Use of satellite imagery in archaeological surveys. Libyan Stud. 1983, 14, 8. [Google Scholar] [CrossRef]
  18. Agapiou, A. Remote sensing heritage in a petabyte-scale: Satellite data and heritage Earth Engine© applications. Int. J. Digit. Earth 2017, 10, 85–102. [Google Scholar] [CrossRef] [Green Version]
  19. Tapete, D.; Cigna, F. Appraisal of opportunities and perspectives for the systematic condition assessment of heritage sites with Copernicus Sentinel-2 high-resolution multispectral imagery. Remote Sens. 2018, 10, 561. [Google Scholar] [CrossRef] [Green Version]
  20. Rayne, L.; Sheldrick, N.; Nikolaus, J. Endangered archaeology in Libya: Recording damage and destruction. Libyan Stud. 2017, 48, 23–49. [Google Scholar] [CrossRef] [Green Version]
  21. Sterry, M.; Mattingly, D.J. (Eds.) Urbanisation and State Formation in the Ancient Sahara and Beyond; Cambridge University Press: Cambridge, UK, 2020. [Google Scholar]
  22. ESA. Sentinel-2 User Handbook. Available online: https://sentinel.esa.int/documents/247904/685211/Sentinel-2_User_Handbook (accessed on 27 September 2020).
  23. Gorelick, N.; Hancher, M.; Dixon, M.; Ilyushchenko, S.; Thau, D.; Moore, R. Google Earth Engine: Planetary-scale geospatial analysis for everyone. Remote Sens. Environ. 2017, 202, 18–27. [Google Scholar] [CrossRef]
  24. Hussain, M.; Chen, D.; Cheng, A.; Wei, H.; Stanley, D. Change detection from remotely sensed images: From pixel-based to object-based approaches. ISPRS J. Photogr. Remote Sens. 2013, 80, 91–106. [Google Scholar] [CrossRef]
  25. ESA. Cloud Masks. Available online: https://sentinel.esa.int/web/sentinel/technical-guides/sentinel-2-msi/level-1c/cloud-masks (accessed on 27 September 2020).
  26. Tewkesbury, A.P.; Comber, A.J.; Tate, N.J.; Lamb, A.; Fisher, P.F. A critical synthesis of remotely sensed optical image change detection techniques. Remote Sens. Environ. 2015, 160, 1–14. [Google Scholar] [CrossRef] [Green Version]
  27. Orengo, H.A.; Conesa, F.C.; Garcia-Molsosa, A.; Lobo, A.; Green, A.S.; Madella, M.; Petrie, C.A. Automated detection of archaeological mounds using machine-learning classification of multisensor and multitemporal satellite data. Proc. Natl. Acad. Sci. USA 2020, 117, 18240–18250. [Google Scholar] [CrossRef]
  28. Orengo, H.A.; Petrie, C.A. Large-scale, multi-temporal remote sensing of palaeo-river networks: A case study from northwest India and its implications for the Indus Civilisation. Remote Sens. 2017, 9, 735. [Google Scholar] [CrossRef] [Green Version]
  29. Hobson, M.S. EAMENA training in the use of satellite remote sensing and digital technologies in heritage management: Libya and Tunisia workshops 2017–2019. Libyan Stud. 2019, 50, 63–71. [Google Scholar] [CrossRef]
  30. Congalton, R.G. A review of assessing the accuracy of classifications of remotely sensed data. Remote Sens. Environ. 1991, 37, 35–46. [Google Scholar] [CrossRef]
  31. Rosin, P.L.; Ioannidis, E. Evaluation of global image thresholding for change detection. Pattern Recognit. Lett. 2003, 24, 2345–2356. [Google Scholar] [CrossRef] [Green Version]
  32. Fradley, M.; Sheldrick, N. Satellite imagery and heritage damage in Egypt: A response to Parcak et al.(2016). Antiquity 2017, 91, 784–792. [Google Scholar] [CrossRef]
Figure 1. Location of study areas in Libya and Egypt.
Remotesensing 12 03694 g001
Figure 2. Change detection workflow using Google Earth Engine.
Remotesensing 12 03694 g002
Figure 3. Sites analysed in the Aswan and Kom Ombo area. Sentinel-2 composite 2018–2019.
Remotesensing 12 03694 g003
Figure 4. Mean change values (prior to thresholding) for each buffer for the Aswan and Kom Ombo results.
Remotesensing 12 03694 g004
Figure 5. Changes at WK40 and WK41 visible in the Sentinel-2 composites. By 2019, the trackway had been extended and additional spoil had been dumped.
Remotesensing 12 03694 g005
Figure 6. WK40.The blue region represents the detected changed area within the buffered zone. The direction of the photograph is arrowed. The photograph (January 2020) shows the track and piles of spoil at WK40. The construction of the track destroyed the site. ‘New Aswan’ is in the background. Google image 2020 imported as an xyz tile to QGIS.
Remotesensing 12 03694 g006
Figure 7. A new track and piles of spoil close to a rocky outcrop where WK41 is located. The direction of the photograph arrowed. Google image 2020 imported as an xyz tile to QGIS. Photograph January 2020.
Remotesensing 12 03694 g007
Figure 8. Modern activities underway between 2018–2020, and ongoing, has destroyed site WK40 and are threatening the survival of site WK41. Images from Google Earth.
Remotesensing 12 03694 g008
Figure 9. Bulldozing to create a pit and surrounding spoil. The changed area within buffered zone of WK32 and direction of the photograph arrowed. Google image 2020 imported as an xyz tile to QGIS. Photograph January 2020.
Remotesensing 12 03694 g009
Figure 10. Trackway/material spread in front of modern cemetery, encroaching on the buffered area of WT1. The changed area within buffered zone of WT1 and direction of the photograph. Google image 2020 imported as an xyz tile to QGIS. Photograph January 2020.
Remotesensing 12 03694 g010
Figure 11. Changes including expansion of a modern cemetery and excavation of a pit (marked with arrows) around WT1 and WT7 are verifiable remotely using PlanetScope imagery.
Remotesensing 12 03694 g011
Figure 12. Lithic scatters in this area WK31, 35, 36, 37, 38 were recorded by AKAP in 2012. Although bulldozing and some ploughing to lay out the fields and their boundaries was done between 2009–2017, crops were not planted until 2018–2020. The planting fell into the analysis period and was detected. Google Earth images.
Remotesensing 12 03694 g012
Figure 13. Sand dune and cliffs that cause false positives (by shadows/moving sand) at WT12, 18 and 25, where remains of desert walls, stone structures and rock art were recorded by AKAP. Photograph November 2018.
Remotesensing 12 03694 g013
Figure 14. Cut-down tree and area of burning in the buffered zone at SM12 and direction of the photograph. Google image 2020 imported as an xyz tile to QGIS. Photograph January 2020.
Remotesensing 12 03694 g014
Figure 15. New building under construction in Nag Al-Tawil after the period of change detection analysis. An area of vehicle tracks and a new roof on a building were detected. Google image 2020 imported as an xyz tile to QGIS. Photograph 26 January 2020.
Remotesensing 12 03694 g015
Figure 16. Sites analysed in the Jufra area. Sentinel-2 composite 2019–2020.
Remotesensing 12 03694 g016
Figure 17. Mean change values (prior to thresholding) for each buffer for the Jufra results.
Remotesensing 12 03694 g017
Figure 18. Field levelling and planting at a foggara (the Endangered Archaeology of the Middle East and North Africa (EAMENA-0001547). Google image 2020 imported as an xyz tile to QGIS.
Remotesensing 12 03694 g018
Figure 19. Change area at EAMENA-0001547. Google image 2020 imported as an xyz tile to QGIS.
Remotesensing 12 03694 g019
Figure 20. Moisture changes at EAMENA-0095146 have long been an issue. Photograph by Muftah Al-Haddad in 2013.
Remotesensing 12 03694 g020
Figure 21. The pool of water and rubbish dumping at EAMENA-0001513. Google Earth images.
Remotesensing 12 03694 g021
Figure 22. Map of detected changed area at EAMENA-0001513. Google Earth images (top) and Google image 2020 imported as an xyz tile to QGIS (bottom).
Remotesensing 12 03694 g022
Figure 23. EAMENA-0001513 is between a hillslope and a road. Photograph looking from the west, towards the site, by Muftah Al-Haddad in 2013.
Remotesensing 12 03694 g023
Figure 24. EAMENA-0001515, a well. Photograph by Lamin Abdulaati in June 2020.
Remotesensing 12 03694 g024
Figure 25. New field with planting holes damaging the ancient field system of EAMENA-0001553. Google Earth images.
Remotesensing 12 03694 g025
Figure 26. PlanetScope images. The remains of past fields and structures are delineated. The second image shows tree planting holes appearing at the south edge of EAMENA-0001553 between 16–26 March 2020 (changed area marked by arrows).
Remotesensing 12 03694 g026
Table 1. Satellite imagery used in this study.
SensorDate RangeCostTemporal ResolutionSpatial Resolution (m)Radiometric Resolution (µm)
Sentinel-2 (L2A)Since 2017Free5 days10, 20, 600.493–1.374
PlanetScope Since 2016Limited free use Daily3.70.455–0.860
VHR via Google Earth and QGISSince c.2003FreeVaries, can be very limitedVarious between c. 0.30–1 mUnavailable
Table 2. Parameters of change detection.
Case StudyDate EarlierDate LaterThreshold ValueReducerReducer ScaleBuffer RadiusInput PointsChanged Points
AswanOctober–December 2018October–December 20190.2Any non-zero1010027973
JufraMarch–May 2019March–May 20200.2Any non-zero101008215
Table 3. Error matrix of the Aswan-Kom Ombo results, with an overall accuracy of 85% (user’s accuracy 61%, producer’s accuracy 78%).
AlgorithmChangeImagery Checked
ChangeNo ChangeTotal
452873
No change12194206
Total57219279
Table 4. Error matrix of the Jufra results, with an overall accuracy of 91% (user’s accuracy 100%, producer’s accuracy 68%).
AlgorithmChangeImagery Checked
ChangeNo ChangeTotal
15015
No change76067
Total226082
Publisher’s Note: MDPI stays neutral with regard to jurisdictional claims in published maps and institutional affiliations.

