1. Introduction
The representation of geographic elements in vector models is generally produced using various capturing and digitization technologies in which the human factor intervenes, that is, they are not free from errors. The human factor also means that it is not possible to faithfully represent a geographical reality because it is in constant change due to extreme natural actions (earthquakes, tsunamis, fires) or continuous (tectonic movements, climate change, etc.), or due to anthropic activities. This lack of accuracy in cartography and geographic information sources is manifested by omission and commission errors, and by geometric location errors.
Thanks to the advances in parallel processing technologies (Graphics Processing Units or GPUs) and artificial intelligence (AI), methodologies are able to be developed for the efficient large-scale processing of data with artificial neural networks (ANN), and obtain high success rates in predictions in different areas. One such example is Deep Learning (DL) applications in remote sensing, where it is possible to process aerial images through semantic segmentation techniques and assign land cover labels to every pixel in an image [
1].
There are several works in the literature related to the use of DL techniques for monitoring the condition of wind turbines [
2], or for their identification in images captured from autonomous vehicles (drones) for supporting maintenance tasks [
3]. However, we did not find papers describing experiences related to the use of semantic segmentation for the extraction of wind turbines. These types of features can have different dimensions (blade diameters from 30 m to 140 m, hub heights from 40 m to 100 m), depending on their capacity to produce energy. The complexity of these structures derives from difficulties in identifying them in high-resolution aerial images due to the large areas of shadow generated, the orientations of the shadows (depending on the time the aerial image was captured), and the errors generated in the orthorectification process.
Interest in applying computer vision techniques to remotely sensed imagery has increased following the introduction of convolutional neural networks like AlexNet [
4], VGGNet [
5], or Inception [
6]. Supported by these advancements, modern segmentation techniques emerged. Current semantic segmentation implementations use convolutional layers to downsample (encode) the images and transposed convolutions in the upsampling part (decoder) to resize the image to the original dimensions.
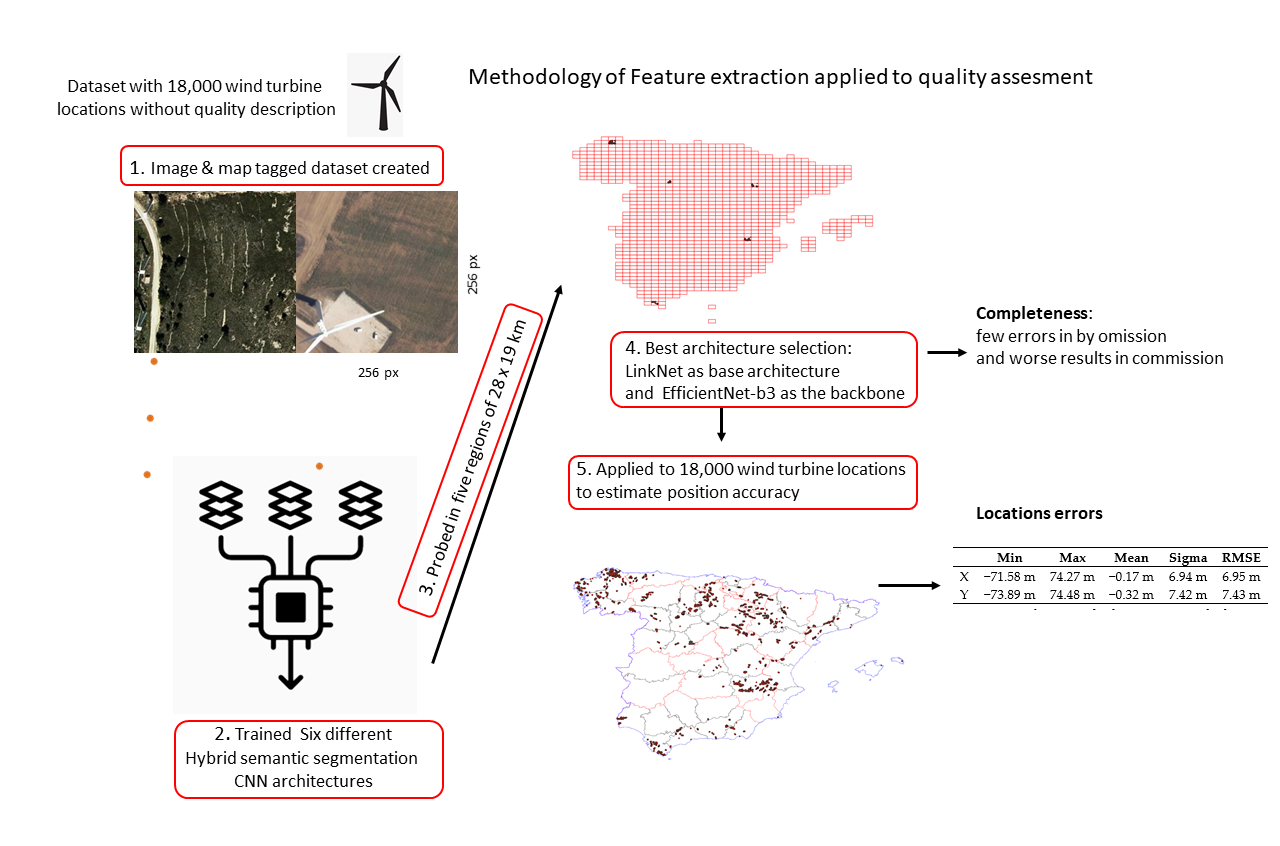
The two most popular semantic segmentation architectures are U-Net [
7] and LinkNet [
8]. They both follow the encoder–decoder structure (presented in
Figure 1), which allows the use of backbone networks at each encoding step and introduce skip connections between two corresponding paths as an intent to provide local context and transfer information. State-of-the-art segmentation models focus on improving the predictions and exploring the information over larger receptive fields, on developing new links between parts of the segmentation model to provide more local context or on introducing lateral connections to allow the detection of objects at multiple scales.
The backbone networks also evolved to improve the efficiency of segmentation operation. Moving away from standard CNN architectures like VGGNet [
5], new backbone networks specialized in segmentation were introduced. Some of the most popular backbone networks specialized in semantic segmentation are EfficientNet [
9] and SEResNeXt [
10] (based on ResNetXt [
11] but using “Squeeze-and-Excitation” (SE) blocks [
10]).
In remote sensing applications, semantic segmentation aims to assign a land cover class to every pixel of an image. This task becomes the operation of extracting geospatial objects from remote sensing images and is challenging due to the high variety of geospatial objects and their complexity (many displaying similar hyperspectral signatures and structural properties) and due to the strong trade-off between downsampling (which enables the abstraction and obtaining of richer information) and objects extraction (requiring a strong local context). Most of the existing methods use supervised learning to extract the geometries using their radiometric, spatial, and photometric features.
Deep learning applied to remote sensing has proven to be useful for aerospatial objects extraction [
12] and aircraft recognition [
13,
14], for automobile detection [
15], for building detection and mapping [
16,
17], for roof segmentation [
18,
19], and for vegetation and buildings segmentation [
20]. Other works in the relevant literature focused on building frameworks for extracting multi-class geospatial objects (including bridges, ships, tennis courts) [
21], on extracting pylons of electric transport lines [
22,
23], on detecting vehicles [
24,
25], on extracting photovoltaic panels using random forest techniques [
26] or through semantic segmentation [
27], or road segmentation using adversarial spatial pyramid networks [
28]. One of the main drawbacks is related to the small study areas taken into account, featuring favorable scenarios (as also pointed out in [
29]).
For this reason, in this article, we will explore the feasibility of training various segmentation models to extract and map wind turbines in optical high-resolution remote sensing orthorectified images. We will use an available dataset (point-type geometry) that georeferences 90% of the wind turbines in Spain, but whose genesis and sources are unknown, and therefore their quality is also unknown. We set ourselves the tasks of exploring the ability to use DL models in extracting wind turbines from aerial imagery and to characterize the quality (positional accuracy and completeness) of the said dataset in order to answer the following research questions:
Which semantic segmentation network generates the best results in the task of wind turbines segmentation from high-resolution aerial imagery?
Can a DL model trained to extract wind turbines help in characterizing the quality of an available dataset in terms of positional accuracy and completeness?
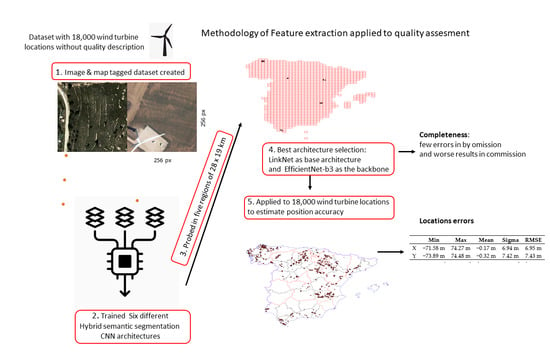
To address these challenges, we propose a methodology for creating optimal Deep Learning-based solutions to extract the ground geometry of wind turbines by means of semantic segmentation using high-resolution aerial orthoimagery—for having them freely available, but we could have used high-resolution optical images obtained by remote sensing—and a methodology to evaluate the positional accuracy and the completeness of a dataset containing the geospatial objects.
The main contributions of this research are:
We propose a methodology for evaluating the goodness of the wind turbine predictions extracted through semantic segmentation operations.
We propose a methodology for evaluating the positional accuracy of the geospatial object extracted using segmentation techniques as a means to assess the quality of a dataset containing the wind turbines.
We train five different semantic segmentation networks on a novel dataset composed of 5,140 tiles of high-resolution aerial orthoimagery and their corresponding cartographic mask containing the wind turbine feature.
We study how changes in a network’s structure (depthwise) and learning techniques affect a segmentation model’s performance in the wind turbine extraction task.
The use of the best performing network, through the proposed methodology, allows to extract the features that represent wind turbines with few false-negatives and generate a set of data to use to compare and characterize the quality of another dataset of which the quality is unknown.
2. Data and Methodology
No official source with georeferenced wind turbines has been found. Some businesses in the field offer lists of their windmill farms registries, in some cases, even mentioning the coordinates of the centroids of the wind farms (e.g., “The Wind Power”, by the Spanish Eolic Business Association, or the Spanish electric transport operator, e.sios). Unfortunately, they are not very useful for detecting the individual wind turbines that form the windmill farms. Nonetheless, we identified the websites of the Association of Renewable Energy Maintenance Companies (“Asociación de Empresas de Mantenimiento de Energías Renovables”, AEMER) and the database generated by Antonio Marín [
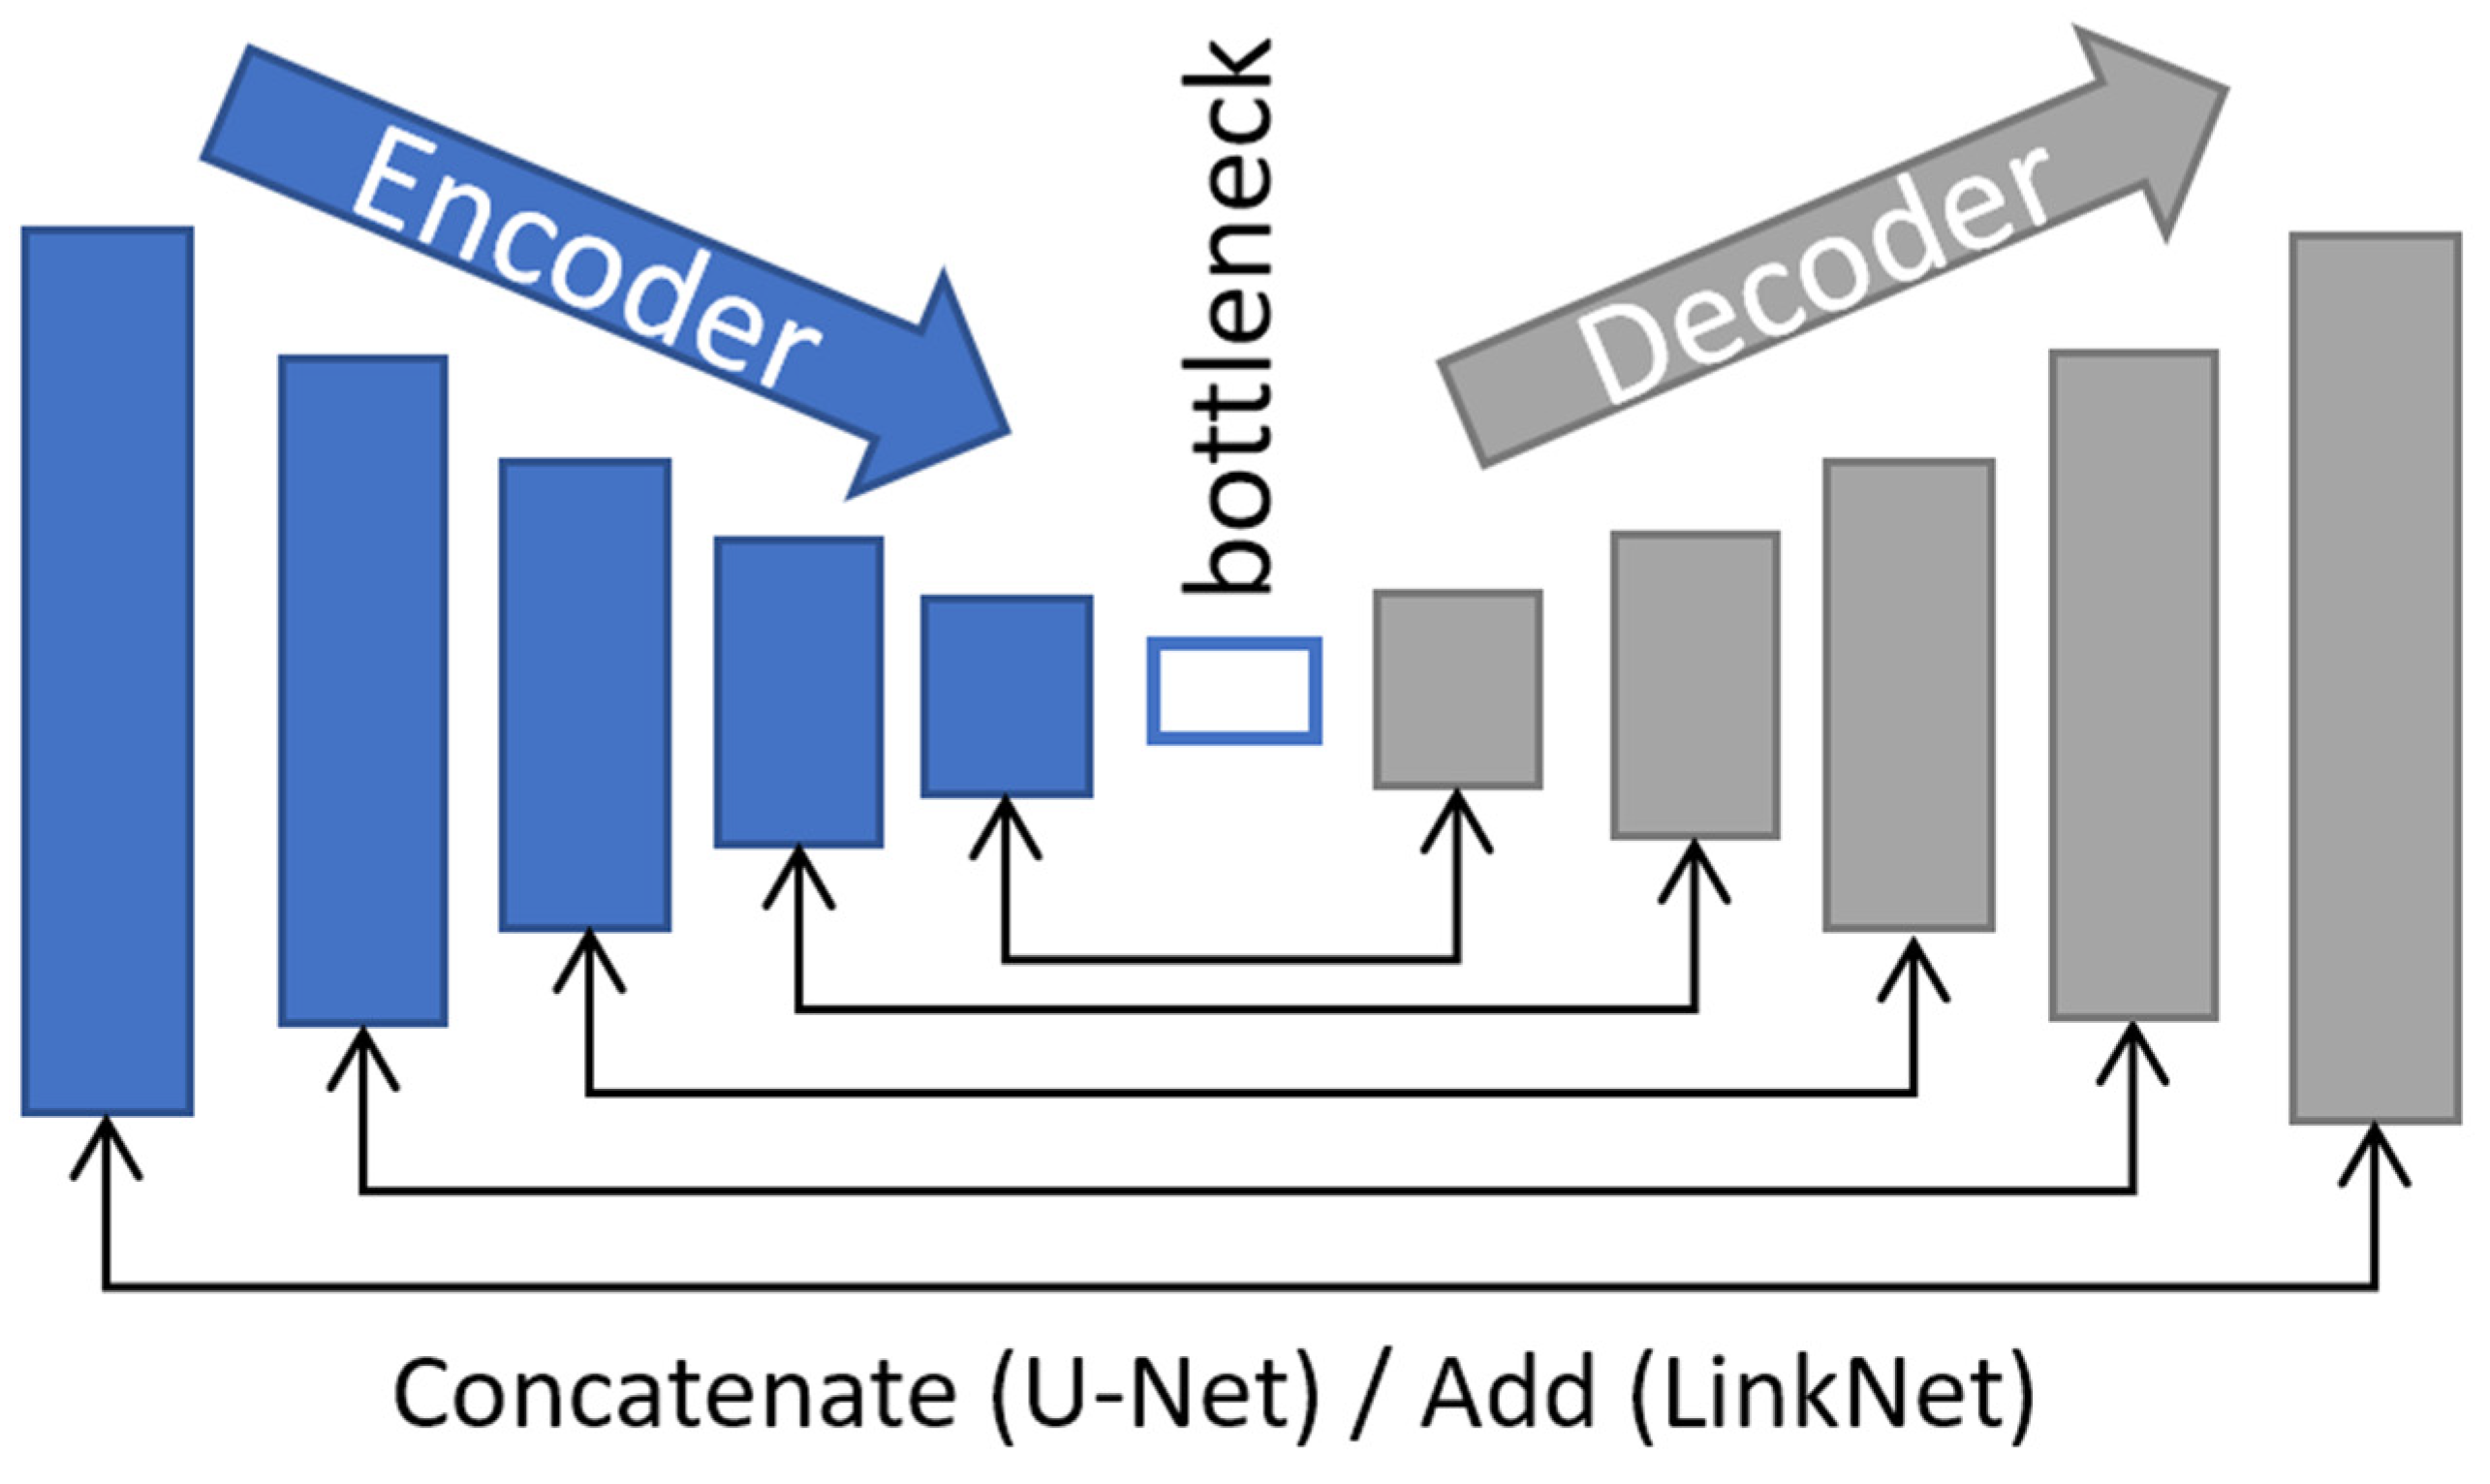
30], and obtained a dataset containing 18,000 georeferenced wind turbines distributed among the entire Spanish mainland and the Balearic Islands (as seen in
Figure 2).
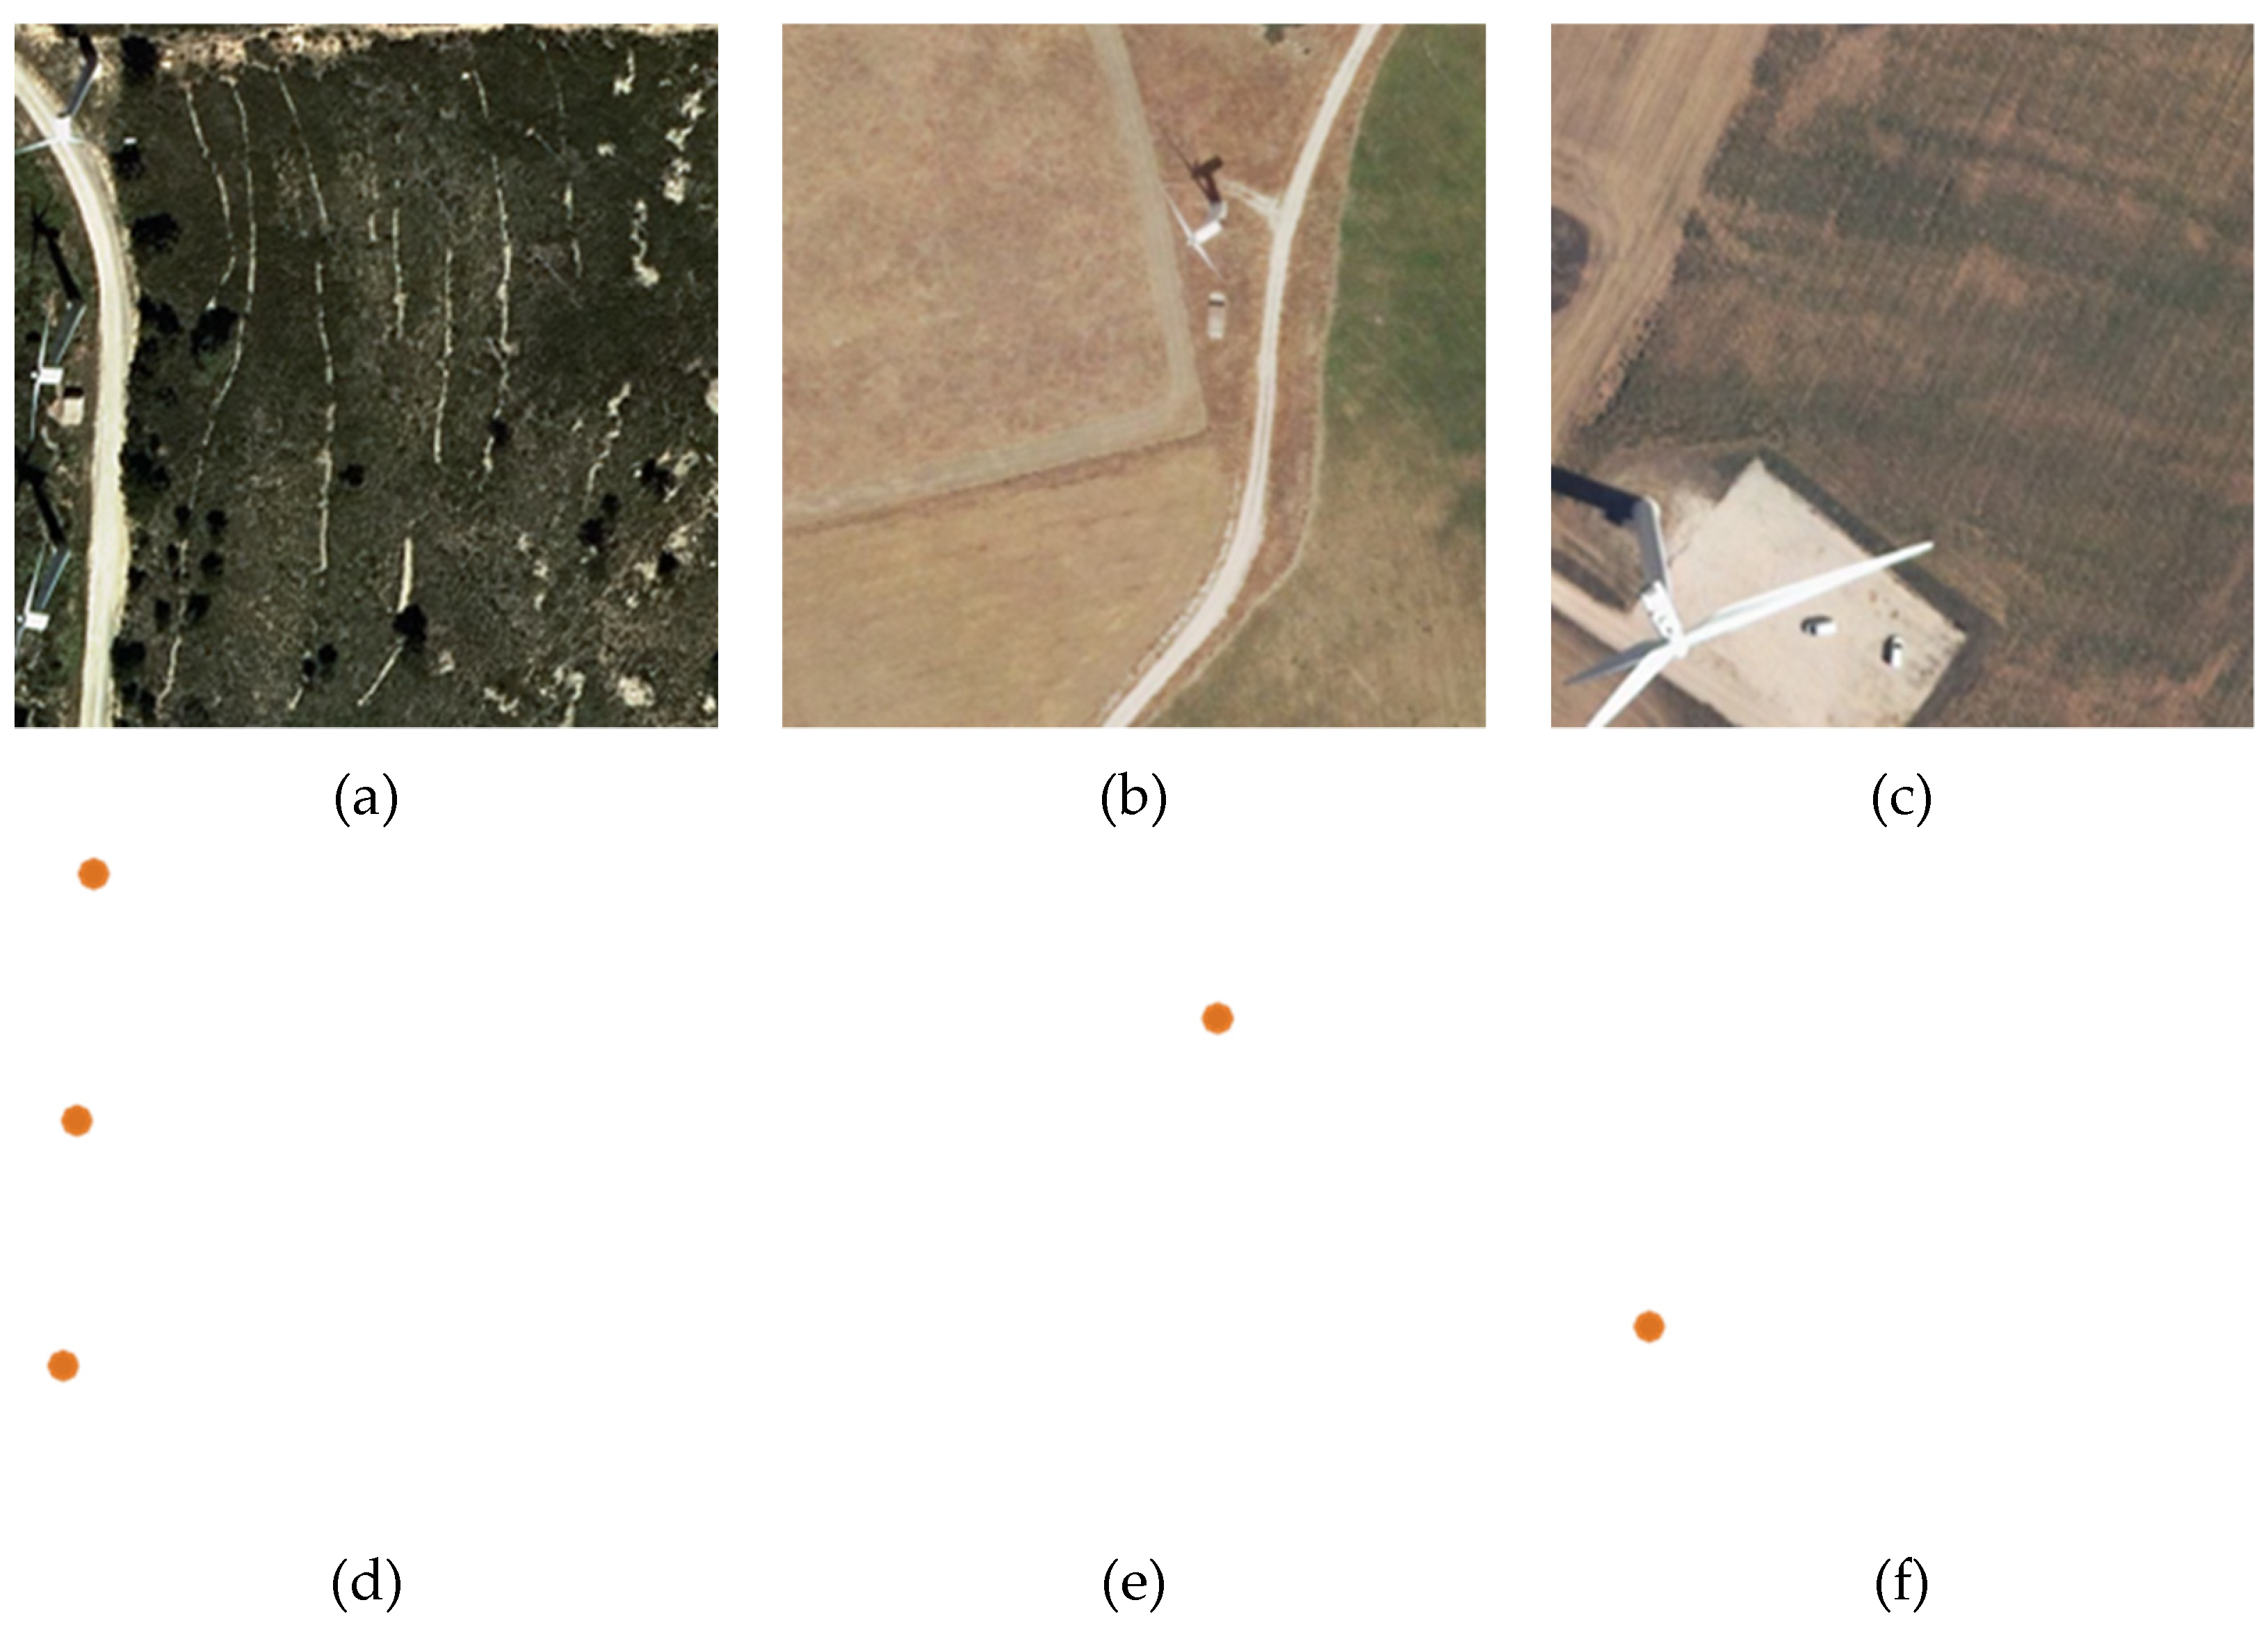
However, we promptly identified various quality problems related to this data repository: location errors consisting of systematic misplacements of the objects, wind turbines that do not exist in the aerial images (they may have been planned and even built, but are inexistent in the latest orthoimage freely obtained from the National Geographic Information Center (“Centro Nacional de Información Geográfica”, CNIG), and wind turbines not registered in the database. In
Figure 3a–d, we can find examples of georeferencing problems and the challenges generated by the differences in types, sizes, and shadows of wind turbines.
To generate the training data bank, we conducted a visual inspection of the available wind turbine dataset (vector format) superimposed on the orthoimages. We applied a general criterion of representation for the footprint of the wind turbine’s base (a circle with a radius of 3 m), regardless of their size and height (since no such information was available at the individual level). The criterion of 3 m of radius for the bases of the wind turbines was adopted, after we analyzed the number of turbines aggregated by power (from 100 KW to 20 MW) and verified that 80% of the installed turbines had powers between 500 KW and 2 MW, typically using the last one, with a base diameter of 5 m. A radius of 3 m was selected for its representation so that the positioning errors of the centers, on an orthophoto of 0.5 m resolution, do not affect and the base is contained in that circle. This way, we generated segmentation masks (raster format) that contain information about the classes of each pixel “Wind Turbine Exists” or “No wind turbine”, the pixels defining the base of the wind turbines being easy to identify.
For the tagging operation, we divided the latest orthoimage tiles of the PNOA [
31] (Spanish “Plan Nacional de Ortofotografía Aérea de España”) into tiles of 256 × 256 pixels at a scale of scale 1:2132 (~0.6 m pixel resolution) using a web application built for the tagging purpose. This web tool allows the simultaneous visualization of the aerial orthoimagery and its cartographic representation, and provides tools that allow the operators to work in parallel during the labelling operations. This same work logic has been successfully employed in other works related to the binary recognition of continuous geospatial elements (road network) in orthophotographs using deep neural networks ([
32,
33]). This way, we obtained a dataset of tiles containing 5140 aerial images of the wind turbines and their cartographic representations. This training dataset represents 28% of the wind turbines whose positional error and completeness accurate that we want to analyze. In
Figure 4, we can find some illustrative examples of differences in size and textures around the turbines.
The methodology proposed in this paper allows the design of Deep Learning solutions to segment wind turbines in high-resolution aerial orthoimagery through feature extraction.
As specified in the introduction, segmentation models are usually built using a segmentation architecture coupled with a base network (or backbone). In [
34], we studied the appropriateness of using hybrid segmentation networks for extracting complex geospatial elements and contrasted their performance in comparison to state-of-the-art segmentation architectures, obtaining improvements in performance metrics of 2.7–3.5% when compared to the original architectures trained from scratch. The best performing hybrid models were featuring U-Net [
7] as segmentation architecture with SEResNeXt50 [
10] as a backbone network and LinkNet [
8] coupled with EfficientNet [
9] as backbone networks and will be used in this study. We also considered the b0, b1, b2 and b3 variations of EfficientNet as backbones to analyze how the depth of the backbone will impact the segmentation results.
2.1. Methodology for Evaluating the Goodness of the Semantic Segmentation Predictions
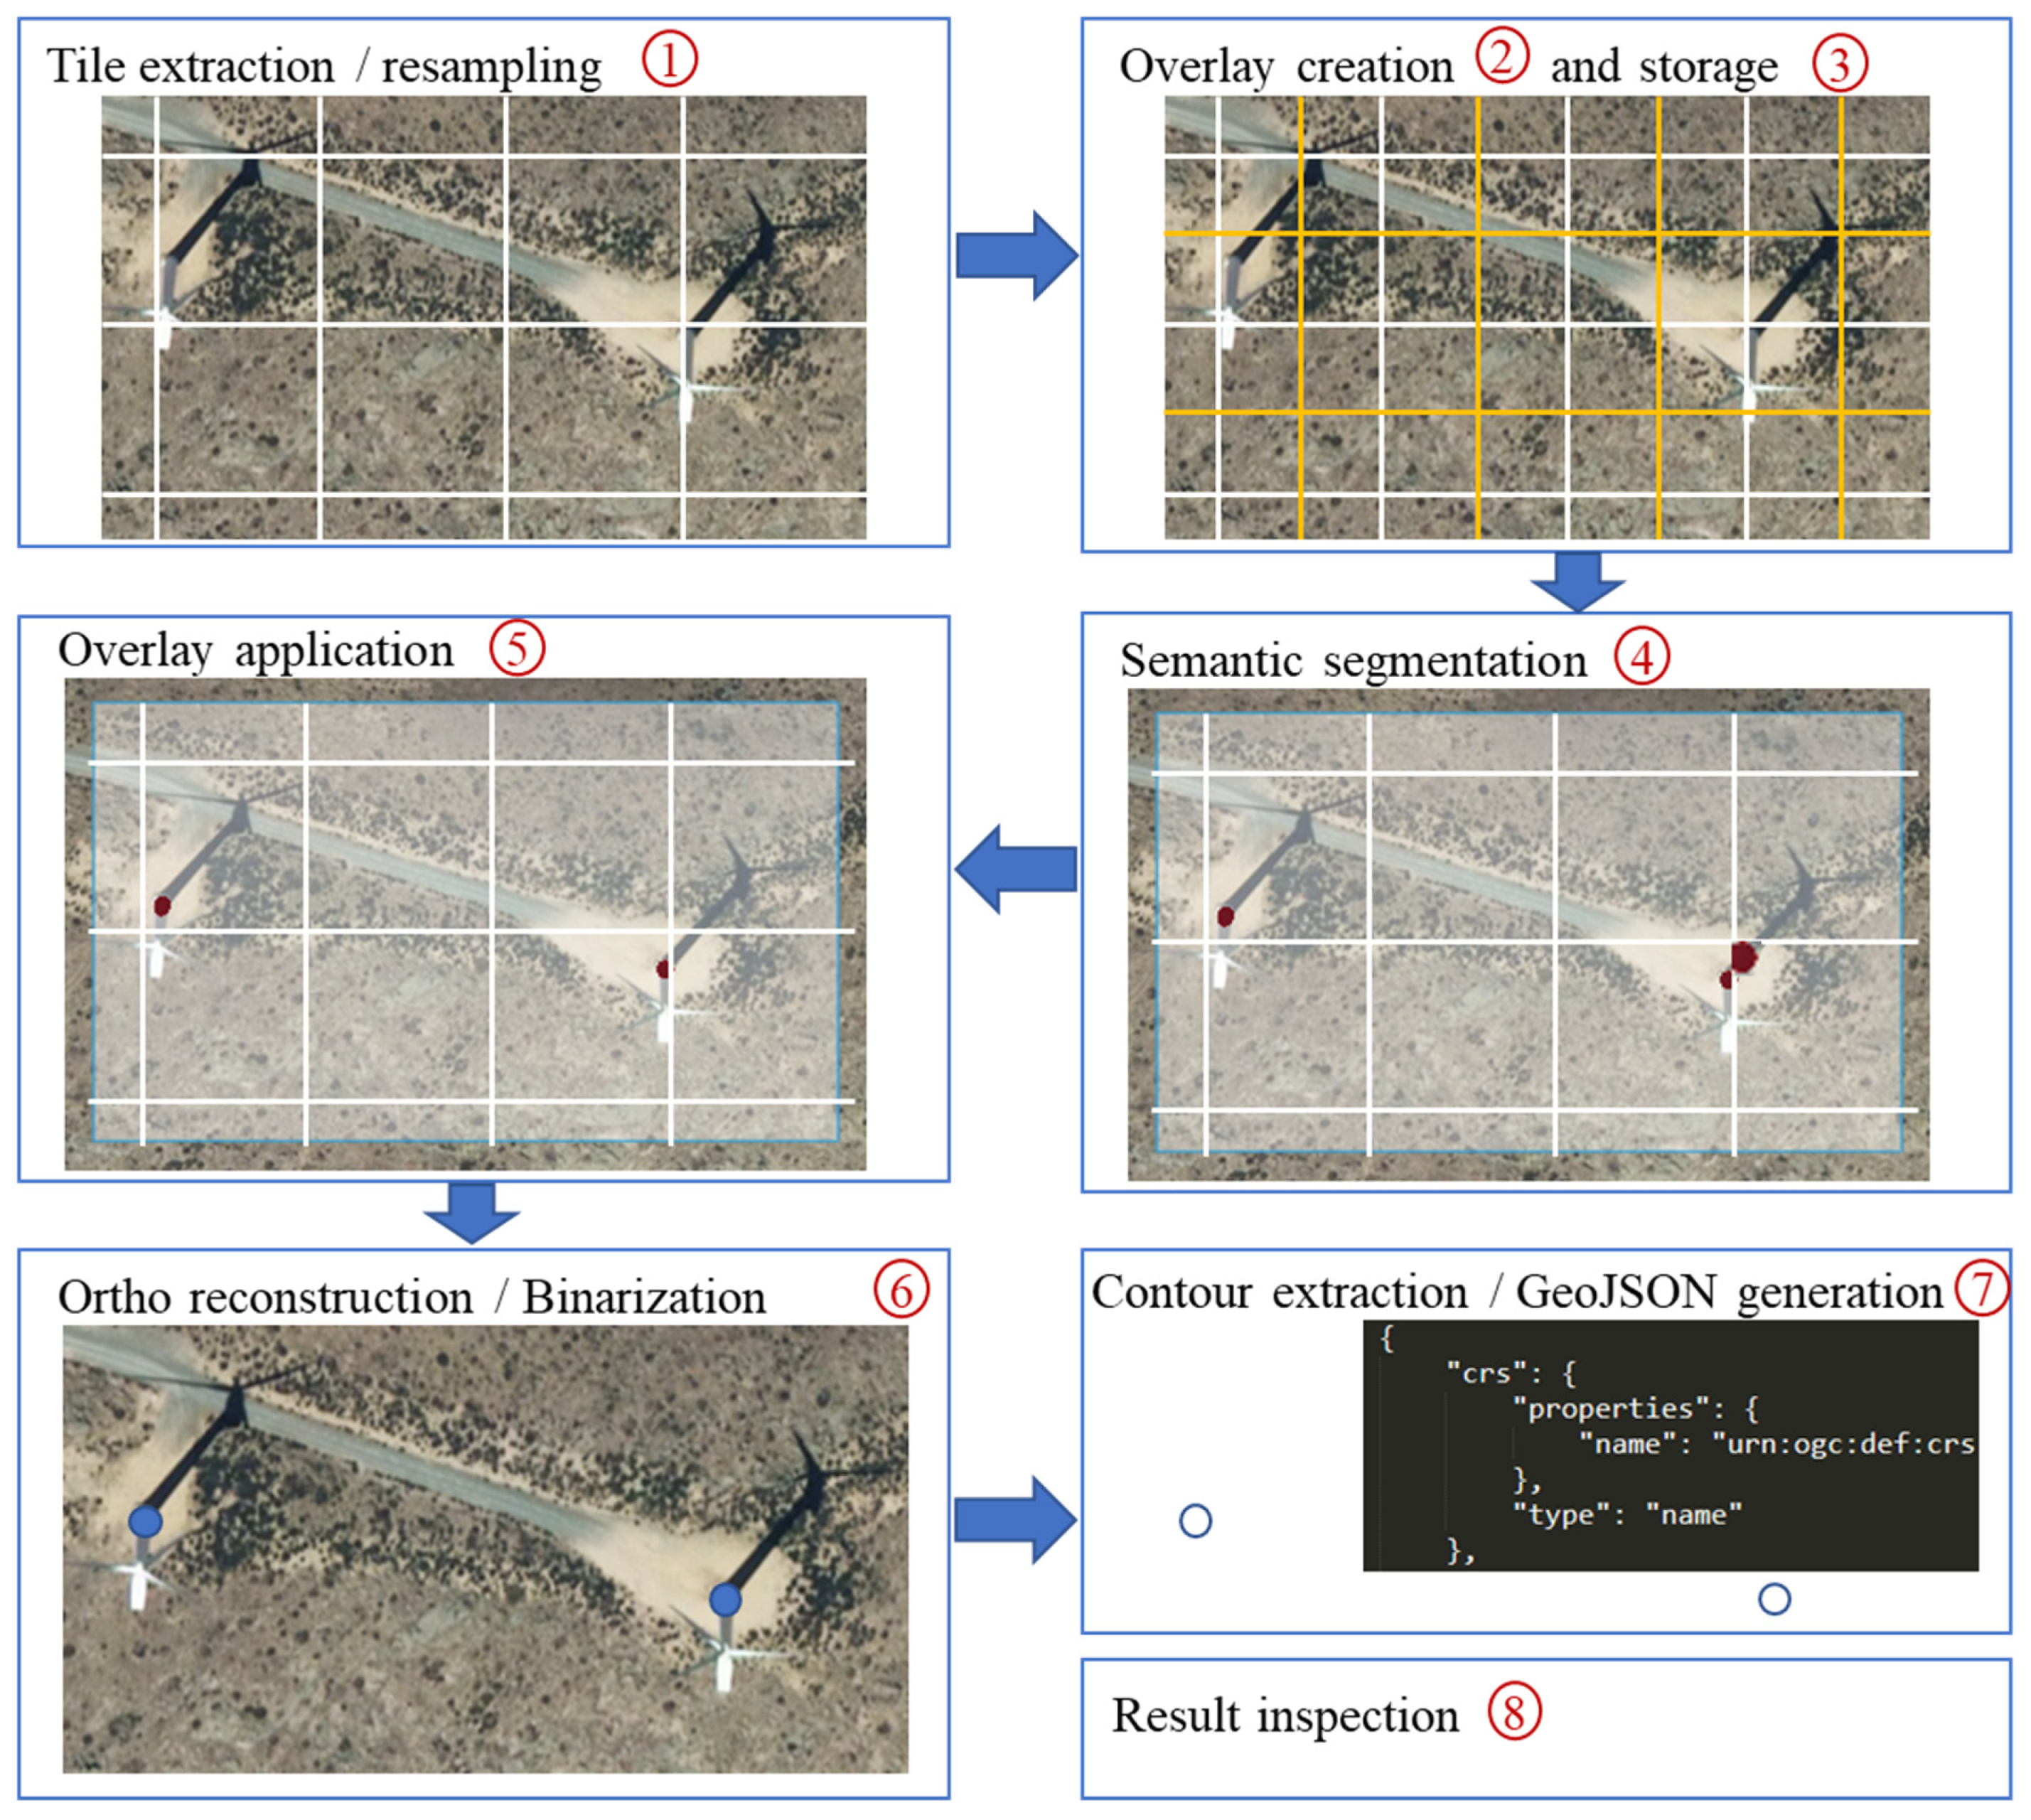
To evaluate the goodness of the predictions returned by the semantic segmentation models, we selected five areas of Spanish geography with extensions of 28 × 19 km each (National Geographical Grid System at 1:50,000 scale) from the H0008, H0383, H0432, H0767 and H1077 cartographic sheets (represented by red rectangles in
Figure 2). The methodology applied for their evaluation consisted of eight steps, which are graphically summarized in
Figure 5 and described below.
As a first step, traverse from North to South and West to East the latest orthoimage downloaded from the CNIG in ECW format, and extract the tiles. Given that the latest orthoimages have a spatial resolution of 0.25 m × 0.25 m and the training of the network was performed on tiles with a pixel size of 0.597 m, the resolution of the latest orthophoto was halved (to 0.5 m/ pixel). For this purpose, tiles of 512 × 512 pixels were extracted, these images being collapsed afterwards by choosing one out of every 4 pixels.
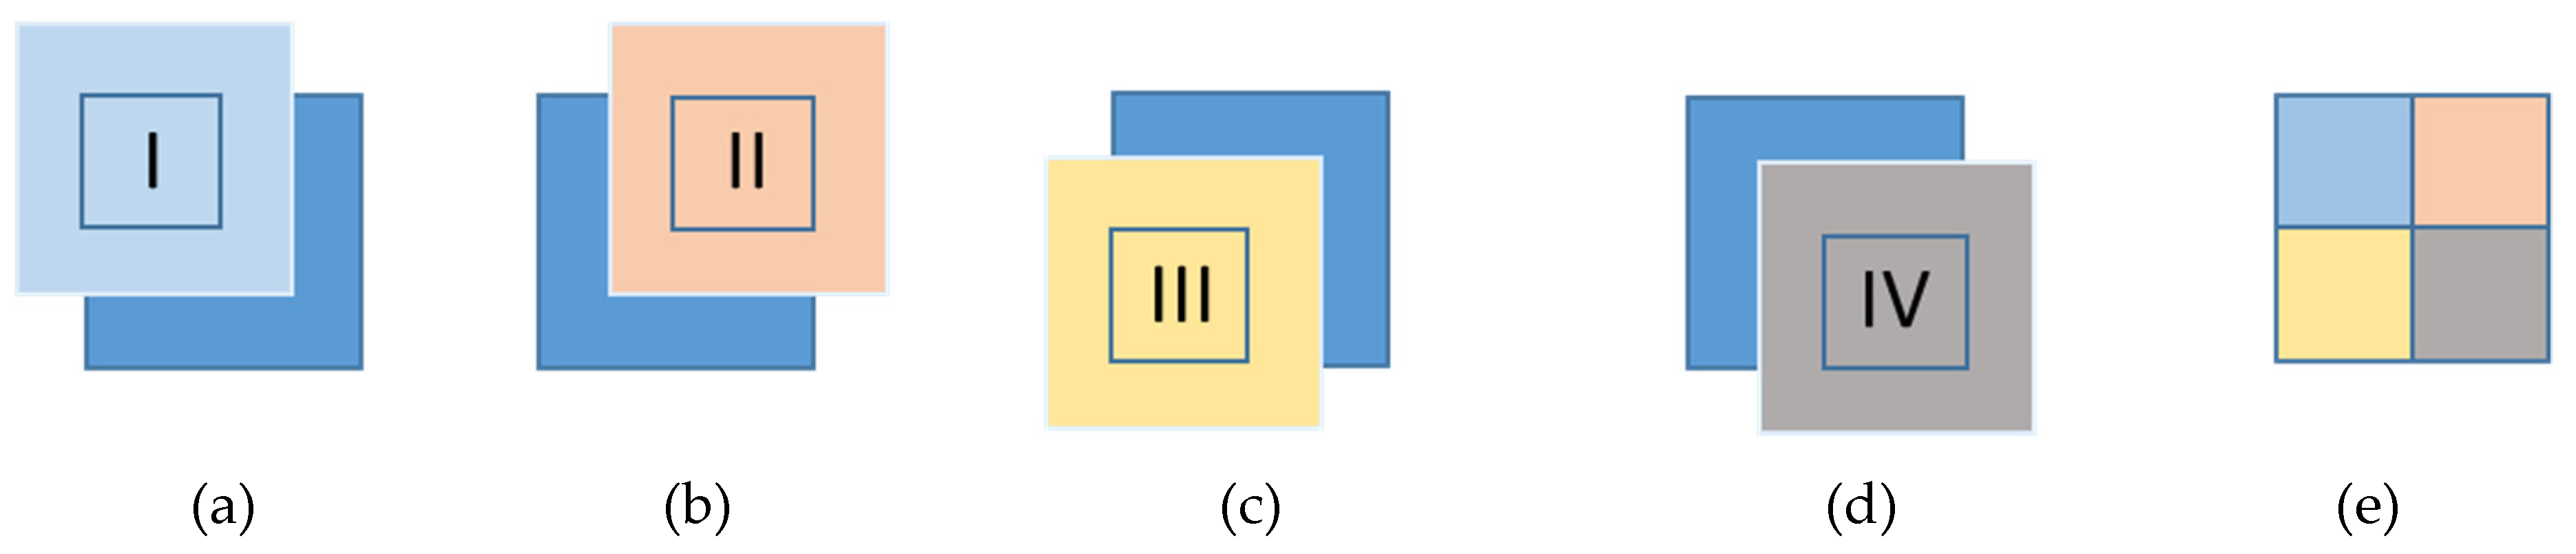
Next, to avoid the common semantic segmentation problem where objects near the boundaries of an image are inaccurately extracted due to the lack of context, we apply a modified version of the method proposed by [
29], where the predictions are averaged with overlays. Our proposed method consists of processing for each original 256 × 256-pixel tile, four secondary tiles of the same size, their center being the centers of the four quarters of the original tile (as shown in
Figure 6). In this way, we are able to keep the central 64 × 64 pixels and discard the pixels farthest from the center. This strategy also penalizes the computation as proposed by [
29], but does not average or mask results.
As a third step, a georeferenced 256 × 256 tiff image is constructed from the four matrices of 64 × 64 cells (featuring numerical values in the range (0,1) and stored on the hard disk (
Figure 6).
Next, the algorithm runs through the entire orthoimage in a Z-shape (generating approximately 32,000 prediction images per analyzed region).
In the fourth step, the created overlay is used to reconstruct a prediction image with dimensions similar to the original one, through a merge operation (by generating a mosaic). The prediction image and the original will not have the same dimensions, since a 256 × 256-pixels image cannot be centered at the edges of the original image and a 64-pixel strip is wasted at each edge. On a practical level, this is not a problem since orthoimages provided by CNIG are openly available and extend beyond the boundaries of the sheets, in such a way that two adjacent orthoimages always overlap in a strip.
Next, once the orthoimage is reconstructed, a binarization operation is carried out over the mosaic of predictions, by saturating the probabilities that exceed a parameterizable threshold to 1, and the rest to 0.
As a penultimate step, the binarized image is vectorized to generate the polygons of the bases of the identified wind turbines, in an operation similar to the extraction of the contour lines from a digital elevation model. The centroids of these polygons are calculated and stored as turbine coordinates in a GeoJSON file, to facilitate their visualization and subsequent analysis.
At last, each turbine identified in the five selected regions is analyzed and contrasted with the orthophotography itself to determine errors in the identification, whether they are false-positives or false-negatives, thus evaluating the goodness of the trained hybrid segmentation model.
2.2. Methodology for Evaluating the Positional Accuracy of the Dataset
The data generated by the semantic segmentation operation in areas where wind turbines are presumed to exist was considered as reference data to determine the positional accuracy of the initial dataset. In this operation, the methodology applied consisted of:
We start by iterating to evaluate the latest orthoimage available (centered on the initial known positions of the wind turbines) with the trained semantic segmentation model to obtain a matrix of 256 rows × 256 columns containing the probability values in the range (0,1).
Next, binarize the probability matrix by saturating the high probability values to 1 and the low values to 0 in a way similar to the “nearblack or nearwhite” function.
Then, build a single band geotiff image that shares the geometric characteristics of the input orthoimage (pixel size and origin).
Afterwards, vectorize the binary image to extract the elliptical polygons (ideally circular) representing the wind turbine bases.
Finally, calculate and store the centroids of these polygons as the true coordinates of the wind turbines, adding as feature attributes the original coordinates in a GeoJSON file, to facilitate their subsequent analysis and visualization.
Once these five steps are completed, analyze the pairs of coordinates obtained to eliminate pairs of mismatched coordinates (where several turbines are identified in the same tile and the calculated coordinates correspond to only one of them) and statistically analyze the errors. The most precise data are considered those obtained from the segmentation operation, as they are obtained from orthoimages generated by an official governmental institution and their error is limited since the source of the data, its genealogy and its geometric quality are known.
It can be observed that steps 2–5 of the methodology proposed for evaluating the positional accuracy are the same as those of the methodology proposed in
Section 2.1. However, this time, we work with smaller volumes of information (tiles of 256 × 256 pixels), instead of images of large dimensions (54,000 columns × 28,000 rows).
3. Implementation of the Proposed Methodology
The implementation of the methodology started with the creation of the training and test sets. Training neural networks require a large number of training examples to obtain a model capable of delivering good predictions. Creating these training banks is costly, not only due to the volume of the images required, but also because we need to ensure a correct correspondence between the segmentation masks (cartographic representation) of the wind turbines and the aerial images containing them. In
Figure 4, we can find some examples of the aerial images and the representation of the bases of the wind turbines used for the training process. The dataset resulting from the tagging operation (5140 sets of tiles and their correspondent geographic representation) was randomly split into the training set (containing 4112 sets) and the test set (containing 1028 sets), following the 80–20% division criteria.
We built the networks using the deep learning “Segmentation Models” library [
35] (based on Keras [
36], with TensorFlow 1.14 [
37] as backend) and trained them on an NVIDIA 2060 GPU. We modified the standard configurations of U-Net and LinkNet by replacing the default backbones both in the encoder and the decoder parts with networks that proved to be better suited for image segmentation tasks. The following hybrid segmentation models were considered for training: LinkNet-EfficientNet-b0, LinkNet-EfficientNet-b1, LinkNet-EfficientNet-b2, LinkNet-EfficientNet-b3 and U-Net-SEResNeXt50.
These models were trained with sets of input tiles and their segmentation mask via stochastic gradient descent to optimize the segmentation function over the training set. This method performs an update of the model´s weights and combined with backpropagation is the standard training algorithm for ANN. As hyperparameters, we considered Adam [
38] to optimize the binary cross-entropy Jaccard loss function. This loss function measures the similarity between the prediction (
) and the ground-truth (
) when working with a network ending in a sigmoid function,
.
The segmentation model takes an RGB image of size 256 × 256 × 3 and outputs a map of size 256 × 256 × 1, by keeping the depth-wise argmax of each pixel. The pre-processing of the tiles begins with normalizing the intensity values of the pixels from the range of (0,255) to (0 and 1), this way avoiding the computation of very large numbers.
To overcome the overfitting behavior, we applied online data augmentation, exposing the model to more aspects of the data. Some of the transformations applied include random crops, random rotation and brightness, horizontal and vertical flips, and contrast and gamma shifts. We also applied feature mapping (transfer learning) from the ILSVRC dataset [
39] to start from pre-trained weights instead of randomly initialized weights. This way, we ensure a better convergence of the model [
40].
We started with a learning rate of 0.01; this value is reduced with a factor of 0.1 when the metrics plateaued for more than 10 epochs (up to a minimum value of
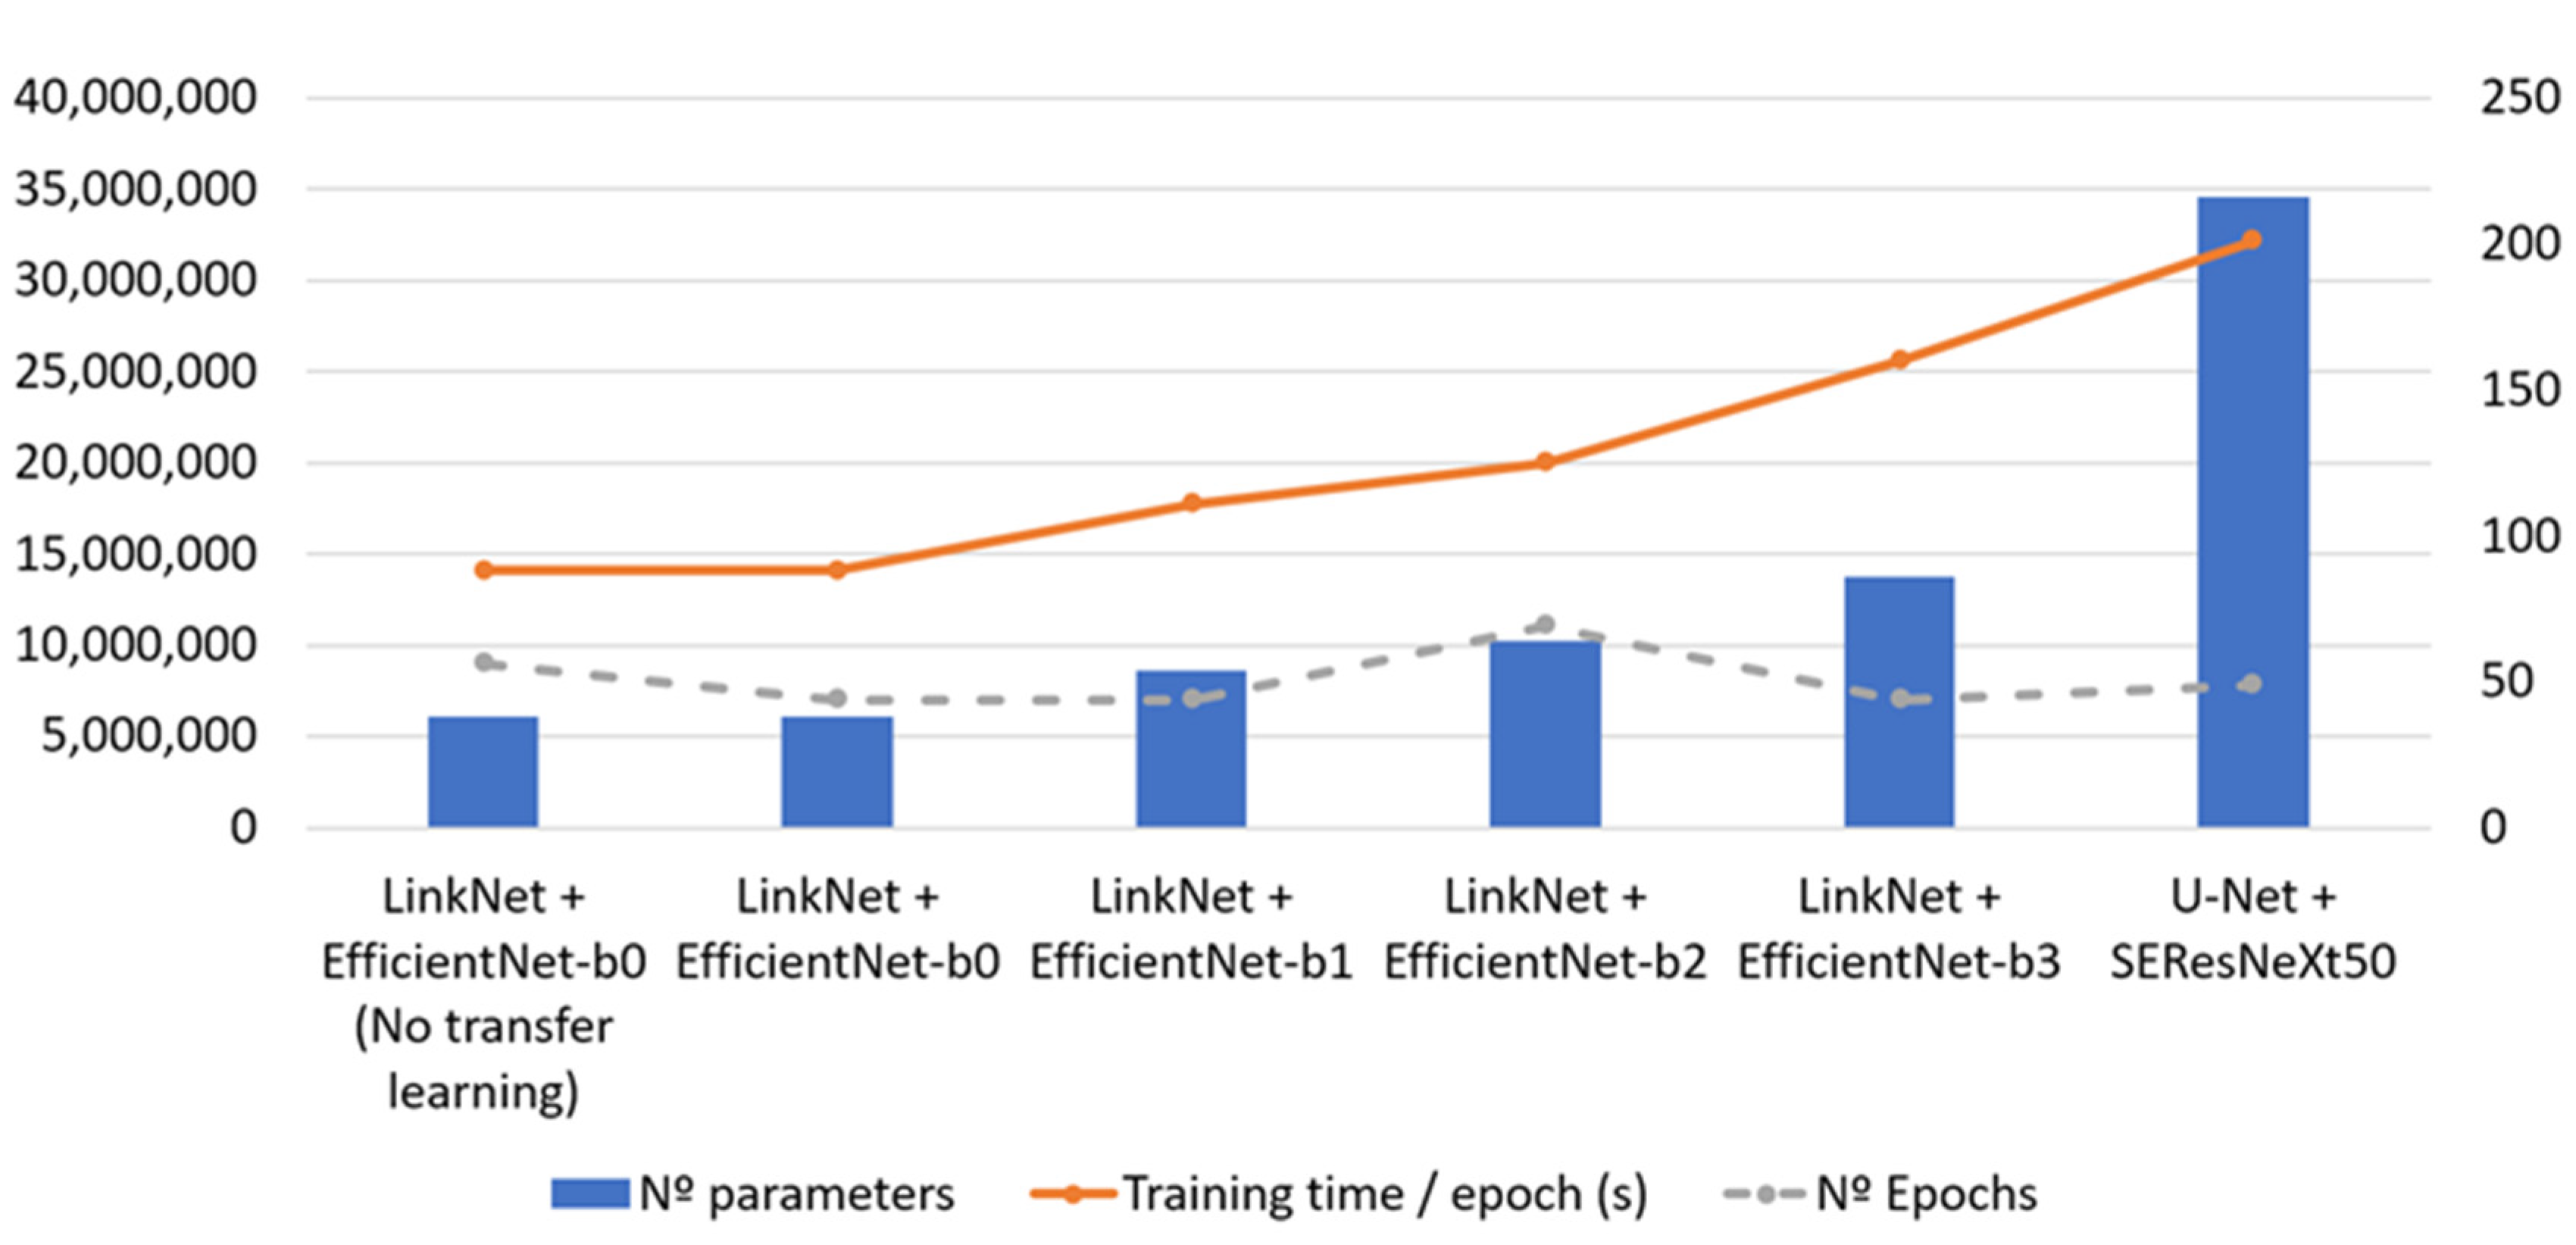
). The learning process stopped when the performance stalled for more than 10 epochs or when the network started to display overfitting behavior (a pronounced higher performance on the train set and a lower performance on the test set). The models trained were stored in the open h5 format. In
Figure 7, we can observe the behavior displayed by the models during the training process.
To use the models stored in the h5 exchange format, a virtual Python with Conda environment was configured on a Windows OS computer, while installing and configuring the GDAL v3.0.2 [
41] and NumPy [
42] libraries and dependencies.
The developed scripts rely on NumPy to handle multidimensional arrays of numbers (the initial 3-dimensional arrays of the RGB orthoimages and the final monoband array containing the prediction), to perform the decimation of the orthophotographs from higher spatial resolution (0.25 m) to a lower spatial resolution (0.5 m), to merge the centers of the prediction images (as described in
Figure 6), and to perform the thresholding or binarization of the prediction images.
The GDAL/ORG libraries were used to open the images stored in ECW format, to create new images both in-memory and in GeoTIFF format, to create vector datasets in memory or files in GeoJSON format, and to generate the polygons that enclose the pixels classified as belonging to the “Wind Turbine Exists” category (by applying the “ContourGenerate” function). To reduce the number of false-positives, we used GDAL to calculate the centroid of the feature corresponding to the georeferenced wind turbine, to eliminate the small errors related to the misclassification of other objects as a wind turbine, and to filter objects whose area is smaller than a selected threshold.
4. Results and Discussion
Table 1 shows the results of a systematical evaluation operation of the five test areas (presented in
Figure 2) with the semantic segmentation networks trained to extract the positions of the wind turbines and features the number of wind turbines elements identified by the models.
The lowest numbers of wind turbines detected in each area highlighted in green. This criterion is selected to minimize the number of false-positives detected by the network. When results are very close (almost the same), several networks are marked as candidates for that area. We can see that the model that shows the most figures highlighted in green is the hybrid network following the LinkNet architecture, with EfficientNet-b3 as the backbone (LinkNet + EfficientNet-b3).
In
Table 2, we can find an evaluation of the completeness accuracy of the best performing model (identified in
Table 1) in the five test areas.
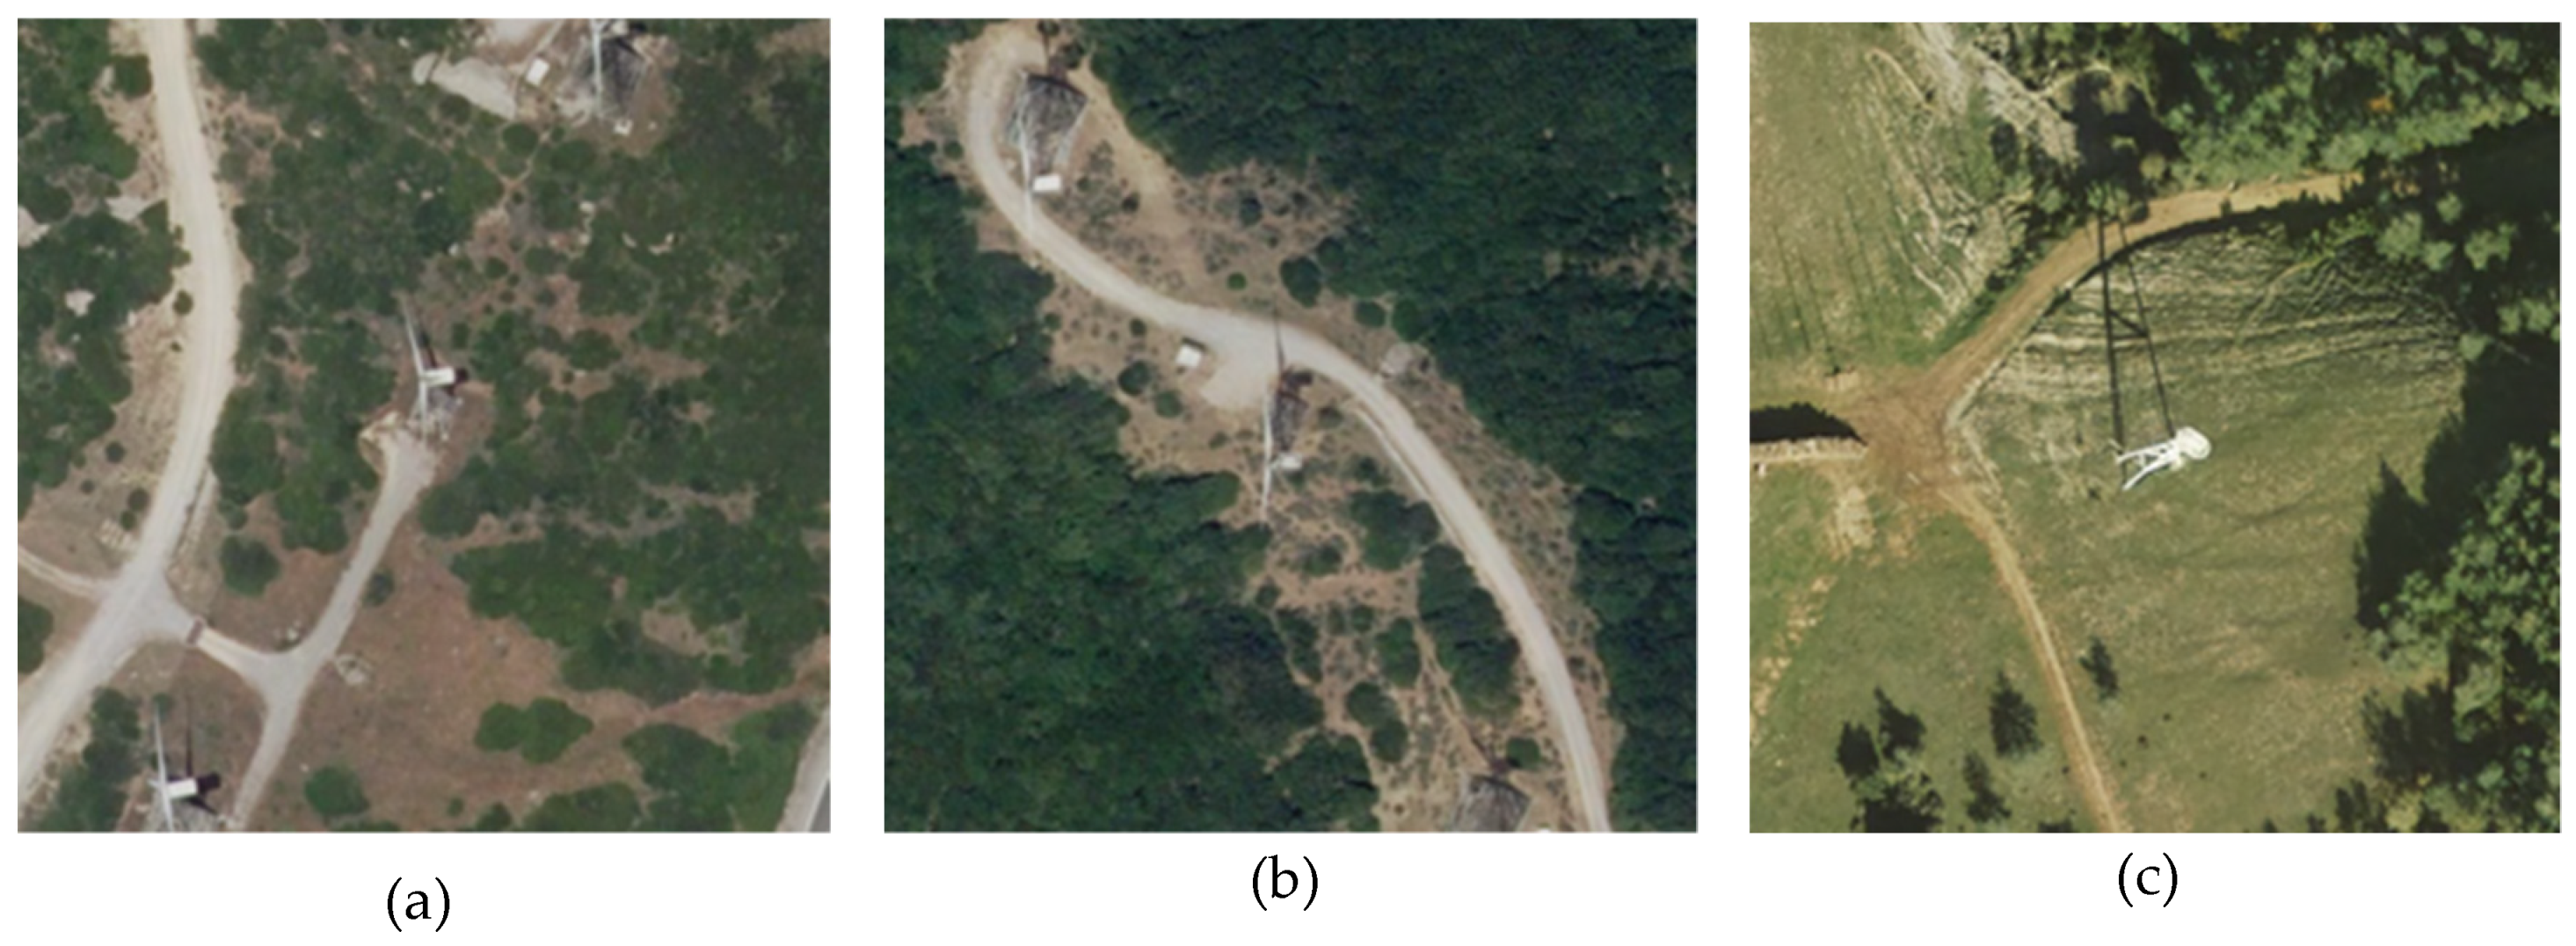
Heterogeneity can be observed in the results, mainly with regard to the number of detected false-positives which is generally large. This fact motivates the need for a cartographic reviewing process to eliminate the false-positives from the generated predictions, despite successfully performing joining and vectorizing operations. In the dataset generated for sheet H0383, this number seems excessive since the number of false-positives is greater than the true ones. False-negative values (when the model omits an element of the wind turbine) are acceptable; in two of the analyzed scenes there are none, while in a third the is only one, and. In the remaining two sheets, false-negatives are due to the existence of very small wind turbines (H0383) or with another type of support structure that is not cylindrical (H1077), but rather on the structure similar to a high-tension tower (as seen in
Figure 8a,b) or are mounted on three cylinders that form the edges of a pyramid trunk to support the turbine (as seen in
Figure 8c).
Regarding the quality of the available dataset, the evaluation of the completeness in the exhaustively revised sheets shows that there are percentages of errors by omission ranging from 0.7% to 2.9%. However, there are no omission errors in three cases and, in the others, it represents 0.3% and 1.3%. If these results are extrapolated to the entire geography of the dataset, it confirms the trend in the proportions of errors by omission derived from the constructions of new wind turbines. At the end of 2019, the sector stated [
43] the existence of 20,940 Wind Turbines in Spain. The 16.3% rate of the omission error suggested by this value is not too misaligned with the rates obtained by the model, knowing that the date of several of the orthophotographs used is 2017. We must also consider that the growth of the global windmill farm is not caused by the growth of existing ones, but rather by the creation of new parks (not registered in the dataset).
Regarding the quality of the positional accuracy of the initial data (18,000 features), we found 259 cases where the best performing segmentation model (LinkNet + EfficientNet-b3) has not identified any wind turbines within the 256 × 256 pixel tiles (centered on the coordinates of the objects). In 181 of these cases, a visual inspection confirmed the absence of the wind turbines (a commission error rate of 1.4% of the set, this value being higher than the systematic analysis of five well-distributed areas). On the contrary, in 69 cases, the network generated false-negatives, which represent a rate of 0.38%, within the range of values obtained in the areas studied. However, of those 69 cases, only 22 can be considered false-negative, 45 cases being caused by a special type of wind turbine base (not cylindrical, as can be seen in
Figure 8a, as was the case in sheet H1077). For the remaining two cases, the orthophotographs shows different types of turbines (as seen in the
Figure 8b). In addition, another nine wind turbines have a low power production capacity; therefore, they are smaller and do not physically resemble normal wind turbines.
By applying the proposed methodology systematically to the 18,000 wind turbines, a set of 18,602 positional relationships was obtained, corresponding to 17,741 different features (18,000 minus the previous 259). This difference in observations is because, in some cases, several turbines were identified in the same tile, all of them being stored. In the subsequent analysis, these cases are filtered (step 6 from
Section 2.2), reaching the result of 17,741 turbines correctly identified by the network. The filtering was carried out by applying a distance criterion between the initial coordinates and those obtained from the deep learning evaluation; 861 observations being eliminated this way.
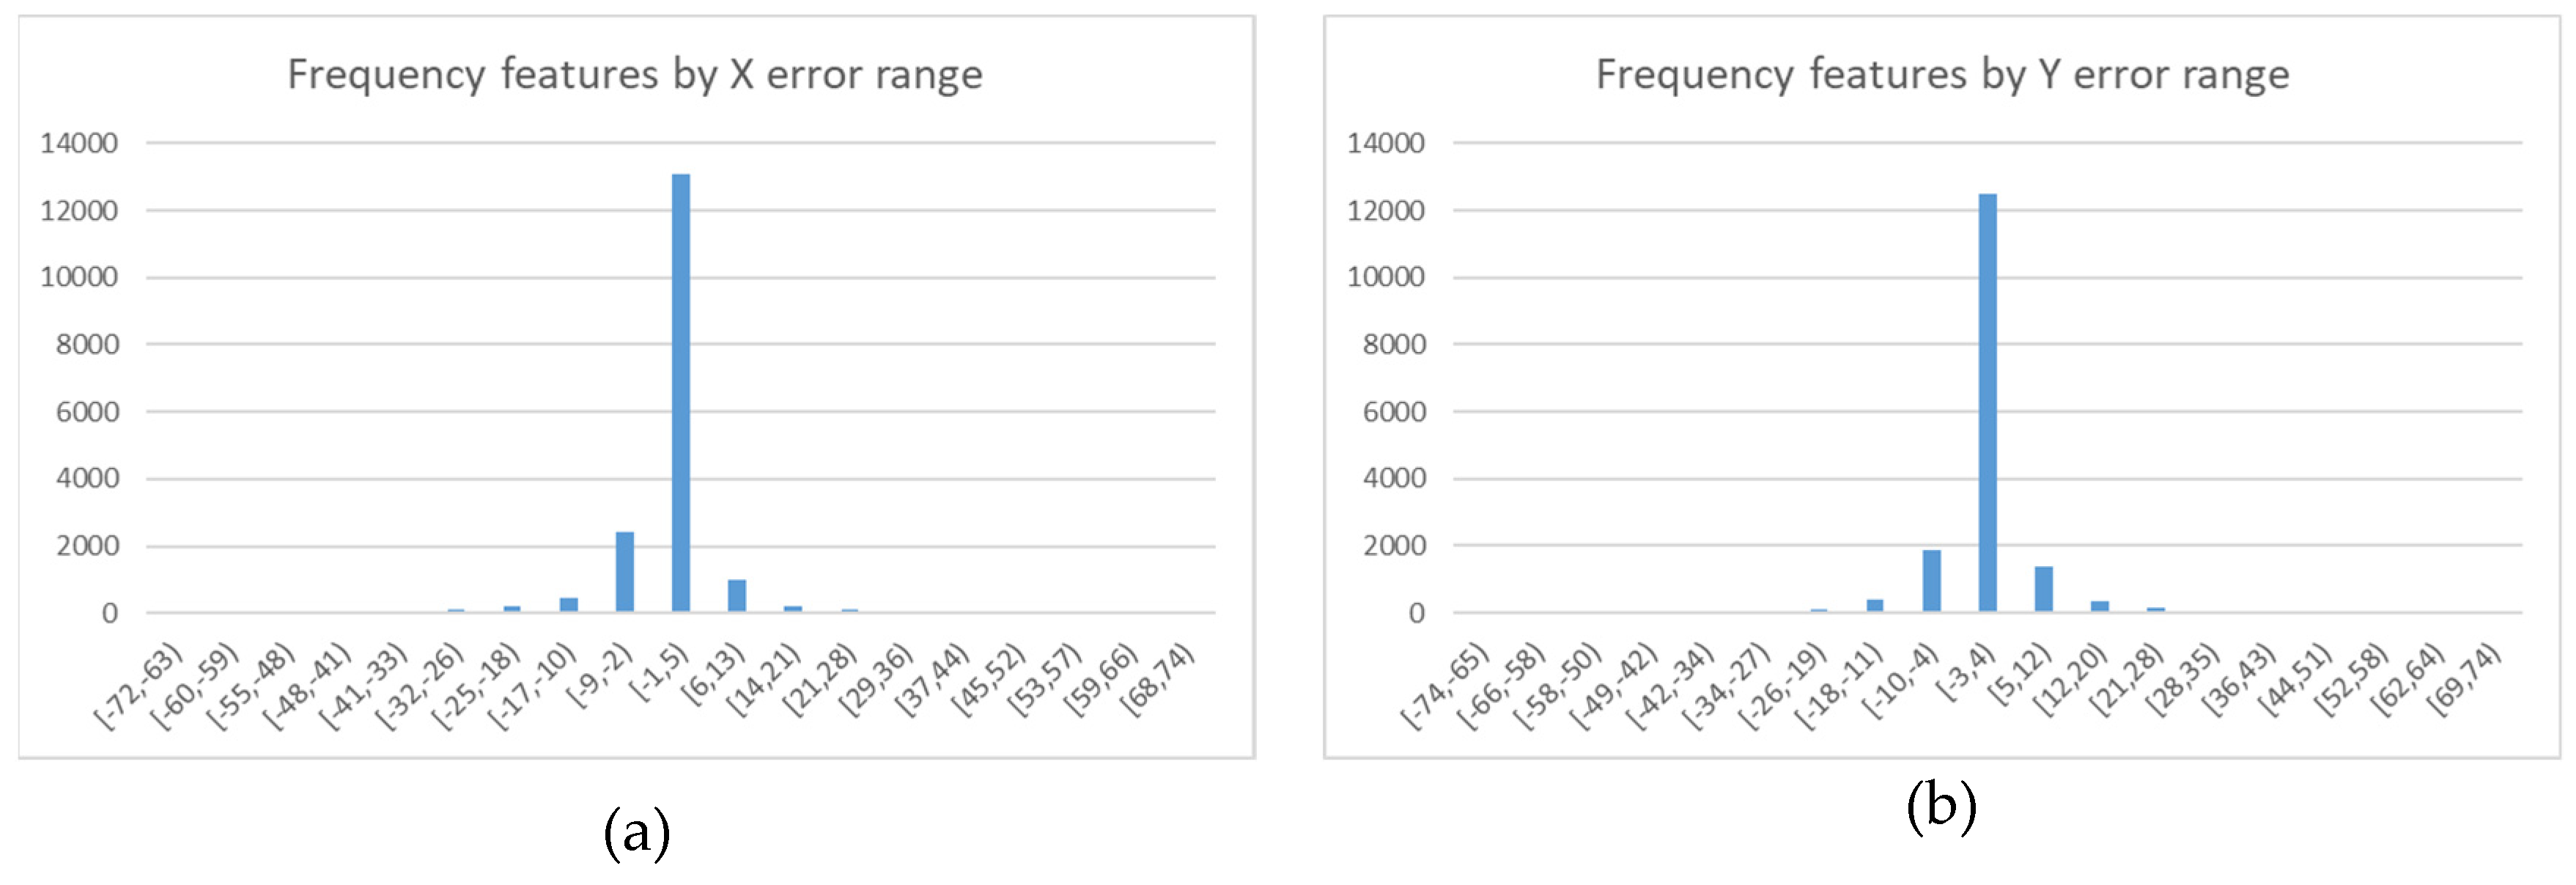
After filtering the data, we obtained a dataset that is 98.56% of the original and we proceeded to characterize the positional error in the planimetric coordinates (X, Y). The results obtained are presented in
Table 3. This allows us to conclude that the dataset has positional accuracy characteristics that are a little worse for the Y component of the planimetry (0.5 m), a value that matches the resolution of the images used. In any case, the RMSE (root-mean-square error) is approximately 7 m according to this first analysis.
To determine the main ranges of errors in both components, the histogram of the distances was calculated by grouping the values into 19 binds. We can see that, for approximately 75% of the georeferenced wind turbines, the error in X is between −1 and 5 m and between −3 and 4 m for the Y coordinate. Both histograms are shown in
Figure 9.
5. Conclusions
In this paper, we explored the capacity of different hybrid semantic segmentation models to extract wind turbines in high-resolution aerial orthoimagery. These models were trained on a dataset generated especially for this purpose and their generalization capacity (goodness of the predictions) was evaluated on five different areas of the Spanish territory (regions of 28 km × 19 km, represented with red rectangles in
Figure 2).
We also proposed a new strategy to automatically deal with the problem of inaccurate extractions near the boundaries of the images. This strategy is described in
Figure 6 and consists of automatically (1) dividing a given tile into four quadrants, (2) extract four secondary images with the same dimensions correspondent to each quadrant from the orthoimage with higher resolution, (3) segment each secondary tile, and (4) only consider their central part in the final segmentation map of the original tile. By applying this strategy, we achieved considerable improvements when extracting wind turbines close to the edges.
Moreover, we proposed a methodology as a workflow that allows the generation of a continuous image with the semantic segmentation predictions and its subsequent vectorization to extract the centers from the bases of the wind turbines. This methodology enabled the comparison of the performance of several hybrid segmentation models in different regions of the Spanish geography and the selection of the one delivering the lowest number of false-positives (in our case, LinkNet + EfficientNet-b3).
We also proposed a methodology as a workflow that has allowed the analysis of the quality in terms of positional accuracy and completeness of an unofficial dataset containing georeferenced wind turbines. In
Section 5, we presented the statistical discrepancies of the georeferenced data (
Table 3) and the discrepancies in completeness by terms of omission and commission (
Table 2). As for the quality of completeness, the values presented are objective, but must be handled with caution, as the date of the latest available orthoimage does not correspond with the latest update of the analyzed dataset. This situation was observed in areas where wind turbines were registered, although they appear under construction in the imagery.
Regarding the geometric quality of the georeferencing of the evaluated dataset, the errors are more dispersive in the X coordinate than the Y coordinate and the values are significantly higher than the resolution of the aerial orthoimagery used 0.5 m (pixel size).
It has been proven that based on the proposed methodology, it is possible to evaluate the quality parameters of datasets whose genealogy and metadata are known using deep learning and semantic segmentation techniques. However, this evaluation has an important cost in the creation of the training datasets of the networks and the tests to select the architecture or hybrid network that generates better results for the application domain (in our case, wind turbines).
The results of the experiments carried out with the six hybrid semantic segmentation networks show that applying Feature Mapping from networks pre-trained with millions of images (e.g., ImageNet Large Scale Visual Recognition Challenge) helps to obtain better results when the training dataset is not very large, as in this case (5140 tiles), as seen in
Figure 7 and
Table 1. In our case, the best performing segmentation architecture uses LinkNet as base architecture and EfficientNet-b3 as the backbone.
As for the second research question, we found that it is possible to use semantic segmentation models to extract features with greater positional accuracy, so that they can be used to characterize the quality of a dataset whose genealogy is unknown. We were also able to evaluate the performance of the networks in detecting the wind turbines by systematically reviewing and comparing the predictions with the ground-truth in five different regions from the Spanish territory, this way obtaining the goodness of the results in terms of false-positives and false-negatives. This is a great achievement from a productive point of view, since it noticeably reduces the human effort required to update the cartography. This way, a systematic and very laborious revision is avoided; only places where the network has extracted features need to be reviewed.
The methodology proposed to characterize the quality in the studied terms (geometric and completeness) can be applied to any other type of feature that can be modeled as point representation in the cartography (e.g., electric towers, telecommunications antennas). Additionally, it can improve the quality of collaboratively generated datasets (e.g., crowdsourcing) in which quality criteria are not well defined and the quality of each contributor’s contributions cannot be quantified.


