Characterization of Intertidal Bar Morphodynamics Using a Bi-Annual LiDAR Dataset
by
 ,
,
Anne-Lise Montreuil
1,*, 
Robrecht Moelans
2,
Rik Houthuys
3,
Patrick Bogaert
4 and
Margaret Chen
1 1
Hydrology and Hydraulic Engineering, Vrije Universiteit Brussel, 1050 Brussels, Belgium
2
VITO, Remote Sensing Unit, 2040 Mol, Belgium
3
Geoconsultant, 1502 Halle, Belgium
4
Earth & Life Institute, Université Catholique de Louvain, 1348 Louvain-la-Neuve, Belgium
*
Author to whom correspondence should be addressed.
Remote Sens. 2020, 12(22), 3841; https://0-doi-org.brum.beds.ac.uk/10.3390/rs12223841
Submission received: 26 October 2020
/
Revised: 19 November 2020
/
Accepted: 20 November 2020
/
Published: 23 November 2020
(This article belongs to the Special Issue New Advances in Coastal Processes and Dynamics Using LiDAR)
Abstract
:Intertidal bars are common features on meso-and macro-tidal sandy beaches with low to moderate wave energy environments. Understanding their morphodynamics is, hence, crucial for enhancing our knowledge on beach processes which is beneficial for coastal management. However, most studies have been limited by assessing bar systems two-dimensionally and typically over the short-term. Morphology and dynamics of an intertidal bar system in a macro-tidal environment have been investigated using bi-annual LiDAR topographic surveys over a period of seven years and along 3.2 km at Groenendijk beach (Belgium). The detected bars demonstrate that a morphology of an intertidal bar is permanently on the beach. However, these individual features are dynamic and highly mobile over the course of half a year. The mean height and width of the bars were 1.1 and 82 m, respectively. The highest, steepest, and asymmetric features were found on the upper beach, while they were least developed in the lower intertidal zone. The bars were evenly distributed over the entire intertidal beach, but the largest concentration observed around the mean sea level indicated the occurrence at preferential locations. The most significant net change across the beach occurs between the mean sea level and mean-high-water neap which corroborates with the profile mobility pattern. The seasonal variability of the bar morphology is moderately related to the seasonally driven changes in storm and wave regime forcings. However, a distinct relationship may be inhibited by the complex combination of forcing-, relaxation time- and feedback-dominated response. This work conducted from bi-annual LiDAR surveys has provided an unprecedented insight into the complex spatial organization of intertidal bars as well as their variability in time from seasonal to annual scale.
1. Introduction
Meso-and macro-tidal sandy beaches with low to moderate wave energy are commonly characterized by the presence of intertidal bars and troughs known as “ridge and runnel topography”, ‘low amplitude ridges”, or “multiple inter-tidal bars” [1]. Multiple intertidal bars occur in groups of two to six that are parallel to the coast. They occur mostly between the mean tidal levels and rarely exceed 1 m high and 100 m wide [2]. The intertidal gradient of bar–trough beaches is usually very gentle (<0.015) while the seaward slopes of the bars can be more than three times steeper. Bars promote beach stability by protecting the upper-beach from wave erosion [3] and also constitute sediment storage for beach progradation [4].
Bars and troughs are permanent or semi-permanent features on most beaches (e.g., [2,5,6]). Although macro-tidal multi-barred beaches have been well-studied over recent decades, the investigation of long-term variability in bar morphodynamics has been little documented due to the limitation of topographic monitoring rarely extending up to three years (e.g., [5,7,8]). The development of intertidal bars is conditioned by time-varying interactions of forcing factors between tides and incident wave energy level and variability. Ref. [9] found that surf zone wave processes play a primary role in onshore migration of the intertidal bars. Also, longshore sediment transport processes can be significant particularly within troughs due to longshore currents over the tidal cycle [10]. The intertidal bar–trough system has a capacity for self-organization and may experience strong morphodynamic feedback on forcing factor condition as well as relaxation time effects [11]. In such a system, the correlation between hydrodynamic forcing and morphological response is weak, while the morphological evolution arises from the internal dynamics of the system including cross- and alongshore process-response function of time. Therefore, multiple intertidal bar–trough features must ideally be considered as a 3D morphological system as recently emphasized by [8].
Investigation of the 3D bar—trough dynamics and evolution is a challenge due to the logistics of acquiring repeated high-resolution measurements over a large spatial area (>1 km) and various temporal scales (season to decades). Most studies have focused on a single beach profile (survey) or at most, a few of such profiles spacing in the order of 0.5 to 1 km, and are commonly carried out several times a year. These do not allow for the detection of the spatio-temporal 3D behavior of a bar–trough system, and in particular to assess the longshore bar variability. The high-resolution airborne LiDAR (light detection and ranging) system has been successfully applied in coastal monitoring [12] and makes possible the identification of the in detail spatio-temporal dynamics of the 3D intertidal bar morphology [8]. This study relies on a unique and exceptional dataset of bi-annual LiDAR surveys (typically in spring and autumn seasons) carried out over a seven-year time span along the Belgian coast. The aim of this paper is to investigate the morphodynamics of multiple intertidal bars from seasonal (six months) to long-term (one year) and on a large scale (>1 km). Also, the variability of bar morphometric characteristics and their relationships are examined to gain insight into bar morphology.
2. Study Site
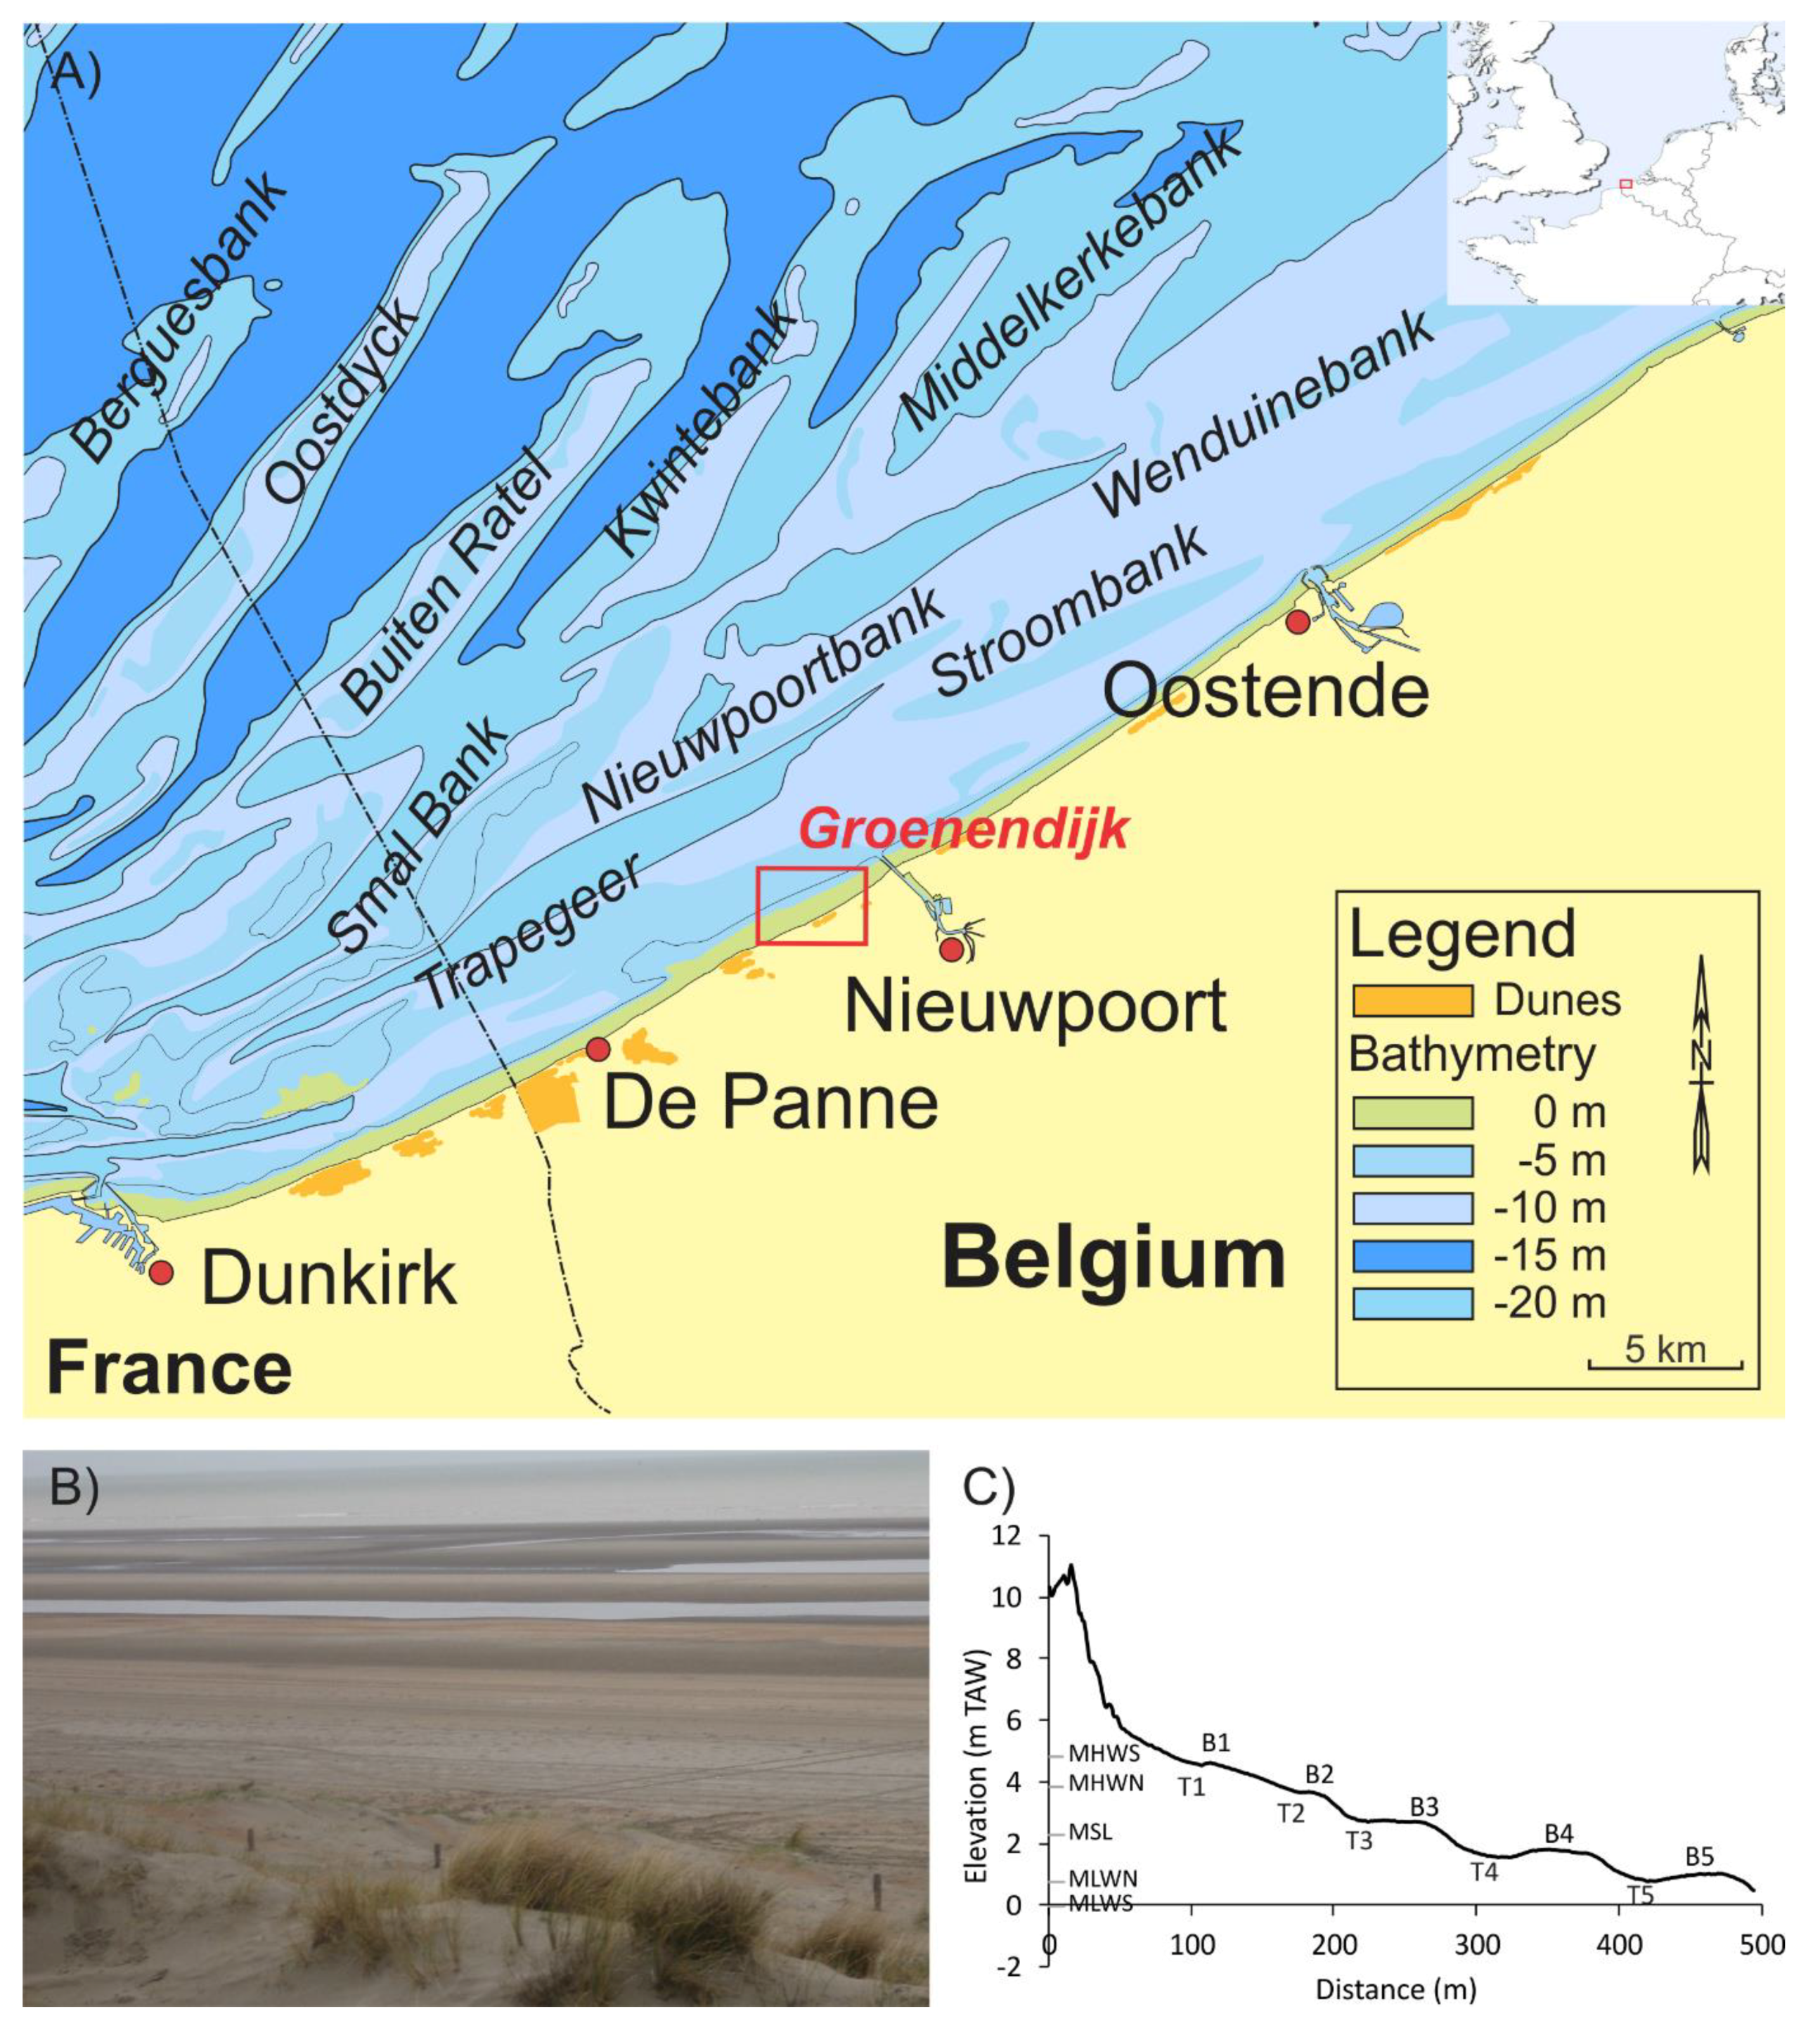
Groenendijk beach is part of the main multi-barred beach that runs from the north of France to the western part of the Belgian coast and fronts the North Sea basin (Figure 1). The subtidal zone of this region is characterized by numerous shallow sandbanks. The beach is oriented SW–NE and about 500 m wide. It is typically characterized by an intertidal bar–trough system parallel to the coast. A system consists of four to five bars from which the first crest is usually located offshore of the first inner troughs (Figure 1). The shoreface also displays a subtidal bar. The beach is generally concave with a gentle intertidal gradient ranging from 0.5° to 0.75°. Perpendicular drainage/rip channels are sometimes present, segmenting the bar–trough system. The intertidal beach is composed of fine to medium and well-sorted sand with a median diameter (D50) of 200 μm. The intertidal bars are directly backed by well-developed foredunes approximately 10 m high above TAW (Belgium Ordnance Datum corresponding to the low spring tide in Ostend). The dune and beach have propagated at a rate of about 17 m3/m/year over the last decade [13].
Groenendijk beach is characterized by a macro-tidal, semi-diurnal tidal regime with a small symmetry. The mean tidal range is between 3.5 m during neap and 5 m during spring tide resulting in strong tidal currents of approximately 1 m/s in the nearshore area [14]. Tidal currents generally flow in an NE direction during the flood following the coastal outline and in an SW direction during the ebb. The sediment transport along the coast is primarily wave-driven toward the east and is estimated to be 200,000 m3/year [15].
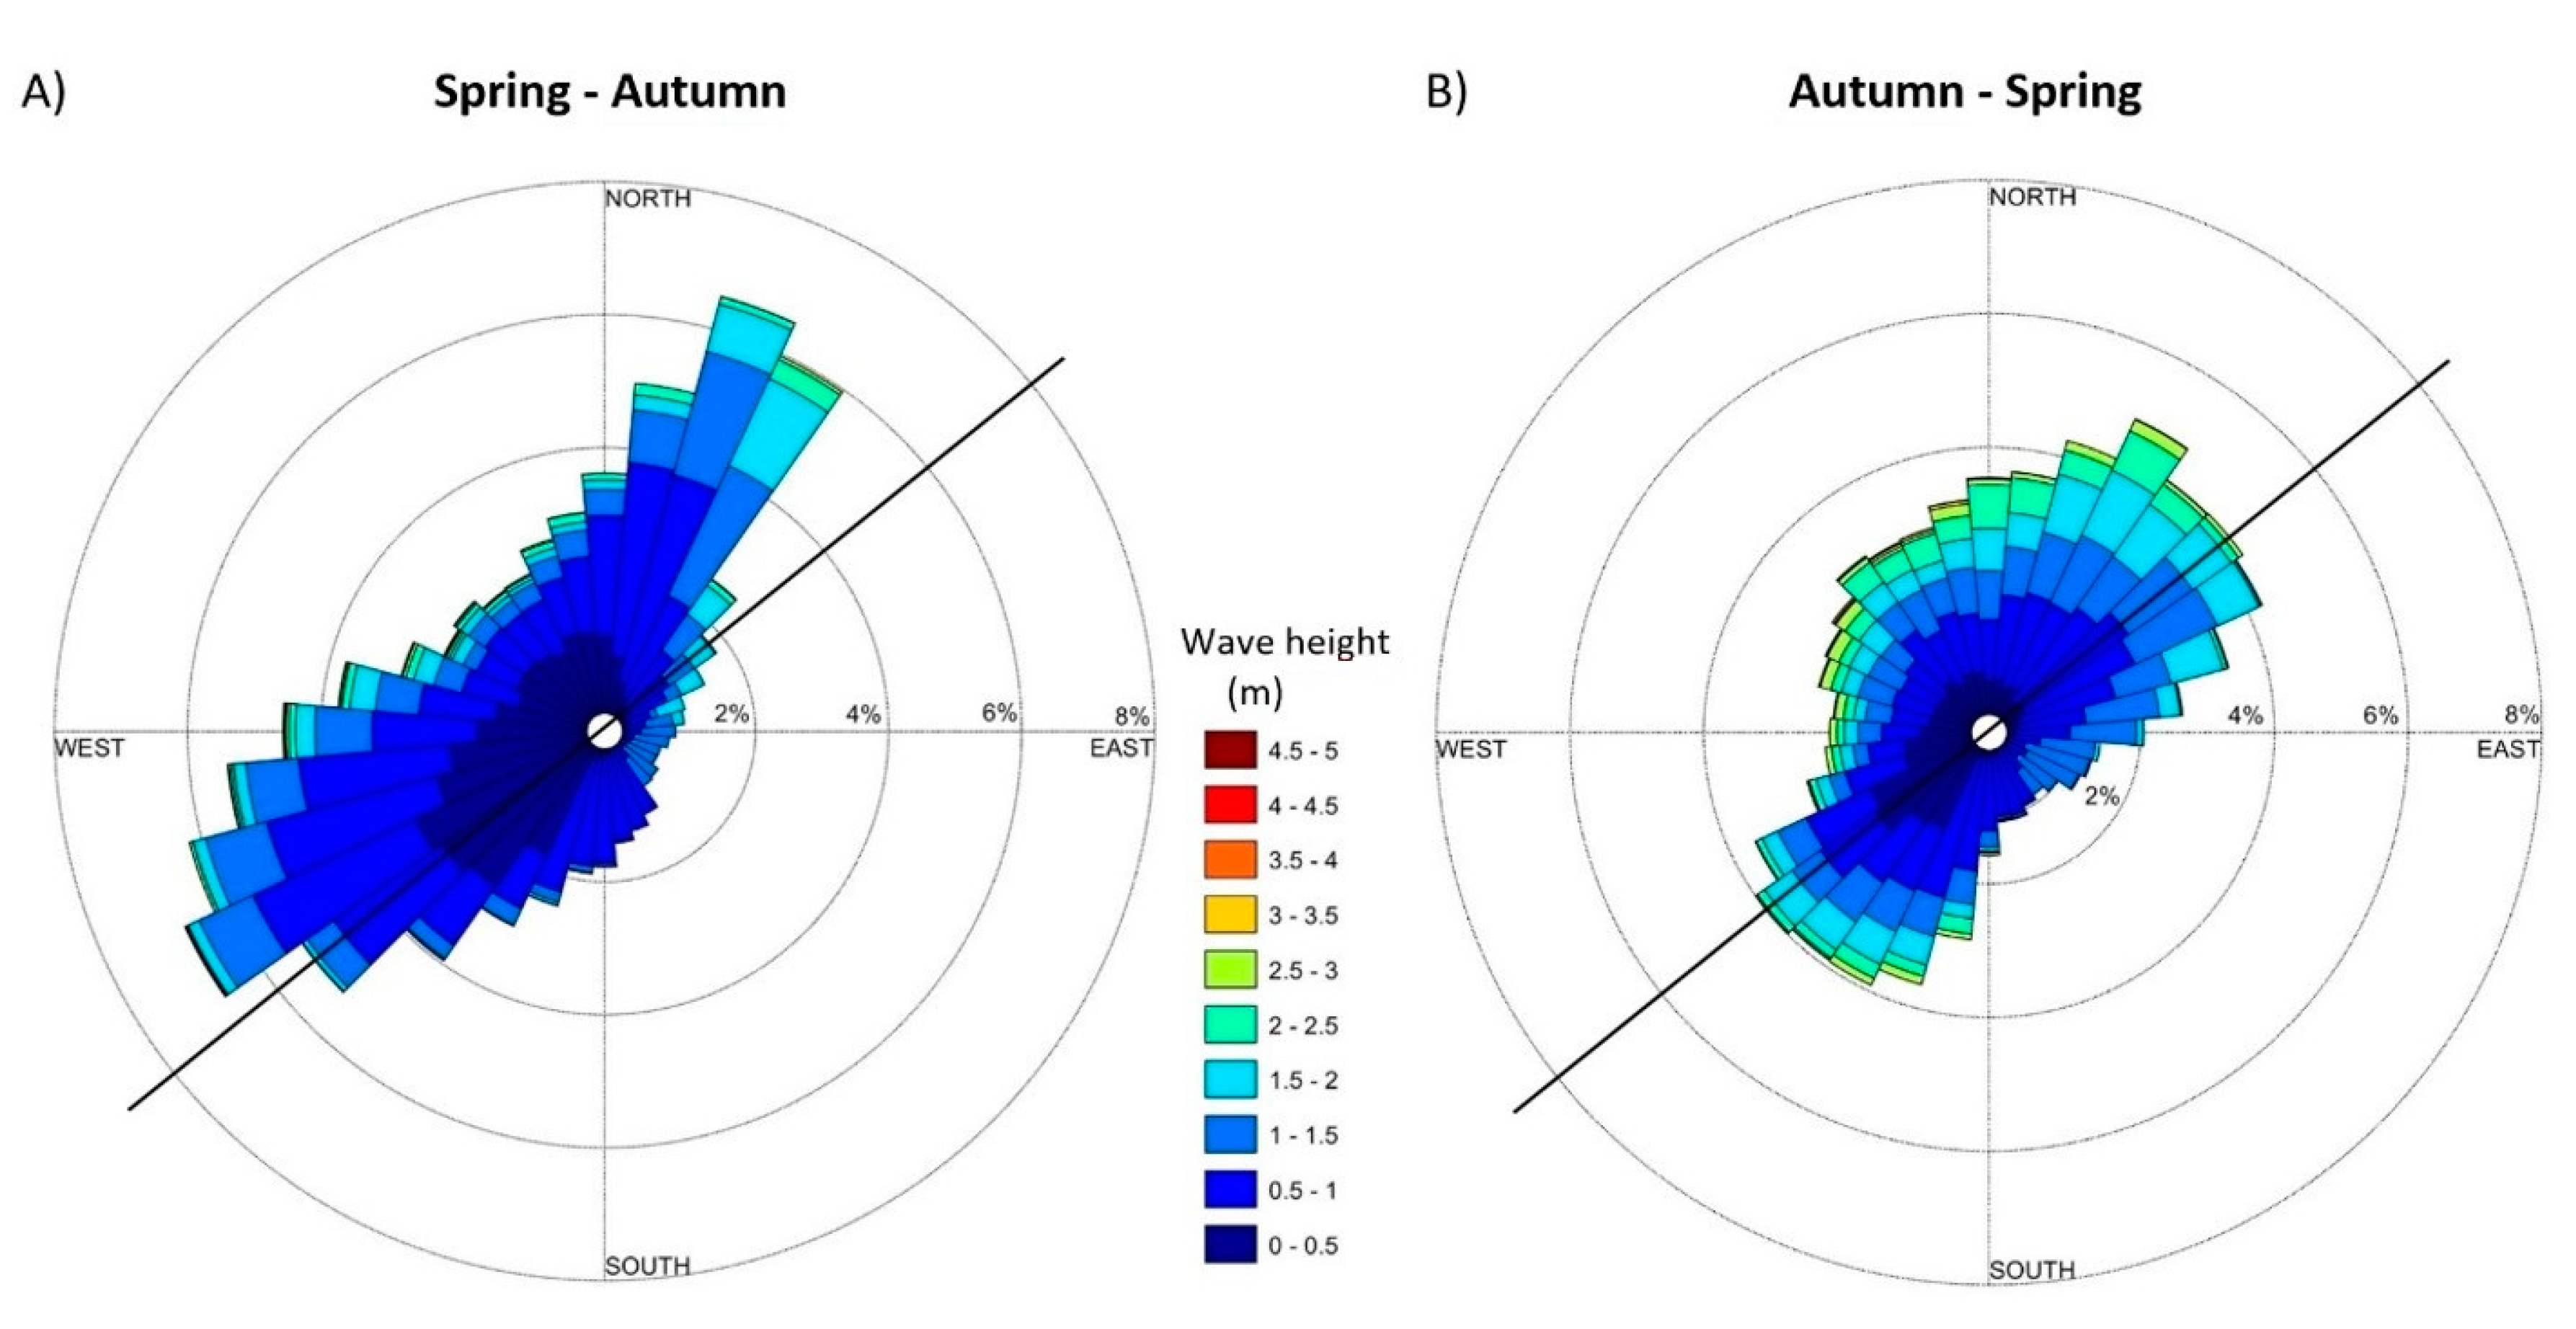
The coast is subject to moderate wave energetic conditions (<1.5 m for at least 80% of the time). Offshore wave regime recorded 20 km from the study site indicate a clear seasonality (Figure 2). In general, waves come predominantly from the SW and NNE directions, however, they are more spread during autumn to spring. Monthly average significant wave height is 0.8 m from spring to autumn, while it reaches 1.1 m from autumn to spring. The mean wave period is about 3.5 to 4.5 s. Waves are typically short-crested due to the shallow water depth and the short fetch. Storms are recorded at least once a year during the winter season [14].
3. Material and Methods
3.1. Multi-Temporal LiDAR Dataset Collection and Processing
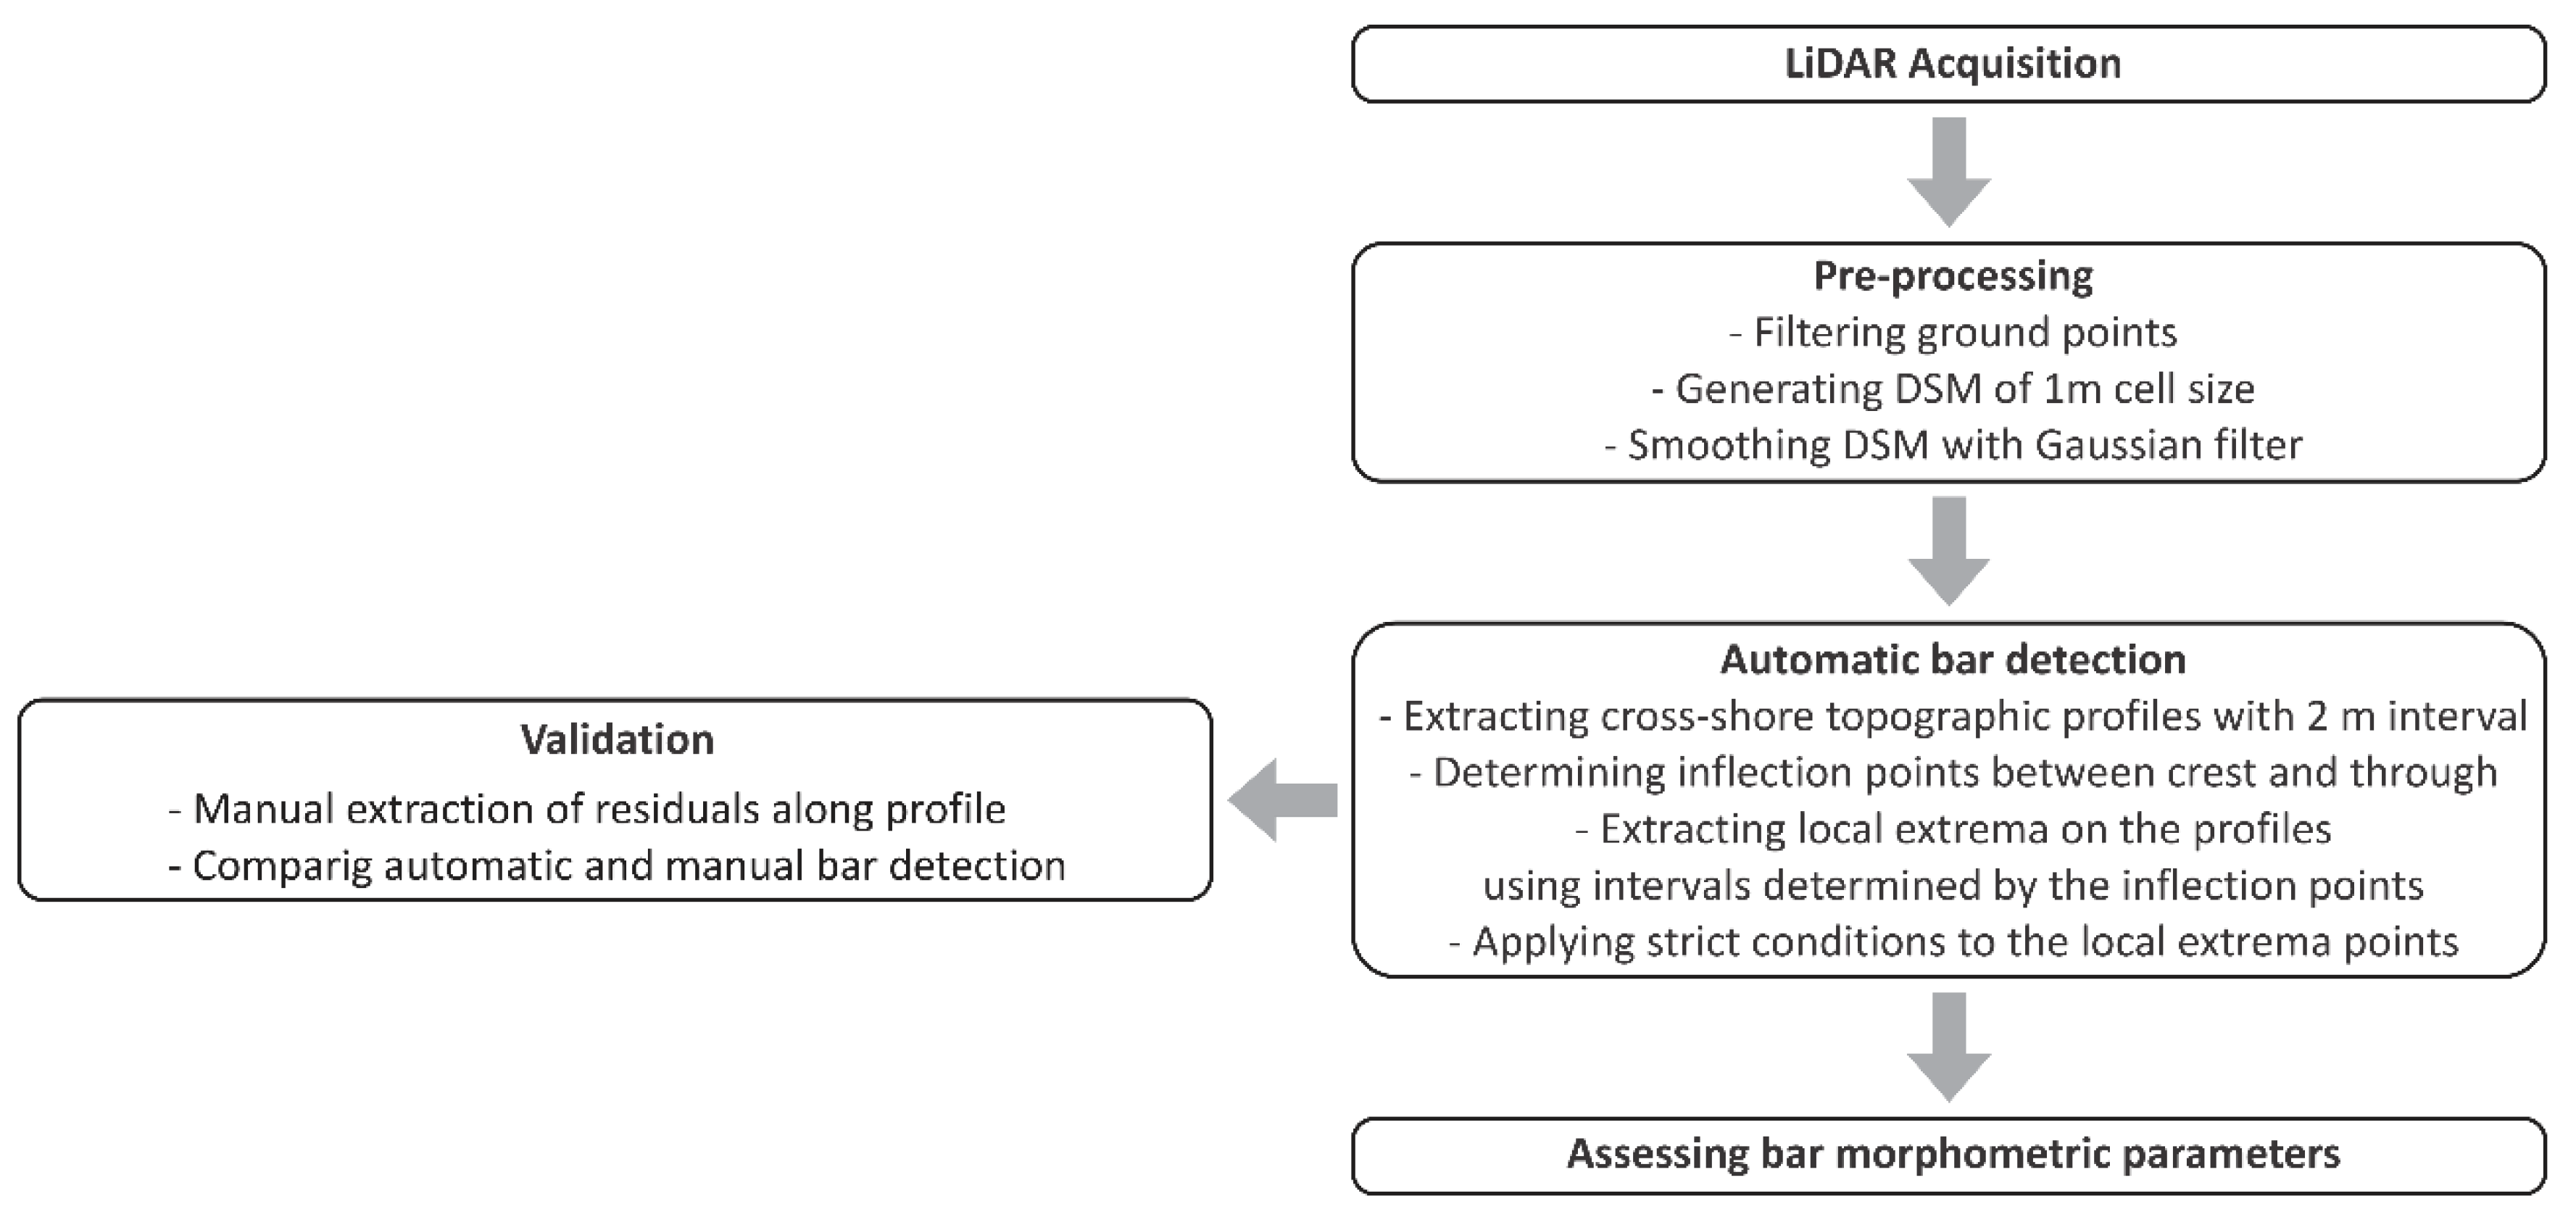
This study is based on a time series of bi-annual LiDAR survey data covering seven years from 2013 to 2019 (Table 1). Seasonal surveys are typically carried out in spring (around April to May) and autumn (around October to November). The dataset consists of 3D point clouds (x, y, z) ranging from one to five points per m2. The error (root-mean-square) for the survey acquisitions ranges from 0.018 to 0.031 m in x, y, z. The surveys were commissioned by the Coastal Division of the Flemish Authority, as a part of a coastal monitoring program.
For every survey, point clouds were processed, filtered, and classified to provide the ground point data (Figure 3). These were used to derive digital surface models (DSM) of 1 m cell size. Then they were smoothed by applying a two-dimensional Gaussian filter of order zero and kernel standard deviation of two meters in order to assess intertidal bars on a larger scale and not take into account the potential influence of small effects. The size of every DSM was approximately 3.2 km long and up to 0.4 km wide with the landward margin located around 15 m seaward from the foredune toe and the seaward margin of 0.5 m TAW.
3.2. Bar Detection Techniques and Analysis
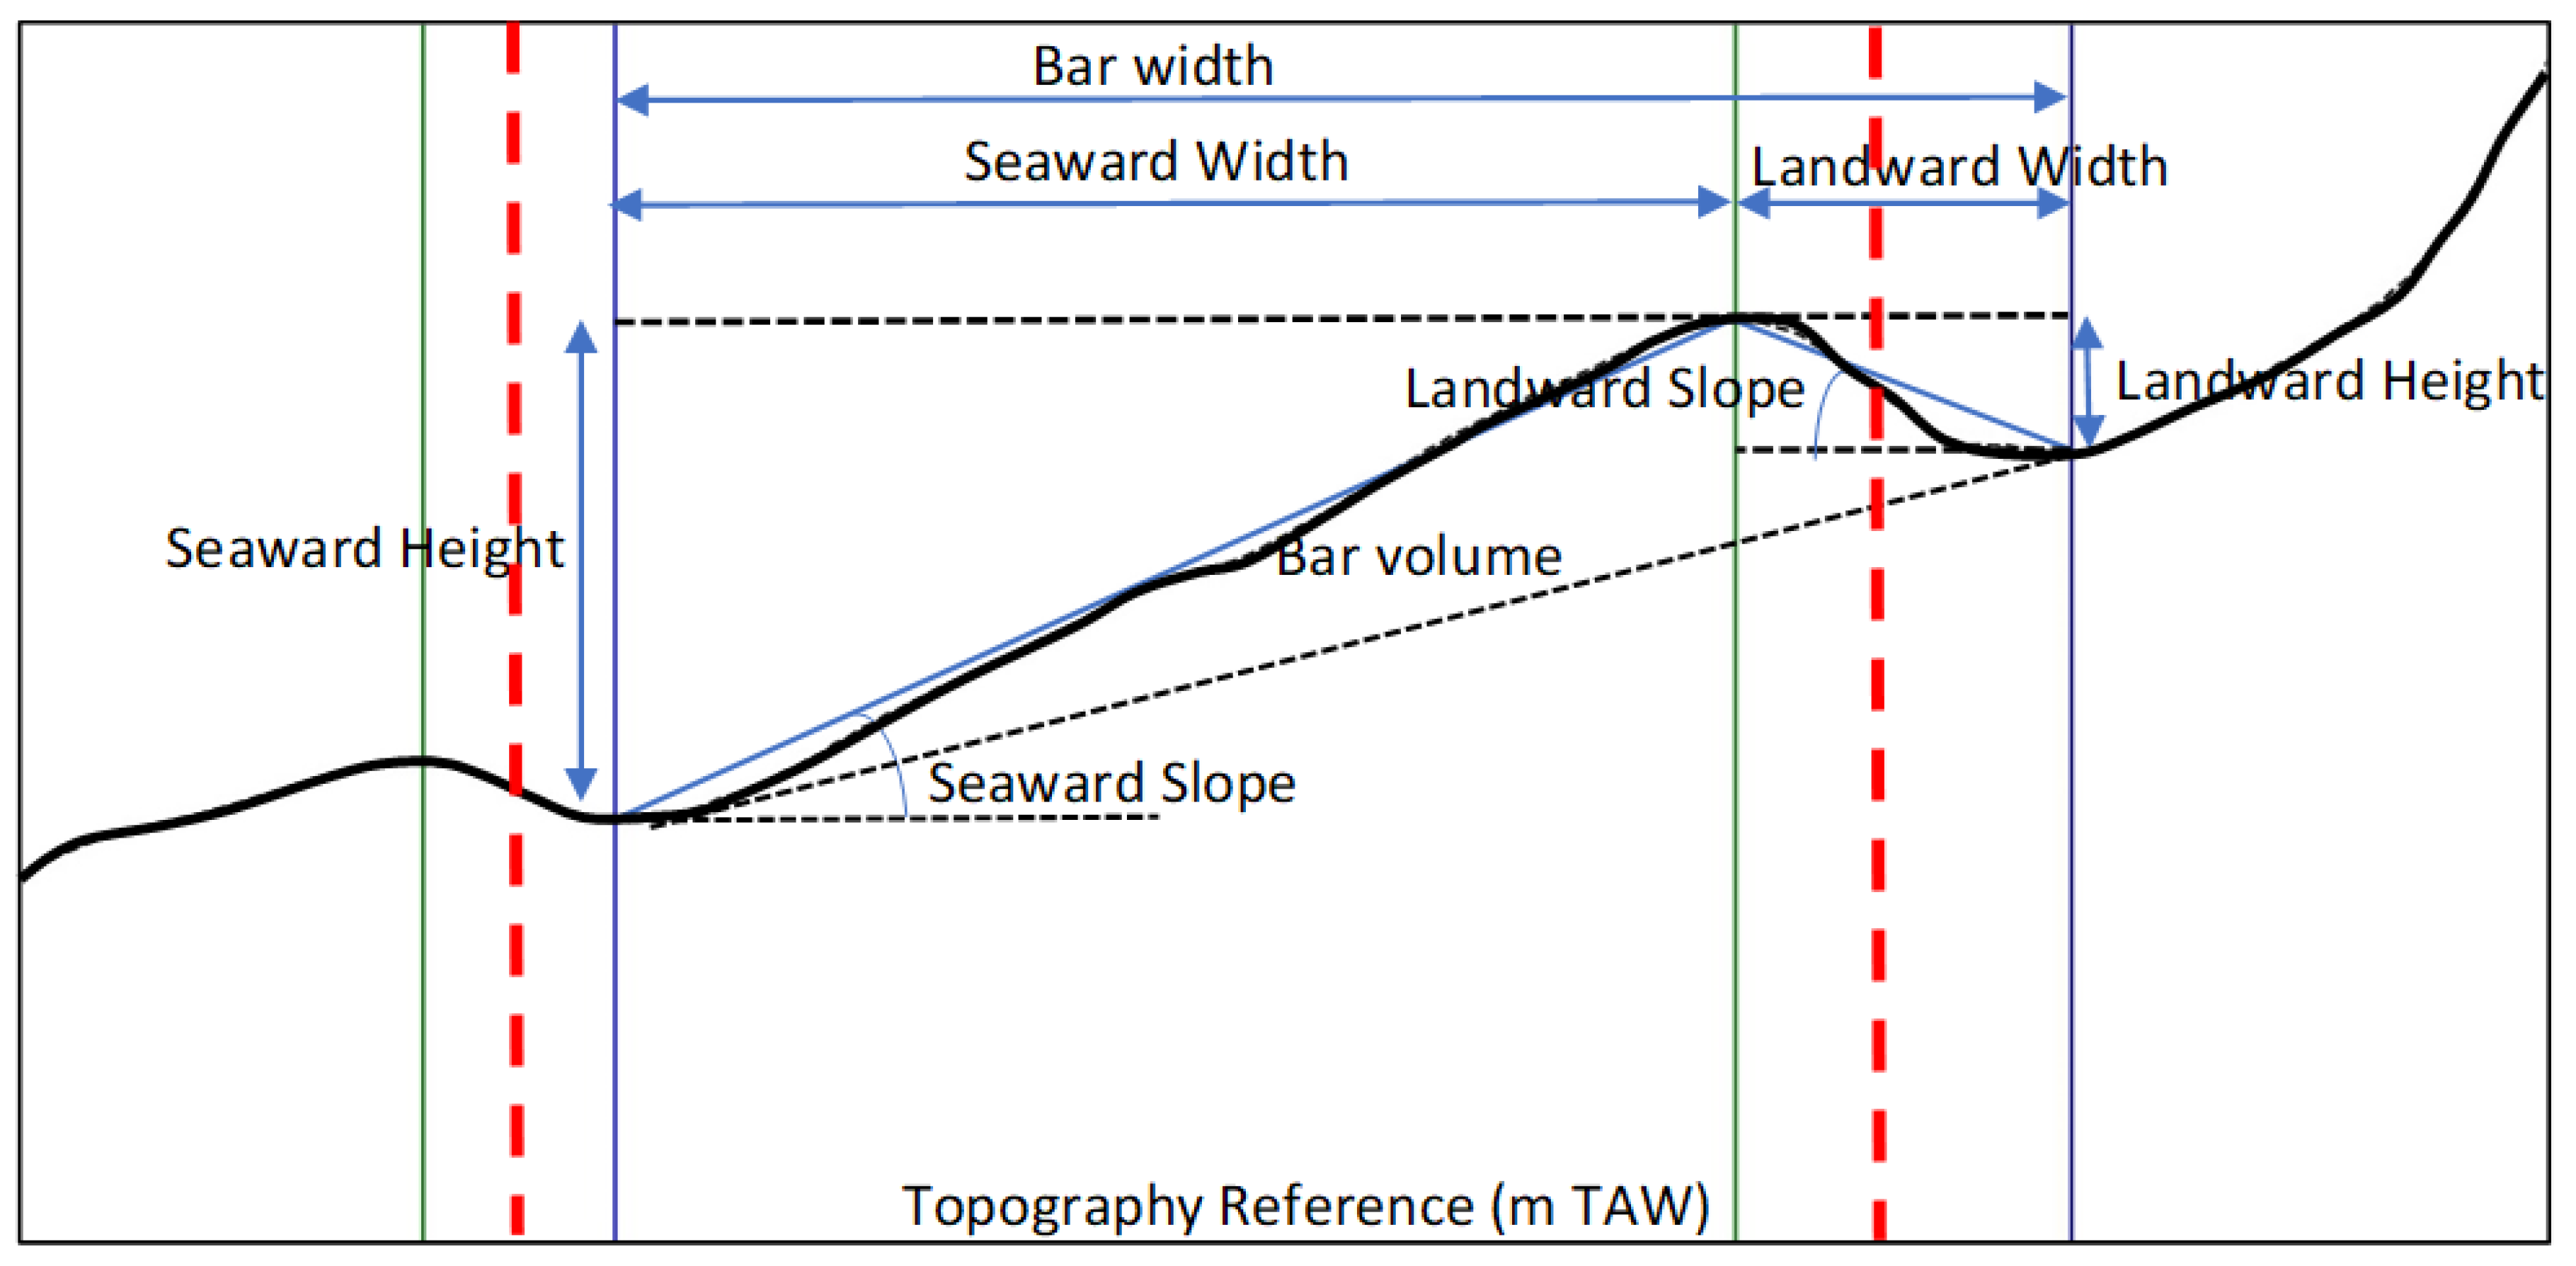
The 3D morphology and variability of bars were investigated between surveys. The detection of the bar location was automatized by developing an algorithm written in Python programming language (Figure 3). A series of cross-shore profiles were extracted from the smoothed DSM with an alongshore inter-distance of 2 m between subsequent profiles The crest and trough positions of the bars were determined from the profiles by detecting each inflection point (i.e., transition between crest and trough) and then by extracting the local maxima and minima points along the beach slope (Figure 4). Two strict conditions were further applied to avoid tagging irrelevant points. First, the absolute distance and the elevation difference between the crest and trough points within the same inflection must be at least 5 and 0.10 m, respectively. Second, a neighborhood filtering with a window dimension of 20 × 10 m was used to remove isolated points. Most of the drainage channels were oriented parallel to the cross-shore profiles. Thus, their presence was not identified by the local extrema points, while the bars continued to be detected on each side of the channels. In the case of bisected channels, the bars were not considered continuous and were excluded from the analysis. Extracted bars were then imported into a geographic information system software (ESRI ArcGIS) in order to be visualized and to be assessed by overlapping on their respective DSM. A comparison between an automatic and manual bar detection was carried out along the same cross-shore profile for each survey. The manual detection consisted of extracting a profile from DSMs and then fitting a second-order polynomial curve to the profile in order to determine the maxima and mina residuals [2]. The error of the automatic detection was 4.37 and 0.11 m horizontally and vertically, respectively. Finally, the position and elevation of the bars were used to determine parameters such as number (total number of detected features in the study site), height, seaward slope, width, symmetry (i.e., bar width divided by landward bar width), orientation, and volume of the bar (Figure 4).
3.3. Hydrodynamic Forcings
Subhourly significant wave height (Hs) and direction records were collected from the Kwintebank buoy, situated 20 km from the study site. In addition, five-minute water level records were acquired from Nieuwpoort tide gauge (1.4 km from the study site). A storm was defined as an event characterized by a water level and 95% Hs exceeding 5.4 (TAW) and 1.5 m, respectively.
Hydrodynamic conditions over the survey periods are presented in Table 2. It indicates that external forcings are characterized by a seasonal variability with alternance of low and high energetic conditions. A storm exceeding a water level of 4.5 m TAW, usually associated with high waves, occurs generally at least once per year, especially between November and January. The seasons 13S–13A, 16A–17S, and 17A–18S were very energetic with the occurrence of three storm events, while no events were recorded in 13A–14S, 15S–15A, 16S–16A, 17S–17A, and 18S–18A. Thus, it seems that more storms and higher waves are likely to occur in autumn to spring.
4. Results
4.1. Bar Morphodynamics
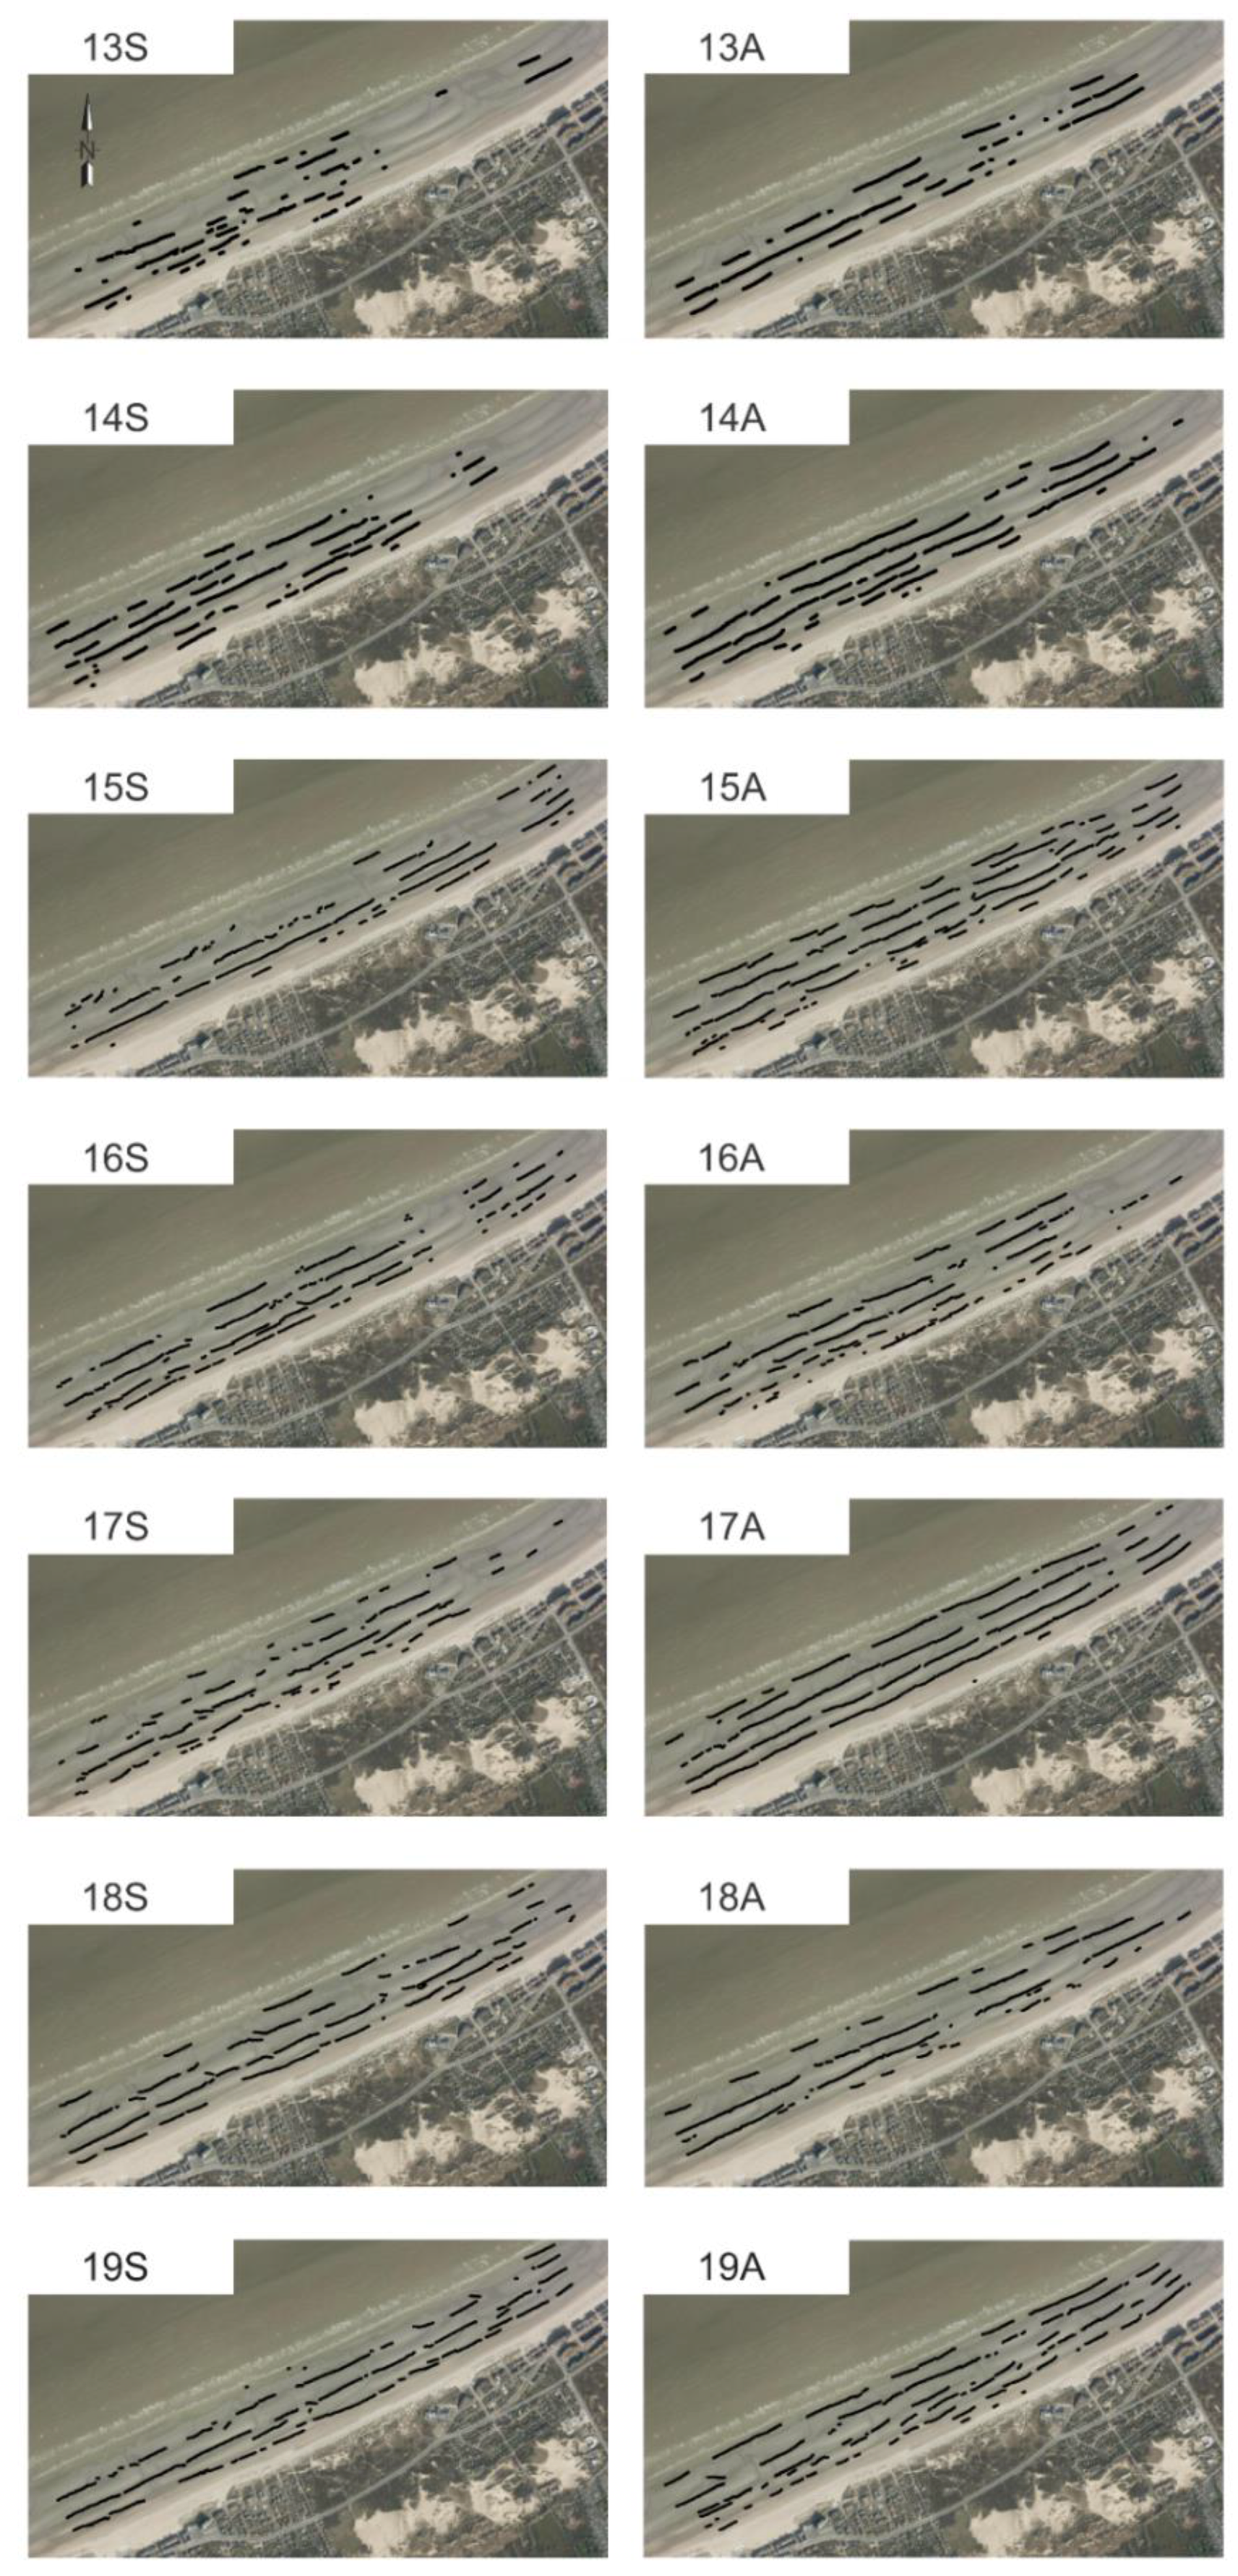
The detected bars from the seasonal LiDAR surveys are displayed in Figure 5, which provide a number of insights on large-scale bar morphology over time. These features are prominent on the intertidal beach and their number typically ranges from three to six in cross-shore dimension. The subtidal bar cannot be observed in the LiDAR dataset. The average annual number of bars, corresponding to the total detected bars in the study site is 68 (Table 3). The larger number of bars in spring suggests that the amount and probably the fragmentation of the features by channels are higher than in autumn. Bars are distributed fairly evenly along the beach (except on 29 April 2013 when they were only concentrated southwest of the study site), while they seem to be closer on the upper-intertidal beach. The individual bars can be followed over large distances and be either continuous or laterally fragmented with an alongshore length ranging from 25 to 880 m. Their fragmentation is due to the presence of few modest tidal drainage channels and/or local beach topographic ruptures evolving over the monitoring period. The bars are parallel to the coastline dominated by an orientation of 64° relative to N. They are characterized by a mean height of 1.1 m with a width of 84 m and a seaward slope around 1.1°. The mean volume of a bar is generally below 14 m3/m. In general, the bar shape is asymmetric with a trend to skew toward the land, so that the landward slope is steeper than the seaward slope.
The bar position is dynamic and complex between consecutive surveys, exhibiting a large spatial and temporal variability. Although the bar morphology detected about six months apart displays some similarity and is generally characterized by an insignificant difference between spring and autumn, it is only with difficulty that the development of some individual bars can be followed between consecutive surveys. This thus precludes the following of individual bars to investigate their migration direction and rate.
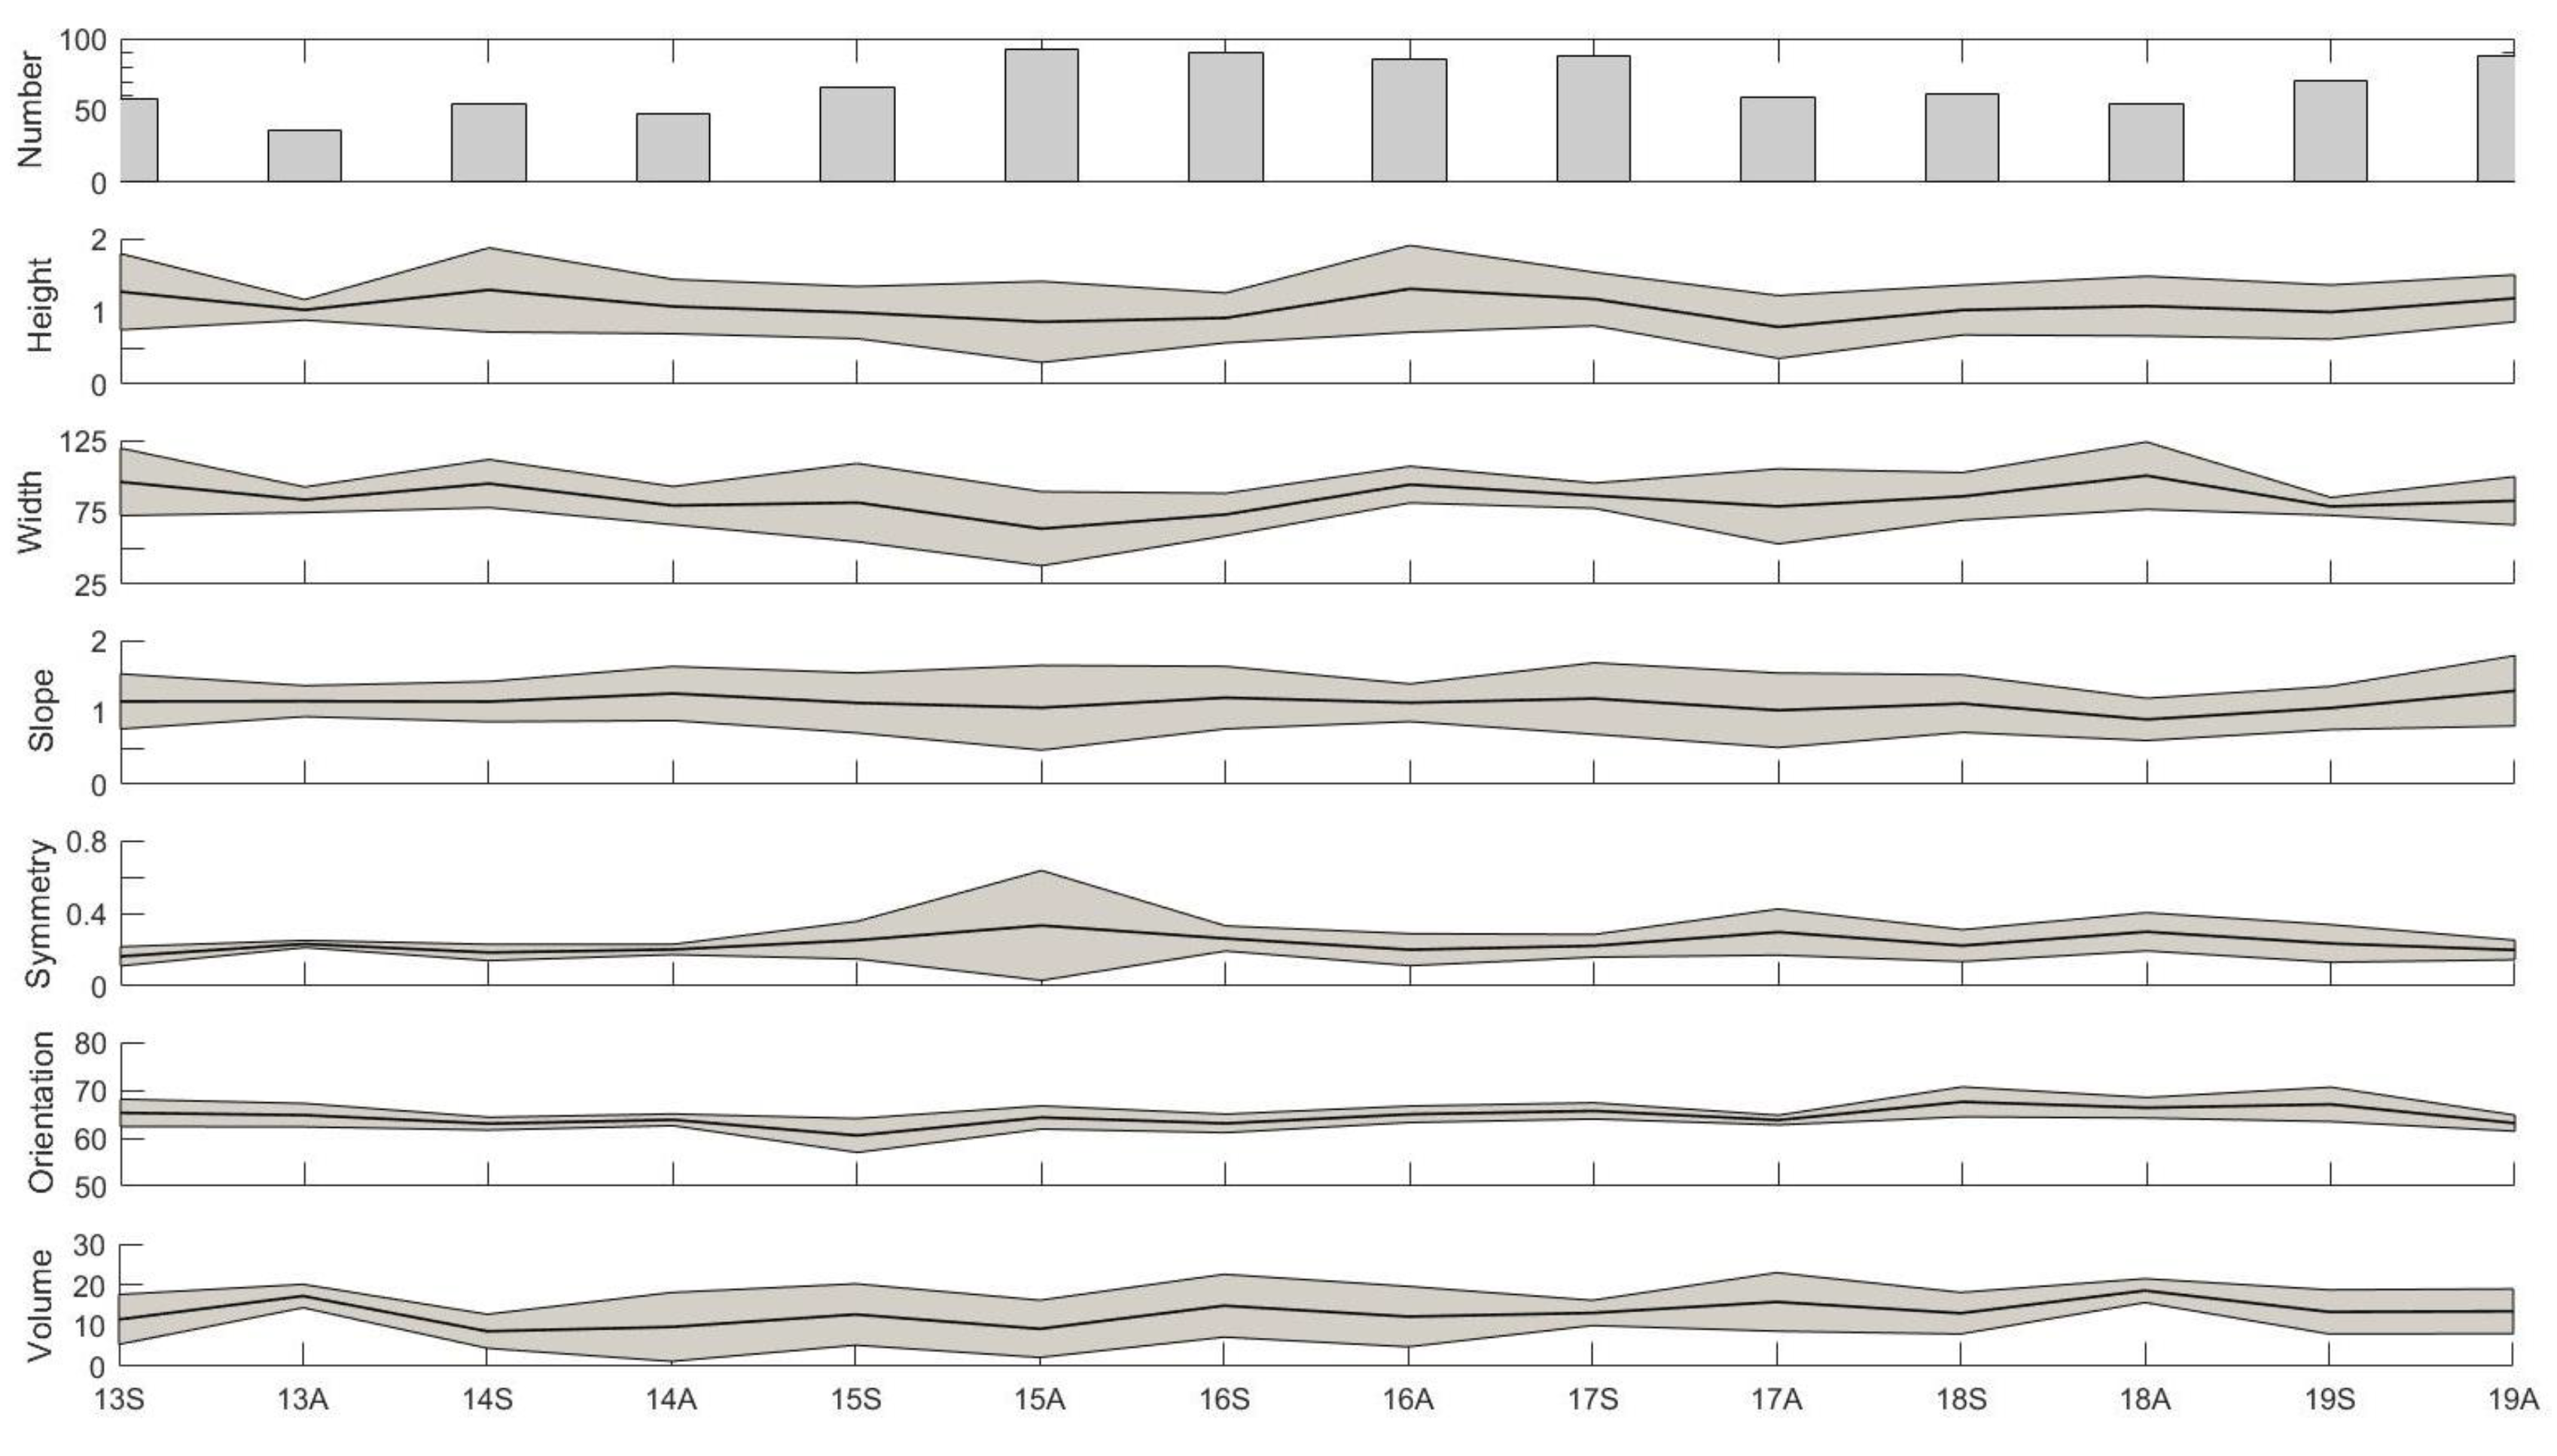
Figure 6 shows the temporal variability of the morphometric parameters in the entire study site. The number of bars (i.e., total detected features) and their characteristics display some variations over the monitoring period. A low number of bars (<55) was detected from 13A to 14S, and 18A, while it exceeded 90 bars in 15A and 16S. The height and width pattern of the bars generally fluctuated similarly over time with a maximum in 16A, while low values were recorded in 15A and 17A. Changes in height and width were in the order of 0.2 and 19, m respectively. A maximum difference was 0.9 m high and 24 m wide. Regarding the bar volume, the largest intertidal bars were observed in 18A with a mean of 18 m3/m, and they were two times lower in 14A. However, volumetric changes between consecutive surveys was in general relatively low (3 m3/m). The bar orientation parallel to the coast and positive symmetry stayed relatively constant over time. These results suggest that some seasonal variability in bar dimensions and shape occurs between S and A, but no long-term trend in bar morphology is obvious.
4.2. Bar Location and Distribution
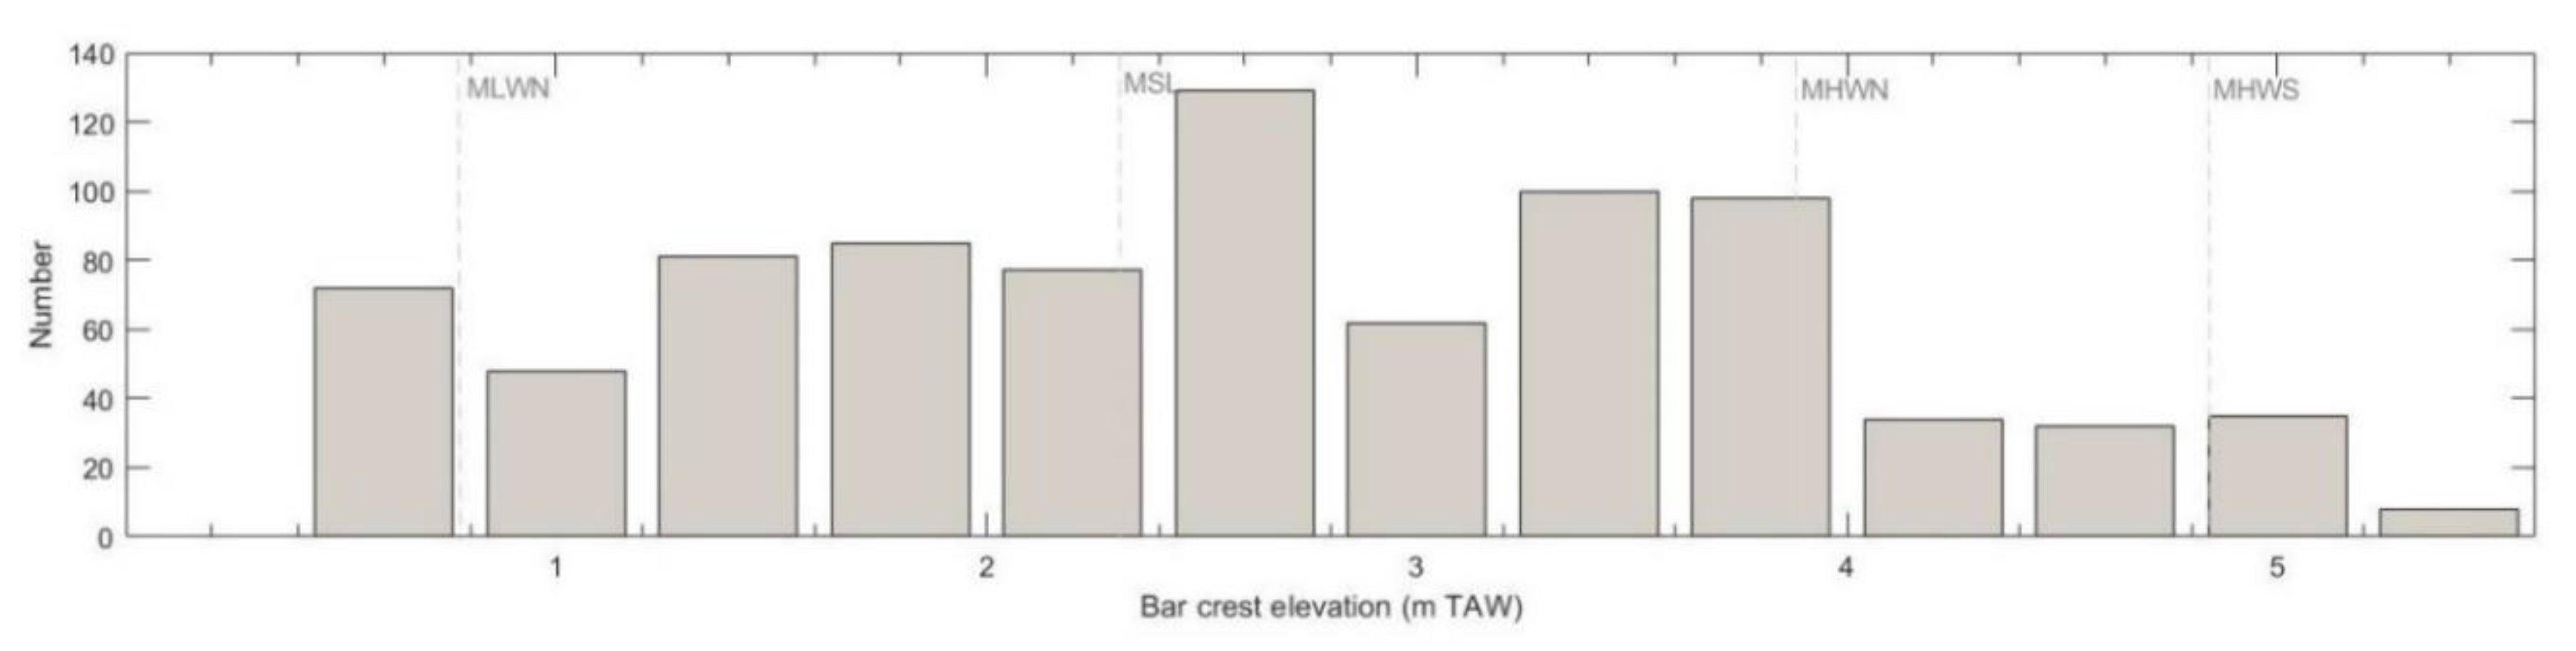
To explore the cross-shore variation in the bar morphology, the detected features were grouped on the basis of their crest elevation relative to TAW in 0.4 m wide classes. For each crest elevation class, the number of bars was analyzed. The bar height was also plotted versus the bar crest elevation to assess whether the bar crest elevation varies systematically across the intertidal beach. The bars are consistently present across the intertidal beach with a limited number above MHWN (Figure 7). However, the largest concentration occurs around the MSL level suggesting that bar development is the greatest at the mid-tide position. Also, a cluster of a large number of bars takes place around 3.4 to 4.2 m TAW.
The mutual correlations between morphometric parameters characterizing the bar morphology are presented in Figure 8. The mean height of the bar was 1.8 m on the upper-intertidal beach above MHWS level and considerably less (0.2 m) on the lower part of the intertidal zone below MLWN level. It appears that there is a relatively diffuse and linear increase in the bar height trend toward the land (R2 = 0.57). Another positive correlation is found between the bar elevation and the seaward slope (R2 = 0.47), so that the inner bars located on the upper-intertidal beach are more likely to have a steeper seaward face. Indeed, the seaward slope of the bar depends on both the bar height as well as width in a such way that steep slopes tend to occur on high bars and/or narrow bars. Noteworthy, this relationship is also affected by the beach gradient since the upper-part is usually steeper with a concave shape (Figure 1C). Additionally, the symmetry of the features decreases toward the land, suggesting that the inner bars are more likely to be asymmetric and landward-skewed than the bars located on the lower part of the intertidal zone. As previously observed, the orientation of the bars across the beach is relatively constant and aligned with the coastline (63% of the time between 60° to 70° to N). Weak correlations are found between the bar crest elevation and width, or volume, suggesting the most pronounced features do not occur systematically on the upper-intertidal beach.
4.3. Cross-Shore Bar Variability
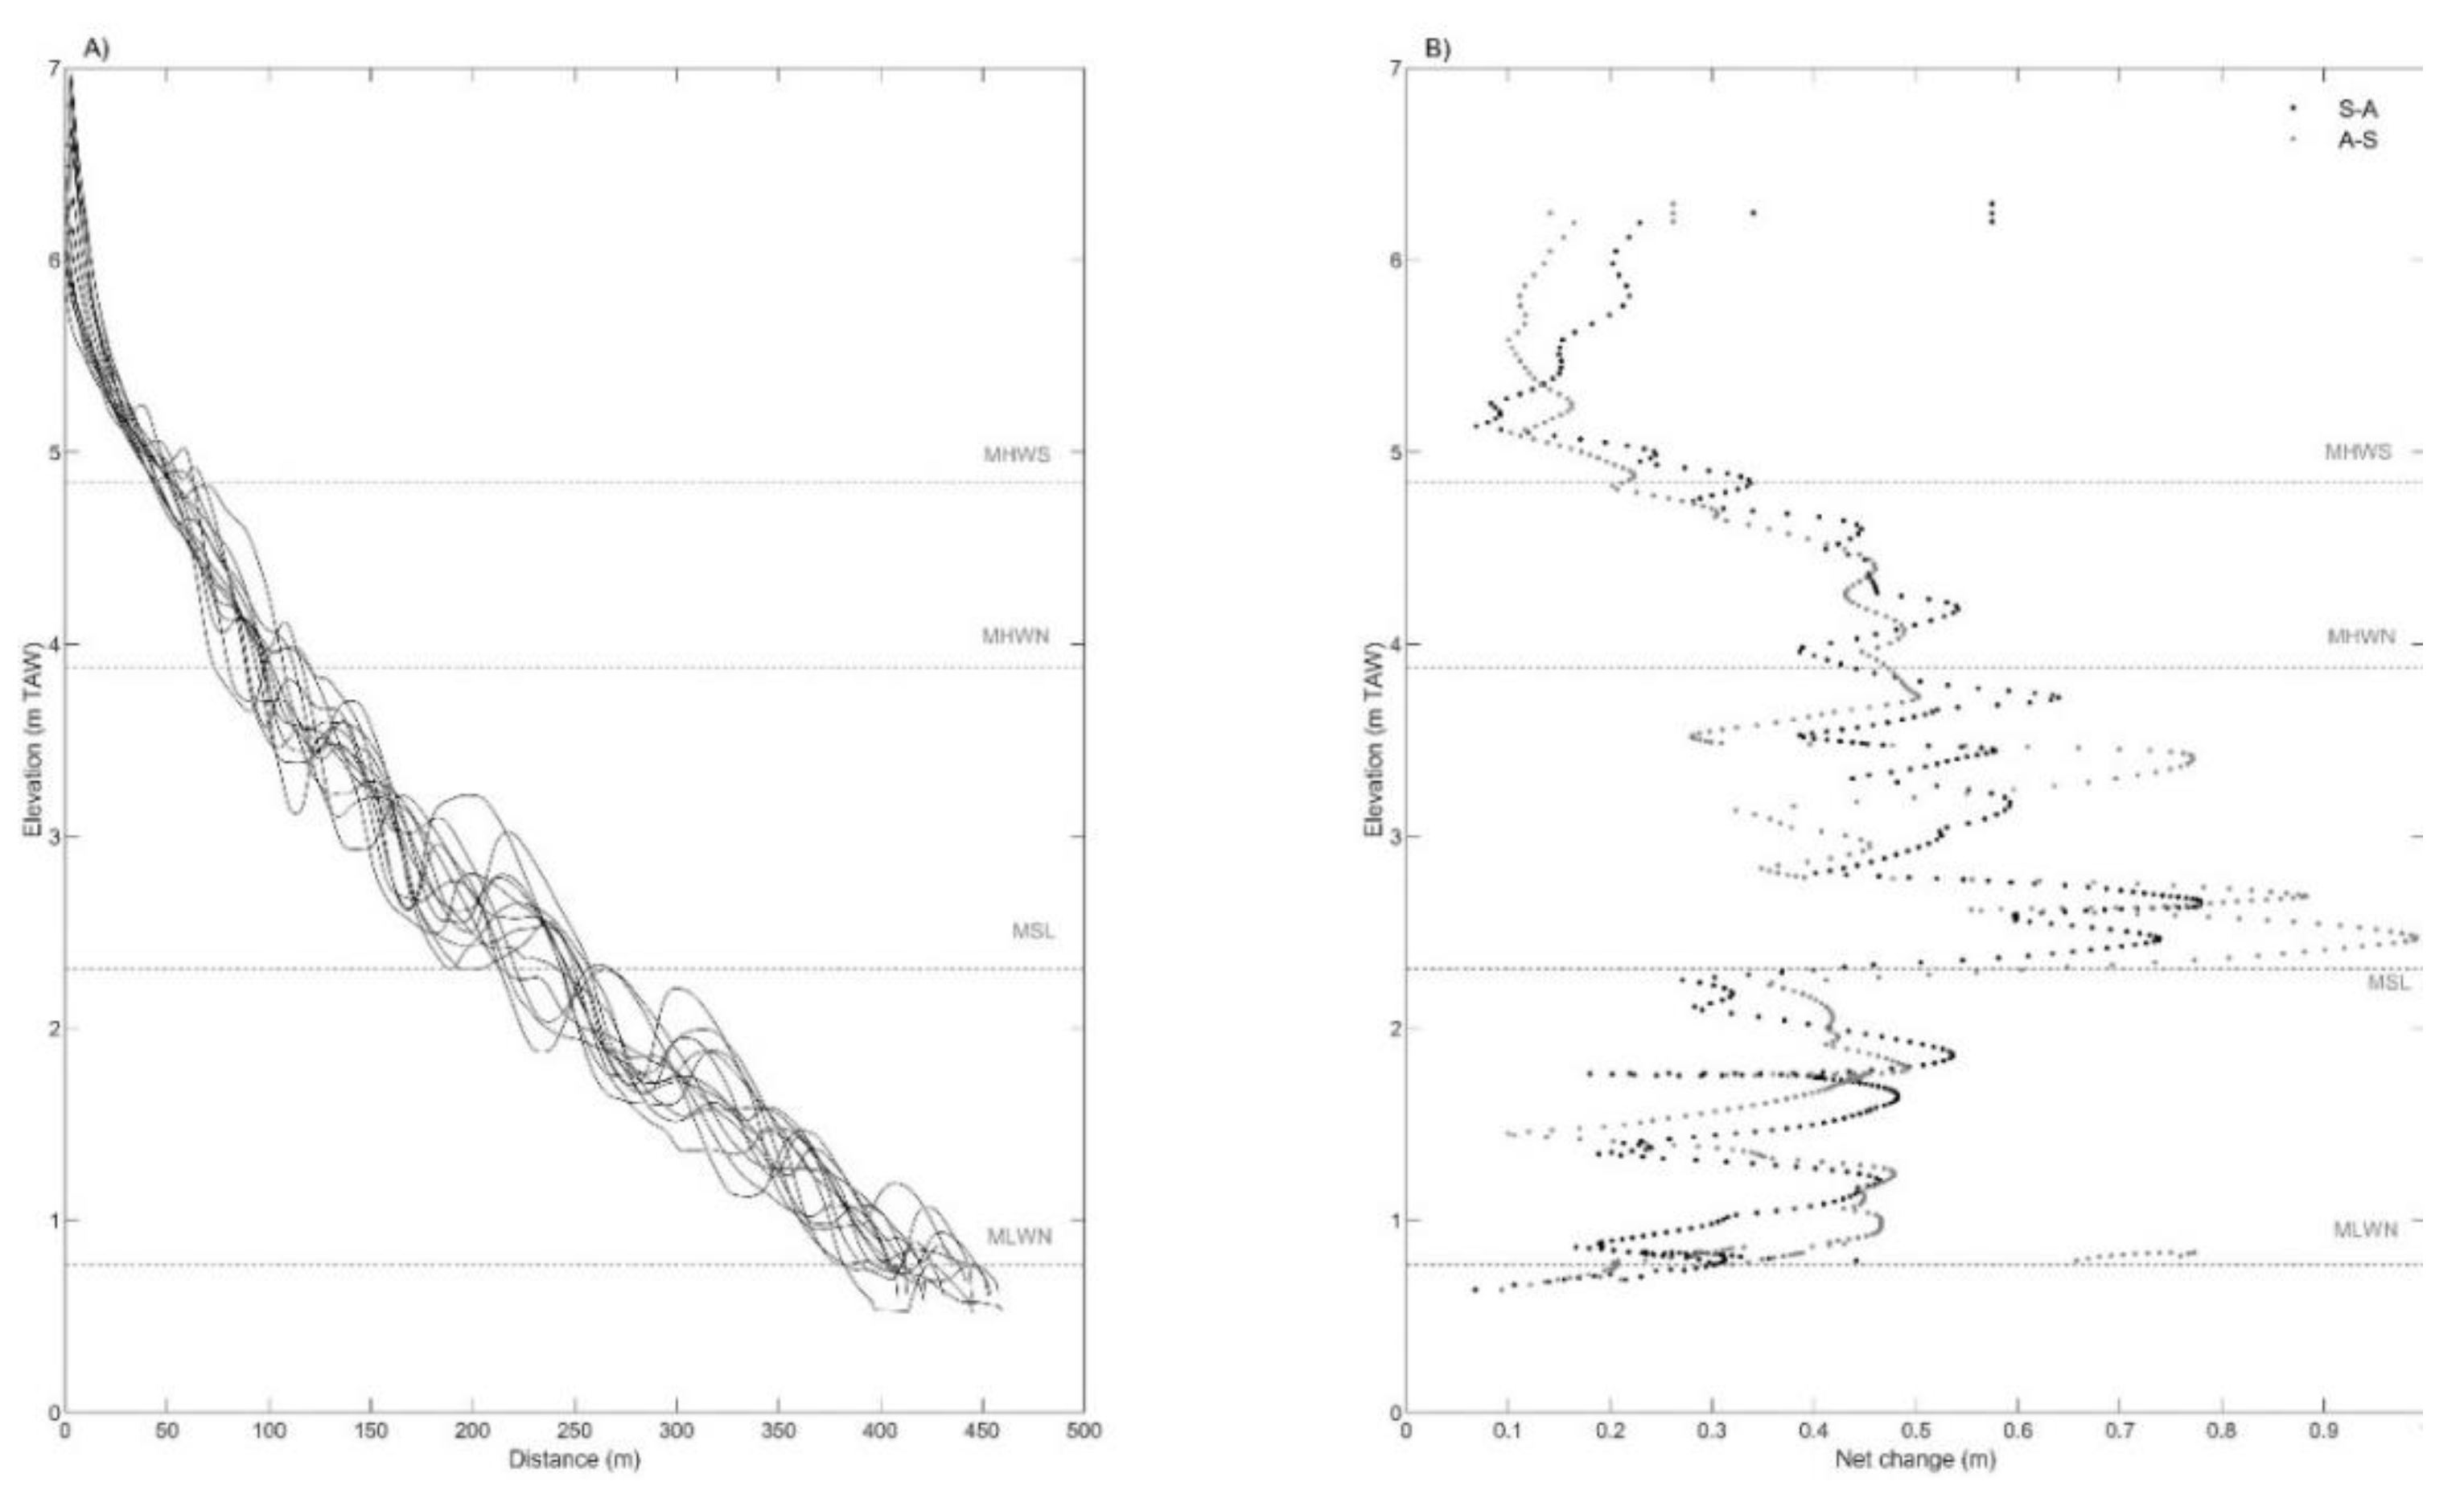
Cross-shore beach profiles extracted from all the bi-annual DSMs and maximum morphological change are presented in Figure 9. It confirms that most of the bars are located between MHWN and MLWN. The most pronounced bars are on either side of the MSL. Also, the results highlight an irregular saw-tooth pattern of beach profile variations generally characterized by high variability. The most significant net morphological change occurs just above MSL and remarkably also above MHWN. It contrasts with the low net change above MHWS. Net change reaches 1 m between A and S, while it was only relatively moderate between S and A (<0.77 m). This largest morphological variation is directly related to the storm observed from 15A to 16S.
5. Discussion
This study has investigated, for the first time, the intertidal bar morphodynamics on a macro-tidal beach using bi-annual LiDAR surveys covering seven years from 2013 to 2019. It emphasizes the utility of a LiDAR dataset as a source of information for high-resolution coastal morphological evolution from a seasonal to an annual scale. The analyses conducted from these dataset have provided further insights on the temporal and spatial variability of bar morphology.
5.1. Temporal and Spatial Variability in Bar Morphology
Intertidal bars appear to be permanent features of the intertidal beach at Groenendijk over the monitoring period of seven years. The bar system is also permanent on other sandy coasts bordering the North Sea, English Channel, and other coasts (e.g., [1,2]). Additionally, the semi-permanent nature of the bar system found in other studies (e.g., [6,7]) was accompanied with the flattening or local destruction of individual bars under high energy conditions. Nevertheless, the complete destruction of intertidal bars has never been observed anywhere. At Groenendijk, the bars were also observed on aerial photographs and field measurements back to the 1950s [16,17] and annually from 1990 to the present [13,18]. This is evidence that bars are permanent features of the intertidal beach along Groenendijk and not only on a time scale of years but decades.
Although the results of the detected bars indicate some seasonal variability between S and A, a systematic intra-annual variation is not observed. In that respect, the seasonal variability of the intertidal bars at Groenendijk is different from previous studies on macro-tidal beaches [2,7,19], where more and well-developed bars were generally present in summer than in winter. Ref. [7] reported that bar build-up and onshore migration occurred in summer, while bar destruction and lower migration rates were observed in winter. In our study, the bars are very active over the course of six months. Thus, the configuration of the bars was very dynamic with high mobility, which precluded the monitoring of the individual bars from season to season. The low coherence in bar configuration between consecutive surveys may be the result of important cross-shore and longshore bar migration rates and/or large re-arrangement of the bar properties as a whole system. For instance, the genesis of a new bar, the cross-shore migration of bars, filling of troughs, or the development of new tidal drainage channels could occur. Additionally, the degree of morphometric changes was rather similar from season to season (Figure 6), suggesting that the development of the bars is unlikely influenced by the long-term beach accretion. However, this might be controlled by the subtidal sandbank playing a role in wave dissipation as reported by [20]. Therefore, it may be concluded that the morphology of the multiple intertidal bar system as an entity is a permanent characteristic of the sandy beach at Groenendijk, however individual features are not permanent (i.e., static) but on the contrary experience a dynamic equilibrium [1].
Examinations of marine conditions were characterized by a seasonal variability with more storm events and higher waves in autumn to spring. The most energetic periods occurred in 13S–13A, 16A–17S, and 17A–18S when three storm events were reported. The first period corresponding to the extreme 2013/2014 winter storms in north-western Europe [21] and the second one in 16A–17S were related to a distinct reduction of bar height and width (Figure 5). In contrast, 17A–18S did not clearly induce a decrease in bar morphology. In general, low volumetric changes occurred, suggesting some local re-adjustment and sediment distribution. Notably, LiDAR data provides a snapshot of the beach morphology at one specific moment, and usually not just after a storm. This might hide a distinct relationship between bar morphology and external forcings since a post-storm recovery could have taken place. Periods of calm conditions in 13A–14S, 15S–15A, and 18S–18A were associated with an increase in the height and width of the bars. Nonetheless, a weak relationship is observed between the other calm periods in 15S–15A and 17S–17A and bar morphology change. Furthermore, the degree of coherence between hydrodynamic forcings and bar morphological response may be reduced by feedback-dominated processes (i.e., in the case of a self-organizational system). As pointed out by [11], bar behavior can only partly be explained by forcing factors and additional understanding of the role of reaction, relaxation time, and morphological feedback is required.
5.2. Tidal Level and Bar Morphology
The bars detected from the LiDAR dataset resulted in an extended insight into the spatial properties of bar morphology along the Groenendijk beach. They are parallel to the coastline and have an average height and width of 1.1 and 82 m, respectively. Our observations are congruent with previous studies reported in the literature [1,2,7]. Results of the cross-shore variation in the morphometric parameters of the intertidal bars demonstrate that they are rather evenly distributed across the intertidal beach with a peak of occurrence just above MSL. This is in accordance with previous studies [2,7,22] reporting that bars occurred most frequently between MLWN and MHWN levels. Additionally, the highest bars occur on the upper-intertidal beach, while a decrease in height is observed in the seaward direction (Figure 8). This contrasts with [19] who argued that the height of the intertidal bars increases seaward. Additional observations of the seaward decrease in bar height were made by [4,23]. The other relationships found between the morphometric bar parameters are: (1) the seaward slope of the bar is positively correlated to the bar elevation which partly depends on the bar shape as well as the overall slope of the intertidal beach; (2) inner bars tend to be asymmetric and skewed landward probably reflecting wave swash and surfing processes [8]; (3) the highest bars do not occur systematically on the upper-intertidal beach. The profile mobility pattern highlights a high net morphological change/variability of bars and in particular between MSL and MHWN while they are less active on the uppermost part of the intertidal beach. [4] reported that bars build up and become immobile between MHWN and MHWS as a result of large high-tide waves and low tidal translation, respectively. In addition, the net morphological changes for the profiles was high, reaching 1 m cross-shore after half a year (0.17 m/month) bar mobility. Recently, ref. [18] have found that the dissimilitude between elevations measured at the same position on a profile at Groenendijk was about 25% and 90% for measurements separated by a time lag of one month and three years, respectively. Thus, the profile elevations become uncorrelated for a time lag exceeding a few years. In addition, the authors have reported that the rapid increase of the dissimilitude between elevations over time is in agreement with the absence of observations of bars and troughs on the average profiles determined over a 19-year period. This would suggest the stochastic nature of the processes driving bar dynamics through time.
The mechanisms involved in the development of the intertidal bars are beyond the scope of this paper, however, previous studies have suggested that they originate through surf processes [2,9]. Tidal translation rates govern locally the duration of these processes but their efficiencies are controlled by the duration and also wave energy, which varies with tide-modulated water depths over the tidal cycle. Formation, behavior, evolution, and destabilization of multiple intertidal bars are still enigmatic. Thus, additional knowledge on the role of forcings, relaxation time, and feedback dominated response of bar morphology is required. Improving the understanding of the development of intertidal bar systems is crucial for coastal management since the evolution of the bars is a key factor governing beach state and sediment transport in the intertidal zone. Associating a longer LiDAR time series with short topographic and hydrodynamic monitoring would help to enhance our understanding of the morphodynamics of the intertidal bar system and its control on beach state and sediment transport.
6. Conclusions
This study has investigated, for the first time, the morphodynamics of multiple intertidal bars using bi-annual airborne LiDAR surveys covering seven years. The high-resolution and quality of the LiDAR dataset have allowed for the accurat detection and assessment of intertidal bars on a macro-tidal beach at Groenendijk. The results provide new insights into the characteristics and dynamics of an intertidal bar system on the time scale of seasons to years. The observations show that a morphology of an intertidal bar is permanently on the beach. Nonetheless, individual features are very dynamic and mobile between surveys every half-year. Therefore, this may result in important cross-shore and longshore bar migration rates and/or a large re-arrangement of the bar properties as a whole system.
The bars are usually parallel to the coast and rather evenly distributed across the intertidal beach with a reduced number above the MHWN level. The largest concentration of these features occurs around the MSL level, thus suggesting that bar development is the greatest at the mid-tide position. On average, the height and width of the bars were 1.1 and 82 m, respectively. The correlation analyses between the morphometric parameters of the bar morphology indicate that the inner bars on the upper-intertidal beach are characterized by a higher amplitude, a steeper seaward slope, and a more asymmetrical shape than the least developed bars in the lower intertidal zone. In addition, the profile mobility pattern highlights a high net morphological change of bars up to 1 m and in particular between MSL and MHWN while they are less active on the uppermost part of the intertidal beach.
The seasonal variability of the bar morphology is moderately related to the seasonally driven changes in hydrodynamic forcings. However, such a relationship may be hidden by the complex combination of a forcing-, relaxation time-, and feedback-dominated response. This work based on bi-annual LiDAR surveys emphasizes the potential and utility of LiDAR datasets as a source of information for a high-resolution morphological study of intertidal bar systems but also other systems operating on similar temporal and spatial scales.
Author Contributions
Conceptualization, A.-L.M.; Formal analysis, A.-L.M. and R.M.; Funding acquisition, A.-L.M., R.M., R.H., P.B., and M.C.; Methodology, A.-L.M. and R.M.; Visualization, A.-L.M.; Writing—original draft, A.-L.M.; Writing—review & editing, A.-L.M., R.M., R.H., P.B., and M.C. All authors have read and agreed to the published version of the manuscript.
Funding
This research was funded by the Belgian Science Policy Office, STEREOIII project SR/00/360.
Acknowledgments
The authors thank the Belgian Science Policy Office for providing funding under STEREOIII project SR/00/360. We would also like to thank the Coastal Division of the Flemish Authority for providing the LiDAR survey data.
Conflicts of Interest
The authors declare no conflict of interest.
References
- Biausque, M.; Grottoli, E.; Jackson, D.W.T.; Cooper, J.A.G. Multiple intertidal bars on beaches: A review. Earth Sci. Rev. 2020, 210, 103358. [Google Scholar] [CrossRef]
- Masselink, G.; Anthony, E.J. Location and height of intertidal bars on macrotidal ridge and runnel beaches. Earth Surf. Process. Landf. 2001, 26, 759–774. [Google Scholar] [CrossRef]
- Masselink, G.; Kroon, A.; Davidson-Arnott, R.G.D. Morphodynamics of intertidal bars in wave-dominated coastal settings a review. Geomorphology 2006, 73, 33–49. [Google Scholar] [CrossRef]
- Reichmüth, B.; Anthony, E.J. Tidal influence on the intertidal bar morphology of two contrasting macrotidal beaches. Geomorphology 2007, 90, 101–114. [Google Scholar] [CrossRef]
- King, C.A.M.; Williams, W.W. The formation and movement of sand bars by wave action. Geogr. J. 1949, 113, 70–85. [Google Scholar] [CrossRef]
- Van den Berg, J.H. Morphodynamic development and preservation of physical sedimentary structures in two prograding recent ridge and runnel beaches along the Dutch coast. Geol. En Mijnb. 1977, 56, 185–202. [Google Scholar]
- Mulrennan, M.E. Ridge and runnel beach morphodynamics: An example from the central east coast of Ireland. J. Coast. Res. 1992, 8, 906–918. [Google Scholar]
- Miles, A.; Ilic, S.; Whyatt, D.; James, M.R. Characterizing beach intertidal bar systems using multi-annual LiDAR data. Earth Surf. Process. Landf. 2019, 44, 1572–1583. [Google Scholar] [CrossRef] [Green Version]
- Kroon, A.; Masselink, G. Morphodynamics of intertidal bar morphology on a macrotidal beach under low-energy wave conditions, North Lincolnshire, England. Mar. Geol. 2002, 190, 591–608. [Google Scholar] [CrossRef]
- Anthony, E.J.; Levoy, F.; Monfort, O. Morphodynamics of intertidal bars on a megatidal beach, Merlimont, Northern France. Mar. Geol. 2004, 208, 73–100. [Google Scholar] [CrossRef]
- Wijnberg, K.M.; Kroon, A. Barred beaches. Geomorphology 2002, 48, 103–120. [Google Scholar] [CrossRef]
- Saye, S.E.; Van der Wal, D.; Pye, K.; Blott, S.J. Beach-dune morphological relationships and erosion/accumulation: An investigation at five sites in England and Wales using Lidar data. Geomorphology 2005, 72, 128–155. [Google Scholar] [CrossRef]
- Houthuys, R.; Verwaest, T.; Dan, S.; Mostaert, F. Morfologische Evolutie van de Vlaamse Kust Tot 2019; Versie 0.1. WL Rapporten 18_142; Waterbouwkundig Laboratorium: Antwerpen, Belgium, 2020; 225p. [Google Scholar]
- Haerens, P.; Bolle, A.; Trouw, K.; Houthuys, R. Definition of storm thresholds for significant morphological change of the sandy beaches along the Belgian coastline. Geomorphology 2012, 143, 104–117. [Google Scholar] [CrossRef]
- Vandebroek, E.; Dan, S.; Vanlede, J.; Verwaest, T.; Mostaert, F. Sediment Budget for the Belgian Coast: Final Report. In Version 2.0. FHR Reports; 12_155_1; Flanders Hydraulics Research, Antwerp & Antea Group: Antwerp, Belgium, 2017; p. 105. [Google Scholar]
- De Wolf, P.; Fransaer, D.; Van Sieleghem, J.; Houthuys, R. Morphological trends of the Belgian coast shown by 10 years of remote-sensing based surveying. In Coastlines of the Southern North Sea; Hillen, R., Ed.; Coastlines of the World: New York, NY, USA, 1993; pp. 245–257. [Google Scholar]
- De Moor, G. Strandgids het Vlaamse Strand: Geomorfologie en Dynamiek; Vlaams Instituut Voor de Zee: Oostende, Belgium, 2006; p. 154. ISBN 90-810081-3-7. [Google Scholar]
- Bogaert, P.; Montreuil, A.-L.; Chen, M. Predicting morphodynamics for beach intertidal systems in the North Sea: A space-time stochastic approach. J. Mar. Sci. Eng. 2020, 8, 901. [Google Scholar] [CrossRef]
- King, C.A.M. Beaches and Coasts. In Edward Arnold; Graham Toms Fine & Rare Books: London, UK, 1972. [Google Scholar]
- Brand, E.; Montreuil, A.-L.; Dan, S.; Chen, M. Macro-tidal beach morphology in relation to nearshore wave conditions and suspended sediment concentrations at Mariakerke, Belgium. Reg. Stud. Mar. Sci. 2018, 24, 97–106. [Google Scholar] [CrossRef]
- Masselink, G.; Castelle, B.; Scott, T.; Dodet, G.; Suanez, S.; Jackson, D.; Floc’h, F. Extreme wave activity during 2013/2014 winter and morphological impacts along the Atlantic coast of Europe: Extreme Atlantic waves during 2013/2014. Geophys. Res. Lett. 2016, 43, 2135–2143. [Google Scholar] [CrossRef]
- Van Houwelingen, S.T.; Masselink, G.; Bullard, J.E. Characteristics and dynamics of multiple intertidal bars, north Lincolnshire, England. Earth Surf. Process. Landf. 2006, 31, 428–443. [Google Scholar] [CrossRef]
- Navas, F.; Malvarez, G. Dundrum Bay: Coastal processes and modelling. In Field Guide to the Coastal Environments of Northern Ireland; Knight, J., Ed.; University of Ulster: Coleraine, Northern Ireland, 2002; pp. 68–73. [Google Scholar]
Figure 1.
(A) Location of the study site, (B) ground photograph, (C) typical beach profile at Groenendijk extracted from LiDAR survey (B: bar, T: trough). The tide levels were: mean high water springs (MHWS) of 4.84 m; mean high water neaps (MHWN) of 3.88 m; mean sea level (MSL) of 2.31 m; mean low water neap (MLWN) of 0.77 m and mean low water spring (MLWS) of −0.02 m TAW.

Figure 2.
Offshore wave roses from 2013 to 2019: (A) spring to autumn (from 15 April–14 October), (B) autumn to spring (from 15 October–14 April). Black lines correspond to the coastline orientation.
Figure 2.
Offshore wave roses from 2013 to 2019: (A) spring to autumn (from 15 April–14 October), (B) autumn to spring (from 15 October–14 April). Black lines correspond to the coastline orientation.

Figure 3.
Workflow from LiDAR data processing to bar analysis.

Figure 4.
Morphometric bar parameters computed using bar crest and trough positions indicated by green and blue vertical lines respectively. The locations of the corresponding inflection points are marked by the dashed red lines.
Figure 4.
Morphometric bar parameters computed using bar crest and trough positions indicated by green and blue vertical lines respectively. The locations of the corresponding inflection points are marked by the dashed red lines.

Figure 5.
Maps of bar crest positions extracted from the seasonal LiDAR survey dataset from 2013 to 2019. Note: aerial image background is fixed taken in 2015.
Figure 5.
Maps of bar crest positions extracted from the seasonal LiDAR survey dataset from 2013 to 2019. Note: aerial image background is fixed taken in 2015.

Figure 6.
Variability in bar morphometry: bar number detected over the study site, crest height (m), width (m), seaward slope (°), symmetry (dimensionless), orientation (° relative to North), volume (m3/m). Solid lines represent the average and grey envelopes indicate the +/− one standard deviation.

Figure 7.
Frequency distribution of bar crest elevation. The number corresponds to the total detected bars of all the surveys (n = 861, total number). The vertical dashed lines correspond to the tidal levels.
Figure 7.
Frequency distribution of bar crest elevation. The number corresponds to the total detected bars of all the surveys (n = 861, total number). The vertical dashed lines correspond to the tidal levels.

Figure 8.
Correlations between morphometric parameters characterizing the bar morphology. The vertical dashed lines correspond to the tidal levels. (p < 0.05).
Figure 8.
Correlations between morphometric parameters characterizing the bar morphology. The vertical dashed lines correspond to the tidal levels. (p < 0.05).

Figure 9.
(A) Beach profiles for all the surveys from 13S to 19A, and (B) cross-shore distribution of maximum net morphological change from spring to autumn (black dots) and from autumn to spring (grey dots) for the entire profile dataset. The horizontal dashed lines correspond to the tidal levels.
Figure 9.
(A) Beach profiles for all the surveys from 13S to 19A, and (B) cross-shore distribution of maximum net morphological change from spring to autumn (black dots) and from autumn to spring (grey dots) for the entire profile dataset. The horizontal dashed lines correspond to the tidal levels.


Table 1.
Description of the LiDAR bi-annual surveys (S: spring, A: autumn season).
| Survey | Date | Error Vertical Survey (m) | Duration between Surveys (month (m), day (d) |
|---|---|---|---|
| 13S | 29 April 2013 | 0.018 | x |
| 13A | 10 December 2013 | 0.029 | 7m11d |
| 14S | 15 April 2014 | 0.02 | 4m5d |
| 14A | 6 November 2014 | 0.017 | 6m22d |
| 15S | 17 May 2015 | 0.023 | 6m11d |
| 15A | 27 October 2015 | 0.02 | 5m10d |
| 16S | 11 April 2016 | 0.022 | 5m14d |
| 16A | 14 December 2016 | 0.025 | 8m4d |
| 17S | 26 May 2017 | 0.027 | 5m12d |
| 17A | 06 November 2017 | 0.026 | 5m11d |
| 18S | 17 April 2018 | 0.029 | 5m11d |
| 18A | 06 November 2018 | 0.027 | 6m20d |
| 19S | 20 April 2019 | 0.031 | 5m14d |
| 19A | 29 October 2019 | 0.019 | 6m9d |
Table 2.
Summary of the hydrodynamic conditions over the monitoring period from 2013 to 2019: number of storms exceeding 5.4 m TAW, maximum water level (m TAW), average and 95th percentile of offshore significant wave height (m). A: autumn, S: spring. The survey periods are delimited according to the day of the respective LiDAR surveys. Grey highlights indicate periods of high energetic condition.
| Survey Period | Number Storm | Max WL | Avg Hs | 95%Hs Offshore | Period Description |
|---|---|---|---|---|---|
| 13S–13A | 3 | 6.38 | 0.94 | 2.01 | High energy |
| 13A–14S | 0 | 5.43 | 1.00 | 1.93 | Low energy |
| 14S–14A | 1 | 5.67 | 0.80 | 1.70 | High energy |
| 14A–15S | 1 | 5.47 | 1.09 | 2.34 | High energy |
| 15S–15A | 0 | 5.43 | 0.89 | 1.79 | Low energy |
| 15A–16S | 2 | 5.68 | 1.29 | 2.57 | High energy |
| 16S–16A | 0 | 5.47 | 0.68 | 2.16 | Low energy |
| 16A–17S | 3 | 5.89 | 0.85 | 1.99 | High energy |
| 17S–17A | 0 | 5.46 | 0.89 | 2.01 | Low energy |
| 17A–18S | 3 | 5.83 | 1.16 | 2.46 | High energy |
| 18S–18A | 0 | 5.33 | 0.81 | 1.79 | Low energy |
| 18A–19S | 1 | 5.58 | 1.04 | 2.04 | High energy |
| 19S–19A | 1 | 5.74 | 0.84 | 1.72 | High energy |
Table 3.
Bar morphometric parameters of the bar morphology from 2013 to 2019. Columns present the average of annual, spring, and autumn characteristics. Values in brackets correspond to the standard deviation.
Table 3.
Bar morphometric parameters of the bar morphology from 2013 to 2019. Columns present the average of annual, spring, and autumn characteristics. Values in brackets correspond to the standard deviation.
| Parameters | All | Spring | Autumn |
|---|---|---|---|
| Bar number | 68 (17) | 70 (13) | 66 (21) |
| Bar height (m) | 1.07 (0.41) | 1.09 (0.41) | 1.04 (0.40) |
| Bar width (m) | 84 (17) | 86 (16) | 83 (18) |
| Seaward bar slope (°) | 1.13 (0.40) | 1.14 (0.40) | 1.12 (0.40) |
| Symmetry (dimensionless) | 0.24 (0.09) | 0.22 (0.07) | 0.25 (0.10) |
| Orientation (° relative to North) | 64.5 (2.19) | 64.77 (2.58) | 64.47 (1.80) |
| Bar volume (m3/m) | 14.09 (4.9) | 13.39 (5) | 14.80 (4.8) |
Publisher’s Note: MDPI stays neutral with regard to jurisdictional claims in published maps and institutional affiliations. |
© 2020 by the authors. Licensee MDPI, Basel, Switzerland. This article is an open access article distributed under the terms and conditions of the Creative Commons Attribution (CC BY) license (http://creativecommons.org/licenses/by/4.0/).
Share and Cite
MDPI and ACS Style
Montreuil, A.-L.; Moelans, R.; Houthuys, R.; Bogaert, P.; Chen, M. Characterization of Intertidal Bar Morphodynamics Using a Bi-Annual LiDAR Dataset. Remote Sens. 2020, 12, 3841. https://0-doi-org.brum.beds.ac.uk/10.3390/rs12223841
AMA Style
Montreuil A-L, Moelans R, Houthuys R, Bogaert P, Chen M. Characterization of Intertidal Bar Morphodynamics Using a Bi-Annual LiDAR Dataset. Remote Sensing. 2020; 12(22):3841. https://0-doi-org.brum.beds.ac.uk/10.3390/rs12223841
Chicago/Turabian StyleMontreuil, Anne-Lise, Robrecht Moelans, Rik Houthuys, Patrick Bogaert, and Margaret Chen. 2020. "Characterization of Intertidal Bar Morphodynamics Using a Bi-Annual LiDAR Dataset" Remote Sensing 12, no. 22: 3841. https://0-doi-org.brum.beds.ac.uk/10.3390/rs12223841
Note that from the first issue of 2016, this journal uses article numbers instead of page numbers. See further details here.