1. Introduction
The acquisition techniques for accurate surveys of coastal cliffs have rapidly developed in recent years with the advent of the Unmanned Aerial Vehicle (UAV) technology, providing new opportunities mainly for the study of remote or inaccessible areas [
1]. At the same time, powerful advancements in the Structure-from-Motion (SfM) approach, which combines well-established photogrammetric principles (basically, image matching and bundle adjustment) with modern computational methods [
2] for estimating three-dimensional structures from two-dimensional image sequences, have been brought to the development of many software for image processing. The combined use of SfM and UAV technologies has reached a great success for the 3D point cloud model reconstruction [
3], providing the potential for reducing significantly the expertise and time required for generating such surface models [
4].
Moreover, for the achievement of high resolutions Digital Surface Models (DSMs), the costs of the different techniques available are really different, being, for example, the Terrestrial Laser Scanning (TLS) survey two or three orders of magnitude more expensive than a UAV one [
5]. Due to the technical and economic advantages, an exponential increase in the geoscience applications of UAV techniques has been observed ([
6,
7,
8,
9,
10]). In particular, in [
11], the authors summarize the parameters that affect the reliability of the data acquisition process over the marine environment using Unmanned Aerial Systems. An application on multi-temporal progressive results obtained by micro-UAVs in rockfall events is provided by [
12], which highlights that the use of micro-UAVs is a suitable method to support both qualitative and quantitative hazard assessments, especially during emergency conditions when the investigated areas are inaccessible.
A methodological approach to assess the stability of rocky cliffs is proposed by [
13], based on coupling of UAV-SfM techniques to reach a 3D finite element model. In this work, the reliability of a methodology to detect discontinuities and joints using in situ surveys supported by UAV techniques is proved. In [
14], the SfM techniques are applied for the range imaging of a uniaxial compression laboratory test on a cylindrical calcarenite sample and a comparison between DIC and SIFT computer vision techniques is discussed. Finally, in [
15], the authors used the time series of the SfM results in order to reveal topographic changes, including landslides, rock falls, and the erosion of landslide talus along the Fort Funston beach.
Nowadays, the detection of signs of incipient failure within a rock mass forming an inland or sea cliff represents one of the most challenging research objectives in the field of geosciences, due to the well-known absence of precursory signs and the brittle failure typically occurring in these contexts. Therefore, the multi-temporal photogrammetric techniques, as for example, the SfM here discussed, is believed to provide an interesting perspective to be pursued for this purpose. At the same time, three-dimensional numerical modelling has recently offered a powerful tool to deal with the investigation of strain and failure processes occurring within the rock masses. It comes out that the two approaches could be potentially integrated to reach a reasonable level of accuracy in the assessment of the cliff stability and the corresponding susceptibility to failure.
This paper is aimed at proposing an integration of multi-temporal UAV and terrestrial imagery surveys in order to derive point clouds of a coastal rocky cliff obtained at different times to be compared. Later on, the indications obtained in terms of a progressive deepening of erosion and detachment of blocks have been interpreted in light of the results of a 3D finite element model of the rock cliff in order to gain indications on the on-going changes in the global stability of the cliff.
2. Case Study: Location, Geological Context, Geomechanical Characterization
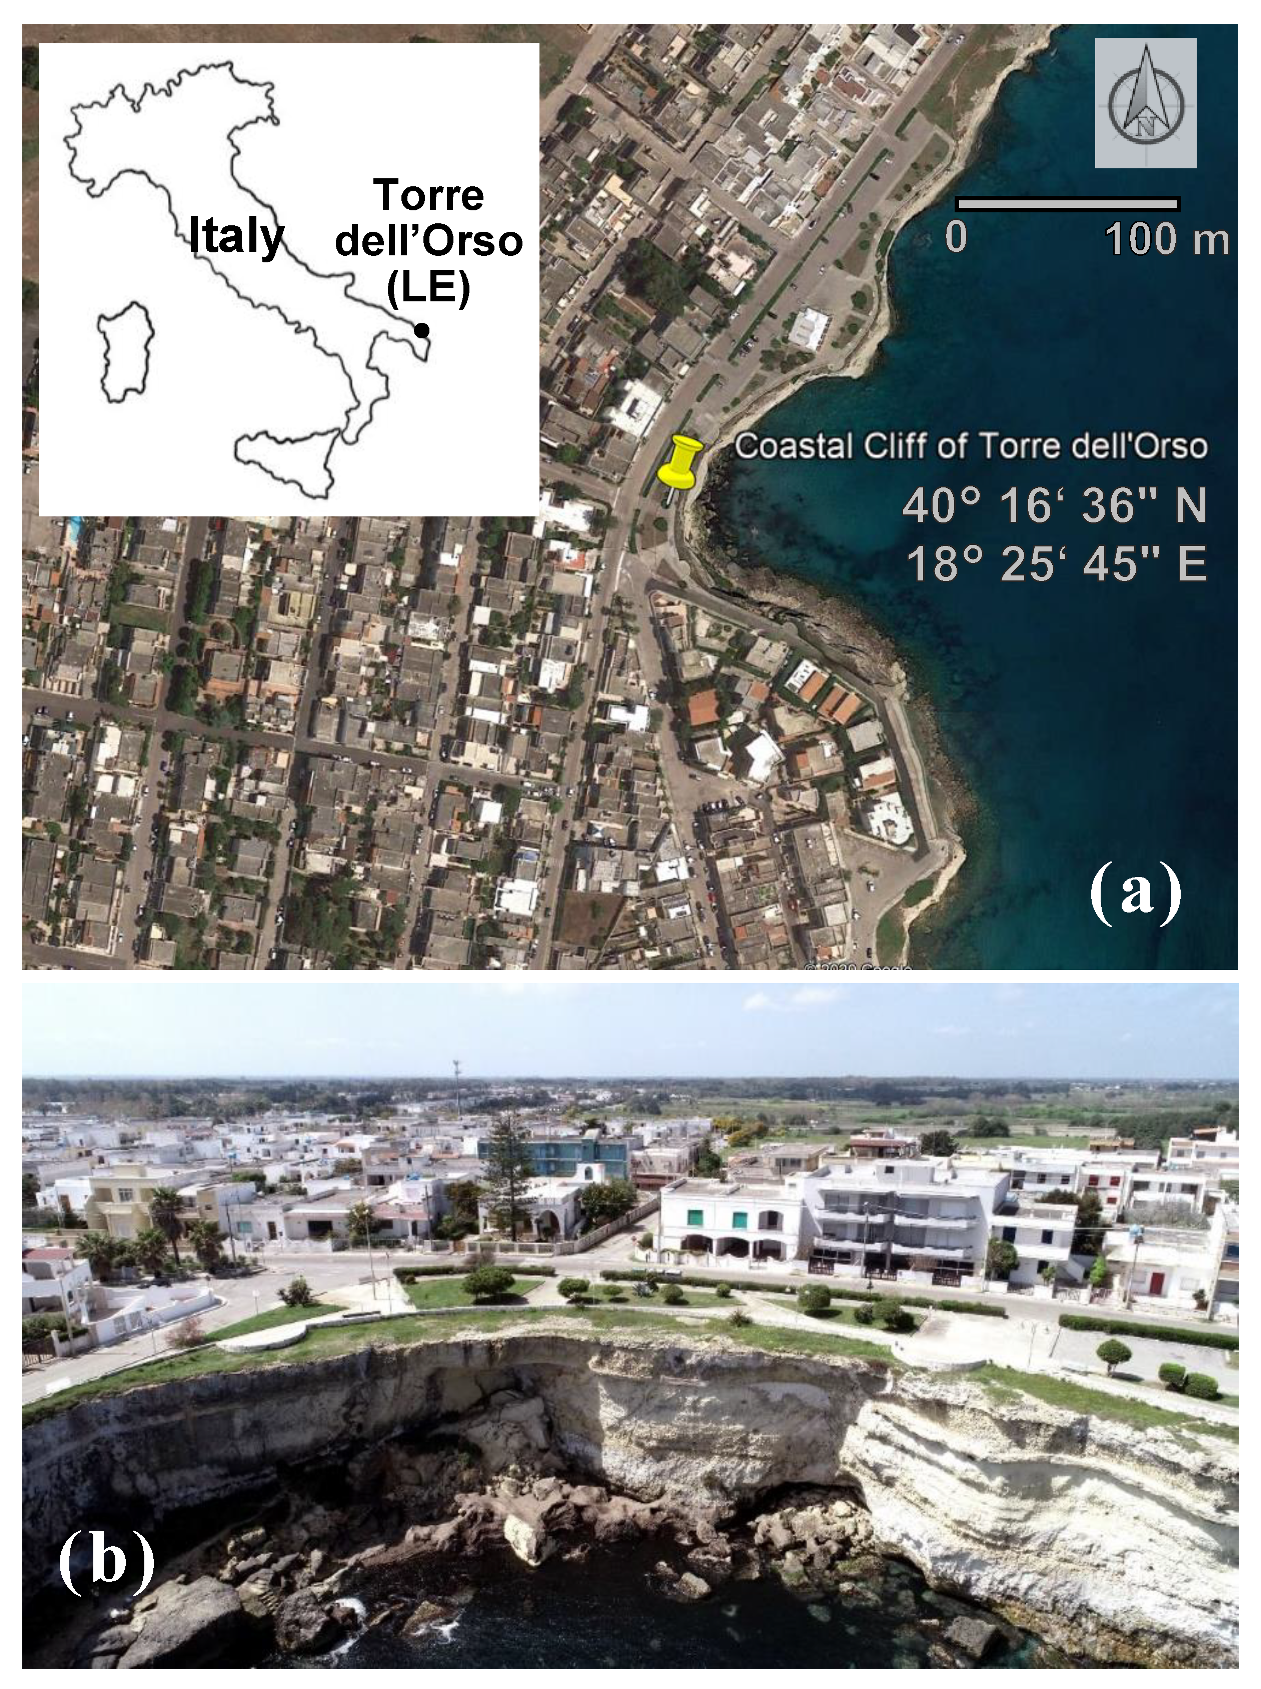
In the coastal area of Melendugno, located on the east coast of the Peninsula Salentina (Puglia, Italy), a large number of rockfall events have occurred in the last decades. Coastal erosion phenomena are constantly evolving and many sites have reached a high degree of geomorphological hazard. Therefore, local administrations have banned several areas close to the coastal walls. The investigated cliff, shown in
Figure 1, is located in Torre dell’Orso (part of the municipality of Melendugno, Lecce, Italy) in a highly frequented area, especially in summer.
The geological context of the study area is quite variable with sub-horizontal layers, often alternating, dating back to the upper Pliocene—lower Pleistocene, as shown in
Figure 2, alluvial deposits, with variable volumes more or less cemented, frequently represent the upper part of the cliffs and, more rarely, are present also at lower depths (sometimes also incorporated in a more consistent calcarenitic unit). Along the rocky coasts, the typical stratification is represented by an alternation of two different facies belonging to the same calcarenitic unit, known as “Uggiano La Chiesa” formation (
Figure 2). In particular, the two facies, with variable thickness, are represented by well-stratified fossiliferous yellowish marly calcisiltites and yellowish to light grey biocalcarenites; although such units are often found in the mixture, the biocalcarenites facies prevail in the lower and higher parts of the cliff, while in the middle one the marly calcisiltites are predominant [
13].
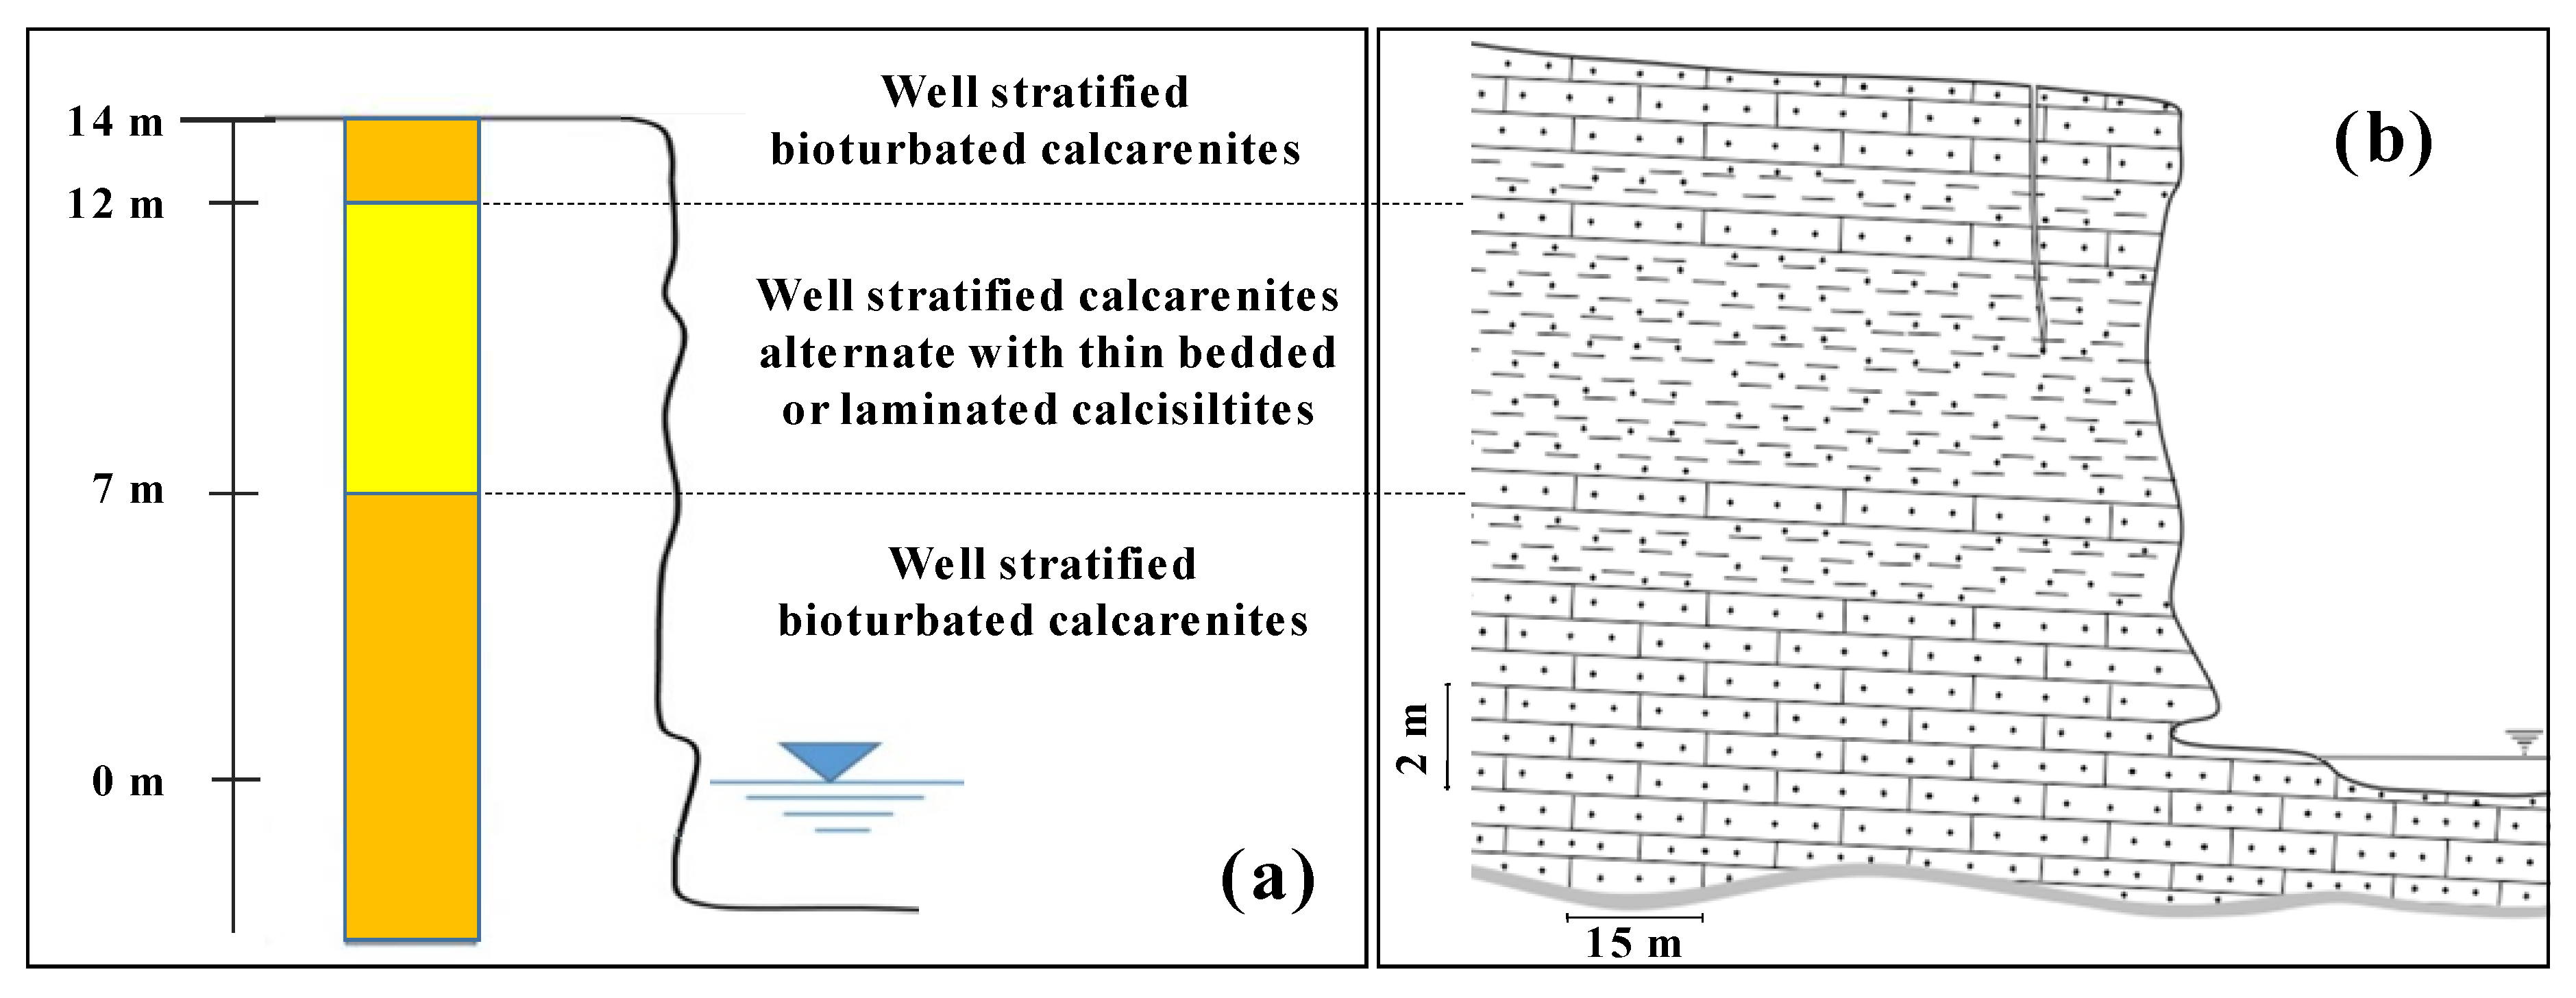
A site-specific stratigraphy, obtained from a borehole drilled a few meters from the area of the case study, is reported in [
16] and the results similar to the stratification described in [
13] are defined for the same coastal area. The two stratigraphic schemes are reported in
Figure 3.
A set of laboratory tests were performed for both dry and saturated calcarenitic samples in order to define the main physical and mechanical properties of the intact rock that have been used in the numerical simulation described below. Rock unit weight ranges between 12 and 17.9 kN/m
3 in dry conditions, and between 17.5 and 21.6 kN/m
3 under saturated conditions, with the lower values registered for samples with a predominantly calcisiltite component. Porosity results in the range 30–60%, water absorption between 20.8–30.4%, and degree of saturation is 100% showing that pores in the rock particle systems are interconnected and continuous, therefore, the porosity is supposed to be effective. Displacement-controlled unconfined compression tests on cylindrical samples as well as indirect tensile tests (also known as Brazilian tests) [
17], to quantify, respectively, the uniaxial compression strength (represents the main mechanical parameter to characterize the intact rock) and tension strength, have been carried out. In
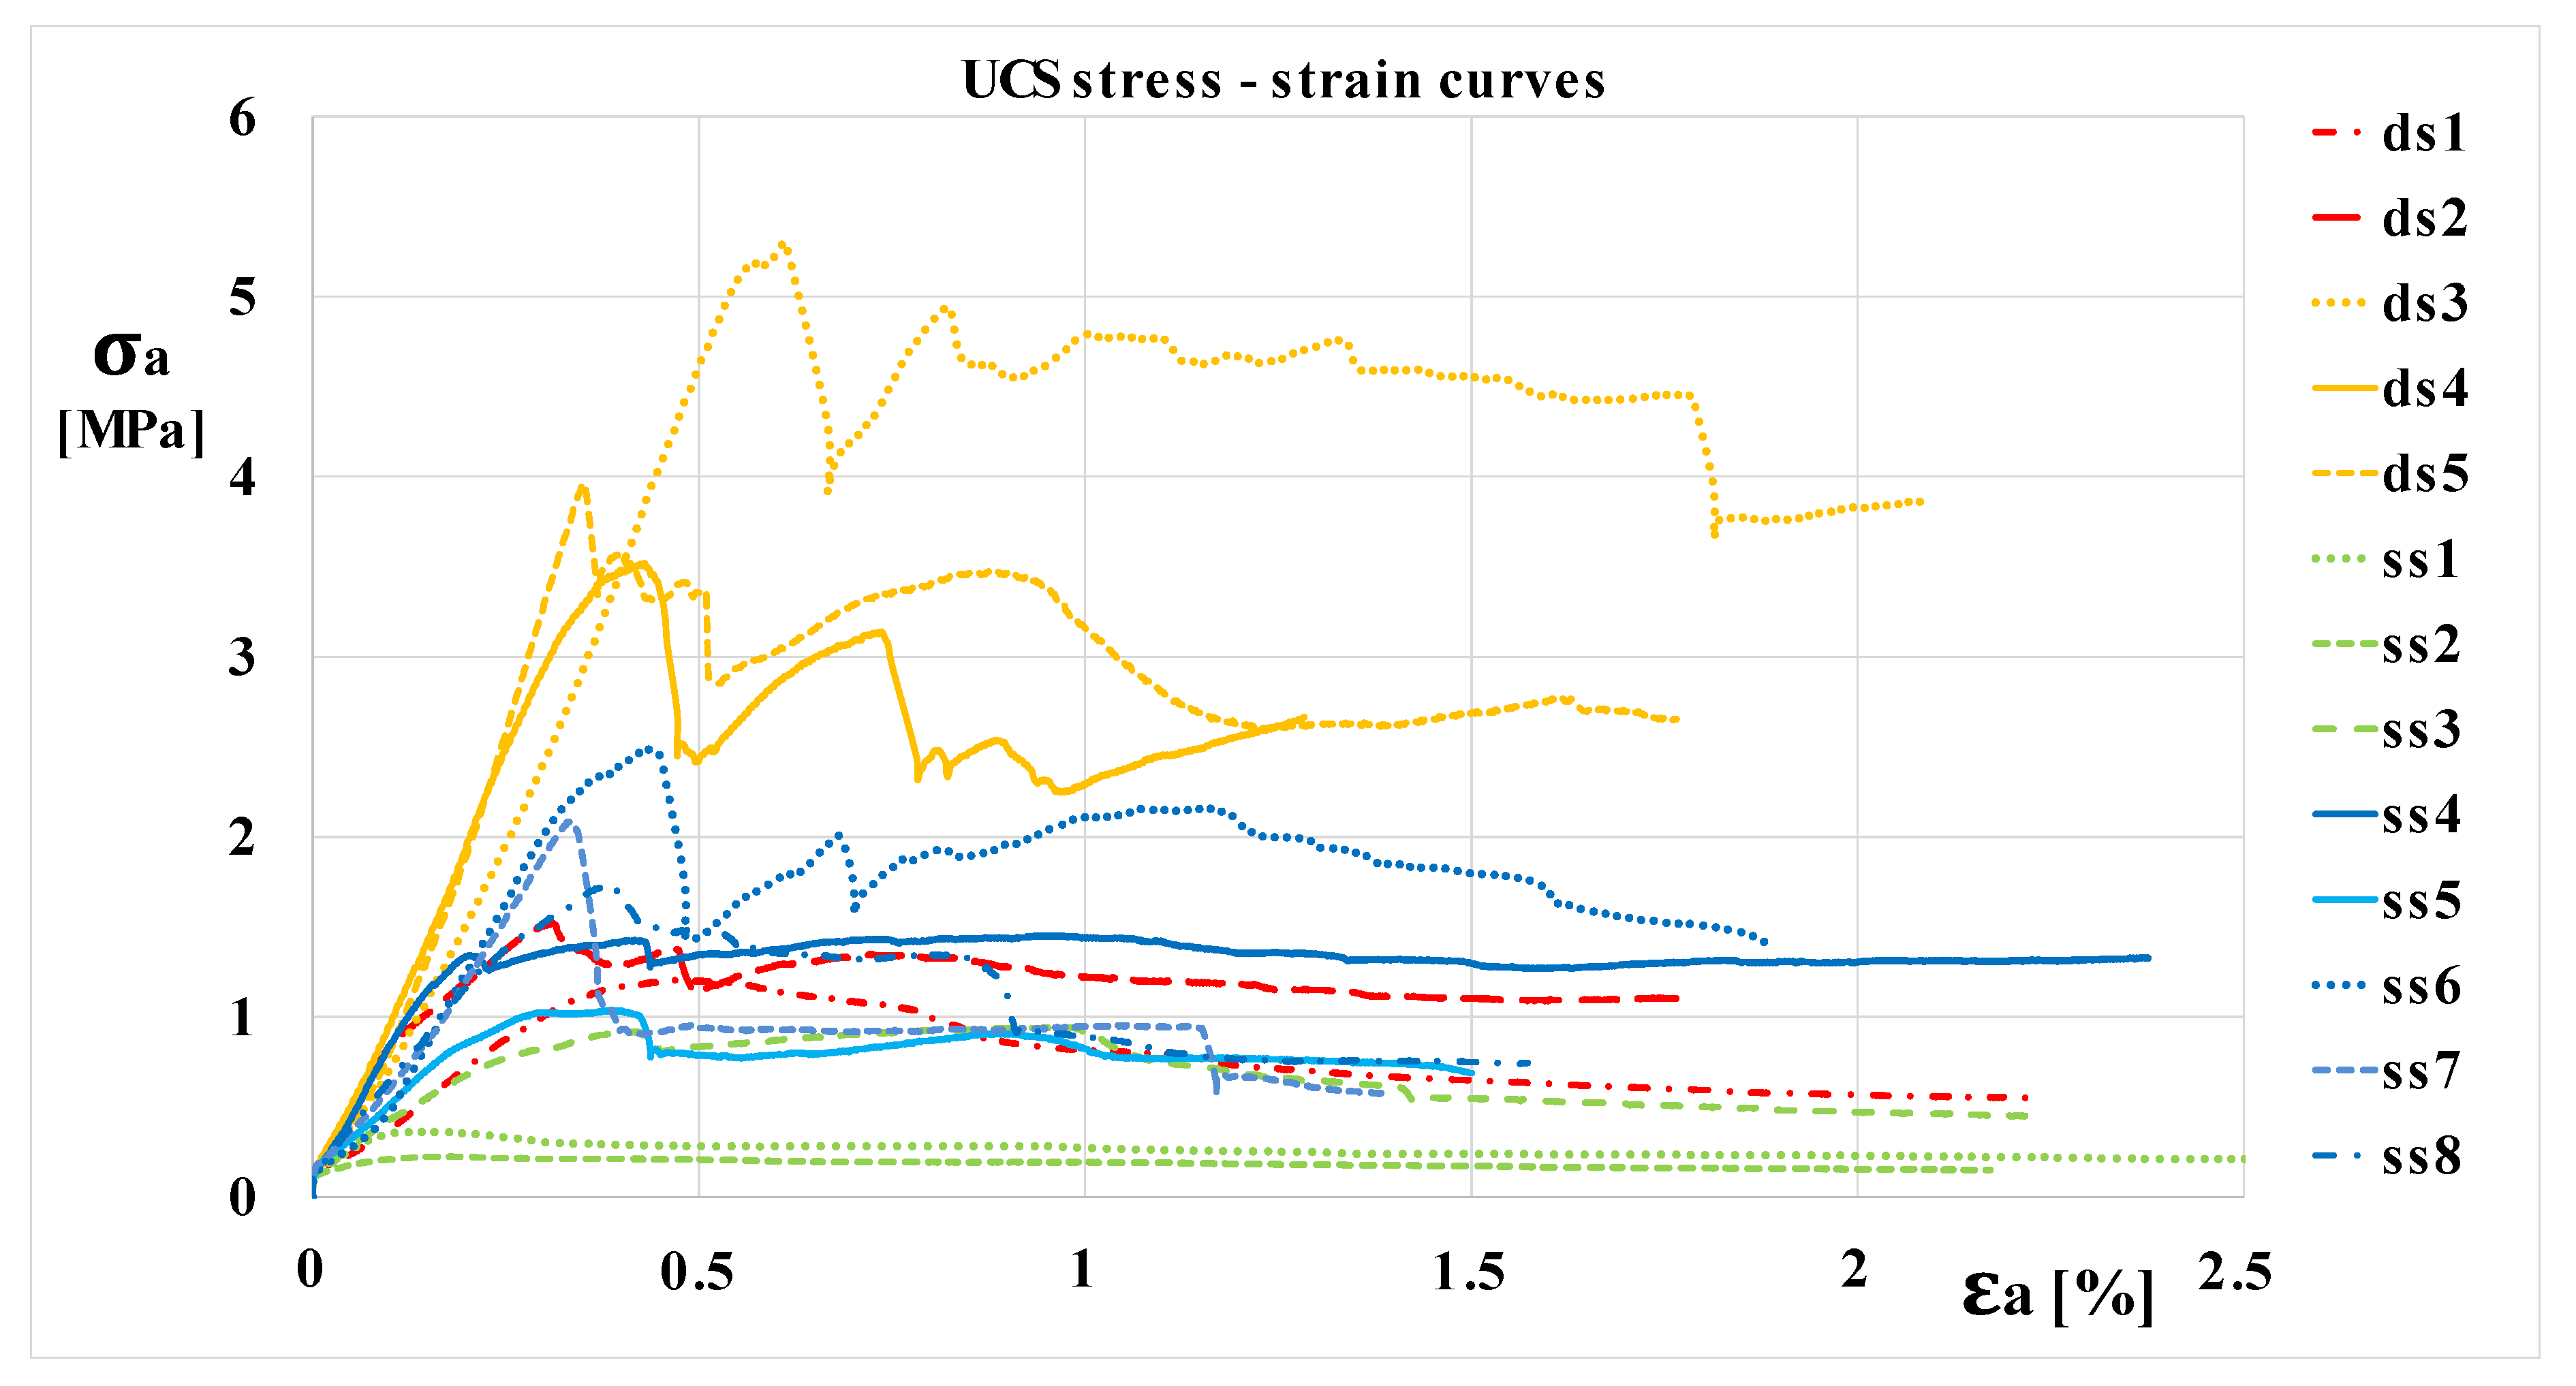
Figure 4, the stress-strain Uniaxial Compressive Strength (UCS) curves, with a legend referred to the dry samples as (ds) and saturated samples as (ss), have been reported.
Although the two aforementioned facies can occur together in the same exposure and are not easily detectable as the effect of the complex depositional history,
Figure 4 shows that the mechanical behavior of the coarse-grained calcarenite and the fine-grained calcisiltite differs significantly. In
Figure 4, the yellow and the blue curves are referred respectively to the dry and saturated samples with a predominantly calcarenite component; red and green curves refer respectively to the dry and saturated samples with a predominantly calcisiltite component. For both facies, a decrease of the uniaxial compression strength, larger than 50%, is obtained moving from dry conditions to saturated conditions, as also observed in [
18]. In fact, the uniaxial compression strength values range between 3.5 and 5.3 MPa for dry calcarenite samples and 1–2.5 MPa for wet calcarenite samples. Similarly, the range of UCS results is 1–1.5 MPa for dry calcisiltite samples and 0.2–0.8 for wet calcisiltite samples.
A loss of strength under saturated conditions is also confirmed from indirect tensile tests performed in the laboratory. Under dry conditions, the indirect tensile strength ranges between 240 and 600 kPa, whereas, under saturated conditions, it results between 60 and 290 kPa, with the lowest values again measured for the calcisiltite samples.
According to the classifications proposed in [
19,
20], the values of the strength parameters, as deduced from the laboratory tests, suggest classifying the calcarenite and calcilsiltite units as moderately to extremely soft rocks. For these types of rocks, a value of Geological Strength Index [
21] equal to 80–90 and a Hoek-Brown mi parameter in a range of 8–12 should be considered in order to characterize the intact rock mass according to a Hoek-Brown failure envelope. By means of a linearization of the Hoek-Brown curvilinear envelope, the shear strength parameters according to a Mohr-Coulomb failure criterion has been obtained and considered in the 3D FEM analyses described below.
3. Materials and Methods
3.1. From UAV and Terrestrial Acquisition to SfM Analysis
The cliff digital surveys were carried out by means of a UAV, DJI Phantom 4 Pro, with the following features:
Flights were accomplished in the manual mode by acquiring oblique images of the cliff, by flying in stripes parallel to the cliffs at different heights checking the image capture from the ground station screen showing in real time the cliff portion framed by the UAV camera. Then, in the automatic mode capturing nadir images of the same area at a fixed height with stripes automatically designed by the UAV planning software on the basis of the defined area of interest. The combination of the two modes allowed surveying the vertical sectors as well as the flat one. Prior to the execution of the flights, the ground targets were placed, in the flat area at sea level, and referenced by the employment of a Leica 1200 GNSS receiver in the RTK-VRS mode, thus ensuring a centimeter accuracy [
22]. The purpose of the target is the geocoding of the flight in a geographic reference system to ease further comparisons and mapping.
In order to investigate the evolution of the cliff over time, two UAV survey campaigns, with characteristics reported in
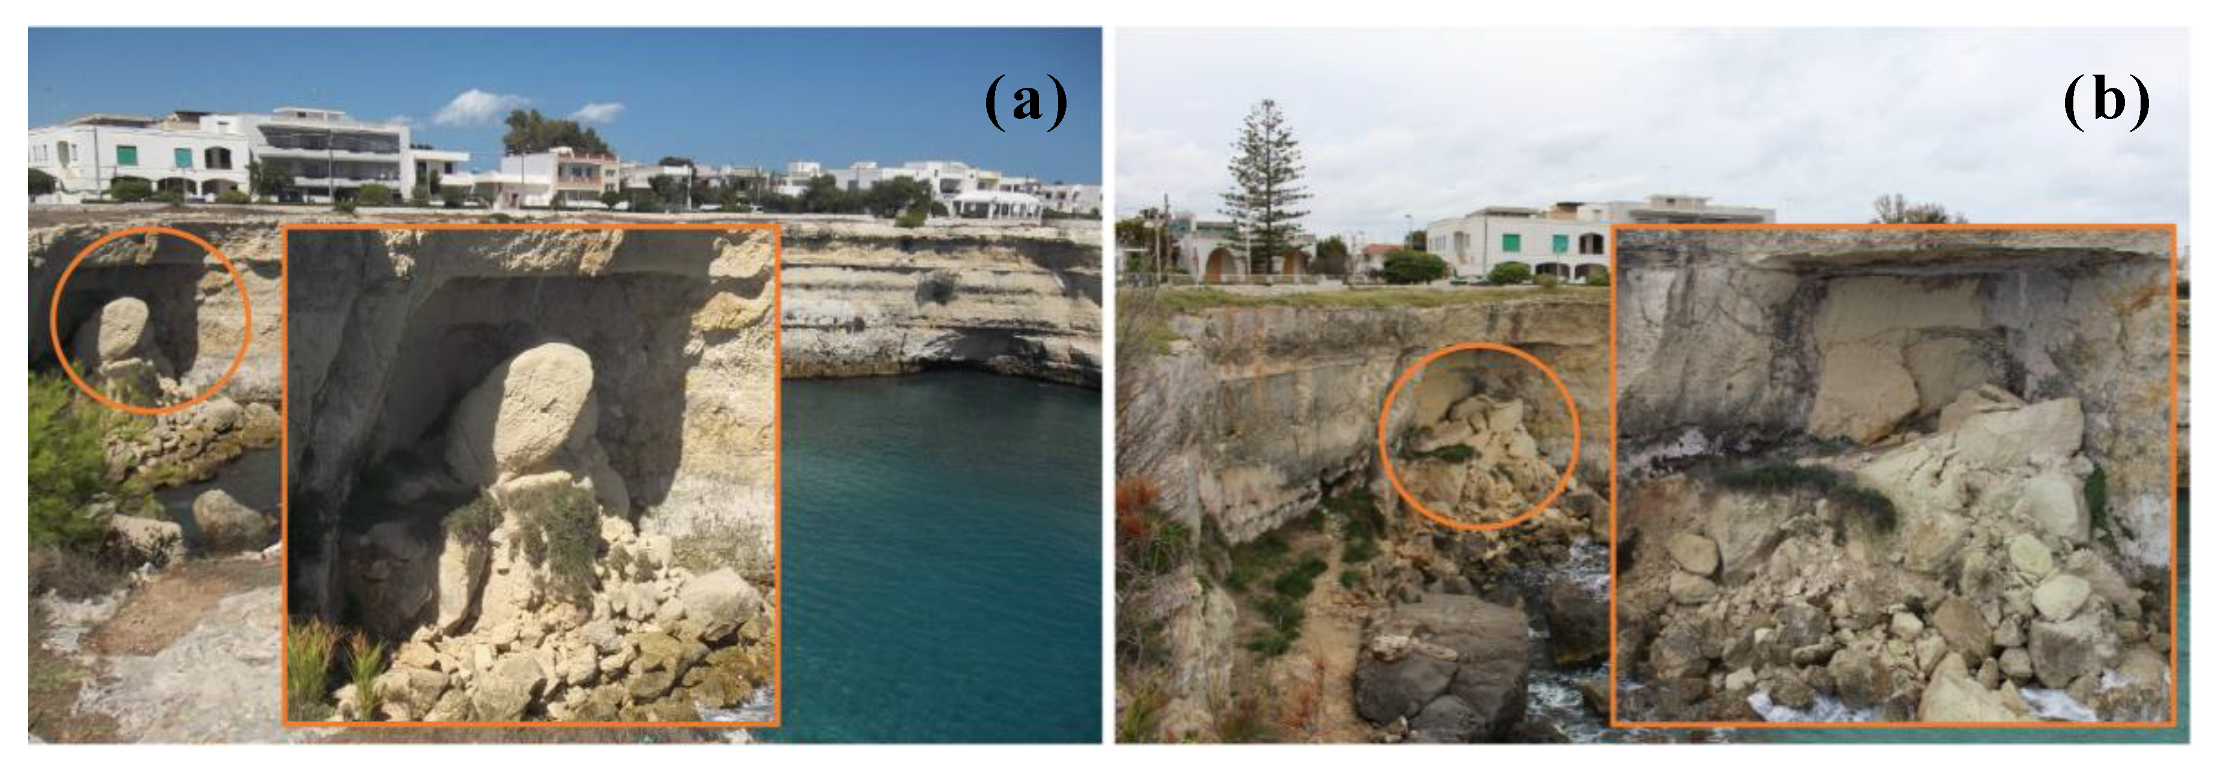
Table 1, were planned and carried out. Moreover, with the aim of investigating the evolution of the center sector of the cliff, where a block failure was observed by means of the visual comparison between the 2017 field survey and the 2019 UAV picture, the terrestrial image acquired during, with a KODAK EASYSHARE Camera M522, the aforementioned field survey was included in the processing, thus allowing the temporal extension of the dataset [
23]. The comparison image of
Figure 5 shows the block failure which occurred in the period between the acquisitions. With reference to
Figure 5b, it is worth noting that the fall of the rock block reveals a portion of the cliff where an uncemented silty calcisiltite unit crops out.
The dataset formed by the three images series was processed in the Agisoft Metashape in order to compute the 3D point clouds of the cliff. The first one was F19, which was geocoded by the collimation of the surveyed ground target and then aligned into a sparse point cloud further densified in the final 3D point cloud. In order to ensure an acceptable degree of reliability of the comparison between the point clouds, F19 was set as the reference one and tie points were recognized on the point cloud and their 3D coordinates were stored. These coordinates were then used to co-register F18 and R17 to F19 with a procedure identical to the geocoding of F19 by collimating the points on the images. Tie points were selected among features recognizable on the cliffs and assumed stable in time as they were located in unchanged cliff sectors.
The 3D point cloud time series was then exported in the “.LAS” exchange format [
24] and imported in the Cloud Compare [
25] software with the aim of performing the change detection. The software is capable of importing large (2 billion points) 3D datasets and computing the cloud-to-cloud distance resulting in a color mapping of the investigated cliff. This analysis was carried out by comparing 2019 vs. 2017 and 2019 vs. 2018 point clouds.
The UAV survey has provided high density point clouds, i.e., F19: 35,338,382 points and F18: 8,381,800 points, featuring high accuracy in their positioning with the errors reported in
Table 2. Concerning R17, despite its lower number of images, provided 5,147,569 points with a comparable accuracy.
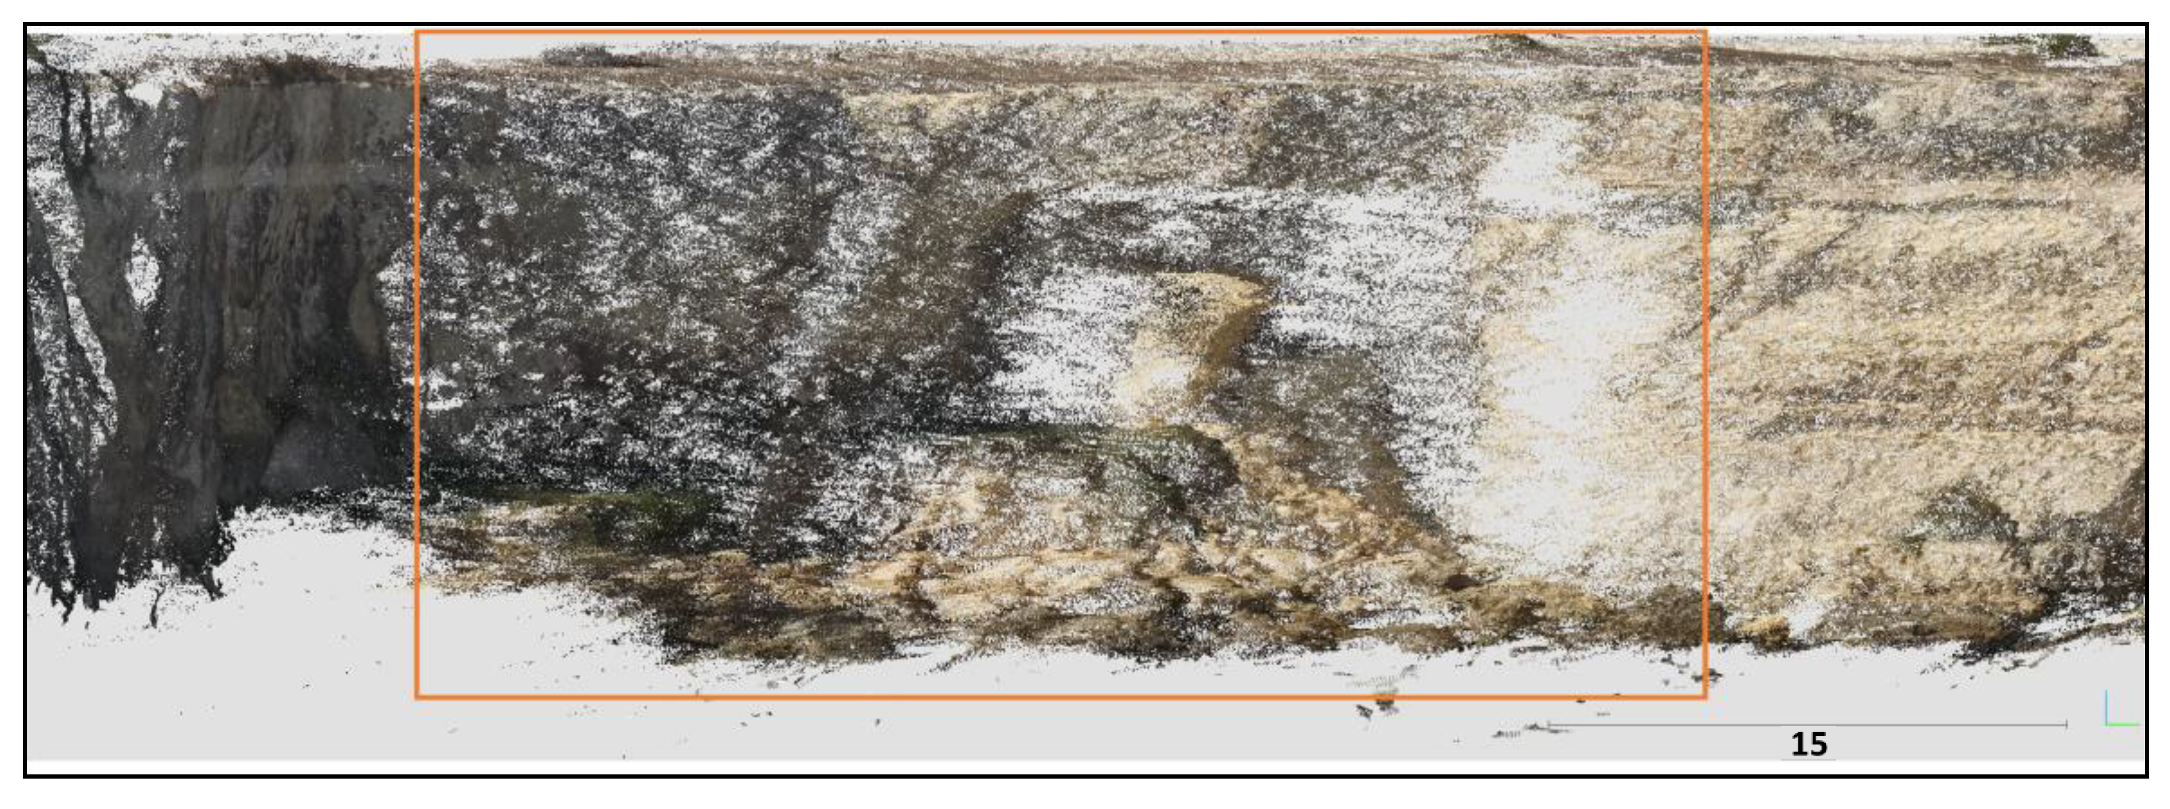
In relation to the geometrical quality of the point clouds, R17 is affected by several artifacts in the central sector, shown in
Figure 6, due to the oblique shots which were taken for completely different purposes and, therefore, the comparison of the results has been handled carefully.
Conversely, the point clouds obtained from UAV flights, combining oblique and nadir shots, provided a geometrical reconstruction of the investigated area.
3.2. Numerical Analyses Simulating Rock Block Detachment and Pre-/Post-Scenarios
A three-dimensional finite element model of the coast cliff, calibrated by means of the results of the UAV and terrestrial photogrammetry techniques, has been developed with the code PLAXIS-3D [
26] in order to simulate the observed erosive process (that led to detachment of the block rock) and to assess the eventual changes in the stability conditions.
3.2.1. From Point Clouds Management to the TIN Surfaces and Numerical Models Construction
The numerical code requires the import of a Triangulated Irregular Network (TIN) poly-surface represented by the union of surfaces identified through three points. Due to the numerical modelling suite, the point cloud, initially consisting of millions of points, were necessarily subsampled in order to reduce the total number of points and to facilitate the TIN surface design. This procedure of “approximation” of the point cloud that, inevitably, involves a loss of geometric information, was carried out with the
Subsample tool of Cloud Compare [
25] applying the
Space method. Since the initial point cloud was measured with the metric coordinate system, imposing a value of 0.01 m as a minimum distance (subsample parameter of the Space method) to be maintained between the points, a simplified cloud was obtained. The ratio of the number of points between the initial and simplified clouds was approximately 2%.
The subsampled point cloud has been transferred into the CAD software where the points have been triangulated in surfaces. The triangulation of points has been carried out also comparing the individual frames of local sectors that have a low point density due to the presence of vegetation or a non-optimal exposure at the time of acquisition. In these sectors, some points have been added by interpolating the neighboring ones, in order to avoid “holes” between the surfaces. In fact, the union of all created triangular surfaces outlines the TIN surface, which must be continuous in order to be imported into the Plaxis 3D FEM code.
The numerical analyses required the geometric construction of the volumes of the calculation model. The TIN surface has been incorporated in a parallelepiped with length and width equal to about five times those of the TIN surface while the height of the volume is about six times that of the cliff. In the resulting model the vertical side boundaries and the base of the model are located, respectively, at a distance of about 200 and 120 m from the cliff surface under study (in the numerical analyses is a commonly used practice to keep the boundaries of the model at a large distance from the study area, in order to avoid computational errors due to the impossibility of redistributing both the stress and deformation state). Kinematical boundary conditions were imposed by assuming zero displacements in the horizontal direction for the vertical boundaries, whereas the base of the model has been completely fixed (prevented movements in all directions).
3.2.2. Mesh Discretization and Calculation Phases Settings
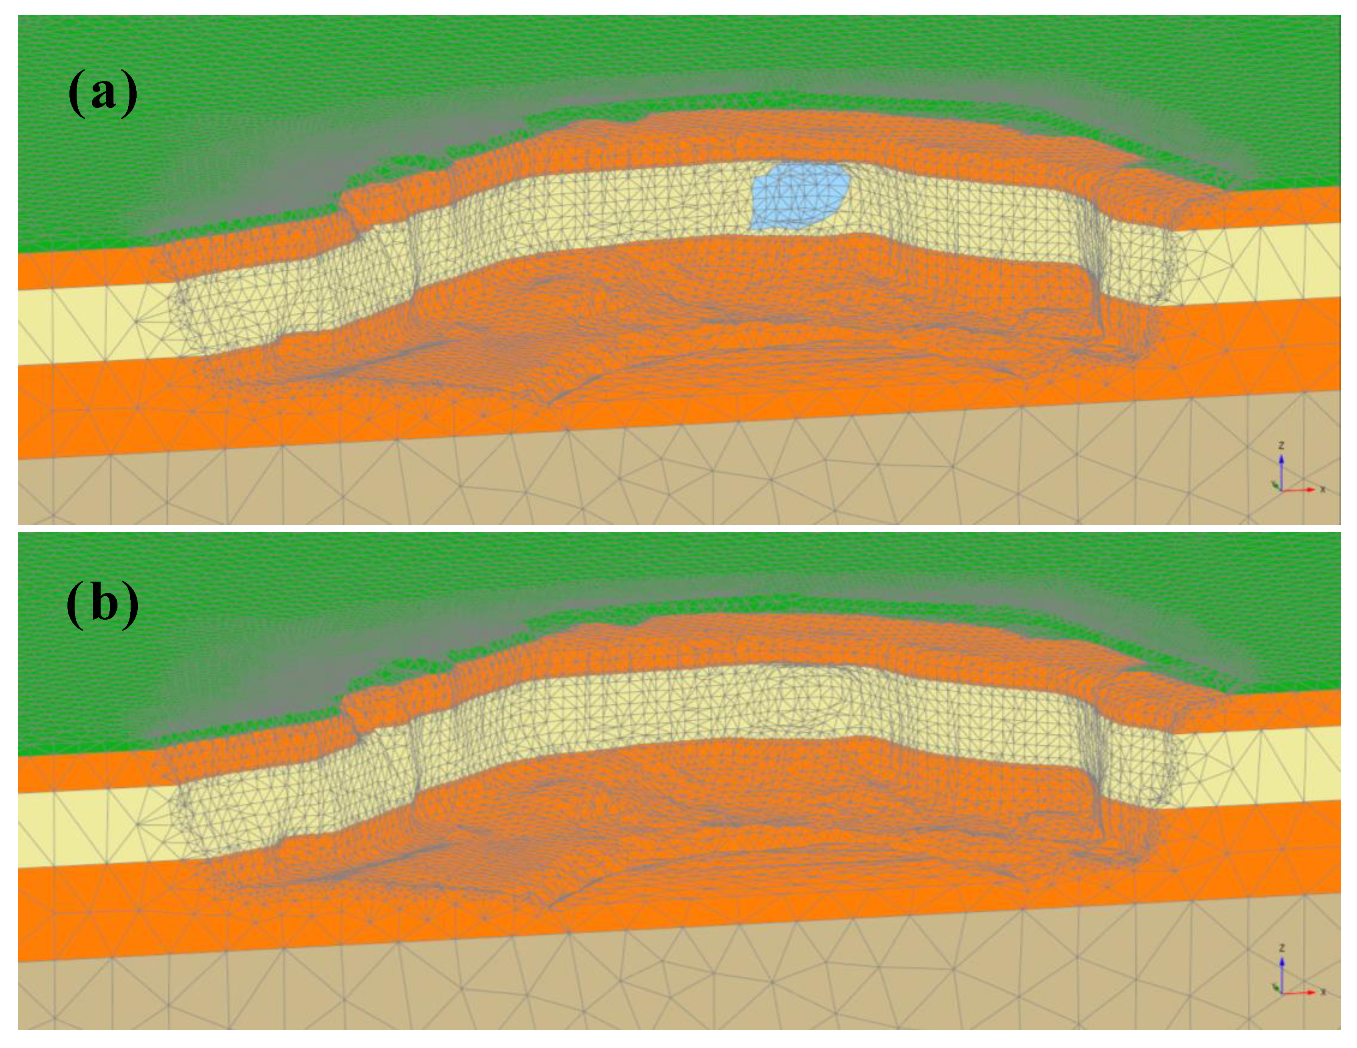
The calculation model was discretized with a very fine mesh in the area representing the coastal cliff, while a coarsen mesh was adopted for the remaining parts, thus reaching a good compromise between numerical accuracy and computational time costs. The mesh, composed by 487,580 elements with 725,004 nodes, is shown in pictures (a) and (b) of
Figure 7, for the pre- and post-rock block detachment model. The light blue volume, discretized in 737 elements, identify the detached rock block as a result of the erosion processes.
Figure 7 shows that the erosive process is mainly concentrated in the calcilsiltite layer and, in accordance with the difference of the two point clouds, R17 and F19, it reaches a maximum of about 2.5 m in the inner area of the cavity, with an average thickness of 0.5 m.
The 3D FEM analyses have followed an Initial Phase in which the initialization of the stress state of the model is carried out by means of a Gravity Loading procedure, i.e., the gravitational forces are applied to the model under elastic conditions of the materials. A hydrostatic water level has been imposed at a distance of 14 m from the crest of the coastal wall, in accordance with the recorded average sea level [
27]. Later on, the plastic behavior has been applied to the rock materials and the corresponding calculation phase has been split into two sub-phases in order to compare the stability conditions of the (i) pre- and (ii) post-erosion models. Both the two sub-phases of the plastic analysis involved a final Safety phase, represented by a calculation stage, which has provided the final value of the safety factor, FS, in order to quantify the global stability conditions in both simulated scenarios.
3.2.3. Rock Material Parameter Evaluation
An elastic-perfectly plastic constitutive model, with a Mohr-Coulomb strength criterion and a non-associated flow rule, has been assumed for the rock materials. The corresponding strength parameters were derived through a linearization of the Hoek-Brown failure envelope, by considering the uniaxial compressive strength measured in the laboratory tests (described in the geomechanical characterization of the previous paragraph). Assuming a Geological Strength Index (GSI) equal to 80–90, accounting for a blocky to intact rock structure with a good surface quality [
21], and fitting a value of the mi parameter equal to 8–10, as obtained from the ratio between the uniaxial compression and the indirect tensile strength [
28], the resulting values of rock cohesion, c’, and friction angle, φ’, range in c’ = 20–80 kPa and φ’ = 25–28° for the finer calcisiltite facies, and c’ = 60–250 kPa and φ’ = 26–30° for the stiffer calcarenite facies. The final shear strength parameters adopted in both pre- and post-erosion simulations are reported in
Table 3.
These parameters, adopted in the numerical analyses to characterize the calcarenite and calcisiltite formations, correspond, approximately, to the minimum values of the ranges of variation described above. Considering that the intervals of c’ and φ’ are referred to the largest values for dry rock conditions and, conversely, to the lowest values for wet conditions, the choice of parameters shown in
Table 3, seems representative of almost totally saturated conditions and, therefore, the assumptions are precautionary. However, on site, the rock mass does not reach a totally saturated state even in adverse hydrological conditions (due to rainfall, superficial or deep infiltration, sea spray, cyclic sea waves) and, generally, physical and mechanical parameters of the rock stand on average values between dry and wet ones. Therefore, the choice of the values adopted in the numerical analyses is also dictated by considerations relating to processes of weathering (defined as the physical disintegration or chemical decomposition of earth materials resulting in changes in the color, texture, composition, density, or form, with little or no transport of the loosened or altered material [
29]) that affect the rock mass strength. In fact, evaluating the material properties of the involved rocks from the classification of [
29], including, e.g., grain size (from 0.002 to 0.062 mm for the calcisiltitic unit and from 0.0625 to 2 mm for the calcarenit unit), texture (composed of contiguous or interlocking crystals), hydraulic conductivity (with a magnitude of 10
−5 m/s [
18]), cementation (from moderate to strong), influence of the fracture on the erodibility of a rock mass (with fissured joint pacing and altered joint face), the calcarenit and calcisiltitic formations, for the case study, result in moderately to highly weathered [
29] conditions.
4. Results
4.1. Point Clouds Multitemporal Comparison
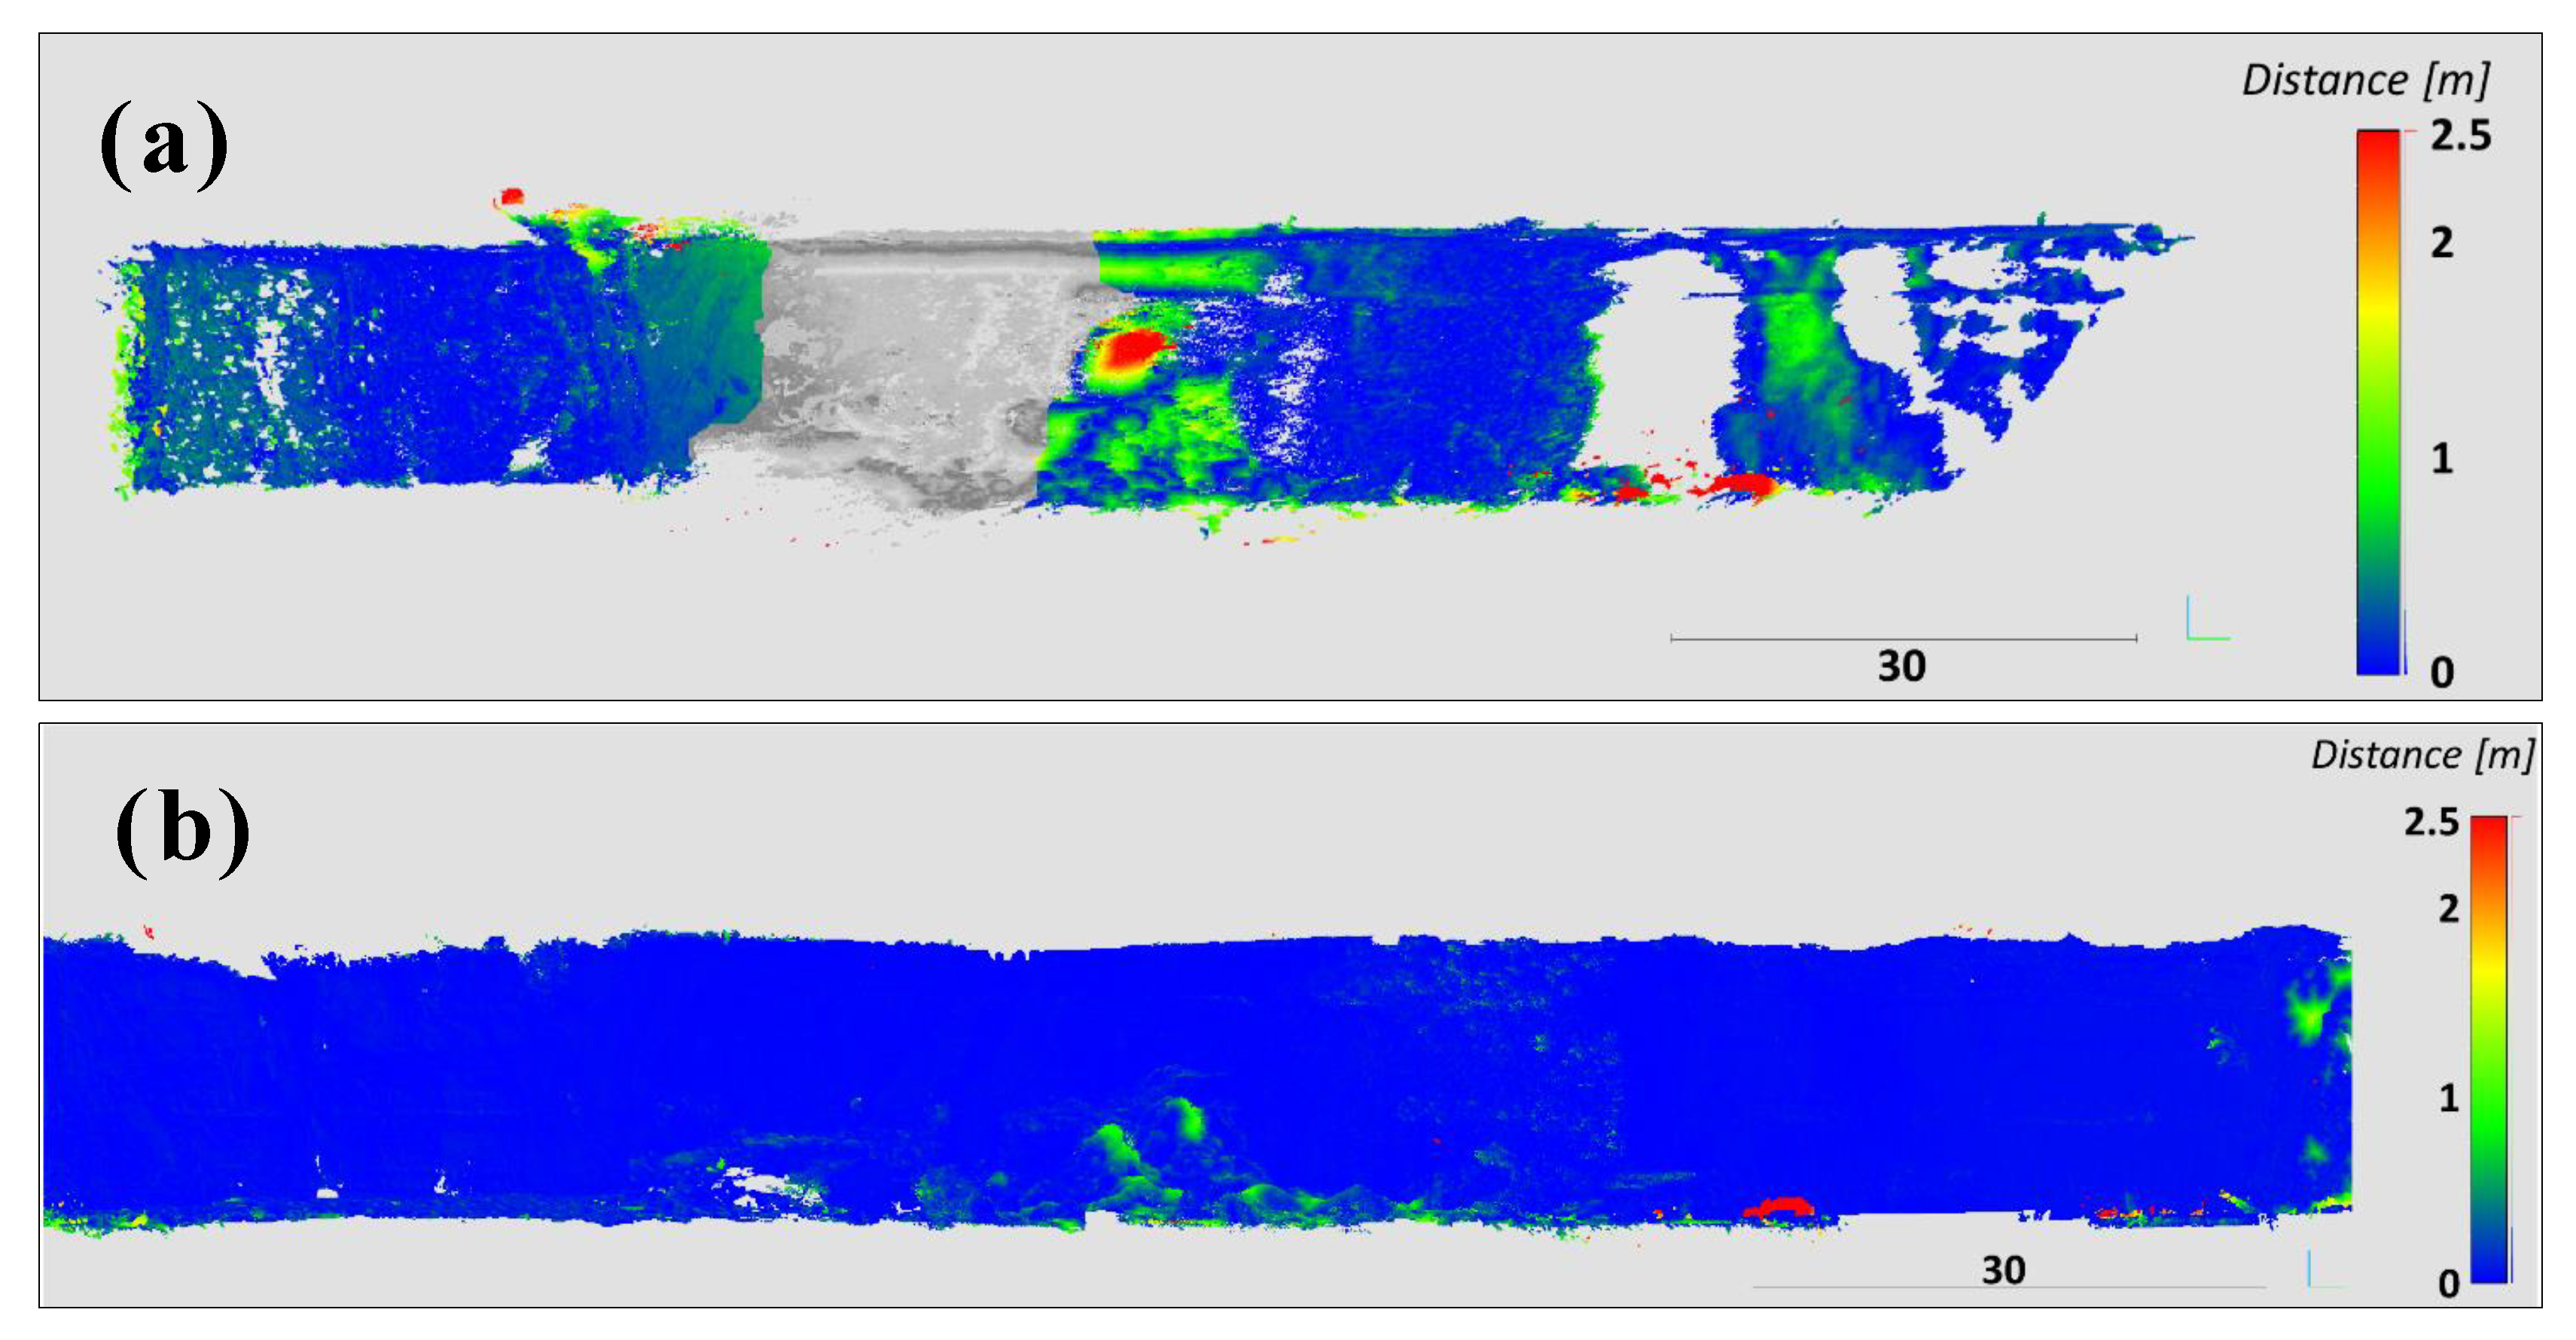
The difference between F19 and R17 highlighted the block failure noticed in the visual comparison shown in picture (a) of
Figure 8. A second change observed is located in the sector affected by the aforementioned artifacts. The rest of the cliff results were unaffected by distinct rock failures or similar phenomena. The assessment of F19 and F18, reported in picture (b) of
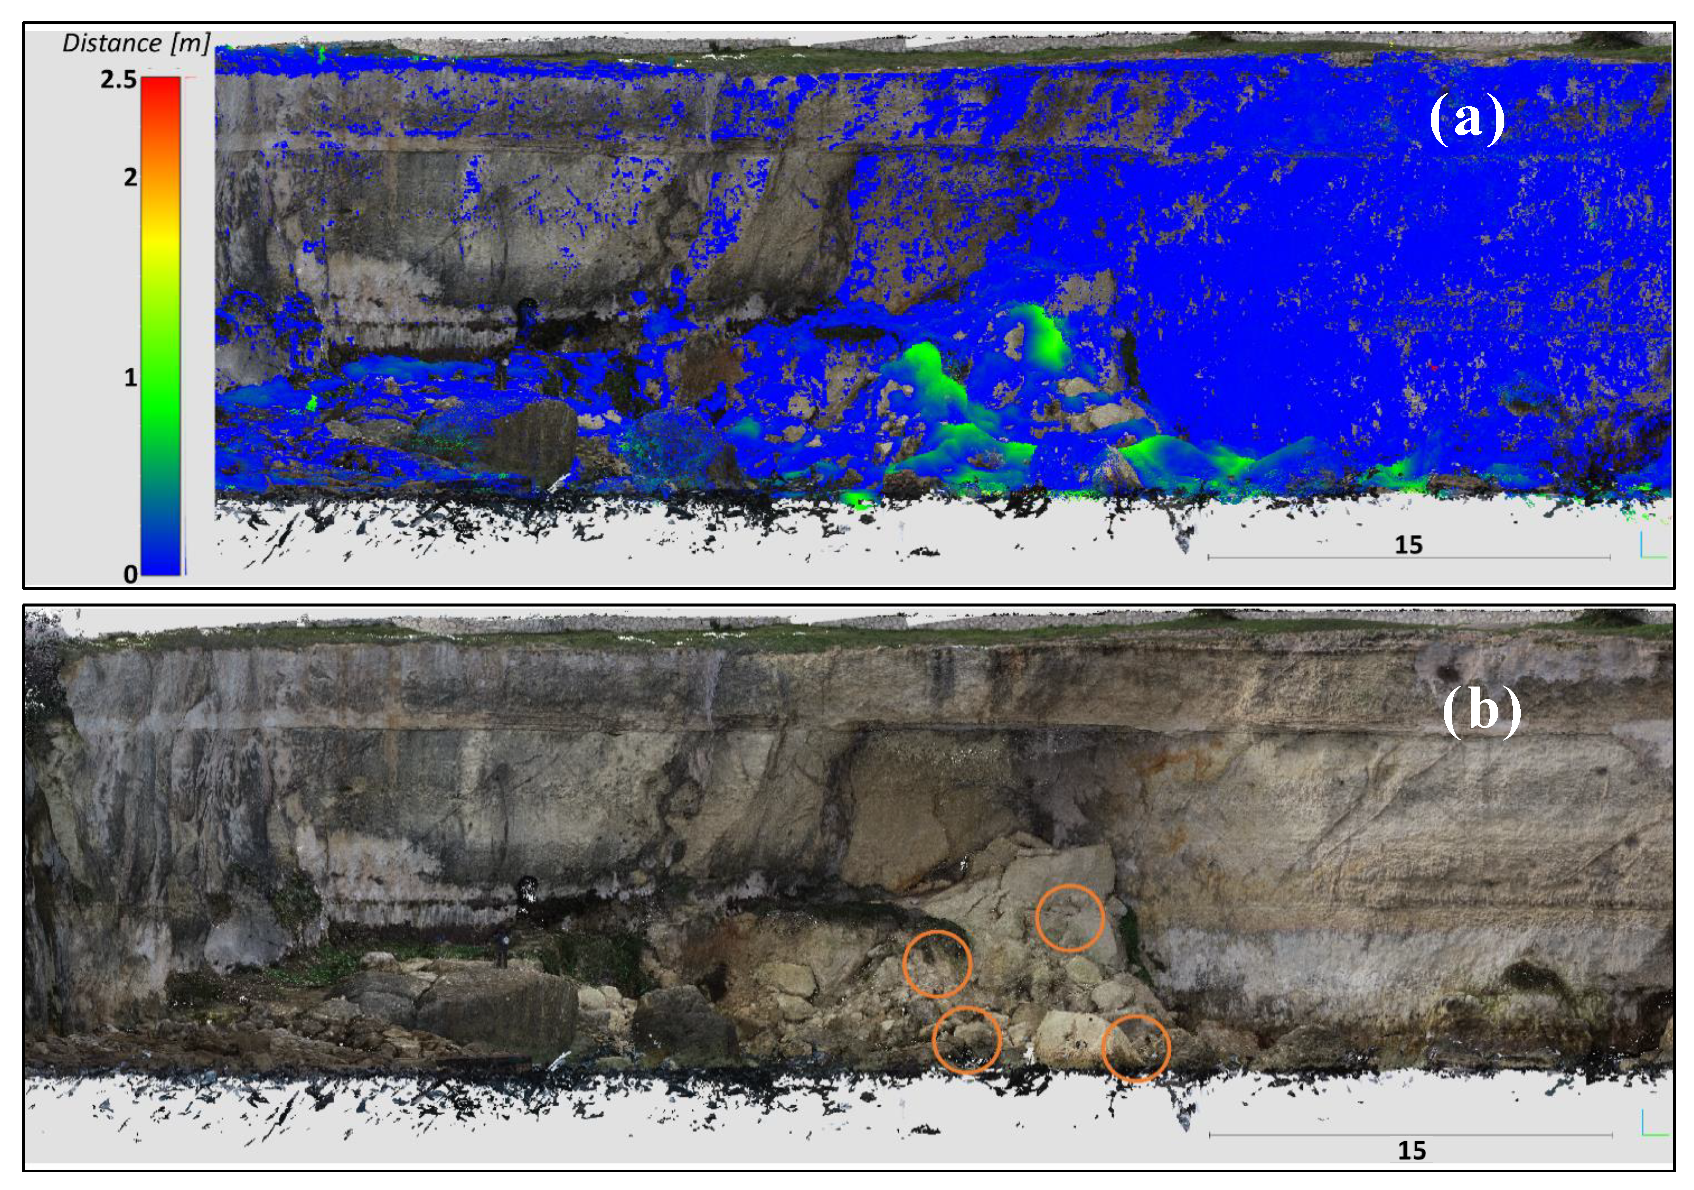
Figure 8, confirmed the insights provided by the previous analysis, thus highlighting only the ongoing erosion process on the block fragments which originated by the main block failure. The details of this erosive process are shown in
Figure 9.
4.2. Results of 3D Finite Element Method Analyses
4.2.1. Pre- and Post-Rock Block Detachment Comparison
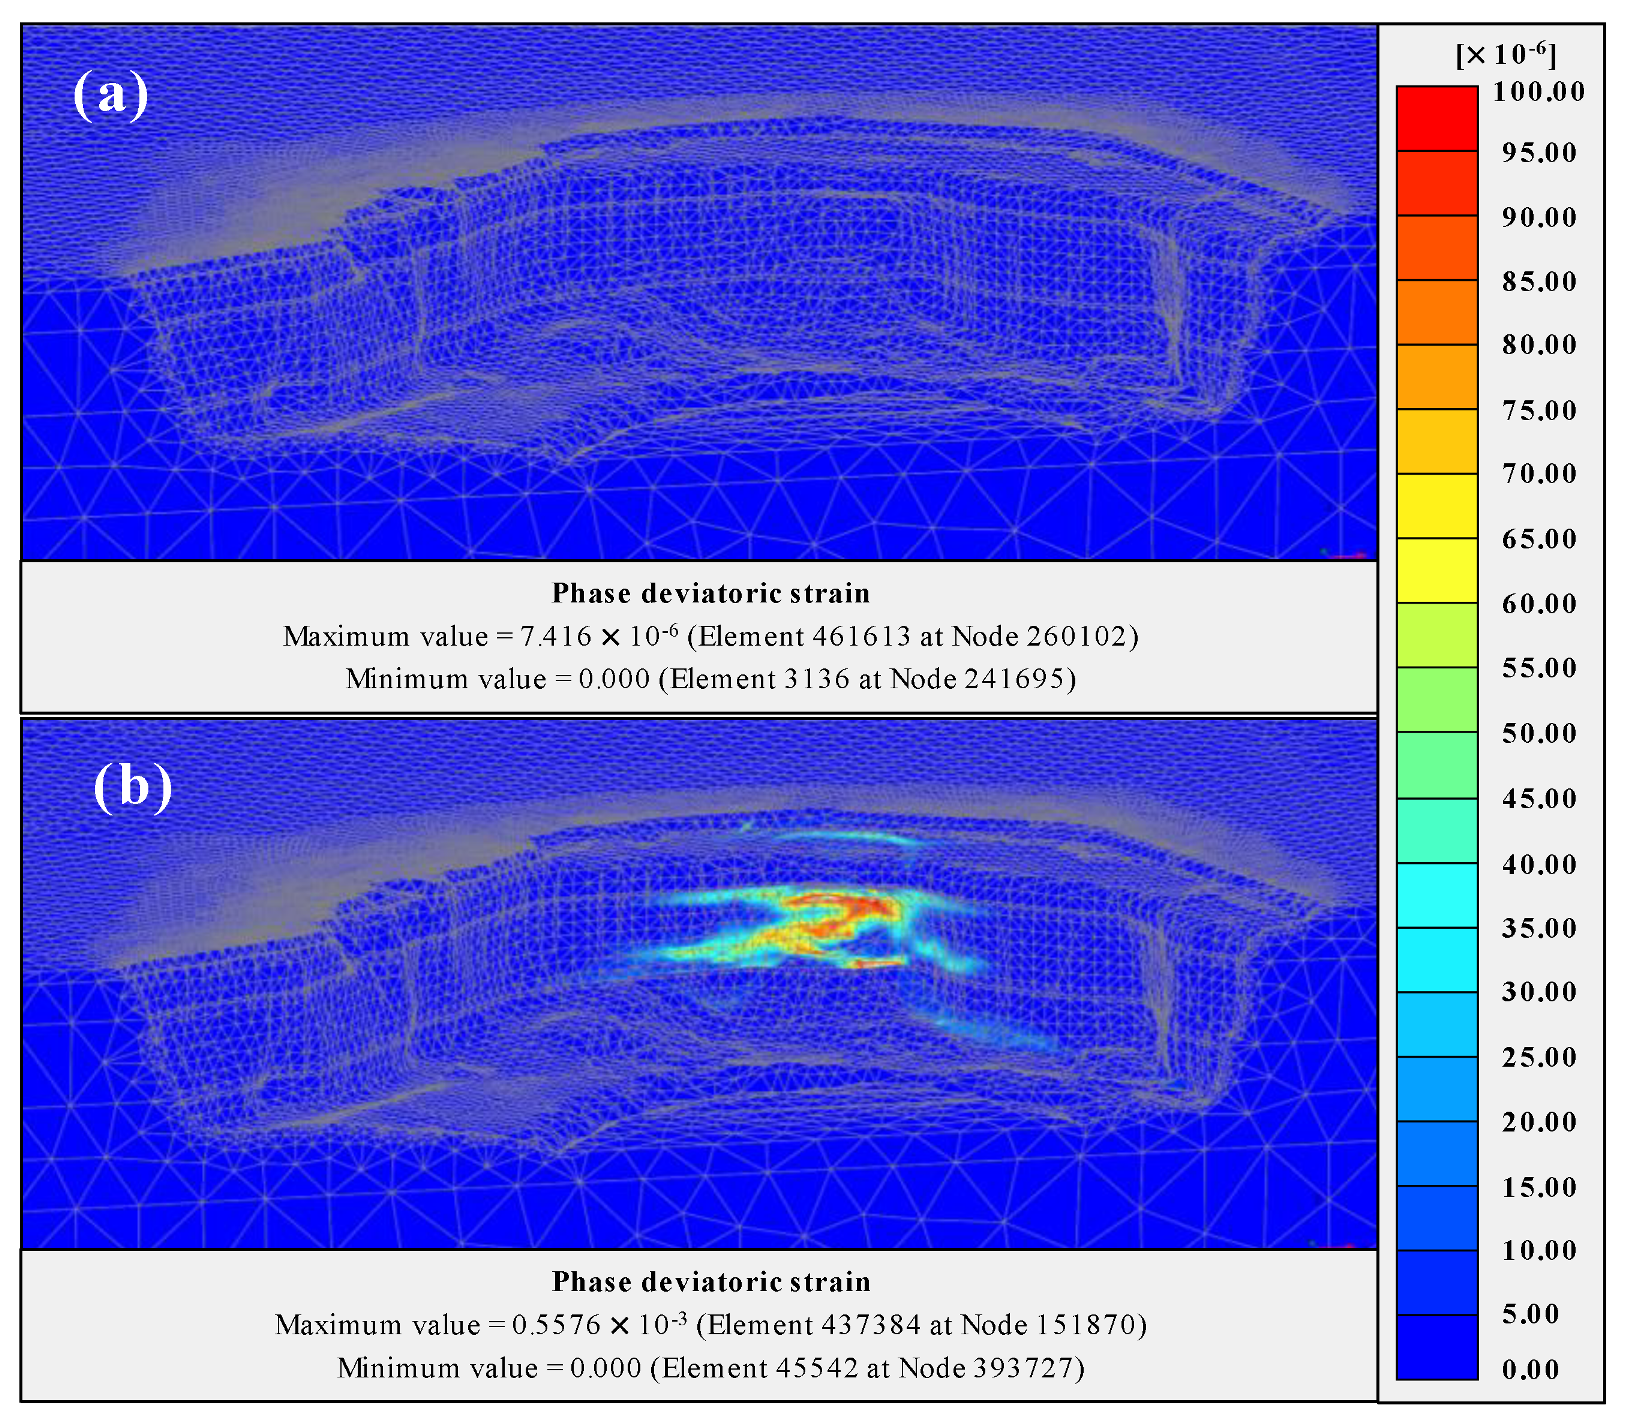
With reference to the plastic calculation phases, the analysis provides an increase of local instabilities in the portion of the cliff where erosive detachment is simulated.
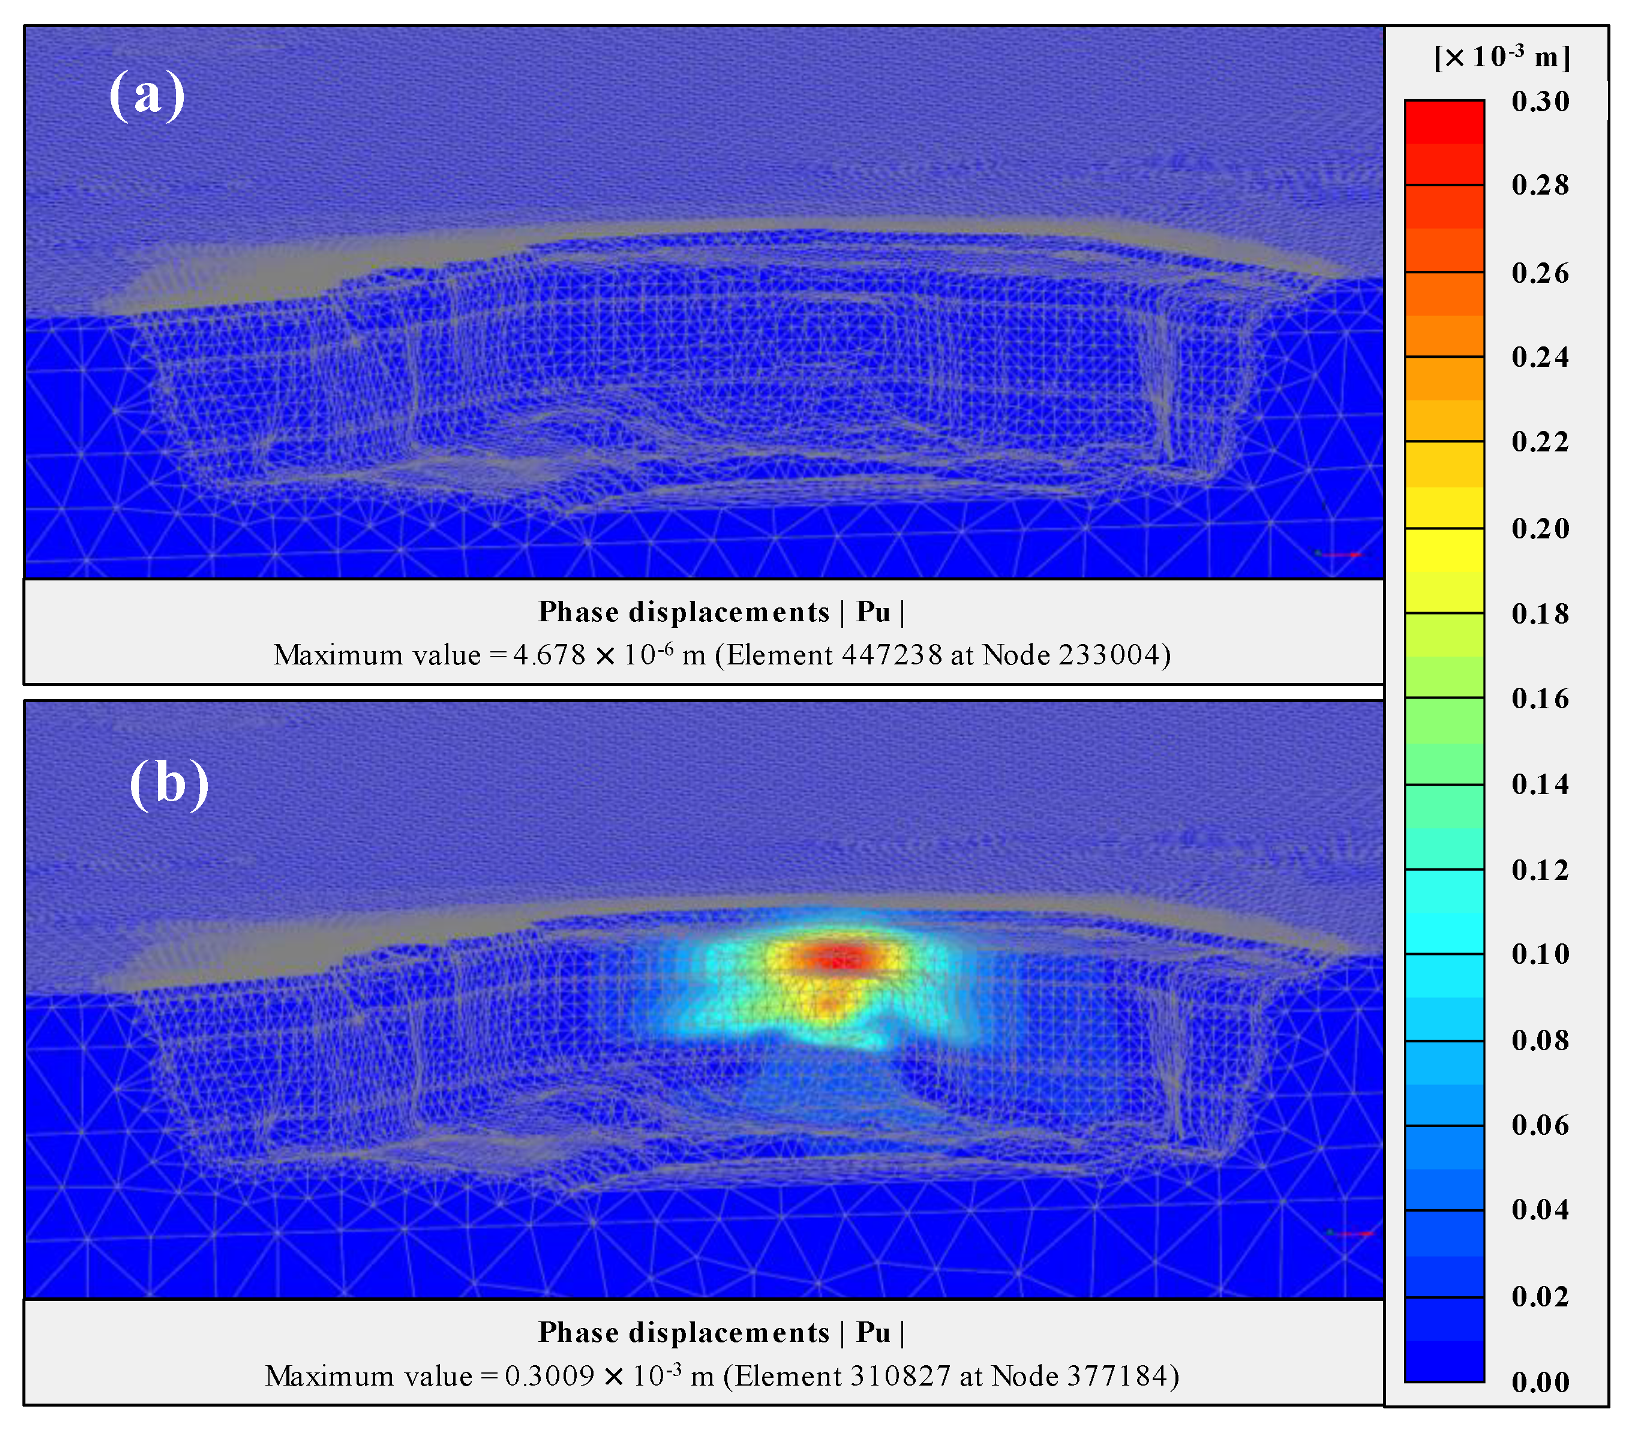
Figure 10 shows the comparison of the contours of deviatoric strains, calculated (a) pre- and (b) post-erosion. At the same time, the contours of cumulated displacements derived after the erosion simulation, despite being of low value, confirm a weakness of the area directly affected by the erosion and of the surrounding area (
Figure 11).
In both models (pre- and post-erosion), the finite element analysis converges and a little lowering of safety factor is registered, thus suggesting the potential for a general failure mechanism.
Figure 12 reports the contours of the calculated displacements obtained from such safety phases of analyses and confirms that the ongoing erosive processes cause a higher proneness to the general instability mechanism. In particular,
Figure 12a is referred to the safety calculation prior to the block detachment which presumably occurred before 2017. The value of the stability factor is FS = 1.206 and the final failure mechanism concerns primarily the area overlying the zone affected by the erosion, although remarkable values of displacement are also detected in the left part of the cliff.
Figure 12b instead refers to the post-erosion condition and, in this case, the value of the safety factor results in F = 1.16, with a general failure mechanism practically the same as the previous one, but with an increase of displacements due to the simulated erosion. In both cases, the upper stiffer calcarenite rock stratum works as a shelf against the risk of global collapse, whereas the erosion in the underlying calcisiltite softer stratum represents a predisposing factor against this risk.
The comparison between the contours corresponding to the situations of pre- and post-block detachment shows that, on the cliff, there are two zones prone to the general instability phenomena, and in the area where the deactivation of the volume material is simulated an increase of the deformation levels is obtained.
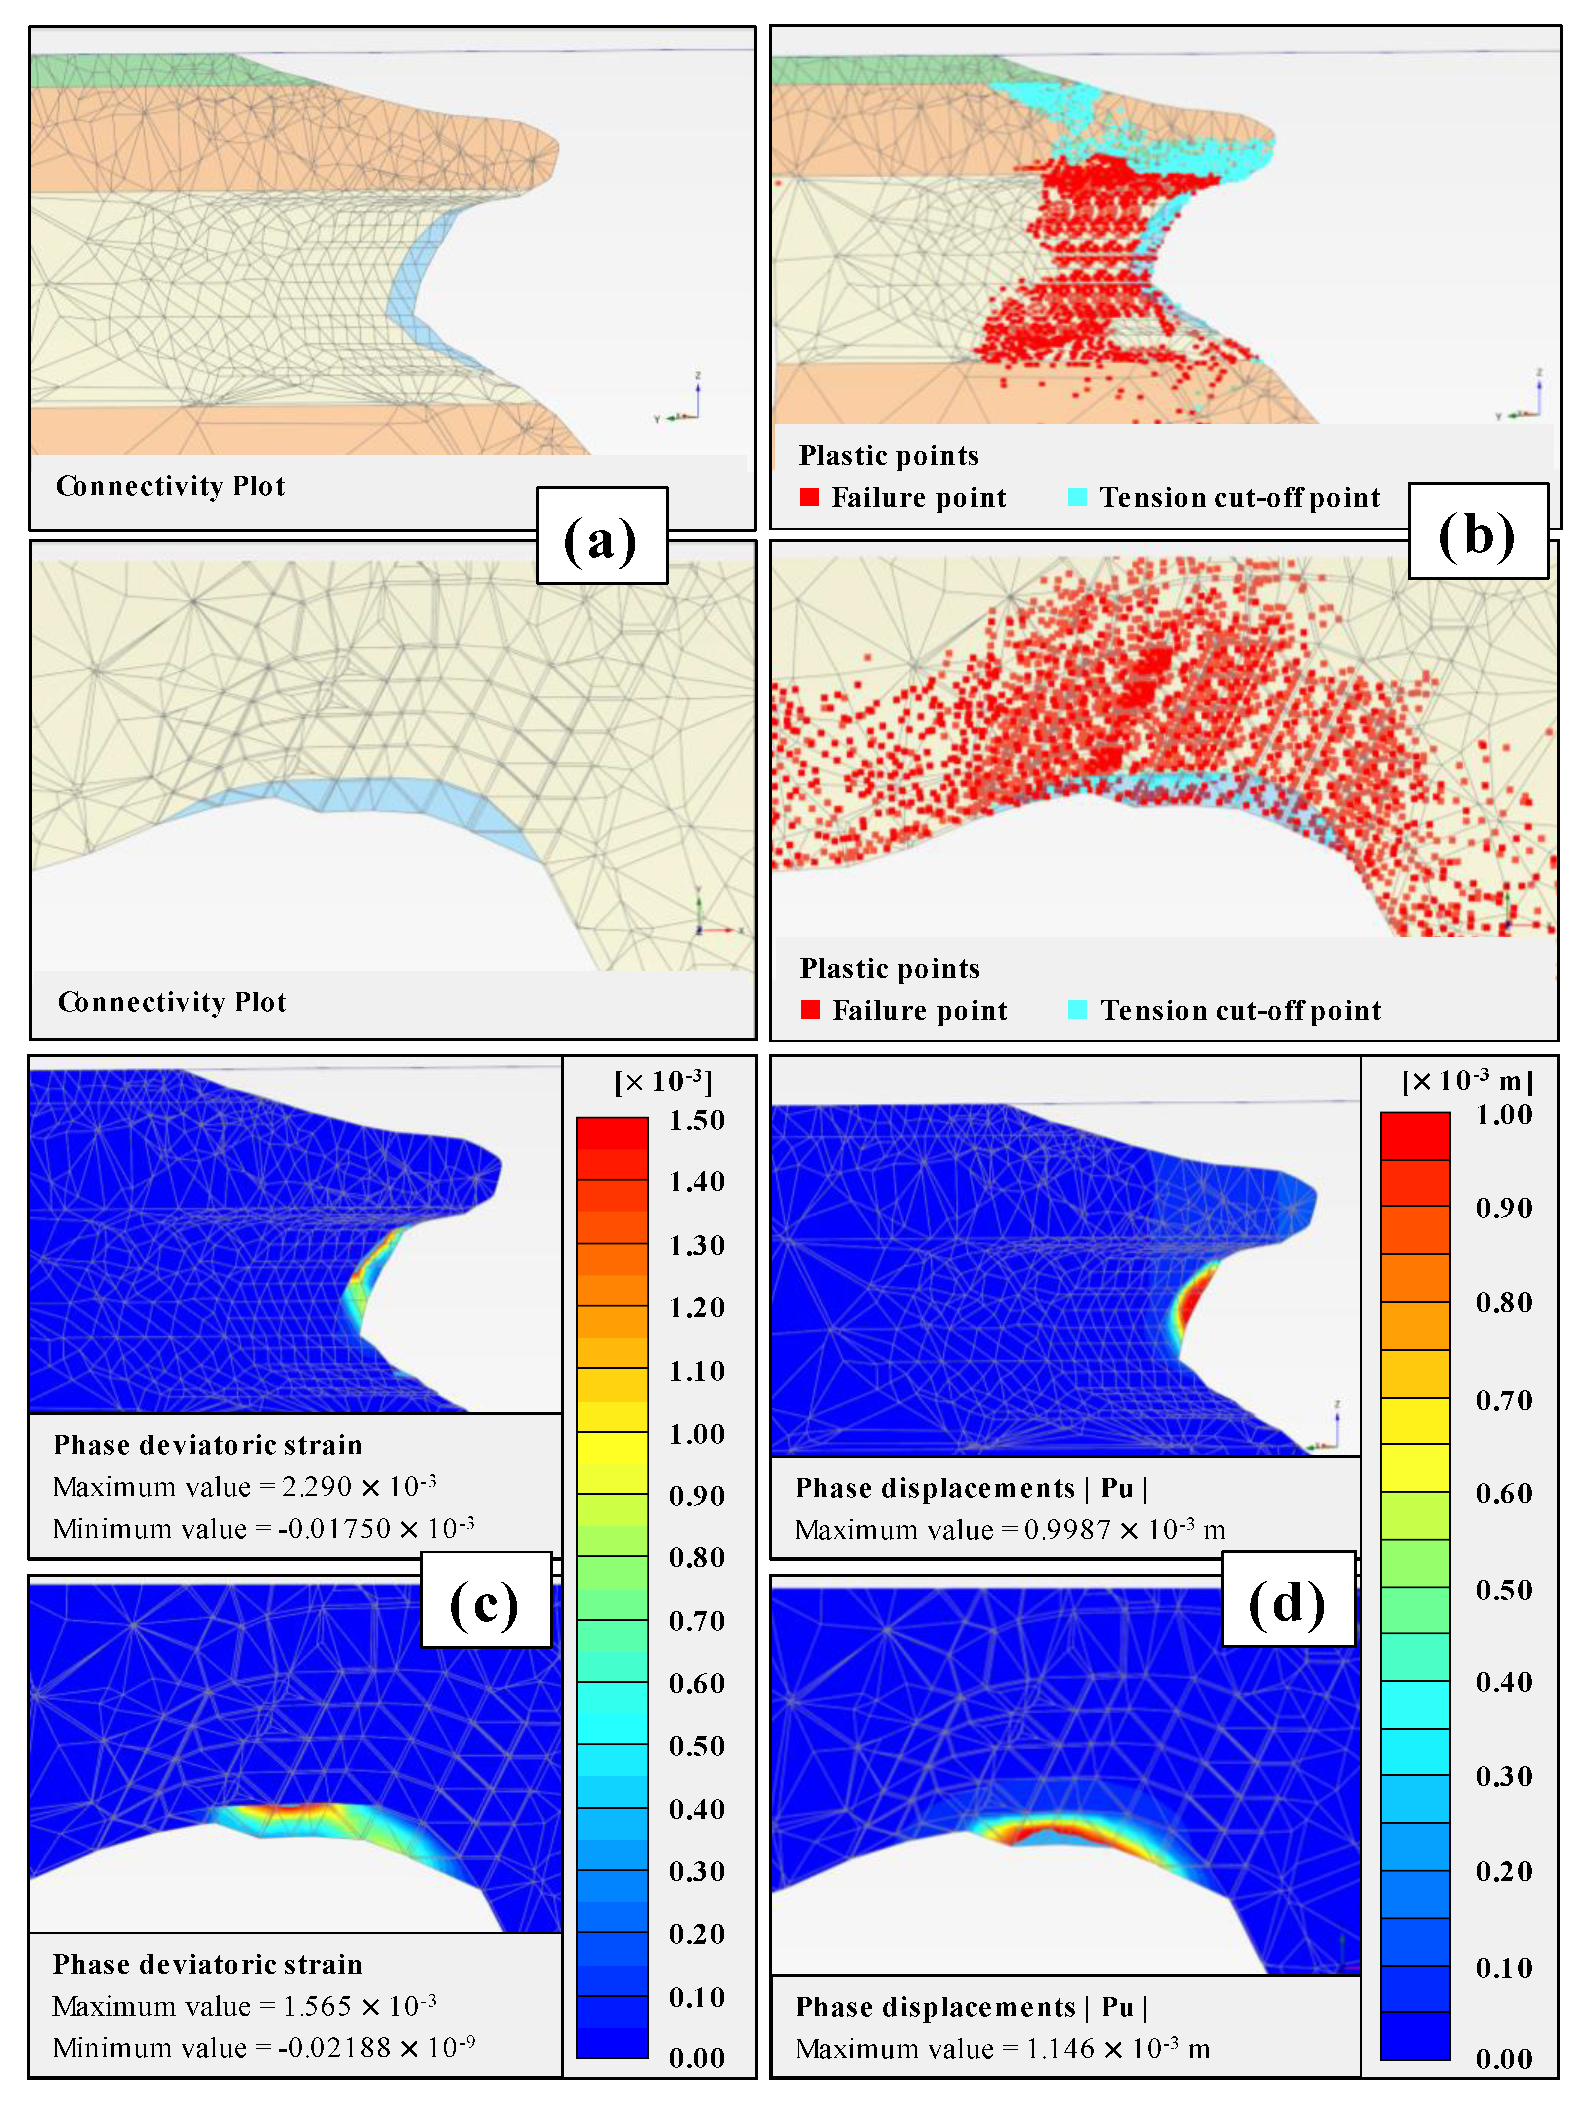
4.2.2. Numerical Analyses Simulating the Rock Block Detachment
The detachment of the rock block, as registered from the SfM analysis, appears, in
Figure 5b, due to the local presence of rock material with a high silt density calcisiltitic unit. In order to compute the lowering of the mechanical parameters capable of inducing rock block detachments, a third sub-phase of plastic calculation was added. In this phase, the process of rock cementation loss is pursued through a reduction of cohesion applied to the external rock volumes affected by the erosion. In particular, this numerical analysis is supposed to simulate the decay of strength parameters consequent to the environmental weathering processes generated by rainfalls, sea and wind actions, which are strongly active in the study area. For the light blue volume in
Figure 7a, the cohesion and tensile strength have been progressively reduced, down to strength parameters representative of an uncemented behavior, as c’ = 1 kPa and σt = 1 kPa, whereas the friction angle remains at the same value of
Table 3 (φ’ = 26°). In this case, the numerical analysis does not converge and the corresponding results in terms of plastic points, contours of deviatoric strains, and contours of cumulated displacements well reproduce the block detachment event, as shown in
Figure 13 (in both the horizontal and vertical section). Moreover, the distribution of plastic and tension cut-off points, shown in
Figure 13b, suggests a propagation of failure within the middle calcisiltite layer (mainly plastic points) and the upper calcarenite layer (tension cut-off points), thus confirming a weakening induced by the rock detachment process.
5. Discussion
The comparison analysis of SfM highlighted, in
Figure 8 and
Figure 9, both the block failure (F19 vs. R17 clouds) and the block fragments accumulation (F19 vs. F18 clouds).
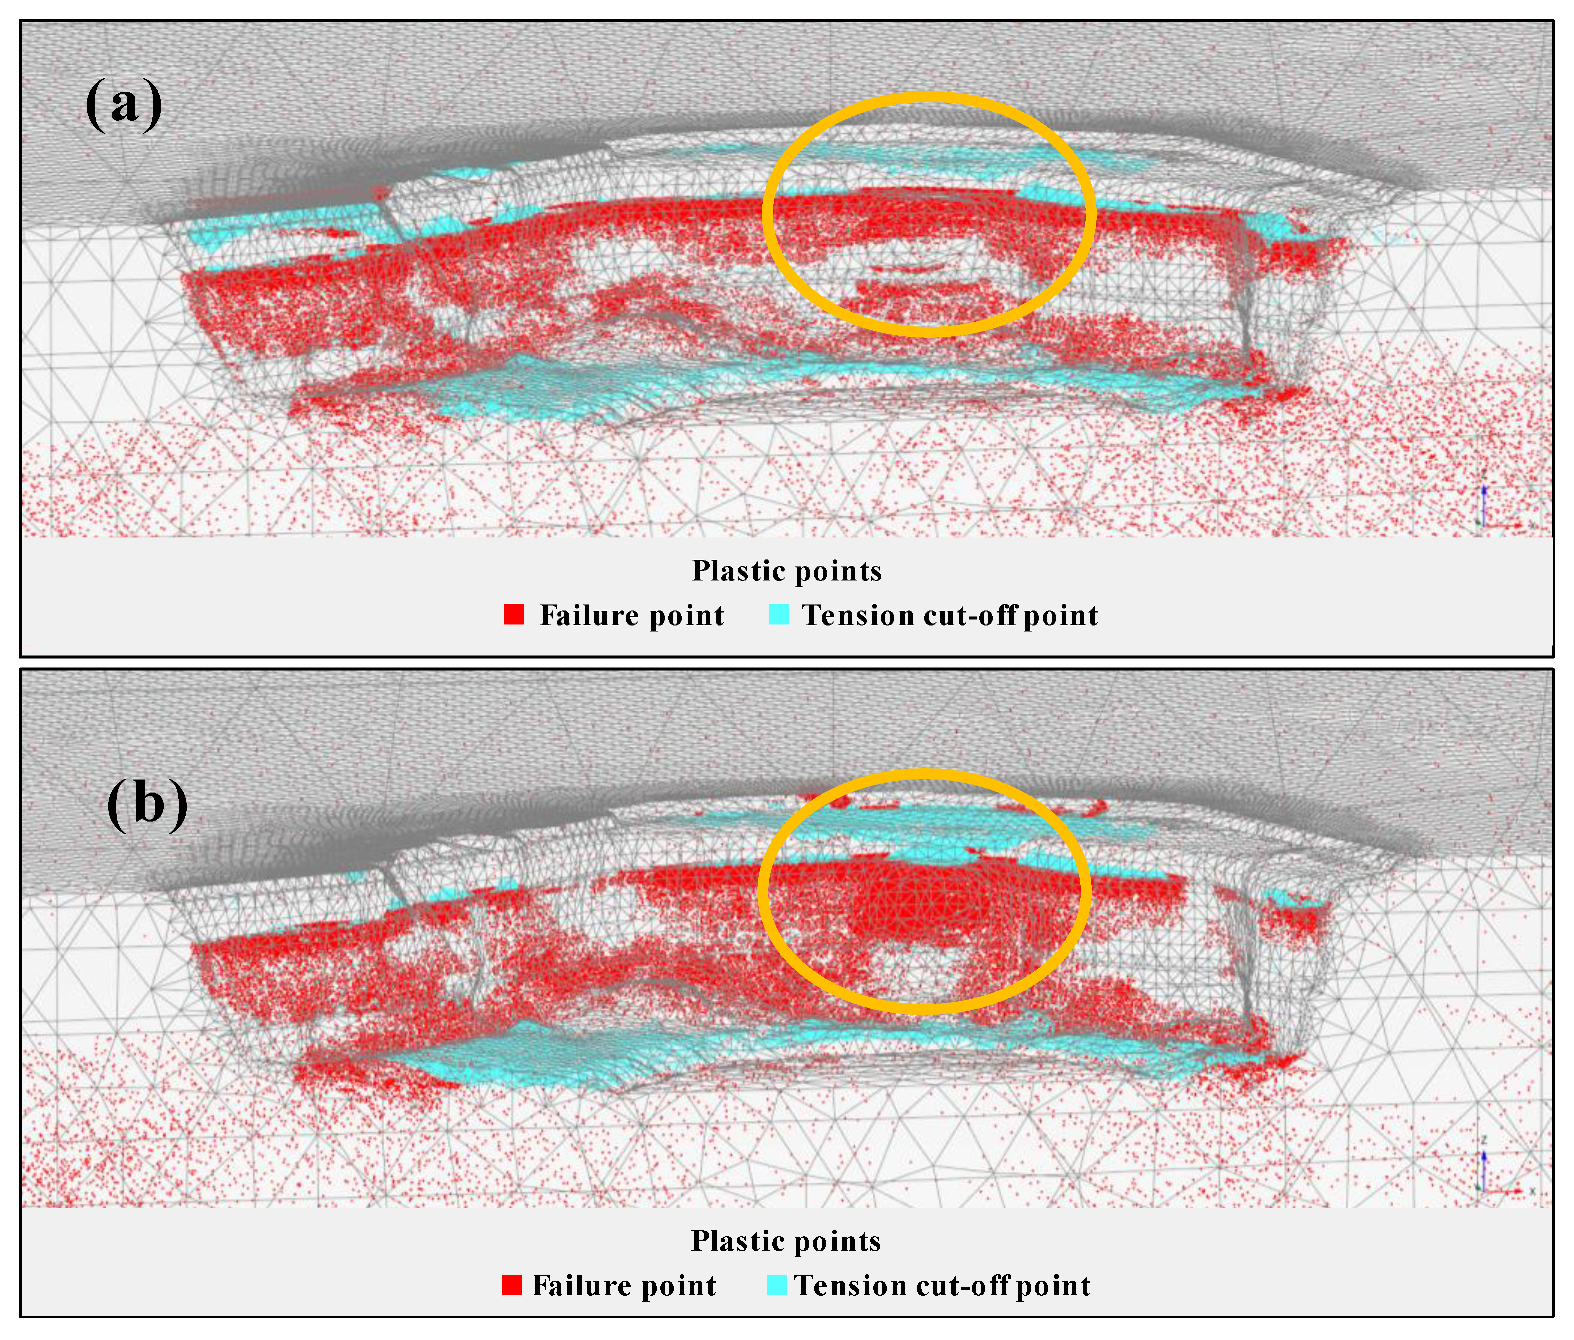
The numerical analyses, performed on the models calibrated by the means point clouds dataset, provided both the simulation of the block failure which occurred, and the comparison of the stability conditions in pre- and post-rock detachment scenarios. A lowering of the safety factor, estimated at around 4%, and an increase of displacements and deviatoric strains, are detected. The increase of plastic points, achieved the simulating block failure, is confirmed from the comparison of the distributions of plastic points in the pre- and post-block failure analyses, as shown in
Figure 14.
The orange circles, in
Figure 14, focus on the higher density of the plastic (both failure and tension cut-off) points in the area where the block detachment is simulated, whereas, in the other sectors of the cliff, considerable changes are not detected.
6. Conclusions
The coupling of terrestrial and UAV digital images for the cliff sector under study has provided a photogrammetric database to derive continuous geometrical surfaces to be implemented in three-dimensional numerical models for qualitative (potential failure mechanism) and quantitative (safety factor computation) assessment of the stability conditions of the sea cliff.
At the same time, the multi-temporal comparison of 3D point clouds, performed with the Structure from Motion techniques, revealed an ongoing erosive process in a zone of the cliff, which is subjected to the potential instabilities phenomena.
The 3D FEM analyses simulating the pre- and post-block detachment scenarios, identified the zones of the cliff which are more susceptible to deformations and failure. Along the cliff, the erosion is strongly active within the superficial rock material and, specifically, within the rock layer, i.e., calcisiltite (which presents a higher silt content and tends to behave as a slightly cemented to uncemented sand with very poor strength parameters). Here, a local failure, due to the loss of strength in cementation bonds, can take place and an increase in deformations and plastic zones is obtained in the surrounding areas.
This type of local failure is frequent in the examined geological context. In fact, the presence of high silty/sandy calcisiltitic unit or discontinuity systems filled with cementless materials (prone to weathering and able to reach a very low value of cementation) can generate a rock block failure that induce, in the long-term, a general instability process of the cliff [
13].
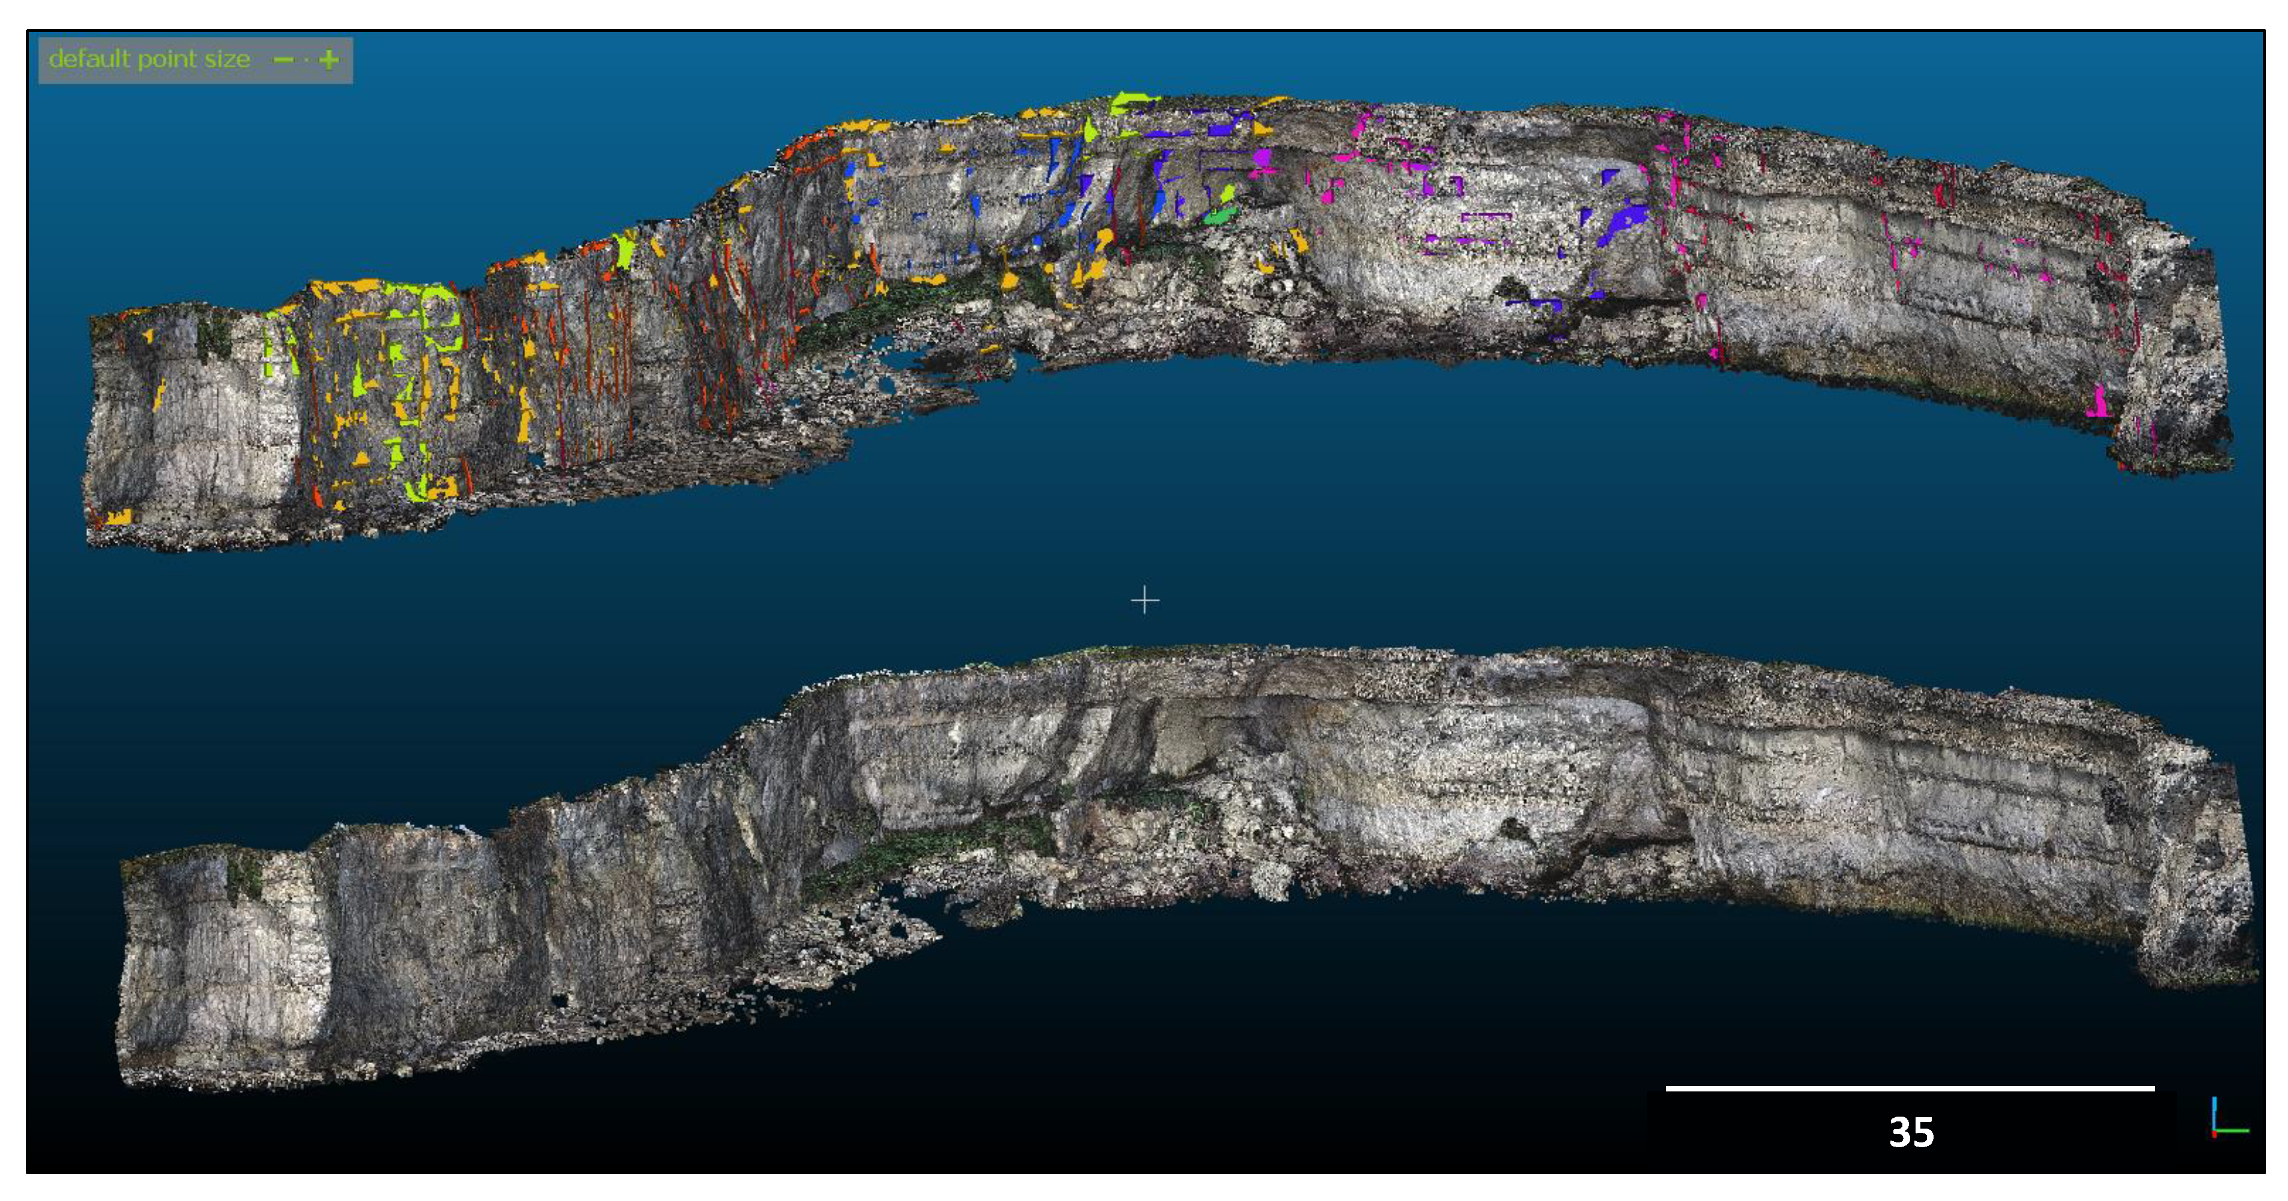
The results of numerical analyses provide indications on the areas to observe in the following monitoring activity (terrestrial and UAV) in order to control the generation or propagation of both local and general failure mechanisms. In this perspective, the identification of areas susceptible to local collapses can be also implemented through a mapping of fractures, in which the presence of uncemented material can occur. An example of the fractures mapping, using a tool for facet/fracture detection [
25], is reported in
Figure 15 where fractures differ in color based on their dip direction and dip angle.
The detected fractures systems are referred to the F19 cloud and the result is located in the areas identified by the FEM analyses where an accumulation of plastic points is calculated. This tool of the SfM technique is useful, especially at a local scale, for modelling geometrical entities in the 3D FEM analyses in order to account for local potential detachments of rock blocks.
In the case study presented here, it was found how local instabilities can influence general failure mechanisms. The block detachment, in fact, favors a shelf behavior of the rock portion located above the inner cavity, due to an increase in the number of tensile failures.
An increasing risk of general failure is deemed to occur due to the reduction of the safety factor values consequent to the erosion events, which are supposed to be enhanced by cyclic loads on the cliff surface, as, for example, those generated by sea, wave and wind actions that weaken the cementation bonds of the rock.
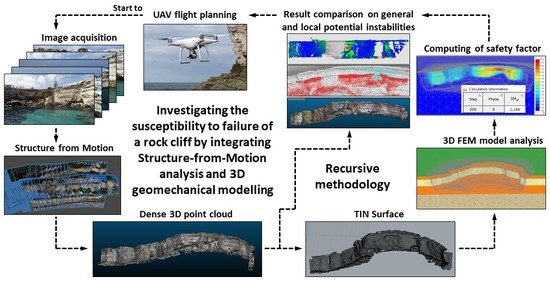
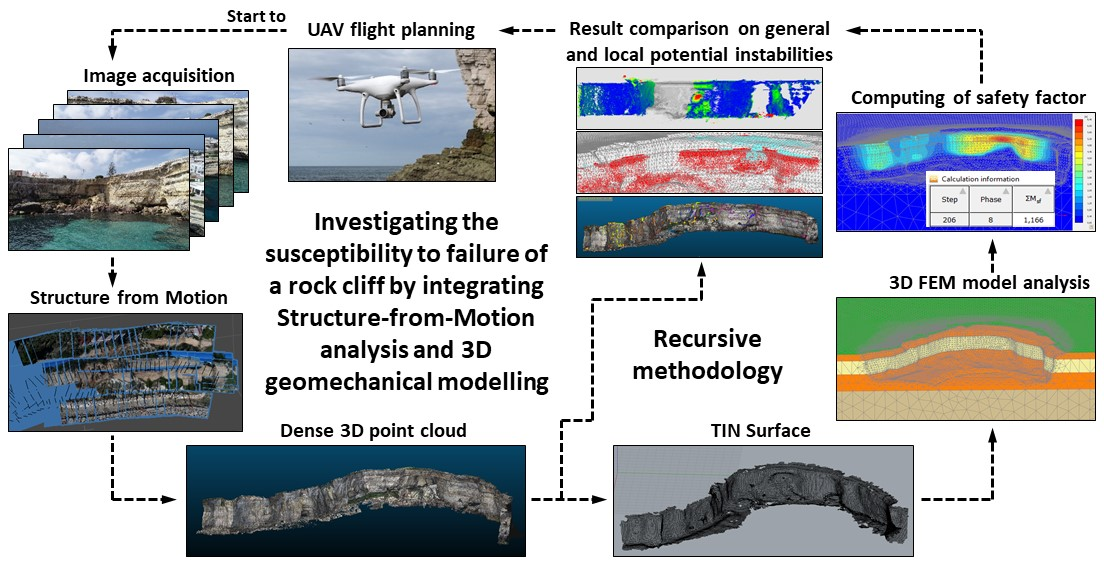
To start from the first UAV flight, a recursive methodology of monitoring, which should implement SfM techniques, 3D FEM stability analyses, geomechanical characterization of rock mass, and fractures systems detection, can be pursued (See Graphical Abstract).
Author Contributions
M.P. organized the structure of the paper, carried out the laboratory tests on rock samples, and wrote the sections related to the geomechanical characterization and the FEM analyses; D.G. stored the acquired images, processed the point cloud data, and wrote the sections related to the SfM analyses; P.A. planned the activities on site, outlined the monitoring methodology, and wrote the introductory parts; M.B. performed the UAV flight and terrestrial survey on-site for GCP location; N.L.F. schematized the coupling of UAV-FEM techniques, managed the TIN surfaces and provided for the construction of the FEM model; P.L. conceptualized the research work, coordinated the multidisciplinary assembling, and wrote the section related to the discussion of the results and the final comments. All authors have read and agreed to the published version of the manuscript.
Funding
This research has been funded by the Apulia regional authority.
Acknowledgments
The work is part of the research project “Integrated assessment of geo-hydrological instability processes in Apulia region, interpretative models and rainfall thresholds for shallow landslides” (POR-FESR 2014–2020).
Conflicts of Interest
The authors declare no conflict of interest.
References
- Harwin, S.; Lucieer, A. Assessing the accuracy of georeferenced point clouds produced via multi-view stereopsis from Unmanned Aerial Vehicle (UAV) imagery. Remote Sens. 2012, 4, 1573–1599. [Google Scholar] [CrossRef] [Green Version]
- Kääb, A.; Girod, L.; Berthling, I. Surface kinematics of periglacial sorted circles using structure-from-motion technology. Cryosphere 2014, 8, 1041–1056. [Google Scholar] [CrossRef] [Green Version]
- Genchi, S.A.; Vitale, A.J.; Perillo, G.M.; Delrieux, C.A. Structure-from-motion approach for characterization of bioerosion patterns using UAV imagery. Sensors 2015, 15, 3593–3609. [Google Scholar] [CrossRef] [PubMed] [Green Version]
- James, M.R.; Robson, S. Straightforward reconstruction of 3D surfaces and topography with a camera: Accuracy and geoscience application. J. Geophys. Res. Earth 2012, 117. [Google Scholar] [CrossRef] [Green Version]
- Mancini, F.; Dubbini, M.; Gattelli, M.; Stecchi, F.; Fabbri, S.; Gabbianelli, G. Using unmanned aerial vehicles (UAV) for high-resolution reconstruction of topography: The structure from motion approach on coastal environments. Remote Sens. 2013, 5, 6880–6898. [Google Scholar] [CrossRef] [Green Version]
- Westoby, M.J.; Brasington, J.; Glasser, N.F.; Hambrey, M.J.; Reynolds, J.M. ‘Structure-from-Motion’ photogrammetry: A low-cost, effective tool for geoscience applications. Geomorphology 2012, 179, 300–314. [Google Scholar] [CrossRef] [Green Version]
- Fonstad, M.A.; Dietrich, J.T.; Courville, B.C.; Jensen, J.L.; Carbonneau, P.E. Topographic structure from motion: A new development in photogrammetric measurement. Earth Surf. Process. Landf. 2013, 38, 421–430. [Google Scholar] [CrossRef] [Green Version]
- Nex, F.; Remondino, F. UAV for 3D mapping applications: A review. Appl. Geomat. 2014, 6, 1–15. [Google Scholar] [CrossRef]
- Mancini, F.; Castagnetti, C.; Rossi, P.; Dubbini, M.; Fazio, N.L.; Perrotti, M.; Lollino, P. An Integrated Procedure to Assess the Stability of Coastal Rocky Cliffs: From UAV Close-Range Photogrammetry to Geomechanical Finite Element Modeling. Remote Sens. 2017, 9, 1235. [Google Scholar] [CrossRef] [Green Version]
- Giordan, D.; Adams, M.; Aicardi, I.; Alicandro, M.; Allasia, P.; Baldo, M.; Berardinis, P.; Dominici, D.; Godone, D.; Hobbs, P.; et al. The use of unmanned aerial vehicles (UAVs) for engineering geology applications. Bull. Eng. Geol. Environ. 2020. [Google Scholar] [CrossRef] [Green Version]
- Doukari, M.; Batsaris, M.; Papakonstantinou, A.; Topouzelis, K. A Protocol for Aerial Survey in Coastal Areas Using UAS. Remote Sens. 2019, 11, 1913. [Google Scholar] [CrossRef] [Green Version]
- Giordan, D.; Mancon, A.; Facello, A.; Baldo, M.; Dell’Anese, F.; Allasia, P.; Dutto, F. Brief Communication: The use of an unmanned aerial vehicle in a rockfall emergency scenario. Nat. Hazards Earth Syst. Sci. 2015, 15, 163–169. [Google Scholar] [CrossRef] [Green Version]
- Fazio, N.L.; Perrotti, M.; Andriani, G.F.; Mancini, F.; Rossi, P.; Castagnetti, C.; Lollino, P. A new methodological approach to assess the stability of discontinuous rocky cliffs using in-situ survey supported by UAV-based techniques and 3-D finite element model: A case study. Eng. Geol. 2019, 260, 105205. [Google Scholar] [CrossRef]
- Fazio, N.L.; Leo, M.; Perrotti, M.; Lollino, P. Analysis of the Displacement Field of Soft Rock Samples During UCS Tests by Means of a Computer Vision Technique. Rock Mech. Rock Eng. 2019. [Google Scholar] [CrossRef]
- Warrick, J.A.; Ritchi, A.C.; Adelman, G.; Adelman, K.; Limber, P.W. New techniques to measure cliff change from historical oblique aerial photographs and Structure-from-Motion photogrammetry. J. Coast. Res. 2016, 33, 39–55. [Google Scholar] [CrossRef] [Green Version]
- Lollino, P.; Pagliarulo, R.; Trizzino, R.; Santaloia, F.; Pisano, L.; Zumpano, V.; Perrotti, M.; Fazio, N.L. Multi-scale approach to analyse the evolution of soft rock coastal cliffs and role of controlling factors: A case study in south-eastern Italy. Earth Surf. Process. Landf. 2020. under review. [Google Scholar]
- ASTM D7012-14. Standard Test Method for Compressive Strength and Elastic Moduli of Intact Rock Core Specimens under Varying States of Stress and Temperatures; ASTM International: West Conshohocken, PA, USA, 2014. [Google Scholar]
- Ciantia, M.O.; Castellanza, R.; Di Prisco, C. Experimental study on the water-induced weakening of calcarenites. Rock Mech. Rock Eng. 2015, 48, 441–461. [Google Scholar] [CrossRef]
- Andriani, G.F.; Walsh, N. Petrophysical and mechanical properties of soft and porous building rocks used in apulian monuments (South Italy). Geol. Soc. Lond. Spec. Publ. 2010, 333, 129–141. [Google Scholar] [CrossRef]
- ISRM. Suggested Methods for the Quantitative Description of Discontinuities in Rock Masses. Int. J. Rock Mech. Min. Sci. Geomech. Abstr. 1978, 15, 319–368. [Google Scholar]
- Hoek, E.; Brown, E.T. The Hoek–Brown Failure Criterion and GSI—2018 edition. J. Rock Mech. Geotech. Eng. 2019, 11, 445–463. [Google Scholar] [CrossRef]
- Euler, H.J.; Keenan, C.R.; Zebhauser, B.E.; Wübbena, G. Study of a Simplified Approach in Utilizing Information from Permanent Reference Station Arrays. In Proceedings of the National Technical Meeting of the Satellite Division of the Institute of Navigation, (ION GPS 2001), Salt Lake City, UT, USA, 11–14 September 2001; Volume 104, pp. 371–391. [Google Scholar]
- Godone, D.; Allasia, P.; Borrelli, L.; Gullà, G. UAV and Structure from Motion Approach to Monitor the Maierato Landslide Evolution. Remote Sens. 2020, 12, 1039. [Google Scholar] [CrossRef] [Green Version]
- Samberg, A. An implementation of the ASPRS LAS standard. In Proceedings of the ISPRS Workshop on Laser Scanning and SilviLaser, Espoo, Finland, 12–14 September 2007; Volume 36 (Part 3/W52), pp. 363–372. [Google Scholar]
- CloudCompare (Version 2.7.0) [GPL Software]. 2020. Available online: http://www.cloudcompare.org (accessed on 25 June 2020).
- PLAXIS 3D [Computer Software]. Plaxis, 2016, Delft, The Netherlands. Available online: https://www.bentley.com/en/products/brands/plaxis (accessed on 31 March 2020).
- ISPRA. La rete di monitoraggio meteo marino nazionale. Rete Ondametrica Nazionale (RON) e rete Mareografica Nazionale (RMN). Stazione di Otranto. 2020, Mareografico.it. Available online: http://dati.isprambiente.it/dataset/ron-rete-ondametrica-nazionale (accessed on 18 September 2020).
- Cai, M. Practical estimates of tensile strength and Hoek–Brown strength parameter mi of brittle rocks. Rock Mech. Rock Eng. 2010, 43, 167–184. [Google Scholar] [CrossRef]
- USDA United States Department of Agriculture. Engineering Classification of Rock Materials. In National Engineering Handbook; Chapter 4, in Part 631; USDA: Washington, DC, USA, 2012; Natural Resources Conservation Service (NRCS), 210-VI-NEH, Amend. 55. [Google Scholar]
Figure 1.
Coastal cliff of Torre dell’Orso; (a) location and site coordinates (Google Earth®); (b) panoramic view.
Figure 1.
Coastal cliff of Torre dell’Orso; (a) location and site coordinates (Google Earth®); (b) panoramic view.
Figure 2.
Typical calcarenitic outcrops of sea cliffs, with location (Google Earth®), in the marine area of Melendugno: (a) North area of Torre dell’Orso; (b) Southern area of Sant’Andrea; (c) Southern area of Torre dell’Orso; (d) North area of Sant’Andrea.
Figure 2.
Typical calcarenitic outcrops of sea cliffs, with location (Google Earth®), in the marine area of Melendugno: (a) North area of Torre dell’Orso; (b) Southern area of Sant’Andrea; (c) Southern area of Torre dell’Orso; (d) North area of Sant’Andrea.
Figure 3.
Stratigraphy of the site with alternating calcarenite layers: (
a) Vertical survey a few meters to the cliff (from [
16]); (
b) observed stratification (from [
13]).
Figure 3.
Stratigraphy of the site with alternating calcarenite layers: (
a) Vertical survey a few meters to the cliff (from [
16]); (
b) observed stratification (from [
13]).
Figure 4.
Uniaxial compressive strength (UCS) stress-strain curves for calcarenite/calcisiltite rock (σa: Uniaxial compressive strength; εa: Axial strain). Yellow curves: Calcarenite dry samples; blue curves: Calcarenite saturated samples; red curves: Calcisiltite dry samples; green curves: Calcisiltite saturated samples.
Figure 5.
Visual comparison image: (a) 2017; (b) 2019. The orange circle highlights the block failure, which is zoomed in the orange square.
Figure 5.
Visual comparison image: (a) 2017; (b) 2019. The orange circle highlights the block failure, which is zoomed in the orange square.
Figure 6.
Artifacts in the central sector of R17, results from this sector were considered not reliable and thus excluded.
Figure 6.
Artifacts in the central sector of R17, results from this sector were considered not reliable and thus excluded.
Figure 7.
Three-dimensional (3D) Fem discretization meshes: (a) Pre- and (b) post-rock block detachment.
Figure 7.
Three-dimensional (3D) Fem discretization meshes: (a) Pre- and (b) post-rock block detachment.
Figure 8.
Comparison results [meters]: (a) Block failure from the F19 vs. R17 difference; (b) block fragments erosion from the F19 vs. F18 difference.
Figure 8.
Comparison results [meters]: (a) Block failure from the F19 vs. R17 difference; (b) block fragments erosion from the F19 vs. F18 difference.
Figure 9.
(a) Change detection overlayed on F19: Green areas depict sectors affected by the erosion; (b) point cloud F19: Highlighted sectors (orange circles) featuring erosive processes.
Figure 9.
(a) Change detection overlayed on F19: Green areas depict sectors affected by the erosion; (b) point cloud F19: Highlighted sectors (orange circles) featuring erosive processes.
Figure 10.
Deviatoric strains obtained from plastic phases: (a) pre- and (b) post-rock block detachment.
Figure 10.
Deviatoric strains obtained from plastic phases: (a) pre- and (b) post-rock block detachment.
Figure 11.
Displacements from plastic phases of analyses: (a) pre- and (b) post-rock block detachment.
Figure 11.
Displacements from plastic phases of analyses: (a) pre- and (b) post-rock block detachment.
Figure 12.
Displacements from safety phases of analyses: (a) pre- and (b) post-rock block detachment.
Figure 12.
Displacements from safety phases of analyses: (a) pre- and (b) post-rock block detachment.
Figure 13.
Results of the simulation of the rock block detachment (on the vertical and horizontal section): (a) Plot with detached block in light blue; (b) plastic points distribution; (c) deviatoric strains; (d) displacements.
Figure 13.
Results of the simulation of the rock block detachment (on the vertical and horizontal section): (a) Plot with detached block in light blue; (b) plastic points distribution; (c) deviatoric strains; (d) displacements.
Figure 14.
Plastic points distribution: (a) pre- and (b) post-rock block detachment.
Figure 14.
Plastic points distribution: (a) pre- and (b) post-rock block detachment.
Figure 15.
Superficial fractures systems with a tool for facet/fracture detection.
Figure 15.
Superficial fractures systems with a tool for facet/fracture detection.
Table 1.
Survey campaign characteristics.
Table 1.
Survey campaign characteristics.
| Date | Source | ID | Images | Ground Resolution [mm/pixel] | Overlap (Nadir Flight) [%] | Sidelap (Nadir Flight) [%] |
|---|
| 26 March 2017 | Terrestrial | R17 | 13 | 17.2 | - | - |
| 11 April 2018 | UAV | F18 | 226 | 4.7 | 80 | 60 |
| 29 January 2019 | UAV | F19 | 208 | 8.5 | 80 | 60 |
Table 2.
Registration/co-registration errors.
Table 2.
Registration/co-registration errors.
| Cloud | Error XY (cm) | Error Z (cm) | Error (cm) | Control/Tie Points | Type |
|---|
| F19 | 0.59 | 1.09 | 1.24 | 4 | Registration |
| F18 | 0.26 | 4.47 | 4.47 | 5 | Co-registration |
| R17 | 0.83 | 3.22 | 3.33 | 5 | Co-registration |
Table 3.
Values of rock material parameters adopted in the numerical analyses.
Table 3.
Values of rock material parameters adopted in the numerical analyses.
| Layer | Unit Weight
γm
[kN/m3] | Elastic Modulus
E’
[MPa] | Cohesion
c’
[kPa] | Friction Angle
φ’
[ ° ] | Tensile Strength
σt
[kPa] |
|---|
| Calcisiltite | 15 | 300 | 20 | 26 | 20 |
| Calcarenite | 17 | 1000 | 80 | 28 | 70 |
| Publisher’s Note: MDPI stays neutral with regard to jurisdictional claims in published maps and institutional affiliations. |
© 2020 by the authors. Licensee MDPI, Basel, Switzerland. This article is an open access article distributed under the terms and conditions of the Creative Commons Attribution (CC BY) license (http://creativecommons.org/licenses/by/4.0/).

 ,
, 


