Article

Analysis of Drought Impact on Croplands from Global to Regional Scale: A Remote Sensing Approach

1
Center for Remote Sensing of Land Surfaces (ZFL), University of Bonn, Genscherallee 3, 53113 Bonn, Germany
2
Remote Sensing Research Group (RSRG), University of Bonn, Meckenheimer Allee 166, 53115 Bonn, Germany
3
Department of Crop Sciences, University of Göttingen, Von-Siebold-Str. 8, 37075 Göttingen, Germany
4
Leibniz Centre for Agricultural Landscape Research (ZALF), Eberswalder Str. 84, 15374 Müncheberg, Germany
*
Author to whom correspondence should be addressed.
Remote Sens. 2020, 12(24), 4030; https://0-doi-org.brum.beds.ac.uk/10.3390/rs12244030
Submission received: 28 October 2020 / Revised: 30 November 2020 / Accepted: 3 December 2020 / Published: 9 December 2020
(This article belongs to the Special Issue Remote Sensing of Dryland Environment)

Abstract

:
Drought is one of the extreme climatic events that has a severe impact on crop production and food supply. Our main goal is to test the suitability of remote sensing-based indices to detect drought impacts on crop production from a global to regional scale. Moderate resolution imaging spectroradiometer (MODIS) based imagery, spanning from 2001 to 2017 was used for this task. This includes the normalized difference vegetation index (NDVI), land surface temperature (LST), and the evaporative stress index (ESI), which is based on the ratio of actual to potential evapotranspiration. These indices were used as indicators of drought-induced vegetation conditions for three main crops: maize, wheat, and soybean. The start and end of the growing season, as observed at 500 m resolution, were used to exclude the time steps that are outside of the growing season. Based on the three indicators, monthly standardized anomalies were estimated, which were used for both analyses of spatiotemporal patterns of drought and the relationship with yield anomalies. Anomalies in the ESI had higher correlations with maize and wheat yield anomalies than other indices, indicating that prolonged periods of low ESI during the growing season are highly correlated with reduced crop yields. All indices could identify past drought events, such as the drought in the USA in 2012, Eastern Africa in 2016–2017, and South Africa in 2015–2016. The results of this study highlight the potential of the use of moderate resolution remote sensing-based indicators combined with phenometrics for drought-induced crop impact monitoring. For several regions, droughts identified using the ESI and LST were more intense than the NDVI-based results. We showed that these indices are relevant for agricultural drought monitoring at both global and regional scales. They can be integrated into drought early warning systems, process-based crop models, as well as can be used for risk assessment and included in advanced decision-support frameworks.

Graphical Abstract

1. Introduction

Drought is one of the most severe natural hazards and can impose a massive impact on water supply, crop, and forage production, and thus, can lead to broad socio-economic and environmental impacts [1,2]. An increase in both drought frequency and severity over the last decades has had adverse impacts on agriculture, for example for East Asia, the Mediterranean region, and Southern Australia [3,4,5]. Severe droughts were also observed for regions in Africa, e.g., Eastern Africa (2009, 2011–2012, 2019) and Southern Africa (2003, 2007, 2015–16, 2018) [4,6,7,8]. Timely and accurate information on drought occurrence is essential to mitigate the negative effects of drought on cropping systems and to support drought management [9]. This information can be integrated with agricultural statistics at the national to the sub-national level, which can be further used for policymaking, risk management, and early drought warning systems; the information can trigger national mitigation activities and further local-scale analysis implemented in a national drought plan [10,11].
Drought is defined as an exceptional deficit of water availability caused by a deviation from normal conditions over a specific region. Although drought is a result of climate-related factors such as rainfall, moisture deficiency, temperature and high evapotranspiration, it can also be impacted by human induced changes of hydrological processes and the environment [12].
Globally, drought reduced the crop yield by approximately 10% in the period 1964–2007 [13]. Agricultural droughts are water shortages that cause a drop in crop productivity. Drought impacts on yield represent the integral effect of several factors such as reduced precipitation, increased temperature as well as management practices [14]. Spatially explicit metrics can be derived from remote sensing to describe the impact of these factors on croplands [15,16,17,18].
Remote sensing time series have been used extensively for assessing the impact of drought on terrestrial ecosystems as proxies of biophysical vegetation properties can be extracted over large scales [19]. Several indices have been proposed for the detection of anomalies in the intensity, continuity, and spatial extent of droughts [20,21,22]. The availability of remote sensing data allows the estimation of vegetation indices (VI), such as the normalized difference vegetation index (NDVI); and consequently, the detection of anomalies in vegetation productivity [23,24,25]. Furthermore, other metrics, such as evapotranspiration (ET), land surface temperature (LST), or soil moisture, can be extracted based on different satellite sensors [26,27,28,29,30]. Time series of these remotely sensed parameters enable the assessment of drought characteristics, such as duration and severity [20,31]. The use of remote sensing has been highlighted for the particular regions (such as East or West Africa) where other measures of drought (e.g., climate station records, yield information) are not available [32]. Although these indicators were shown to be effective for drought monitoring at different scales, they have shown some limitations, such as sensitivity to non-drought-related factors such as changes in management practices or land cover changes. Furthermore, as drought is the result of interaction between precipitation, temperature, evapotranspiration, soil moisture and ground water levels, an index applicable for one region may not be suitable elsewhere. Therefore, generalizing the results across various regions needs further analysis [33].
Currently, several satellite-based time-series are available at a global scale. These include moderate resolution imaging spectroradiometer (MODIS), and advanced very high resolution radiometer (AVHRR) sensors [34]. Although some global-scale remote sensing products exist, e.g., the Food and Agriculture Organization (FAO) agriculture stress index system (ASIS), they rely on coarse resolution data, such as from AVHRR [10]. Other global products, such as the Global Drought Observatory data, rely only on one remote sensing-based indicator, namely MODIS fAPAR [35]. Often, they are univariate and do not include multiple indicators that can be a proxy of vegetation condition and drought impact. Furthermore, there is a lack of knowledge regarding which index (or indices) best represents drought impacts, especially at a moderate spatial resolution, as the majority of current global products rely solely on NDVI- and/or LST-based products, often with coarser resolution datasets, such as AVHRR [10,36,37]. As different indices do not always yield similar results for drought events characterization due to local site conditions (e.g., land cover, local management), there is, thus, no universal index that could be used for drought monitoring [20,38,39].
In this study we therefore explored the potential of three drought indicators that are generally accepted in crop science as a measure of water stress on crop growth to detect drought impacts on crop productivity. Namely we tested the applicability of the NDVI time series, due to its wide use and integration in several drought monitoring frameworks, but at the same time it can be affected by other stressors such as heat, frost, water logging, pests, and diseases [40]. LST has been used as a proxy for evapotranspiration and vegetation water stress [41]. Nevertheless LST can vary in space and time due to the heterogeneity of land surface characteristics in vegetation, topography and soil [42]. The ratio between actual evapotranspiration (AET) and potential evapotranspiration (PET) has the strongest link to drought as it directly captures crop responses to drought such as stomata closure of drought stressed plants [33].
We further improved the analysis by integrating moderate resolution crop masks and phenometrics. Though it was acknowledged that the use of these data can improve the detection of crop sensitivity to droughts at various crop growth stages [43,44], few studies have integrated these datasets at a global scale and most of the studies used an 8 km resolution dataset [1]. Furthermore, this study evaluates the utility of remote sensing-based indicators to analyze the impact of suboptimal conditions on crop yield, which to date has not been performed with different indicators at a global level. At the same time, we tested the relevance of the indicators for agricultural drought monitoring at both global and regional scales, to analyze the applicability of the metrics derived at a global level for more targeted studies, as well as for validation with regional scale data.
Based on this, the objective of this study is to compare remote sensing based indices for their suitability to detect drought impacts on crop production from global to subnational scale with the use of multiple moderate resolution remote sensing datasets as well as land cover data and crop phenology information. Specifically, we aim at:
  • Comparing different remote sensing (RS)-based indices for drought impact, monitoring at a global scale with the use of multiple RS-based datasets of moderate spatial resolution
  • Analyzing the impact of drought at the national and subnational scale.
We conducted our study at both global and regional scales to be able to not only reflect general patterns of drought occurrence as identified by multiple drought indicators but also to show the possibility of RS-based data to analyze the temporal dimension of drought events and impacts.

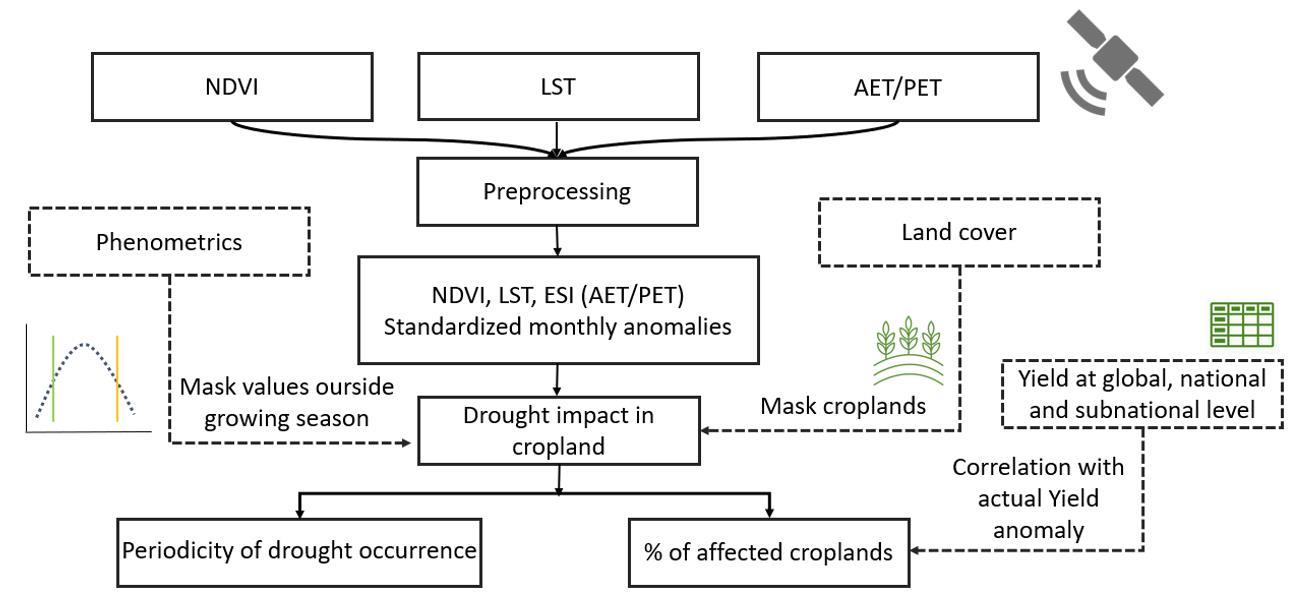
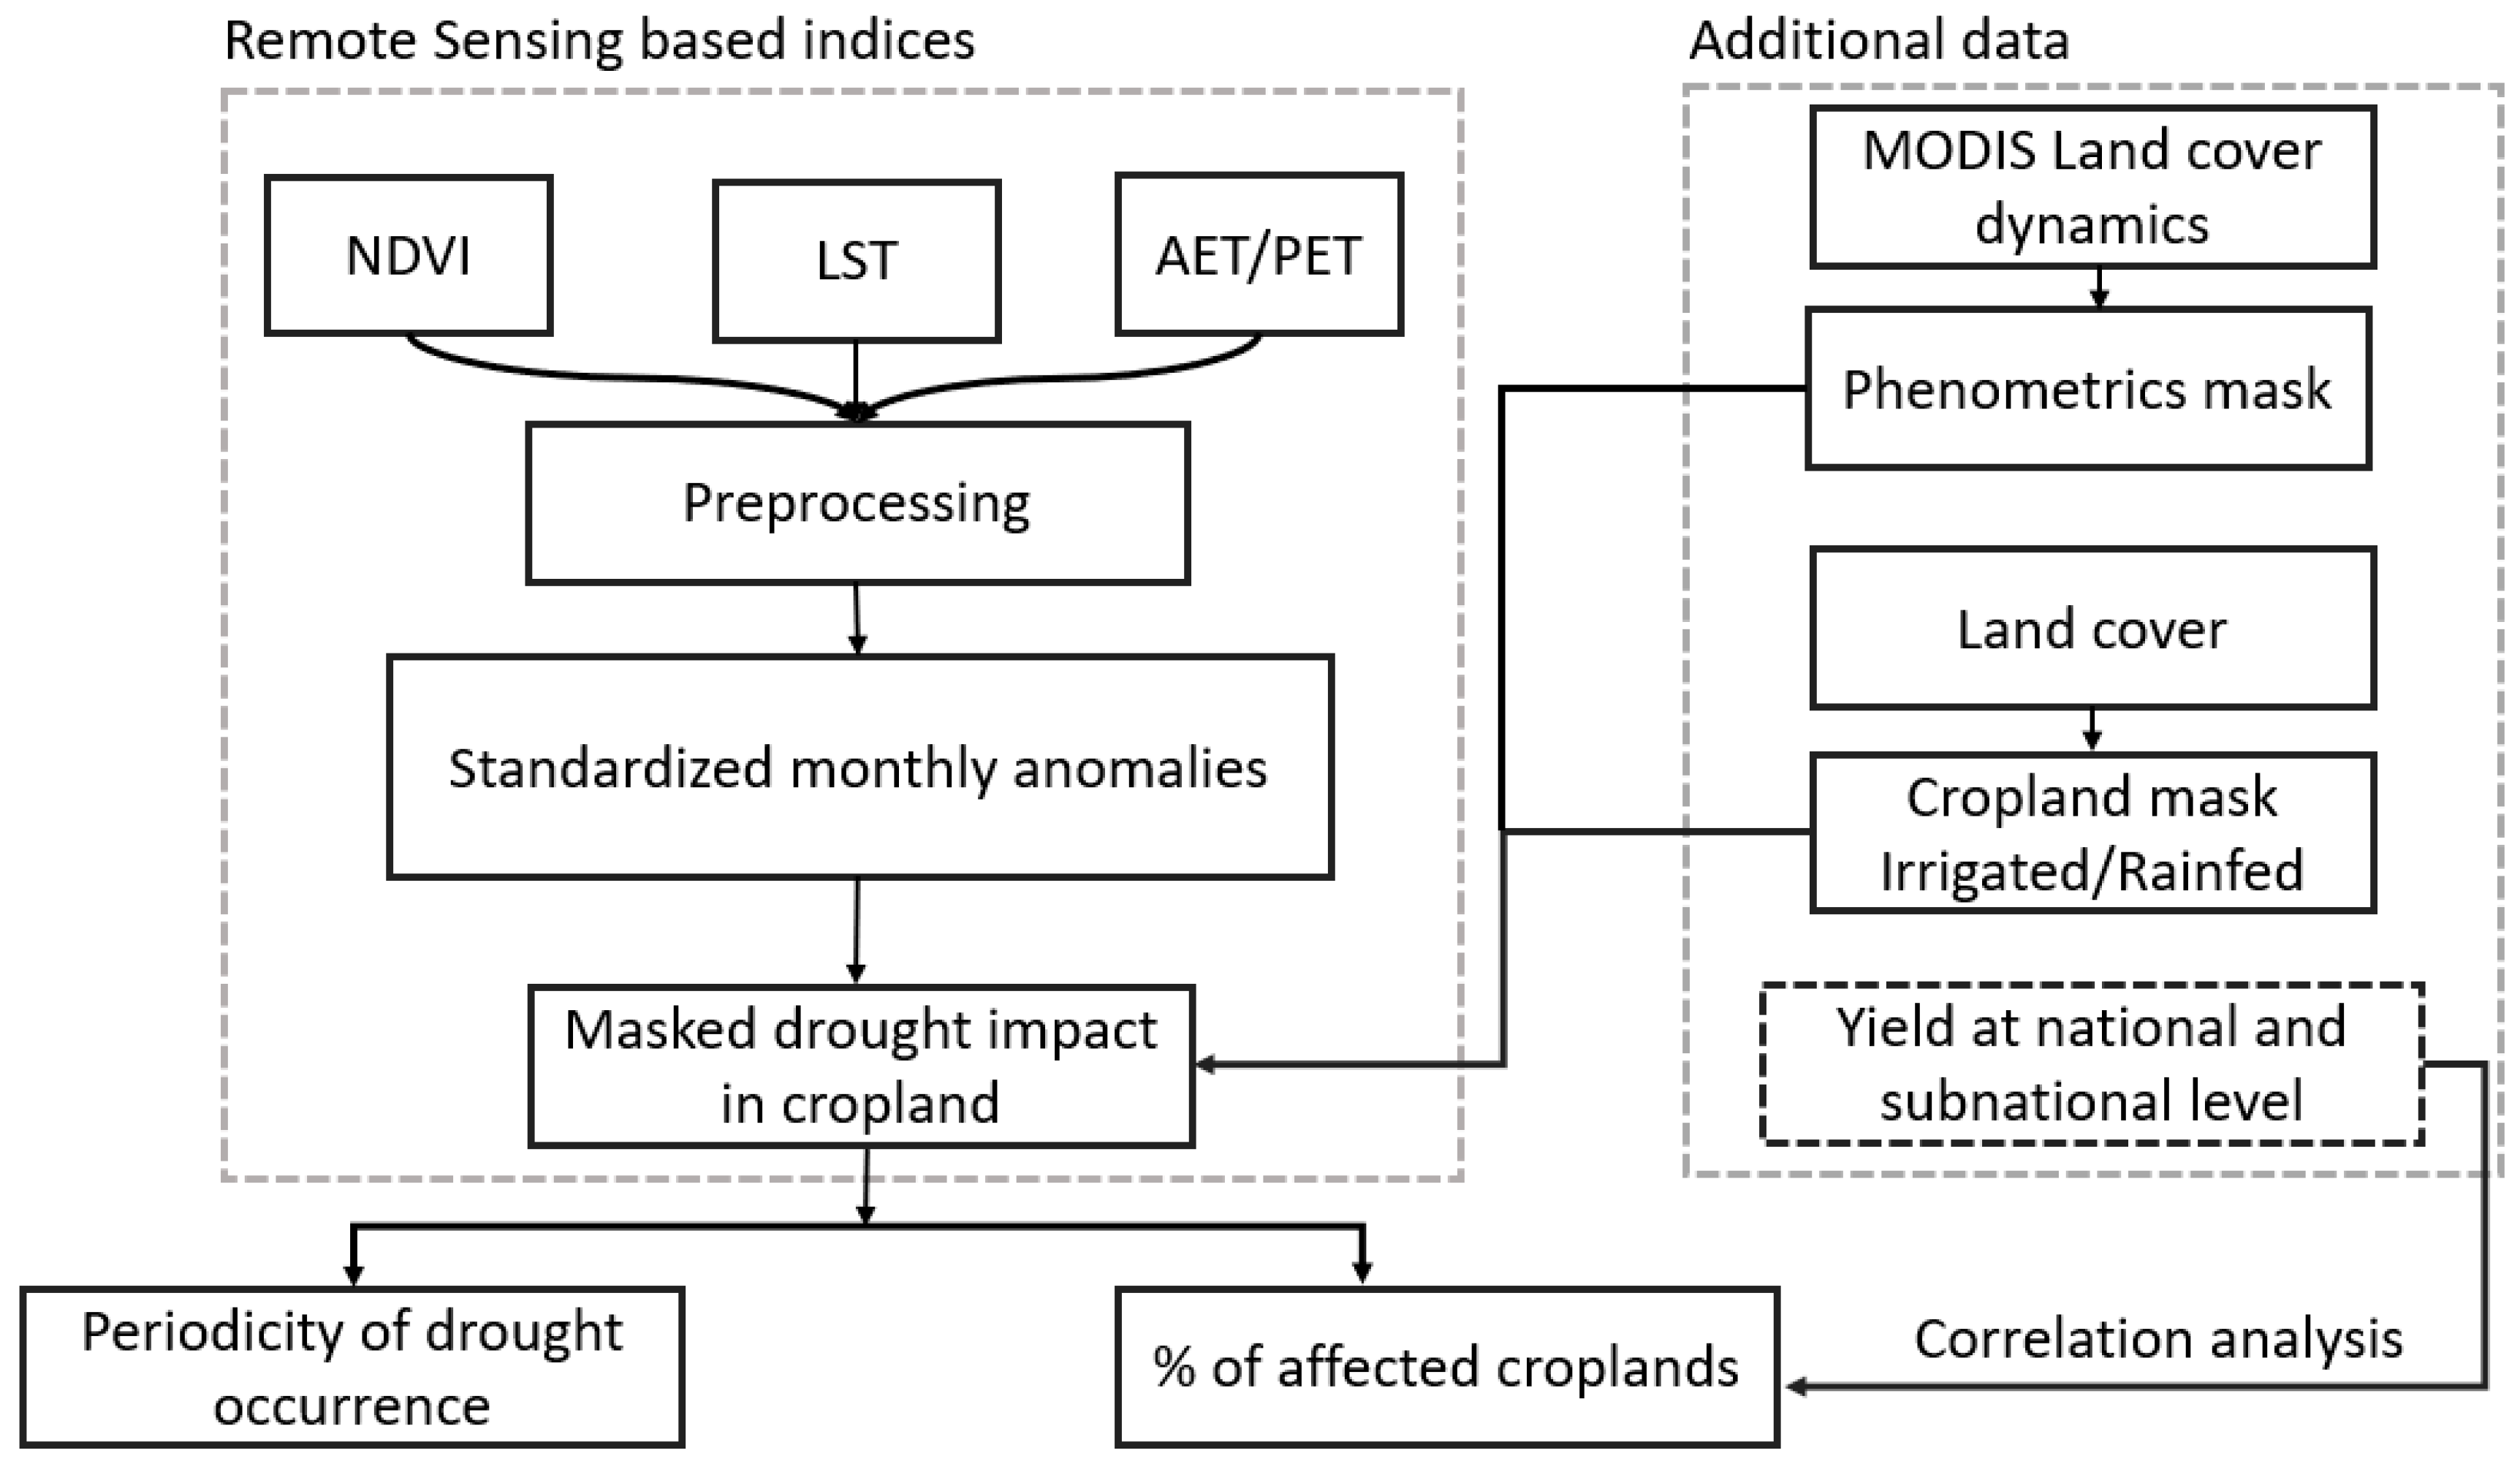
2. Materials and Methods

2.1. Data

2.1.1. Remote Sensing Based Indicators

For this study, several datasets derived from MODIS imagery, spanning from 2001 to 2017 were used. These include the 16-day NDVI (500 m spatial resolution), land surface temperature (LST) (1 km spatial resolution) [45] and actual and potential evapotranspiration (AET, PET) (500 m spatial resolution) [46] as an indicator of drought-induced vegetation condition. NDVI, which is computed based on near-infrared (NIR) and red spectral bands, is an indicator of vegetation health, thus the anomalies in the NDVI could be used as an indicator of drought conditions. NDVI is thus often used for drought monitoring and famine early warning [47]. Nevertheless, other processes can affect NDVI, such as frost, waterlogging, salinity, pests, diseases, and nutrient deficiency.
LST in general is often considered relevant to drought monitoring due to the relationship between leaf temperature and transpiration. High transpiration rates cause a cooling of the active vegetation surface while drought induced reduced transpiration may heat up of the vegetation [37]. For LST analysis, the MOD11A2 (1 km spatial resolution), average 8-day per-pixel land surface temperature product was used [48].
The ratio between the AET and the PET, i.e., the ESI, has the strongest link to drought among the three indicators because it directly measures the crop response to water limitations in the soil. The AET and PET were extracted from MOD16A2.006 (500 m spatial resolution). The product is based on the Penman–Monteith energy balance model [49] that uses as an input remote sensing time series of the leaf area index, land cover, albedo, and the enhanced vegetation index (EVI), as well as radiation, air temperature, pressure, and humidity parameters. The original dataset has an 8-day resolution, which represents the water flux for that duration [50]. The ratio ET/PET (ESI) has a value of 1.0 when evapotranspiration fully satisfies potential plant water requirements and declines toward zero where the surface dries. Thus, relatively low ESI indicates crop drought stress [51].

2.1.2. Additional Data

To assess the impact of drought on croplands, we used the MODIS land cover type dataset (MCD12Q1.006, [52]). Based on this product with 500 m resolution pixels, at least 60% of cultivated areas were selected and non-cultivated areas were masked. To assess the impact of irrigation, maps showing the density of irrigated land for specific regions such as the USA (MIRAD) [53] and South Africa (DAFF) for four (2002, 2007, 2012 and 2017) and two (2012 and 2014) time steps, respectively, were used (Figure 1).
Since the sensitivity of crop yields to drought impact depends on the vulnerable stages of crop growth, vegetation phenology has to be considered [54]. Thus, to determine the growing period, we used the MODIS land cover dynamics dataset (MCDC12Q2.006) as it is an available validated dataset that provides high-quality consistent output applicable for studies at regional-to-global scales [55]. In this product, seasonal dynamics of vegetation are derived using time series of two band EVI-2, which in turn is based on MODIS nadir bidirectional reflectance distribution function (BRDF)-adjusted reflectance (NBAR) at 500 m spatial resolution.
To better characterize the drought impacts and associated exposures, we further complemented the remote sensing-based information with several socio-economic indicators, such as percentage of irrigated agricultural land based on the global map of irrigation areas of the UN Food and Agriculture Organization [56]. To assess drought impact on yield we used an annual time series of crop yields from FAOSTAT [57] as well as gridded yields for the major food crops wheat, maize, and soybean [58]. This yield dataset is consistent with FAO yield statistics, providing gridded data at 0.5-degree resolution [58]. The subnational data for the regional analysis were extracted from the USDA/NASS QuickStats database [59] and the South African Department of Agriculture, Forestry, and Fisheries (DAFF) [60].
To compare the remote sensing-based impact estimates with the socio-economic datasets, the remote sensing data had to be aggregated into two distinct administrative unit levels. These regions were extracted from the Global Administrative Unit Layers (GAUL) which provide administrative unit information worldwide. We used level 0 for national-level analysis and level 1 for sub-national comparisons [61].

2.2. Methods

The NDVI, ESI, and LST data were resampled to the same spatial resolution of 500 m and aggregated to monthly estimates, as most of the input data were provided at a native resolution of 500 m. The data was accessed and processed using the Google Earth Engine cloud processing platform [62]. The MODIS datasets were pre-processed, and observations with low quality were excluded from further processing based on quality assurance (QA) flags describing the data quality (Figure 1).
We used monthly estimates to exclude any potential small variations and outliers in the time series, which may falsely be regarded as short-term changes. Using the monthly time series, anomalies for each indicator (I) analyzed were calculated (Equation (1)).
I ( A n o m ) i , y = I i , y I ¯ σ ( I )
where I ¯ and σ ( I ) are the mean and the standard deviation of the indicator in a month i; and y represents the year.
To improve the crop condition identification, crop phenological stages (the timing of greening and senescence) were used to mask the calculated indicator-based anomalies outside the crop growing season [54].
The MODIS land cover dynamics dataset was preprocessed using its quality masks to exclude pixels with low quality. The estimate of the start of the season, “Greenup_1” and “Greenup_2” which represent the start of the first and second growing cycles (defined as a date when EVI2 exceeded 15% of the segment of EVI2 amplitude during the first and second cycles) were converted to DOY and extracted for each year individually. Similarly, “Senescence_1” and “Senescence_2” were processed to extract metrics representing the end of the growing season. The start and end of the season metrics were used to mask I anomalies that were out of the growing season of each year, thus excluding anomalies that are not relevant to the crop growing season.
In order to delineate the drought impact and define the suboptimal conditions for crop growth, a specific threshold was selected for each of the calculated anomalies’ time series [63]. In drought analysis in general a value of ±1 is often used to discriminate possible wet (positive anomalies) or dry (negative anomalies) conditions from the normal [11,35]. This value corresponded to suboptimal conditions and was used for the NDVI and ESI-based anomalies, while in the case of LST, the reverse was applied (possible wet (negative anomalies) or dry (positive anomalies).
Following the calculation of anomalies, the percentage of affected cropland area was calculated at a national and subnational level. This is an aggregate value per administrative unit, that shows the overall condition of the croplands for a specific time step, and thus, can be an indicator of drought impact on cropland for a specific region.
To assess drought both over irrigated and rainfed regions, we further integrated irrigated crop masks to demonstrate the advantages of remote-sensing approaches to assess the differences between irrigated and rainfed regions [64].
The maximum duration of a drought event was calculated as the most prolonged period of consecutive time steps under suboptimal conditions, representing the duration of the extreme drought event. The total number of months with unfavorable conditions was also estimated, representing the frequency of drought for a specific area. Furthermore, the number of months with below normal conditions was calculated based on each RS indicator.
To analyze the association between the RS-based drought impact estimates and yield, and thus to test the suitability of different indicators to detect drought impacts on crop production, the anomaly of the yield was estimated (Equation (2)).
Y ( A n o m ) i , y = Y i , y Y ¯ σ Y
where Y ¯ and σ ( Y ) are the mean and the standard deviation of yield in a month i, respectively and y represents the year. This allows comparisons across different administrative regions. Correlations (Pearson) were estimated between each administrative unit yield anomaly and selected indicator for several timesteps during the growing season.
The results of the anomaly time series were compared with historical drought events described in the literature [1,16,38,65,66]. Furthermore, the results were compared with the drought occurrence data based on the Standardized Precipitation Index (SPI) derived from the Global Drought Observatory [67].

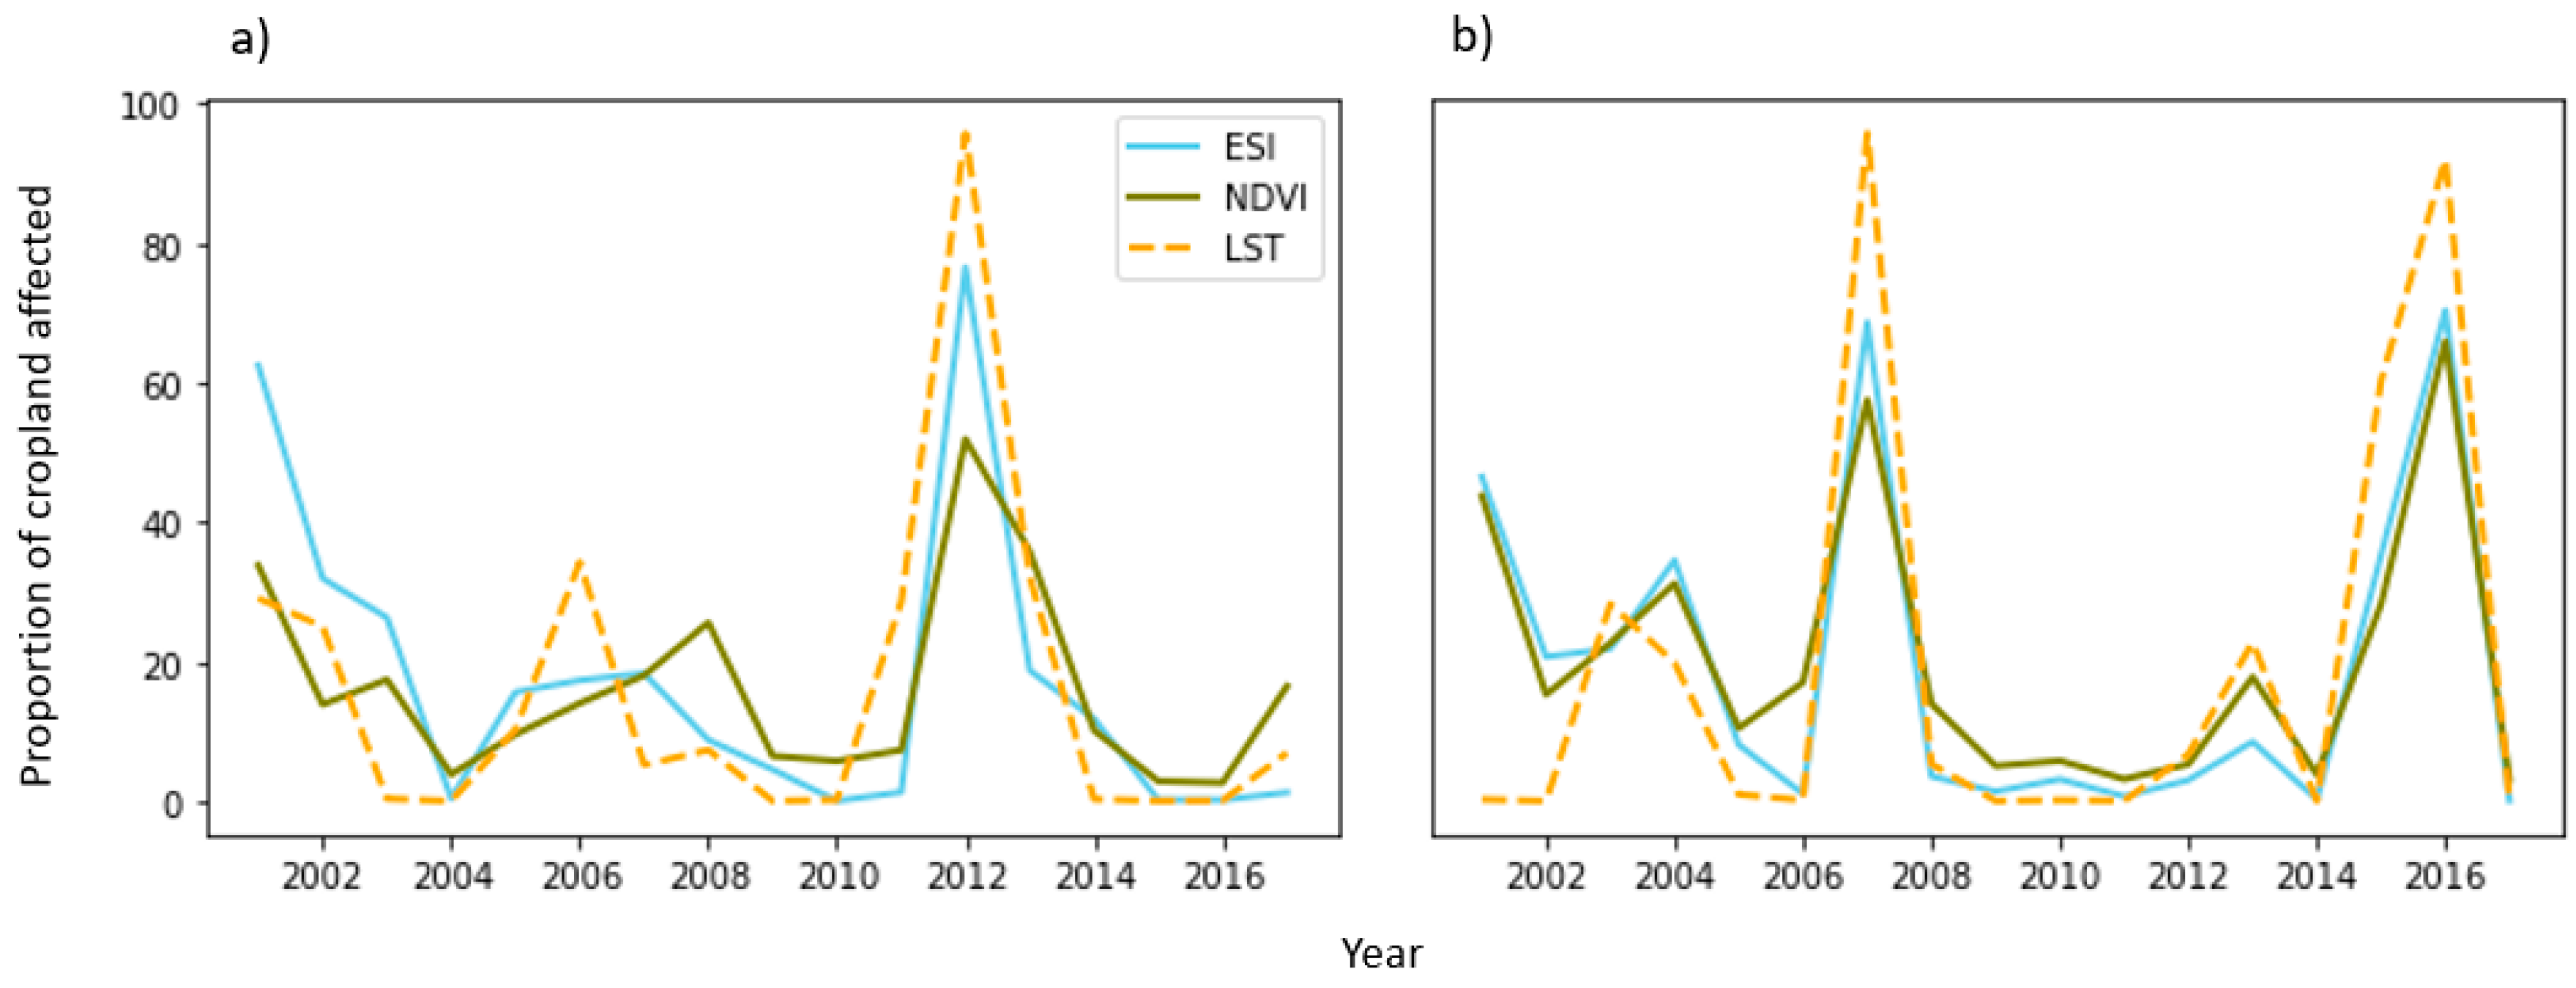
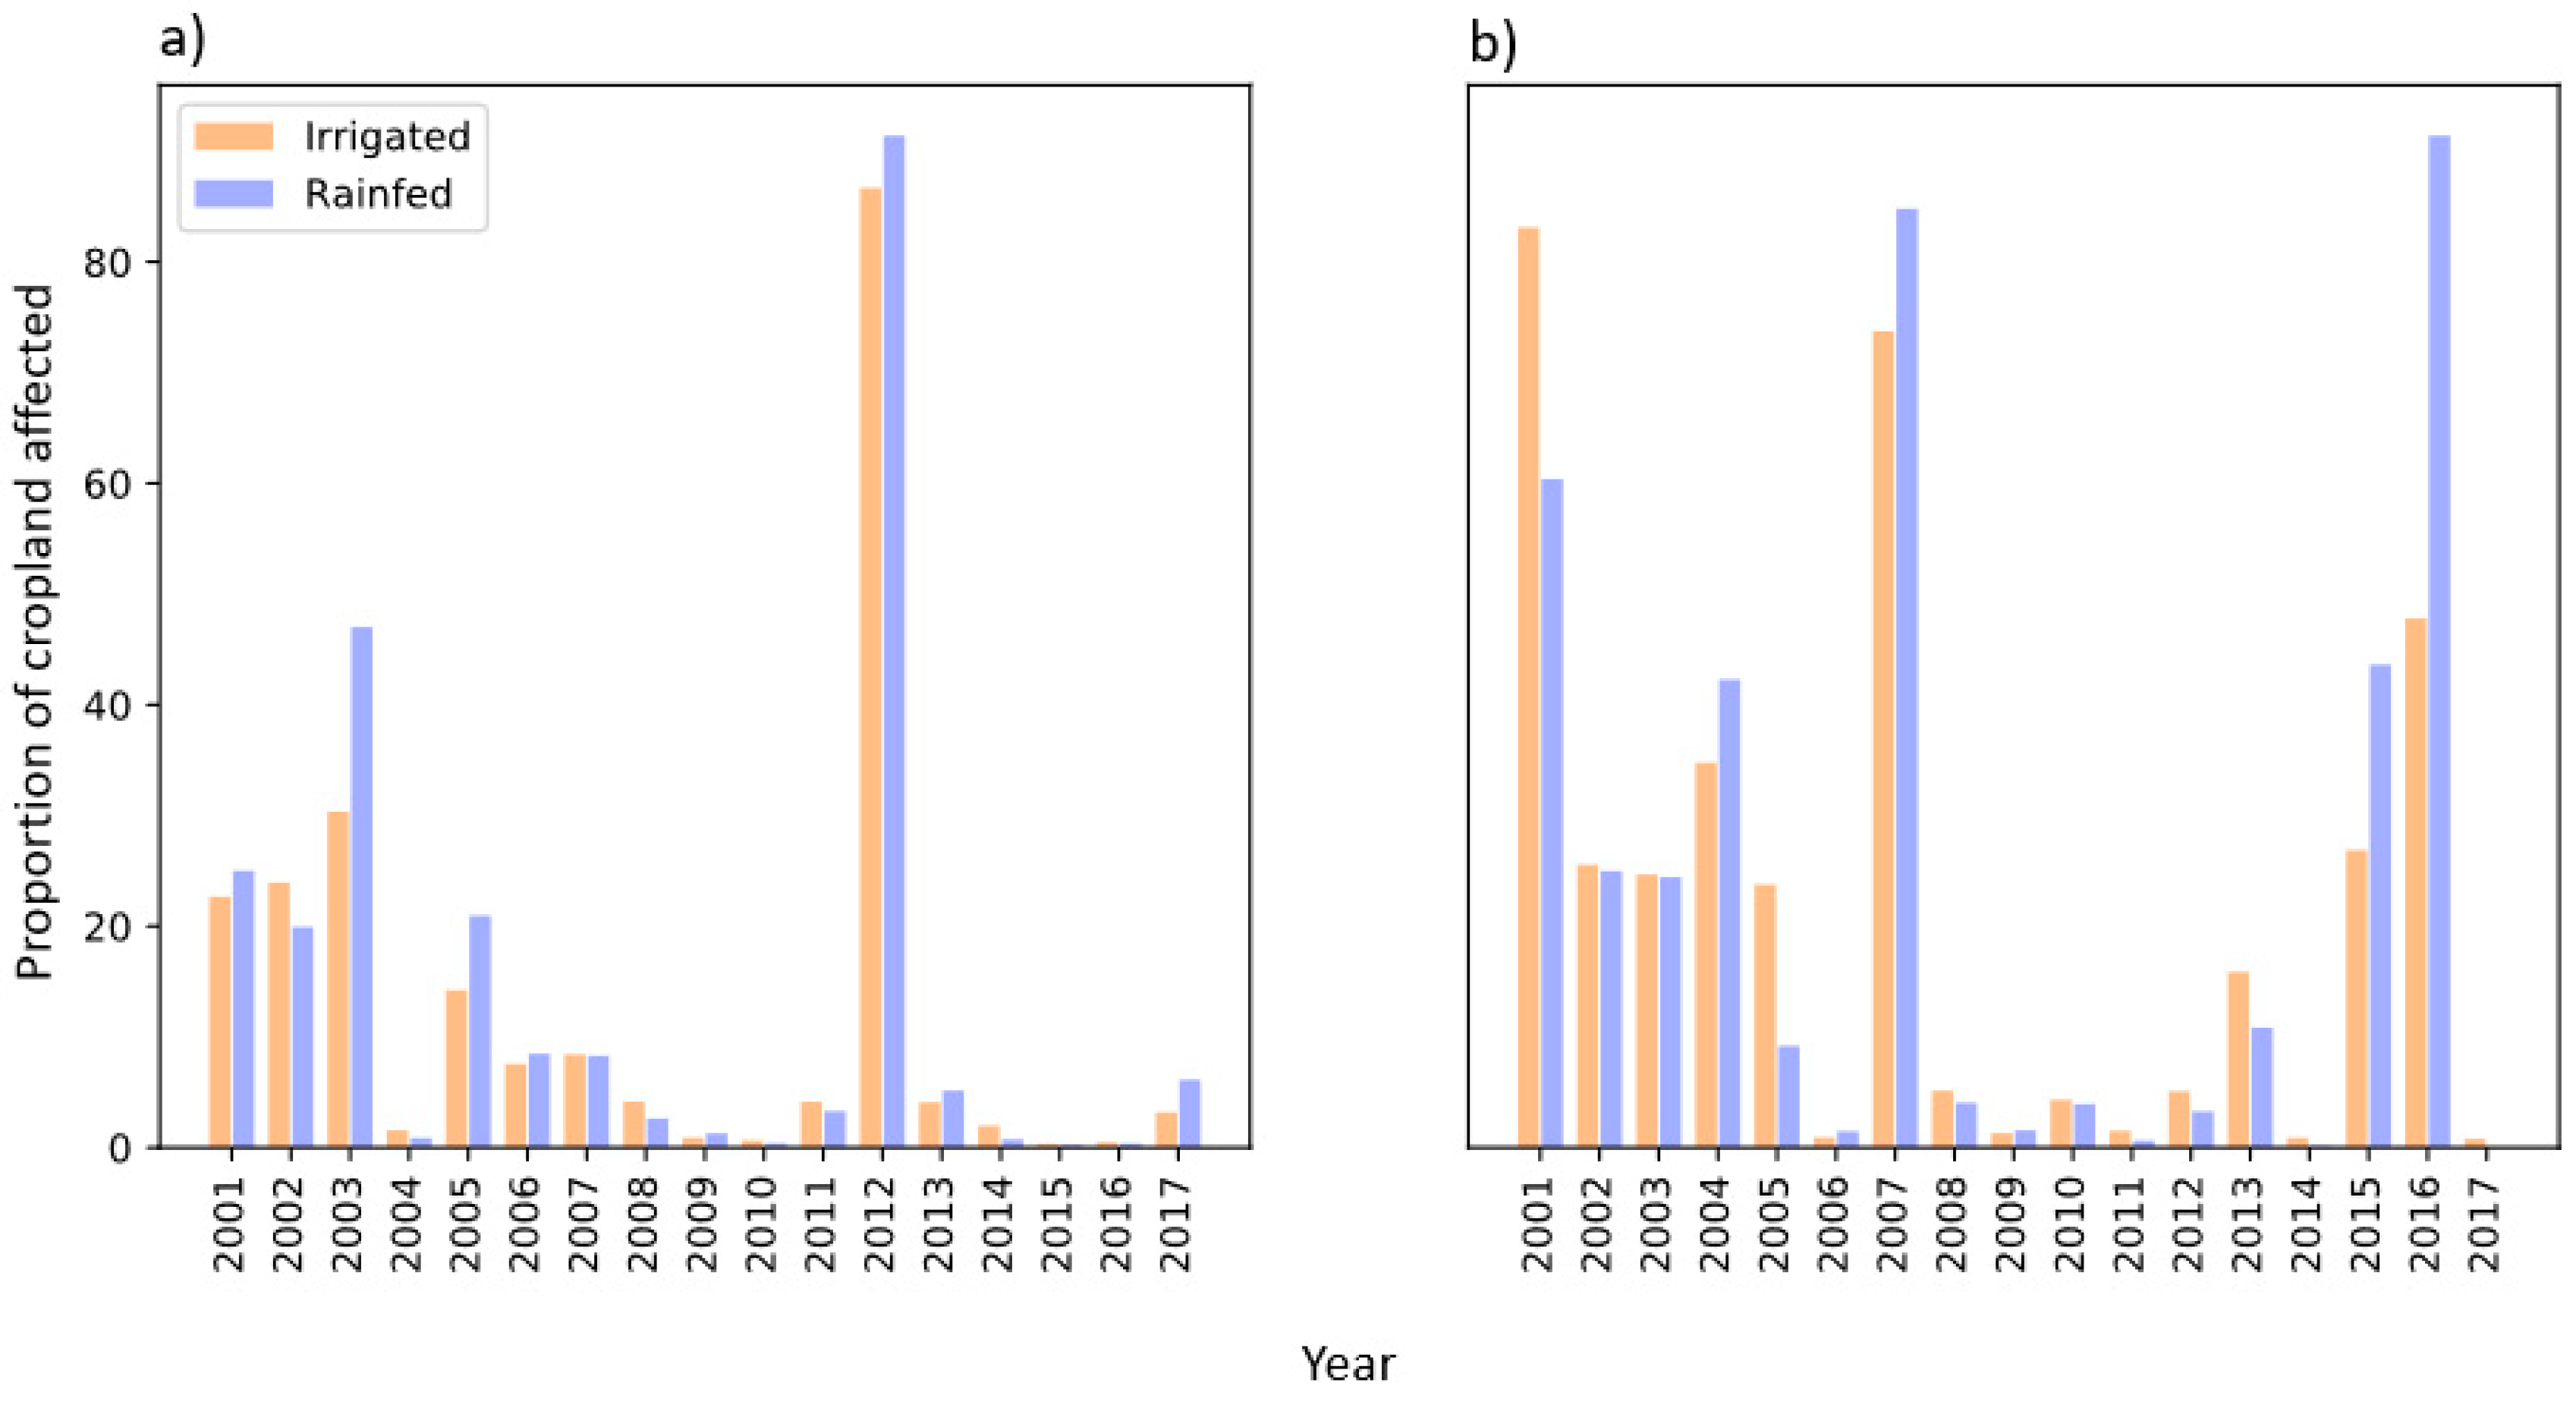
3. Results and Discussion

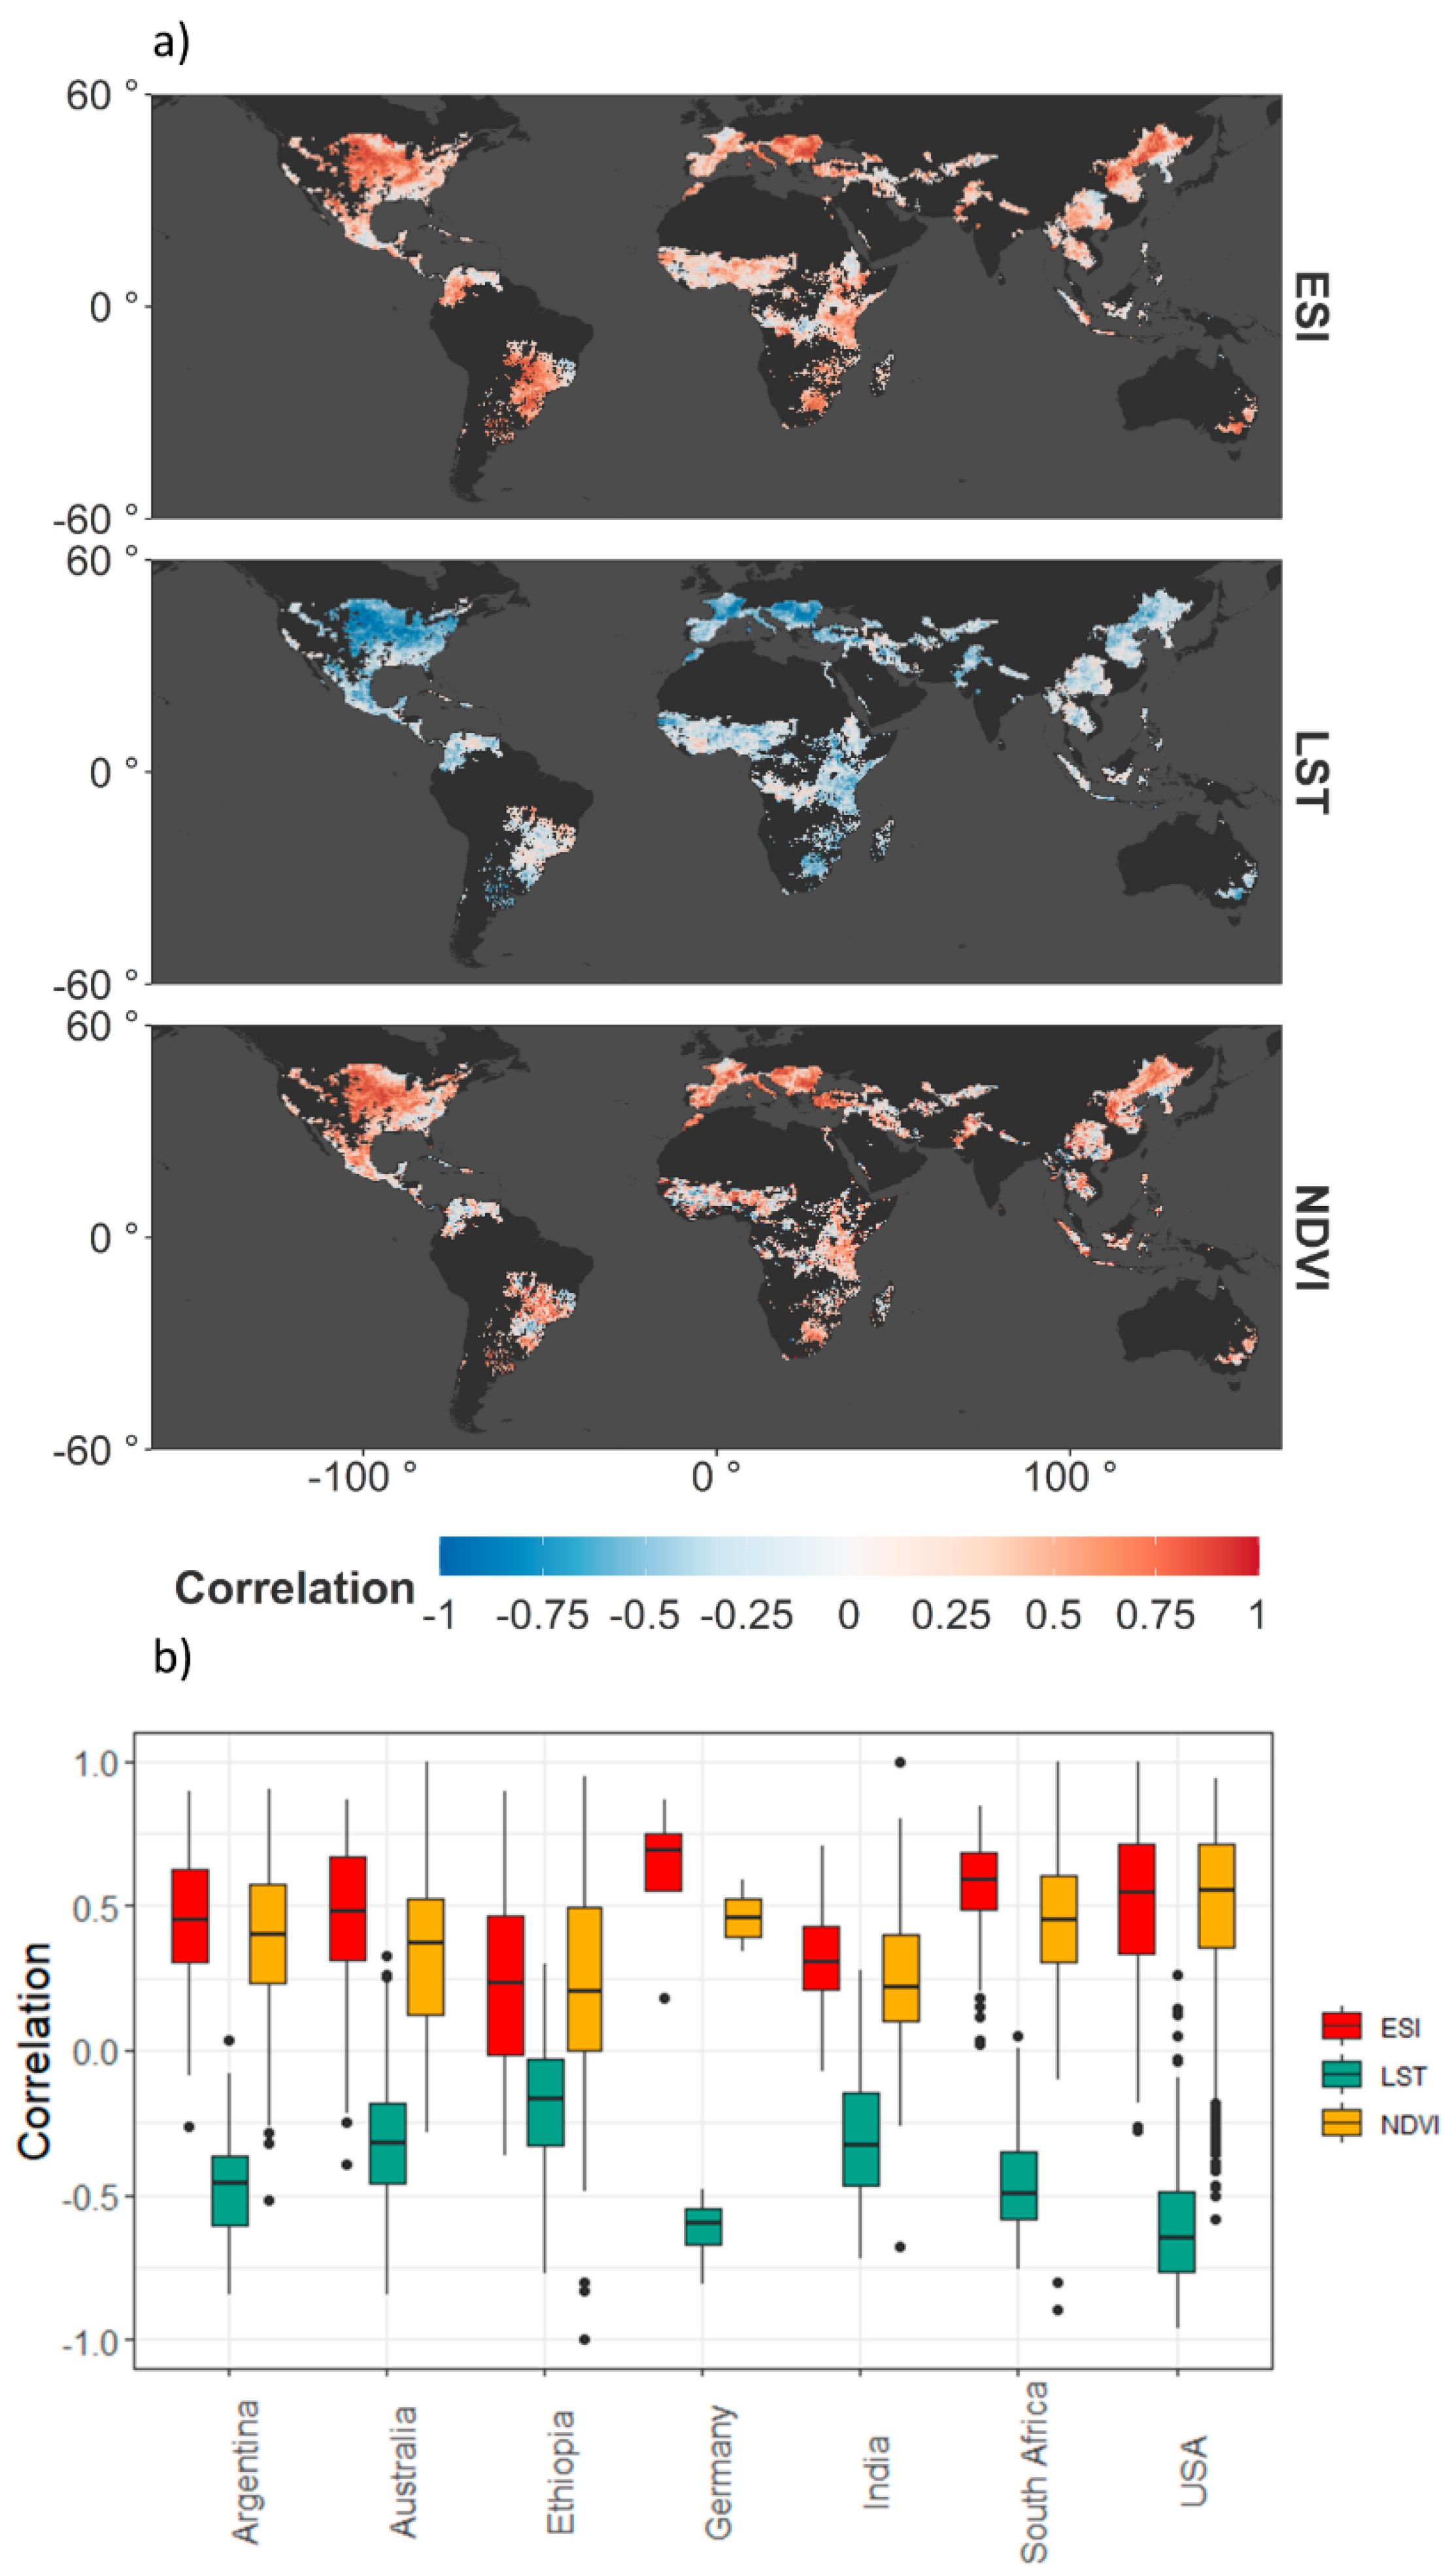
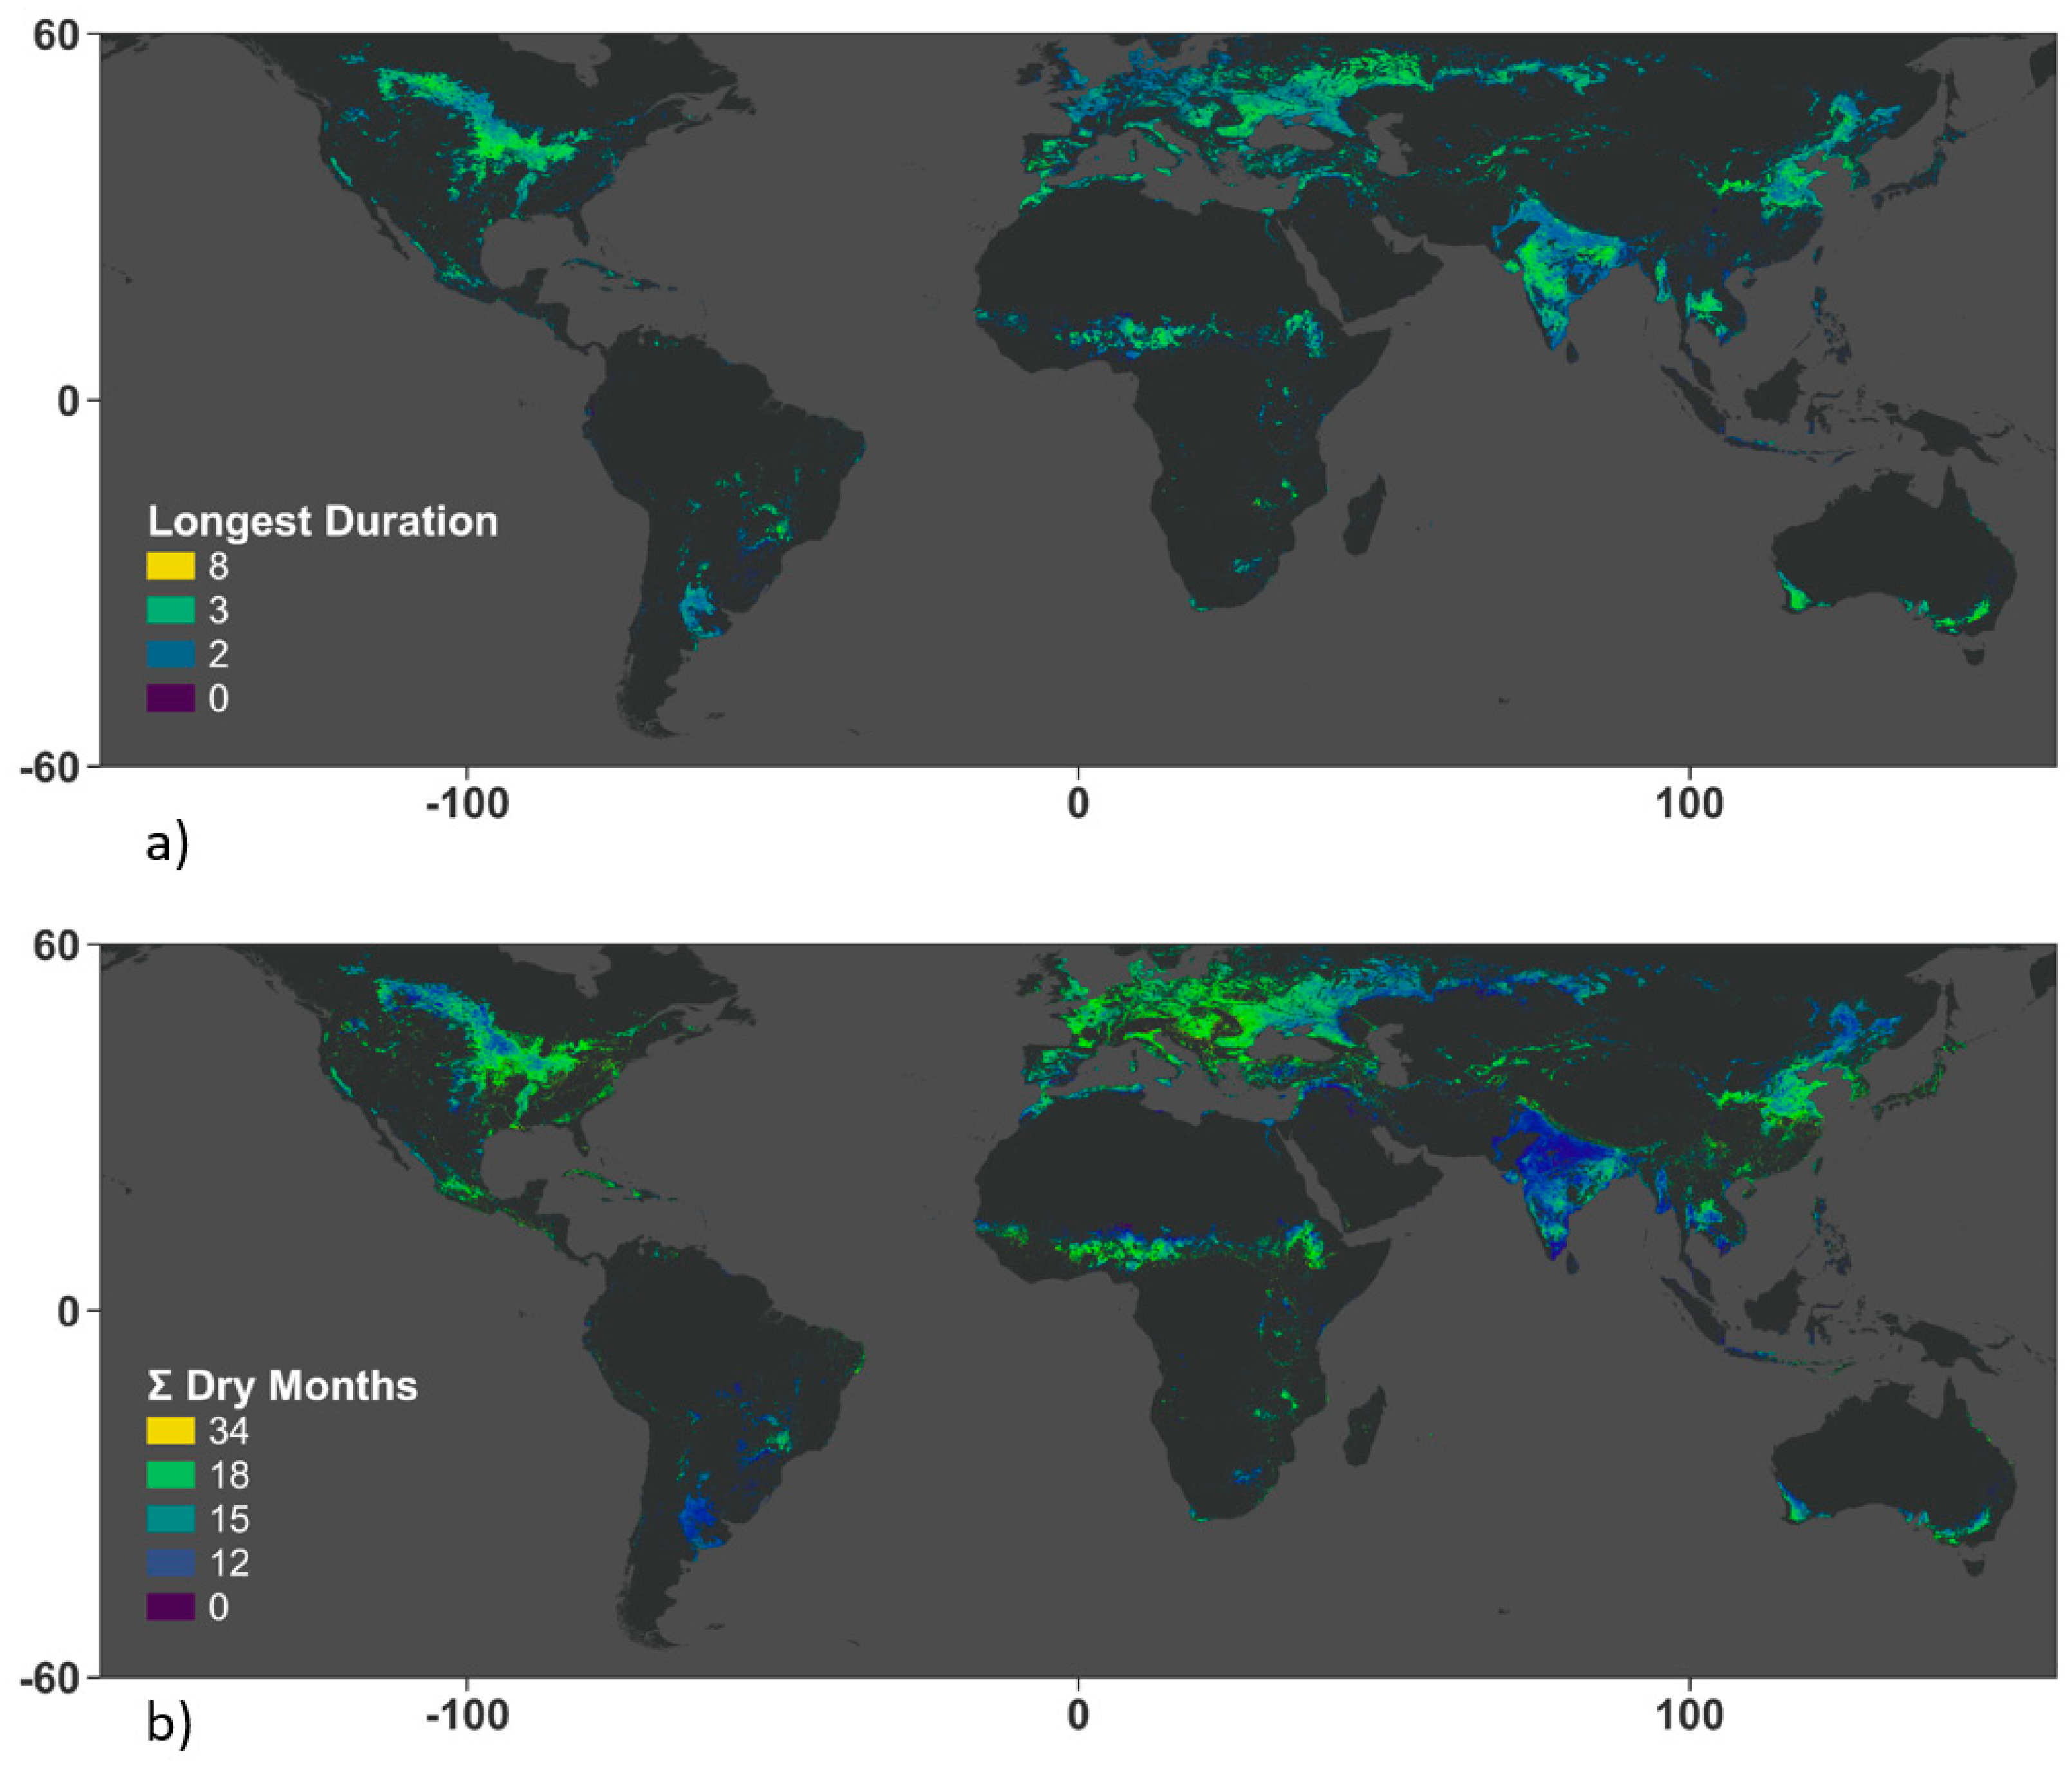
3.1. Global Patterns of Drought

Anomalies in the ESI had higher correlations with maize yield than the NDVI and LST in arid and semi-arid regions, indicating that prolonged periods of a low ESI during the growing season are highly correlated with reduced yields for maize (Figure 2a,b).
The results show that the variability of crop yield is associated with the anomalies of different indicators. In general, LST, NDVI, and ESI anomalies show similar clusters of high and low correlations, indicating that all of these indices could be used for drought monitoring and assessing its hotspots (Figure 2 and Figure 3). In particular, clusters of high correlation can be observed in the central US, South Africa, Eastern Europe, and Brazil for maize. We can observe areas with negative ESI/yield correlation in the southern states of the US as well as some areas in northern France, that can be attributed to the irrigation in those areas or other management practices.
Relatively low correlations between yield and drought indicators can be observed in equatorial regions, which can be attributed to relatively low crop densities. Furthermore, nutrient deficiency rather than drought is the most important yield determining factor for those regions [68]. We also observed that ESI, compared to NDVI, has more consistent correlation patterns, especially in Southern America, Central-, and Southern Africa. This can be explained by the fact, that ET is more strongly associated with drought conditions as it reflects energy and water exchanges among vegetation, soil, and atmosphere [69]. Furthermore, due to the sensitivity of the NDVI to vegetation changes, it is sensitive to yield variability in regions where drought is by far the major constraint for crop productivity.
For soybean, clusters of the high correlation between the ESI and yield anomalies can be observed in the continental USA, especially in the Great Plains, as well as in India and South Africa, which ca shows the impact of insufficient rainfall as well as irrigated water availability. For wheat yield, a cluster of high correlation can be observed in northern Kazakhstan. For the latter, it is a significant wheat growing area in the country; and it is also frequently impacted by droughts [70]. Additionally, large clusters can be observed in the northern US and Canada, where rainfed wheat production is abundant, as well as in Ukraine, Ethiopia and Australia.
Although we can see that RS-based time series can generally explain the patterns of yield variability, there are still some areas that show inconsistent results, which can be explained by several factors. First, the use of a 500 m resolution cropland mask can induce some inconsistencies, especially in areas where several crops are planted, which can result in mixed signals from remote sensing datasets. Second, the yield data has coarser resolution compared with the RS-based input. Furthermore, in specific regions, other factors, such as management practices or other disturbances, can be more relevant than drought.
The spatial patterns of drought between 2001 and 2017 are displayed based on a pixel estimation of frequency over the growing season period in Figure 4a,b. We observed that large areas of prolonged drought impacted arid and semi-arid regions, such as eastern and southern Africa as well as southern regions of Australia. At the same time, based on the maximum number of consecutive months with suboptimal conditions, we detected in Spain, Turkey, Australia, and some regions in India, had a maximum of up to 5 to 9 months of drought. Higher frequencies of drought events were also observed in humid areas, such as the central and northern United States and Central Europe, which are major crop-producing areas (Figure 4a).
Some of these regions, such as in eastern and southern Africa, overlap with the areas characterized by limited irrigation capacity. Simultaneously, these areas are major crop-producing areas, which potentially pose challenges for food security. Countries such as the US, Russia, France, and Ukraine are among the biggest crop producers and exporters [71], and frequent droughts can potentially impact their exports and food trade [18]. For countries such as Ethiopia, where agriculture forms the basis of the economy supporting around 42% of the GDP and 85% of employment [72], high-frequency droughts pose a danger to the country’s food security [73]. For other highly impacted countries, such as South Africa, agriculture accounts for a relatively small share in the economy (3% of GDP), 6% of employment, and about 10% of exports, but still plays a pivotal role in ensuring food security [74]. In contrast, it can be observed, that in the majority of areas over the world, the droughts were limited to a 1–3 month period during the growing season.

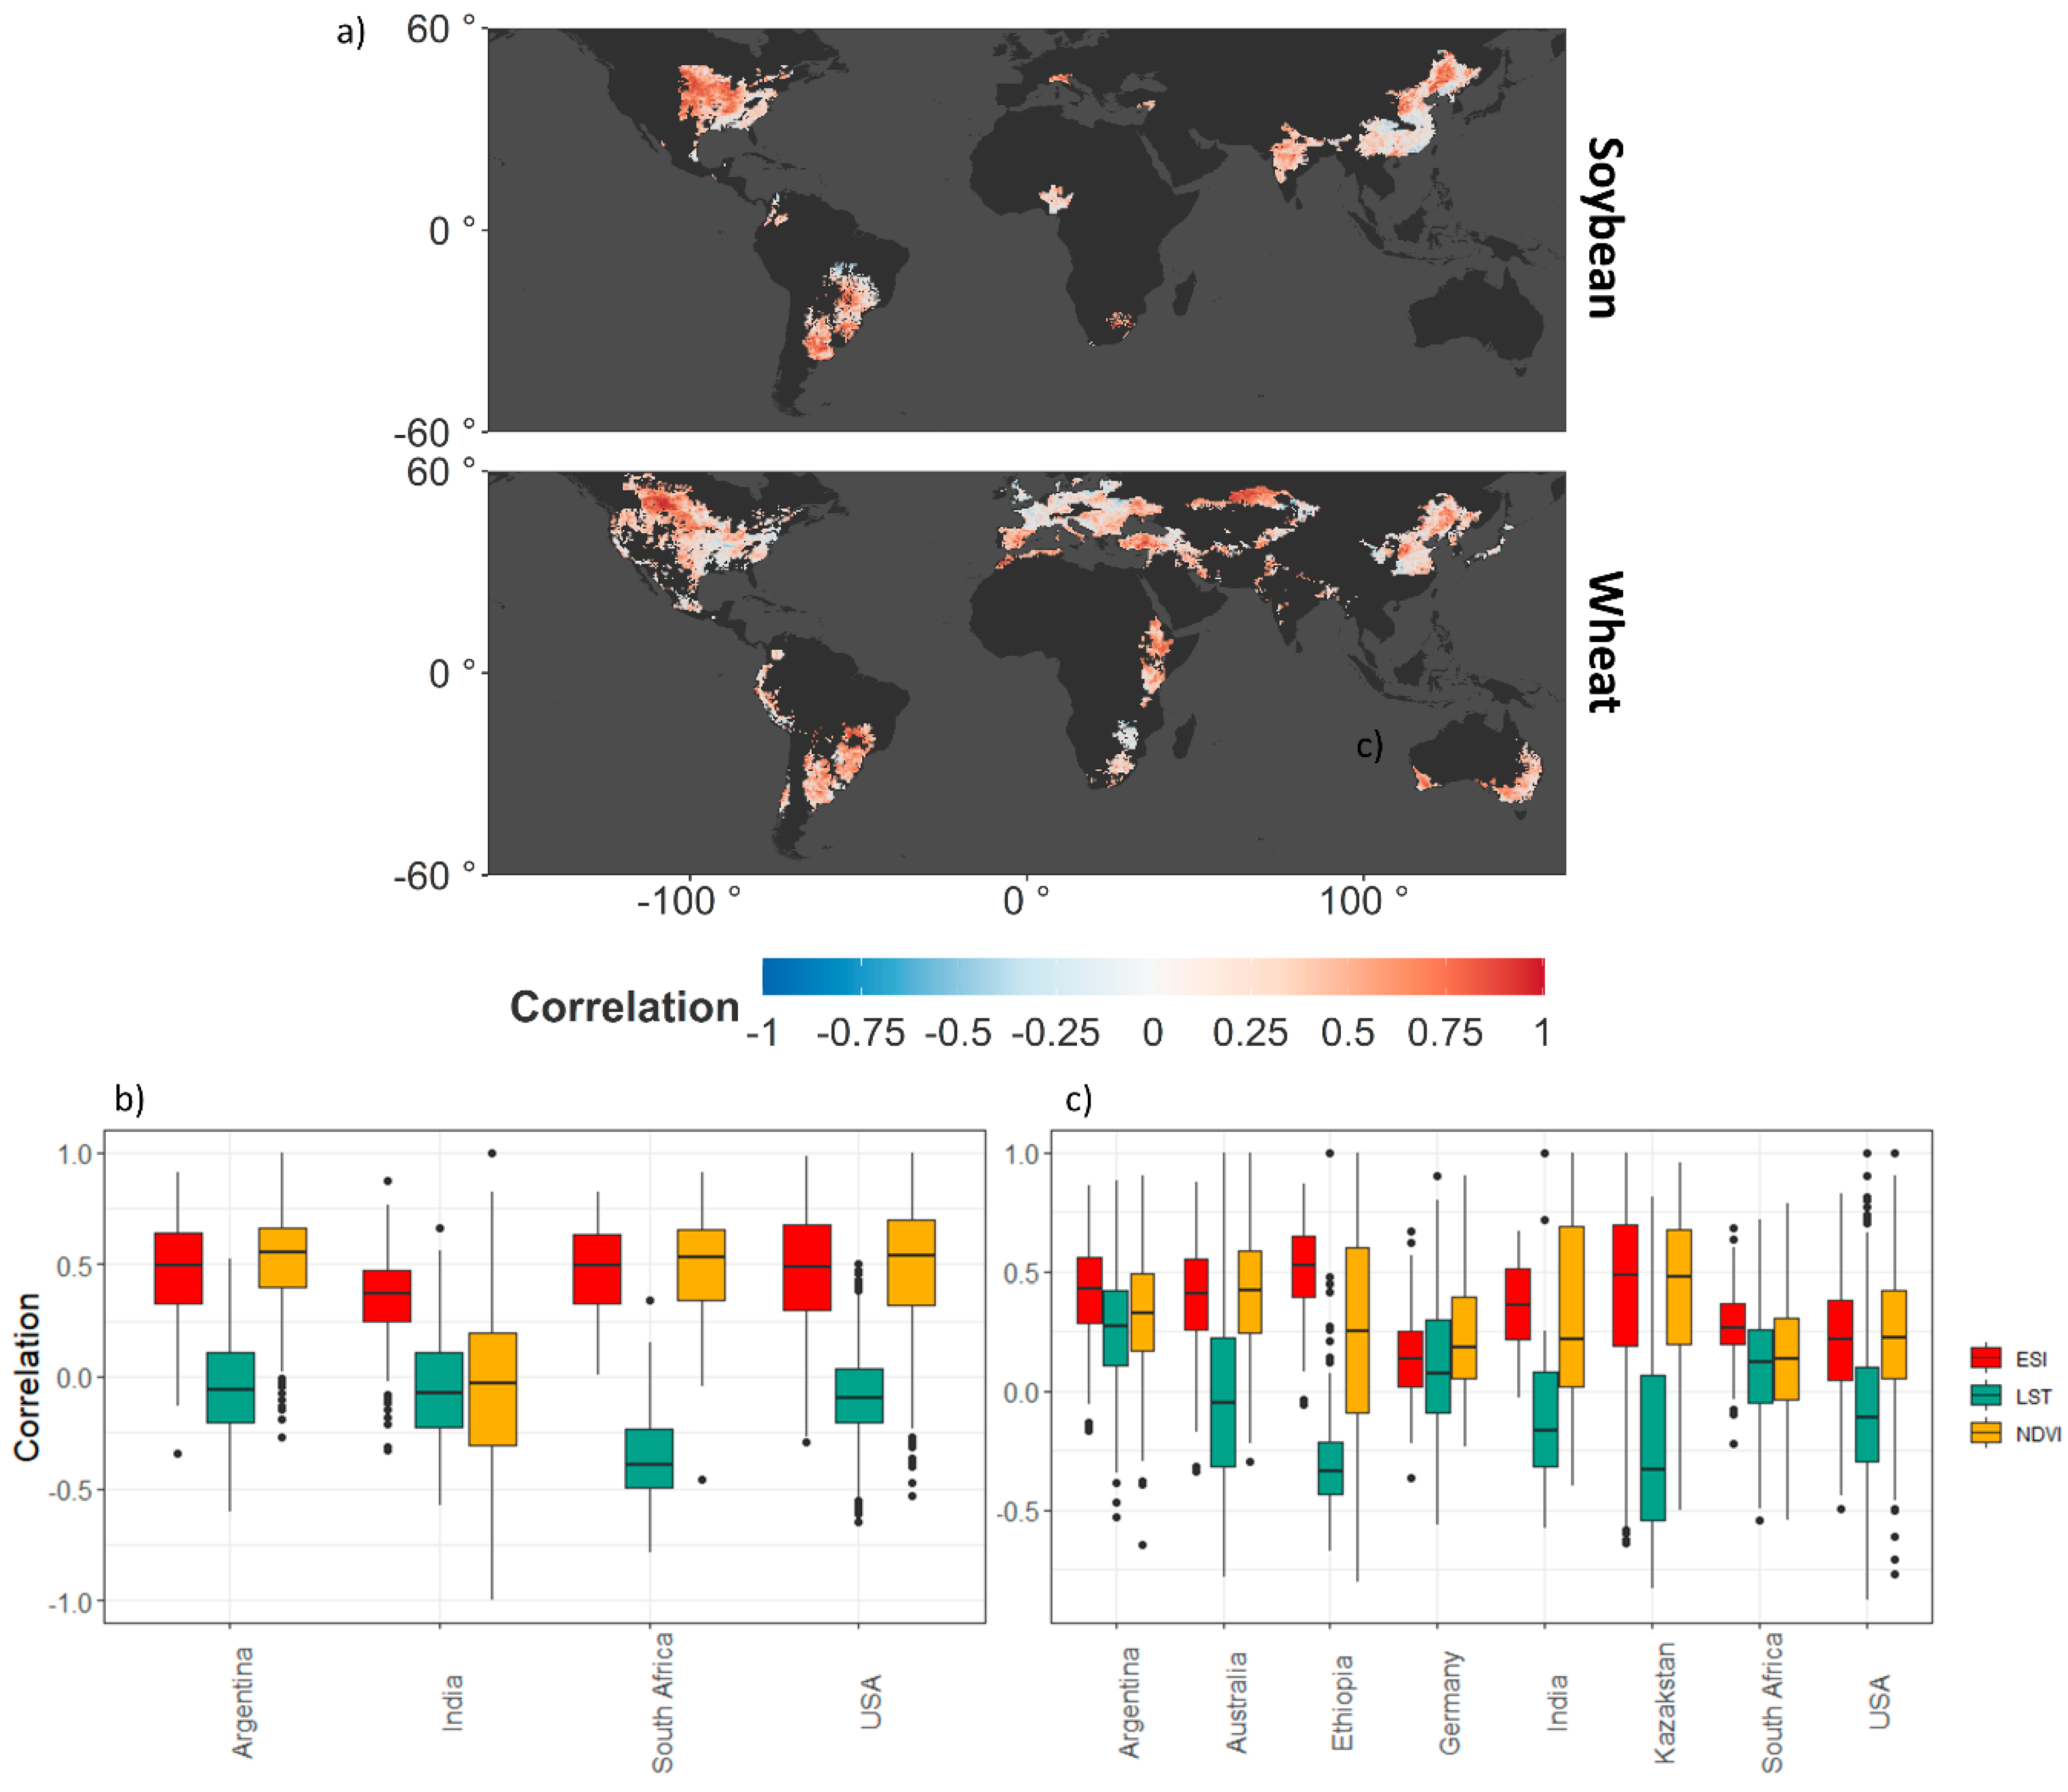
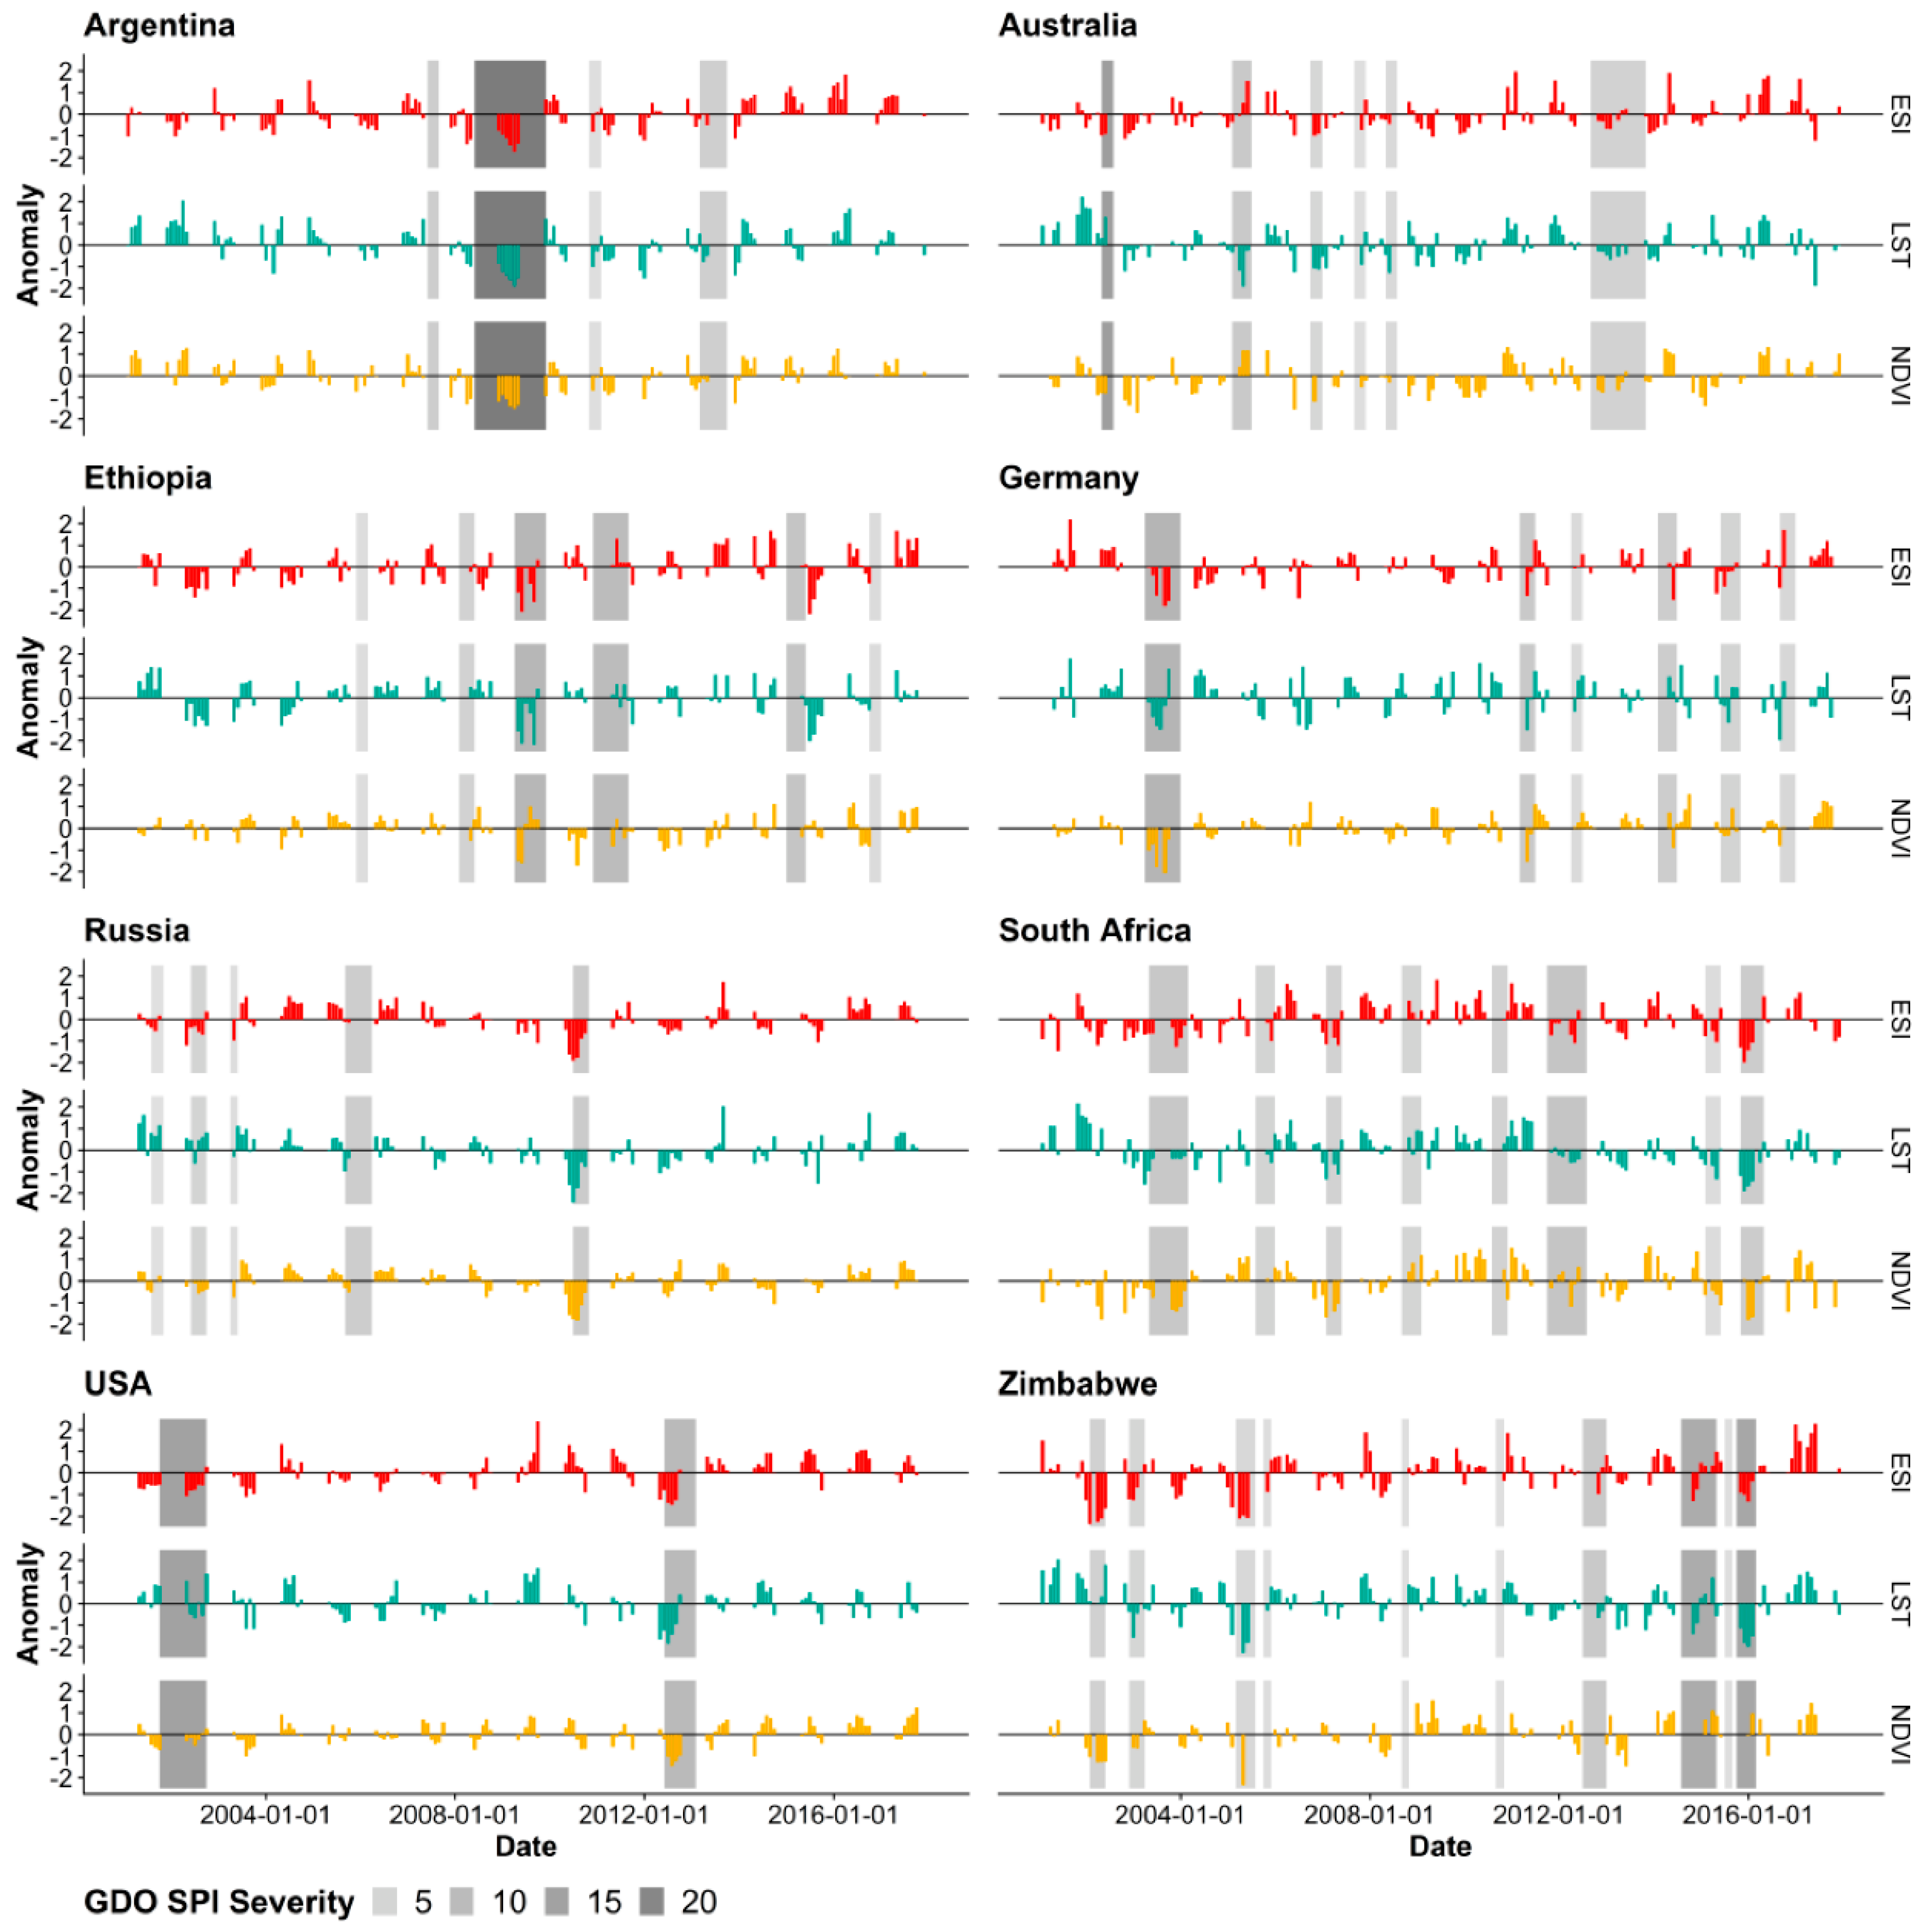
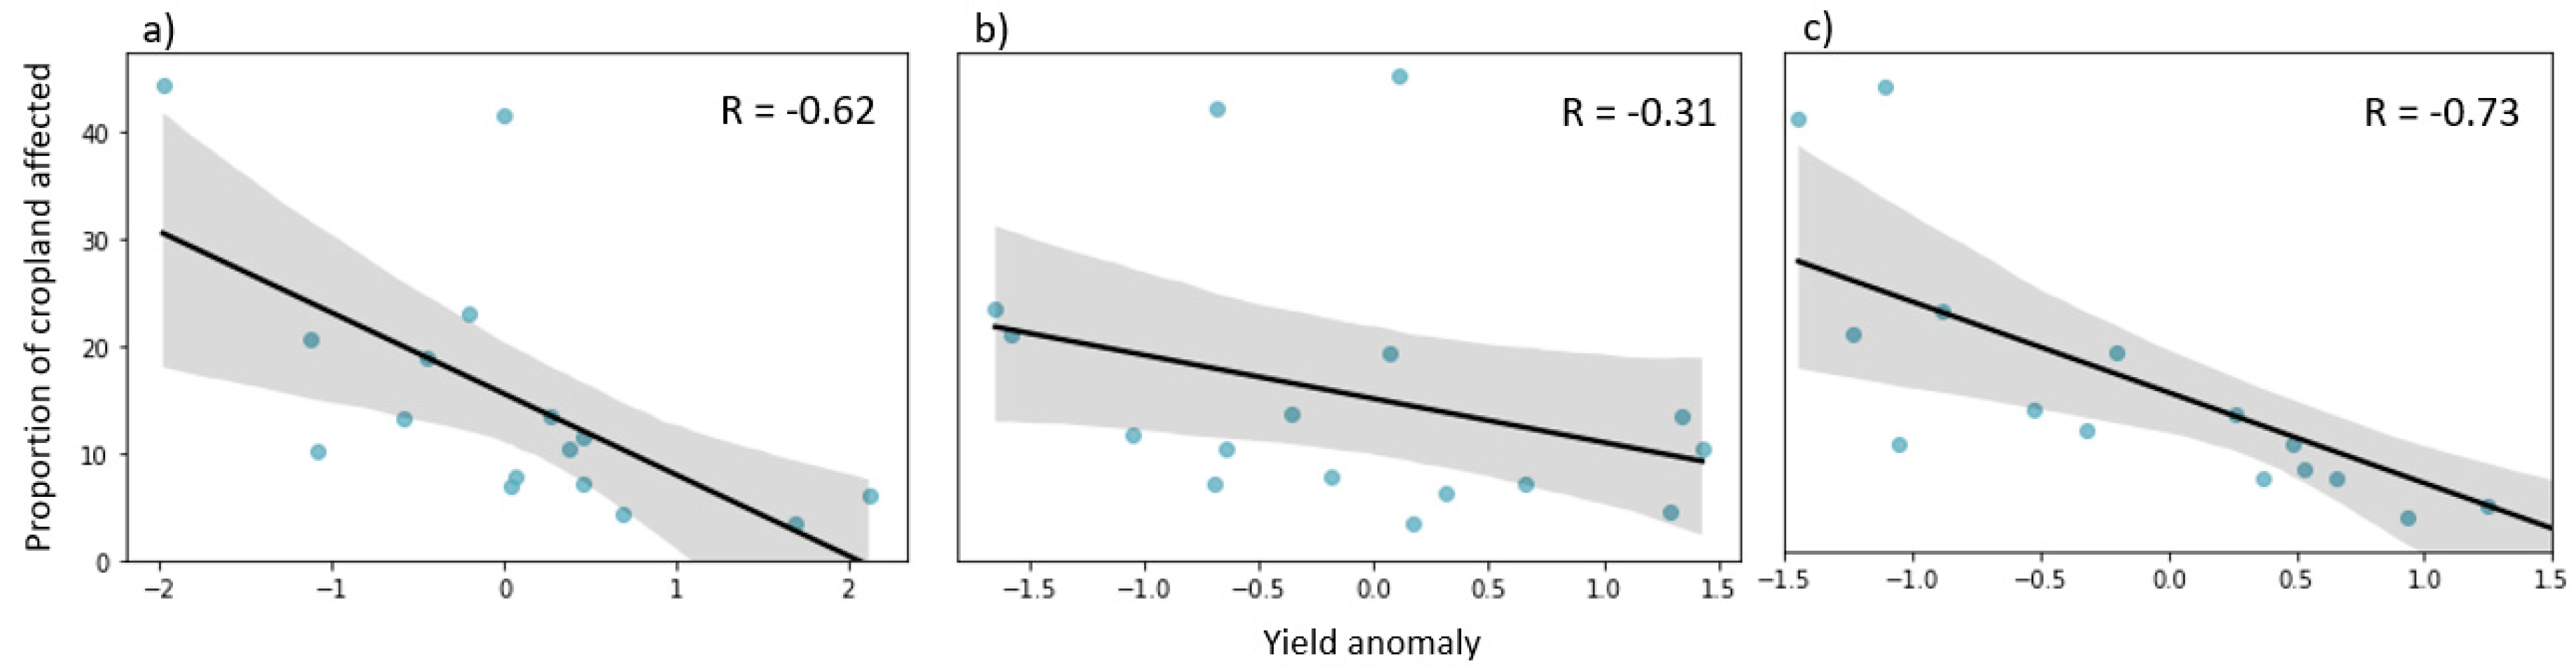
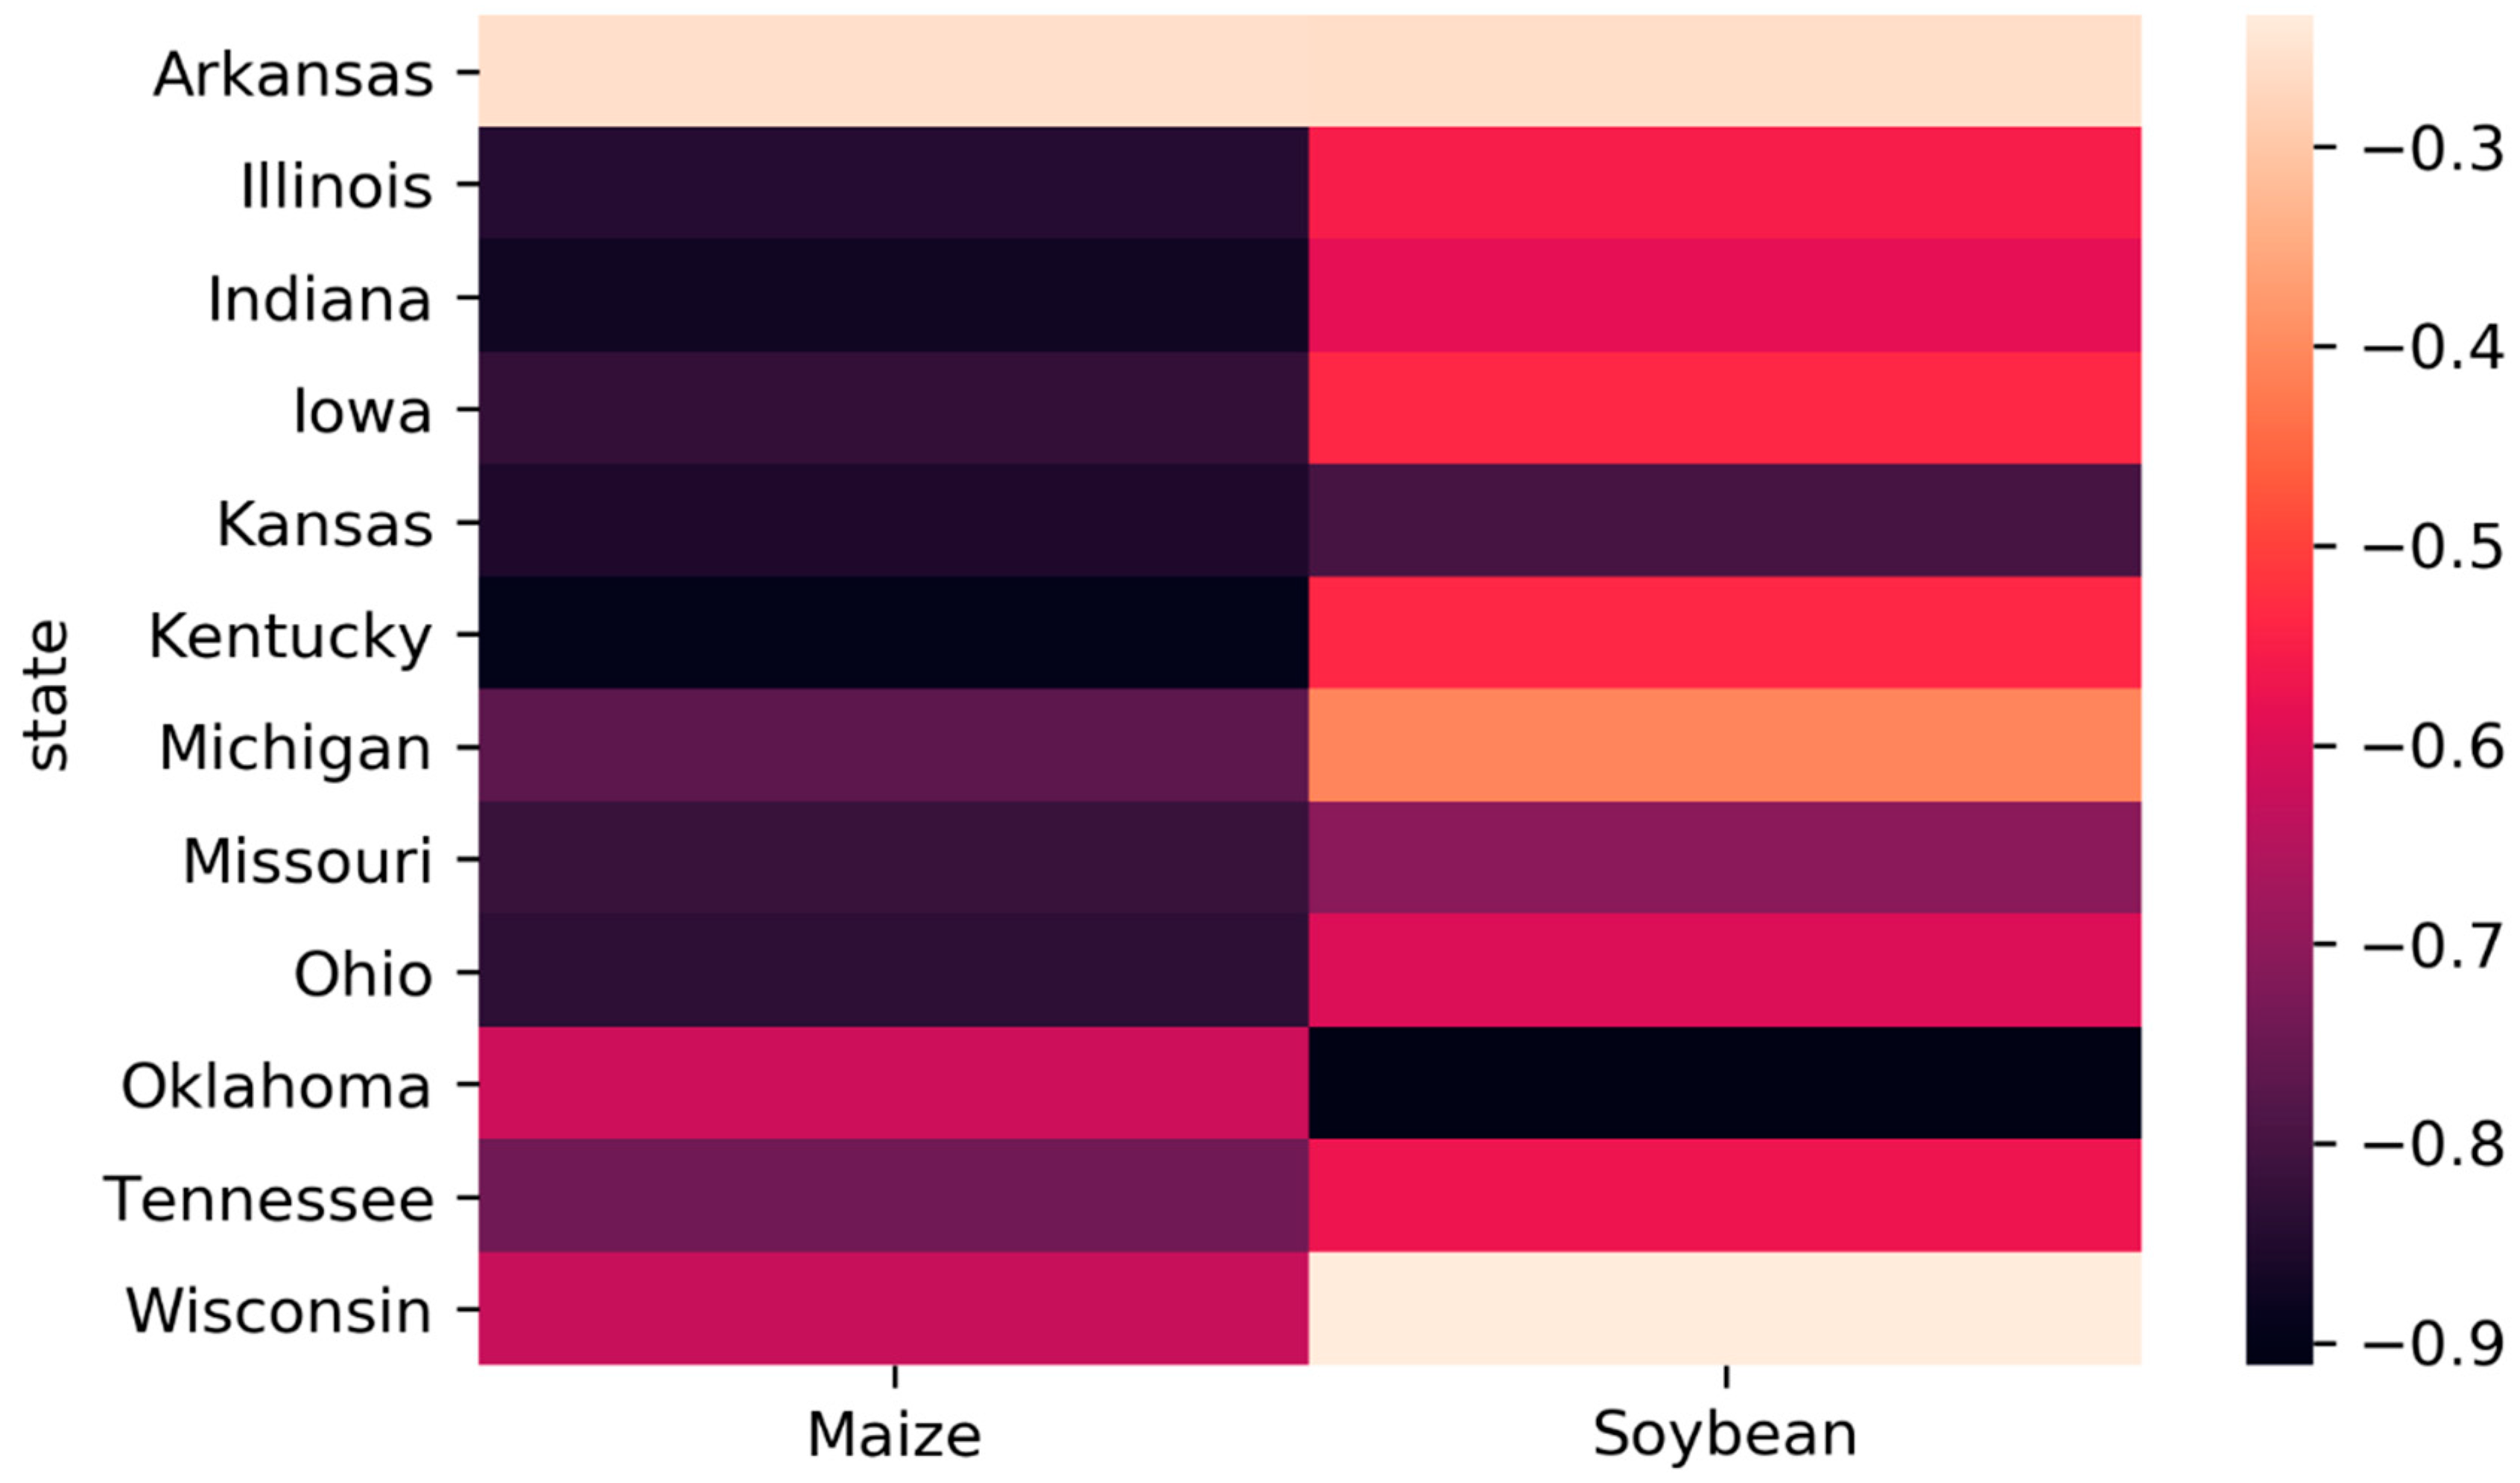
3.2. Regional Patterns of Drought

To analyze the temporal development of the drought impact, we aggregated drought anomalies for selected administrative units (Figure 5). Anomalies of the NDVI, LST, and ESI revealed 1 (moderate drought) to 2 (extreme drought) negative standard deviations over different countries, indicating severe drought impacts. The countries Argentina, Australia, Ethiopia, Germany, Russia, South Africa, USA and Zimbabwe were chosen based on the suboptimal conditions observed at the global level analysis, to further analyze the temporal patterns of drought propagation. We included at least one country per continent to reflect the patterns in areas with different environmental as well as socio-economic characteristics.
Anomalies extracted for croplands during the growing season (Figure 5) at a national level show the most severe droughts, such as 2012 in the US, 2006/2007 and 2015/2016 in South Africa, 2010 in Russia, 2003 in Germany, and 2009 in Argentina. Nevertheless, differences in magnitude and duration of drought conditions appeared between the specific indicators. For instance, the drought of 2015/2016 in Zimbabwe can be identified using the ESI and LST, whereas, with the NDVI, the impact is less visible. Similarly, more months with drought conditions were identified with ET and LST, such as for Ethiopia in 2009 and 2015. This shows the utility of LST and ET for drought impact analysis. These results are also in line with several studies where the ESI and LST were more sensitive to drought impact and were identified as better predictors of yield than the NDVI [51,75,76].
The effects of the particularly severe droughts in South Africa as well as in the US on cropland and national agricultural production were exemplarily analyzed, as these areas were highly impacted based on the global scale analysis. Hereby, regional drought severity is expressed by the spatial extent of agricultural droughts based on anomaly thresholds on cropland areas within national and sub-national administrative units, respectively. Figure 6 shows the comparison between the area affected in South Africa with soybean (left) and maize yield (right) at the national level. When comparing the proportion of the drought-impacted cropland with the yield anomaly, a negative association can be observed for all the crops (Figure 6). Nevertheless, maize and soybean yields exhibited a higher linear negative relationship than soybean, which has a smaller sown area and is predominately irrigated. A similar pattern can be observed for the regional level yield anomaly estimate, with a correlation coefficient of −0.81, for the Free State in South Africa, which is one of the main maize growing areas in South Africa.
Similarly, in the main crop growing states in the central USA, negative linear associations can be observed for both soybean and maize. Figure 7 shows the correlation matrix of correlations between the proportion of affected crops and yield anomaly over six states, depicting strong negative correlations with r ranging from −0.5 to −0.9. This depicts that the initially derived global products are relevant and can be used at a regional scale.
When comparing the proportion of drought-impacted cropland area, we can see a general agreement among the three RS-based indicators in both countries (Figure 8). For the comparison, two major crop growing areas are presented here: Iowa in the US and the Free State in South Africa, two leading maize production areas in respective countries. Particularly, the major drought events such as the 2002 and 2012 droughts in the USA [77] are highlighted with a significantly higher area affected with all three indices. This is in line with the other studies, which report that nearly two-thirds (65.45%) of the continental US was covered by drought, and in 2012 ~76% of the crop region was under a moderate to a severe dry condition in the USA Midwest [16]. Nevertheless, generally, a better agreement is observed between LST and the ESI. This can be explained by the fact that LST-based anomalies also show the evaporative stress of the crop. The NDVI, which in our study generally exhibited lower affected area, can be sensitive to other stress factors and can show the compound impact of not only drought but also other environmental and management differences. In the case of the Free State, the drought in 2006–2007 and 2015–2016 can be identified with all indices. In both of the areas, we can observe the LST-based indicator showing the highest proportion of affected croplands and with the NDVI indicating a lower proportion of the affected area.
When assessing the differences between irrigated and rainfed croplands (Figure 9), we can observe the general tendency of the larger area of affected rainfed croplands in both the US and South Africa, especially during the years with extreme drought events. This shows that the RS data can reflect the impacts of an insufficient irrigation supply. At the same time, we can observe some time steps, where a larger area of irrigated land is depicted (e.g., 2001 in South Africa). This is predominantly caused by the crop masks, which are available only in the later intervals in the time series, and the areas identified in 2014 as irrigated can be rainfed in 2001. This highlights the need for a consistent time series of spatially explicit irrigation information, which can further improve the analysis of impacts on different cropping systems.
The method presented in this study could be used in a more detailed way by looking at specific areas and using detailed information on annual crop cycles and the integration of crop-specific masks. Furthermore, the integration of other datasets, such as active and passive RS-based soil moisture information, can give additional insights regarding the drought impact. Nevertheless, the presented data and generated output, which are based on publicly available data (such as those presented in Figure 2, Figure 3 and Figure 4) could be used at a pixel level or aggregated over administrative regions at different levels for food security monitoring. The results of the study highlight the potential use of AET/PET and the integration of 500 m resolution to derive spatially explicit information on drought and its impacts. It is also the first study that integrated MODIS-based crop phenology, which effectively excluded the periods outside the growth. Further studies should use the phenometrics to assign specific weights to specific stages of growth, which can further improve the assessment of the drought impact. Unlike other studies, we also present drought characteristics aggregated over two decades, such as the number of months with suboptimal conditions, which can serve as a basis for drought risk analysis.
The results of this study confirmed the applied value of remote sensing-based indicators for drought-induced crop condition monitoring. These indices can be integrated into drought early warning systems and crop yield models; they can also be used for risk assessment and included in advanced decision-support frameworks.

4. Conclusions

Drought impact assessments based on RS time series provide objective measures and spatially consistent data covering large areas, up to the global level, with moderate spatial resolution. Multisource remotely sensed time-series gave accurate information on varying drought impacts from the global and sub-national scale. MODIS data at 500 m resolution are appropriate for national and subnational level analysis and reflect the reported yield variability. Among analyzed indicators, ET-based ESI from the peak growing stage was the best indicator for drought impact on cropland and for explaining yield variability. For several regions, such as Ethiopia, South Africa, and Zimbabwe, droughts identified using the ESI and LST were more intense than the NDVI-based results. We concluded that the analyzed three indicators are relevant and supplementary for agricultural drought monitoring at both global and regional scales. Several past drought events were clearly identified in this study, such as the drought in the USA in 2012, in several regions of Europe in 2003, Eastern Africa in 2016–2017, and in South Africa in 2015–2016. The resulting gridded drought occurrence data as well as aggregates over different regions can be used for food security monitoring and can be integrated into drought risk analysis frameworks. They can be used for operational drought early warning systems and crop models and included in advanced decision-support frameworks. The method and indicators used can be further applied for monitoring of drought impacts on the carbon, nutrient, and water cycles.

Author Contributions

Conceptualization, G.G., S.K., E.E.R. and O.D.; formal analysis, G.G. and S.K., writing—original draft preparation, G.G., S.K., E.E.R., O.D. and S.S.; funding acquisition O.D. and S.S.; supervision O.D. and S.S. All authors have contributed to drafting the manuscript, the interpretation of the results, and approved the final manuscript. All authors have read and agreed to the published version of the manuscript.

Funding

This research was funded by the German Federal Ministry of Education and Research (Project: GlobeDrought, grant No. 02WGR1457A-F).

Acknowledgments

The authors would like to thank the Department of Agriculture, Forestry and Fisheries (DAFF) of South Africa for providing the regional yield and irrigation data.

Conflicts of Interest

The authors declare no conflict of interest.

References and Notes

  1. Rojas, O.; Vrieling, A.; Rembold, F. Assessing drought probability for agricultural areas in Africa with coarse resolution remote sensing imagery. Remote Sens. Environ. 2011, 115, 343–352. [Google Scholar] [CrossRef]
  2. Hazaymeh, K.; Hassan, Q.K. Remote sensing of agricultural drought monitoring: A state of art review. AIMS Environ. Sci. 2016, 3, 604–630. [Google Scholar] [CrossRef]
  3. Spinoni, J.; Lakatos, M.; Szentimrey, T.; Bihari, Z.; Szalai, S.; Vogt, J.; Antofie, T. Heat and cold waves trends in the Carpathian Region from 1961 to 2010. Int. J. Climatol. 2015, 35, 4197–4209. [Google Scholar] [CrossRef] [Green Version]
  4. Meza, I.; Siebert, S.; Döll, P.; Kusche, J.; Herbert, C.; Rezaei, E.E.; Nouri, H.; Gerdener, H.; Popat, E.; Frischen, J.; et al. Global-scale drought risk assessment for agricultural systems. Nat. Hazards Earth Syst. Sci. 2020, 20, 695–712. [Google Scholar] [CrossRef] [Green Version]
  5. Eslamian, S.; Eslamian, F.A. Handbook of Drought and Water Scarcity: Principles of Drought and Water Scarcity; CRC Press: Boca Raton, FL, USA, 2017; ISBN 978-1-315-40420-2. [Google Scholar]
  6. AghaKouchak, A.; Farahmand, A.M.; Melton, F.S.; Teixeira, J.P.; Anderson, M.C.; Wardlow, B.D.; Hain, C.R. Remote sensing of drought: Progress, challenges and opportunities. Rev. Geophys. 2015, 53, 452–480. [Google Scholar] [CrossRef] [Green Version]
  7. Kogan, F.; Adamenko, T.; Guo, W. Global and regional drought dynamics in the climate warming era. Remote Sens. Lett. 2013, 4, 364–372. [Google Scholar] [CrossRef]
  8. Mahlalela, P.T.; Blamey, R.C.; Hart, N.C.G.; Reason, C.J.C. Drought in the Eastern Cape region of South Africa and trends in rainfall characteristics. Clim. Dyn. 2020, 55, 2743–2759. [Google Scholar] [CrossRef]
  9. Funk, C.; Shukla, S.; Thiaw, W.M.; Rowland, J.; Hoell, A.; McNally, A.; Husak, G.; Novella, N.; Budde, M.; Peters-Lidard, C.; et al. Recognizing the Famine Early Warning Systems Network: Over 30 Years of Drought Early Warning Science Advances and Partnerships Promoting Global Food Security. Bull. Am. Meteorol. Soc. 2019, 100, 1011–1027. [Google Scholar] [CrossRef]
  10. Hoolst, R.V.; Eerens, H.; Haesen, D.; Royer, A.; Bydekerke, L.; Rojas, O.; Li, Y.; Racionzer, P. FAO’s AVHRR-based Agricultural Stress Index System (ASIS) for global drought monitoring. Int. J. Remote Sens. 2016, 37, 418–439. [Google Scholar] [CrossRef]
  11. Qu, C.; Hao, X.; Qu, J.J. Monitoring Extreme Agricultural Drought over the Horn of Africa (HOA) Using Remote Sensing Measurements. Remote Sens. 2019, 11, 902. [Google Scholar] [CrossRef] [Green Version]
  12. Van Loon, A.F.; Gleeson, T.; Clark, J.; Van Dijk, A.I.J.M.; Stahl, K.; Hannaford, J.; Di Baldassarre, G.; Teuling, A.J.; Tallaksen, L.M.; Uijlenhoet, R.; et al. Drought in the Anthropocene. Nat. Geosci. 2016, 9, 89–91. [Google Scholar] [CrossRef] [Green Version]
  13. Lesk, C.; Rowhani, P.; Ramankutty, N. Influence of extreme weather disasters on global crop production. Nature 2016, 529, 84–87. [Google Scholar] [CrossRef] [PubMed]
  14. Yu, C.; Huang, X.; Chen, H.; Huang, G.; Ni, S.; Wright, J.S.; Hall, J.; Ciais, P.; Zhang, J.; Xiao, Y.; et al. Assessing the Impacts of Extreme Agricultural Droughts in China Under Climate and Socioeconomic Changes. Earths Future 2018, 6, 689–703. [Google Scholar] [CrossRef]
  15. Hao, Z.; AghaKouchak, A.; Nakhjiri, N.; Farahmand, A. Global integrated drought monitoring and prediction system. Sci. Data 2014, 1, 140001. [Google Scholar] [CrossRef] [PubMed]
  16. Jin, C.; Luo, X.; Xiao, X.; Dong, J.; Li, X.; Yang, J.; Zhao, D. The 2012 Flash Drought Threatened US Midwest Agroecosystems. Chin. Geogr. Sci. 2019, 29, 768–783. [Google Scholar] [CrossRef] [Green Version]
  17. Liou, Y.-A.; Mulualem, G.M. Spatio–temporal Assessment of Drought in Ethiopia and the Impact of Recent Intense Droughts. Remote Sens. 2019, 11, 1828. [Google Scholar] [CrossRef] [Green Version]
  18. Rojas, O.; Piersante, A.; Cumani, M.; Li, Y. Understanding the Drought Impact of El Niño/La Niña in the Grain Production Areas in Eastern Europe and Central Asia; FAO: Rome, Italy, 2019. [Google Scholar]
  19. Schwarz, M.; Landmann, T.; Cornish, N.; Wetzel, K.-F.; Siebert, S.; Franke, J. A Spatially Transferable Drought Hazard and Drought Risk Modeling Approach Based on Remote Sensing Data. Remote Sens. 2020, 12, 237. [Google Scholar] [CrossRef] [Green Version]
  20. Gidey, E.; Dikinya, O.; Sebego, R.; Segosebe, E.; Zenebe, A. Analysis of the long-term agricultural drought onset, cessation, duration, frequency, severity and spatial extent using Vegetation Health Index (VHI) in Raya and its environs, Northern Ethiopia. Environ. Syst. Res. 2018, 7, 13. [Google Scholar] [CrossRef] [Green Version]
  21. Alsafadi, K.; Mohammed, S.A.; Ayugi, B.; Sharaf, M.; Harsányi, E. Spatial–Temporal Evolution of Drought Characteristics Over Hungary Between 1961 and 2010. Pure Appl. Geophys. 2020, 177, 3961–3978. [Google Scholar] [CrossRef] [Green Version]
  22. Senay, G.B.; Velpuri, N.M.; Bohms, S.; Budde, M.; Young, C.; Rowland, J.; Verdin, J.P. Drought Monitoring and Assessment. In Hydro-Meteorological Hazards, Risks and Disasters; Elsevier: Amsterdam, The Netherlands, 2015; pp. 233–262. ISBN 978-0-12-394846-5. [Google Scholar]
  23. Wu, D.; Qu, J.J.; Hao, X. Agricultural drought monitoring using MODIS-based drought indices over the USA Corn Belt. Int. J. Remote Sens. 2015, 36, 5403–5425. [Google Scholar] [CrossRef]
  24. Rhee, J.; Im, J.; Carbone, G.J. Monitoring agricultural drought for arid and humid regions using multi-sensor remote sensing data. Remote Sens. Environ. 2010, 114, 2875–2887. [Google Scholar] [CrossRef]
  25. Klisch, A.; Atzberger, C. Operational Drought Monitoring in Kenya Using MODIS NDVI Time Series. Remote Sens. 2016, 8, 267. [Google Scholar] [CrossRef] [Green Version]
  26. Swain, S.; Wardlow, B.D.; Narumalani, S.; Tadesse, T.; Callahan, K. Assessment of Vegetation Response to Drought in Nebraska Using Terra-MODIS Land Surface Temperature and Normalized Difference Vegetation Index. GISci. Remote Sens. 2011, 48, 432–455. [Google Scholar] [CrossRef]
  27. Karnieli, A.; Agam, N.; Pinker, R.T.; Anderson, M.; Imhoff, M.L.; Gutman, G.G.; Panov, N.; Goldberg, A. Use of NDVI and Land Surface Temperature for Drought Assessment: Merits and Limitations. J. Clim. 2010, 23, 618–633. [Google Scholar] [CrossRef]
  28. Vicente-Serrano, S.M.; Beguería, S.; López-Moreno, J.I. A Multiscalar Drought Index Sensitive to Global Warming: The Standardized Precipitation Evapotranspiration Index. J. Clim. 2009, 23, 1696–1718. [Google Scholar] [CrossRef] [Green Version]
  29. Maes, W.H.; Steppe, K. Estimating evapotranspiration and drought stress with ground-based thermal remote sensing in agriculture: A review. J. Exp. Bot. 2012, 63, 4671–4712. [Google Scholar] [CrossRef] [Green Version]
  30. Sazib, N.; Mladenova, I.; Bolten, J.; Sazib, N.; Mladenova, I.; Bolten, J. Leveraging the Google Earth Engine for Drought Assessment Using Global Soil Moisture Data. Remote Sens. 2018, 10, 1265. [Google Scholar] [CrossRef] [Green Version]
  31. Bhuiyan, C.; Saha, A.K.; Bandyopadhyay, N.; Kogan, F.N. Analyzing the impact of thermal stress on vegetation health and agricultural drought—A case study from Gujarat, India. GISci. Remote Sens. 2017, 54, 678–699. [Google Scholar] [CrossRef]
  32. Abera, T.A.; Heiskanen, J.; Pellikka, P.; Maeda, E.E. Rainfall–vegetation interaction regulates temperature anomalies during extreme dry events in the Horn of Africa. Glob. Planet. Chang. 2018, 167, 35–45. [Google Scholar] [CrossRef]
  33. Haroon, M.A.; Zhang, J.; Yao, F. Drought monitoring and performance evaluation of MODIS-based drought severity index (DSI) over Pakistan. Nat Hazards 2016, 84, 1349–1366. [Google Scholar] [CrossRef]
  34. Rojas, O. Agricultural extreme drought assessment at global level using the FAO-Agricultural Stress Index System (ASIS). Weather Clim. Extrem. 2020, 27, 100184. [Google Scholar] [CrossRef]
  35. Cammalleri, C.; Verger, A.; Lacaze, R.; Vogt, J.V. Harmonization of GEOV2 fAPAR time series through MODIS data for global drought monitoring. Int. J. Appl. Earth Obs. Geoinf. 2019, 80, 1–12. [Google Scholar] [CrossRef] [PubMed]
  36. Lu, J.; Carbone, G.J.; Gao, P. Mapping the agricultural drought based on the long-term AVHRR NDVI and North American Regional Reanalysis (NARR) in the United States, 1981–2013. Appl. Geogr. 2019, 104, 10–20. [Google Scholar] [CrossRef]
  37. Son, N.T.; Chen, C.F.; Chen, C.R.; Chang, L.Y.; Minh, V.Q. Monitoring agricultural drought in the Lower Mekong Basin using MODIS NDVI and land surface temperature data. Int. J. Appl. Earth Obs. Geoinf. 2012, 18, 417–427. [Google Scholar] [CrossRef]
  38. Agutu, N.O.; Awange, J.L.; Zerihun, A.; Ndehedehe, C.E.; Kuhn, M.; Fukuda, Y. Assessing multi-satellite remote sensing, reanalysis, and land surface models’ products in characterizing agricultural drought in East Africa. Remote Sens. Environ. 2017, 194, 287–302. [Google Scholar] [CrossRef] [Green Version]
  39. Patel, N.R.; Parida, B.R.; Venus, V.; Saha, S.K.; Dadhwal, V.K. Analysis of agricultural drought using vegetation temperature condition index (VTCI) from Terra/MODIS satellite data. Environ. Monit. Assess. 2012, 184, 7153–7163. [Google Scholar] [CrossRef]
  40. Zargar, A.; Sadiq, R.; Naser, B.; Khan, F.I. A review of drought indices. Environ. Rev. 2011, 19, 333–349. [Google Scholar] [CrossRef]
  41. Cunha, A.P.M.; Alvalá, R.C.; Nobre, C.A.; Carvalho, M.A. Monitoring vegetative drought dynamics in the Brazilian semiarid region. Agric. For. Meteorol. 2015, 214–215, 494–505. [Google Scholar] [CrossRef]
  42. Le Page, M.; Zribi, M. Analysis and Predictability of Drought In Northwest Africa Using Optical and Microwave Satellite Remote Sensing Products. Sci. Rep. 2019, 9, 1466. [Google Scholar] [CrossRef] [Green Version]
  43. Graw, V.; Dubovyk, O.; Duguru, M.; Heid, P.; Ghazaryan, G.; De León, J.C.V.; Post, J.; Szarzynski, J.; Tsegai, D.; Walz, Y. Chapter 9—Assessment, monitoring, and early warning of droughts: The potential for satellite remote sensing and beyond. In Current Directions in Water Scarcity Research; Mapedza, E., Tsegai, D., Bruntrup, M., Mcleman, R., Eds.; Elsevier: Amsterdam, The Netherlands, 2019; Volume 2, pp. 115–131. [Google Scholar]
  44. Bolton, D.K.; Friedl, M.A. Forecasting crop yield using remotely sensed vegetation indices and crop phenology metrics. Agric. For. Meteorol. 2013, 173, 74–84. [Google Scholar] [CrossRef]
  45. Hu, L.; Sun, Y.; Collins, G.; Fu, P. Improved estimates of monthly land surface temperature from MODIS using a diurnal temperature cycle (DTC) model. ISPRS J. Photogramm. Remote Sens. 2020, 168, 131–140. [Google Scholar] [CrossRef]
  46. Running, S.; Mu, Q.; Zhao, M. MOD16A2 MODIS/Terra Net Evapotranspiration 8-Day L4 Global 500m SIN Grid V006 2017. Available online: https://cmr.earthdata.nasa.gov/search/concepts/C1000000524-LPDAAC_ECS.html (accessed on 28 October 2020).
  47. Gessesse, A.A.; Melesse, A.M. Temporal relationships between time series CHIRPS-rainfall estimation and eMODIS-NDVI satellite images in Amhara Region, Ethiopia. In Extreme Hydrology and Climate Variability; Melesse, A.M., Abtew, W., Senay, G., Eds.; Elsevier: New York, NY, USA, 2019; pp. 81–92. ISBN 978-0-12-815998-9. [Google Scholar]
  48. Wan, Z.; Hook, S.; Hulley, G. MOD11A2 MODIS/Terra Land Surface Temperature/Emissivity 8-Day L3 Global 1km SIN Grid V006. Available online: https://data.nasa.gov/dataset/MODIS-Terra-Land-Surface-Temperature-Emissivity-8-/cqy8-qjka (accessed on 28 October 2020).
  49. Monteith, J.L. Evaporation and environment. Symp. Soc. Exp. Biol. 1965, 19, 205–234. [Google Scholar] [PubMed]
  50. Mu, Q.; Zhao, M.; Running, S.W. Improvements to a MODIS global terrestrial evapotranspiration algorithm. Remote Sens. Environ. 2011, 115, 1781–1800. [Google Scholar] [CrossRef]
  51. Anderson, M.C.; Zolin, C.A.; Sentelhas, P.C.; Hain, C.R.; Semmens, K.; Tugrul Yilmaz, M.; Gao, F.; Otkin, J.A.; Tetrault, R. The Evaporative Stress Index as an indicator of agricultural drought in Brazil: An assessment based on crop yield impacts. Remote Sens. Environ. 2016, 174, 82–99. [Google Scholar] [CrossRef]
  52. Sulla-Menashe, D.; Friedl, M. MCD12Q1 MODIS/Terra+Aqua Land Cover Type Yearly L3 Global 500m SIN Grid V006. Available online: https://lpdaac.usgs.gov/products/mcd12q1v006/ (accessed on 28 October 2020).
  53. Pervez, M.S.; Brown, J.F. Mapping irrigated lands at 250-m scale by merging MODIS data and national agricultural statistics. Remote Sens. 2010, 2, 2388–2412. [Google Scholar] [CrossRef] [Green Version]
  54. Graw, V.; Ghazaryan, G.; Schreier, J.; Gonzalez, J.; Abdel-Hamid, A.; Walz, Y.; Dall, K.; Post, J.; Jordaan, A.; Dubovyk, O. Timing is Everything–Drought Classification for Risk Assessment. IEEE J. Sel. Top. Appl. Earth Obs. Remote. Sens. 2020, 13, 428–433. [Google Scholar] [CrossRef]
  55. Ganguly, S.; Friedl, M.A.; Tan, B.; Zhang, X.; Verma, M. Land surface phenology from MODIS: Characterization of the Collection 5 global land cover dynamics product. Remote Sens. Environ. 2010, 114, 1805–1816. [Google Scholar] [CrossRef] [Green Version]
  56. Aquastat, FAO. FAO’s Global Information System of Water and Agriculture. Rome, Italy. 1999. Available online: http://www.fao.org/aquastat/en/ (accessed on 7 December 2020).
  57. FAO. Faostat. 2020. Available online: http://www.fao.org/faostat/en/#data (accessed on 7 December 2020).
  58. Iizumi, T.; Sakai, T. The global dataset of historical yields for major crops 1981–2016. Sci. Data 2020, 7, 97. [Google Scholar] [CrossRef] [Green Version]
  59. USDA/NASS QuickStats Ad-hoc Query Tool. Available online: https://quickstats.nass.usda.gov/ (accessed on 8 January 2020).
  60. Department of Agriculture, Forestry and Fisheries (DAFF) of South Africa Observed Maize yield in South Africa. Pretoria, South Africa: Department of Agriculture, Forestry and Fisheries, Government of South Africa.
  61. GeoNetwork, FAO. Global Administrative Unit Layers (GAUL); Food and Agriculture Organization of the United Nations: Roma, Italy, 2015; Available online: http://www.fao.org/geonetwork/srv/en/metadata.show?currTab=simple&id=12691 (accessed on 7 December 2020).
  62. Gorelick, N.; Hancher, M.; Dixon, M.; Ilyushchenko, S.; Thau, D.; Moore, R. Google Earth Engine: Planetary-scale geospatial analysis for everyone. Remote Sens. Environ. 2017. [Google Scholar] [CrossRef]
  63. Jiménez-Donaire, M.D.P.; Tarquis, A.M.; Giráldez, J.V. Evaluation of a combined drought indicator and its potential for agricultural drought prediction in southern Spain. Nat. Hazards Earth Syst. Sci. 2020, 20, 21–33. [Google Scholar] [CrossRef] [Green Version]
  64. Wardlow, B.D.; Callahan, K. A multi-scale accuracy assessment of the MODIS irrigated agriculture data-set (MIrAD) for the state of Nebraska, USA. GISci. Remote Sens. 2014, 51, 575–592. [Google Scholar] [CrossRef]
  65. Reinermann, S.; Gessner, U.; Asam, S.; Kuenzer, C.; Dech, S. The Effect of Droughts on Vegetation Condition in Germany: An Analysis Based on Two Decades of Satellite Earth Observation Time Series and Crop Yield Statistics. Remote Sens. 2019, 11, 1783. [Google Scholar] [CrossRef] [Green Version]
  66. Leng, G.; Hall, J. Crop yield sensitivity of global major agricultural countries to droughts and the projected changes in the future. Sci. Total Environ. 2019, 654, 811–821. [Google Scholar] [CrossRef] [PubMed]
  67. Global Drought Observatory (GDO) Timeline of Drought Events—Global Drought Observatory—JRC European Commission. Available online: https://edo.jrc.ec.europa.eu/gdo/php/index.php?id=2020 (accessed on 24 November 2020).
  68. Mueller, N.D.; Gerber, J.S.; Johnston, M.; Ray, D.K.; Ramankutty, N.; Foley, J.A. Closing yield gaps through nutrient and water management. Nature 2012, 490, 254–257. [Google Scholar] [CrossRef]
  69. Joiner, J.; Yoshida, Y.; Anderson, M.; Holmes, T.; Hain, C.; Reichle, R.; Koster, R.; Middleton, E.; Zeng, F.-W. Global relationships among traditional reflectance vegetation indices (NDVI and NDII), evapotranspiration (ET), and soil moisture variability on weekly timescales. Remote Sens. Environ. 2018, 219, 339–352. [Google Scholar] [CrossRef] [Green Version]
  70. Dubovyk, O.; Ghazaryan, G.; González, J.; Graw, V.; Löw, F.; Schreier, J. Drought hazard in Kazakhstan in 2000–2016: A remote sensing perspective. Environ. Monit. Assess. 2019, 191, 510. [Google Scholar] [CrossRef]
  71. FAO Food and Agriculture Organization. Statistical Pocketbook 2018; FAO: Rome, Italy, 2018. [Google Scholar]
  72. Conway, D.; Schipper, E.L.F. Adaptation to climate change in Africa: Challenges and opportunities identified from Ethiopia. Glob. Environ. Chang. 2011, 21, 227–237. [Google Scholar] [CrossRef]
  73. Mekonen, A.A.; Berlie, A.B.; Ferede, M.B. Spatial and temporal drought incidence analysis in the northeastern highlands of Ethiopia. Geoenviron. Disasters 2020, 7, 10. [Google Scholar] [CrossRef] [Green Version]
  74. Sifiso, N.; Bonani, N.; Simphiwe, N.; Heidi, P.; Moses, L.; Ntombela, S.; Nyhodo, B.; Ngqangweni, S.; Phahlane, H.; Lubinga, M. Economy-wide effects of drought on South African Agriculture: A computable general equilibrium (CGE) analysis. J. Dev. Agric. Econ. 2017, 9, 46–56. [Google Scholar] [CrossRef]
  75. Yoon, D.-H.; Nam, W.-H.; Lee, H.-J.; Hong, E.-M.; Feng, S.; Wardlow, B.D.; Tadesse, T.; Svoboda, M.D.; Hayes, M.J.; Kim, D.-E. Agricultural Drought Assessment in East Asia Using Satellite-Based Indices. Remote Sens. 2020, 12, 444. [Google Scholar] [CrossRef] [Green Version]
  76. Liu, W.T.; Kogan, F. Monitoring Brazilian soybean production using NOAA/AVHRR based vegetation condition indices. Int. J. Remote Sens. 2002, 23, 1161–1179. [Google Scholar] [CrossRef]
  77. Rippey, B.R. The U.S. drought of 2012. Weather Clim. Extrem. 2015, 10, 57–64. [Google Scholar] [CrossRef] [Green Version]
Figure 1. The workflow of the analysis.
Remotesensing 12 04030 g001
Figure 2. Pearson’s correlation coefficient (r) estimated for a maize yield anomaly (based on gridded yield data) with (a) land surface temperature (LST), evaporative stress index (ESI), and normalized difference vegetation index (NDVI) anomalies (peak of the growing season) and (b) boxplots extracted for selected countries.
Remotesensing 12 04030 g002
Figure 3. Pearson’s correlation coefficient (r) estimated for (a) soybean and wheat yield anomalies with the ESI anomaly and boxplots extracted for selected countries showing comparison with other indicators for (b) soybean and (c) wheat.
Remotesensing 12 04030 g003
Figure 4. (a) Maximum number of consecutive months with the ESI anomaly <−1 in the period 2001–2017 (non-cropland areas are masked based on the MODIS land cover) and (b) total number of months with the ESI anomaly <−1.
Remotesensing 12 04030 g004
Figure 5. Standardized anomalies of the indicators ESI, LST and NDVI for croplands aggregated to national scale for selected countries (2001–2017). The gaps in the data correspond to off-season observations (for visualization purposes, the LST anomaly was multiplied by −1, so all negative values show sub-optimal conditions in croplands). The bars represent drought events based detected by the Global Drought Observatory.
Remotesensing 12 04030 g005
Figure 6. Relationship between the area affected by drought (based on the ESI anomalies andyields) of (a) soybean, (b) wheat, and (c) maize yield for South Africa in period 2001–2017. The 95% confidence interval was determined by bootstrapping and is illustrated as the dark gray area.
Remotesensing 12 04030 g006
Figure 7. Correlation (r) between the area affected by drought (based on ESI anomalies) and yields of maize and soybean for federal states of USin period 2001–2017.
Remotesensing 12 04030 g007
Figure 8. Percentageof crop area affected by drought based on anomalies of ESI, NDVI and LST derived from MODIS for (a) Iowa (US, July) and (b) Free State (South Africa, February) in period 2001–2017.
Remotesensing 12 04030 g008
Figure 9. Percentageof the crop area affected by drought for irrigated and rainfed cropland (a) Iowa (US, July) and (b) Free State (South Africa, February) for period 2001–2017.
Remotesensing 12 04030 g009
Publisher’s Note: MDPI stays neutral with regard to jurisdictional claims in published maps and institutional affiliations.

