Damage-Map Estimation Using UAV Images and Deep Learning Algorithms for Disaster Management System


1
Department of Civil, Architecture and Environmental System Engineering, Sungkyunkwan University, Suwon 16419, Korea
2
Department of Convergence Engineering for Future City, Sungkyunkwan University, Suwon 16419, Korea
3
School of Civil, Architectural Engineering and Landscape Architecture, Sungkyunkwan University, Suwon 16419, Korea
4
Technical Research Center, Smart Inside Co., Ltd., Suwon 16419, Korea
*
Author to whom correspondence should be addressed.
Remote Sens. 2020, 12(24), 4169; https://0-doi-org.brum.beds.ac.uk/10.3390/rs12244169
Submission received: 18 November 2020
/
Revised: 14 December 2020
/
Accepted: 14 December 2020
/
Published: 19 December 2020
(This article belongs to the Special Issue Pattern Analysis in Remote Sensing)
Abstract
:Estimating the damaged area after a forest fire is important for responding to this natural catastrophe. With the support of aerial remote sensing, typically with unmanned aerial vehicles (UAVs), the aerial imagery of forest-fire areas can be easily obtained; however, retrieving the burnt area from the image is still a challenge. We implemented a new approach for segmenting burnt areas from UAV images using deep learning algorithms. First, the data were collected from a forest fire in Andong, the Republic of Korea, in April 2020. Then, the proposed two-patch-level deep-learning models were implemented. A patch-level 1 network was trained using the UNet++ architecture. The output prediction of this network was used as a position input for the second network, which used UNet. It took the reference position from the first network as its input and refined the results. Finally, the final performance of our proposed method was compared with a state-of-the-art image-segmentation algorithm to prove its robustness. Comparative research on the loss functions was also performed. Our proposed approach demonstrated its effectiveness in extracting burnt areas from UAV images and can contribute to estimating maps showing the areas damaged by forest fires.
1. Introduction
Forest fires impact the normal distribution of vegetation and have a significant social impact [1]. According to the Republic of Korea Forest Fire Statics Yearbook [2], there were 432 forest fires from 2009 to 2018, causing 670 hectares (ha) worth of forest destruction. In 2019, the number of dry days increased and the number of precipitation days decreased, leading to a substantial rise in forest-fire incidents. A total of 653 forest fires occurred and 3255 ha of damage was sustained. The numerous causes of forest fires make prevention challenging. However, evaluating the damage for immediate postfire control is essential because the response approach helps minimize both damage to the economy and to human life.
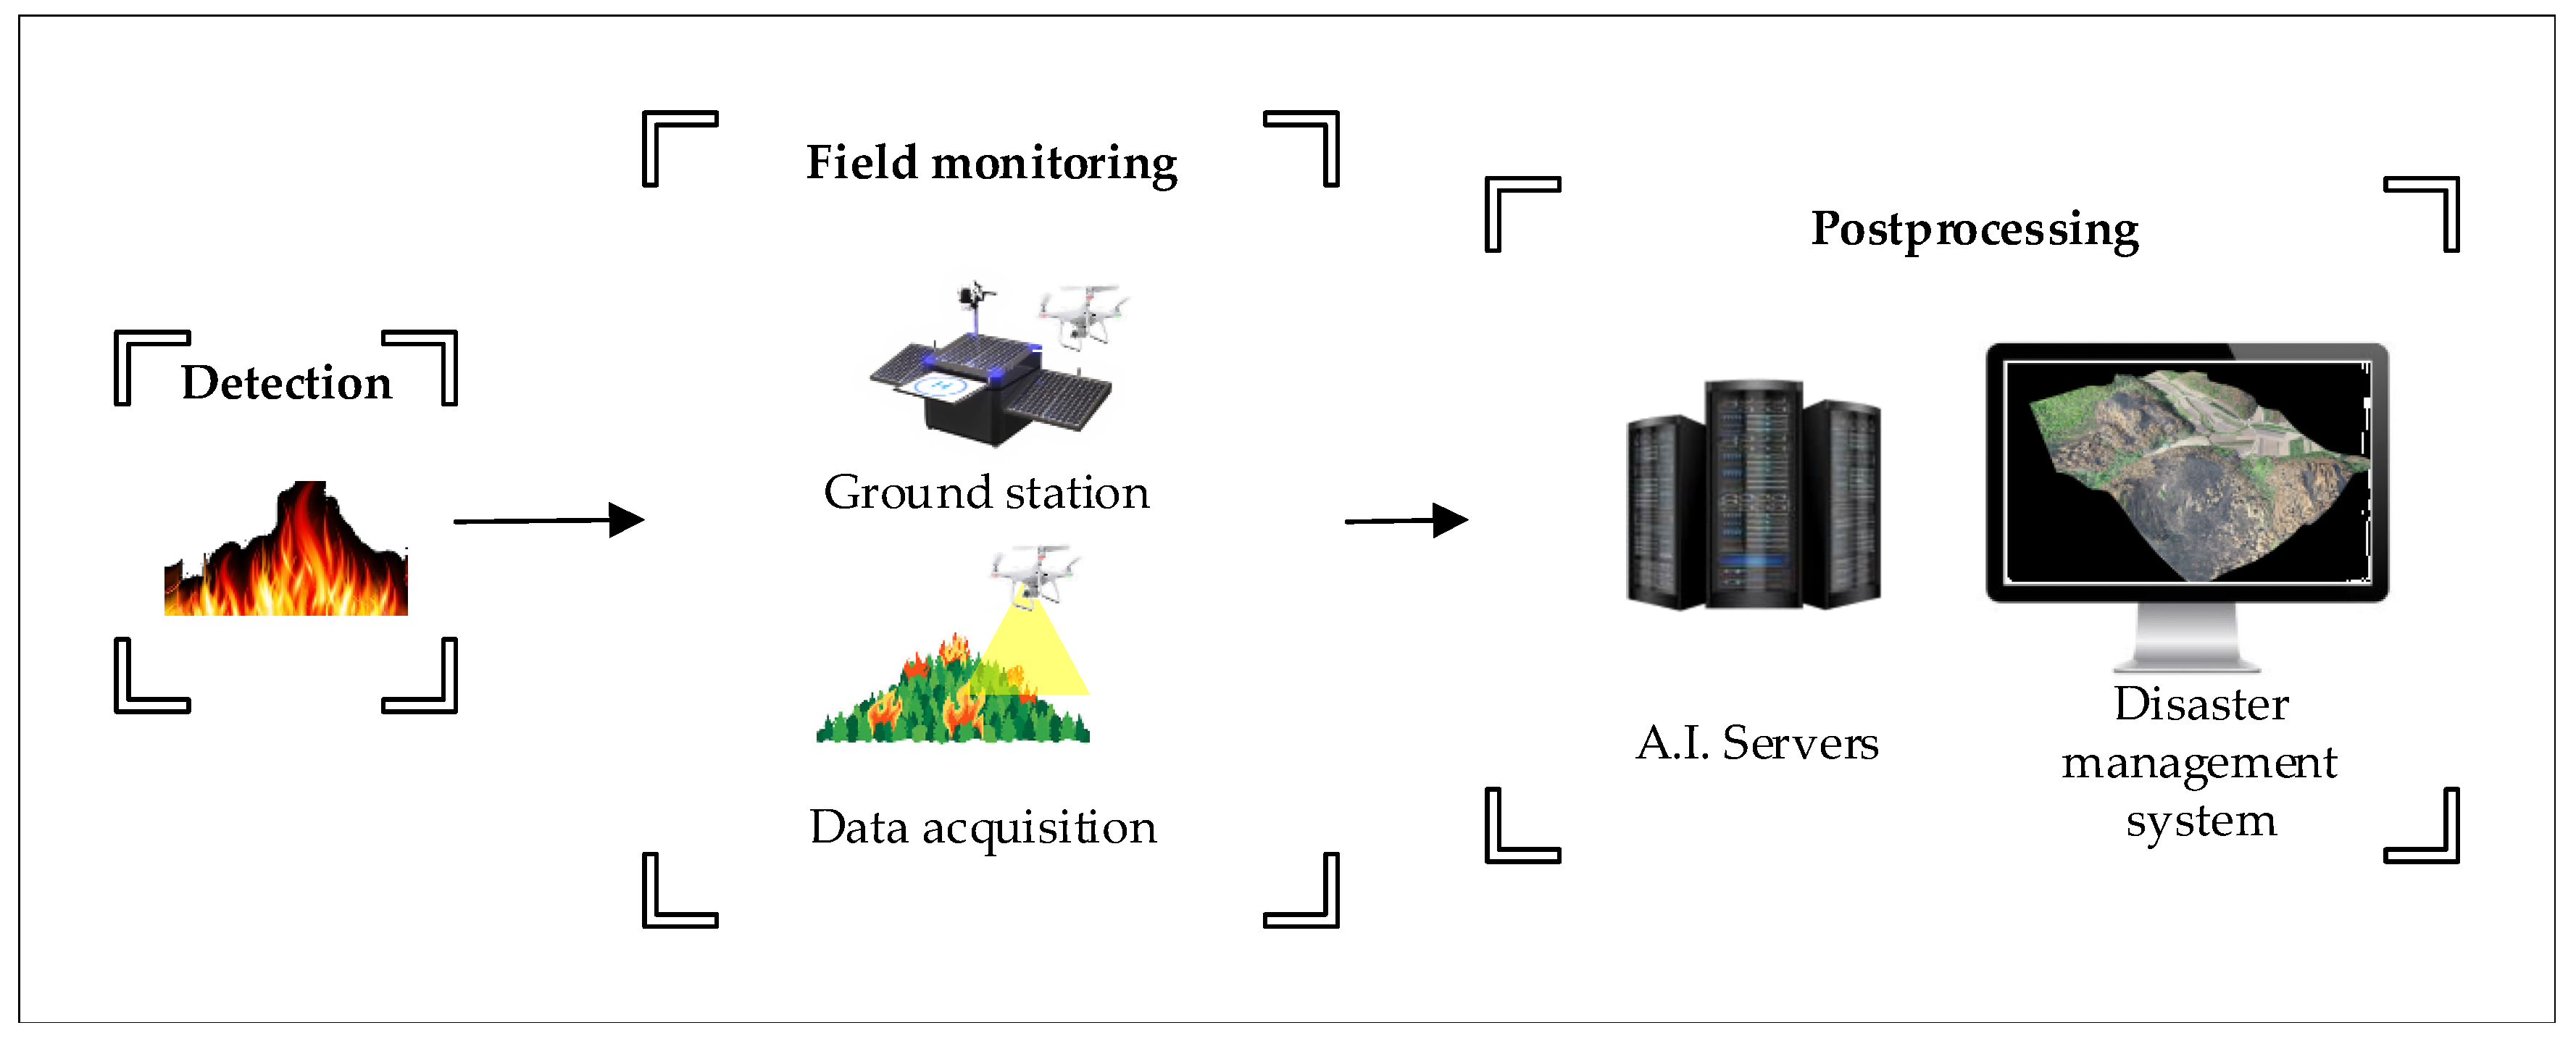
Several research studies have proposed solutions for post-forest-fire monitoring using different tools, e.g., satellite data [3,4,5,6] and unmanned aerial vehicle (UAV) images [7,8,9,10,11,12,13,14]. As is discussed in the research [15], UAVs have several promising features, e.g., efficiency and high-spatial/temporal resolution images, that make this data-acquisition system a promising system for remote sensing. Figure 1 presents the conceptual framework of a UAV-based forest-fire monitoring system. With the assistance of the ground station, and the advancement of big data and artificial intelligence (A.I.) technology, the data obtained from the UAV can almost be postprocessed in real time, giving it advantages as a monitoring system. The following literature review provides an overall picture of the latest postprocessing techniques and their limitations.
In [7], the authors proposed a method using the Landsat burn indicator with UAV calibration to forecast the percentage of green vegetation covered after the burn, as well as the percentage of the charred surface that was covered. However, because satellite images are dependent on the satellite-platform revision cycles or cloud-cover effects and projected shadows [16], the above approach has data-acquisition limitations. In [8], the authors showed the opportunities and challenges of monitoring large, heterogeneous burnt areas with UAV images. The authors inferred the scope for postfire monitoring in a drone survey. However, the method only collected the raw image data without segmenting the burnt region. Additionally, researchers [9,10,11] used multispectral UAV images to classify the forest-burn severity, including the burnt surface. These studies utilized supervised classifiers and a normalized difference-vegetation index (NDVI) thresholds to compute the results. However, for other test areas, the NDVI threshold must be generalized because of these process limitations. To obtain an automatic method for classifying the burn severity, the authors in [12] used a probability neural network with the four inputs (green, red, red-edge, and near-infrared (NIR)) and three output classes to address this classification problem. The proposed method stopped at the classification problem, but did not establish the entire segmentation process. Moreover, with four input variables, the approach found dealing with large areas and areas with mixed colors challenging. Undoubtedly, with the support of deep learning (DL)-based image-segmentation algorithms, image processing problems can be solved more and more precisely. Some researchers have suggested using DL algorithms for segmenting remotely sensed UAV images [17,18]. Drone images, machine learning, and DL algorithms were used by researchers [17] to map the main vegetation communities. The results demonstrated the high accuracy of the DL algorithms. In [18], they compared the efficiency of two DL-based image-segmentation algorithms, i.e., a fully convolutional neural network and SegNet, for classifying rice housing. However, this DL-based image-segmentation study ended with separate segmented drone images, without further postprocessing to merge these results together.
As mentioned previously, the existing methodology based on a satellite image and aerial image has its drawbacks, e.g., data collection takes a long time, it does not fully apply a method for segmentation, the damage indicator needs to be generalized for each particular test area. The UAV data acquisition system can capture large field data quickly and the results can be processed in real time, resulting in a better performance than other monitoring tools. While some DL-based image-segmentation algorithms are implemented using UAV images, few studies have included the end-to-end postprocessing of the UAV image needed for mapping segmented orthophotos. The integration of UAV images and DL-based image segmentation algorithms is now becoming an attractive research subject in the remote sensing field based on the superior performance of DL-based algorithms compared to conventional image processing algorithms in many applications. It can therefore become an effective tool for monitoring the area of damage following a forest fire. The contributions of this paper are as follows:
- An automated approach to postfire mapping, using DL algorithms and UAV images;
- A dual-segmentation network with high accuracy and precise information, compared to a single DL segmented image model.
This paper continues with a description of the study area in Section 2. The proposed approach is then presented with a detailed description of the dual image segmentation models in Section 3. Next, the output of the proposed method is validated in Section 4. Finally, the paper ends with a discussion and conclusion in Section 5.
2. Study Area
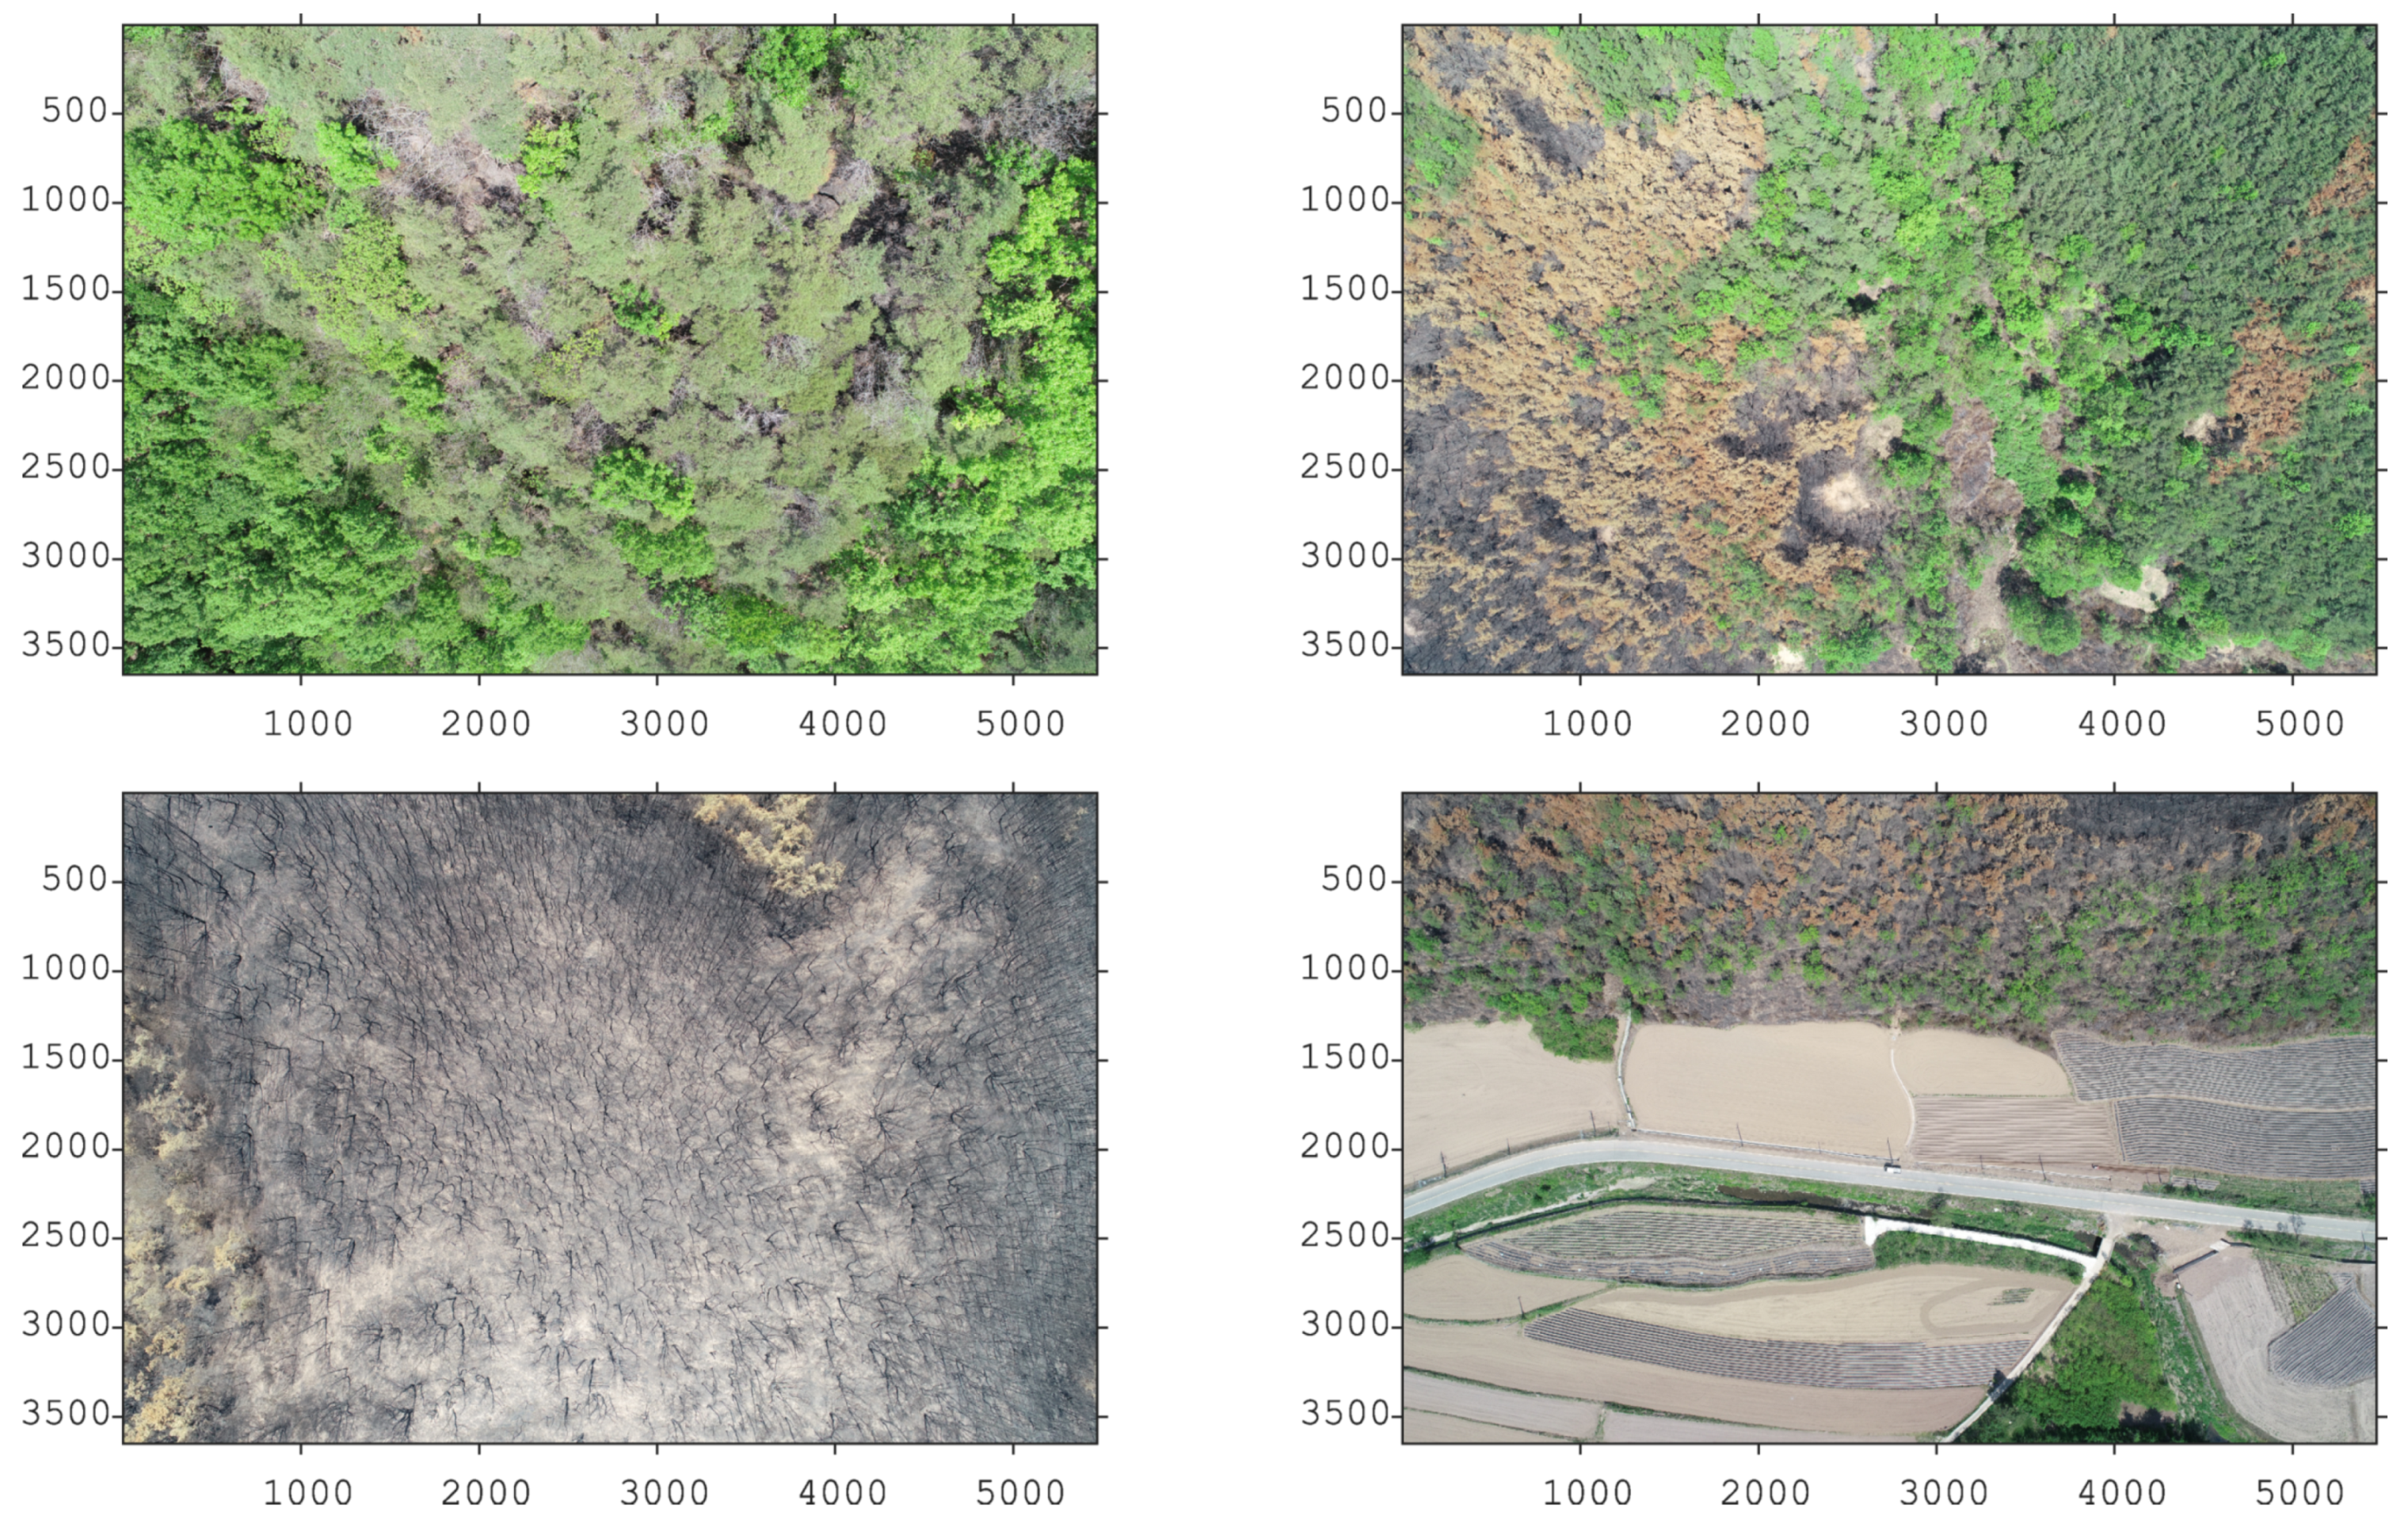
The data were collected from Andong, North Gyeongsang, the Republic of Korea, on 6 May 2020, two weeks after a forest fire. This fire burned nearly 800 hectares in 40 h. Figure 2a,b show the locations of Andong and the two examined areas. The orthophotos are shown in Figure 2c,d.
The Phantom 4 Pro V2.0 UAV was used to collect images with a filming height of 150 m. It collected 43 and 44 images of locations 1 and 2, respectively; each image was 5473 × 3648 × 3 pixels. The GPS coordinates are stored as “metadata” embedded in the picture files themselves. This information, along with the image, can be used to build orthophotos using UAV postprocessing commercial software. In this research, the orthophotos were made using the DroneDeploy platform [19].
As discussed in the previous section, if the large, high-resolution images shown in Figure 3 were resized and directly used as input for the segmentation model, the model would have difficulty identifying a small area with burnt pixels. Therefore, the proposed dual-segmentation DL models are presented to resolve these issues.
3. Proposed Approach
This section explains our proposed approach. First, the UNet and UNet++ image-segmentation algorithms are briefly presented in Section 3.1. The loss functions and evaluation metrics are defined in Section 3.2. Finally, the two patch-level networks for image segmentation are proposed in Section 3.3.
3.1. Unet and Unet++ for Image Segmentation
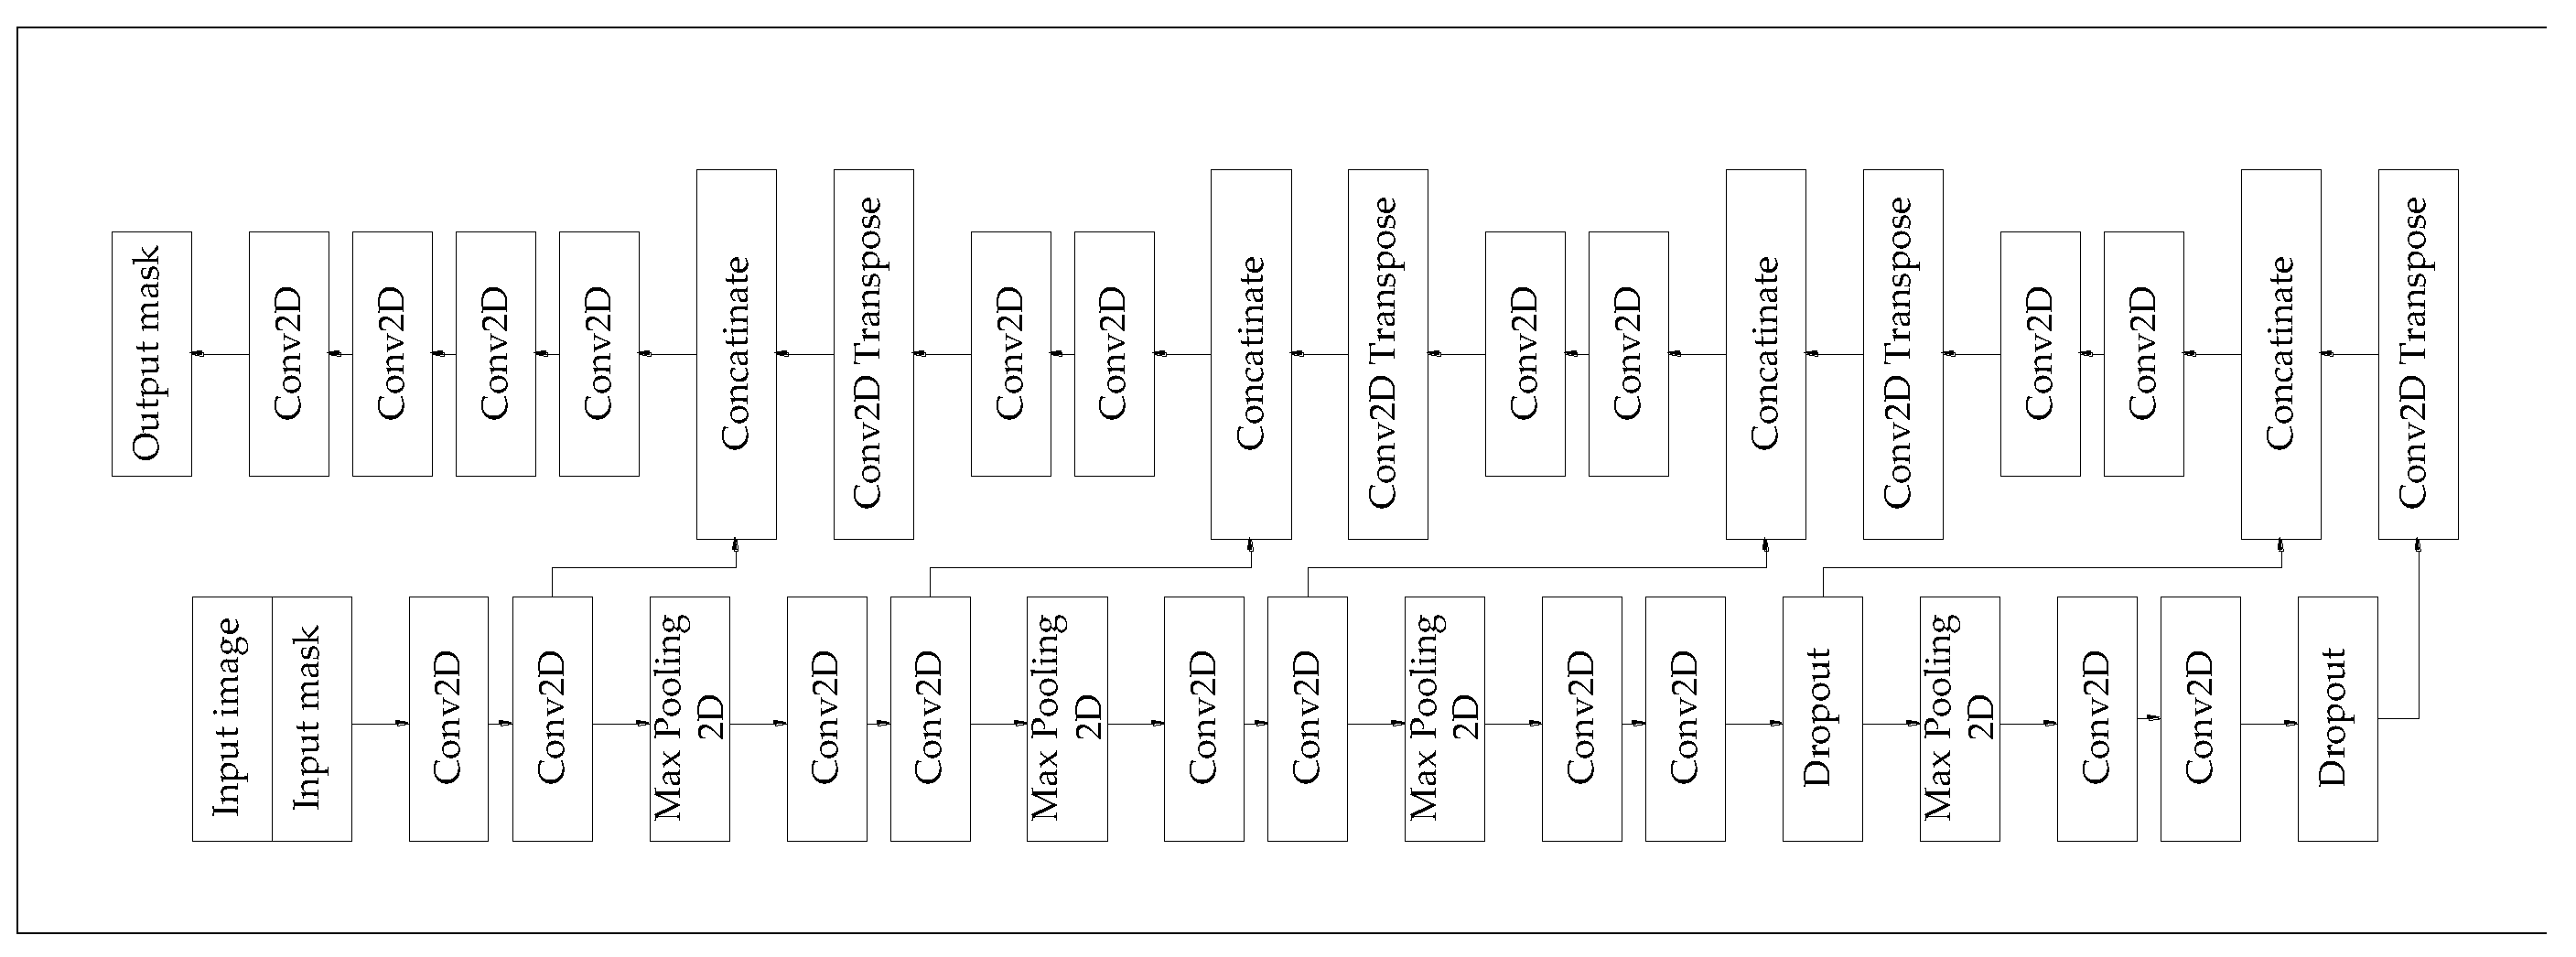
Introduced by [20], UNet was an effective tool for the image-segmentation problem. As shown in Figure 4, UNet uses a skip-connection technique. With this technique, UNet recovers the full spatial resolution of the output mask. In addition, inspired by this concept, a number of research studies have created enhanced versions of UNet: one of them is called UNet++ [21]. This model contains encoders and decoders that are linked via a series of nested, dense, convolutional blocks. In addition, UNet++ attempts to close the semantic gap between the encoder and decoder features prior to fusion. This improved version has been shown to have an effective performance in the image-segmentation problem [22].
However, dealing with high-resolution images remains a challenge. Some researchers have proposed dual-image-segmentation networks to deal with large images [23,24]. In these studies, the authors suggested local–global networks to split the training phase into two steps. Step one trains with full-size images and step two trains with patch-level images; then they are combined for a final estimate. The results showed a reasonable performance as compared to a single model. Inspired by this dual-model research, this study proposes two patch-level networks to deal with drone image processing.
3.2. Loss Functions and Evaluation Metrics
3.2.1. Loss Functions
With supervised learning, the basic idea is to create a model that is best suited to the training and validation sets. This is achieved by solving the optimization problem; hence, the objective function or loss function plays a vital role. To address the imbalance in the dataset, the focal loss (FL) [25] is utilized to examine the performance along with the common binary cross entropy (BCE) loss. Equations (1) and (2) define BCE and FL, respectively.
where p is the ground truth and is the predicted result. In Equation (2), and are the parameters of the FL. Detailed explanations for these parameters can be found in [25]. The specific values are then displayed in our public source code below.
3.2.2. Evaluation Metrics
The accuracy of a pixel in the image-segmentation area is not guaranteed by the accuracy of the region of interest. In other words, other measurement metrics must be used to evaluate the efficiency of image-segmentation algorithms. The most common metrics are the dice coefficient, sensitivity, and specificity.
The dice coefficient measures the overlap between the ground truth and predictions. The sensitivity shows the percentage of pixels in the interest area that are correctly segmented. The specificity provides the percentage of true negative values.
where TP is true positive, TN is true negative, FP is false positive, and FN is false negative. Overall, our main aim is to build a model with as high a dice coefficient as possible.
3.3. Proposed Approach
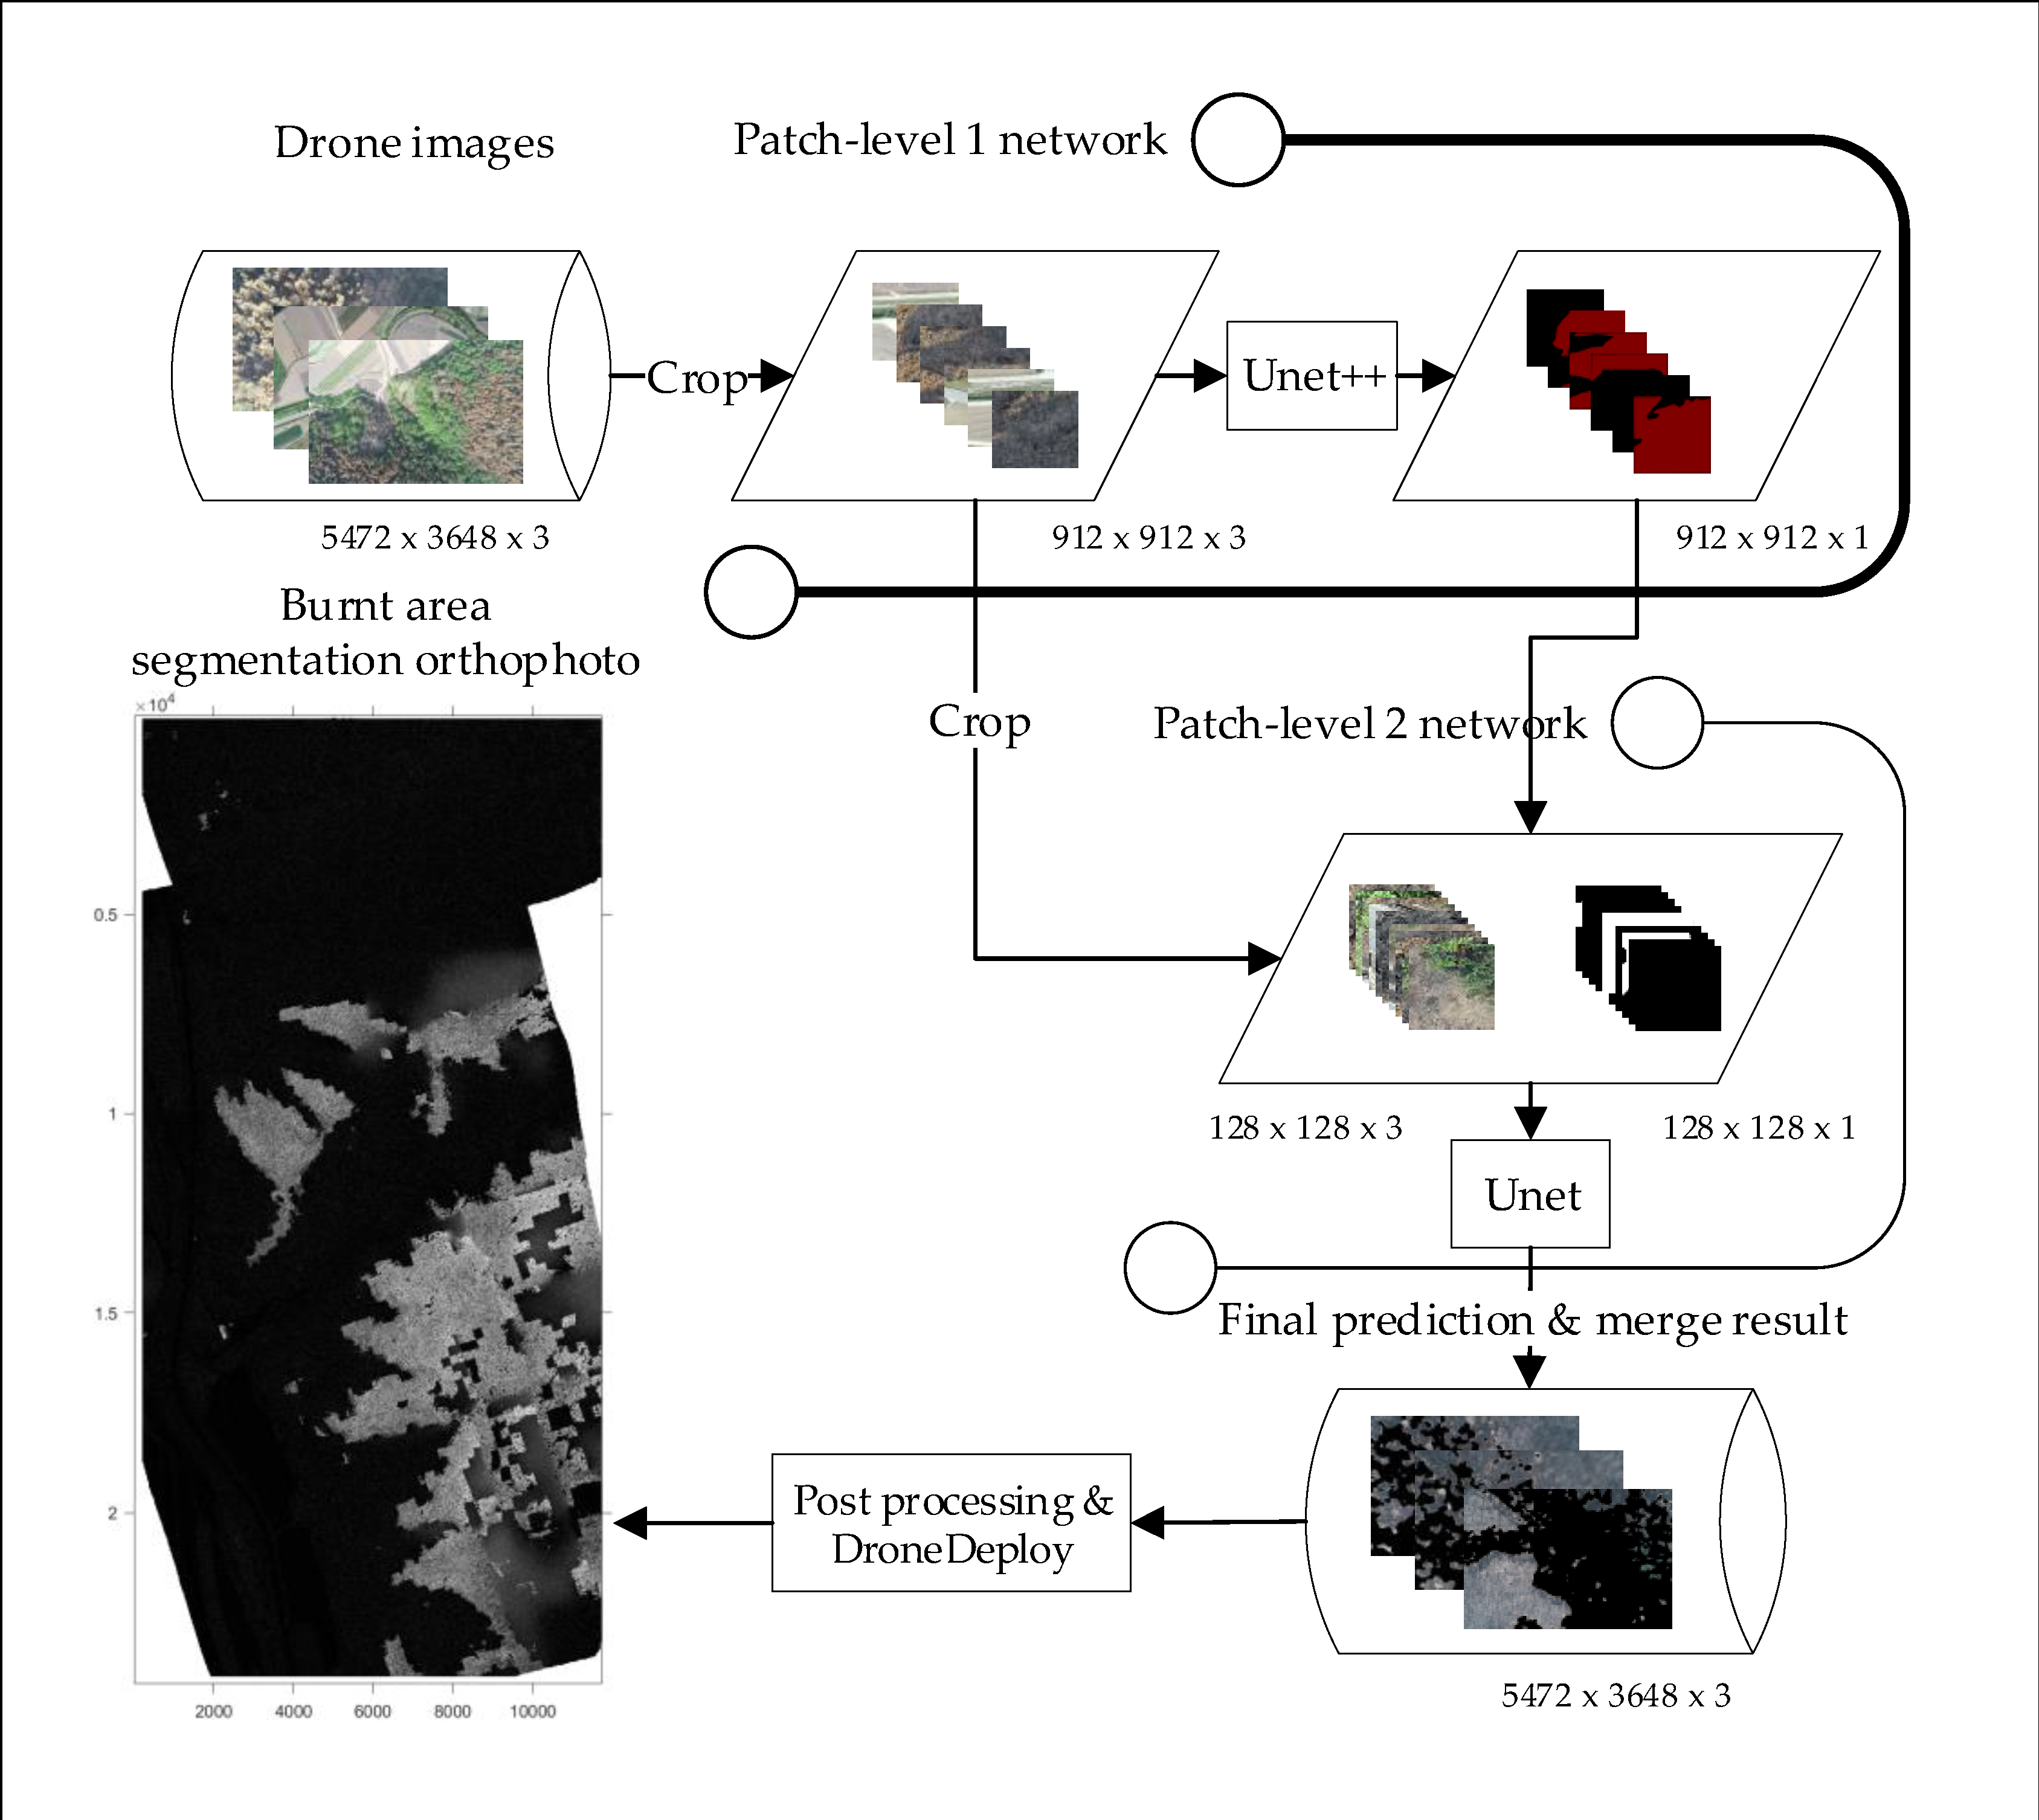
As can be seen from Figure 5, the proposed approach involves the following steps:
- First, the images are collected using a drone. Then, they are cropped to 912 × 912 × 3 pixels and labeled using the Labelme image-annotation tool [26]. UNet++ is used for the patch-level 1 network;
- The patch-level 2 network is used as a model for refining. This model is based on the network 1 prediction results. It repredicts the area containing only burnt pixels on the patch-level input images of 128×128×3 pixels. The result of this model is considered to be the final prediction;
- Finally, the final prediction mask is resized, converted to RGB, copied onto the original information, and uploaded to the DroneDeploy platform for orthophoto generation and further processing.
4. Validation Results
Comparative studies were conducted to validate the performance of the proposed method. The image was reprocessed by normalizing the value and augmenting the data with rotation, zoom, and shift operators to prevent over-fitting. In addition, using the model checkpoint method, the model was monitored by the validation dice coefficient, from which the best model with the highest dice coefficient was saved as a pretrained model. The DL models were implemented using the Tensorflow machine learning platform [27], ran on CentOS Linux 8, with an NVIDIA Tesla V100 graphics processing unit with 32 GB.
As shown in Table 1, at patch-level 1 the image is 912 × 912 × 3 pixels, and at level 2, 128 × 128 × 3 pixels. As stated in the previous section, after collecting the image from the studied region, the image is then cropped to 912 × 912 × 3 and carefully labeled using Labelme. The labeling process is based on the cropped image and field observation. As a result, the labelled image is considered to be the ground truth for further processing. With the proposed method, after the level 1 network, only predicted results with at least one pixel of the burnt area are used for training. Therefore, at level 2, the model only focuses on the areas that are confused and need refinement. The patch level 2 image size was chosen on the basis of our comparative studies, in which both smaller and larger patch size experiments were conducted. As a result, the patch level 2 image with a size of 128 × 128 × 3 showed better training and validation performance. The Adam was used by both patch-level 1 and 2 as an optimizer with the learning rate of 0.0001 for training the DL algorithm configuration. The epoch number was 30 and the batch size was 1. The detailed step-by-step implementation of this proposed approach can be found at https://github.com/daitranskku/forest-fire-damage-mapping.
First, UNet++ and UNet were trained on location 1 with the patch-level 1 and patch-level 2 images, respectively. These two models were compared with the proposed method. As shown in Table 2, and as discussed in Section 3.2, the dice coefficient was our main concern. The proposed method shows its effectiveness in all aspects, including sensitivity and specificity. The process was then repeated using location 2 for the training and location 1 for the testing (Table 3).
Additionally, the effectiveness of the loss function should be considered. To prove the robustness of the proposed method, we changed the training and test sets. In Table 4, location 1 was used as the training set and location 2 as the test set. The results show that, using the FL in network 1 and the BCE loss in network 2, the performance of this combination improved and outperformed the other combinations. The above conclusion still applies, as shown in Table 5, when location 1 was used as the test set and location 2 was used for the training models.
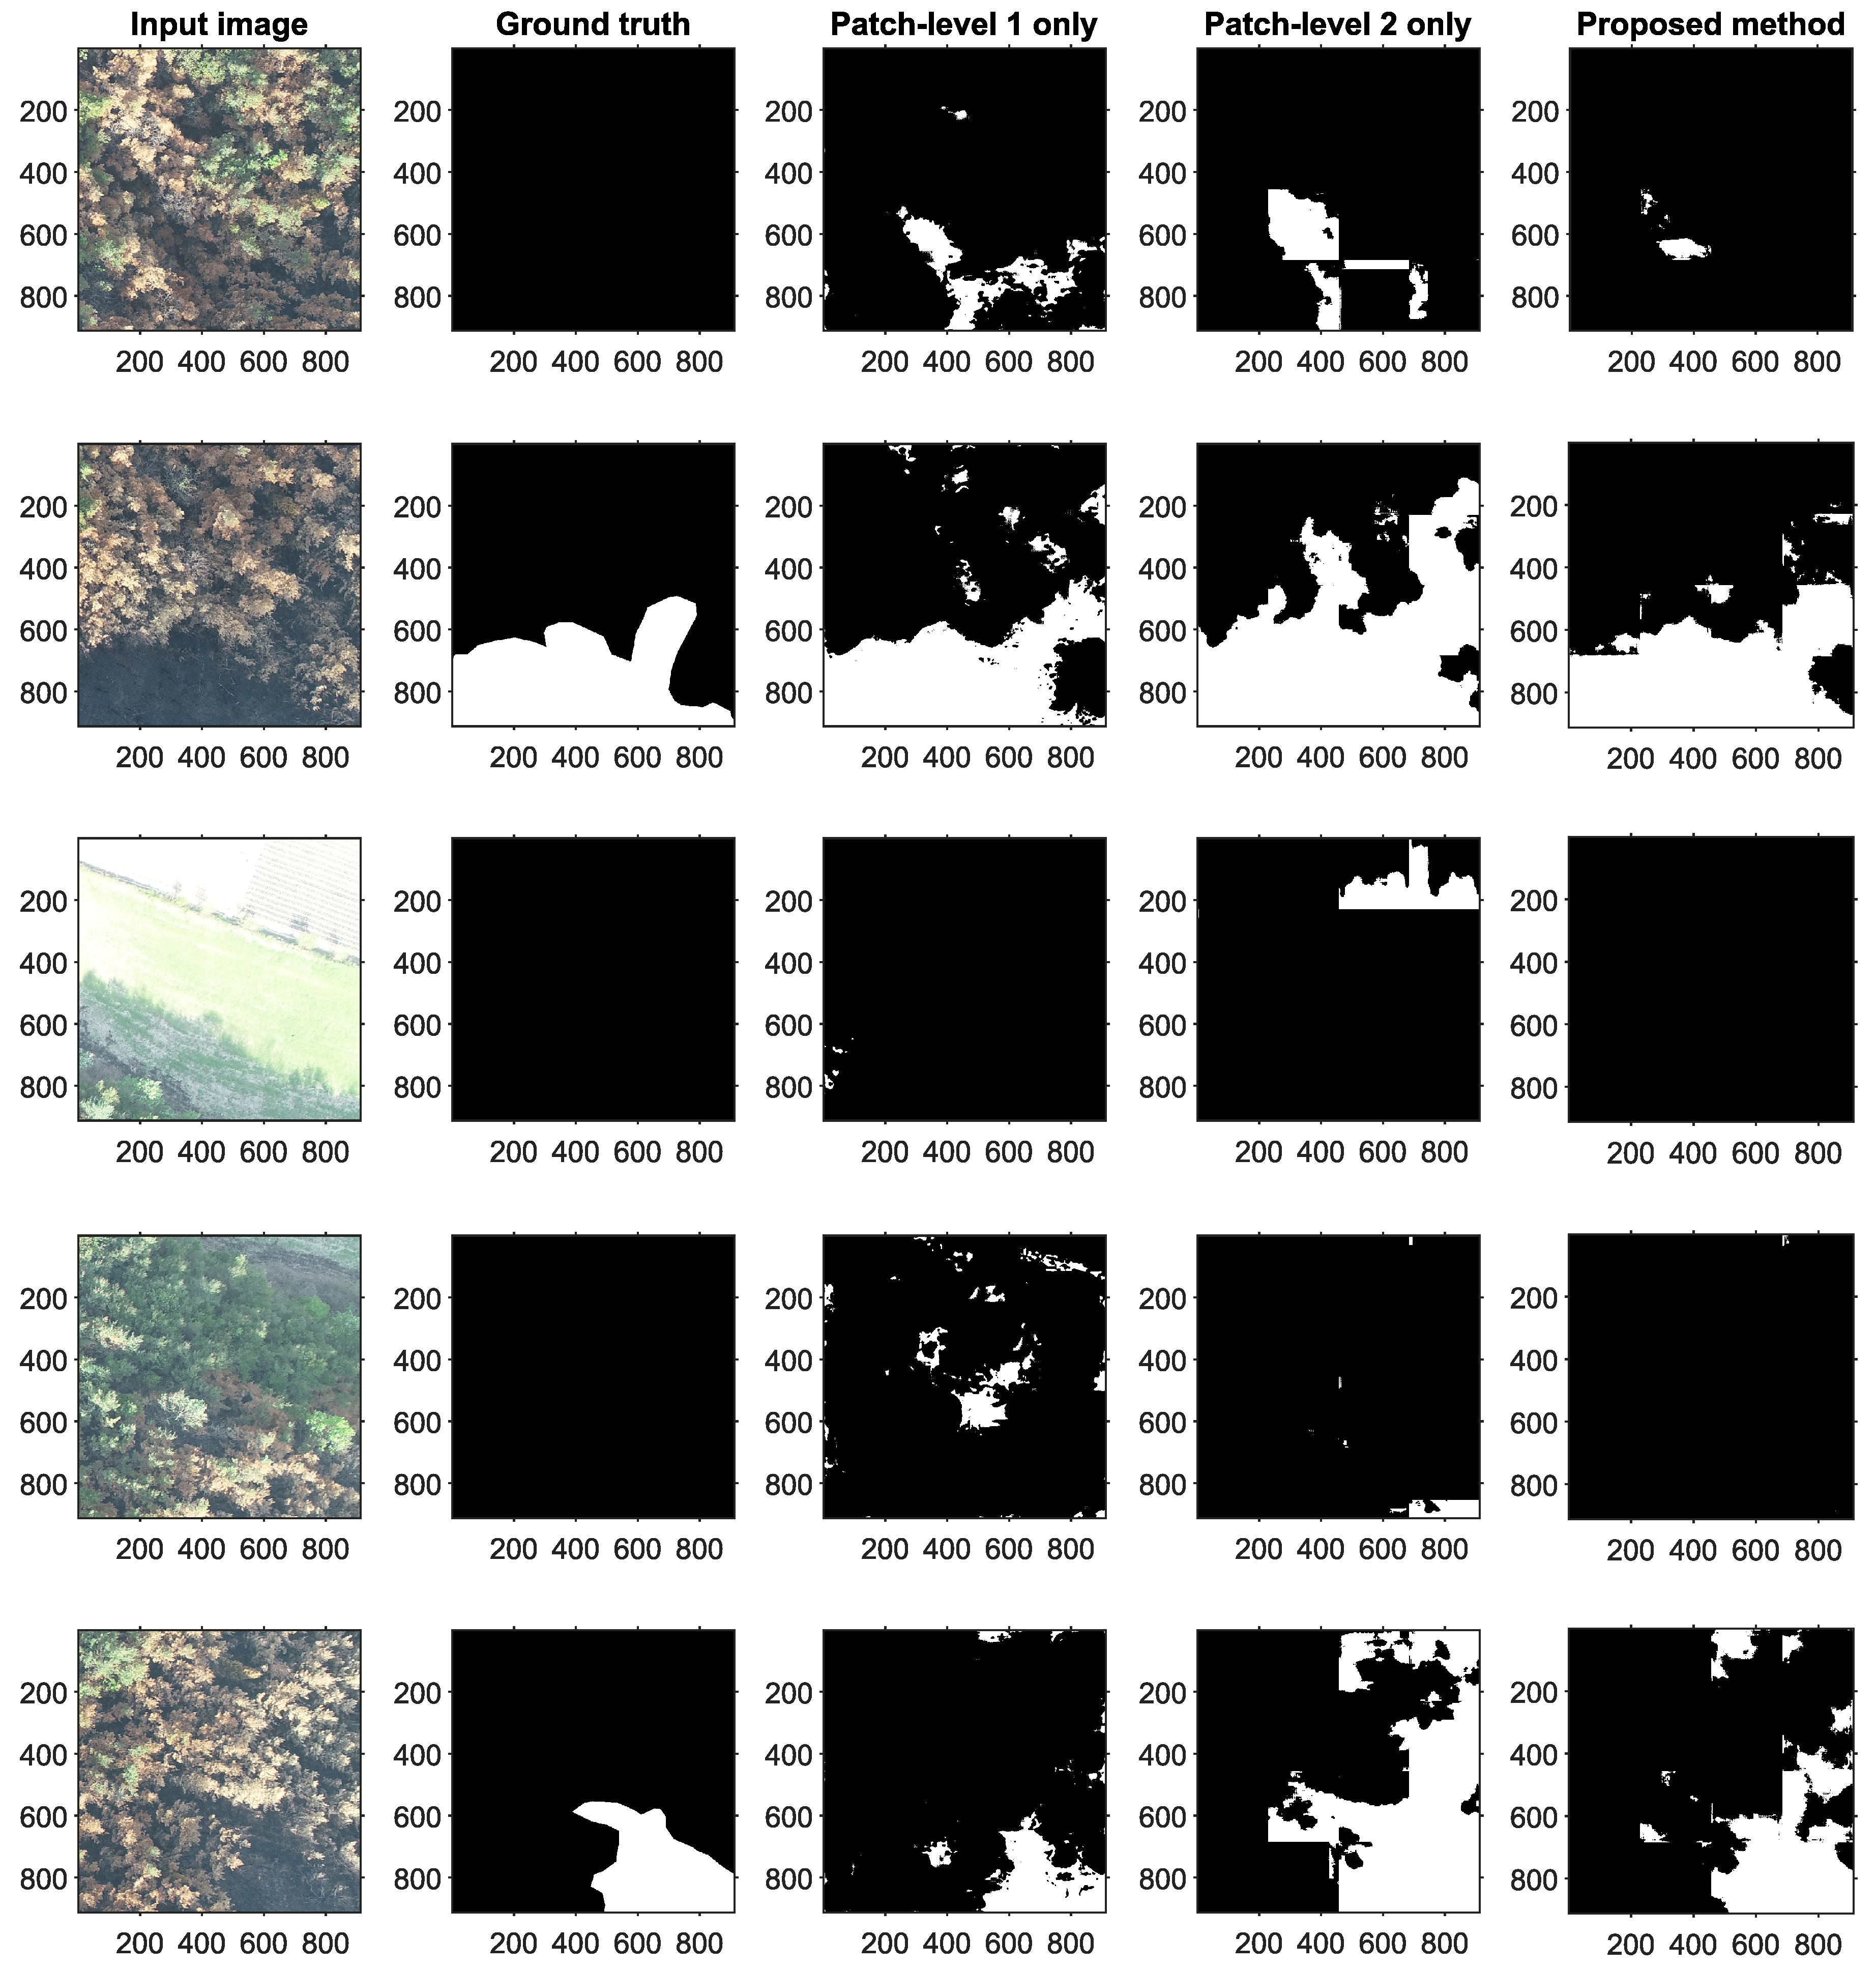
Figure 6 visualizes the prediction results on patch-level 1 for the different models. It should be noted that, despite the fact that all of the models worked well with images containing burnt and green areas (trees), the images with road or farm areas were challenging. In the case of supervised learning in particular, the model was learned on the basis of the dataset given and tried to match the parameters. In addition, from the image structure of the road and farm area viewpoint, these images have a similar structure to certain burnt areas in terms of the edges or colors. From this similarity, a model trained with a small dataset can be presented with a prediction challenge. However, if this large and complex image is cropped and carefully tuned to the DL-based image segmentation model, the final model can overcome this problem. This is one of the reasons we proposed our dual-model approach. With the aid of the patch-level 2 model, the proposed method can refine the results from the first model and solidify the prediction with a better performance.
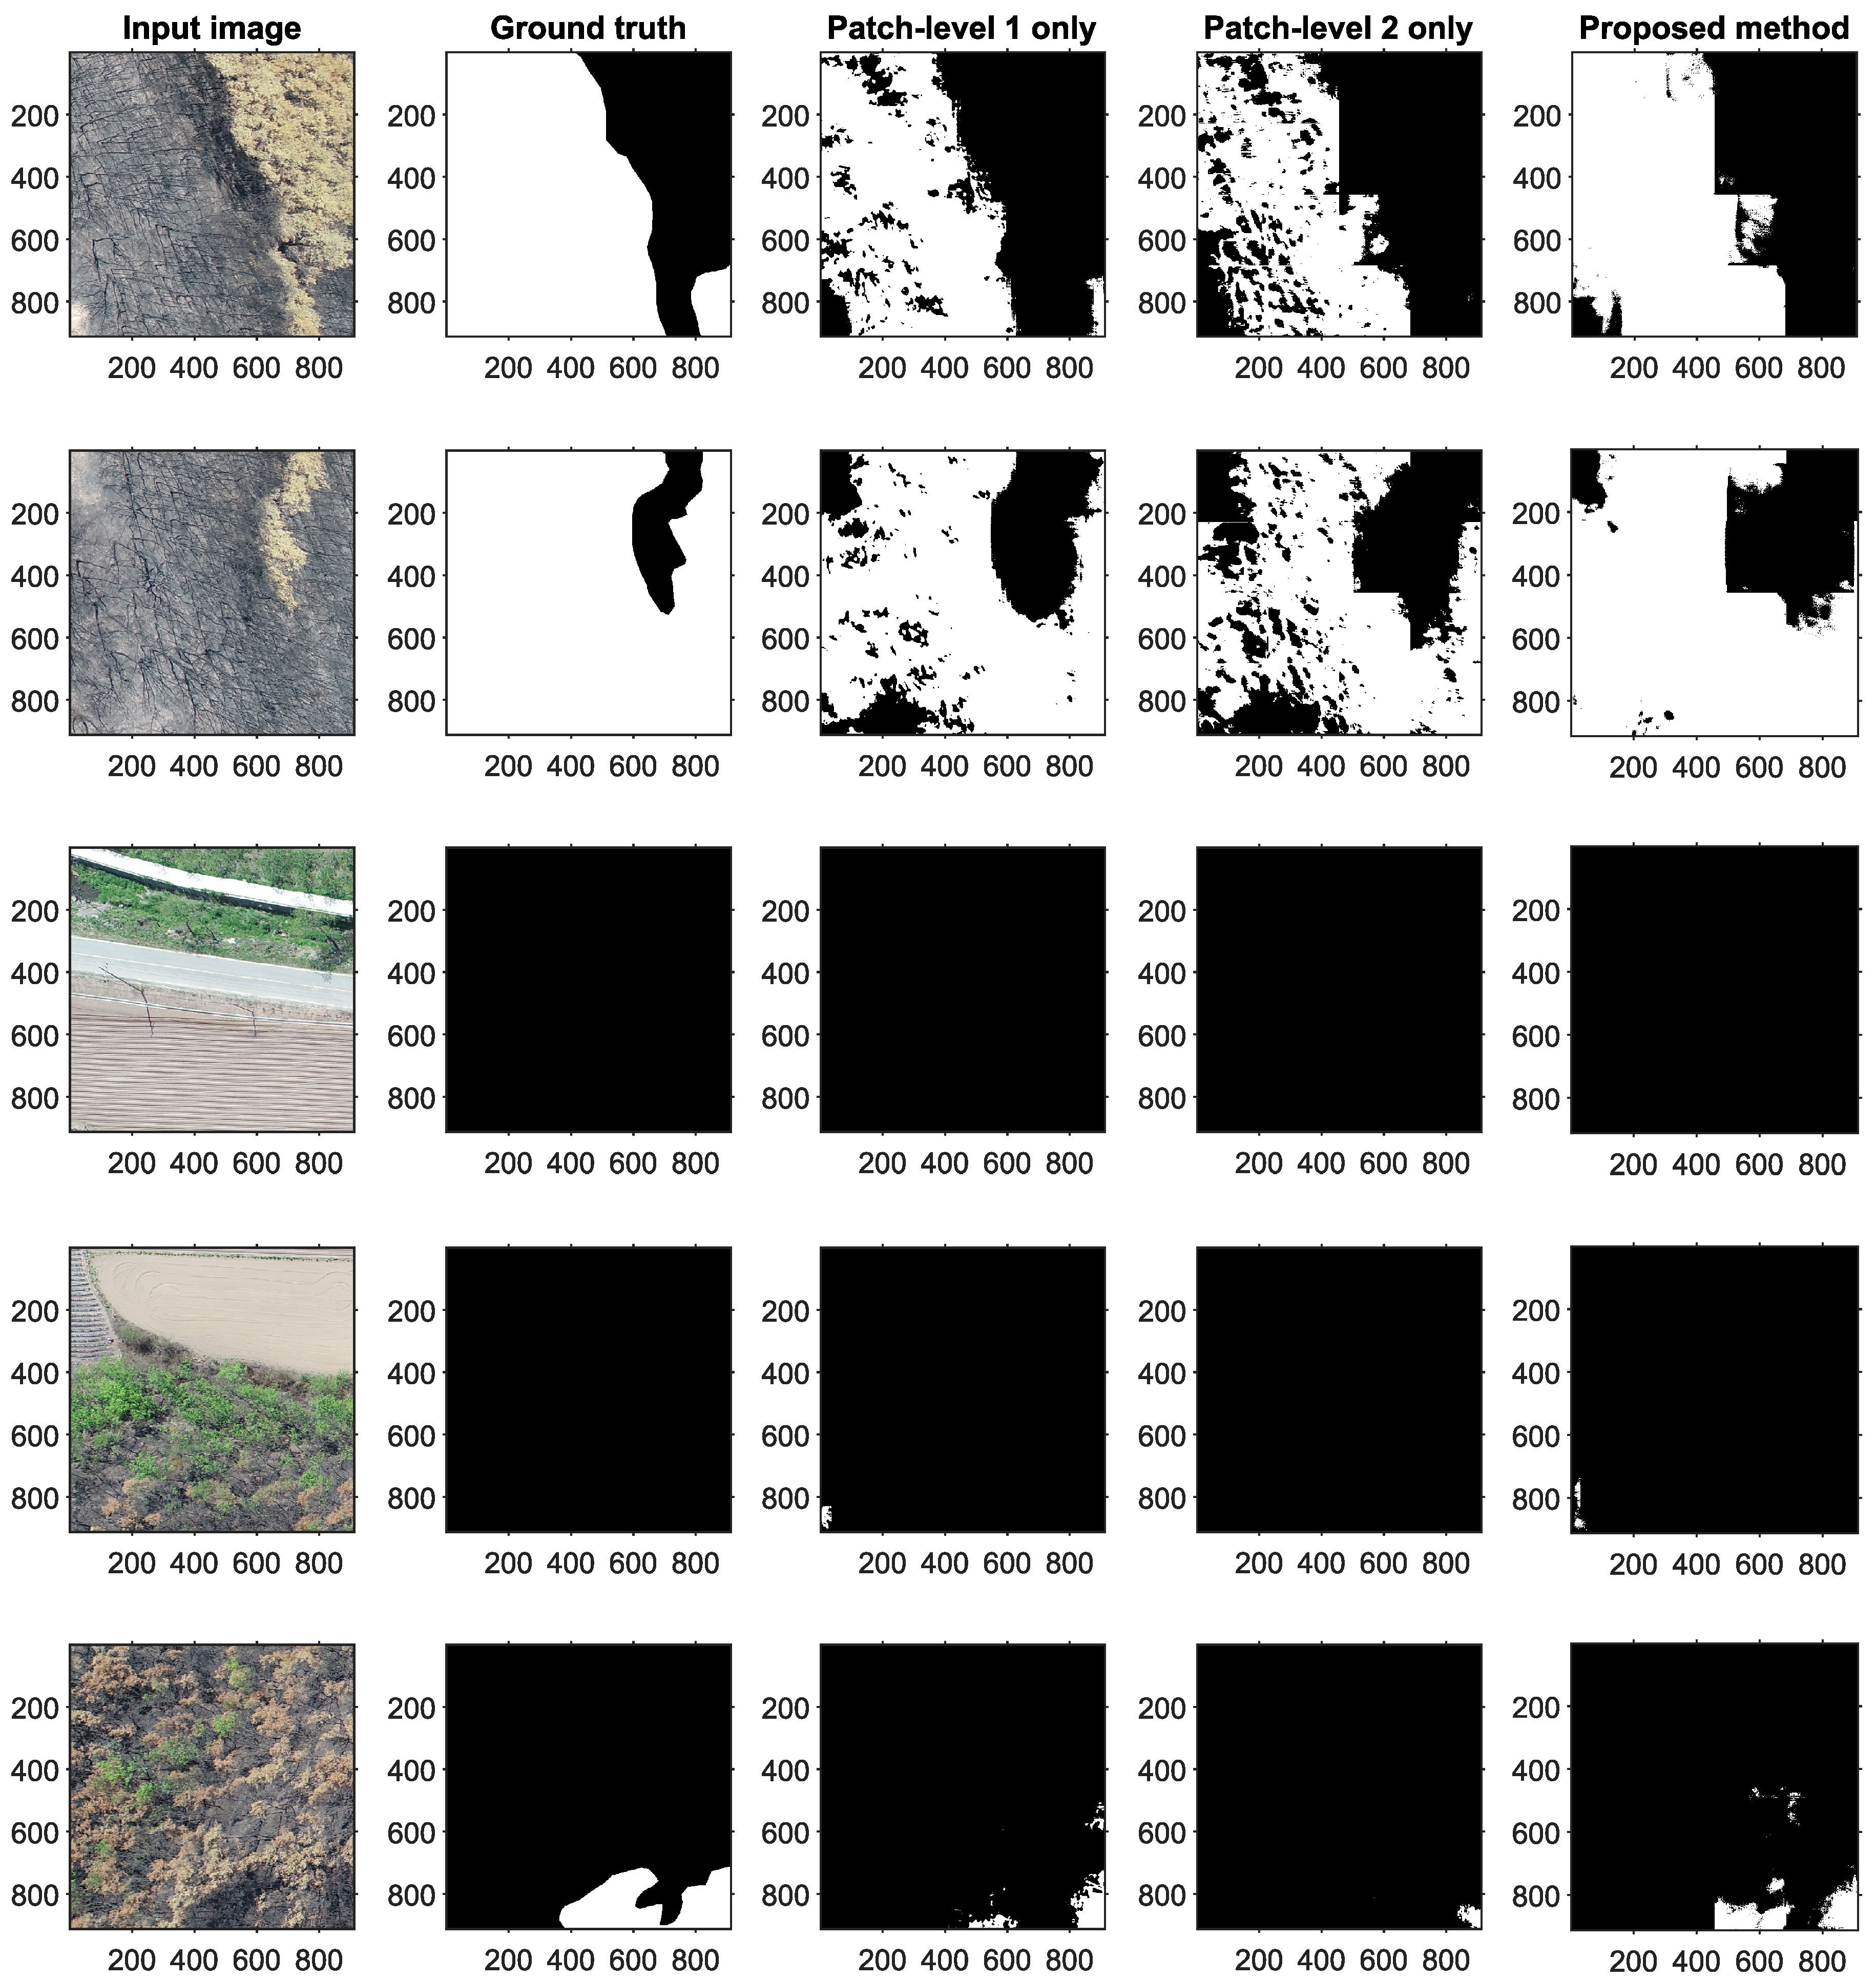
Similarly, Figure 7 illustrates the effectiveness of the proposed method, even when changing the training and testing locations.
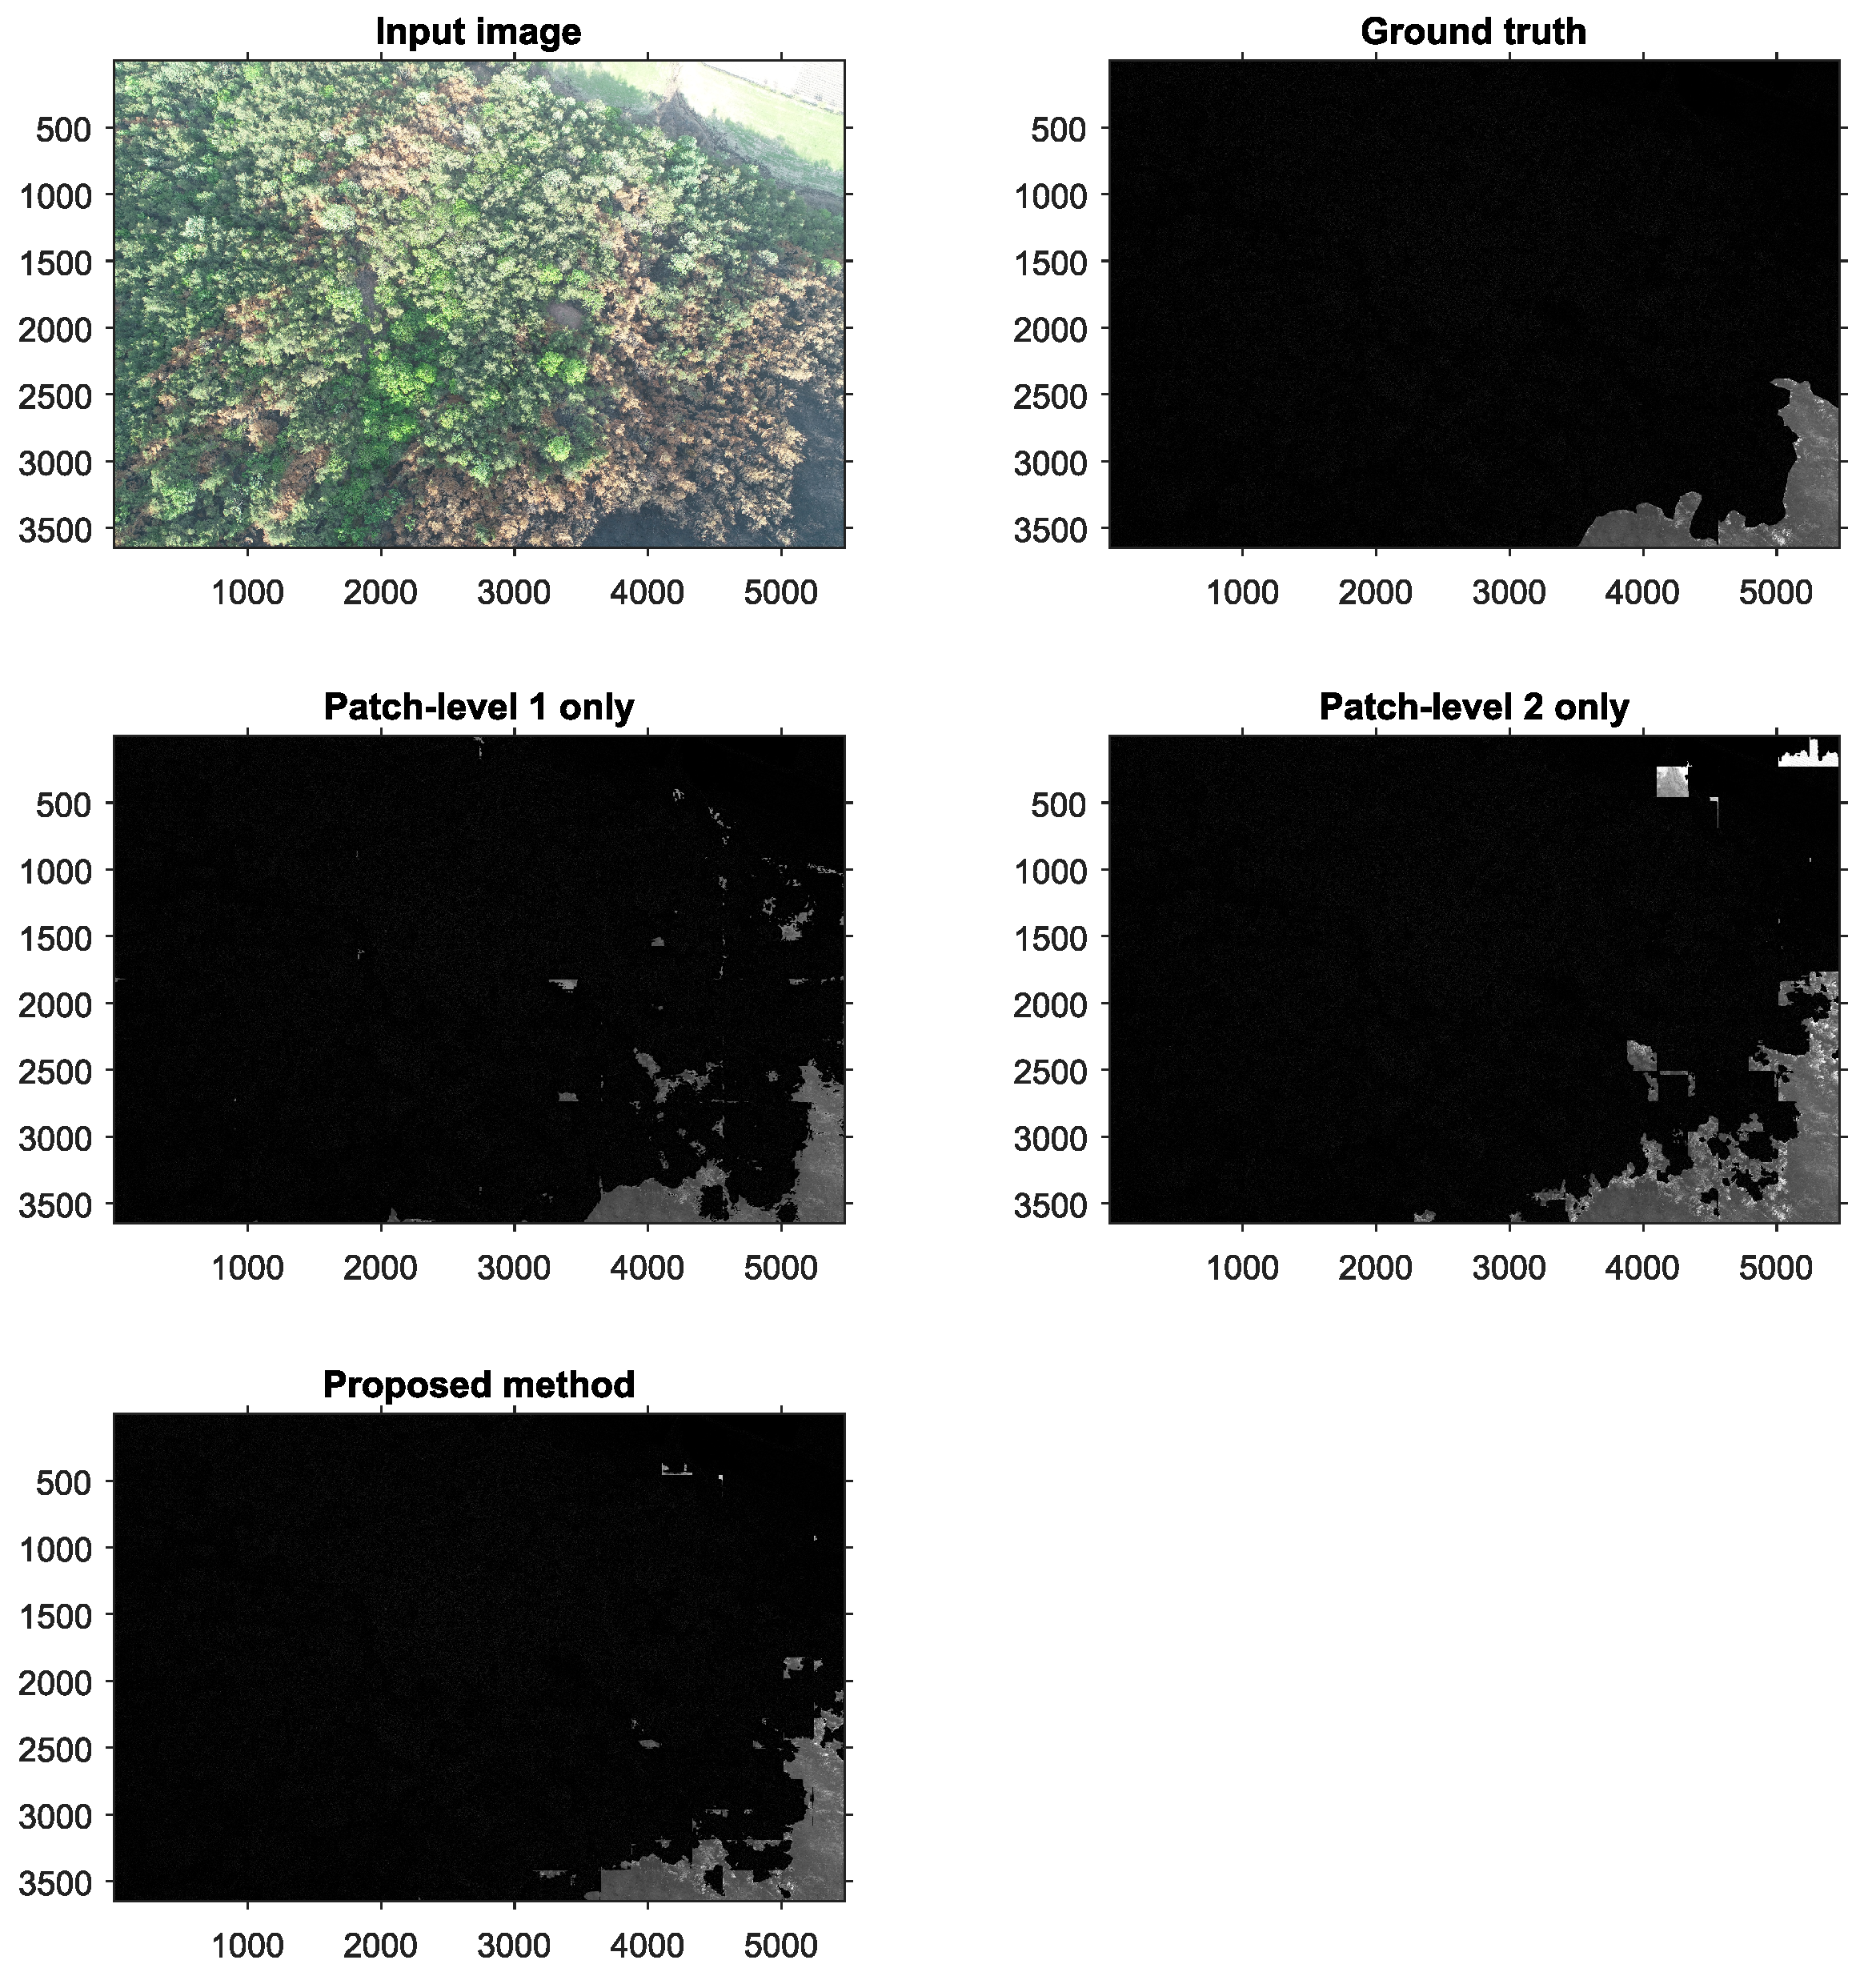
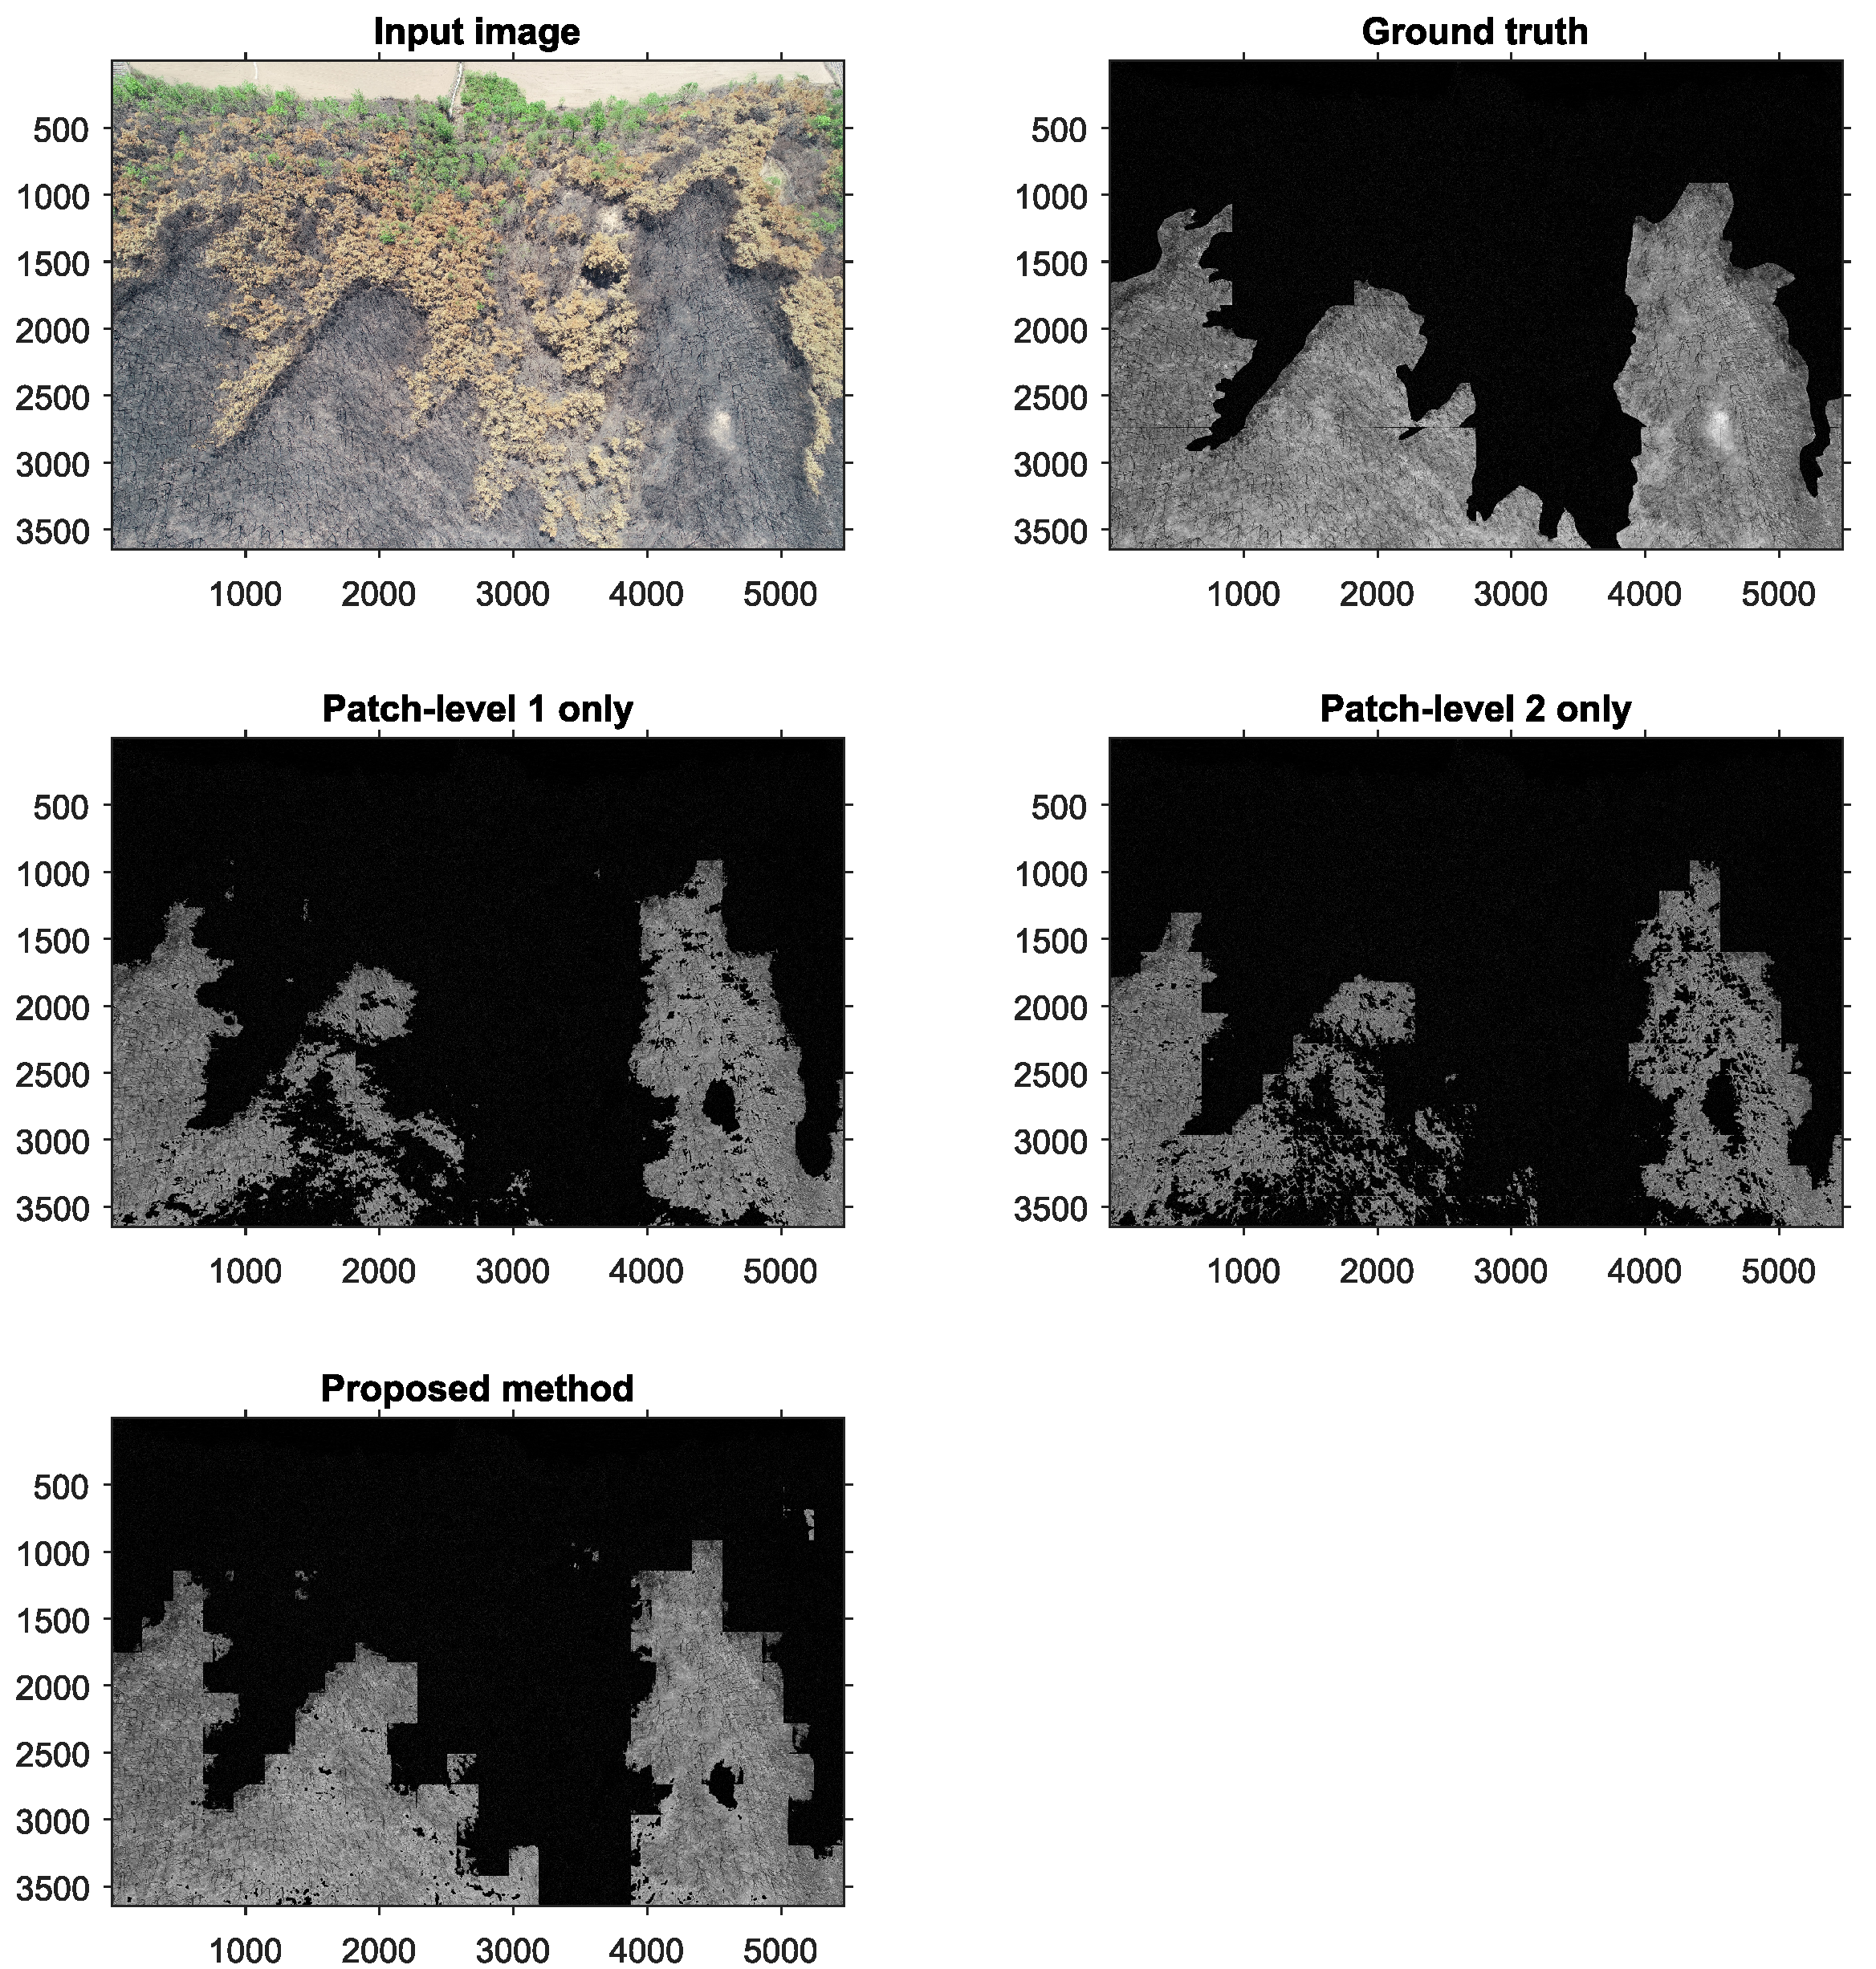
As concluded in the patch-level 1 results, the image containing road or farm areas was a challenging one. By predicting and merging these patch images, we obtained the original images, as shown in Figure 8 and Figure 9. Clearly, the burnt area could be extracted well by the proposed method.
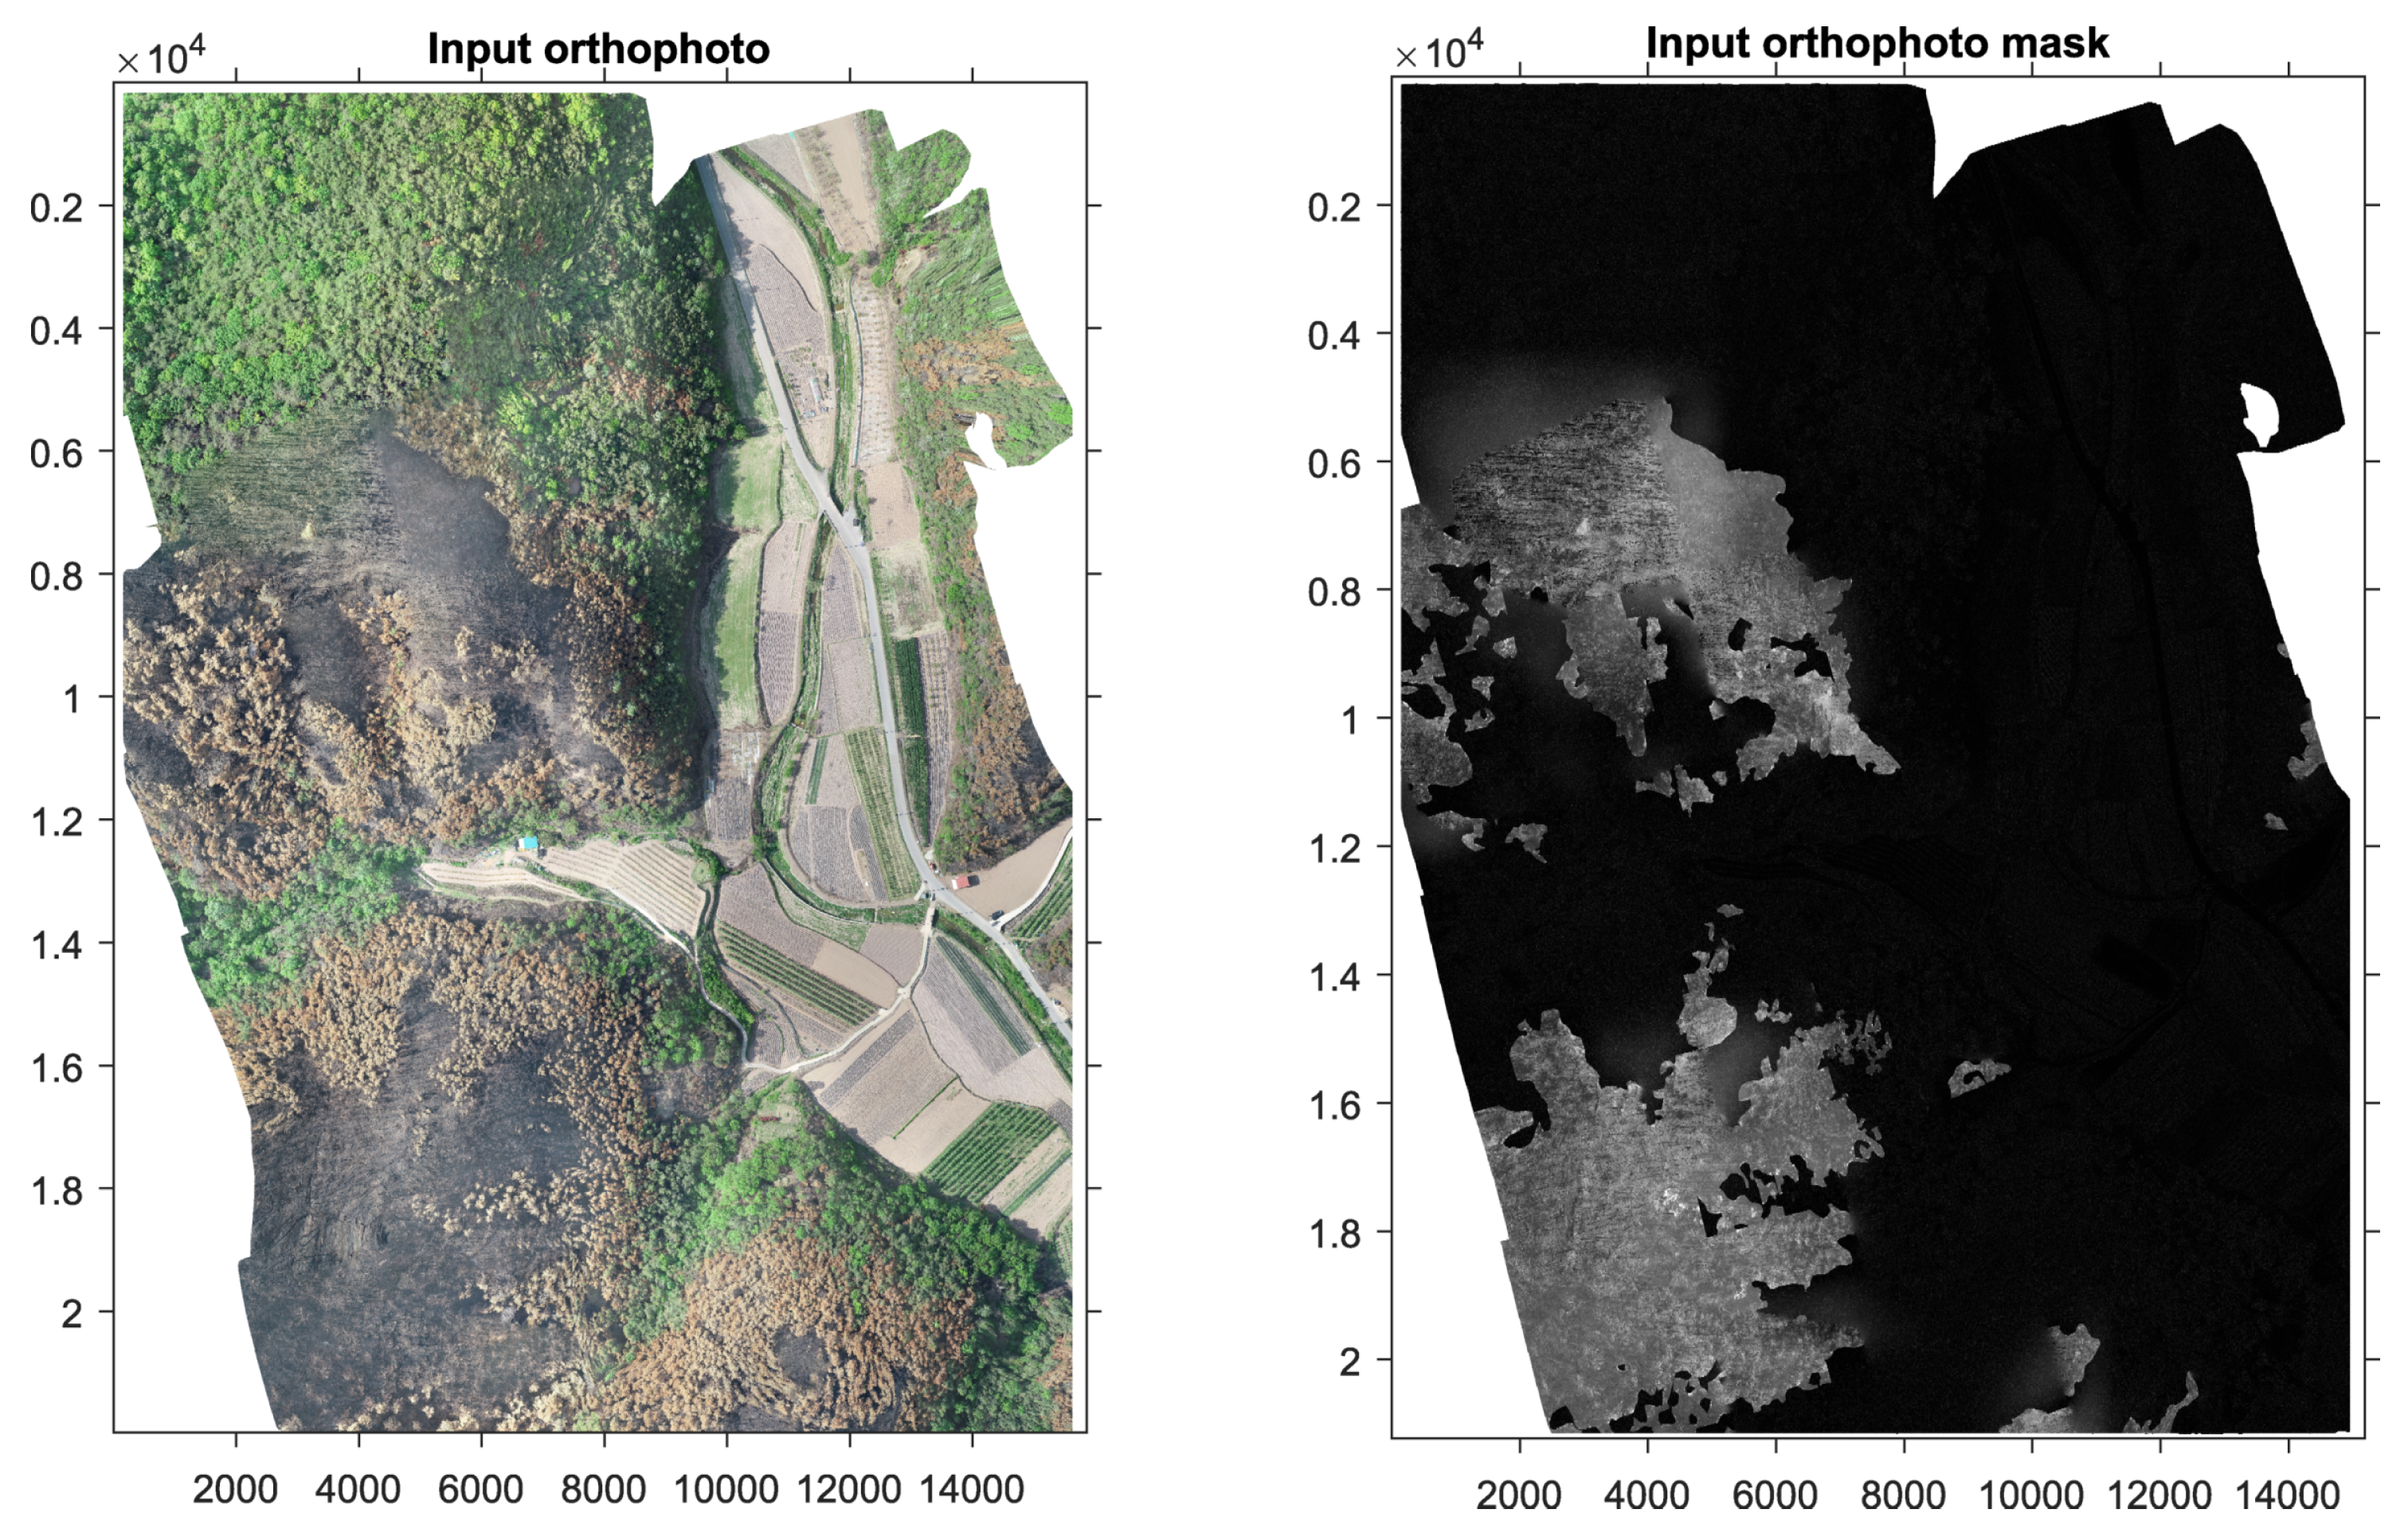
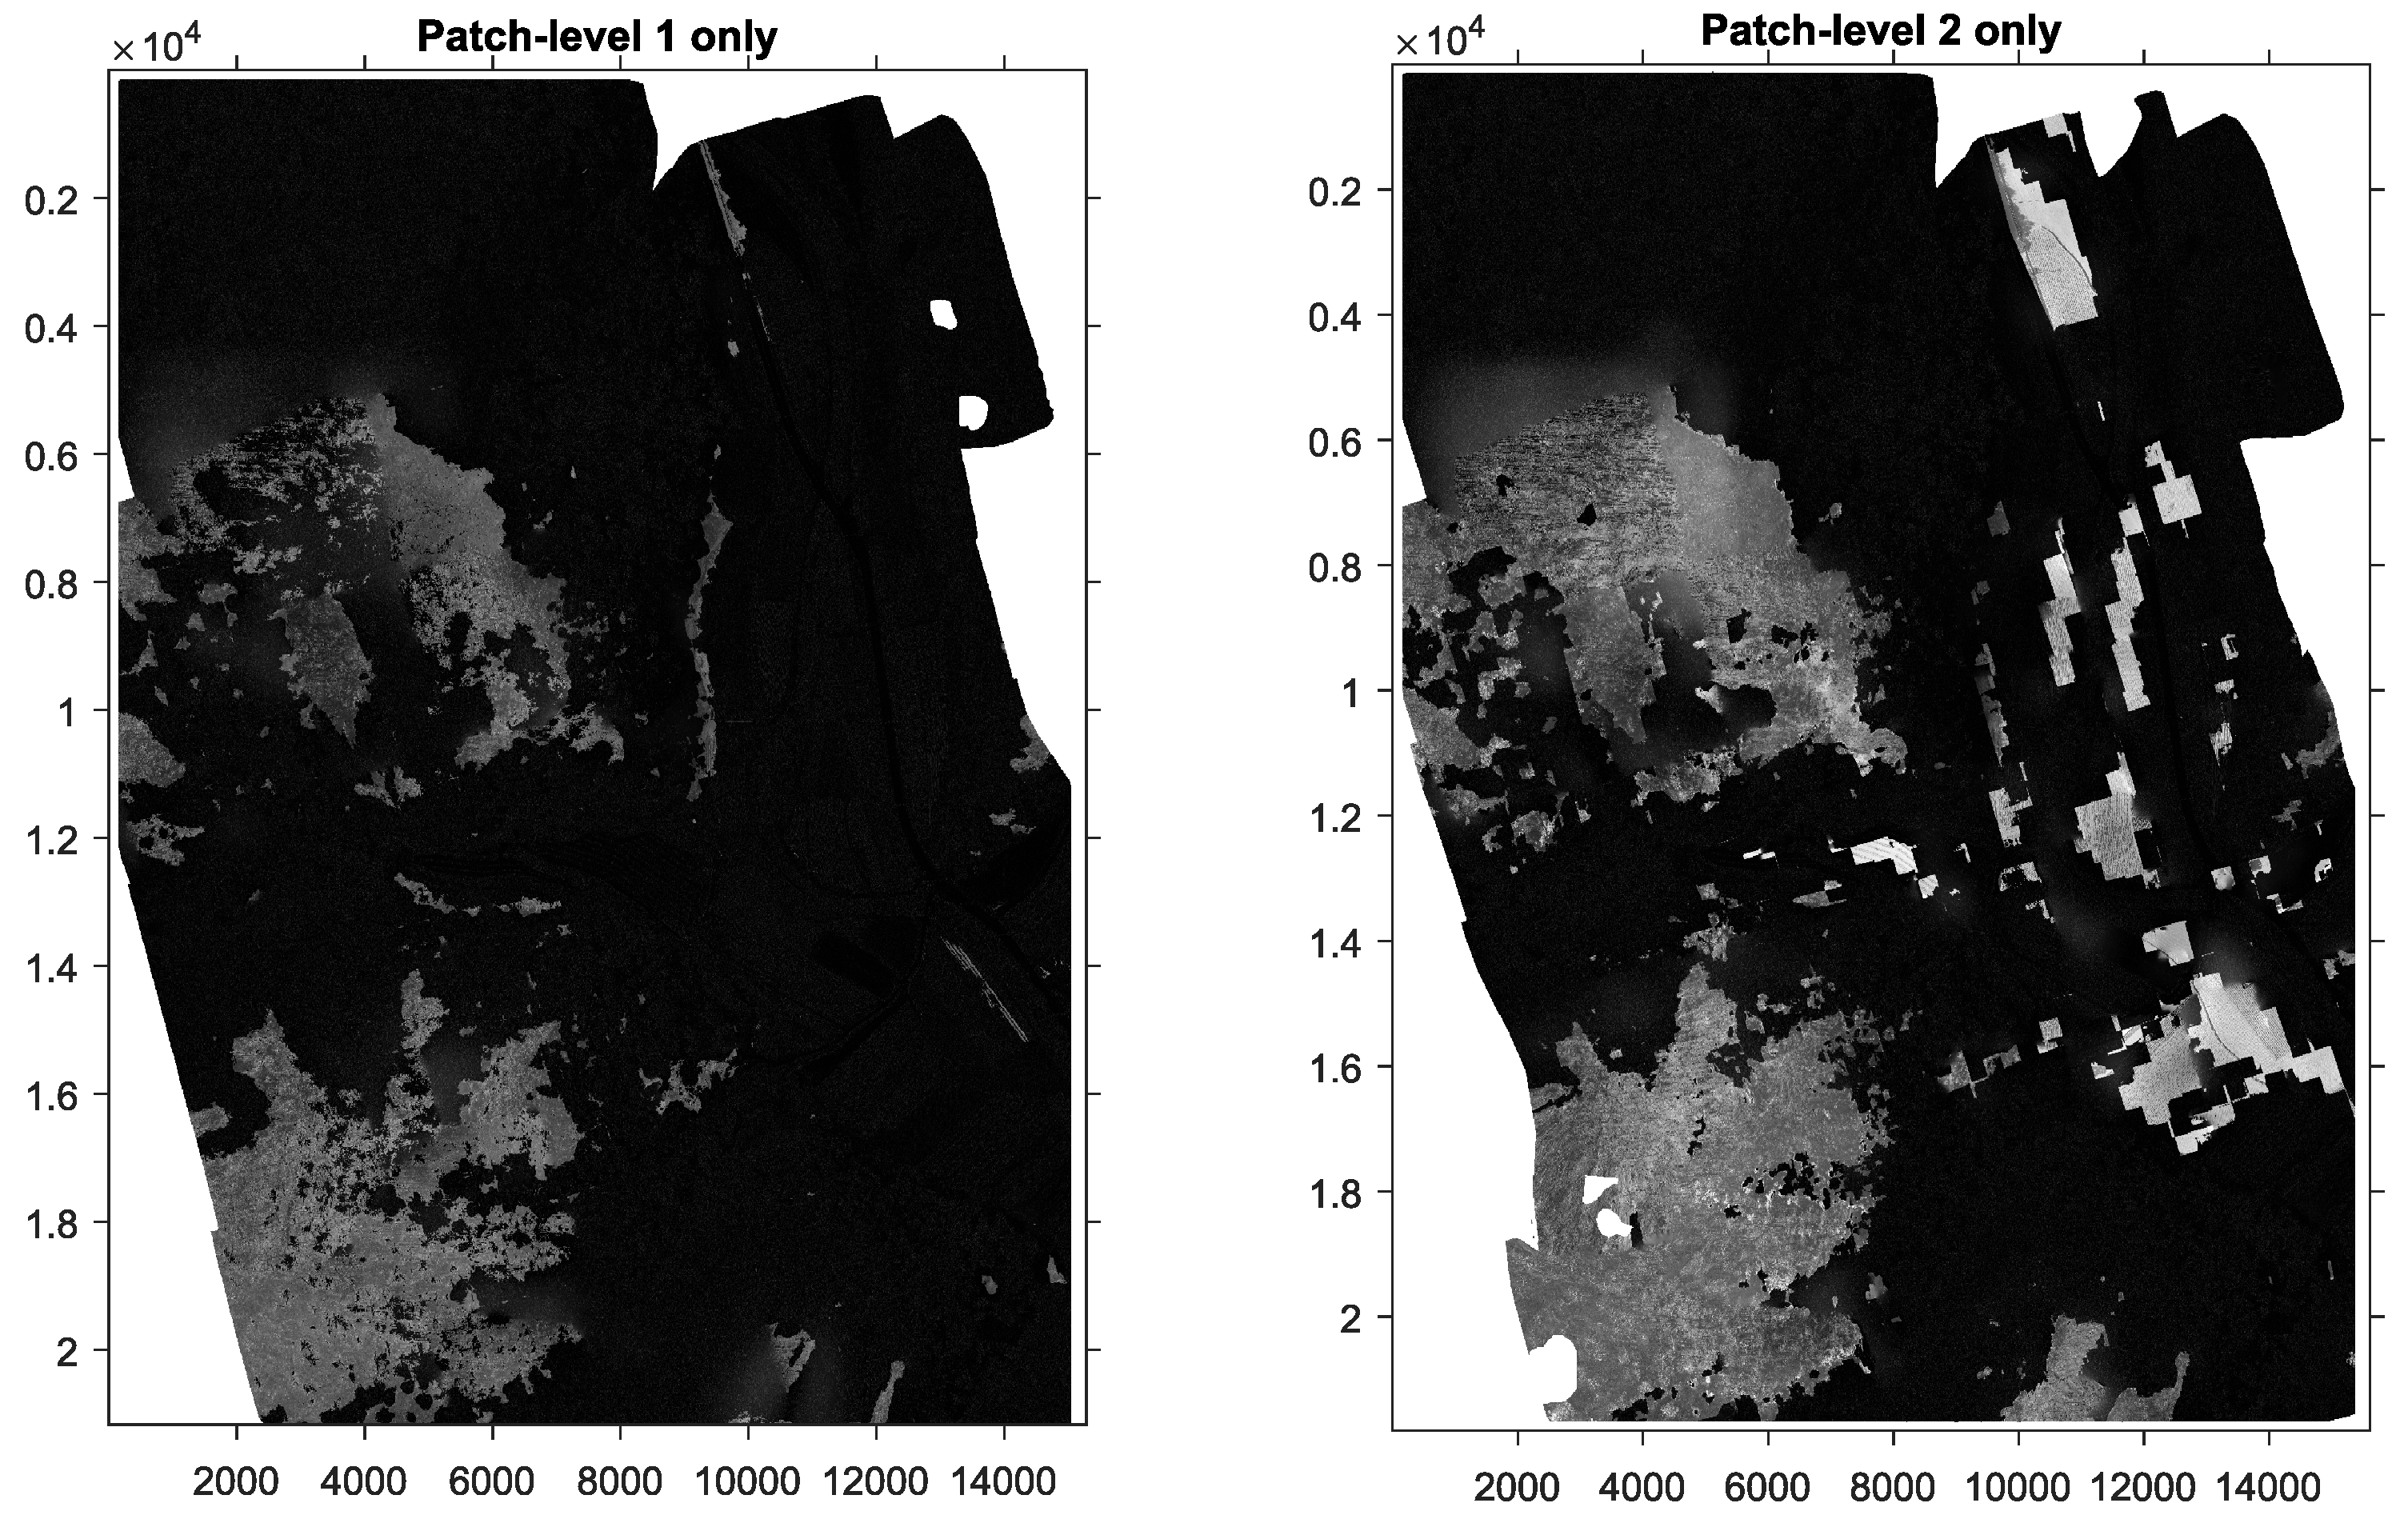
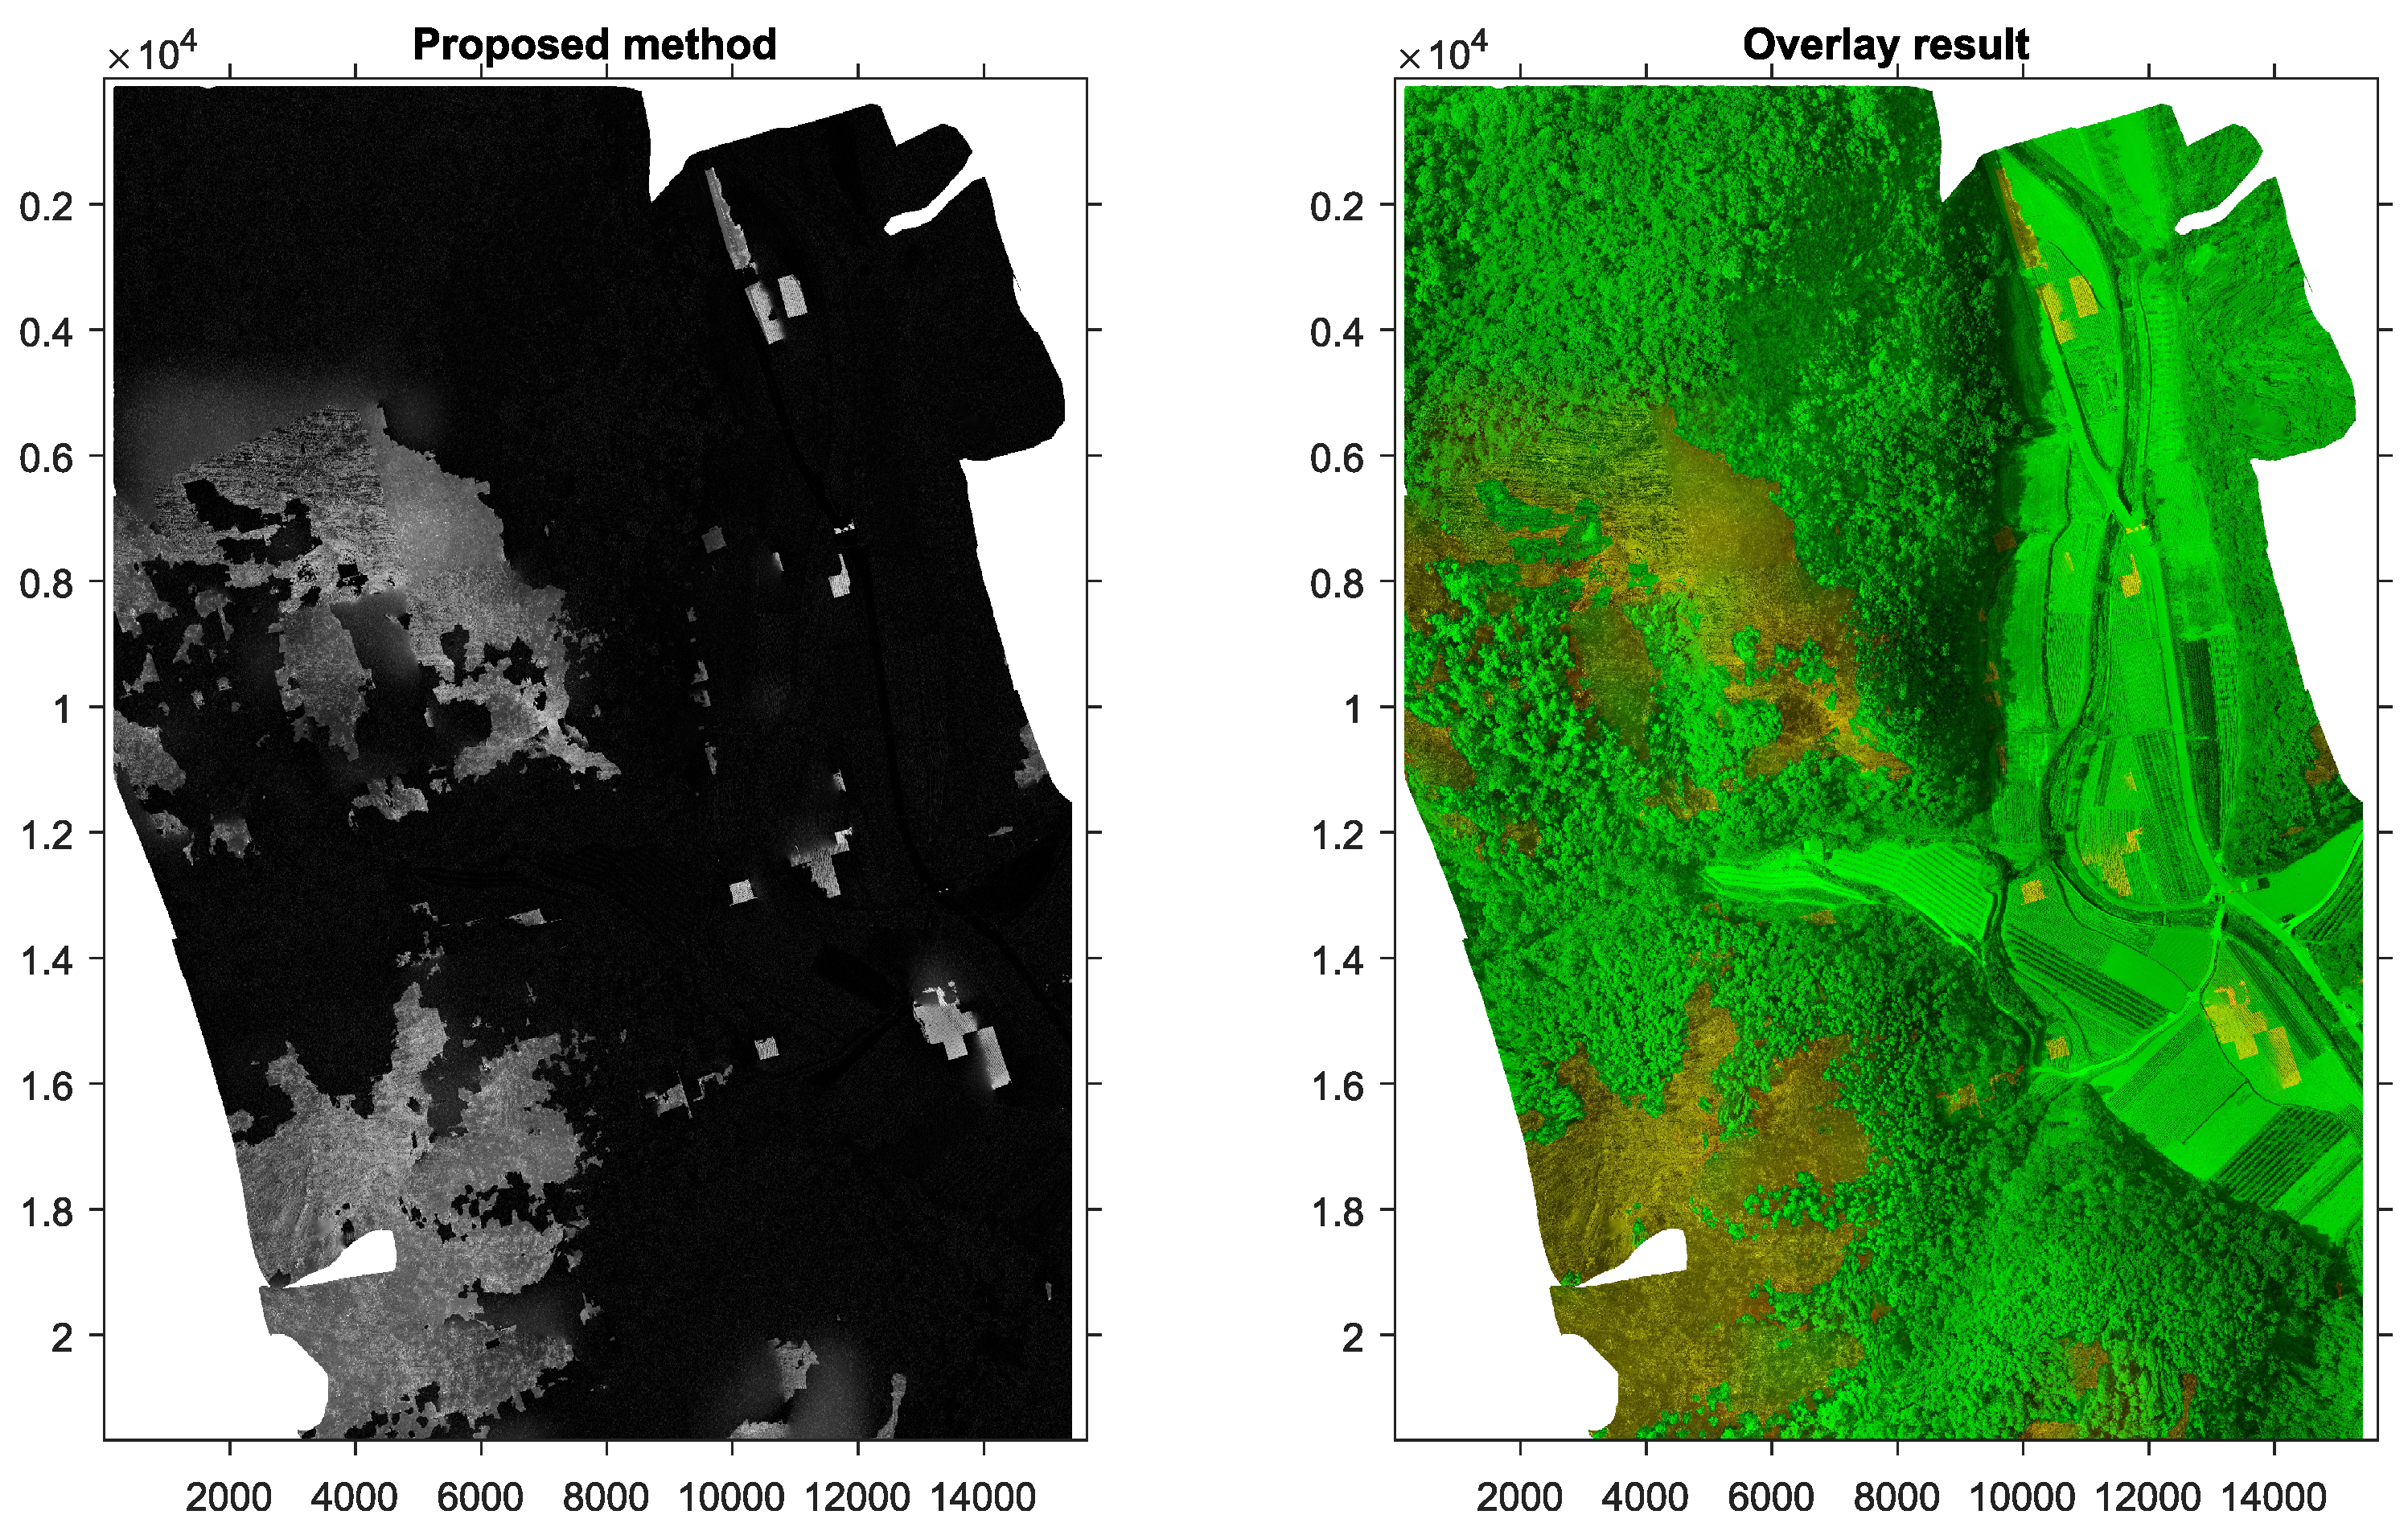
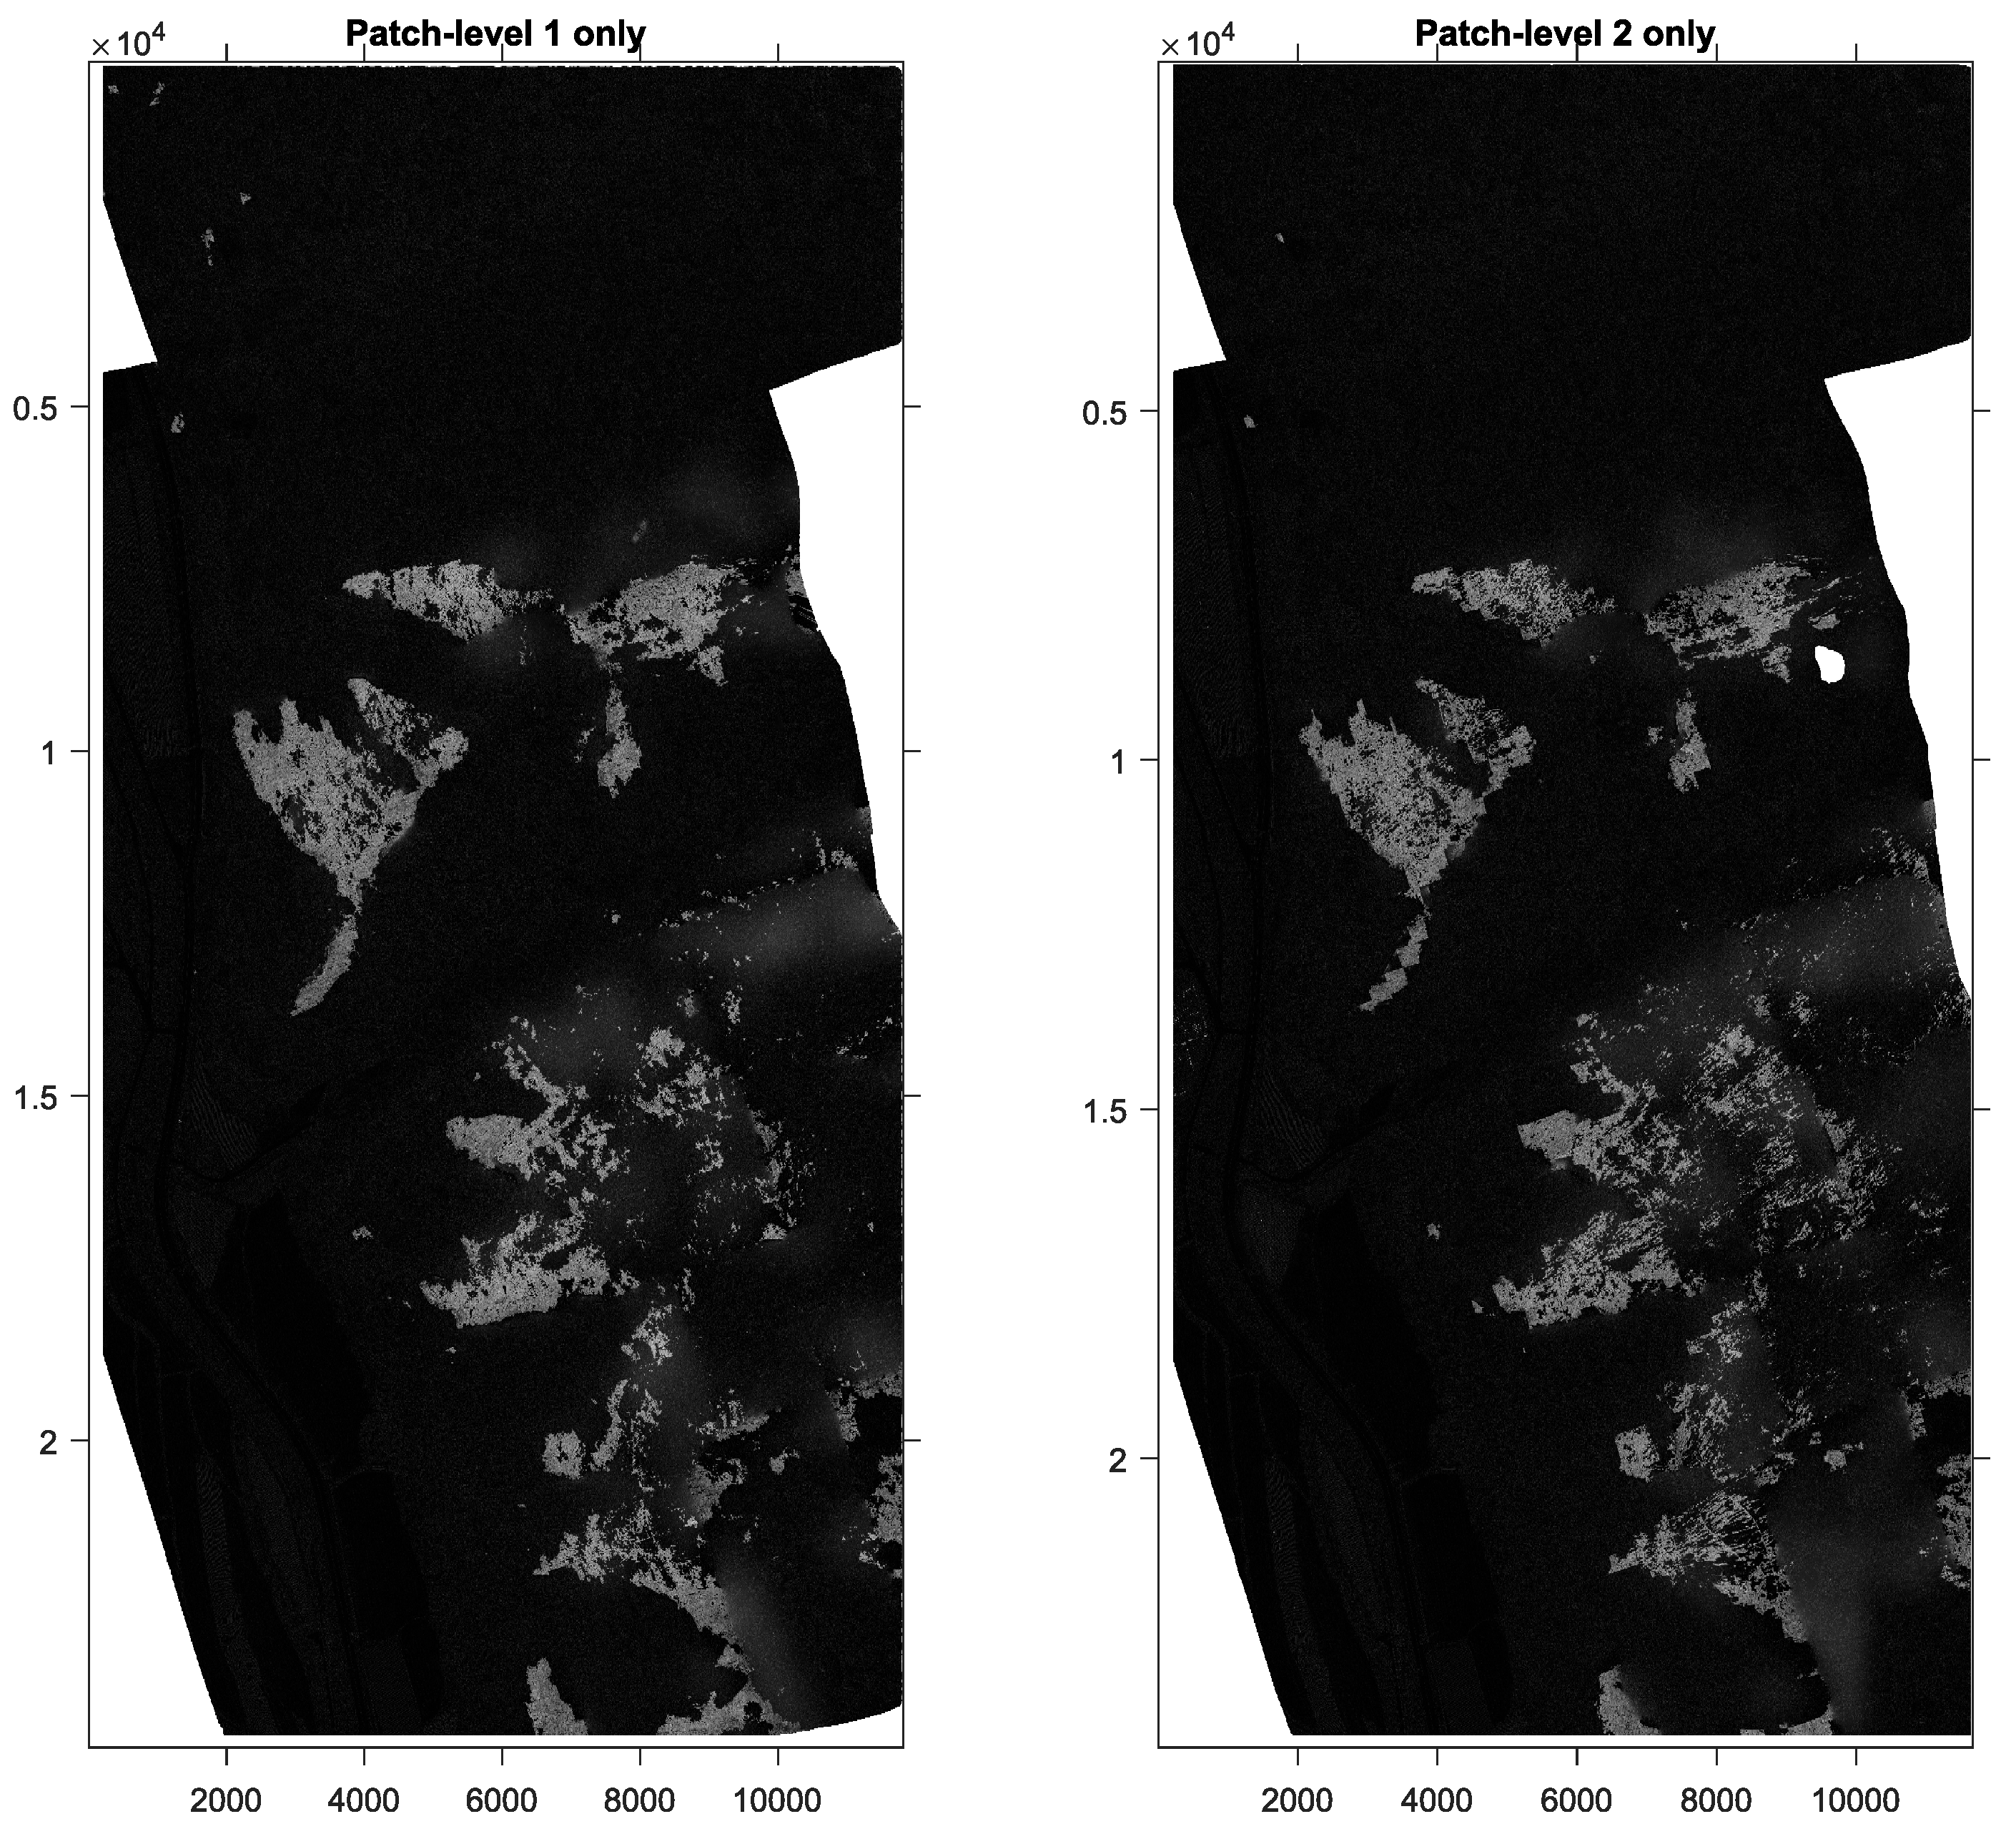
Finally, the final original images were obtained. The predicted results were postprocessed, e.g., converted to RGB and the EXIF information copied for the DroneDeploy platform. Figure 10 shows the orthophoto of location-2 area and its mask. With a similar process, the orthophoto from the other models and the proposed method was then assembled in Figure 11 and Figure 12. Compared with the original mask, the proposed method gave a better estimate than if only one segmentation model was used. In particular, the performance of the refined model is clearly present in the confusing farm area. Therefore, if the area was only cropped at level 1 or level 2, the trained model could face a challenge because of the imbalance problem. From that, it would give a poorer prediction.
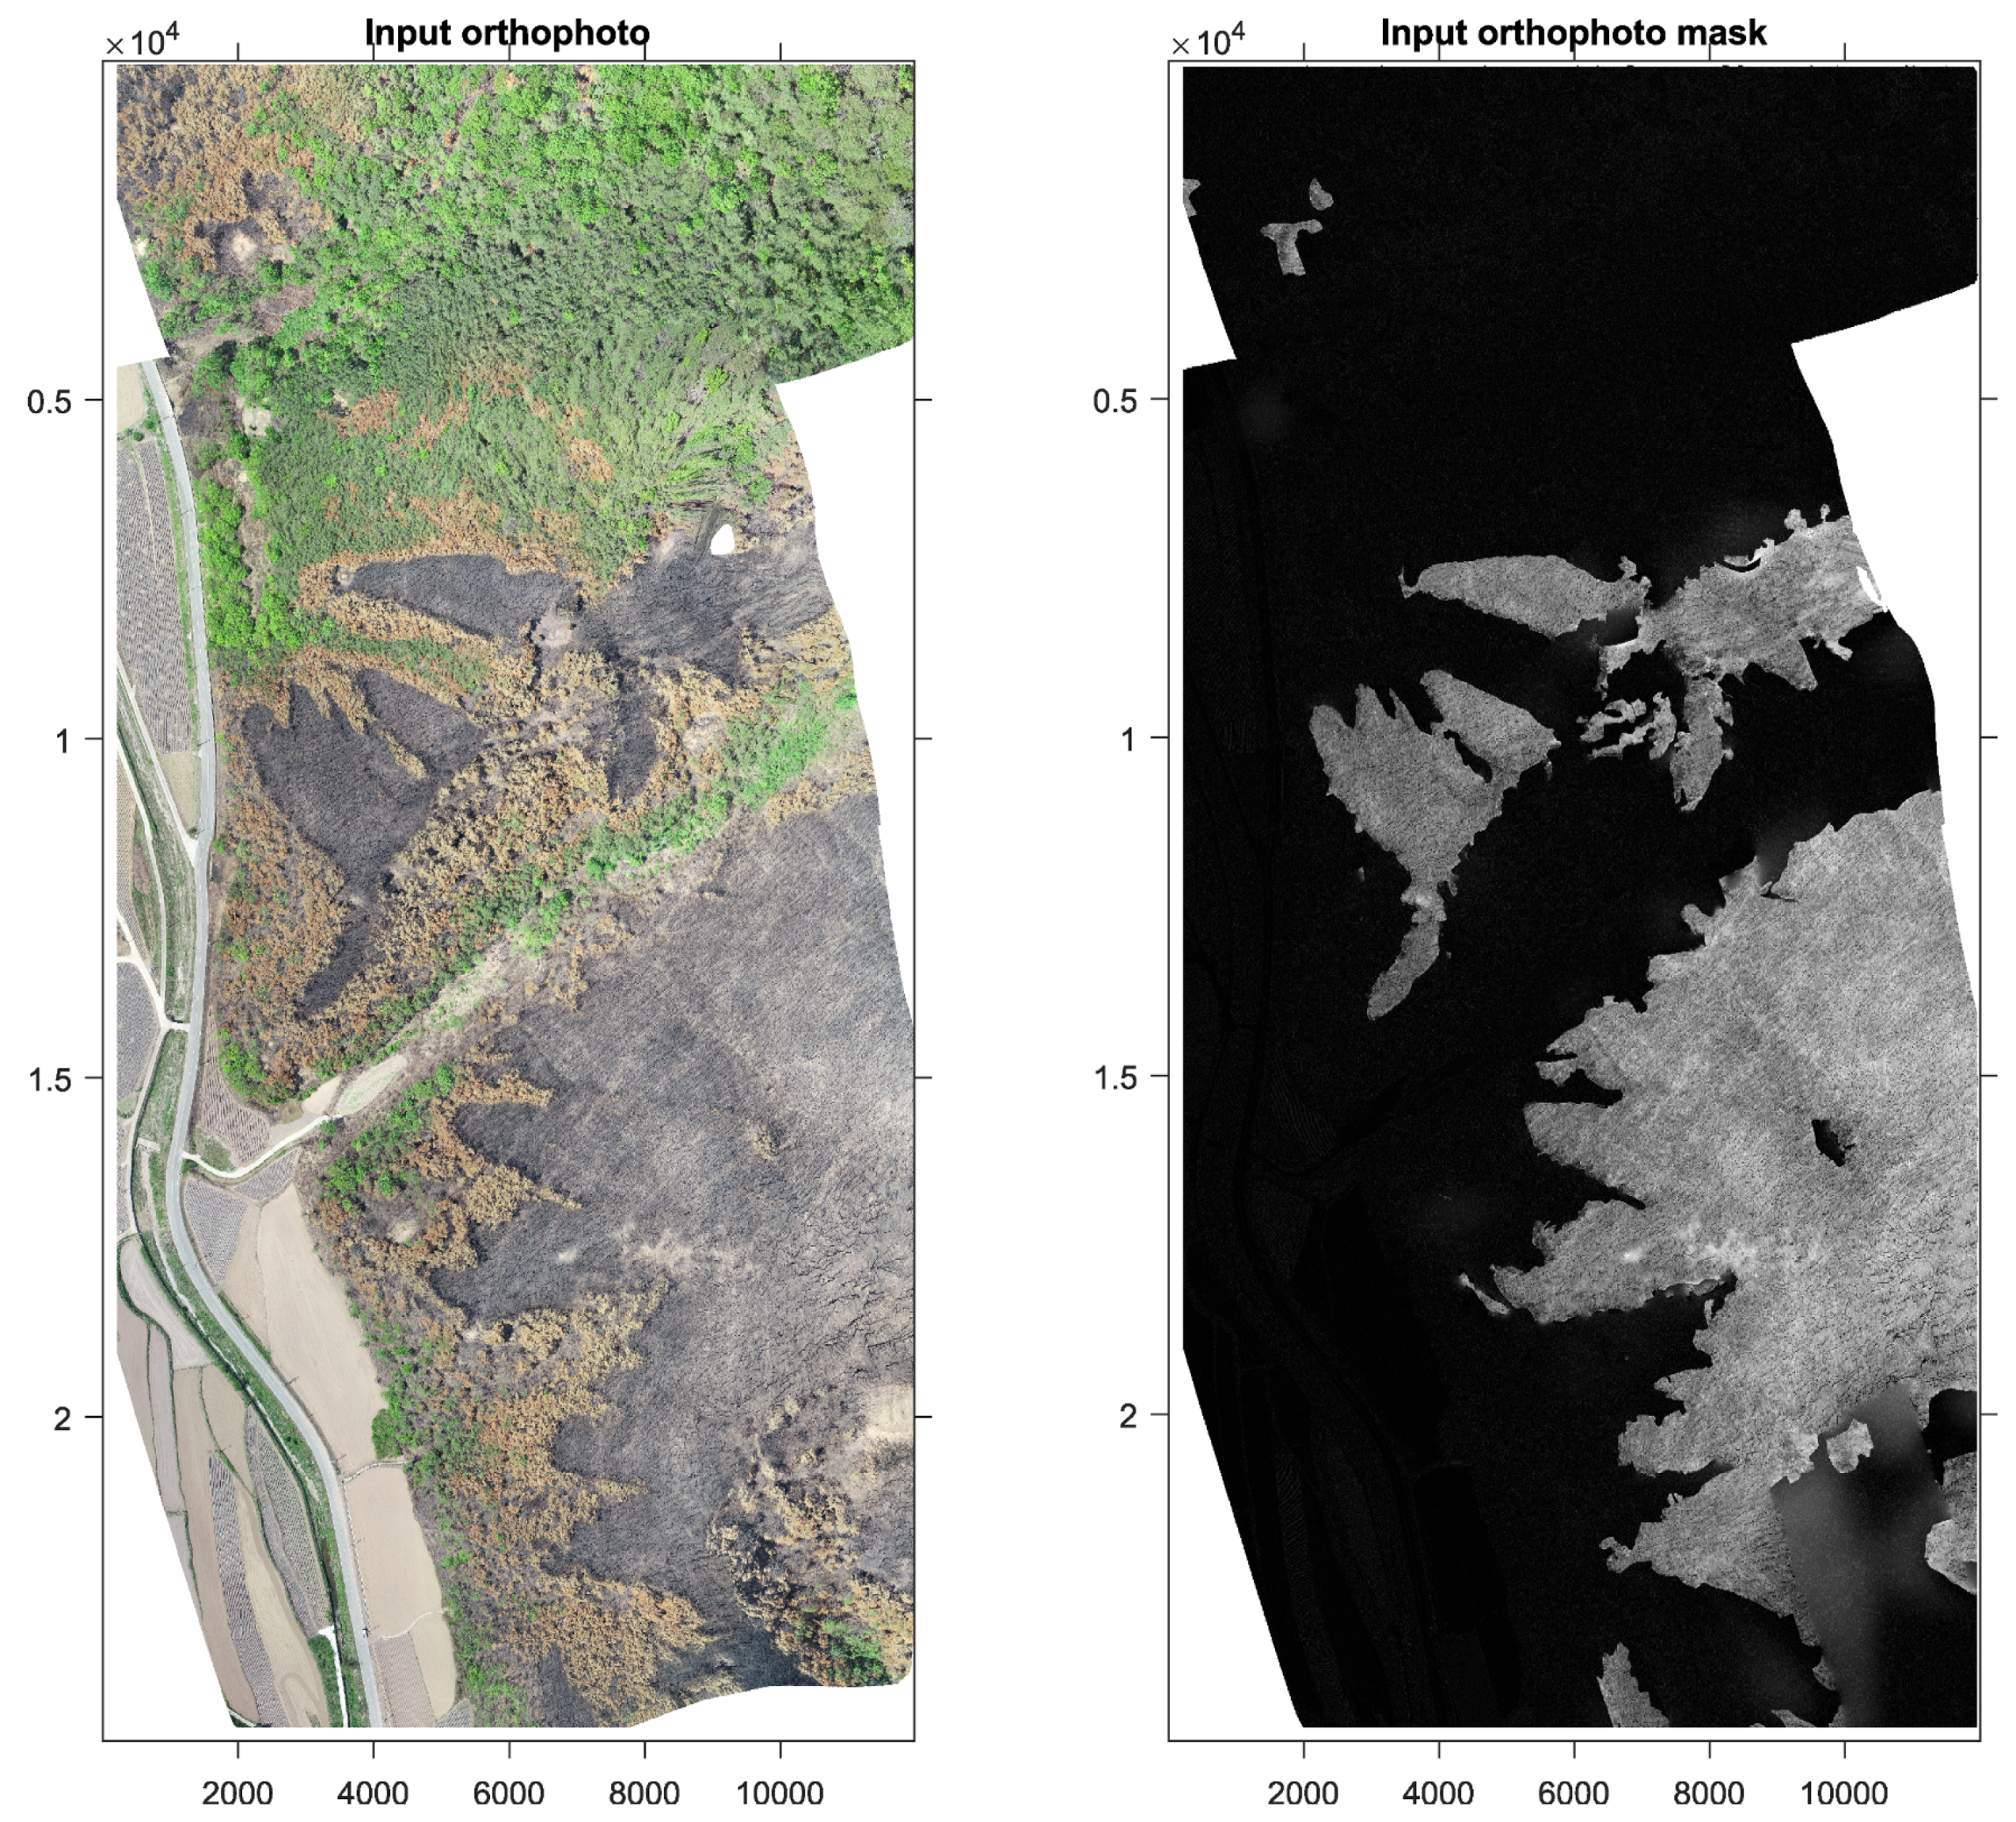
Similarly, by applying the same process, the final orthophoto prediction of location 1 is shown in Figure 13, Figure 14 and Figure 15. Clearly, the proposed method gave a better and more general prediction. However, at this point, the area with a farm or road is not a confused region anymore. This is mainly because the training dataset was from location 2; although the proposed method cannot depend on this limited dataset to give an acceptable results. This can be improved by using a general and better training dataset for further development.
5. Conclusions
Estimating the burnt area after a forest fire is important for monitoring the damage. The proposed approach was introduced, which incorporated deep learning-based image-segmentation algorithms and UAV images. The main findings are summarized as follows:
- The dual patch-level models worked better than the single-image-segmentation models. The dice coefficients when testing on locations 2 and 1 were 0.6924 and 0.7639, respectively;
- The FL as a loss function showed its effectiveness in optimizing the model and increasing the model performance on the test set;
- A pipeline step-by-step approach for pre- and postprocessing UAV images is introduced and made publicly available.
However, the proposed approach still has certain limitations:
- The dual patch-level models need to train on different locations with different weather conditions to improve their performance;
- The approach is now processed locally. Its need to be converted into an online platform to increase it practicality and reduce its time consumption.
Author Contributions
Idea development and original draft writing, D.Q.T.; data curation, draft review, and editing, M.P.; project administration, D.J.; supervision and funding acquisition, S.P. All authors have read and agreed to the published version of the manuscript.
Funding
This research was supported by a grant [2019-MOIS31-011] from the Fundamental Technology Development Program for Extreme Disaster Response funded by the Ministry of Interior and Safety, Korea and the National Research Foundation of Korea (NRF) grant funded by the Korea government (MSIP) (No. NRF-2017R1A2B3007607).
Conflicts of Interest
The authors declare no conflict of interest.
References
- Bowman, D.M.J.S.; Balch, J.K.; Artaxo, P.; Bond, W.J.; Carlson, J.M.; Cochrane, M.A.; D’Antonio, C.M.; DeFries, R.S.; Doyle, J.C.; Harrison, S.P.; et al. Fire in the Earth System. Science 2009, 324, 481–484. [Google Scholar] [CrossRef] [PubMed]
- Forest fire damage status: Detailed indicator screen. Available online: https://www.index.go.kr/potal/stts/idxMain/selectPoSttsIdxMainPrint.do?idx_cd=1309&board_cd=INDX_001 (accessed on 18 December 2020).
- Leblon, B.; Bourgeau-Chavez, L.; San-Miguel-Ayanz, J. Use of remote sensing in wildfire management. In Sustainable Development-Authoritative and Leading Edge Content for Environmental Management; IntechOpen: Croatia, Yugoslavia, 2012; pp. 55–81. [Google Scholar]
- Di Biase, V.; Laneve, G. Geostationary Sensor Based Forest Fire Detection and Monitoring: An Improved Version of the SFIDE Algorithm. Remote Sens. 2018, 10, 741. [Google Scholar] [CrossRef] [Green Version]
- Jang, E.; Kang, Y.; Im, J.; Lee, D.W.; Yoon, J.; Kim, S.K. Detection and Monitoring of Forest Fires Using Himawari-8 Geostationary Satellite Data in South Korea. Remote Sens. 2019, 11, 271. [Google Scholar] [CrossRef] [Green Version]
- Khodaee, M.; Hwang, T.; Kim, J.; Norman, S.P.; Robeson, S.M.; Song, C. Monitoring Forest Infestation and Fire Disturbance in the Southern Appalachian Using a Time Series Analysis of Landsat Imagery. Remote Sens. 2020, 12, 2412. [Google Scholar] [CrossRef]
- Fraser, R.H.; Van der Sluijs, J.; Hall, R.J. Calibrating Satellite-Based Indices of Burn Severity from UAV-Derived Metrics of a Burned Boreal Forest in NWT, Canada. Remote Sens. 2017, 9, 279. [Google Scholar] [CrossRef] [Green Version]
- Fernández-Guisuraga, J.; Sanz-Ablanedo, E.; Suárez-Seoane, S.; Calvo, L. Using Unmanned Aerial Vehicles in Postfire Vegetation Survey Campaigns through Large and Heterogeneous Areas: Opportunities and Challenges. Sensors 2018, 18, 586. [Google Scholar] [CrossRef] [PubMed] [Green Version]
- Shin, J.I.; Seo, W.W.; Kim, T.; Park, J.; Woo, C.S. Using UAV Multispectral Images for Classification of Forest Burn Severity—A Case Study of the 2019 Gangneung Forest Fire. Forests 2019, 10, 1025. [Google Scholar] [CrossRef] [Green Version]
- Carvajal-Ramírez, F.; Marques da Silva, J.R.; Agüera-Vega, F.; Martínez-Carricondo, P.; Serrano, J.; Moral, F.J. Evaluation of Fire Severity Indices Based on Pre- and Post-Fire Multispectral Imagery Sensed from UAV. Remote Sens. 2019, 11, 993. [Google Scholar] [CrossRef] [Green Version]
- Samiappan, S.; Hathcock, L.; Turnage, G.; McCraine, C.; Pitchford, J.; Moorhead, R. Remote Sensing of Wildfire Using a Small Unmanned Aerial System: Post-Fire Mapping, Vegetation Recovery and Damage Analysis in Grand Bay, Mississippi/Alabama, USA. Drones 2019, 3, 43. [Google Scholar] [CrossRef] [Green Version]
- Pérez-Rodríguez, L.A.; Quintano, C.; Marcos, E.; Suarez-Seoane, S.; Calvo, L.; Fernández-Manso, A. Evaluation of Prescribed Fires from Unmanned Aerial Vehicles (UAVs) Imagery and Machine Learning Algorithms. Remote Sens. 2020, 12, 1295. [Google Scholar] [CrossRef] [Green Version]
- Park, M.; Tran, D.Q.; Jung, D.; Park, S. Wildfire-Detection Method Using DenseNet and CycleGAN Data Augmentation-Based Remote Camera Imagery. Remote Sens. 2020, 12, 3715. [Google Scholar] [CrossRef]
- Jung, D.; Tran Tuan, V.; Dai Tran, Q.; Park, M.; Park, S. Conceptual Framework of an Intelligent Decision Support System for Smart City Disaster Management. Appl. Sci. 2020, 10, 666. [Google Scholar] [CrossRef] [Green Version]
- Xiang, T.; Xia, G.; Zhang, L. Mini-Unmanned Aerial Vehicle-Based Remote Sensing: Techniques, applications, and prospects. IEEE Geosci. Remote Sens. Mag. 2019, 7, 29–63. [Google Scholar] [CrossRef] [Green Version]
- Matese, A.; Toscano, P.; Di Gennaro, S.F.; Genesio, L.; Vaccari, F.P.; Primicerio, J.; Belli, C.; Zaldei, A.; Bianconi, R.; Gioli, B. Intercomparison of UAV, aircraft and satellite remote sensing platforms for precision viticulture. Remote Sens. 2015, 7, 2971–2990. [Google Scholar] [CrossRef] [Green Version]
- Bhatnagar, S.; Gill, L.; Ghosh, B. Drone Image Segmentation Using Machine and Deep Learning for Mapping Raised Bog Vegetation Communities. Remote Sens. 2020, 12, 2602. [Google Scholar] [CrossRef]
- Yang, M.D.; Tseng, H.H.; Hsu, Y.C.; Tsai, H.P. Semantic Segmentation Using Deep Learning with Vegetation Indices for Rice Lodging Identification in Multi-date UAV Visible Images. Remote Sens. 2020, 12, 633. [Google Scholar] [CrossRef] [Green Version]
- Drone & UAV Mapping Platform | DroneDeploy. Available online: https://www.dronedeploy.com/ (accessed on 18 December 2020).
- Ronneberger, O.; Fischer, P.; Brox, T. U-Net: Convolutional Networks for Biomedical Image Segmentation. arXiv 2015, arXiv:1505.04597. [Google Scholar]
- Zhou, Z.; Siddiquee, M.M.R.; Tajbakhsh, N.; Liang, J. Unet++: A nested u-net architecture for medical image segmentation. In Deep Learning in Medical Image Analysis and Multimodal Learning for Clinical Decision Support; Springer: New York, NY, USA, 2018; pp. 3–11. [Google Scholar]
- Jadon, S.; Leary, O.P.; Pan, I.; Harder, T.J.; Wright, D.W.; Merck, L.H.; Merck, D.L. A comparative study of 2D image segmentation algorithms for traumatic brain lesions using CT data from the ProTECTIII multicenter clinical trial. In Medical Imaging 2020: Imaging Informatics for Healthcare, Research, and Applications; International Society for Optics and Photonics: Bellingham, WA, USA, 2020; Volume 11318, p. 113180Q. [Google Scholar]
- Yan, Z.; Han, X.; Wang, C.; Qiu, Y.; Xiong, Z.; Cui, S. Learning mutually local-global u-nets for high-resolution retinal lesion segmentation in fundus images. In Proceedings of the 2019 IEEE 16th International Symposium on Biomedical Imaging (ISBI 2019), Venice, Italy, 8–11 April 2019; pp. 597–600. [Google Scholar]
- Pham, Q.; Ahn, S.; Song, S.J.; Shin, J. Automatic Drusen Segmentation for Age-Related Macular Degeneration in Fundus Images Using Deep Learning. Electronics 2020, 9, 1617. [Google Scholar] [CrossRef]
- Lin, T.Y.; Goyal, P.; Girshick, R.; He, K.; Dollár, P. Focal loss for dense object detection. In Proceedings of the IEEE International Conference on Computer Vision, Venice, Italy, 22–29 October 2017; pp. 2980–2988. [Google Scholar]
- Russell, B.C.; Torralba, A.; Murphy, K.P.; Freeman, W.T. LabelMe: A database and web-based tool for image annotation. Int. J. Comput. Vis. 2008, 77, 157–173. [Google Scholar] [CrossRef]
- Abadi, M.; Barham, P.; Chen, J.; Chen, Z.; Davis, A.; Dean, J.; Devin, M.; Ghemawat, S.; Irving, G.; Isard, M. Tensorflow: A system for large-scale machine learning. In Proceedings of the 12th USENIX Symposium on Operating Systems Design and Implementation (OSDI 16), Savannah, GA, USA, 2–4 November 2016; pp. 265–283. [Google Scholar]
Figure 1.
Conceptual framework of an unmanned aerial vehicle (UAV)-based forest-fire monitoring system.
Figure 1.
Conceptual framework of an unmanned aerial vehicle (UAV)-based forest-fire monitoring system.

Figure 2.
Research area. (a) Location of Andong Province; (b) locations of the two examined areas; (c,d) show orthophotos of these places.
Figure 2.
Research area. (a) Location of Andong Province; (b) locations of the two examined areas; (c,d) show orthophotos of these places.

Figure 3.
Sample raw images with a resolution of 5473 × 3648 × 3 pixels.

Figure 4.
Typical UNet architecture.

Figure 5.
Proposed approach for automatic burned area segmentation using deep learning algorithms and UAV images.
Figure 5.
Proposed approach for automatic burned area segmentation using deep learning algorithms and UAV images.

Figure 6.
Segmentation results for the path-level 1 dataset on different models and the proposed method. The model was trained on location 1 and tested on location 2. The input and predicted mask of size 912 × 912 × 3 pixels.
Figure 6.
Segmentation results for the path-level 1 dataset on different models and the proposed method. The model was trained on location 1 and tested on location 2. The input and predicted mask of size 912 × 912 × 3 pixels.

Figure 7.
Segmentation results for the path-level 1 dataset on different models and the proposed method. The model was trained on location 2 and tested on location 1. The input and predicted mask of size 912 × 912 × 3 pixels.
Figure 7.
Segmentation results for the path-level 1 dataset on different models and the proposed method. The model was trained on location 2 and tested on location 1. The input and predicted mask of size 912 × 912 × 3 pixels.

Figure 8.
Segmentation results from different models on a merged original image. The model was trained on location 1 and tested on location 2. The input and predicted mask of size 5473 × 3648 × 3 pixels.
Figure 8.
Segmentation results from different models on a merged original image. The model was trained on location 1 and tested on location 2. The input and predicted mask of size 5473 × 3648 × 3 pixels.

Figure 9.
Segmentation results from different models on a merged original image. The model was trained on location 2 and tested on location 1. The input and predicted mask of size 5473 × 3648 × 3 pixels.
Figure 9.
Segmentation results from different models on a merged original image. The model was trained on location 2 and tested on location 1. The input and predicted mask of size 5473 × 3648 × 3 pixels.

Figure 10.
Original orthophoto from location 2 and its mask. The orthophoto of size 21,976 × 15,861 × 3.
Figure 10.
Original orthophoto from location 2 and its mask. The orthophoto of size 21,976 × 15,861 × 3.

Figure 11.
Prediction orthophoto from U-Net++ patch level 1 and UNet on patch-level 2 only. The orthophoto of size 21,976 × 15,861 × 3.
Figure 11.
Prediction orthophoto from U-Net++ patch level 1 and UNet on patch-level 2 only. The orthophoto of size 21,976 × 15,861 × 3.

Figure 12.
Prediction orthophoto from the proposed method. The orthophoto of size 21,976 × 15,861 × 3.
Figure 12.
Prediction orthophoto from the proposed method. The orthophoto of size 21,976 × 15,861 × 3.

Figure 13.
Original orthophoto from location 1 and its mask. The orthophoto of size 24,142 × 11,662 × 3.
Figure 13.
Original orthophoto from location 1 and its mask. The orthophoto of size 24,142 × 11,662 × 3.

Figure 14.
Prediction orthophoto from U-Net++ patch level 1 and UNet on patch-level 2 only. The orthophoto of size 24,142 × 11,662 × 3.
Figure 14.
Prediction orthophoto from U-Net++ patch level 1 and UNet on patch-level 2 only. The orthophoto of size 24,142 × 11,662 × 3.

Figure 15.
Prediction orthophoto from the proposed method, trained on location 2 and tested on location 1. The orthophoto of size 24,142 × 11,662 × 3.
Figure 15.
Prediction orthophoto from the proposed method, trained on location 2 and tested on location 1. The orthophoto of size 24,142 × 11,662 × 3.


Table 1.
Number of training images from two locations.
| Location | Patch-Level 1 Network Only | Patch-Level 2 Network Only | Patch-Level 2 Network Proposed Method |
|---|---|---|---|
| 1 | 1032 | 16,512 | 7660 |
| 2 | 1056 | 16,896 | 4140 |
Table 2.
The performance of each model on the test set. This model was trained on location 1 and tested on location 2.
Table 2.
The performance of each model on the test set. This model was trained on location 1 and tested on location 2.
| Evaluation Metrics | Patch-Level 1 Network Only | Patch-Level 2 Network Only | Proposed Method |
|---|---|---|---|
| Dice coefficient | 0.1712 | 0.5697 | 0.6924 |
| Sensitivity | 0.1750 | 0.2643 | 0.2340 |
| Specificity | 0.9274 | 0.8384 | 0.9177 |
Table 3.
The performance of each model on the test set. This model was trained on location 2 and tested on location 1.
Table 3.
The performance of each model on the test set. This model was trained on location 2 and tested on location 1.
| Evaluation Metrics | Patch-Level 1 Network Only | Patch-Level 2 Network Only | Proposed Method |
|---|---|---|---|
| Dice coefficient | 0.3346 | 0.5590 | 0.7639 |
| Sensitivity | 0.2313 | 0.2038 | 0.3808 |
| Specificity | 0.8571 | 0.8545 | 0.8311 |
Table 4.
The loss function effectiveness of deep learning model performance—Trained on location 1 and tested on location 2.
Table 4.
The loss function effectiveness of deep learning model performance—Trained on location 1 and tested on location 2.
| Evaluation Metrics | Net 1 BCE-Net 2 BCE | Net 1 BCE-Net 2 FL | Net 1 FL-Net 2 BCE | Net 1 FL-Net 2 FL |
|---|---|---|---|---|
| Dice coefficient | 0.6568 | 0.5658 | 0.6924 | 0.6170 |
| Sensitivity | 0.2348 | 0.2589 | 0.2340 | 0.2574 |
| Specificity | 0.9109 | 0.877 | 0.9177 | 0.8901 |
Table 5.
The loss function effectiveness of deep learning model performance—Trained on location 12 and tested on location 1.
Table 5.
The loss function effectiveness of deep learning model performance—Trained on location 12 and tested on location 1.
| Evaluation Metrics | Net 1 BCE-Net 2 BCE | Net 1 BCE-Net 2 FL | Net 1 FL-Net 2 BCE | Net 1 FL-Net 2 FL |
|---|---|---|---|---|
| Dice coefficient | 0.7381 | 0.7043 | 0.7639 | 0.7322 |
| Sensitivity | 0.3815 | 0.2994 | 0.3808 | 0.3010 |
| Specificity | 0.8244 | 0.8405 | 0.8311 | 0.8436 |
Publisher’s Note: MDPI stays neutral with regard to jurisdictional claims in published maps and institutional affiliations. |
© 2020 by the authors. Licensee MDPI, Basel, Switzerland. This article is an open access article distributed under the terms and conditions of the Creative Commons Attribution (CC BY) license (http://creativecommons.org/licenses/by/4.0/).
Share and Cite
MDPI and ACS Style
Tran, D.Q.; Park, M.; Jung, D.; Park, S. Damage-Map Estimation Using UAV Images and Deep Learning Algorithms for Disaster Management System. Remote Sens. 2020, 12, 4169. https://0-doi-org.brum.beds.ac.uk/10.3390/rs12244169
AMA Style
Tran DQ, Park M, Jung D, Park S. Damage-Map Estimation Using UAV Images and Deep Learning Algorithms for Disaster Management System. Remote Sensing. 2020; 12(24):4169. https://0-doi-org.brum.beds.ac.uk/10.3390/rs12244169
Chicago/Turabian StyleTran, Dai Quoc, Minsoo Park, Daekyo Jung, and Seunghee Park. 2020. "Damage-Map Estimation Using UAV Images and Deep Learning Algorithms for Disaster Management System" Remote Sensing 12, no. 24: 4169. https://0-doi-org.brum.beds.ac.uk/10.3390/rs12244169
Note that from the first issue of 2016, this journal uses article numbers instead of page numbers. See further details here.