1. Introduction
Flash floods are one of the most catastrophic natural hazards, inducing a wide range of tangible and intangible effects [
1,
2], significant economic losses [
2,
3,
4], and a noteworthy number of fatalities [
5,
6,
7,
8]. Recent findings indicate that flash flood impacts can potentially become more significant in the future as a result of climate change [
9].
Flash flood characteristics and spatiotemporal scales of occurrence limit the possibilities for systematic conventional observations [
10,
11,
12]. The damage of conventional instrumentation [
13], inadequacy or absence of instruments [
14,
15,
16] and even safety issues [
17,
18] have shifted the focus on post-flood field surveys and indirect estimates [
10,
11,
12].
The peak discharge is a key metric of flash floods and its estimation provides valuable insights into rainfall-runoff relationships and catchments’ hydrological response. Studying discharge is a crucial step to comprehend flood frequency and estimate return period, which are in turn necessary to develop effective flood mitigation procedures and infrastructure.
The slope conveyance method and the use of the Manning formula are two of the most common tools in indirect discharge estimations [
10,
19,
20]. Recent works highlight their dominance in post-flood discharge studies [
17,
20].
Nevertheless, the process of estimating discharge has inherent uncertainties and difficulties, connected mostly with defining water surface and energy slope with accuracy, as well as measuring the channel geometry, determining roughness coefficient, and others [
17,
20]. To minimize these uncertainties, fieldwork-based calculations can become time-consuming and in some occasions impractical or unsafe. Post-flood field surveys are often accompanied by repeated thorough measurements under challenging conditions. In addition, the wrong choices of cross-sections or non-meticulous measurements can lead to a need to revisit a remote site. Further, human-induced or natural changes of the river channel after the first survey can lead to loss of discharge information entirely.
Recent works demonstrate the mapping and detection of geomorphological features, especially within river channels using imagery derived from Unmanned Aerial Systems (UAS) as an emerging discipline. Recently, studies have tested UAS systems in post-flood environments to enhance disaster- and hydrology-related observations and flood monitoring [
21,
22,
23,
24]. Together with Structure from Motion (SfM) techniques and the field of photogrammetry, UAS can be a powerful tool for developing high-resolution topographic data, which contribute to terrain modelling and provide insight into the dynamics of geomorphological processes [
25,
26,
27]. The combination of UAS and SfM has proved its capacity in multiple geoscientific applications in recent years [
28] and has contributed to various field surveying solutions [
29].
Some of UAS and SfM applications focus on hydro-morphological changes [
30,
31], flood effects [
29], and fluvial geomorphology [
32] fields, which benefit from the capacity of continuous coverage in terms of measurements [
33].
While terrestrial and airborne Lidar data were used for developing the high-resolution topographic datasets, the emerging SfM photogrammetry methods proved to have similar advantages. Westoby et al. [
28] proposed an open-source SfM tool to produce 3-D point clouds in the field of developing high-resolution Digital Elevation Models (DEMs). Still, their results had similar spatial resolution to the more traditional and costly terrestrial laser scanning methods. A similar comparison of SfM and Lidar outputs was performed by Woodget et al. [
34], who used a UAS to quantify fluvial topography and showed that it is possible to develop hyperspatial resolution DEMs by using SfM photogrammetry.
Furthermore, SfM proved to be a very useful tool for channel and fluvial geomorphology, as well as a critical parameter for hydrodynamic studies [
35]. Photogrammetry’s capacity for detailed mapping of channel surfaces has been exploited in the field of hydraulic simulation and flood magnitude estimation [
22,
35,
36]. In addition, the high level of detail in representing river morphology was shown also to be useful. Watanabe and Kawahara [
36] used SfM-derived high accuracy [even in the order of cm] Digital Surface Models (DSMs) to reproduce river topography and vegetation, as well as to detect changes in ground level and vegetation after flooding. In a more recent study, Langhammer and Vackova [
29] examined a flood plain using a multi-rotor UAS and applied photogrammetry methods to create high spatial resolution digital elevation model (DEM) and orthomosaics, that can be used for object-based segmentation as well as the classification of fluvial geomorphological features.
Recently, in the field of roughness estimation, granulometry of river beds has benefited by automatic analysis of photographs through automatic object detection software solutions [
37]. Pearson et al. [
38] found that using the SfM technique we can successfully replicate roughness-grain-size relationships using either laboratory or field-based SfM surveys. The capacity that these UAS-aided techniques have demonstrated in measuring various geometric factors of the terrain show that they can contribute to measurements relevant to flood hydraulics [
35].
In this context, the objective of this paper is to examine the application of the slope conveyance method by exploiting UAS-derived data in the course of a post-flood survey to make peak discharge estimations. This study examines the accuracy of this UAS-aided approach by comparing its results with the traditional peak discharge estimation method and discusses its strengths and limitations. This study applies its methods in the catchment of Soures in Mandra, Greece, focusing on the flood event of 2017. This event has been studied before by Diakakis et al. [
39] from a risk and disaster management viewpoint, adding to the compilation of data on extreme flash floods. The present study focuses on the applicability of a UAS-aided approach and compares it with established methods, discussing its practical advantages and disadvantages against them, adding to the relatively new literature on UASs’ applications on flash floods hydrology.
The rest of the paper is structured as follows.
Section 2 describes the study area.
Section 3 presents a step by step description of the methodological framework including data collection, recording of key information in the channels, estimating roughness coefficient with two approaches, and estimating peak discharge.
Section 4 and
Section 5 present and discuss the results, respectively, comparing different approaches in a systematic way and focusing on the advantages and disadvantages of UAS-derived results. Finally,
Section 6 concludes with the main findings of the study.
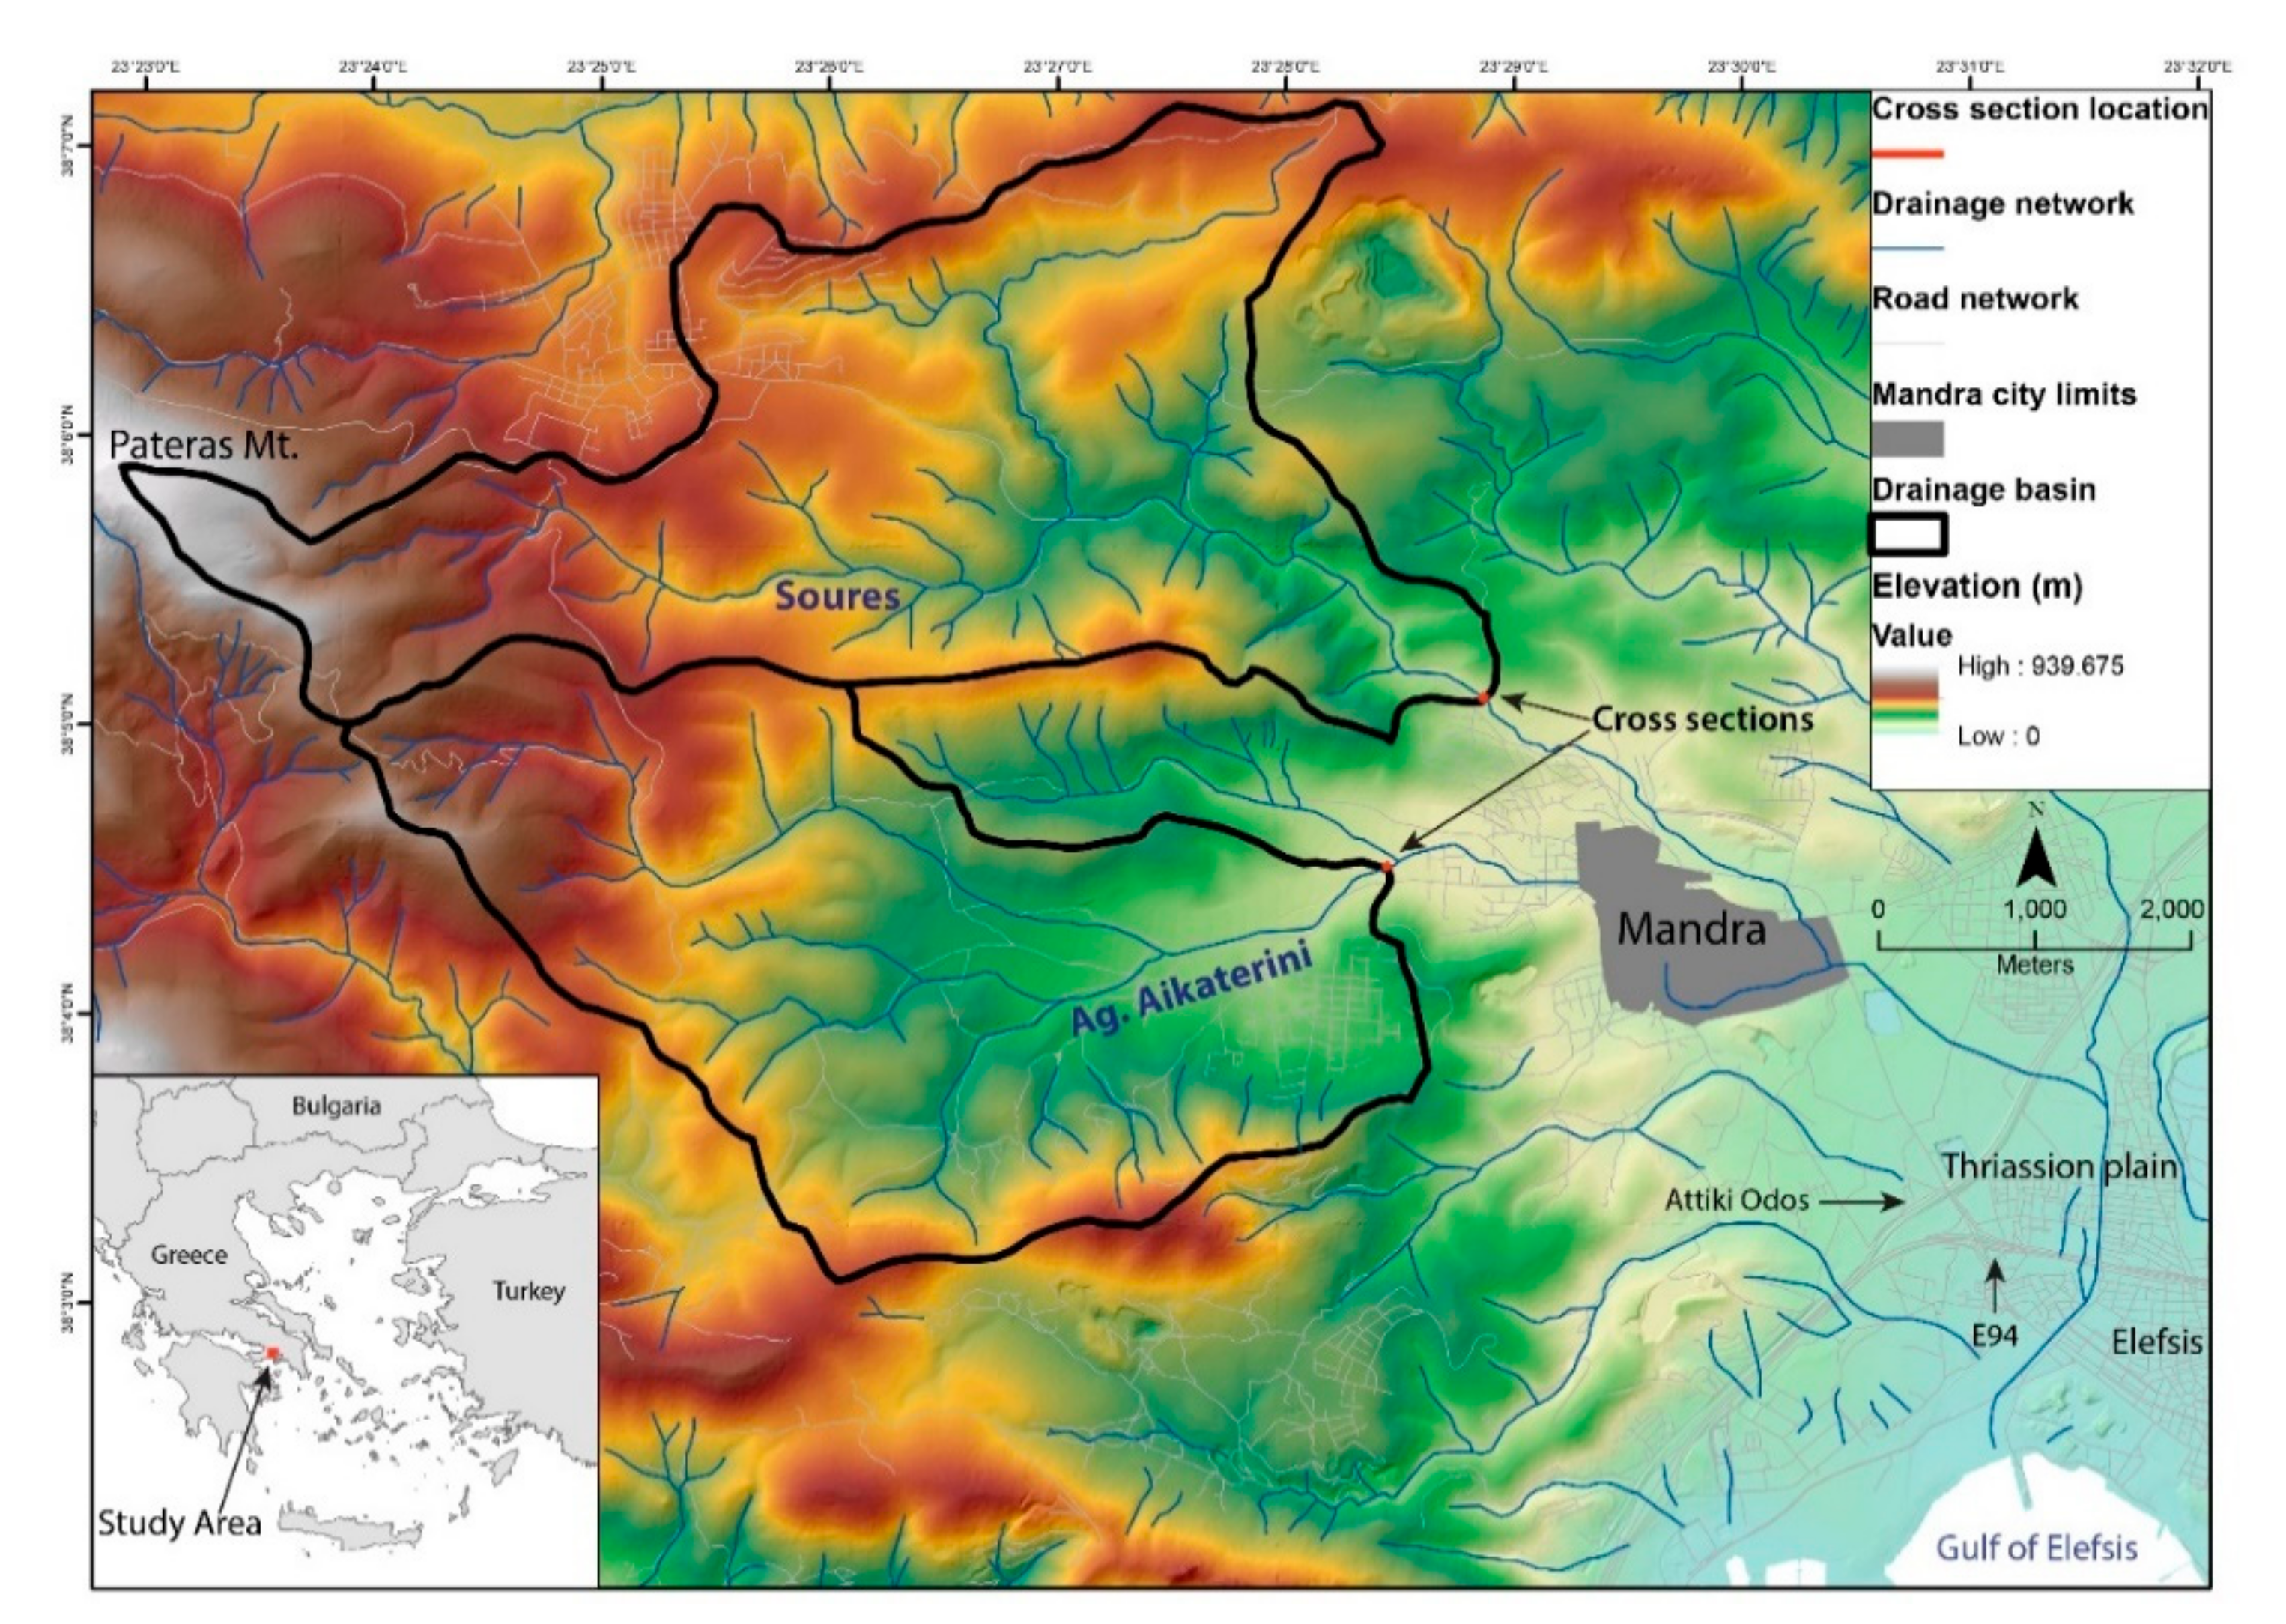
2. Study Area
The town of Mandra is located in the western part of Attica, in Greece and on the western border of Thriassion plain. Mandra is built on a small alluvial fan, formed in the catchment of the Soures torrent and its most important tributary [Agia Aikaterini torrent], which merge on the eastern edge of the town (
Figure 1). At the location where they converge, Soures and Agia Aikaterini drain areas of 20.4 km
2 and 22.8 km
2 respectively. The local drainage network has little or no water at all for most of the year and drains the eastern slopes of Pateras Mt. foothills, flowing eastward, towards the plain and then to the south towards the Gulf of Elefsis. At the outlet of the basin, Soures flows through the town of Elefsis. The towns and the broader area of the plain are host to critical socio-economic activities, industrial centers, and logistic hubs, as well as two essential motorways (Attiki Odos and E94), built approximately parallel to the coastline.
In terms of geomorphology, the area is dominated by moderate slopes around the western foothills and steeper relief in the upstream parts of the catchment. Thriassion plain and Mandra record at least five important flash flood events in the recent decades (1960-onwards) [
40] with substantial damages and at least two fatalities in 1996. Even though previous events had significant coverage from the press, there was only documentary information on their hydrologic and damage characteristics.
On 15 November 2017, Mandra was hit by a violent flash flood that ravaged through the town with catastrophic impacts on properties and infrastructure, tragically causing 24 deaths. The flood was triggered of a very intense storm exceeding 280 mm at its core, as it was captured by an X-band polarimetric radar (XPOL) of the National Observatory of Athens [
39] that reproduced radar-rainfall maps showing the spatiotemporal patterns of rainfall, in the absence of rain gages locally. XPOL rainfall estimates resulted from processes described by Kalogiros et al. [
41]. The storm started at 23:00 UTC on 14 November and ended at 12:00 UTC on the 15th with the most of the rainfall clustered between 01:00 and 07:00 UTC [
39].
Based on spatial patterns identified on radar-rainfall maps, the core of the storm appeared and stayed for several hours over the upstream part of the catchments of Soures and Agia Aikaterini, with a southwest-northeast longitudinal shape of roughly 4 km wide and 18 km long. Elefsis station intensity-duration-frequency curves indicated a return period of over 500 years for the rainfall amount accumulated in 8 h [
39].
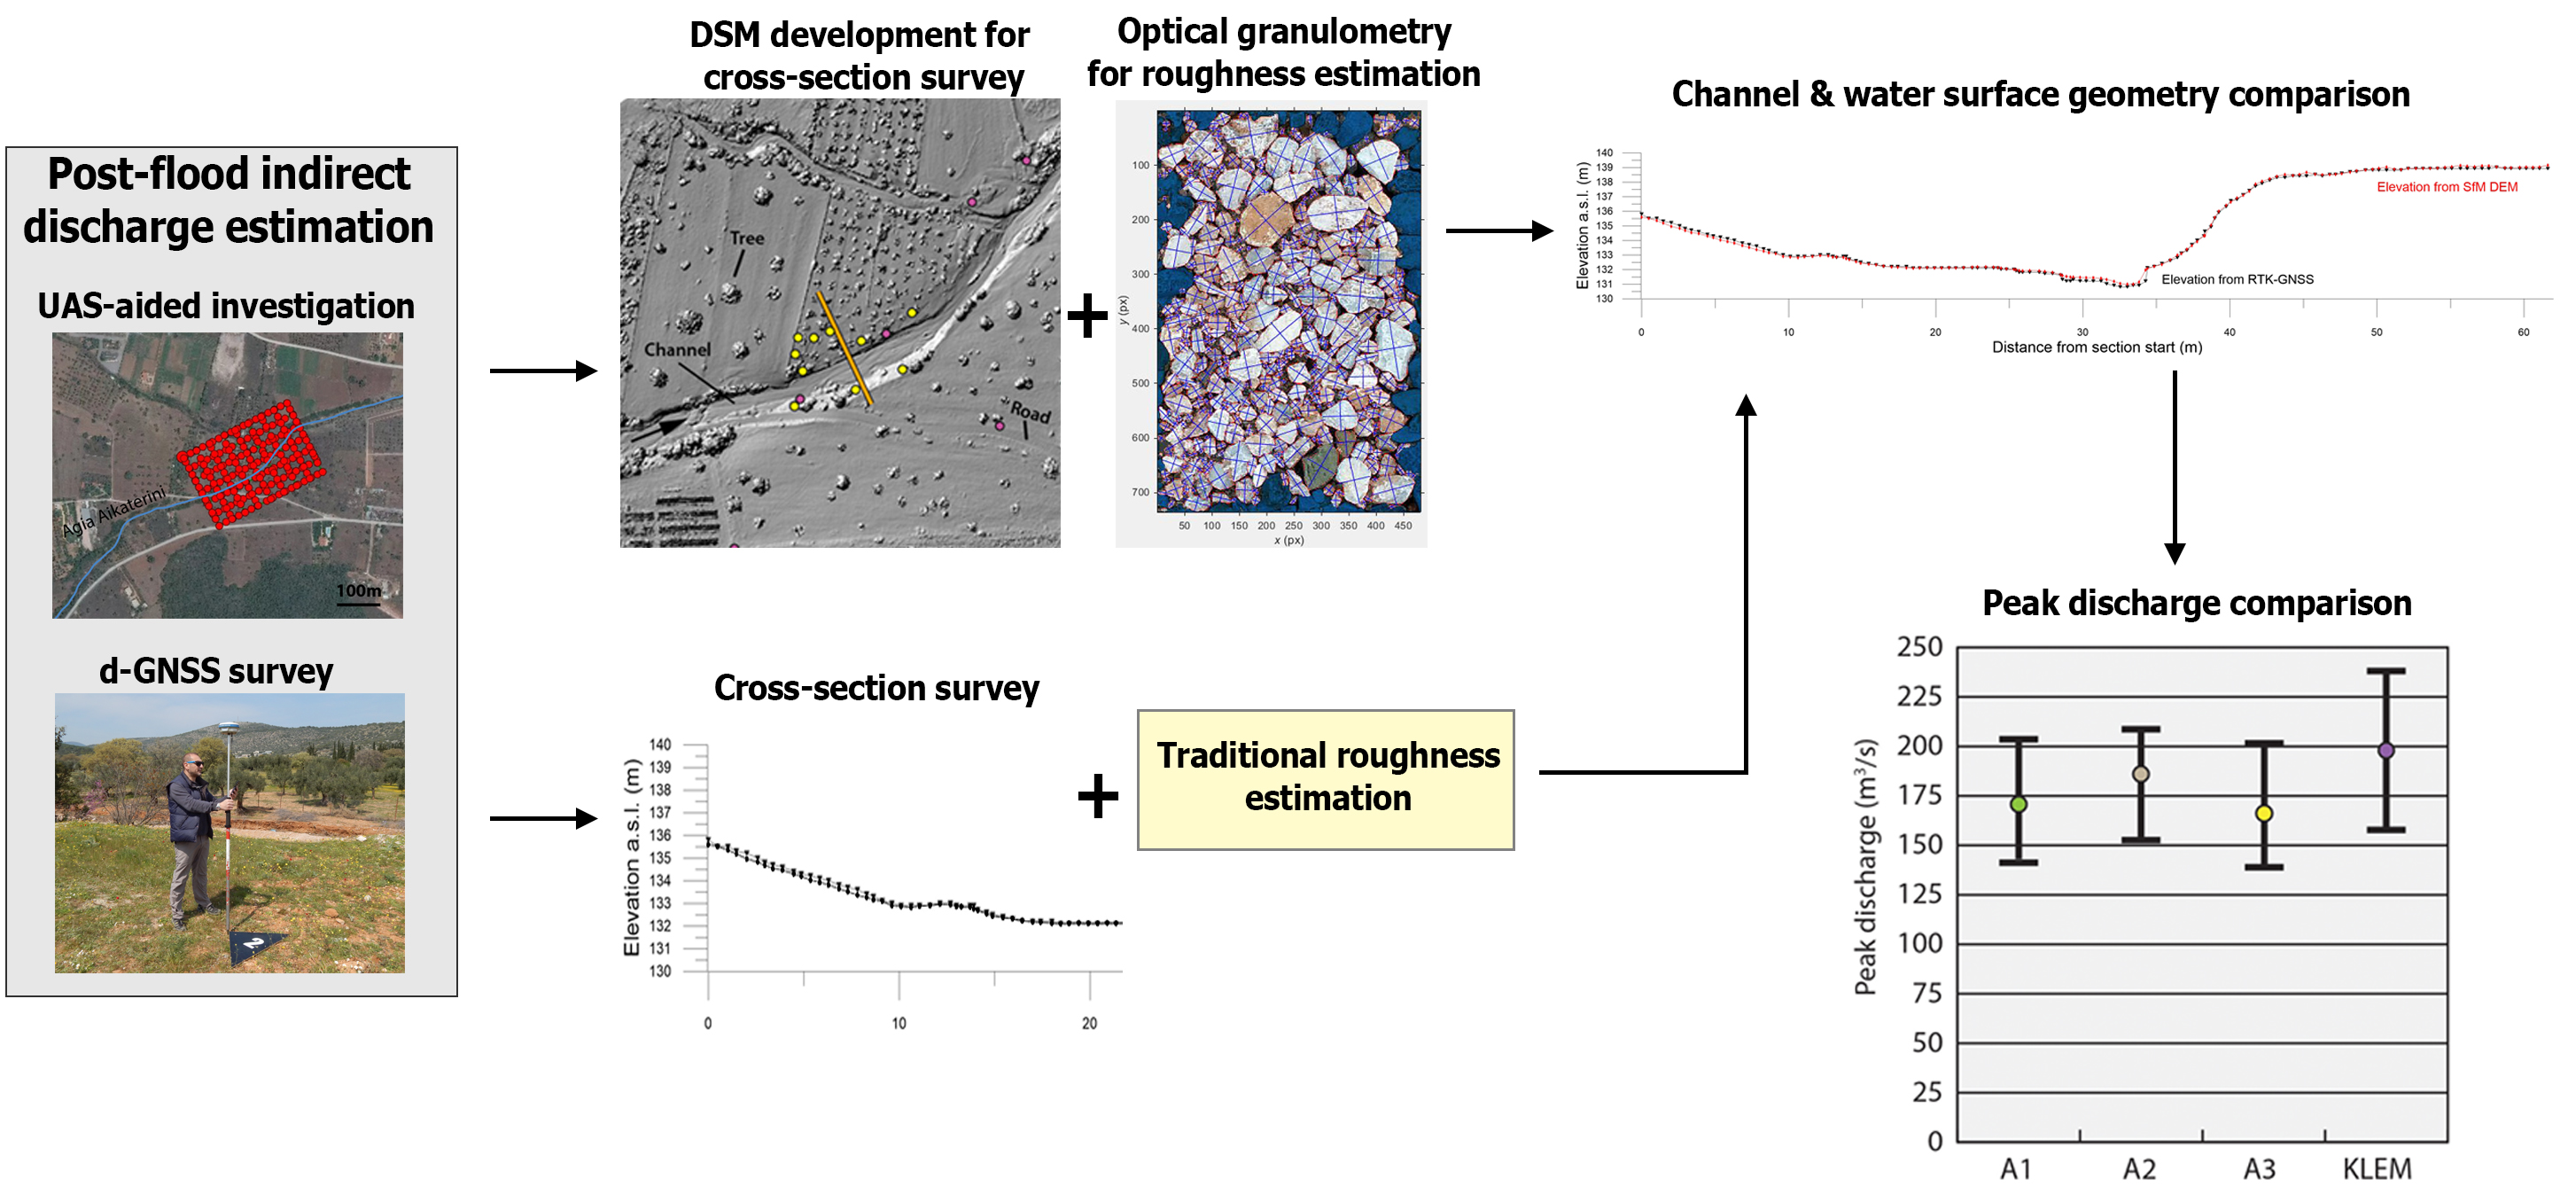
3. Methodology
The research team visited the area after the November 15th flood and selected general areas for discharge estimation close to the outlet of the two main tributaries of the catchment [Soures and Agia Aikaterini]. To estimate discharge, we used the slope-conveyance method [
20,
42] by applying the Gauckler—Manning formula, assuming uniform flow at the two reaches examined. The locations were selected in a way that they would be suitable for indirect estimates using the manning formula from a hydraulic point of view, including stable channel geometries and minimum erosion phenomena (
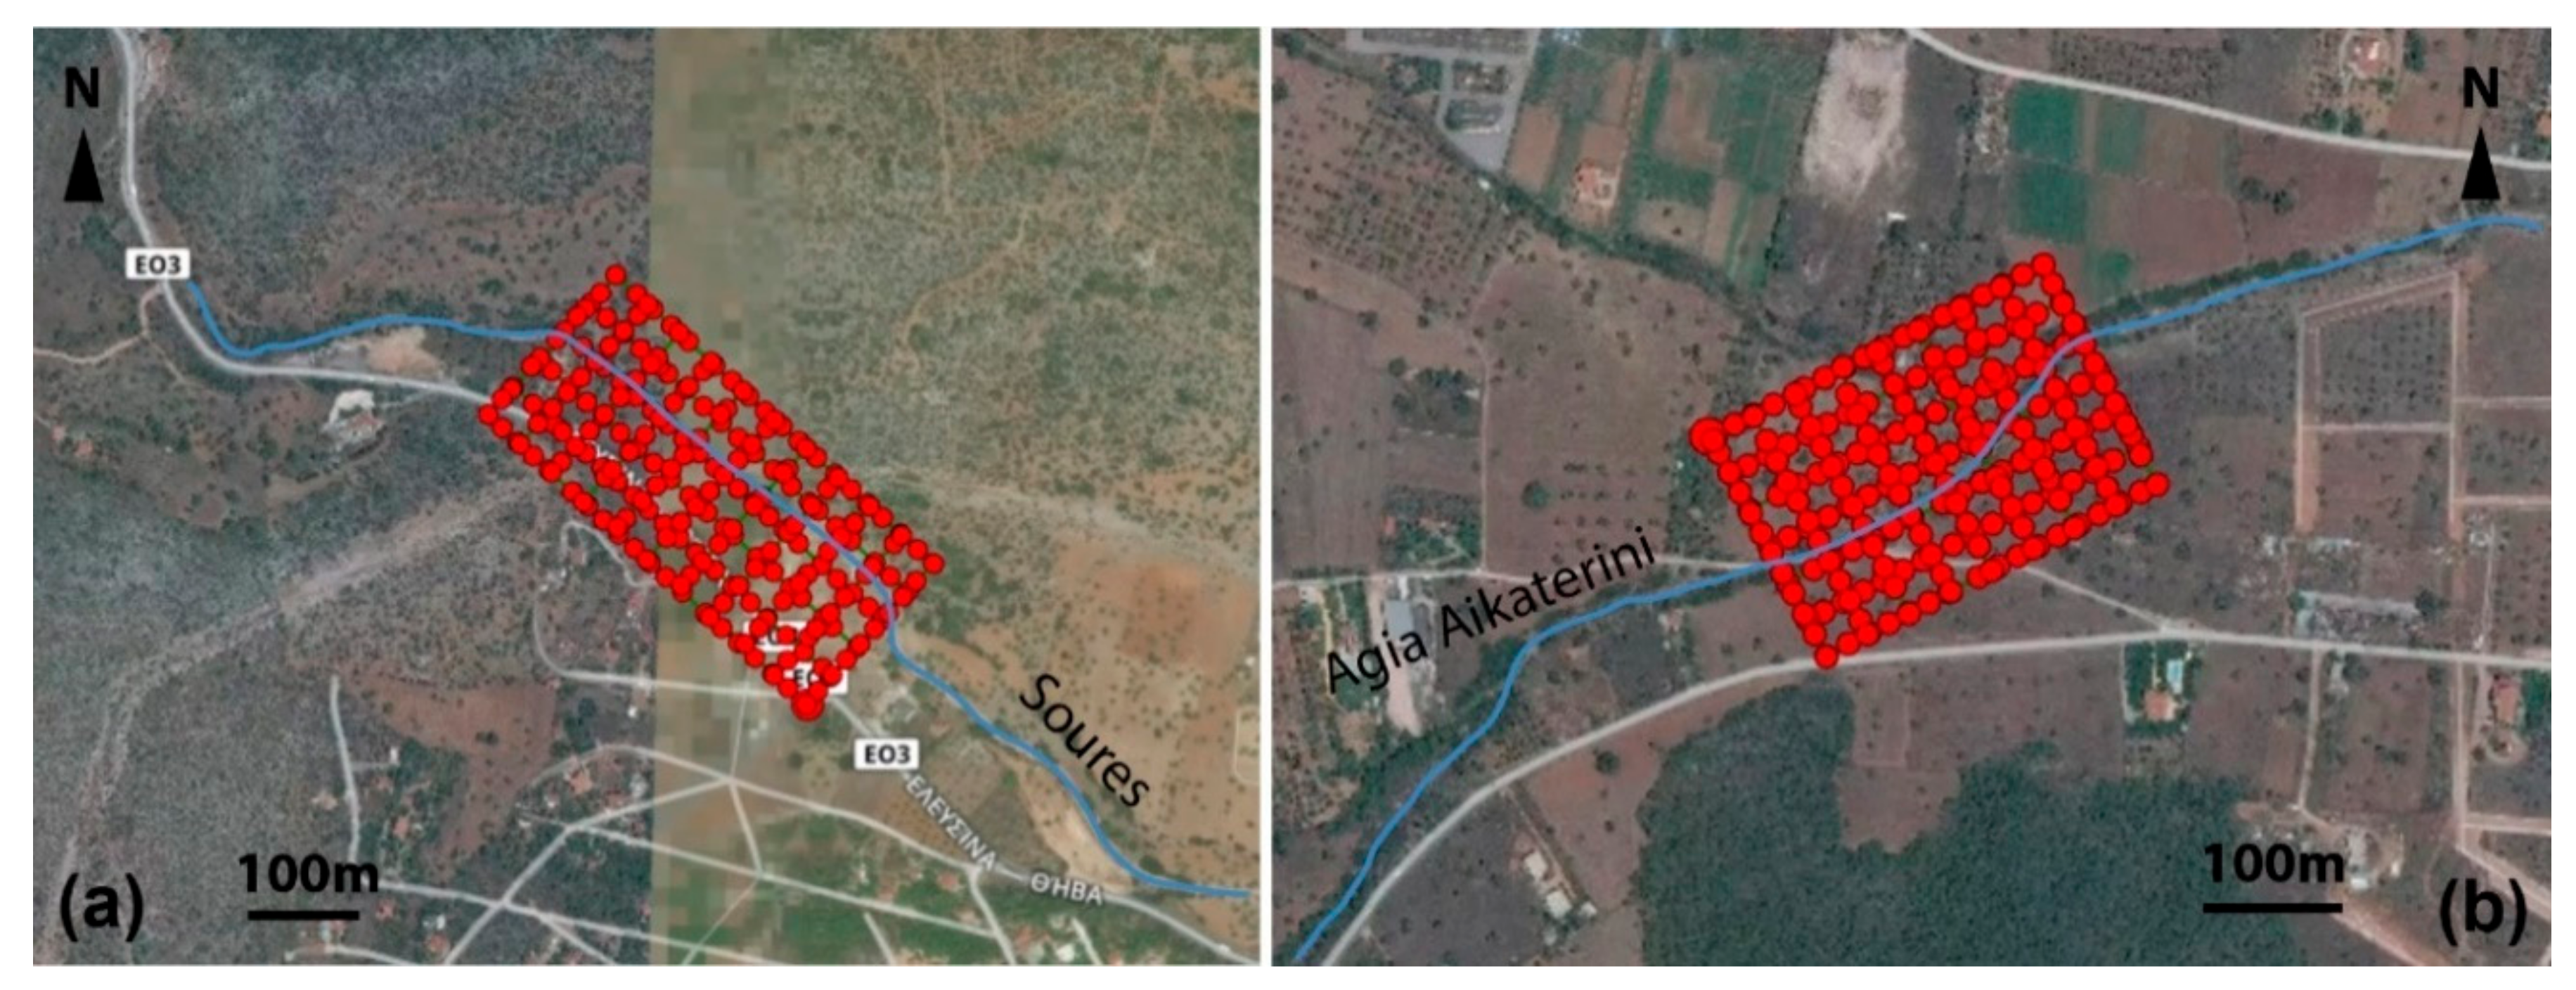
Figure 1). During fieldwork, which took place two days after the flood event, a handful of possible cross-sections were identified and included in the survey; however, the final cross-sections were selected after careful post-processing of all the fieldwork data.
3.1. UAS Flights Description and Data Collection
The research team used a commercial UAS (namely a quadcopter DJI Phantom 4 Pro) with a 30-min flight time limit. The DJI GO 4 Pro application, on an Apple iPad Pro was used for flight control, while the vehicle’s 1″ CMOS camera captured 20-megapixel photos.
The flights were planned and executed in a way that they covered the reaches to be modelled, spreading downstream and upstream from the locations of the possible cross-sections. At these locations we calculated the upstream area of Soures and Agia Aikaterini at 17.01 km
2 and 15.5 km
2 respectively. In the case of Soures, one (1) flight was executed at 85 m altitude, capturing multiple photos from a 526 m by 300 m area. In the case of Agia Aikaterini, the flight plan was executed in one flight at 75 m of altitude, covering a 390 m by 310 m area with multiple shots (
Figure 2).
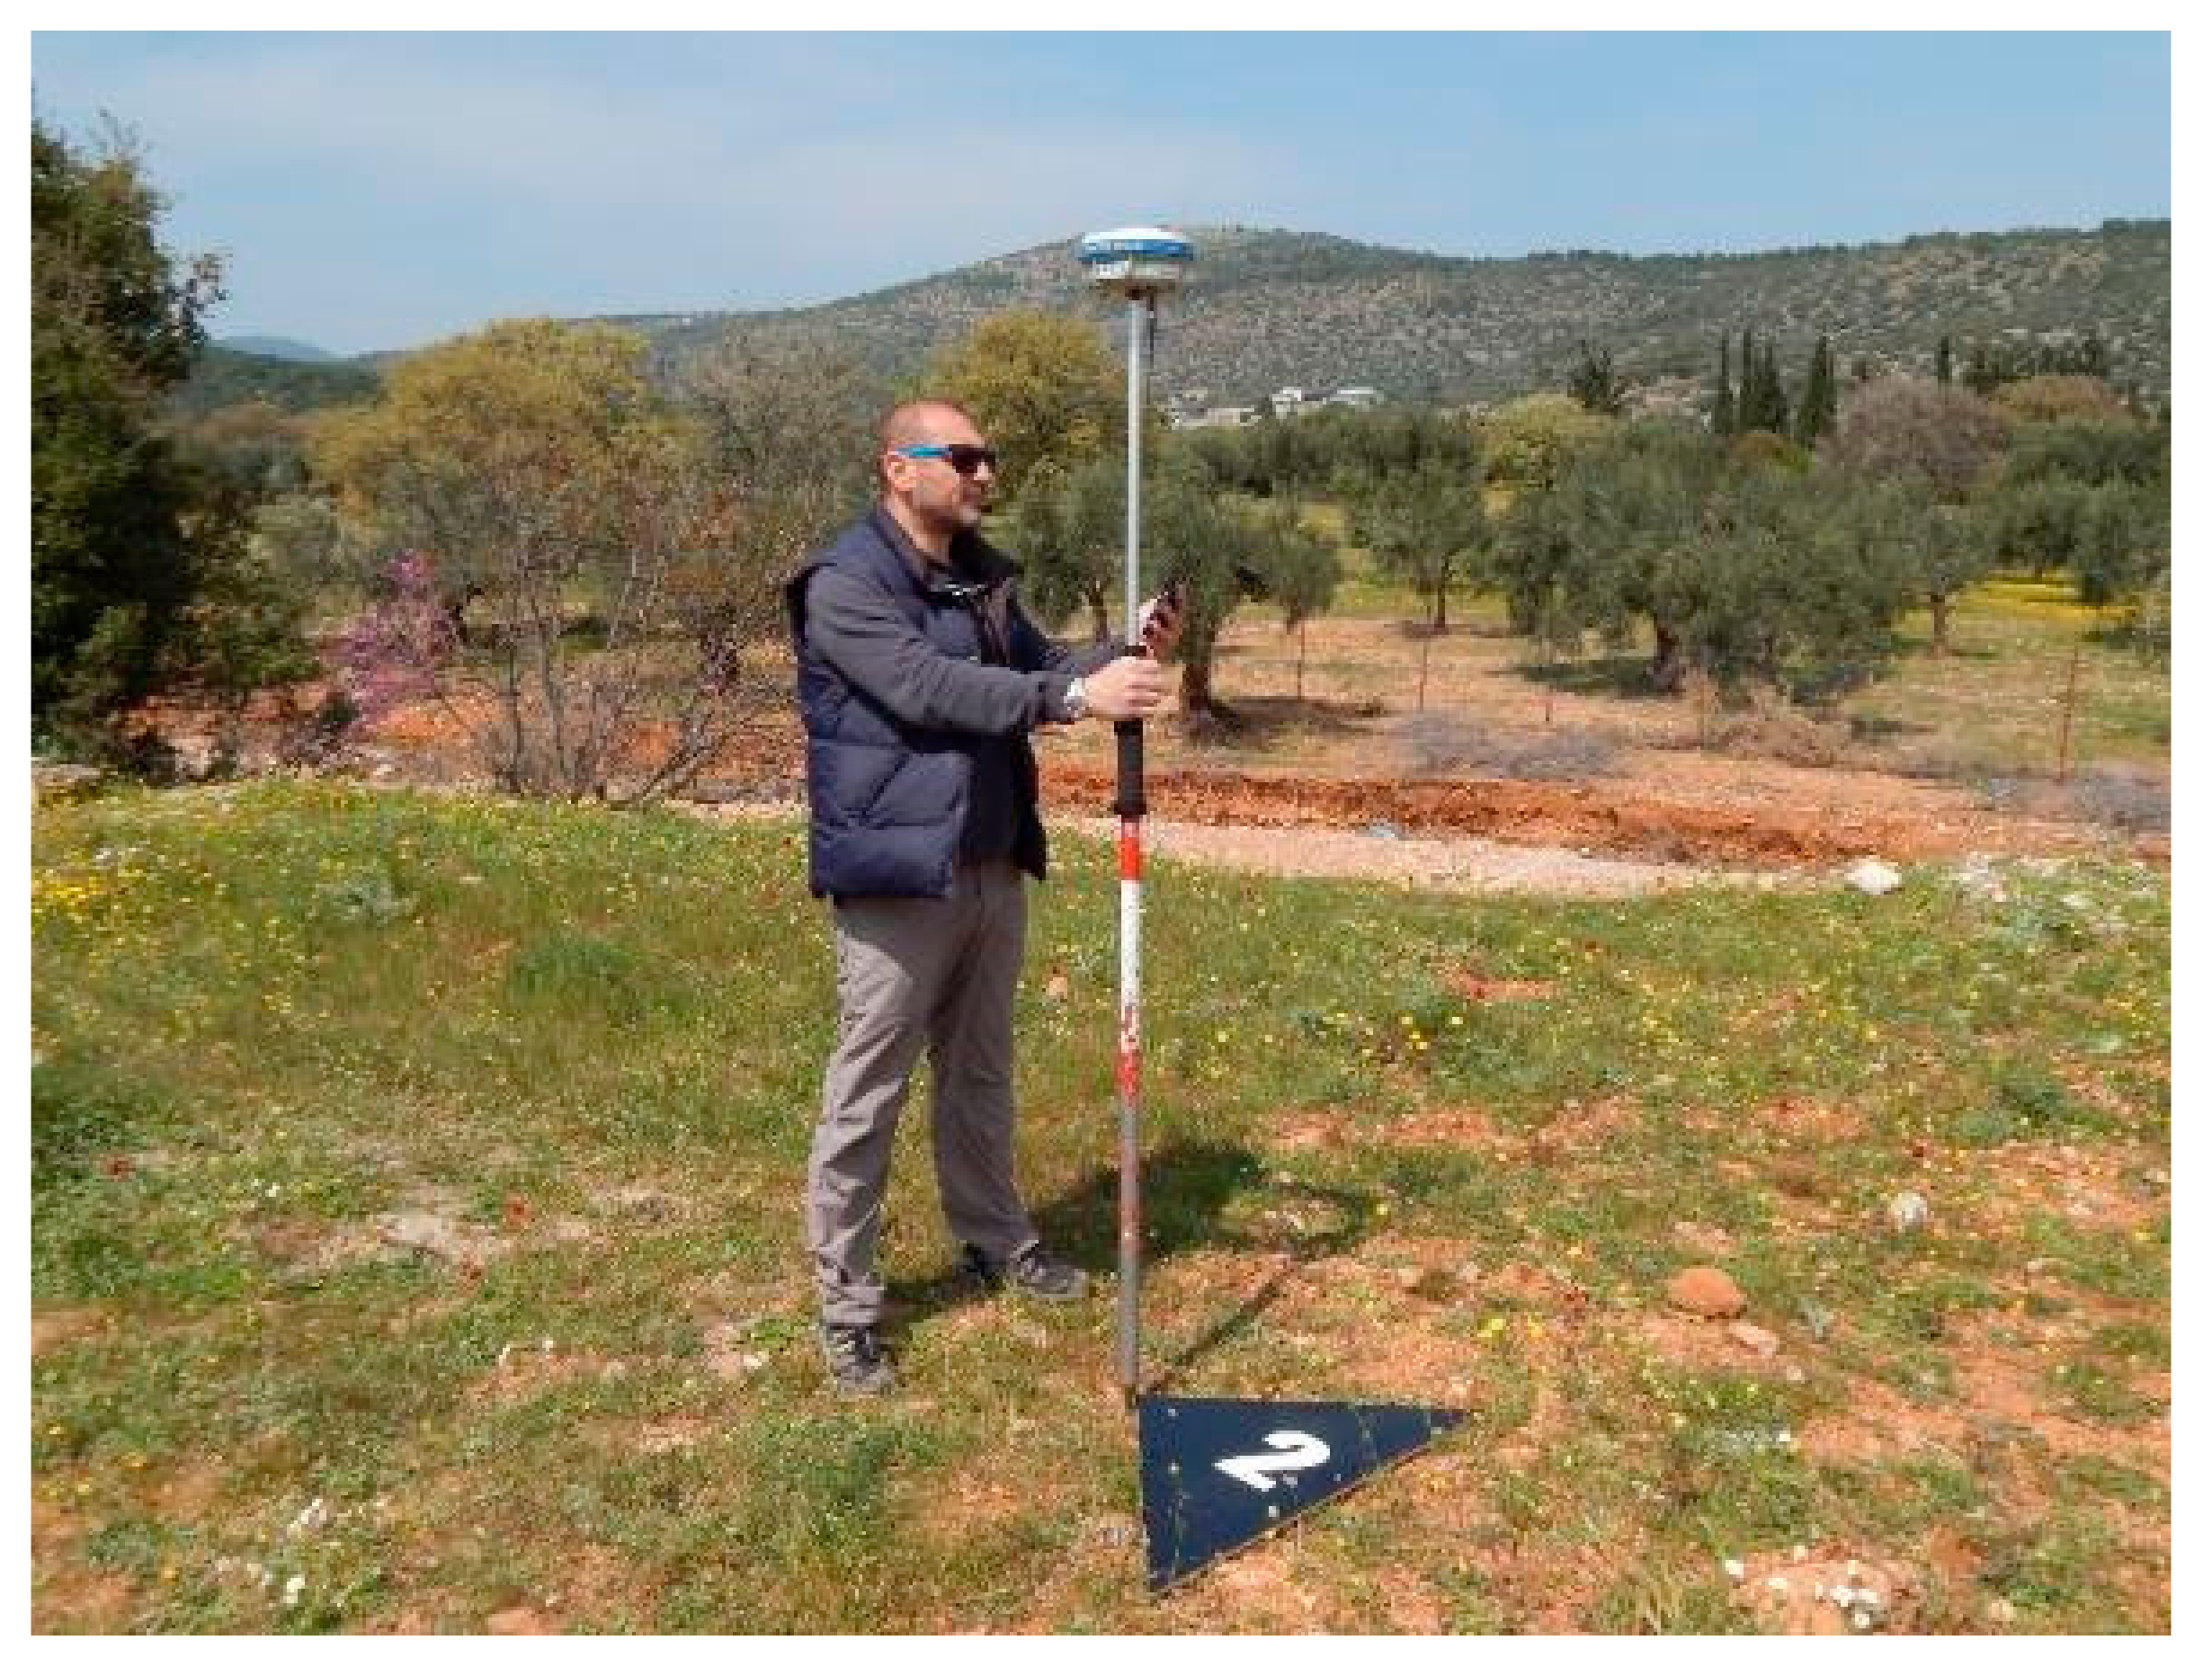
Seven (7) ground control points (hereafter GCPs) were positioned by the research team at Soures and nine (9) at Agia Aikaterini, within each of the rectangle-shaped areas defined by the two flight plans (i.e., 16 in total). The GCPs coordinates were measured using a dual-frequency geodetic receiver Hi-Target iRTK5 fixed on a two-meter-high pole, with 1 Hz interval observation rate. This Real Time Kinematics—Global Navigation Satellite System (RTK-GNSS) equipment used the Network method solution after the real-time HxGN SmartNet of Greece positioning service (
https://www.metrica.gr/smartnet-greece), for extracting highly accurate coordinates (x, y, z) for each location (
Figure 3) [
43]. The GCPs were placed with a balanced spatial distribution within the above area, and their coordinates were used as markers during the photogrammetric processing. After the final products of ortho-photo-mosaic and DSM generation, we re-measured the GCPs coordinates on the screen and used them for geospatial verification [
44].
The software package Pix4D [
45,
46] was used for image processing and production of orthomosaics and DSMs from the georeferenced point cloud. The camera line of sight was continuously at 60° degrees towards the ground, and the oblique images were acquired on constant intervals in x and y axes, in order to ensure full coverage over different angles on both directions (NW-SE and NE-SW, at both areas, see
Figure 2), to ensure that all sides of the riverbanks are included in the photographs. This resulted in a dataset of 228 images for Soures, and 226 images for Agia Aikaterini reaches, with at least 75% overlap, that led to the production of ortho-photomosaics with spatial resolutions of 0.030 m and 0.027 m, respectively. The 16 GCPs were also introduced in Pix4D and were manually identified in the images. The image data series was then photogrammetrically processed in order to be aligned, before creating a sparse point cloud, then a dense point cloud, and finally, a mesh for the entire study areas. The model was then georeferenced to the Greek Datum (GGRS ’87), based on the GCPs, in order to create DEMs and orthomosaics for both reaches.
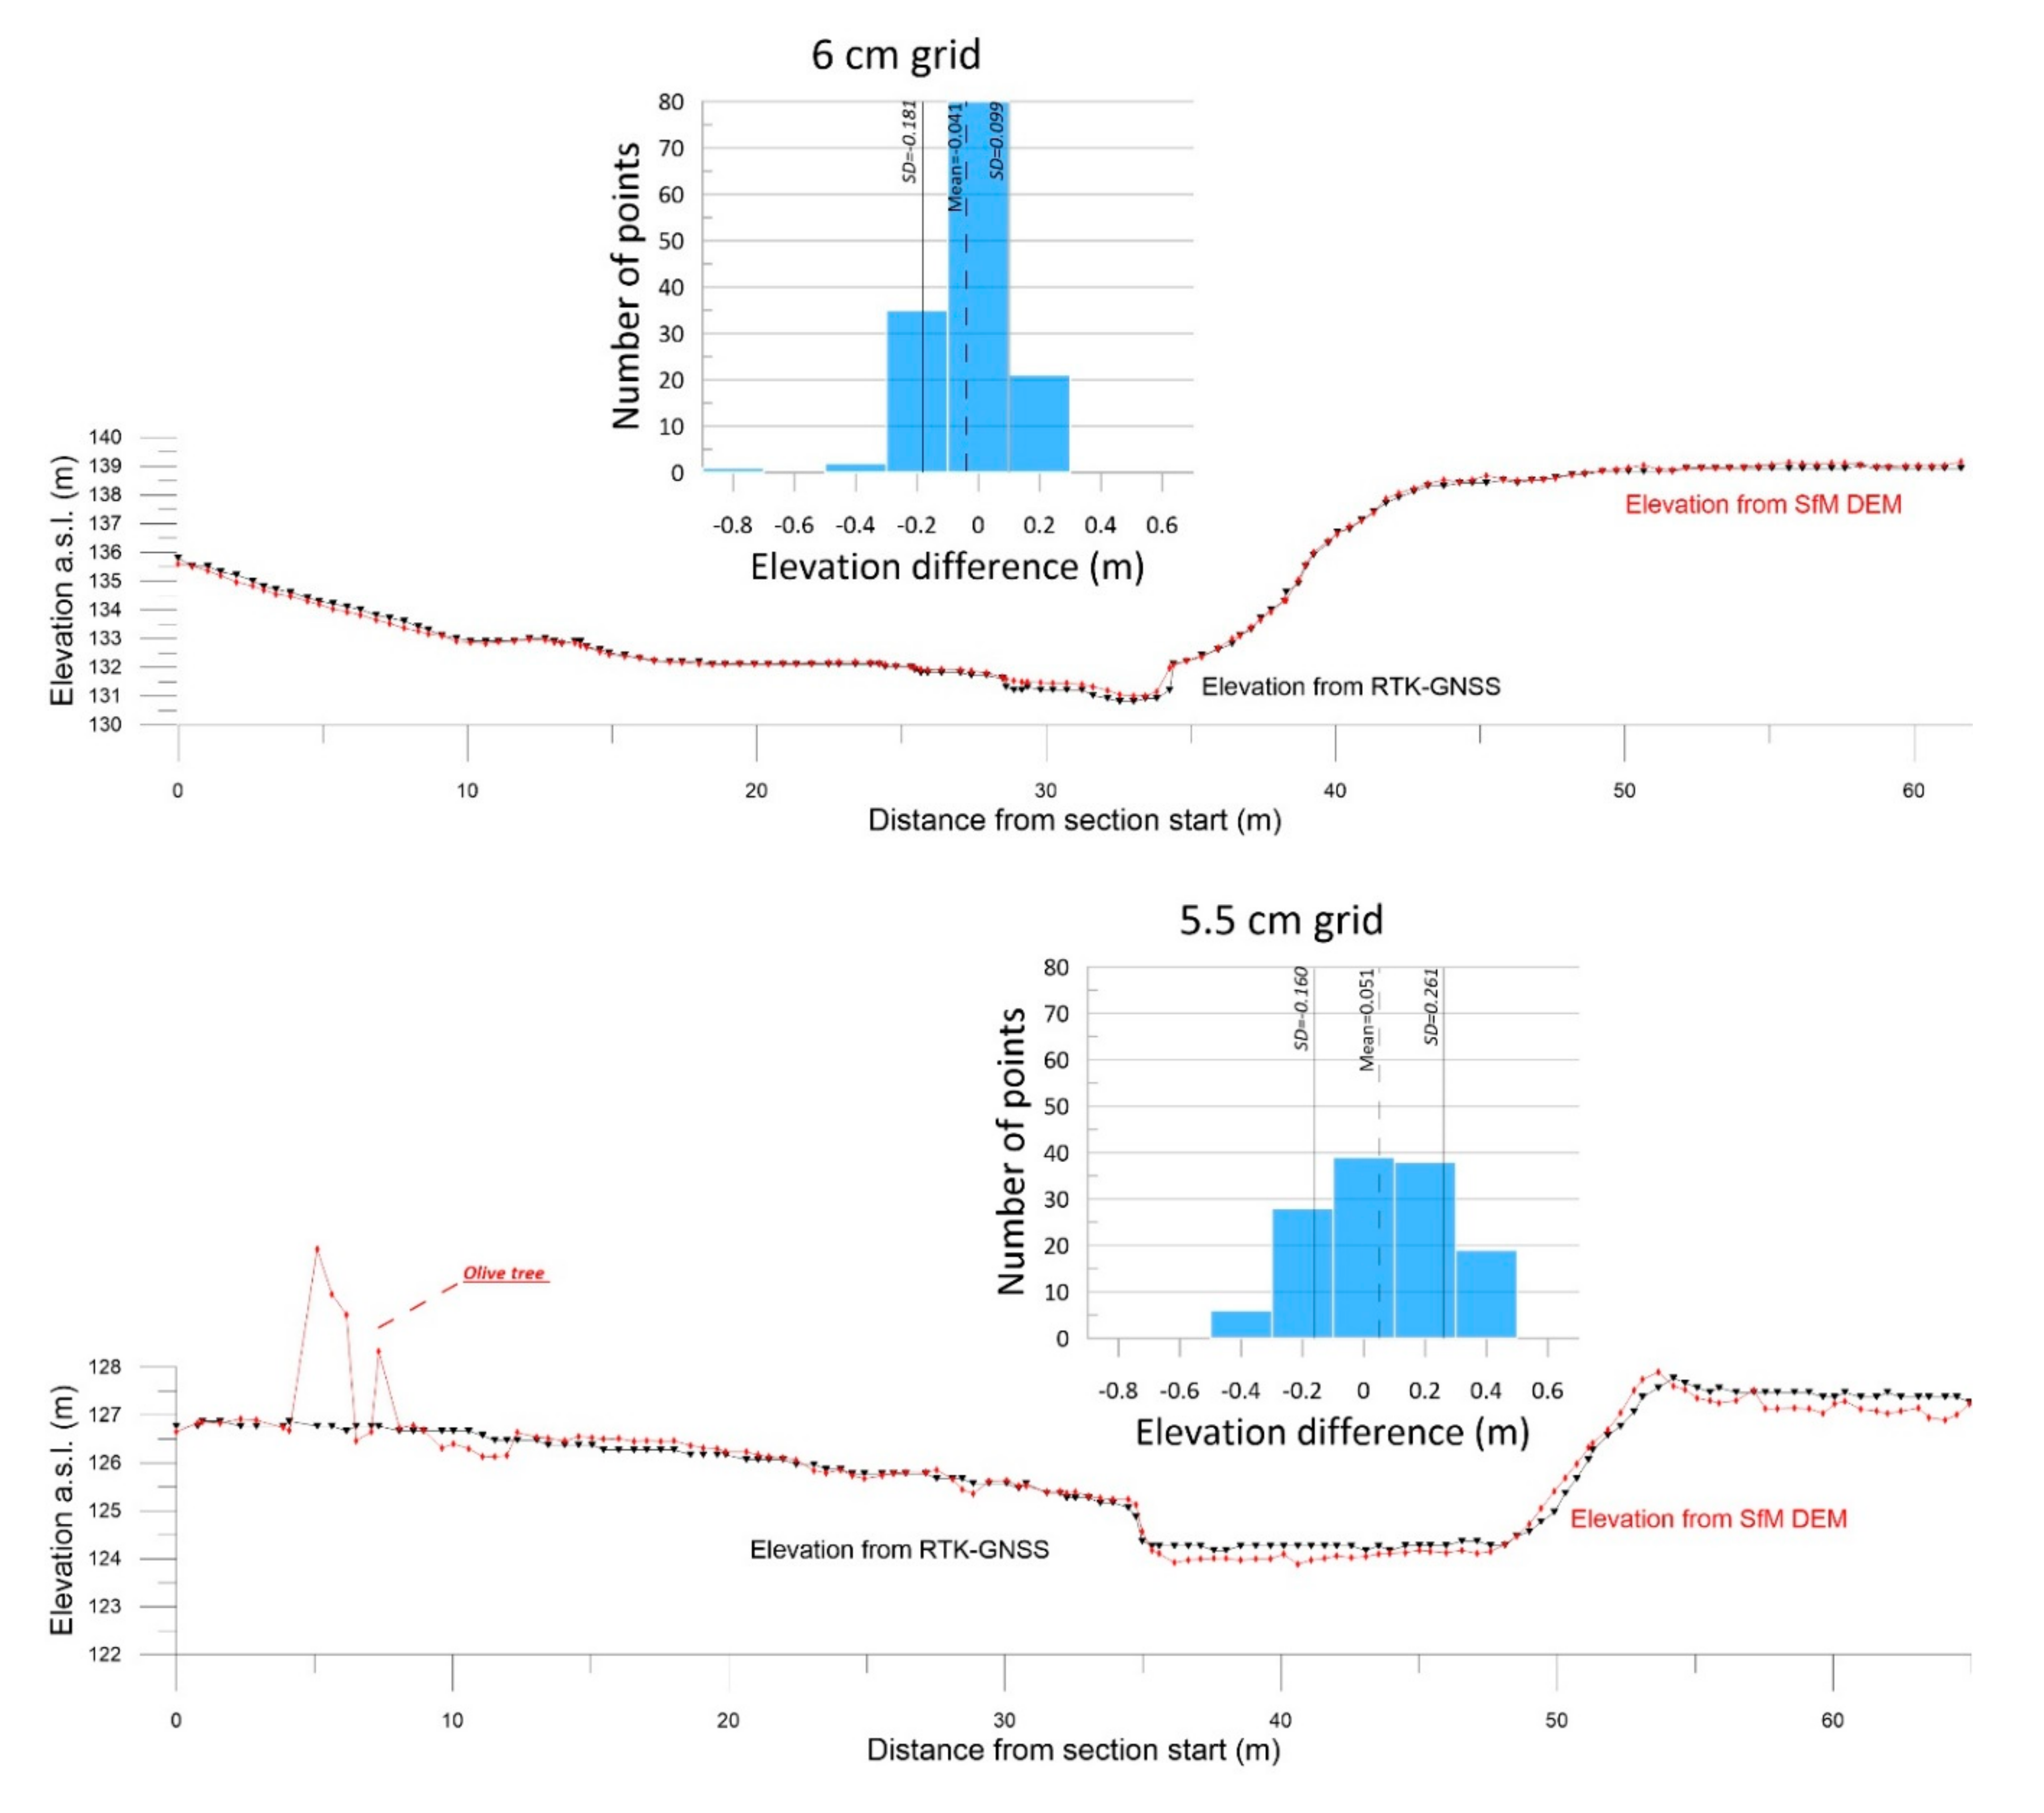
Residual geo-referencing errors were calculated for the GCPs established at both areas, which were used within the photogrammetric procedure, by comparing each GCP measured location and their estimated x,y,z coordinates (
Table 1). Following Javernick et al. [
47] we assessed point-cloud quality by summarizing residual errors, for each reach, over the GCPs using four indicators: (i) the mean error (ME; a measure of accuracy), where positive errors indicated the point cloud had larger value than the GNSS-measured point; (ii) mean absolute error (MAE, the mean of absolute errors); (iii) root mean squared error (RMSE); and (iv) the standard deviation (SD). It has to be noted that the number and the spatial distribution of GCPs were subject to constraints that are present during a field survey in a disaster zone immediately after a flood (such as safety, accessibility) and fit the opportunistic nature of post-flood data collection, acknowledged also in previous studies [
35]. Nevertheless, we kept the standards of previously published studies [
34,
35,
36] in terms of density of GCPs per studied area (5〓6 GCPs/hectare) and in DSM precision in relative terms [the ratio of RMSE to ground sampling distance was found to be 2 and 5.7 in Agia Aikaterini and Soures respectively] [
48].
3.2. d-GNSS Survey
As mentioned above, we used the GCPs for each of the two reaches (7 and 9, respectively) ideally spread at different elevations throughout the entire area of interest, which were measured with high precision RTK-GNSS equipment to maximize accuracy.
Additionally, we used the same equipment for acquiring high accuracy surface points along two topographic cross-sections, at selected sites, normal to the regular flow of both the streams under investigation. Measurements were recorded every 30–50 cm in order to provide a comparative geometry to the cross-sections extracted from the photogrammetric processing.
All measurements [GCPs and cross-section points] proved to be very accurate as the receiver quality was mainly at FIX status, allowing to capture each point within the range of 1–2 cm at the horizontal plane and 2–3 cm in elevation [
49].
3.3. High-Water Marks
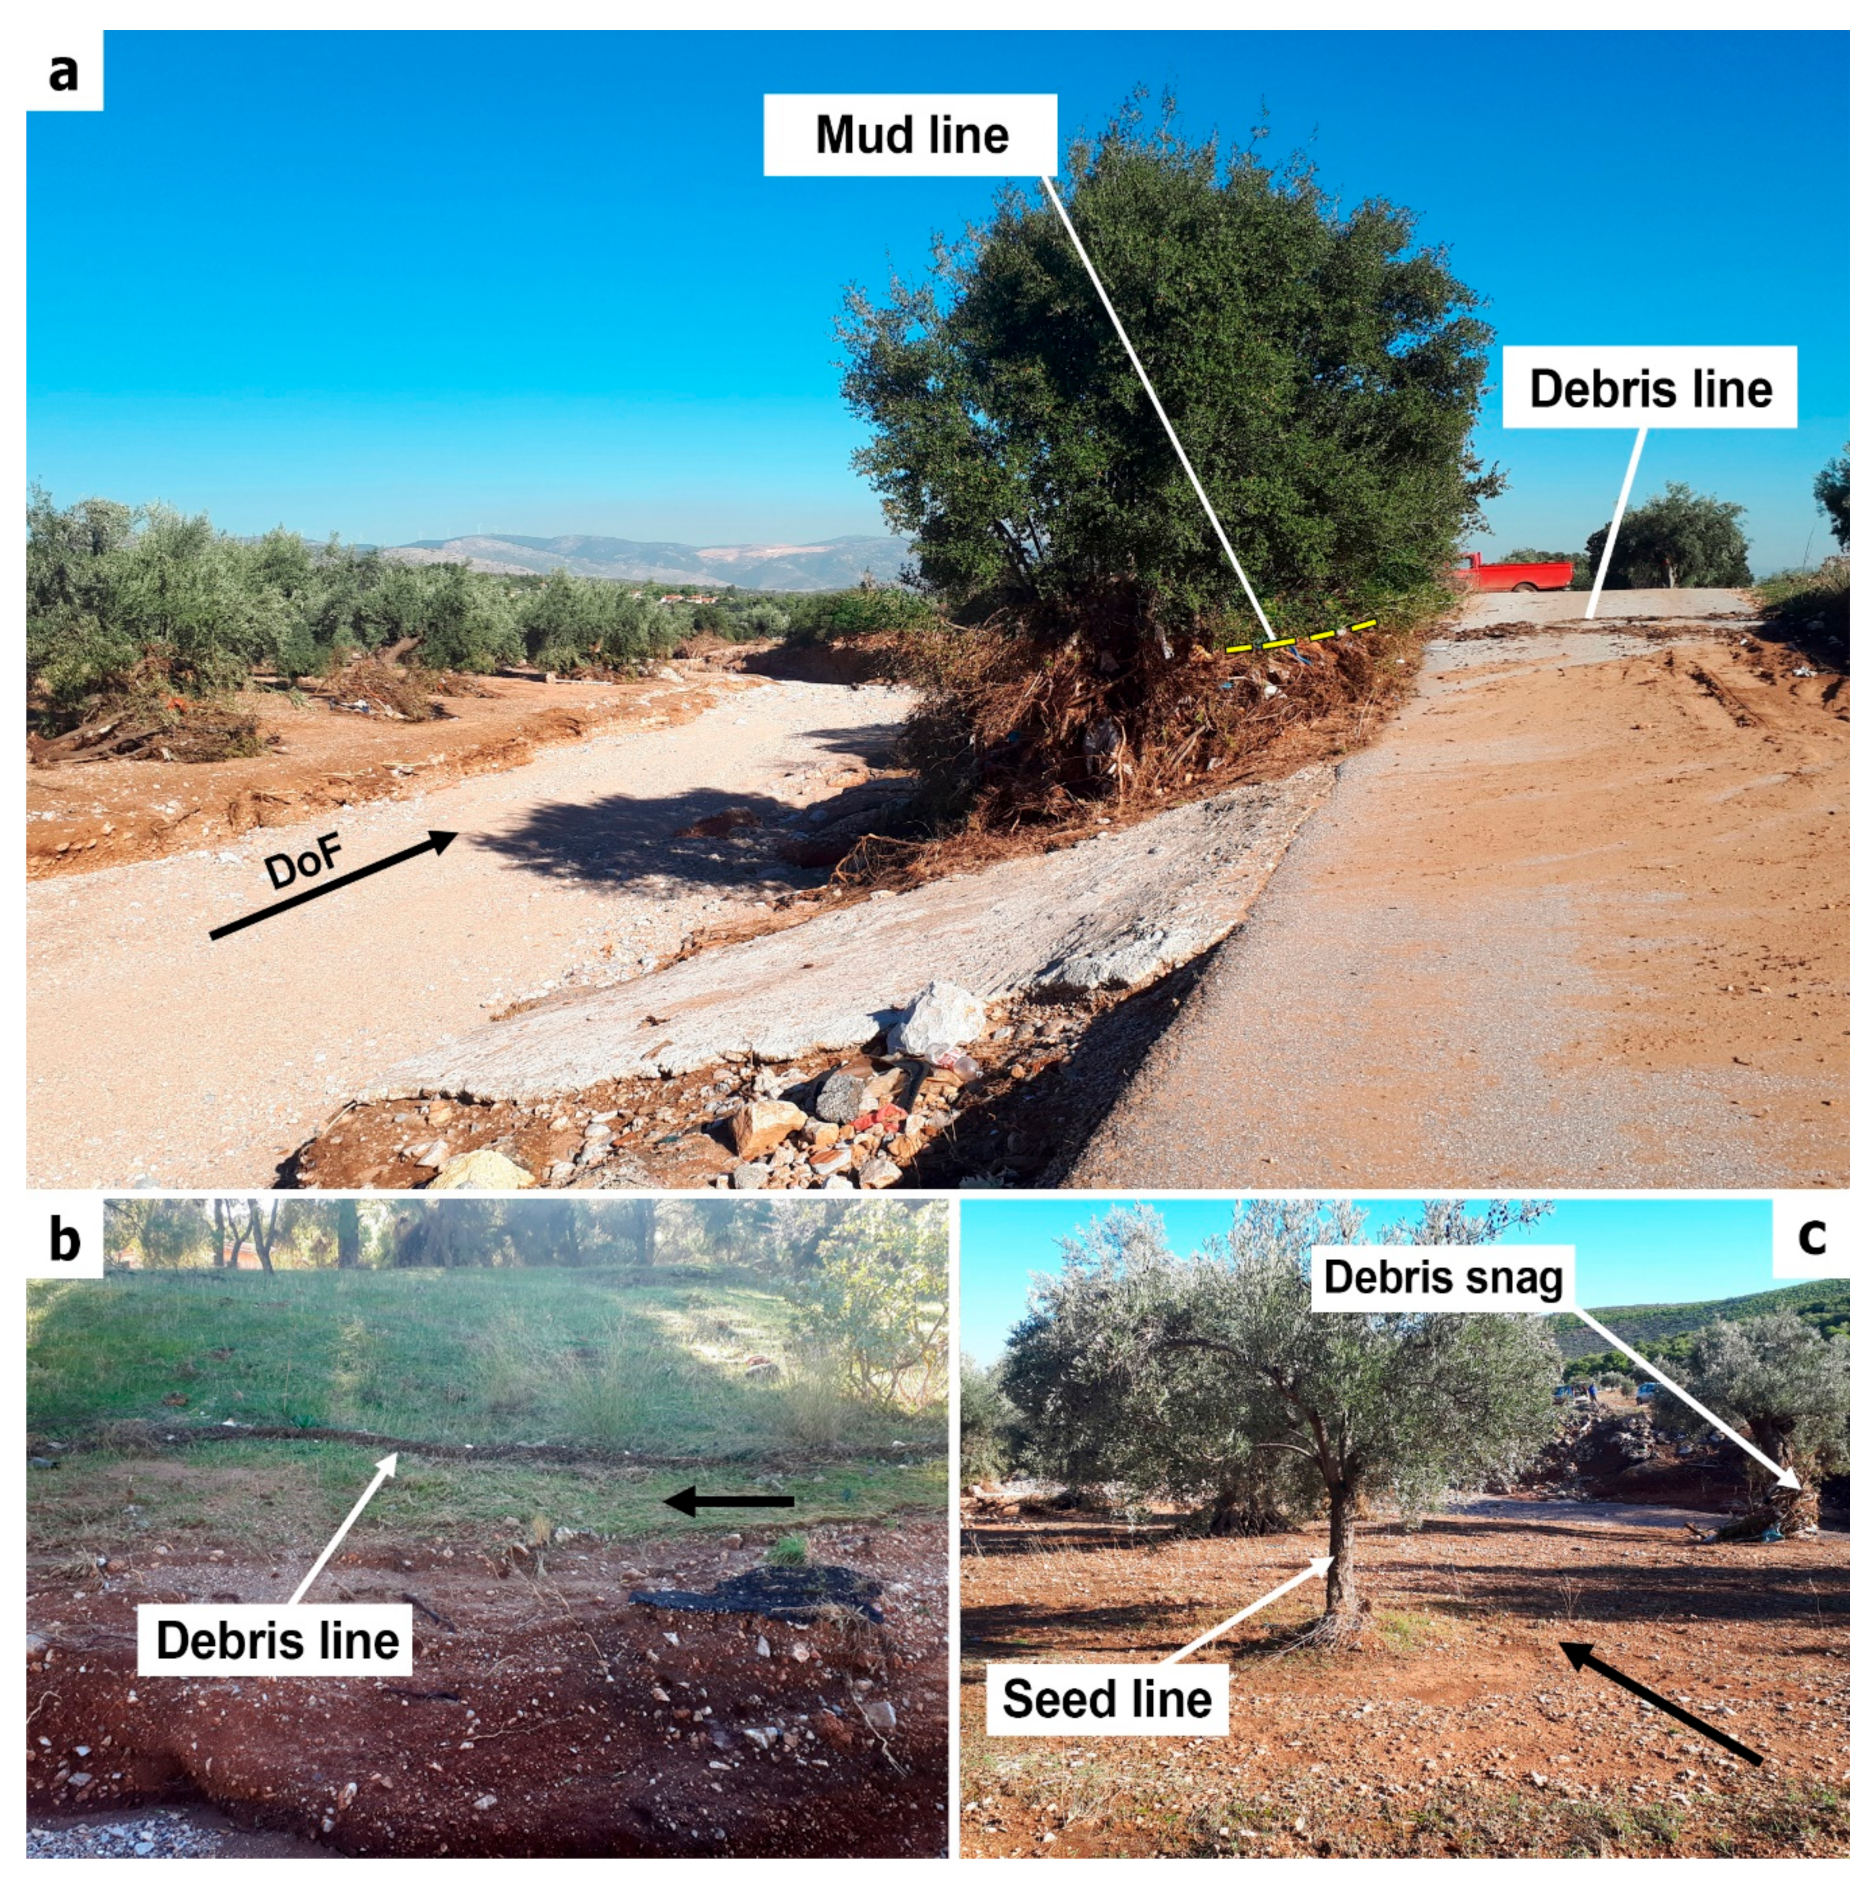
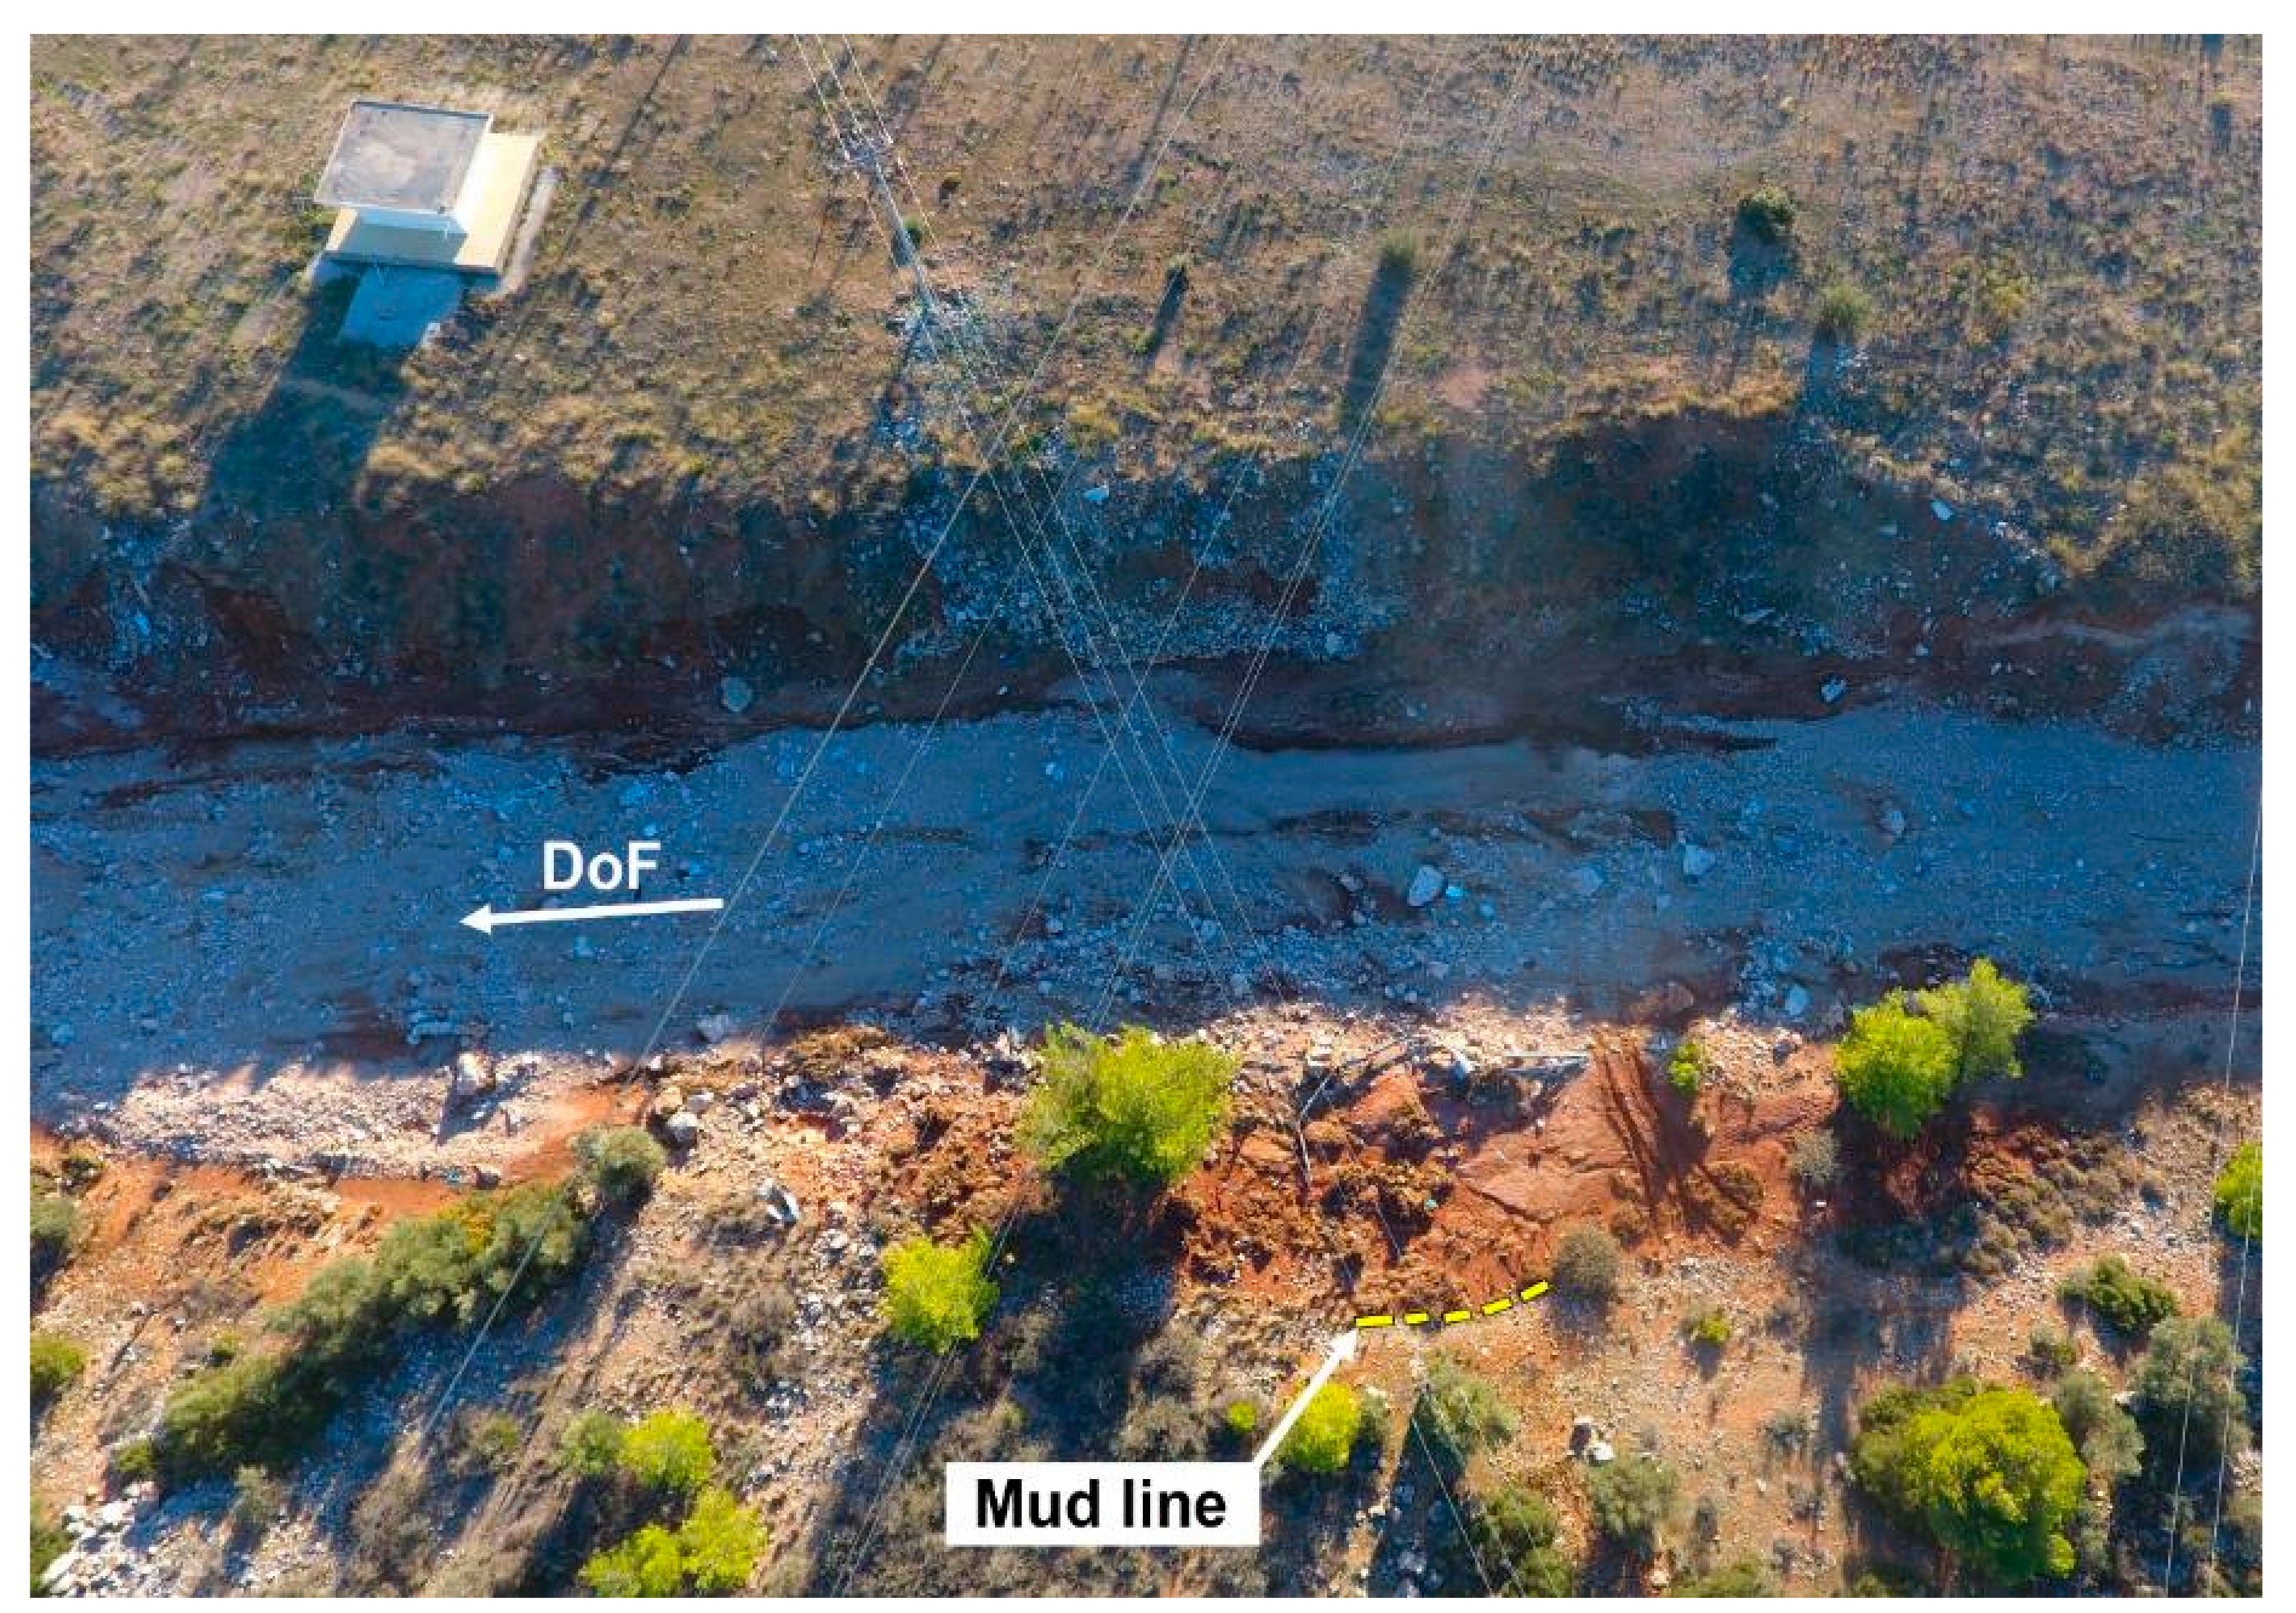
The maximum water level indicating peak discharge was measured at various locations within the reaches studied. High water marks (HWMs) identified included pine straw and leaves stuck on river banks and on the floodplain, seed, debris, and wash lines on the floodplain and on river banks, and debris snags on vegetation [mostly on the downstream side of tree trunks] as well as lines of dried mud as described in Koenig et al. [
50] (2016). Some of these elements are shown in
Figure 4.
Specific care was taken to avoid water marks that were unreliable or not representative of the maximum water stage. Examples of this category included HWMs on potentially bent shrubs and potentially movable hanging branches and HWMs formed by run-up or wave action of floodwaters. HWMs were also identified in the aerial images and were incorporated into the analysis once the images were georeferenced (
Figure 5).
3.4. Channel and Water Surface Geometry
Using UAS imagery and the SfM technique, two detailed DSMs were created at these two locations. The resolution obtained for the DSMs was 3.0 cm and 2.7 cm for Soures and Agia Aikaterini respectively, given the selected flights’ altitude.
The DSMs were used to extract and inspect detailed channel geometry and cross-sections that were in turn used to calculate the cross-sectional area and the wetted perimeter.
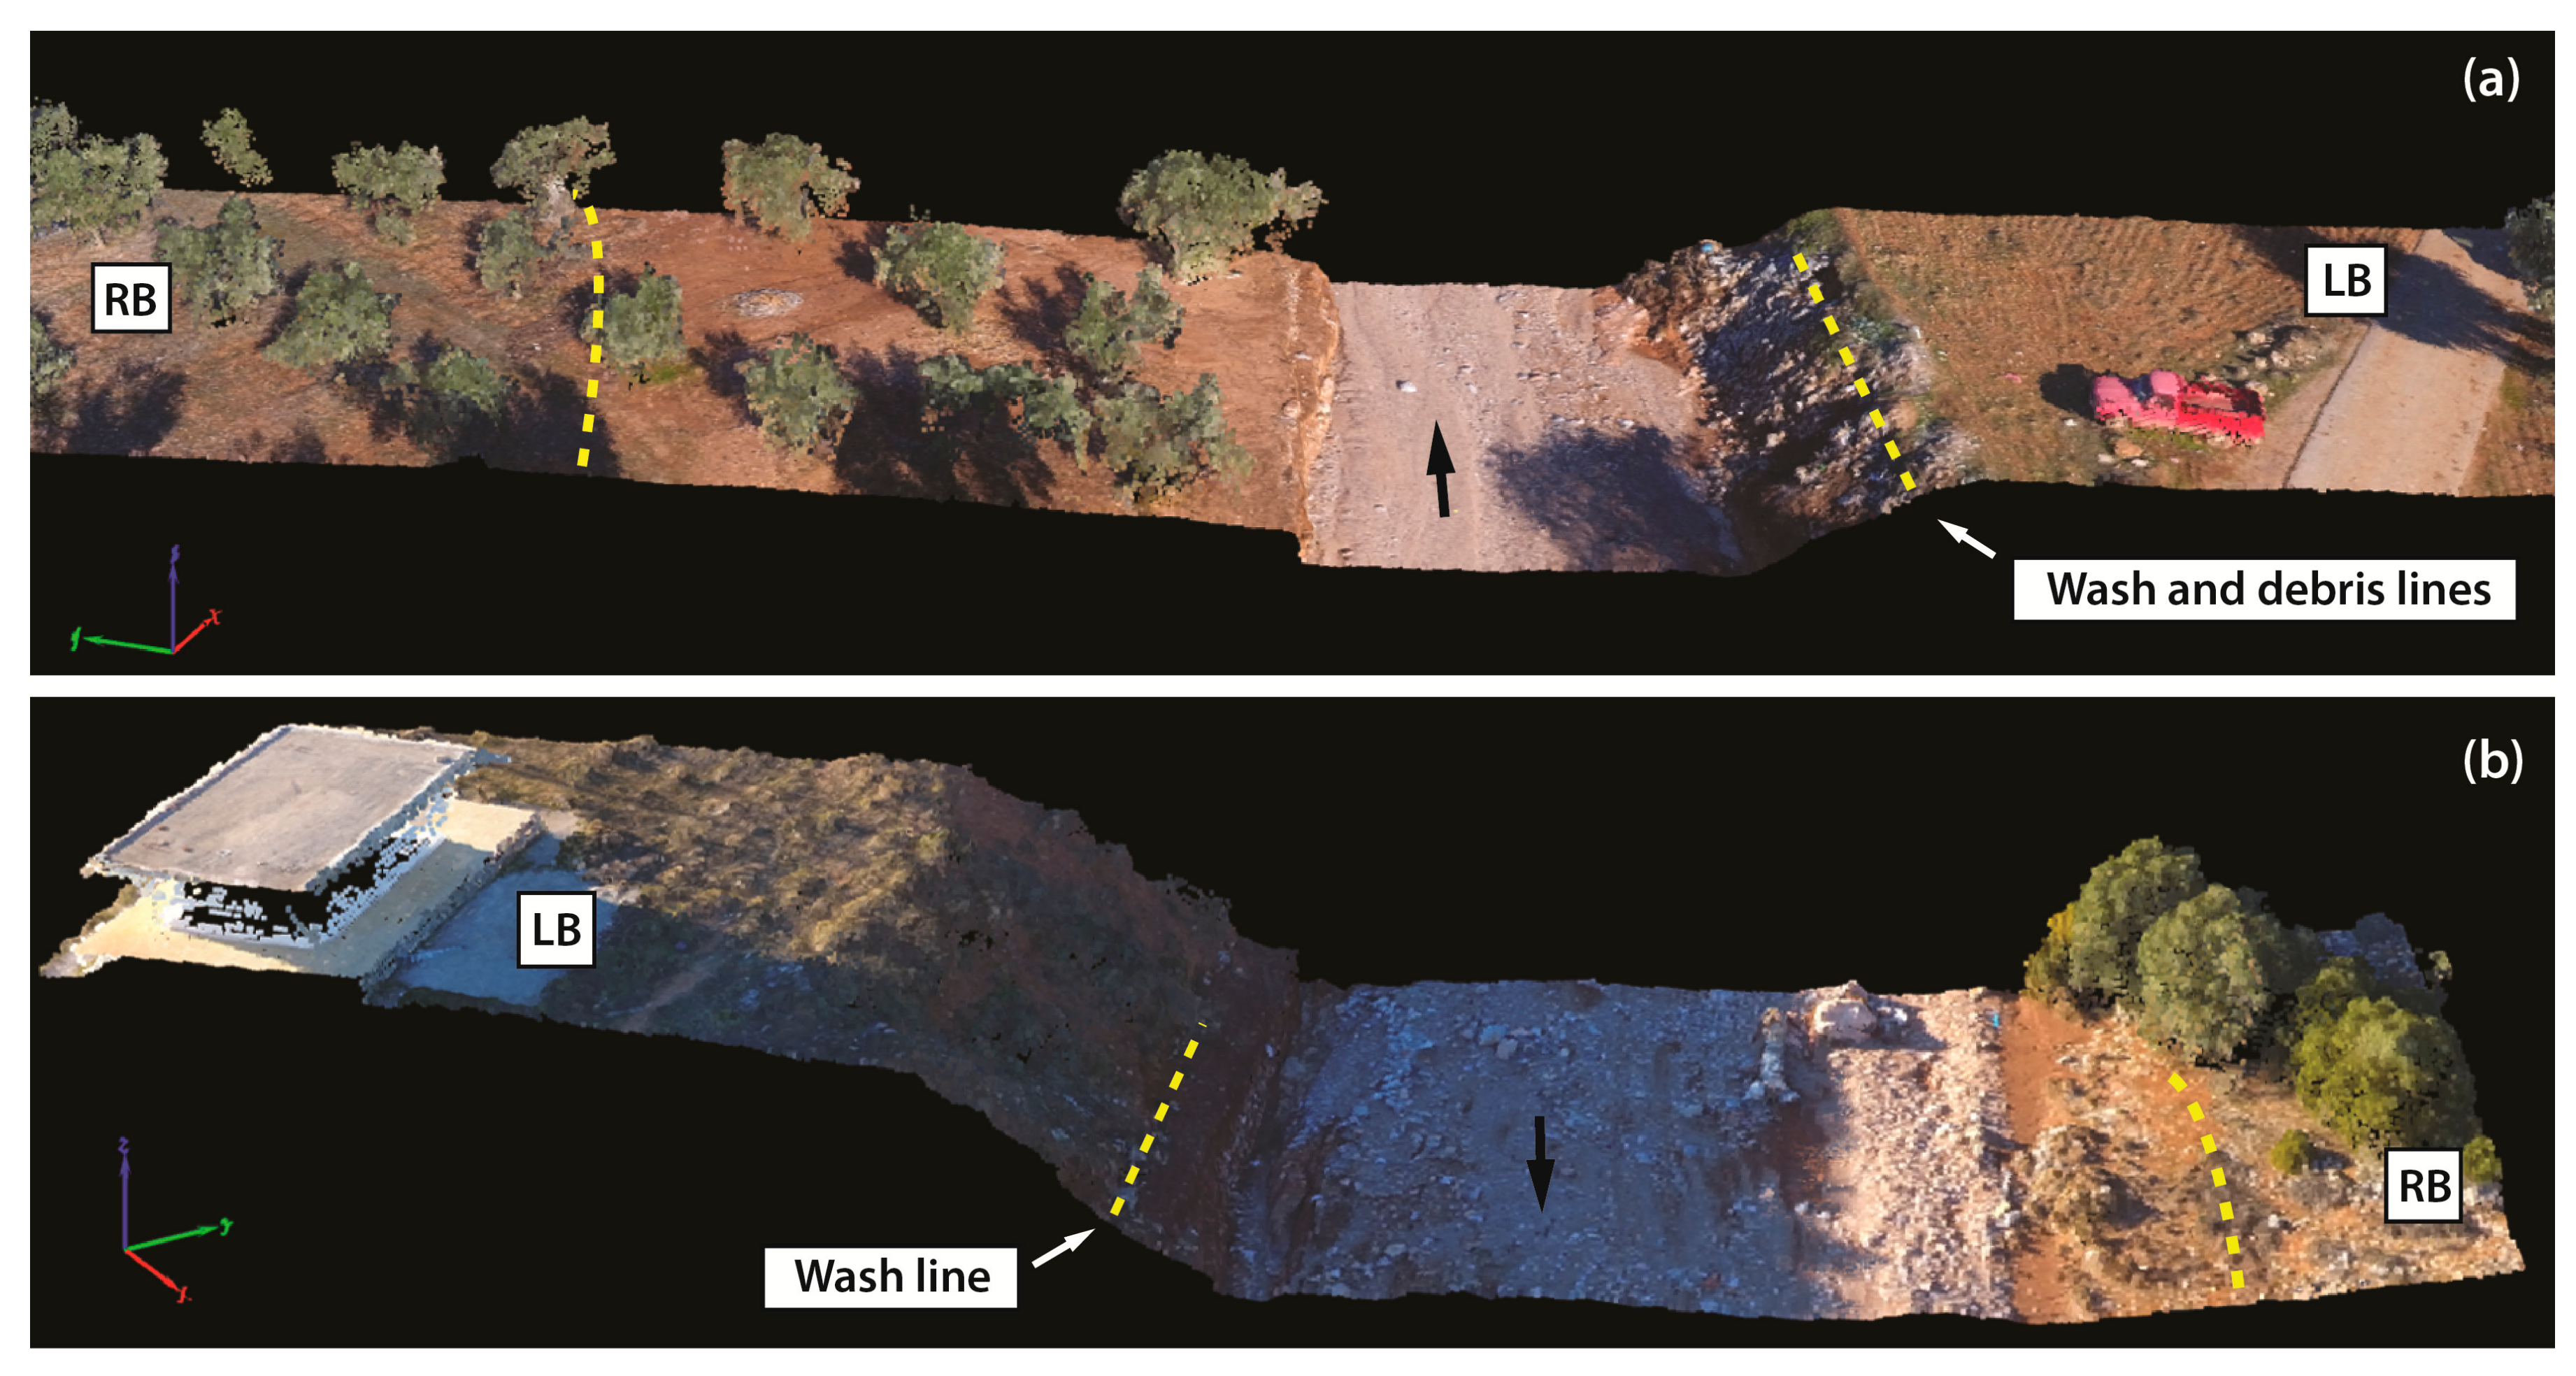
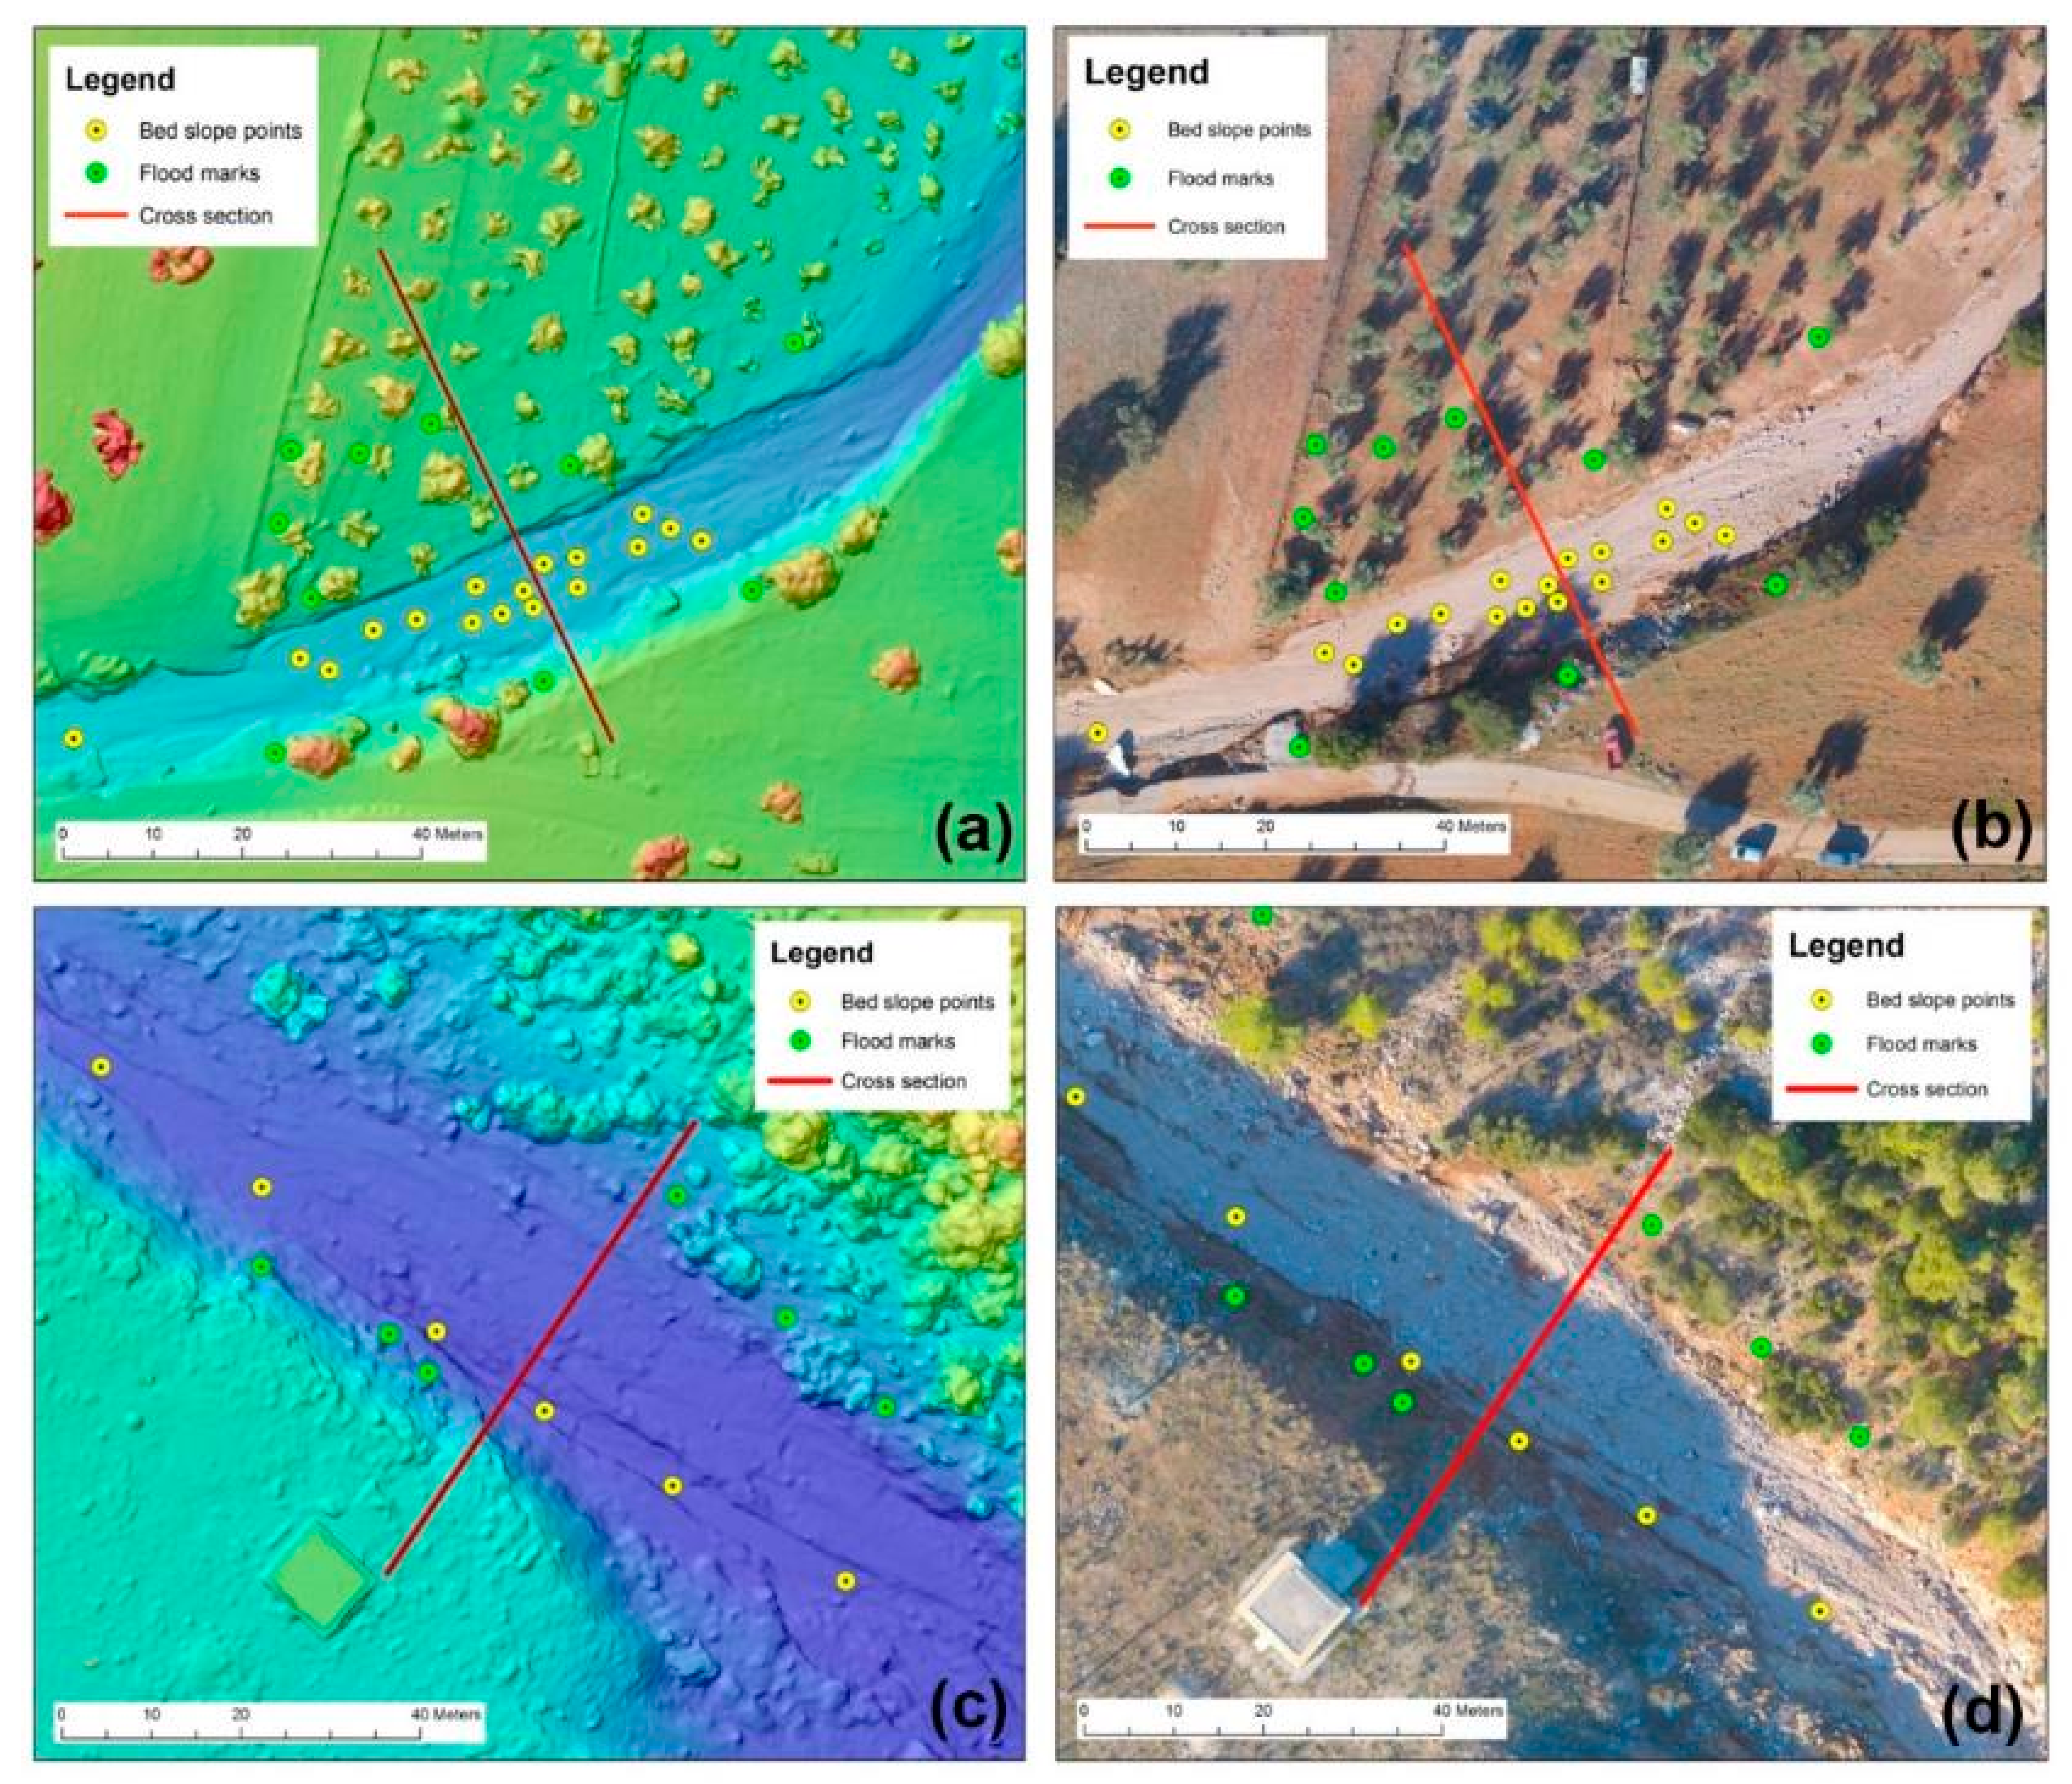
Through the field survey, we identified more than one potential cross-sections, considered initially as suitable for estimating discharge. Using the DSMs (one for each reach), we then selected the two most suitable cross-sections, considering the absence of artefacts (e.g., vegetation) and large obstacles, significant changes in channel geometry and cross-section area (
Figure 6).
After identifying the most suitable cross-sections, a cross-sectional line (
Figure 6) was determined over the DSM. Cross-sections were created by connecting nodes, extracted using the coordinates (x, y, z) of the centroids of every cell of the DSM on the cross-sectional line. The process was carried out for both reaches, in total, aggregating 3633 and 1871 nodes for the Agia Aikaterini and Soures cross-sections, respectively.
The calculation of wetted perimeter and cross-sectional area was based on the relative positions and distances of the aforementioned nodes of the selected cross-sections, using a procedure developed in the course of HYDRATE project [
51]. It was assumed that the maximum discharge was reached in the conditions in which the channel was surveyed, given that in the locations of the selected cross-sections scouring and erosion of the channel and the riverbanks, as well as vegetation removal were very limited.
To obtain the geometry of the water surface at maximum depth, HWMs were identified upstream and downstream of these cross-sections and were placed on the DSM on the appropriate elevation (
Figure 7). The energy slope, defined as the slope of the energy grade line or the ratio of energy (head) loss against the length of the reach under study, was extracted as the best fit profile line formed based on these marks in the three-dimensional space (
Figure 8).
The energy slope defined by the HWMs was controlled for consistency by abstracting HMWs points one by one and observing the effect that each abstraction had on the energy slope’s value. In essence, we removed each one of them from the whole set and examined how this affected the correlation coefficient (R) of the best fit line and the line’s inclination (
Figure 9). If the correlation coefficient moved closer to one (1) by an abstraction of a point, then this meant that the line fit better to the rest of the set. This process was used to examine the sensitivity of the slope value to the set of HWMs and to each one of them. Finally, we kept the HMWs that showed coherence with the slope formed by all the rest HWMs. On the contrary, the HWMs that were visually incoherent with the line and the rest of the set were removed during this process. In this procedure, we removed one HMW out of nine that we initially had from each reach.
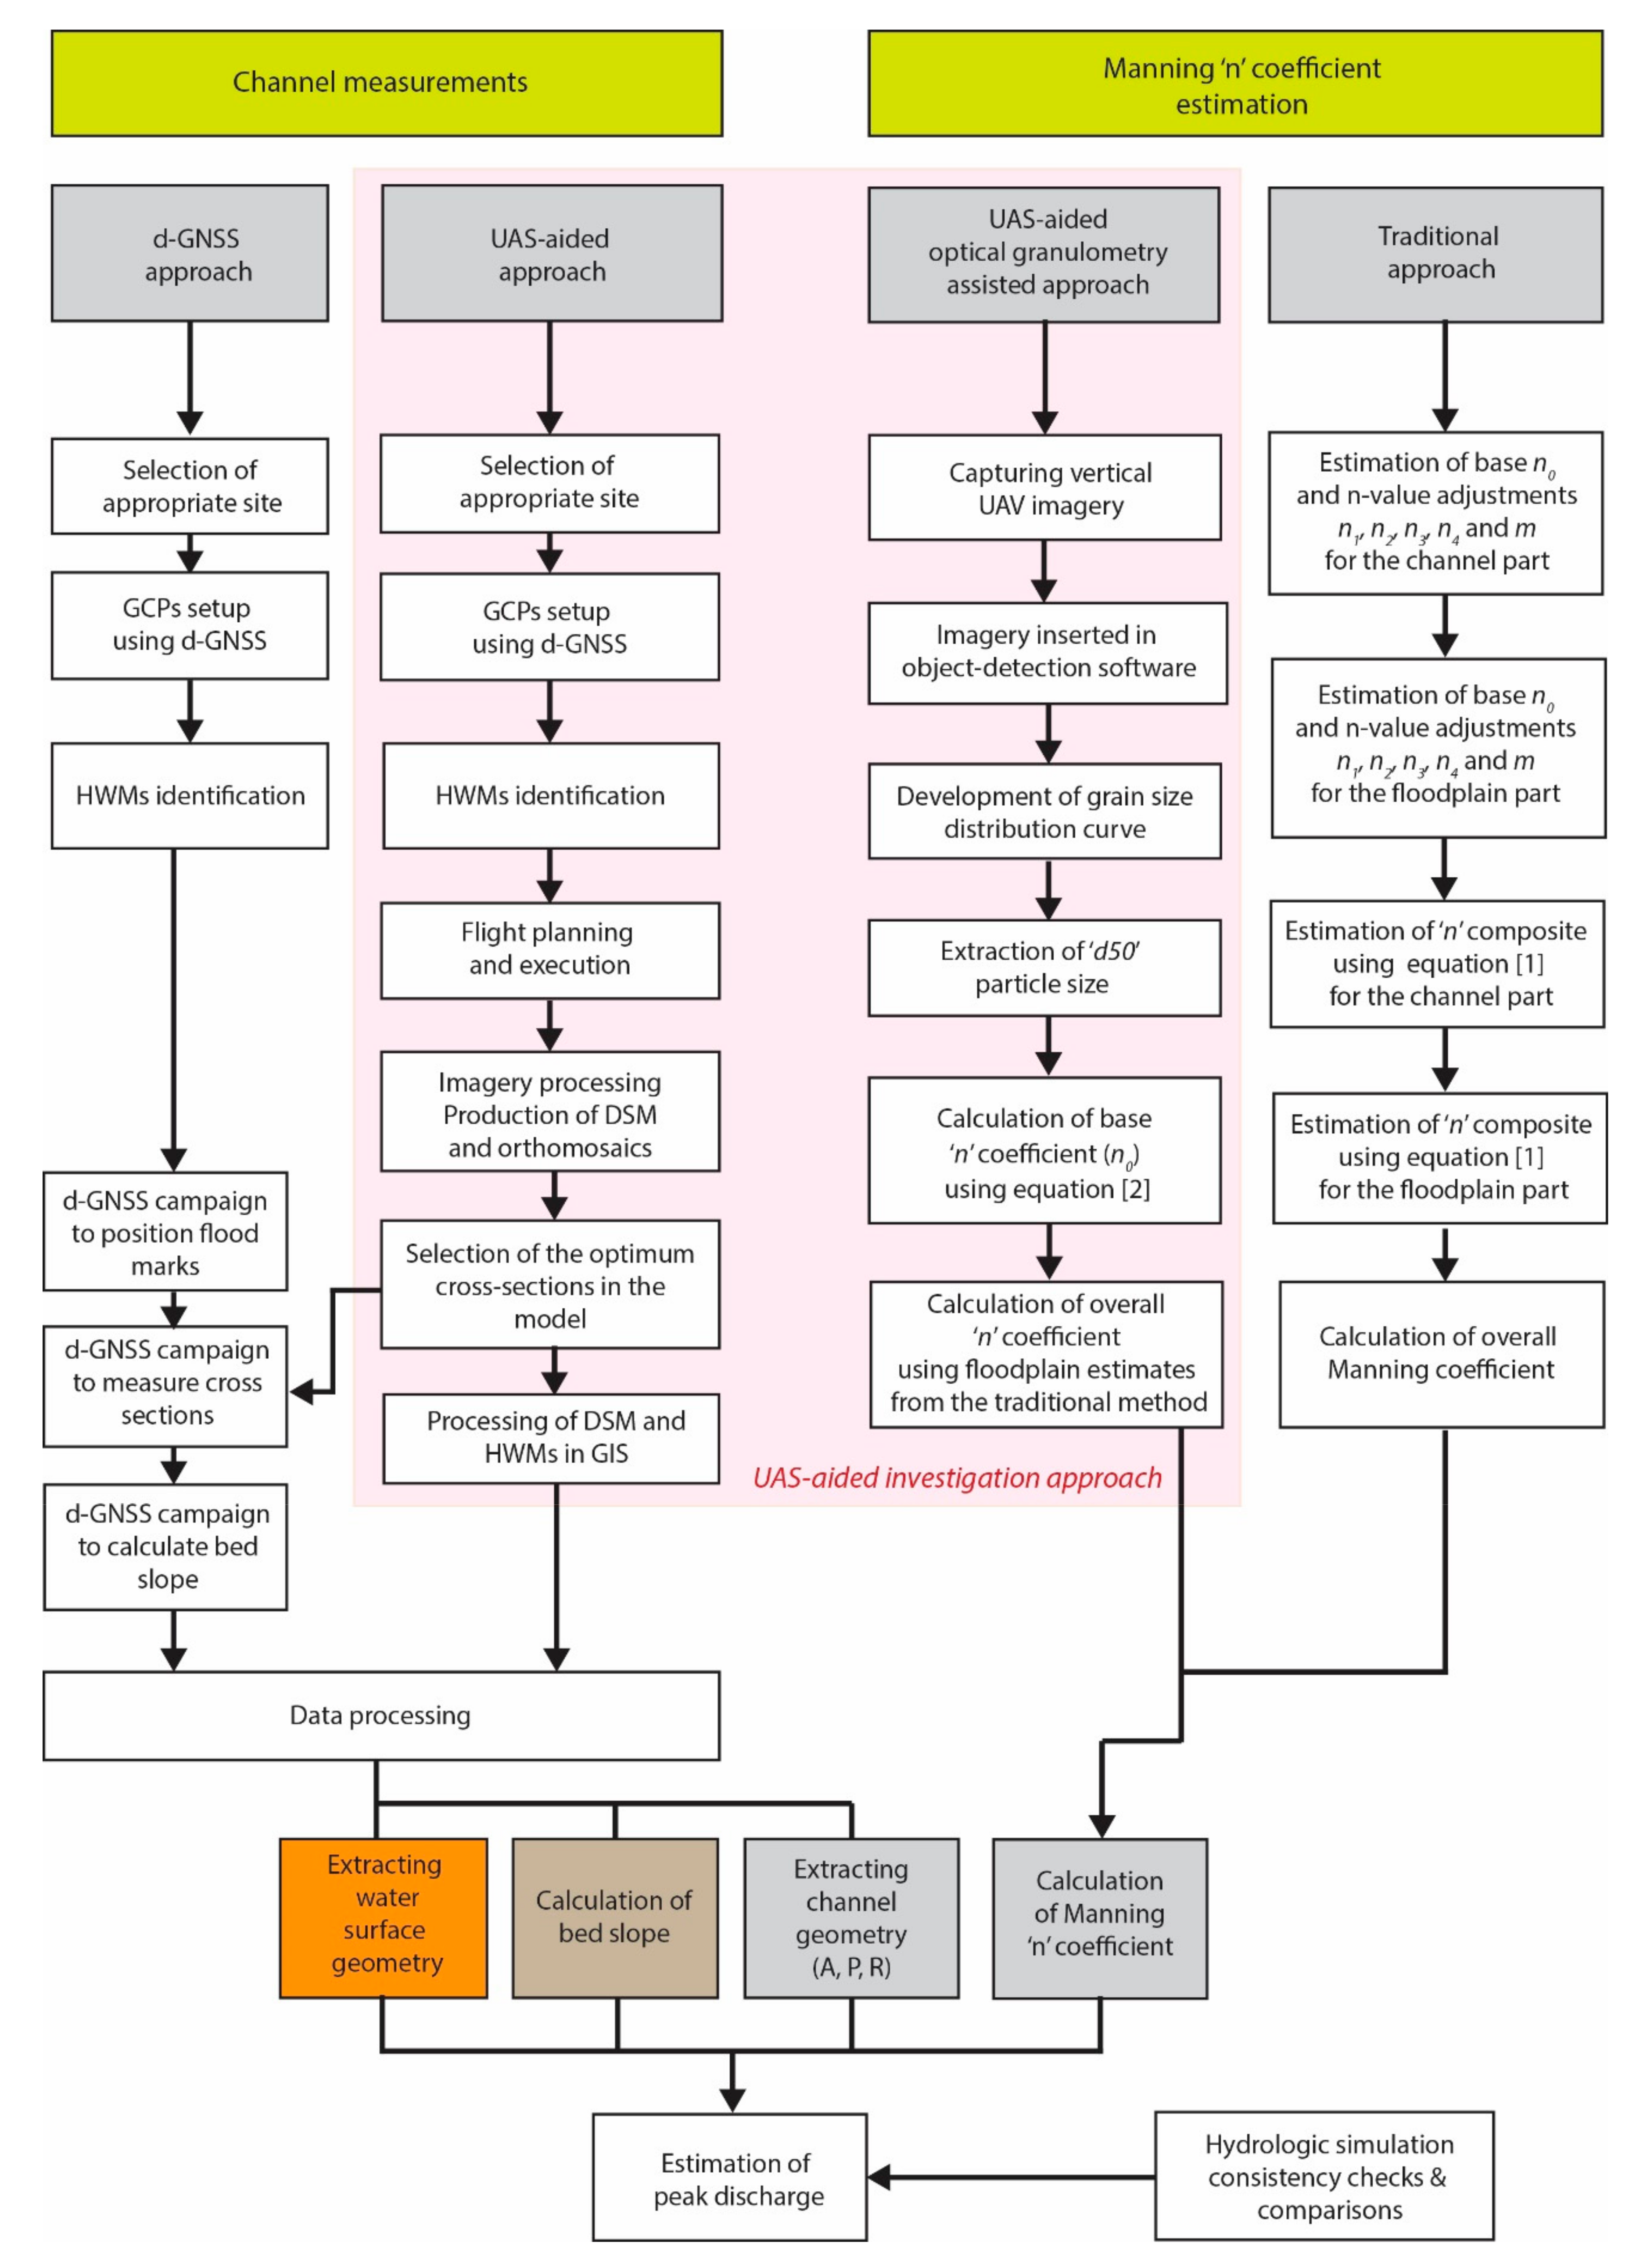
3.5. Roughness Estimation
Roughness was estimated by two approaches in the two cross-sections. In the first approach, we used the traditional method of calculating a composite n Manning coefficient as described by Cowan [
52], Arcement and Schneider [
53] and also found in Phillips and Tadayon [
54]. In the second approach we used optical granulometry on pictures of the channel captured by the UAS.
3.5.1. Traditional Approach
We computed the Manning coefficient (n) first by assigning a coefficient for individual segments of the channel and used the calculations for each segment to derive a value of n for the entire channel. To this end, the cross section was divided into segments, namely (i) the channel, (ii) the south floodplain area, and (iii) the north floodplain area, so that the roughness factor within each segment would be uniform. It has to be noted that given the minimal changes in the channel after the flood we assumed that during peak discharge the Manning coefficient (n) was equal to the one estimated during the post-flood survey (as described by Aldridge and Garrett, [
55]).
First, we determined a base value of n for the bed material of the channel and then selected separate n-value adjustments to account for channel degree of irregularity, variations of cross sections, obstructions to flow, vegetation, and degree of meandering, [
53,
54].
Following this process, the value of n was computed using Equation (1):
where
n0 = base value of n for a straight, uniform channel,
n1, n2, n3, n4 = adjustment for channel degree of irregularity, variations of cross sections, obstructions to flow, and vegetation, respectively
m = adjustment for meanders
3.5.2. Optical Granulometry-Assisted Approach
For the second approach we used vertical imagery captured by the UAS along the riverbed segment of each cross-section. The imagery was captured at 1 m above ground level (a.g.l.) altitude by the 20-megapixel camera of the unmanned aerial vehicle. Each image was introduced in Matlab software [
56], using the BASEGRAIN plugin.
The software is an automatic object-detection tool for granulometric analysis and can be used for vertical aerial photography [
37,
57], following Fehr’s [
58] line-sampling method to calculate grain dimensions. BASEGRAIN runs 5-steps algorithms, which detect different objects (grains and intersects), use edge detection techniques and separate the objects into single grain areas. The final step of the software is to attribute the properties of every grain and the export data represent granular distribution curves. An additional advantage of BASEGRAIN is that the whole procedure may transform from automatic to semi-automatic while the user is able to intervene with pre-processing and post-processing.
It must be noted that the imagery was captured using a scale (
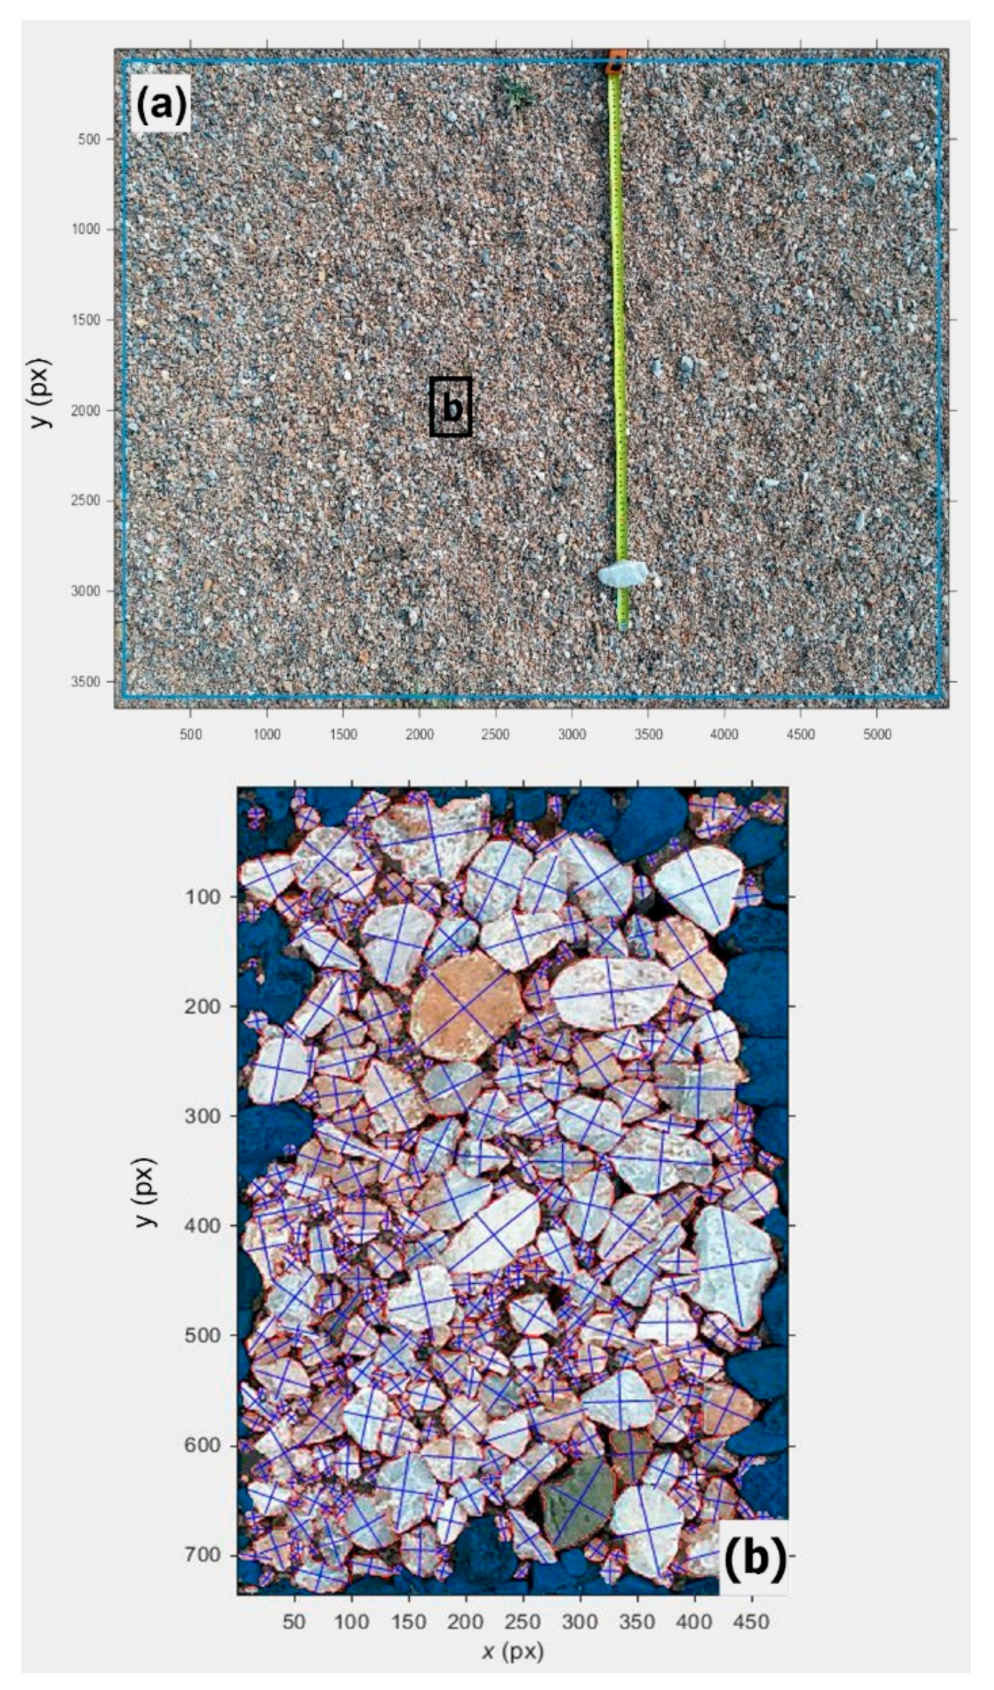
Figure 10) to accurately determine the pixel to actual length ratio, which is necessary for the grain size calculations. This ratio is defined by the ‘Scale’ tool of the software, provided that a scale is included in the imagery. The ratio can vary depending on the height from which the photos are taken and the dimensions of the photo. In this case, we used a standard photo size, and we chose to use the imagery captured by the 1 m a.g.l. flights to achieve higher analysis. We calculated a ratio of 0.3246 and 0.4187 px/mm for Agia Aikaterini and Soures, respectively.
The riverbed was examined in segments as defined by the different photos captured. Overall, we captured 75 and 61 photos for Agia Aikaterini and Soures, respectively, with 5472 × 3648 resolution. This investigation examined a zone of the cross section of an actual width of 5.33 m and 6.87 m for Agia Aikaterini and Soures, respectively.
Following grain-size estimation by the software, we calculated a grain size distribution curve for each cross-section. From the two curves we extracted ‘d50′, the median particle size diameter, for each dataset. Then, we calculated the base ‘n’ value for the two channels, using the Phillips and Ingersoll, [
59] Equation (2) (shown also in Phillips and Tadayon [
54]). Then, we estimated the overall Manning ‘n’ coefficient using the estimates for the floodplain segments of the cross-sections from the traditional method.
where n is the manning coefficient and R is the hydraulic radius.
The summary and basic steps of the approach for estimating the different variables of the Manning equation is presented in
Figure 11.
3.6. Hydrologic Modelling and Consistency Checks
Hydrologic response during the flash flood event under study was simulated using the Kinematic Local Excess Model (KLEM). KLEM is a distributed hydrologic model that is based on the SCS-CN (Soil Conservation Service—Curve Number) method for estimating runoff at each grid cell. Runoff is routed over hillslope and channel grid cells following a simple linear routing scheme that assumes two invariant velocities for hillslope and channel nodes respectively, KLEM’s spatially distributed nature allows to effectively incorporate information of spatial rainfall variability, which is extremely important especially for flash flood events induced by highly localized intense storms as in this case. Despite its relatively simple representation of runoff generation and routing, KLEM has been successfully applied in many other flash flood related studies for peak flow estimation [
60,
61,
62,
63]. For more details on KLEM setup and parameterization, the interested reader is referred to Diakakis et al. [
39].
5. Discussion
In the present study, we examine the capabilities of UAS use in peak discharge estimation in the course of post-flood surveys and we explore its strengths and weaknesses. To this end, we applied the slope conveyance method using a UAS for calculating the different parameters needed. Then, we compared our UAS-derived estimates with estimates made through a conventional d-GNSS survey. We applied these techniques in the post-flood setting of Mandra in Greece, in two main tributaries of the catchment that experienced the catastrophic flooding in 2017.
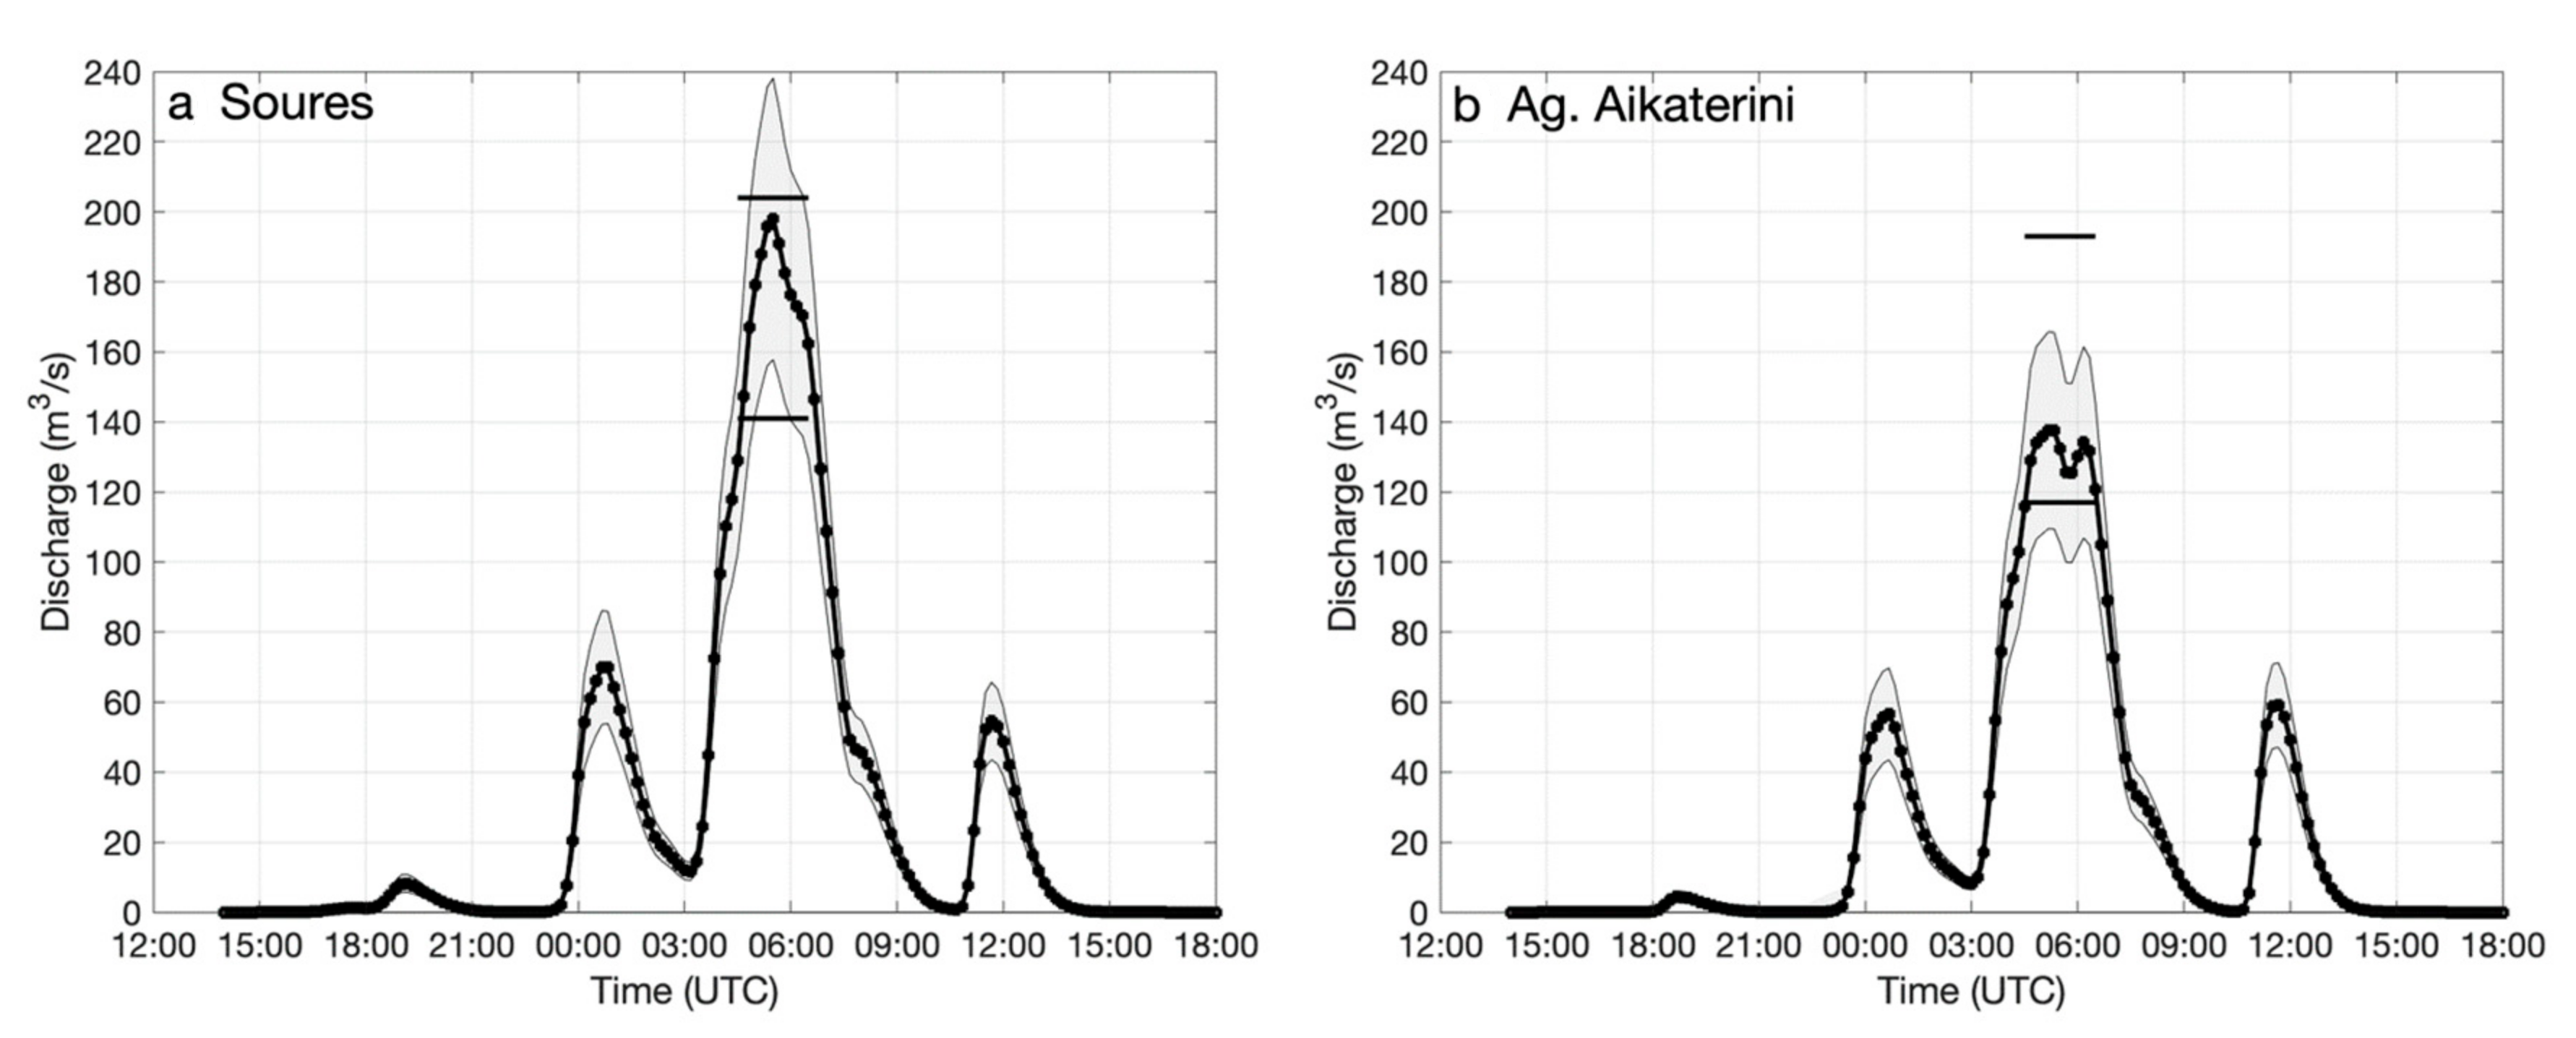
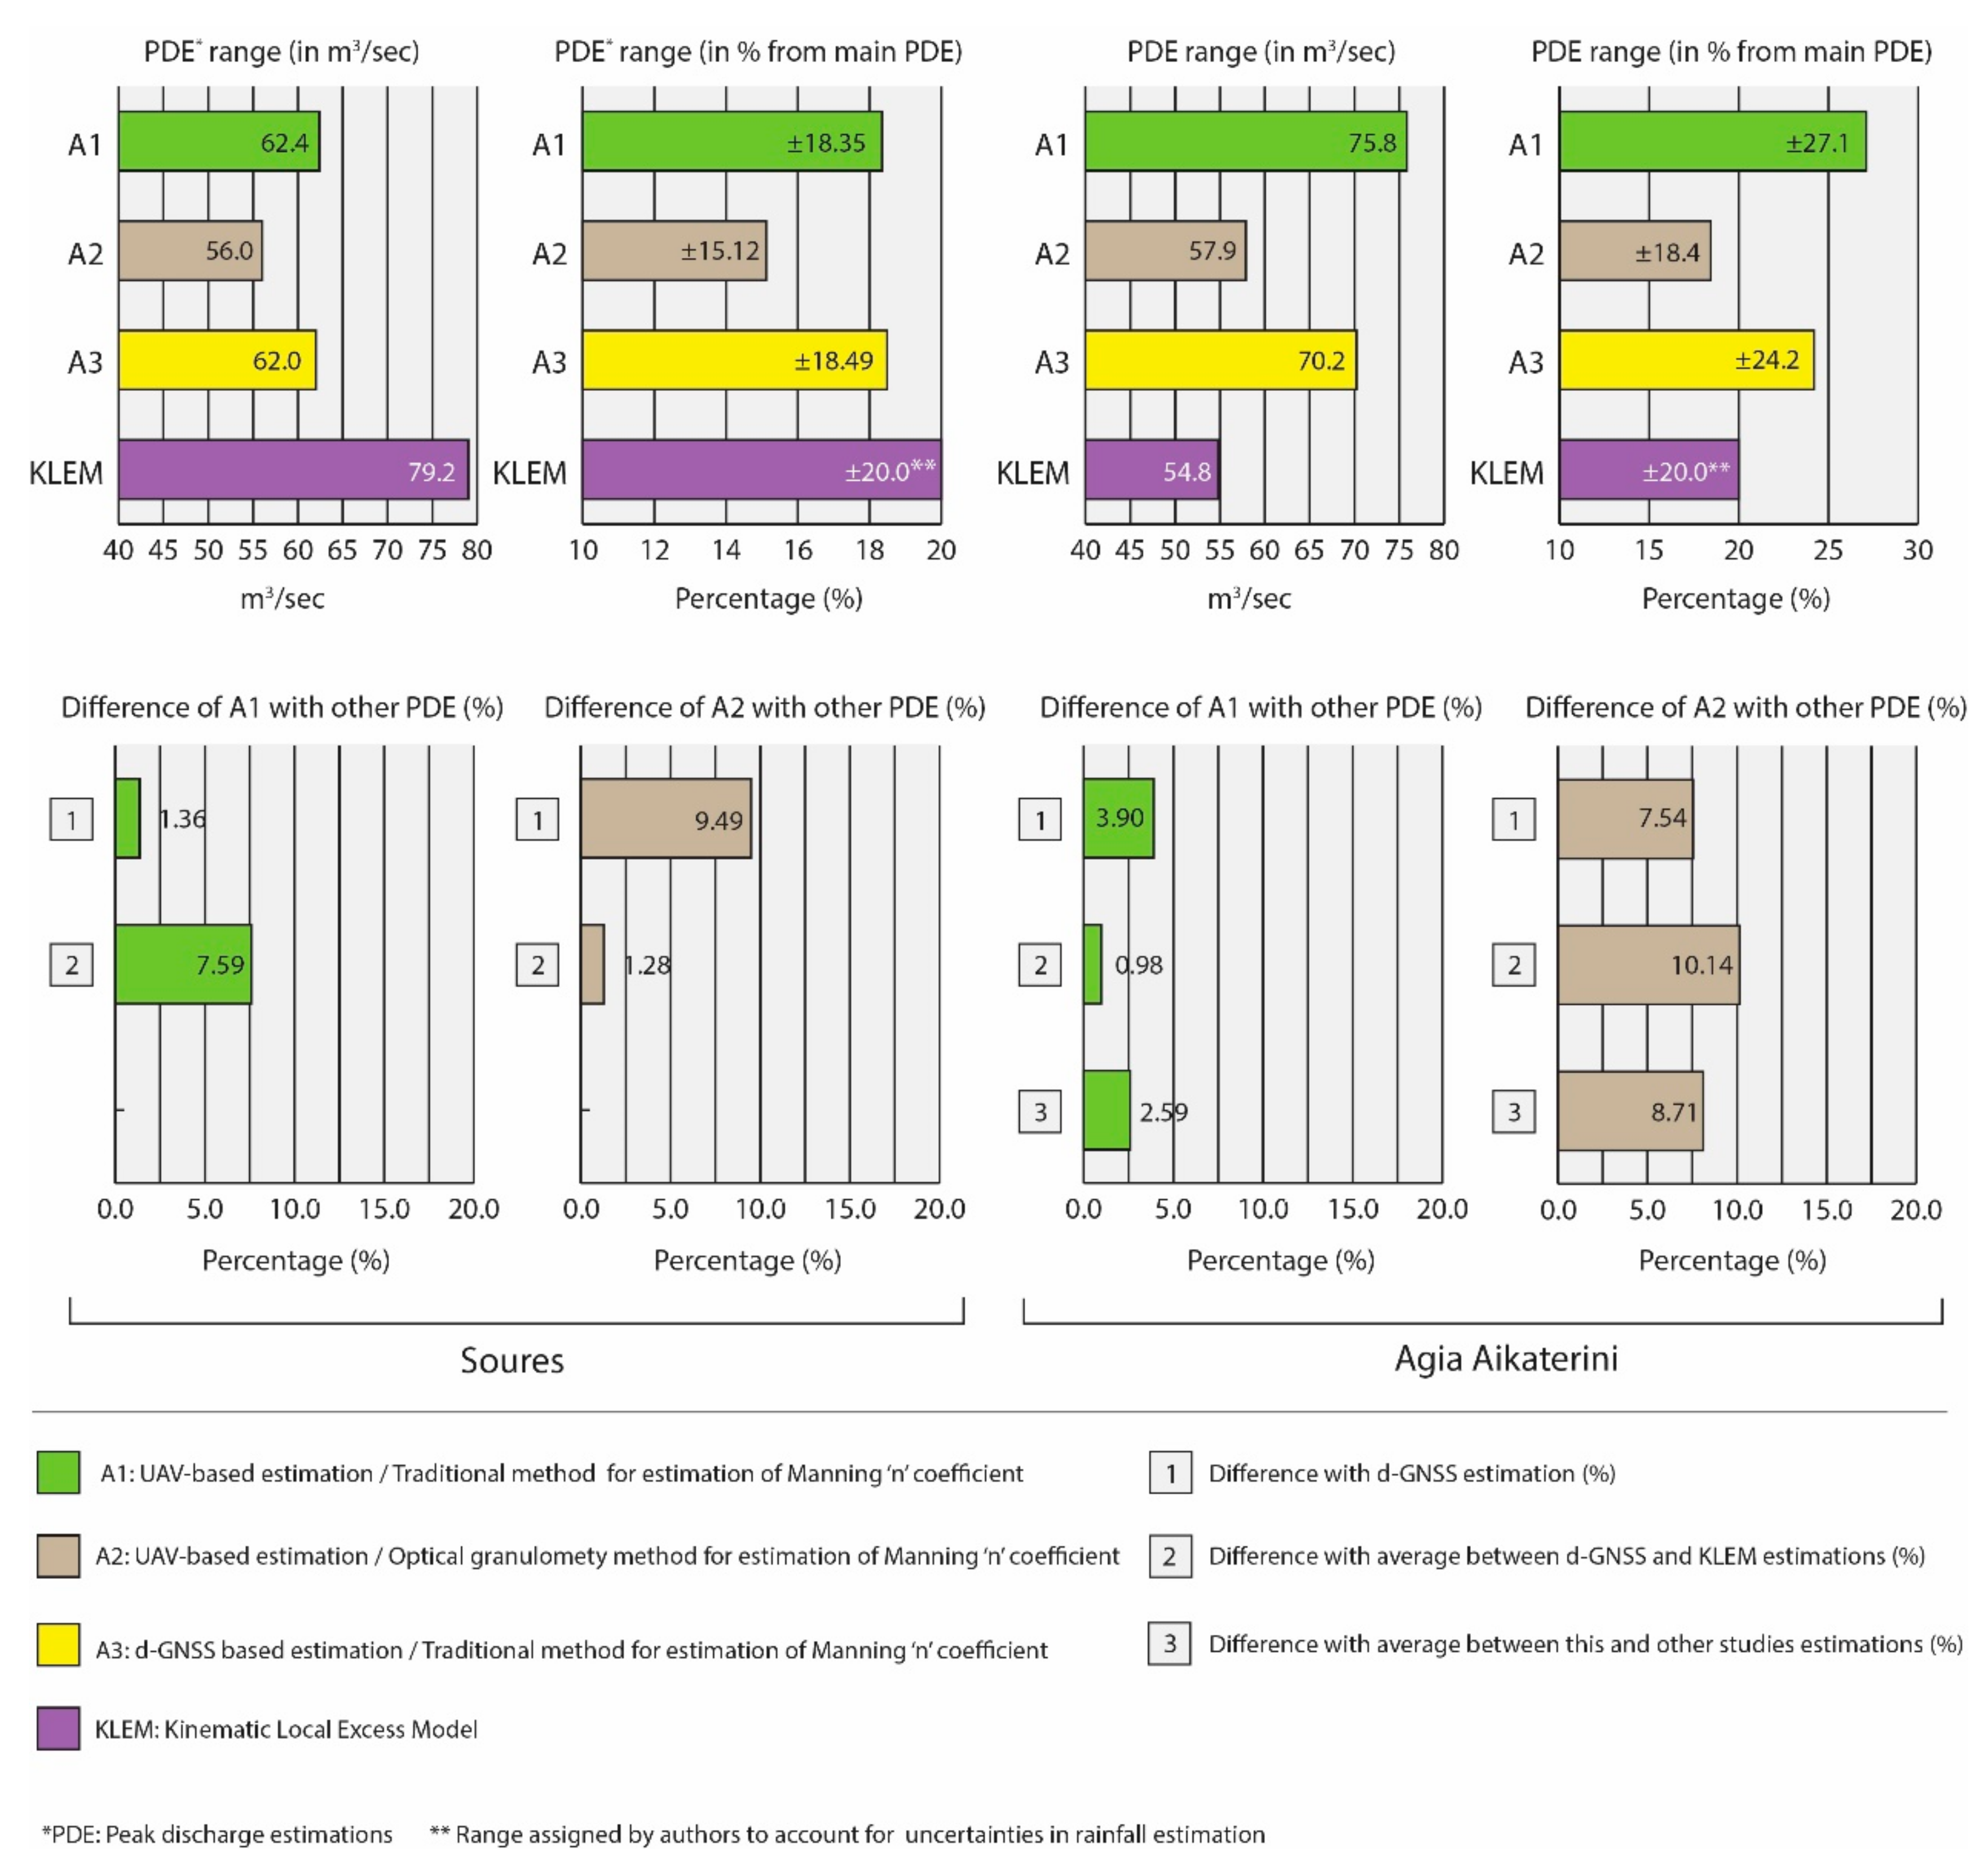
The findings show that a UAS-aided peak discharge estimation is an effective and practicable method able to extract with accuracy the geometric properties of the channel and the geometry of high-water surface. Comparison with the d-GNSS survey findings showed minor differences in the cross section and wetted perimeter calculations ranging between 0.61–1.46% and 0.71–0.93% respectively for Soures and Agia Aikaterini reaches, indicating a very satisfactory performance.
With respect to the final discharge estimates we found minimal differences in the estimations. When we applied the traditional manning coefficient estimation approach, the UAS-aided results differed only slightly from the d-GNSS survey ones, namely 1.4% in the case of Soures and 3.7% in the case of Agia Aikaterini. These differences identified in the final discharge results were propagated by differences found in channel and water surface geometry and remain well within the range of values used to account for uncertainy in the estimations.
Comparison of UAS-aided discharge estimates based on optical granulometry with the d-GNSS approach shows larger differences 7.5% and 9.5% for Agia Aikaterini and Soures, respectively. The optical granulometry approach estimates are in all cases higher than the estimates of the traditional approaches, although they are found to be within the range of these estimates (
Figure 14). This increase is an indication that optical granulometry may lead to a slight overestimation of discharge, although more research should be carried out to investigate whether this is a consistent trend. A probable cause for this overestimation is that top-view photography does not account for broader scale topographic variability within the channel that in reality may increase the Manning coefficient. This matter is discussed in more detail in
Section 5.3 of this study.
The UAS-aided approach follows different a sequence of steps compared to the conventional one. In the d-GNSS approach, the geometry of the channel is described directly by surveying a specific cross-section that is selected during fieldwork. Then at the lab, the topographic data are projected, and calculations are made to obtain the values of wetted perimeter and wetted area based on HWMs identified also in the field. In contrast, the UAS-aided approach collects data from a wider area and obtains the geometry of a larger part of the channel. The selection of the appropriate cross-section can be done both during fieldwork and at the lab and even changed at a later time. Even though this change has certain constraints of its own (discussed in
Section 5.2), a different cross section can be selected and studied without a second visit to the study area, provided that there is no need for additional data (e.g., new HWMs). This clearly adds to the value of the UAS-aided approach. This visual material as well as the terrain information can be stored in the model intact from human intervention or natural changes be used for comparison with future flood event or other riverine processes [
36].
5.1. Advantages of the UAS-Aided Approach
In the area of data collection, the UAS-aided approach has three important advantages. Firstly, the study reach can be remotely revisited (i.e., virtually), as photogrammetry allows storing of the geometry data for use/reuse at a later time. This is particularly useful in the case of remote areas and sites where safety is compromised [
21]. Secondly, in the case that the selected cross-section(s) are unsuitable, a second field survey using d-GNSS or other field-based techniques at a later time may lead to inaccuracies due to changes in channel geometry. These changes between the channel geometry exactly after the flood and the geometry of a later time are common, both due to human activities (i.e., cleanup efforts) and post-flood river erosion/sedimentation processes. UAS imagery, by storing the channel geometry in a wider area through structure-from-motion, minimizes this problem. Thirdly, the availability of terrain data for a part of the reach allows processing of multiple parts of it, permitting in this way a more thorough study of flow conditions in multiple cross sections if needed. In this way the captured terrain information in the form of a DSM offer greater flexibility and provide the opportunity of easy-to-perform trials, when it comes to geometric data including bed slope and cross section selection. As such, for example, if we identify extensive erosion or other elements that render our selection unsuitable for estimating discharge, we can make a different selection or test another part of the reach.
Furthermore, the resolution of the model permits observations in high detail (bedrock, vegetation, soil, clasts larger than a few centimeters (3 cm in this case) and every object and obstacle in the streambed are clearly visible). This way the imagery can contribute to the Manning’s n coefficient estimation even after the field survey. In addition, other elements such as debris lines or mud lines (
Figure 5) can be identified from the imagery, along with their exact position. The increased resolution provides also a very accurate description of the cross section with nodes every few centimeters (in this case 3 cm). This is also a strong advantage of the UAS approach, as it becomes impractical and time consuming to survey the whole cross section using a d-GNSS rover receiver with such small intervals, especially considering steep riverbanks and inaccessible channels. Our application showed that the UAS provide a unique opportunity to capture this imagery with minimum safety concerns, in a rapid way and with less personnel, increasing the flexibility of the required operation. This, in turn, facilitates the survey in a way that it can be carried out immediately after the flood despite practical limitations (mentioned in detail by Gaume and Borga [
20]) reducing the chances of losing valuable data. Given the temporary nature of HWMs [
50] this characteristic of the UAS-aided approach is considered particularly valuable.
It should be emphasized that the flights carried out to capture the imagery used in this study, along with the d-GNSS campaign to acquire coordinates of the GCPs took a total of 30 min each. For comparison, this time was approximately one-third of the d-GNSS survey for the two cross sections, which were in the scale of 70 to 80 m in length. In addition, as it already mentioned by applying the UAS-aided approach the data collected expanded to a large part of the channel and they are not restricted to only two cross sections.
Finally, the simple consumer-grade equipment required to carry out the survey is also one of the advantages increasing the practicality and the potential for a wider use (also acknowledged by Yang et al. [
22]).
5.2. Weaknesses and Limitations of the UAS-Aided Approach
With regard to disadvantages, we identified mostly practical issues and certain limitations that need to be stressed. One of the disadvantages of structure-from-motion-derived terrain is that permanent water flow in the river could cause inaccuracies in producing an accurate channel geometry. Therefore, the technique is more effective for ephemeral streams, rather than river beds that experience permanent water submersion [
22,
23]. In the case of permanent flow, the inclusion of optical-empirical bathymetric mapping in the SfM data, accomplished with the aid of depth measurements [
47] was used to counter this problem. In addition, the obstruction of vegetation is also one of the limitations of constructing a channel geometry through photogrammetry (acknowledged also by previous studies [
23]. The technique does not distinguish between the actual terrain and other surfaces, including the vegetation canopy. This obstacle is expected to be more significant in channels with dense vegetation. The most common solution to this problem is selecting cross-sections that have no vegetation out of the constructed DSMs. The method is more suitable or can be applied more easily in arid and semi-arid areas where vegetation is normally less dense. Another solution would be to remove vegetation related points during the point cloud post-processing. For that reason, a more dense and detailed photo shooting process is needed in advance, in order to accurately identify the shape and colour of different vegetation types. The vegetation related points are then grouped into certain classes which can be filtered and removed from the DSM (see also [
35]). However, in case of individual vegetation stands, a filtering could be also applied during the cross-section evaluation.
The placement of high-water marks can be carried out using both approaches. In some cases, like debris lines these marks can be visible from the aerial imagery and therefore can be placed directly on the digital model of the study site. In the case that a HWM is found above the ground (e.g., on a tree limb) it can be still placed by measuring its height above the ground in the field and then add an HWM point by adding the aboveground elevation on the DSM. However, in this area, the d-GNSS approach has the advantage of including data and information (e.g., HWMs) not visible from top-down photography (i.e., hidden by the vegetation canopy). These types of HWMs are recommended for use only after being measured by a d-GNSS device.
In addition, the use of d-GNSS ensures standardization of the HWM placement accuracy in the sense that it is measurable. On the contrary, manual placement of HWM directly on the DSM, while it is considered accurate due to the very high analysis, its accuracy is difficult to measure. Nonetheless, this study found no important differences in the energy slope extracted by the two approaches. Nevertheless, it must be noted that in some cases, when HWMs are on the ground surface [see
Figure 5] are easier and faster to place on the Digital Surface Model.
Close-up, careful inspection and examination of of the HWMs is critical to ensure they are reliable indicators of maximum water stage [
50], which in turn is important for a realistic interpretation of the water surface geometry. Thus, a UAS-only survey without the input of ground observation is not recommended (stressed also by Kastridis et al. [
21]), when it comes to HWMs identification and placement.
The time of collecting the necessary data can vary depending on the reach length, the amount of HWM data available and the weather conditions. Adverse weather conditions may be a limitation to data collection leading to the postponement of a UAS flight or faster battery consumption. The latter in turn may lead to more flights needed to capture the necessary imagery and therefore more time required for the survey. In terms of time scale, the flights presented in this study needed approximately 20 min each with an additional 10 min for preparation.
Regarding the precision of the DSM, it must be noted that this is a multi-parameter issue, that is influenced by the number and placement of GCPs and the altitude of flight among other factors. In turn, the flight altitude affects the size of the area captured in imagery in a specific time window, which is important as by increasing the area, the method provides more flexibility in terms of cross-section selection. Time availability, as well as safety and accessibility are also important constraints that bound the overall field survey process in a disaster zone. These constraints are pronounced and unbending immediately after the flood but tend to relax with time. However, the more time passes between the flood and the survey, the more we run the risk of losing critical data. In this framework, the aforementioned factors are bound in a tradeoff. The more we apply the method in a way that increases the DSM’s precision [i.e., by lowering flight altitude and adding more GCPs], the more we lose on flexibility and the more time is needed to complete the survey, which in turn incorporates the risk of data-loss. This is a practical issue that has been acknowledged in previous studies as well [
48].
5.3. Limitations of the Optical Granulometry Technique
Practical considerations also apply in the optical granulometry part of the method. One of the limitations of the automatic process of granulometry based on imagery is that we cannot exclude the chance of errors. Even when good quality imagery is used, poor lighting conditions can potentially affect the results. Therefore, adequate and homogenous lighting conditions are recommended. In addition, when poor quality imagery is combined with very small grains, multiple grains can appear as one. This problem is not common and even if it happens it is not expected to affect the overall result significantly. To counter this problem, a 5 mpx (or better) camera is recommended. In addition, a visual quality check of the results allows corrections of the automatic process of identifying grains, by manual intervention of the user.
Furthermore, in bedrock-only channels and in parts of the channel covered with water, grass, vegetation or snow the optical granulometry part of the method is not expected to work properly and should be avoided, as it is based on grain measurements.
As vertical photography cannot account for broader relief changes and topographic variability within the channel, estimation of manning coefficient is limited to its relationship with grain size. Thus, the technique produces more realistic results and its more effective on flat riverbeds with minimum relief changes. In the case of river channels with presence of bedforms and intense topographic variability, it is possible that the final estimation will underestimate Manning coefficient to a degree and therefore it is not recommended. In the case of minor topographic variability within the channel, placing scaling objects in multiple locations across the channel and keeping a constant relative altitude (i.e., a.g.l) is recommended to retain the same scale in the imagery. It must be noted that other sources of imagery (e.g., portable digital camera) are compatible for optical granulometry. In this case, using the camera of the unmanned aerial vehicle was considered more practical in the framework of a rapid post-flood reconnaissance, offering an efficient way to capture top-down images with a constant altitude.
In general, the altitude is inversely proportional to distinctive shooting ability of the camera and therefore, the altitude is at the judgment of the user, who must calculate the available time, equipment, and case study extent. Regarding the flight altitude for optical granulometry, there is no particular recommended altitude for capturing the imagery, provided that the distinctive ability of the camera is adequate to distinguish the smaller grains. Experiments that carried out in 1 and 3 m a.g.l. shots showed negligible differences in the d50 estimation results. Namely, for both Soures and Agia Aikaterini, the “n” roughness coefficient presented differences not larger than 0.2%. However, there is a need for further research and trials to determine the maximum altitude of imagery-capturing in relation to the resolution of the camera. In addition, it must be stressed that imagery of poorer quality, for example due to the camera attributes, may lead to inaccuracies in the estimation of d50 in higher altitudes of image-capturing that could be propagated in the roughness coefficient. Thus, keeping an altitude of less than 3 m a.g.l altitude for applying the optical granulometry is recommended, before further research is carried out.
Overall, the optical granulometry module of the application gives results within the realistic spectrum but the tends to overestimate discharge by a small percentage. Although more research is needed, this part of the approach is effective only within certain limitations acknowledged in this section, the most important of which is a suitable channel that lacks significant topographic variability and grains are visible.
Overall, the study shows that the UAS can be a reliable and very efficient tool for peak discharge estimation. The UAS can provide the post-flood field surveys with a collection of aerial imagery/data in a quick way over an extensive area, even in the case of inaccessibility and despite safety issues. The high-resolution digital surface models developed through this imagery were found to be particularly valuable for analyzing channel geometry, as well as obstructions to flow and other characteristics of the riverbed. In addition, they proved to be particularly useful for measuring cross-sectional areas on demand, even at a later time, when the channel has changed. The capabilities of UAS are suitable to the opportunistic nature of flash flood studies in the sense that UASs are able to collect data within the limited time window that these data are available. Nonetheless, it must be stressed that a combination of these aerial observations with ground surveys is considered desirable.
6. Conclusions
This paper demonstrates the potential of a UAS-aided method using the structure-from-motion technique to provide channel and water surface geometry data, along with roughness coefficient information appropriate for peak discharge estimation in the course of a post-flood survey.
Overall, the short time of its application and the flexibility of the technique in terms of timing and resources needed, in comparison with conventional approaches, render this approach a very effective tool for indirect discharge estimation. This study demonstrates that the approach described allows us to survey multiple river reaches in a short time and with minimum resource requirements. The method, with the exception of the optical granulometry module, shows minimal differences in terms of estimates, in comparison with the conventional survey. At the same time, it provides the flexibility to review the data collected in the field and potentially correct mistakes in the surveyor judgment, when it comes to selecting a cross section. Overall, the UAS-aided estimation despite its limitations is more practical than the conventional approach. The ability of data collection at multiple river sections and the flood plain, offers the potential to advance our understanding on the spatial dynamics of flood response. Moreover, high resolution imagery can be used to further understand flow dynamics and sediment connectivity between overland areas and river segments or monitor these dynamics in subsequent surveys.
While certain practical limitations exist, which must be taken into consideration to ensure accuracy, this approach is an easy-to-use methodology that has the potential to become a common practice in indirect discharge estimation campaigns.
The readily available consumer-grade equipment that is essential for this approach, the enhanced observation capabilities, and certain practical conveniences [i.e., safety, flexibility] they offer in field surveys, indicate a strong potential of these technologies in many aspects of flash floods, especially given the opportunistic nature of their study.

 ,
, 


