Dynamic Divide Migration as a Response to Asymmetric Uplift: An Example from the Zhongtiao Shan, North China


1
School of Geography and Ocean Science, Nanjing University, Nanjing 210023, China
2
Gansu Lanzhou Geophysics National Observation and Research Station, Lanzhou 730000, China
*
Author to whom correspondence should be addressed.
Remote Sens. 2020, 12(24), 4188; https://0-doi-org.brum.beds.ac.uk/10.3390/rs12244188
Submission received: 29 November 2020
/
Revised: 17 December 2020
/
Accepted: 19 December 2020
/
Published: 21 December 2020
(This article belongs to the Special Issue Quantifying Landscape Evolution and Erosion by Remote Sensing)
Abstract
:Previous numerical–analytical approaches have suggested that the main range divide prefers to migrate towards the high uplift flank in the asymmetric tectonic uplift pattern. However, natural examples recording these processes and further verifying the numerical simulations results, are still lacking. In this study, the landscape features, and the probable drainage evolution history of the Zhongtiao Shan, a roughly west-east trending, half-horst block on the southernmost tip of the Shanxi Graben System, were investigated through the geomorphic analyses (i.e., slope and steepness distributions, and the Gilbert and χ metrics). The topographic slope and steepness results indicate that the Zhongtiao Shan, controlled by the north Zhongtiao Shan normal fault, experiences asymmetric uplift and erosion patterns, with higher uplift and erosion on the north range. In addition, the Gilbert and χ metrics suggest that the western part of the main divide is currently stable, while the eastern divide is moving southward. According to the drainage divide stability criteria, we suggest that the uplift and erosion, on the fault side, balance each other well on the western part of the range, while on the eastern part, the uplift is outpaced by the erosion. In addition, a dynamic divide migration model in the asymmetric uplift condition is proposed, indicating that the interaction between uplift and erosion controls the migration and/or stability of the main divide. Deducing through this dynamic model, we suggested that the eastern segment of the north Zhongtiaoshan Fault must have experienced higher activities in the geological history, and the western fault may remain its activity along with the mountain relief generation. This gives a case that specific information on asymmetric neotectonic history and landscape evolution in an orogenic mountain can be uncovered by the proposed dynamic model.
1. Introduction
Drainage divide, the elevated terrain that separates neighboring drainage basins, is the backbone of the terrestrial landscape, and its morphology and mobility have great effects on regional geomorphic evolution [1,2,3]. In recent years, there has been increasing awareness that divide is a kind of dynamic, rather than static, feature in geomorphic systems [2,4,5,6,7]. Divide migration would change regional drainage area, sediment flux, and stream power, and hence influence regional erosion process, population genetic structure, and further present opportunities to examine landscape-scale interactions among tectonics, erosion, and ecology [2,8,9,10,11,12,13]. Therefore, researches on divide mobility, subsequent fluvial network configuration, and the corresponding landscape evolution have been widely considered in recent years [2,4,6,14,15,16,17]. Both conceptual model and numerical simulation results have demonstrated that, for a simple synthetic landscape (i.e., uniform uplift, rock erodibility, and climate conditions), divide is sensitive to cross-divide erosion and may migrate to the side with low erosion rate [1,2,14]. With further research, a growing number of studies suggested that divide migration can also be affected by many factors, including the tectonic asymmetric uplift [9,15,18], differences in rock erodibility and precipitation across the divide [19,20], tectonic horizontal advection [15,21], and even the short time-scale extreme events, for example, the occurrence of landslides [22,23]. Within all the factors, the tectonic asymmetric uplift, which is mainly controlled by the fault activity, has always been regarded as the most important factor, for its effects on local climate, rock strength, and the triggering on landslides [9,14,18,24]. The numerical–analytical approaches indicated that the main divide prefers to migrate towards the high uplift rate face in the asymmetric uplift pattern, and finally reaches a quasi-steady state [14,21]. However, the divide will gradually migrate back to the previous position when the tectonic uplift becomes uniform again [15,21]. By contrast, natural examples that verifying the simulation results and explaining the geomorphic process are still lacking.
The unique geological-geomorphological conditions of the Cenozoic graben-range systems around the Ordos Block show asymmetric uplift of the ranges (i.e., controlled by the active normal faults) (Figure 1), and may provide perfect natural settings to reveal divide migration history in the field. In this study, we choose to investigate the landscape characteristics and possible divide migration history of the Zhongtiao Shan, a mountainous range which is located at the southernmost tip of the Shanxi Graben System. First, the tectonic background of the Zhongtiao Shan is distinct and its uplift was argued to be only controlled by the north Zhongtiaoshan normal fault [25,26]. Second, the Zhongtiao Shan is crossed by the Yellow River and both northern and southern sides of the range share a common base level (i.e., the Yellow River) (Figure 1), thus the geomorphic condition of the Zhongtiao Shan is simple. Third, the lithology and precipitation of the Zhongtiao Shan are quite uniform, and the elevation of the range is low with no glacier capping since the Quaternary [27]. Therefore, we may briefly exclude these issues as the controlling factor for divide migration, and explore the impacts of tectonic pattern on the regional landscape evolution.
In this study, slope and steepness analysis are firstly conducted to show the general landscape features of the Zhongtiao Shan. Secondly, the migration status of the Zhongtiao Shan divide is investigated following the drainage divide stability criteria [1,6]. Thirdly, based on our geomorphic results, in concert with previous simulation results, a divide migration model on the asymmetric uplift pattern is proposed. Finally, the asymmetric uplift history of the range and the activity of the range-front normal fault are further discussed.
2. Background Setting
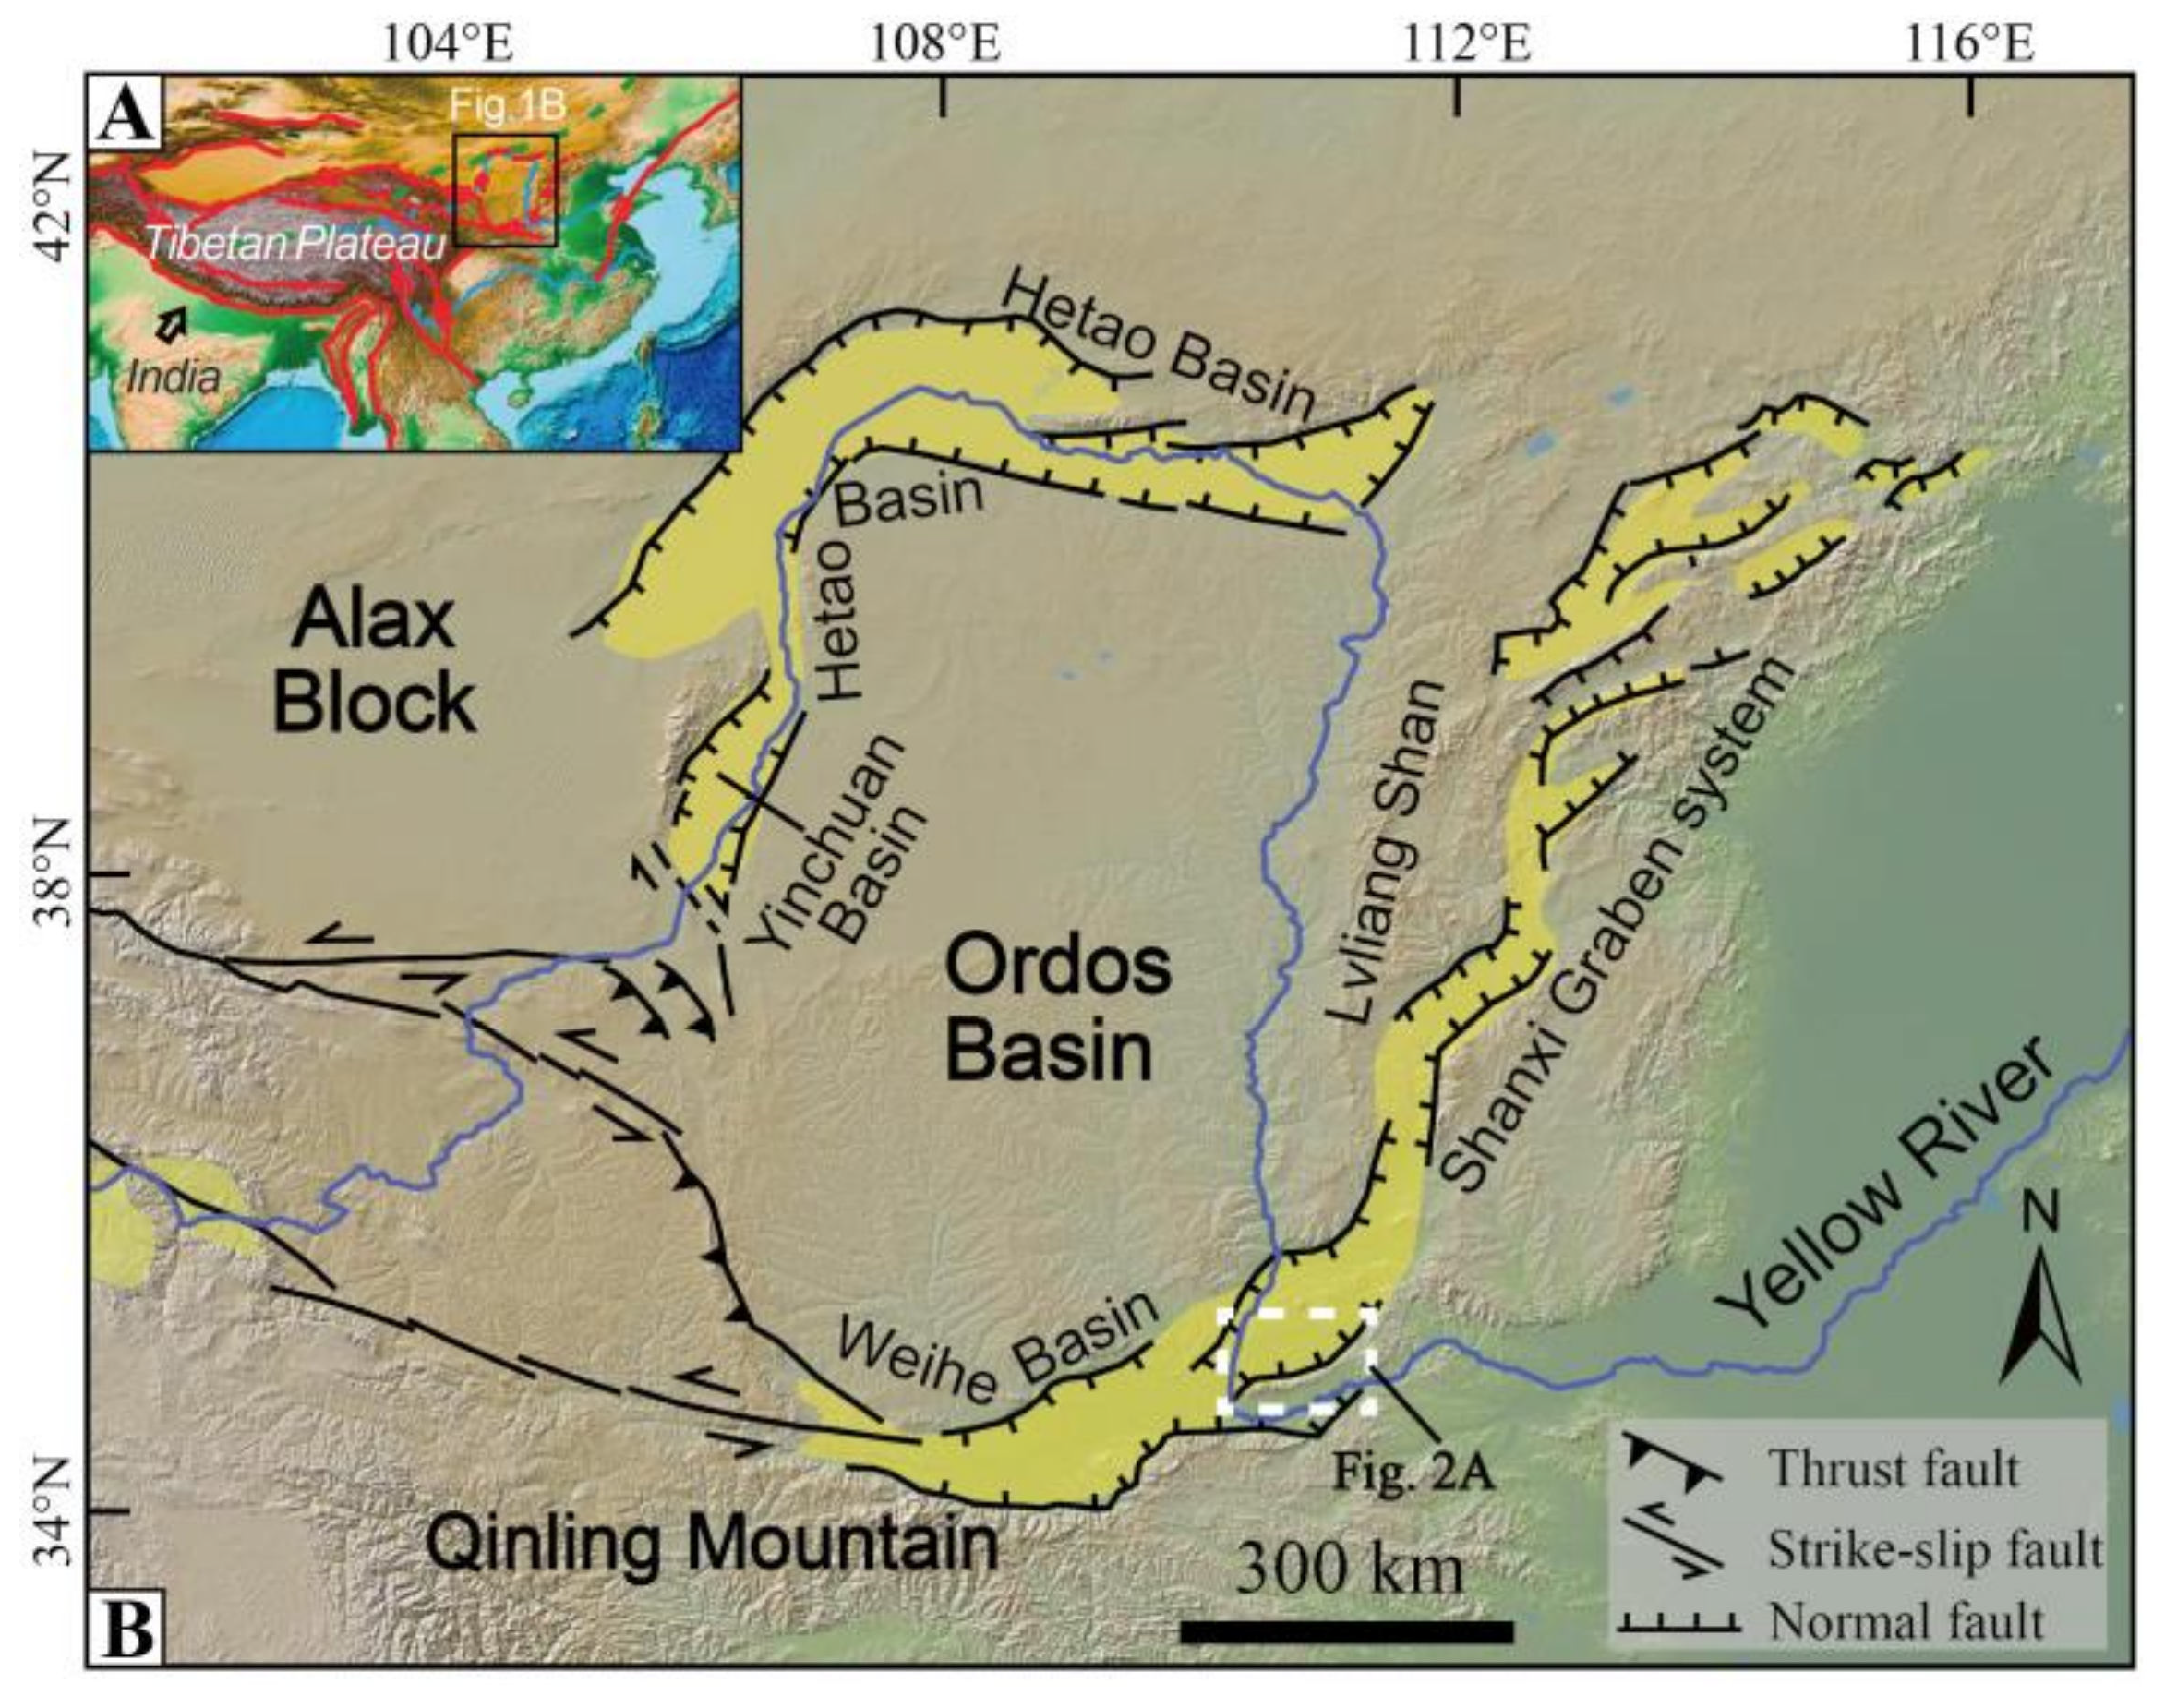
The Ordos Block is situated in the western part of the North China Craton and is surrounded by a series of Cenozoic graben systems, with the Yinchuan Graben to the west, the Shanxi Graben system to the east, the Hetao Graben to the north and the Weihe Graben to the south (Figure 1). Previous results from geology, seismicity, and geodesy investigations indicated that the graben systems were developed under a regional extensional stress field and characterized by the fault-uplift side of ranges and the subsidence of basins [29,30,31,32]. In addition, the ranges and basins are controlled by active normal faults and show the mirror image symmetry [25,28,32,33].
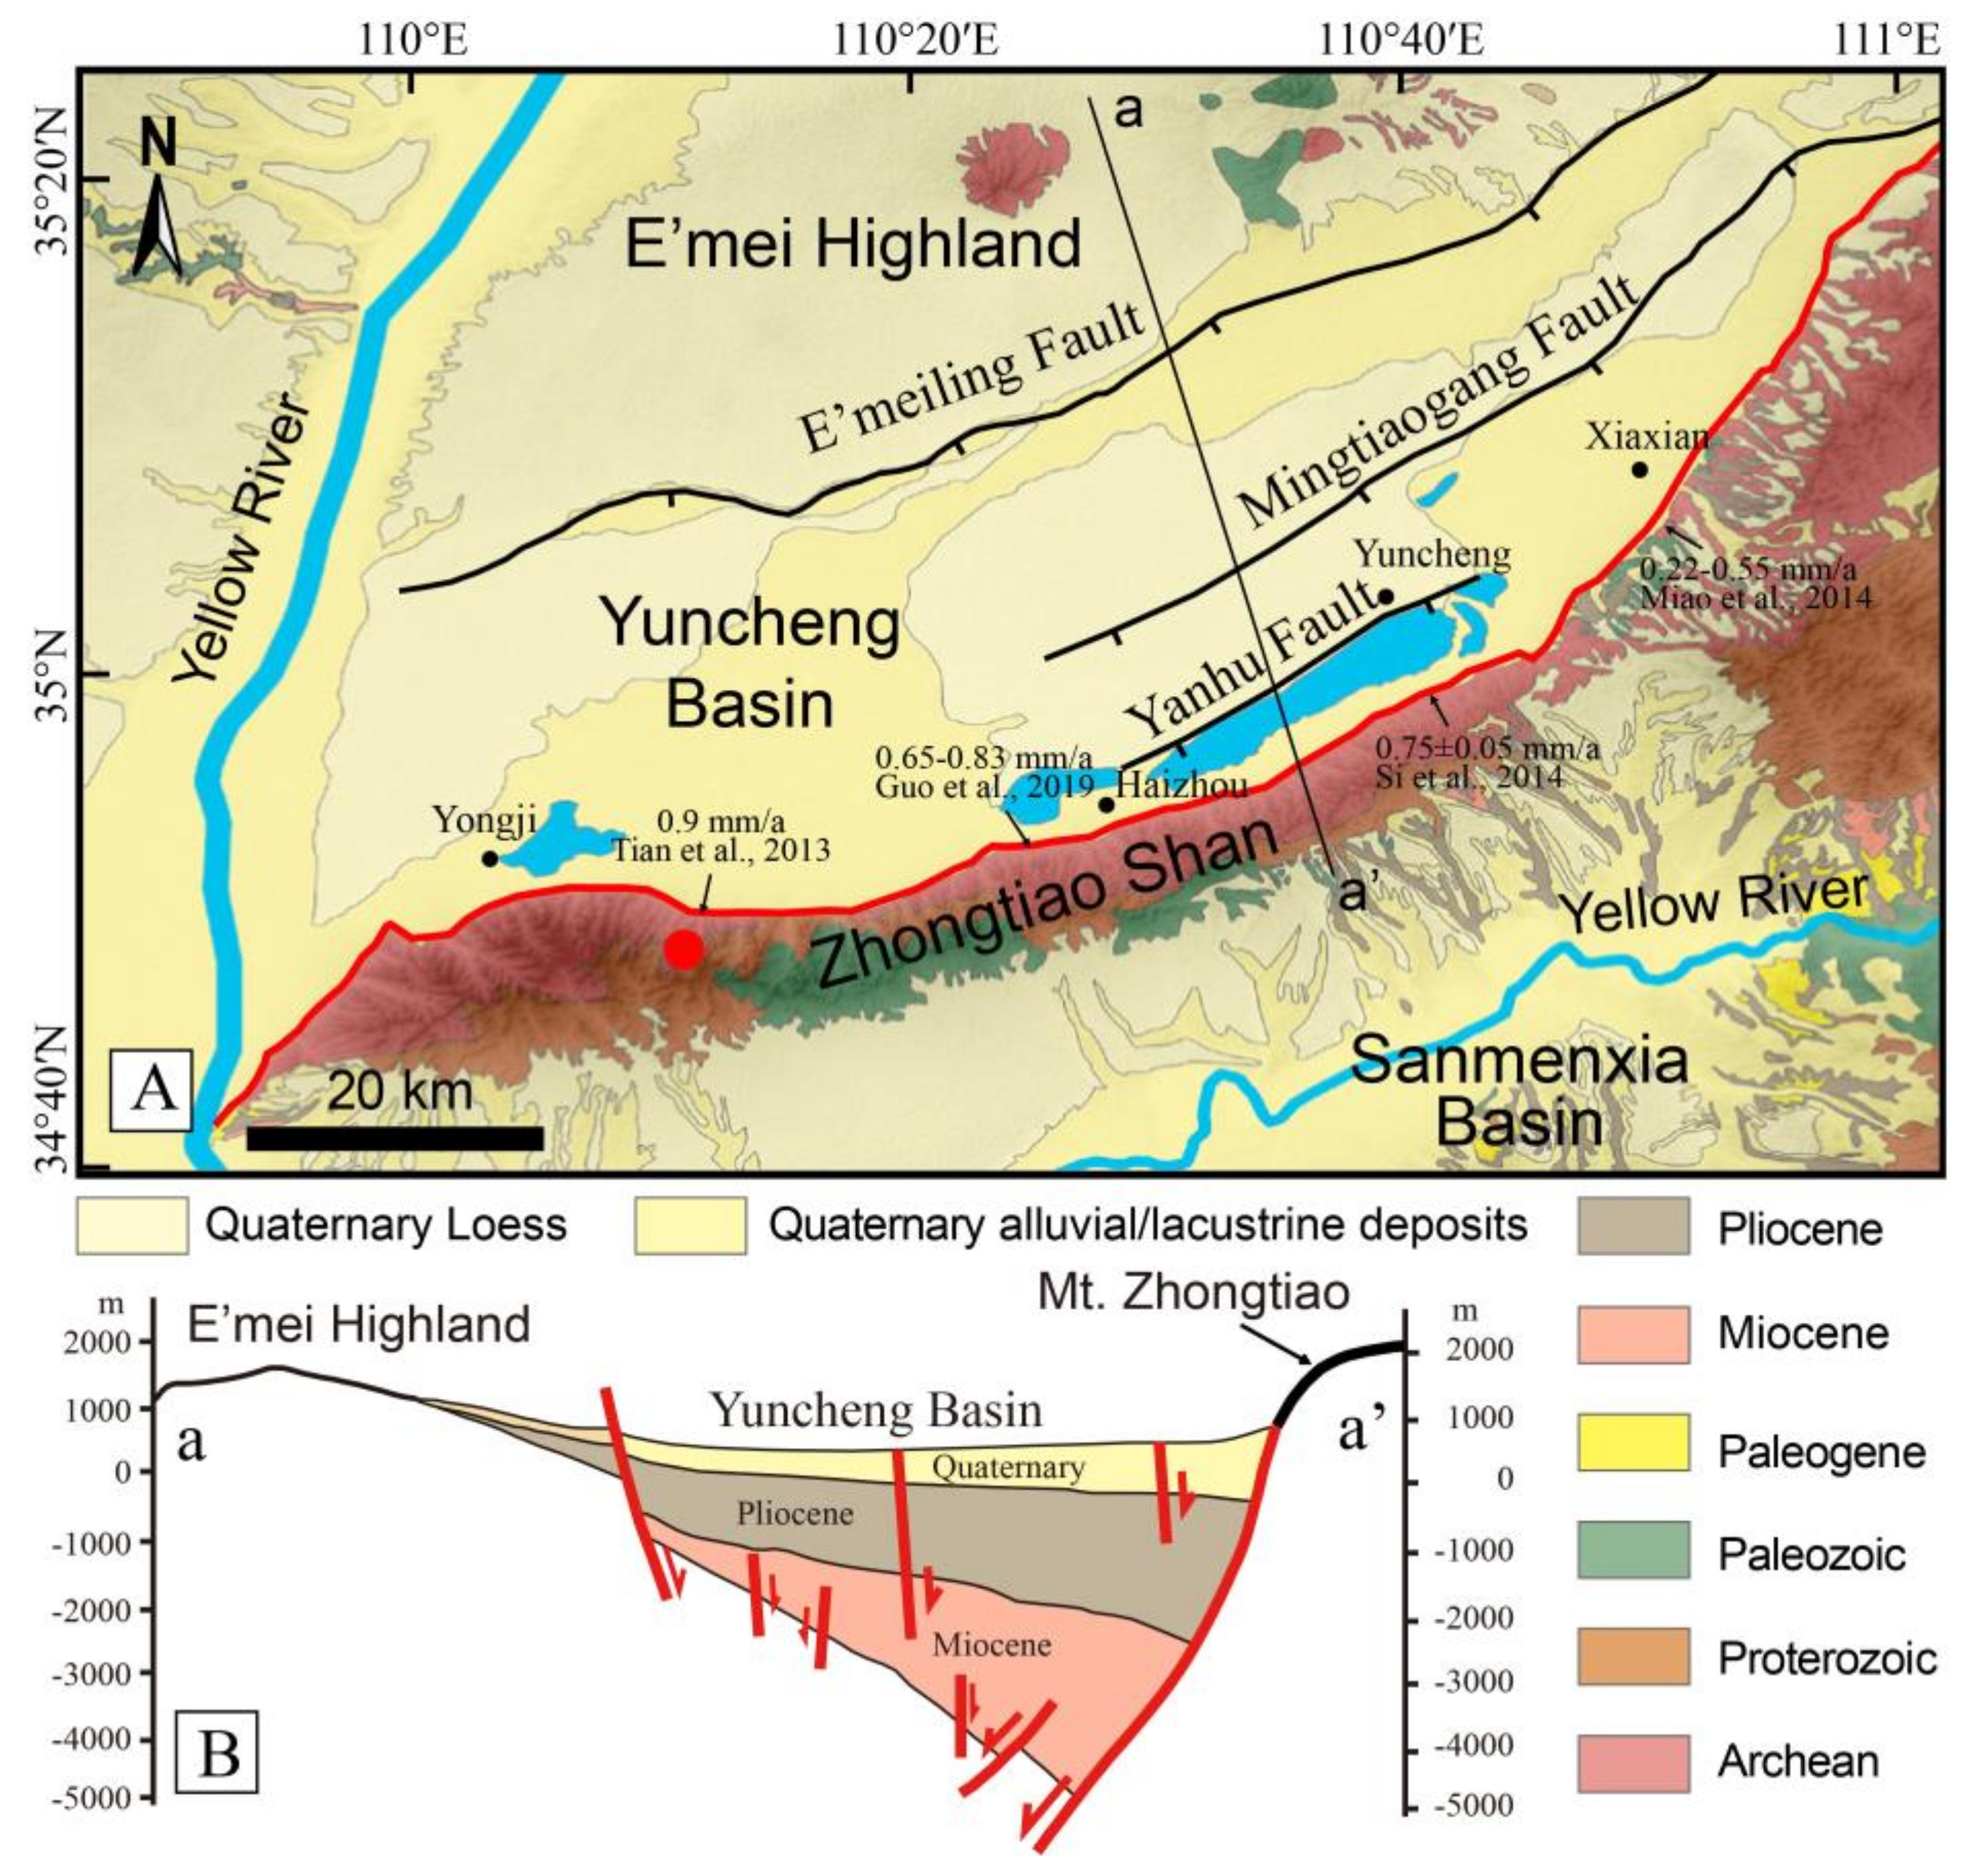
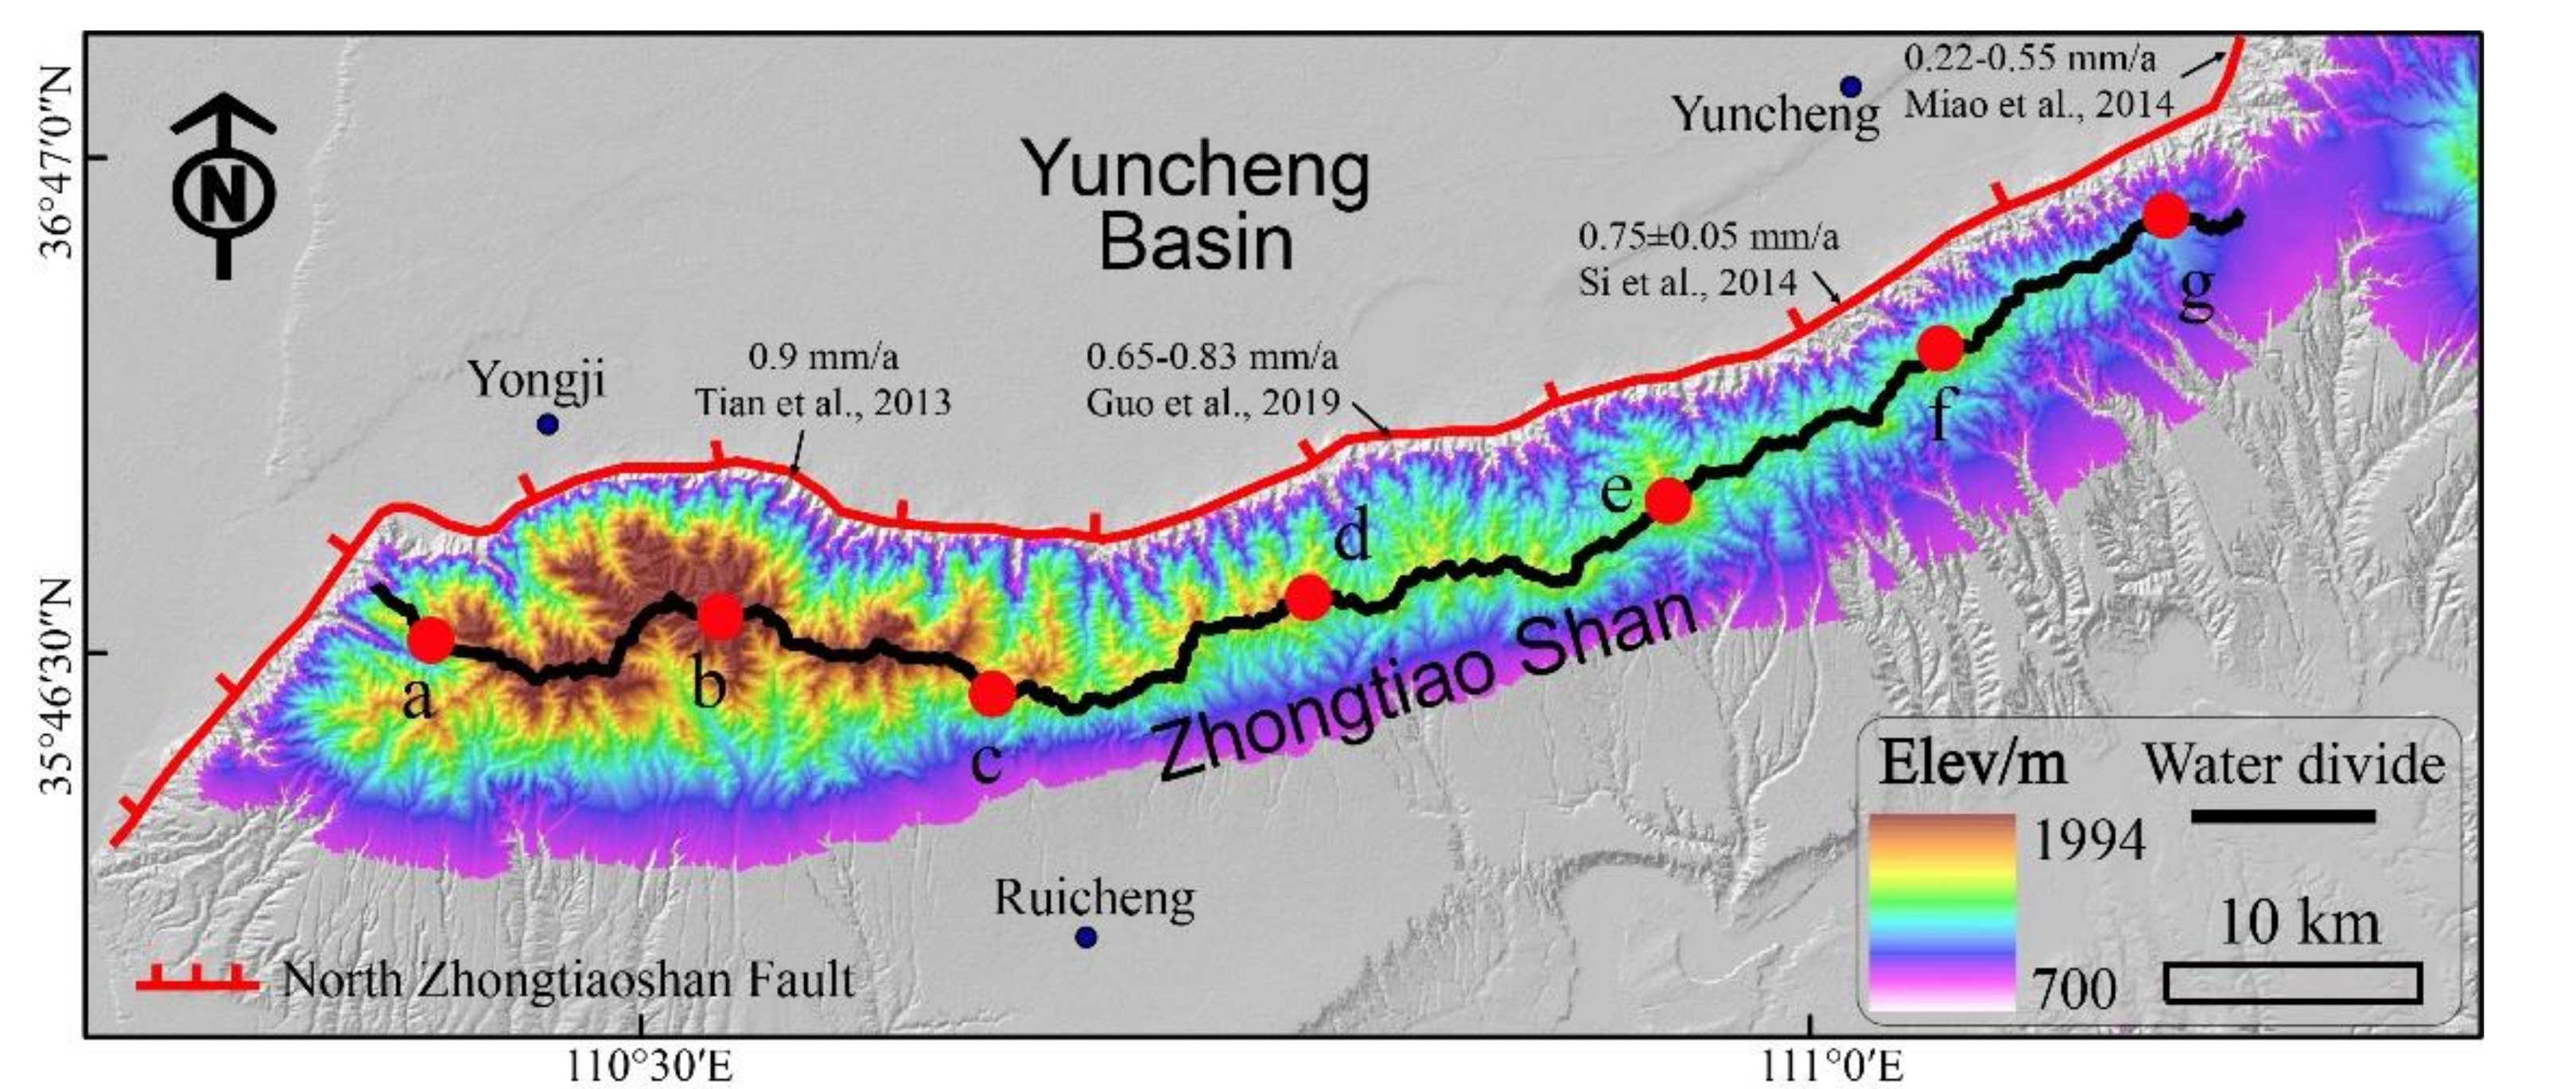
The Zhongtiao Shan is located to the southernmost tip of the Shanxi Graben System and shows a NE to NNE trend. The Zhongtiao Shan separates the Yuncheng Basin to the north from the Sanmenxia Basin to the south (Figure 2A). The stratigraphy of the main range includes Archean and Proterozoic metamorphic rocks, and Paleozoic marine deposits [27] (Figure 2A). The highest peak, Xuehua Shan, with an elevation of 1994 m a.s.l, is located at the western part of the range (see Figure 2A). It has been suggested that the uplift of the Zhongtiao Shan is controlled by its range-front fault, the north Zhongtiao Shan normal fault (NZTF) [25,33,34]. The fault has a total length of 130 km and trends from ENE to NNE (Figure 2A). Previous studies based on the interpretation of aerial images, topography measurements and excavation of trenches provided evidence for Holocene seismic activities for the NZTF [34,35,36], as also testified by at least four rupturing events found along the fault [37,38]. In addition, the mean slip rates of the western segment (i.e., 0.9 mm/a), the Salt Lake segment (i.e., 0.65–0.83 mm/a), the Haizhou segment (i.e., 0.75 mm/a) and the Xiaxian segment (i.e., 0.22–0.55 mm/a) of the NZTF since the late Pleistocene have been estimated respectively [34,35,36], by using the methods of high resolution remote sensing image interpretation, geological–geomorphological investigation, fault profile analysis and stratigraphic dating, and the slip rates decrease eastward [34,35,36,39]. The Yuncheng Basin represents the hangingwall basin of the NZTF and is filled by the Miocene to Pleistocene deposits [40,41]. The hangingwall block is a tilted block, dipping toward south and producing a depocenter close to the NZTF. This is highlighted by the thickening of basin fill deposits moving from north (few hundred meters) to south (more than 5000 m), as testified by drilling and geophysical data [25,40] (Figure 2B).
3. Methods
3.1. Channel Steepness
Channel steepness has long been regarded as a powerful reconnaissance tool to interrogate the rates and patterns of deformation in active mountain belts [42,43,44,45,46]. Analysis of bedrock profiles always relies on the stream power incision model, which is usually conceptually modeled as a power-law function of contributing drainage area (a proxy for discharge) and channel gradient [43,47]:
where dz/dt is the channel elevation change over time; U is the bedrock uplift rate; A is upstream catchment area and S is channel gradient; K is a constant depending on rock erodibility, precipitation rate, and channel geometry; and m and n are empirical constants [42,48]. If the stream power equation is used to describe the evolution of a river profile, a common analytical approach is to assume a topographic steady state (dz/dt = 0) with uniform U and K, and the Equation (1) can be transformed for the channel slope as
where the parameters ks and θ are the steepness and concavity, respectively [49]. Assuming a steady-state river profile under constant rock uplift rates and erodibility in time and space [2,50], we can integrate Equation (2) as
where zb represents the elevation at the river’s base level at x = xb. The quantity χ, an integral function of position in the channel network, can be expressed as [2,50]:
Equation (5) shows a linear relationship of z(x) and χ (always referred to Chi-plot), in which the dependent variable z behaves as the vertical axis and the integral quantity χ is the horizontal axis [51]. In addition, the dimensionless slope (U/K)1/n/A0m/n can be used to determine the channel steepness, as A0 is often set to be 1 m2 [2]. Therefore, Chi-plot is often used to infer regional relative bedrock uplift rate [49,52]. Moreover, the difference of χ across a water divide can also be used to indicate presumable motion of the divide in simple synthetic landscapes (i.e., uniform uplift, rock erodibility, and climate), with divide migrating to the direction of larger χ for equilibrium [2,53,54]. In this study, the channel steepness of the rivers from the Zhongtiao Shan and its adjacent areas was calculated based on the Topographic Analysis Kit (TAK) [55] for TopoToolbox [56], with a reference concavity of 0.45. Furthermore, regional slope distribution was also determined by means of the GIS software from the origin SRTM1-DEM database (https://earthexplorer.usgs.gov/) to show the general landscape features in our study area.
3.2. Gilbert Metrics and χ
As mentioned above, cross-divide χ anomaly has been widely accepted and used to indicate the direction and rate of a migrating divide [2,17,53,54]. However, subsequent studies pointed out that χ-anomalies may indicate incorrect divide migration direction in practical applications (i.e., landscape experiencing asymmetric uplift and spatially-various rock erodibility) [6,14]. Recently, the Gilbert metrics (i.e., cross divide contrasts in headwater elevation, relief, and gradient), originally put forward by Gilbert [1] and then formalized by Whipple [6], were suggested to be well correlated to current direction of divide migration in unsteady-state landscapes [14]. The metrics were firstly posited as that if a divide is asymmetric, that would induce differential erosion across the divide; driven by the erosion contrast, the divide would migrate towards the side with lower slope, lower relief, and higher channel head elevation [1]. The latest study suggested that using χ metric, in concert with the Gilbert metrics, is ideal for interpreting the current migration of the drainage divide [14,57]. In addition, if χ disagrees with the Gilbert metrics, this likely suggests that the Gilbert metrics may indicate current divide behavior, and that χ is indicating potential future divide behavior when the differences in uplift rate are eliminated [14]. In this study, we used the Gilbert metrics, in concert with χ, as suggested by a previous simulation result [14], to investigate the condition of the Zhongtiao Shan main divide.
To determine the drainage network, a contributing drainage area threshold of 1 km2 was chosen to define the channel head in this study. Hence, the elevation metrics can be extracted by the channel head elevations. Local relief was determined by the range of elevation in a circular window and the slope gradient is the average topographic gradient between the channel head and the highest point within the analyzed window [14,57]. In this study, the main divide of the Zhongtiao Shan was divided into six segments (i.e., the ab, bc, cd, de, ef, and fg segments) for detailed analysis, as suggested by Fort and Whipple [14]. Every segment was separately analyzed for their χ and Gilbert metrics distributions, and further for the divide condition. As all the rivers used to calculate the Gilbert metrics and χ should terminate at a common base level [2,14], and nearly all the calculations should be determined in bedrock channels, we therefore chose a base level of 700 m based on the field condition of the Zhongtiao Shan (Figure 3).
4. Results
4.1. Topographic Steepness and Slope
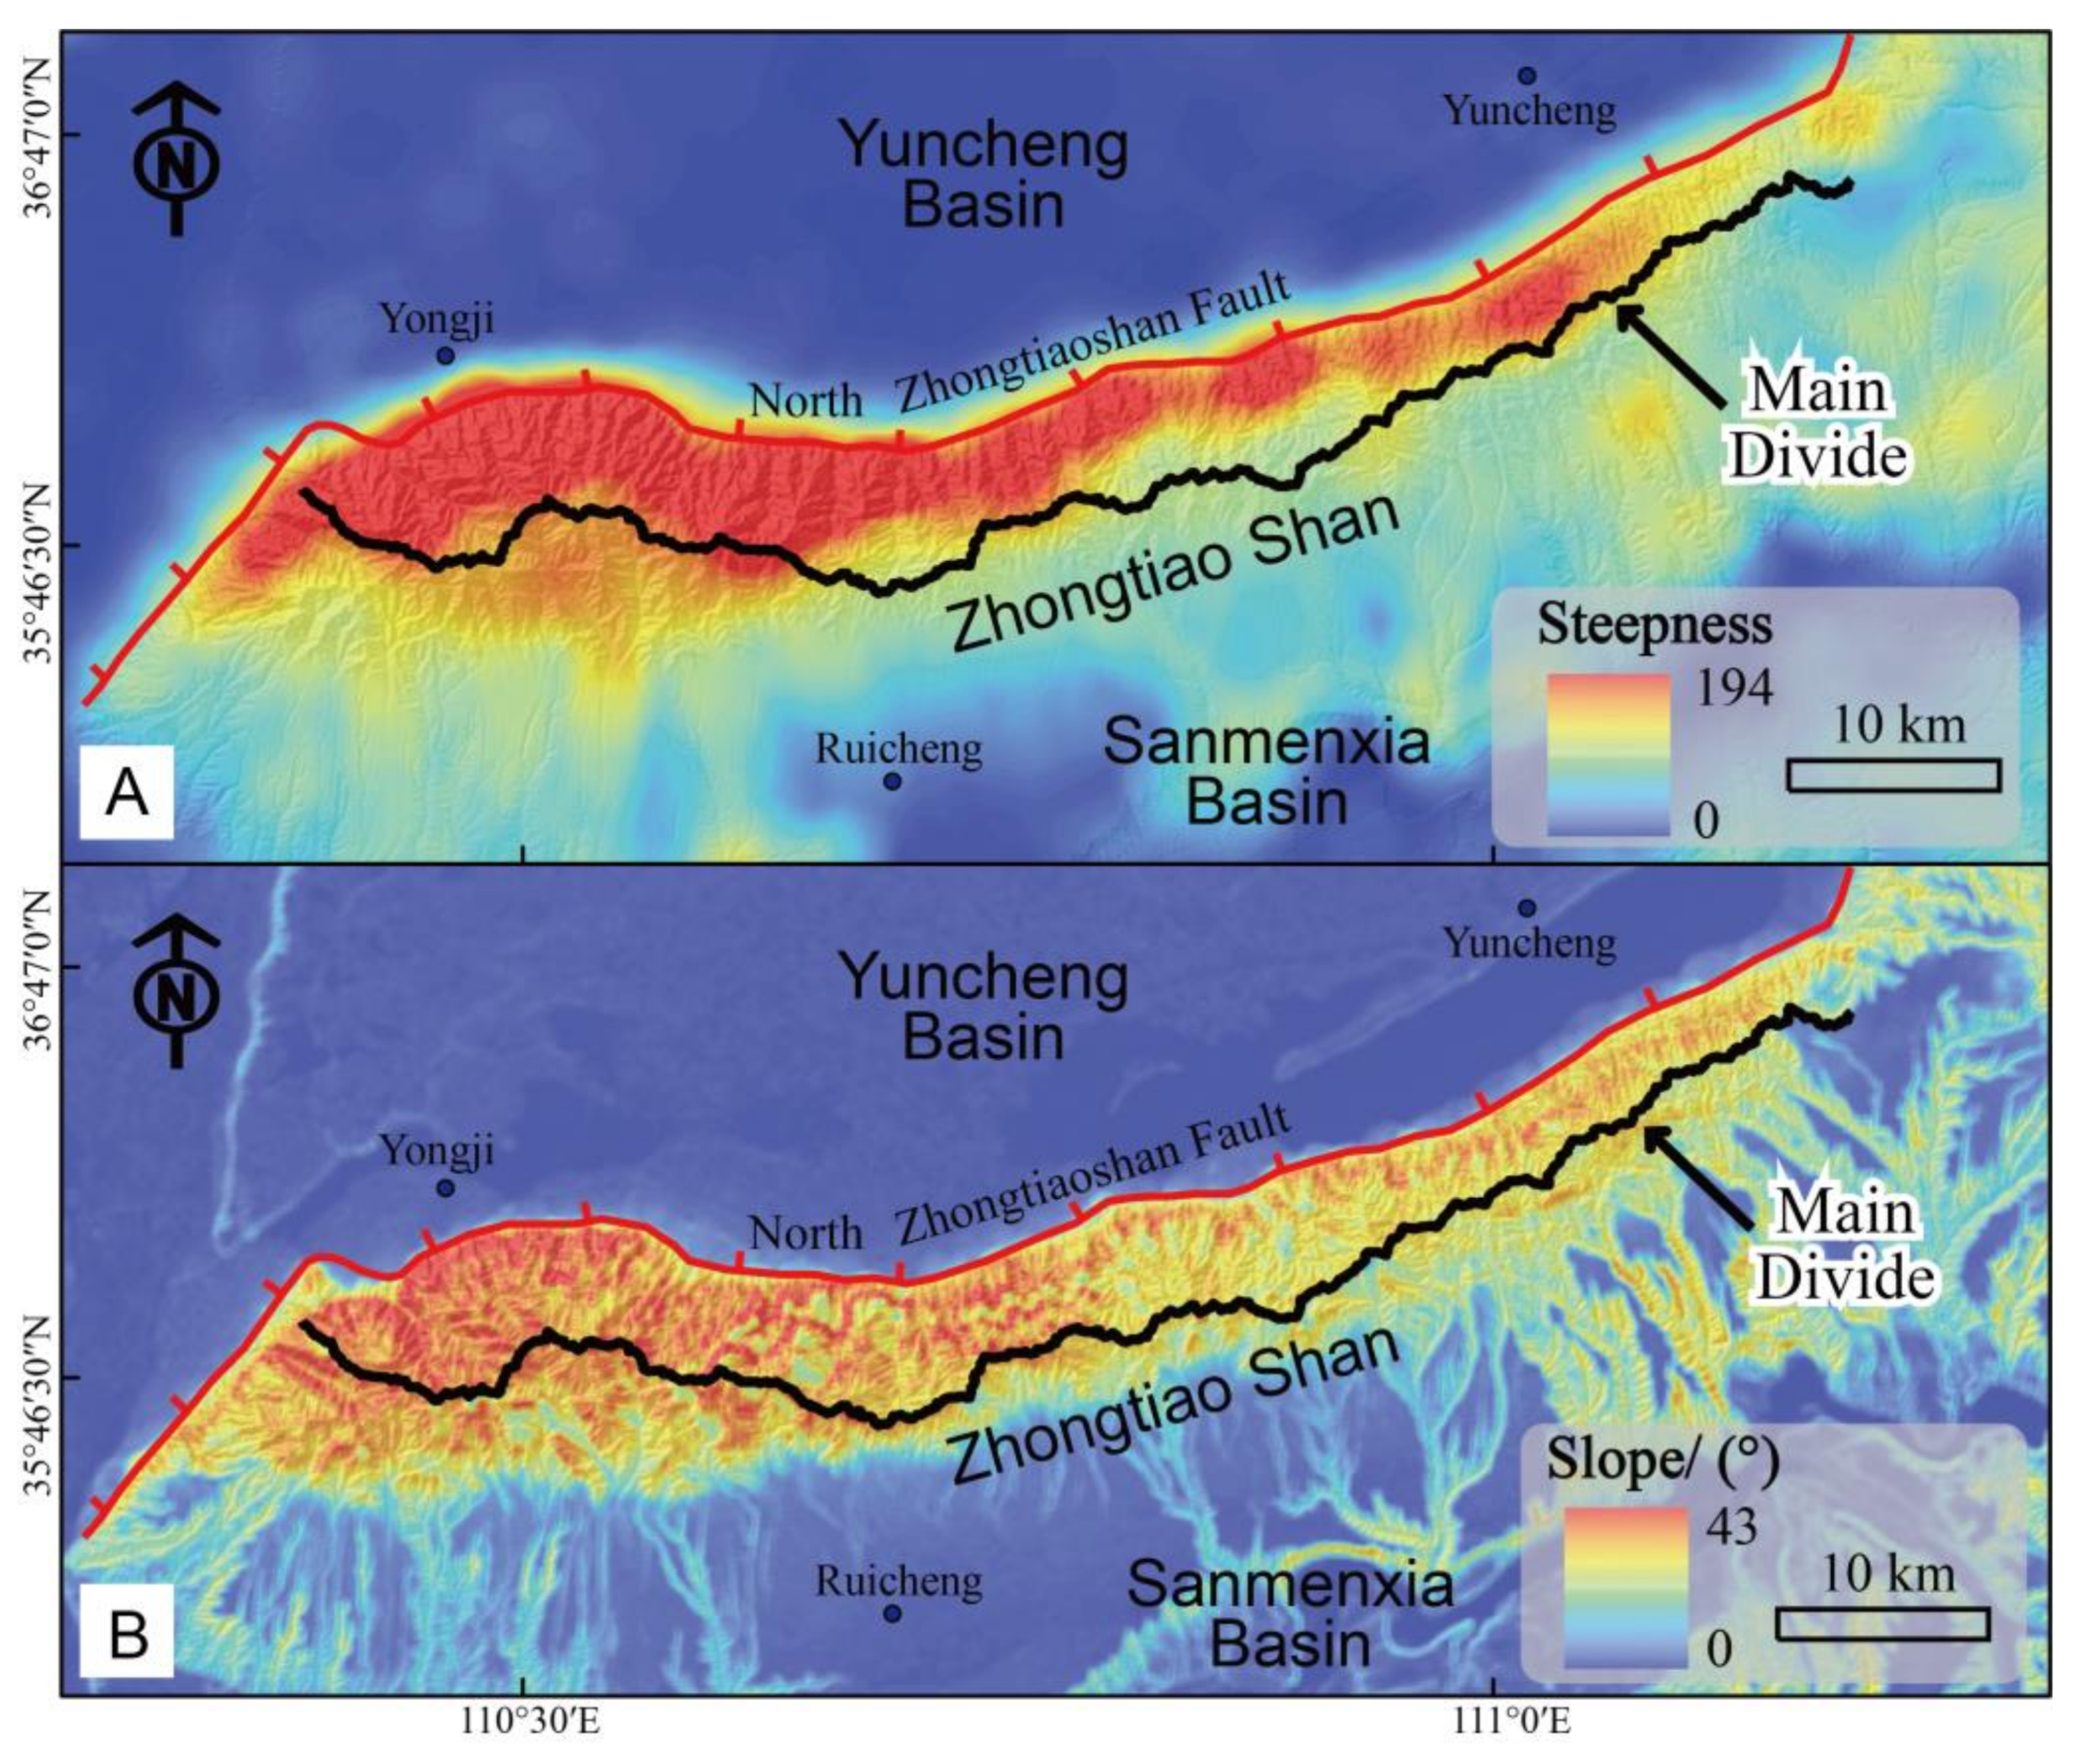
Figure 4A shows that high values of the channel steepness are mainly distributed in the area between the north Zhongtiao Shan fault and the main range divide (i.e., the north-range area), and that the high values decrease gradually along the strike of the Zhongtiao Shan from west to east. The lowest steepness is mainly distributed in the Yuncheng Basin (i.e., the hangingwall basin area) on north side of the NZTF. It should be noted that the steepness shows a cliff-like drop across the fault, moving from south to north. In addition, the steepness values on the southern side of the main divide (i.e., the south-range area) are lower than that on its northern side; but the steepness in the south range area is obviously higher than that in the basin area.
The slope distribution nearly shares a same trend with the steepness, with the highest values in the north-range area, decreasing from west to east along the range strike, and the lowest values mainly in the basin area (Figure 4B).
4.2. Gilbert Metrics and χ
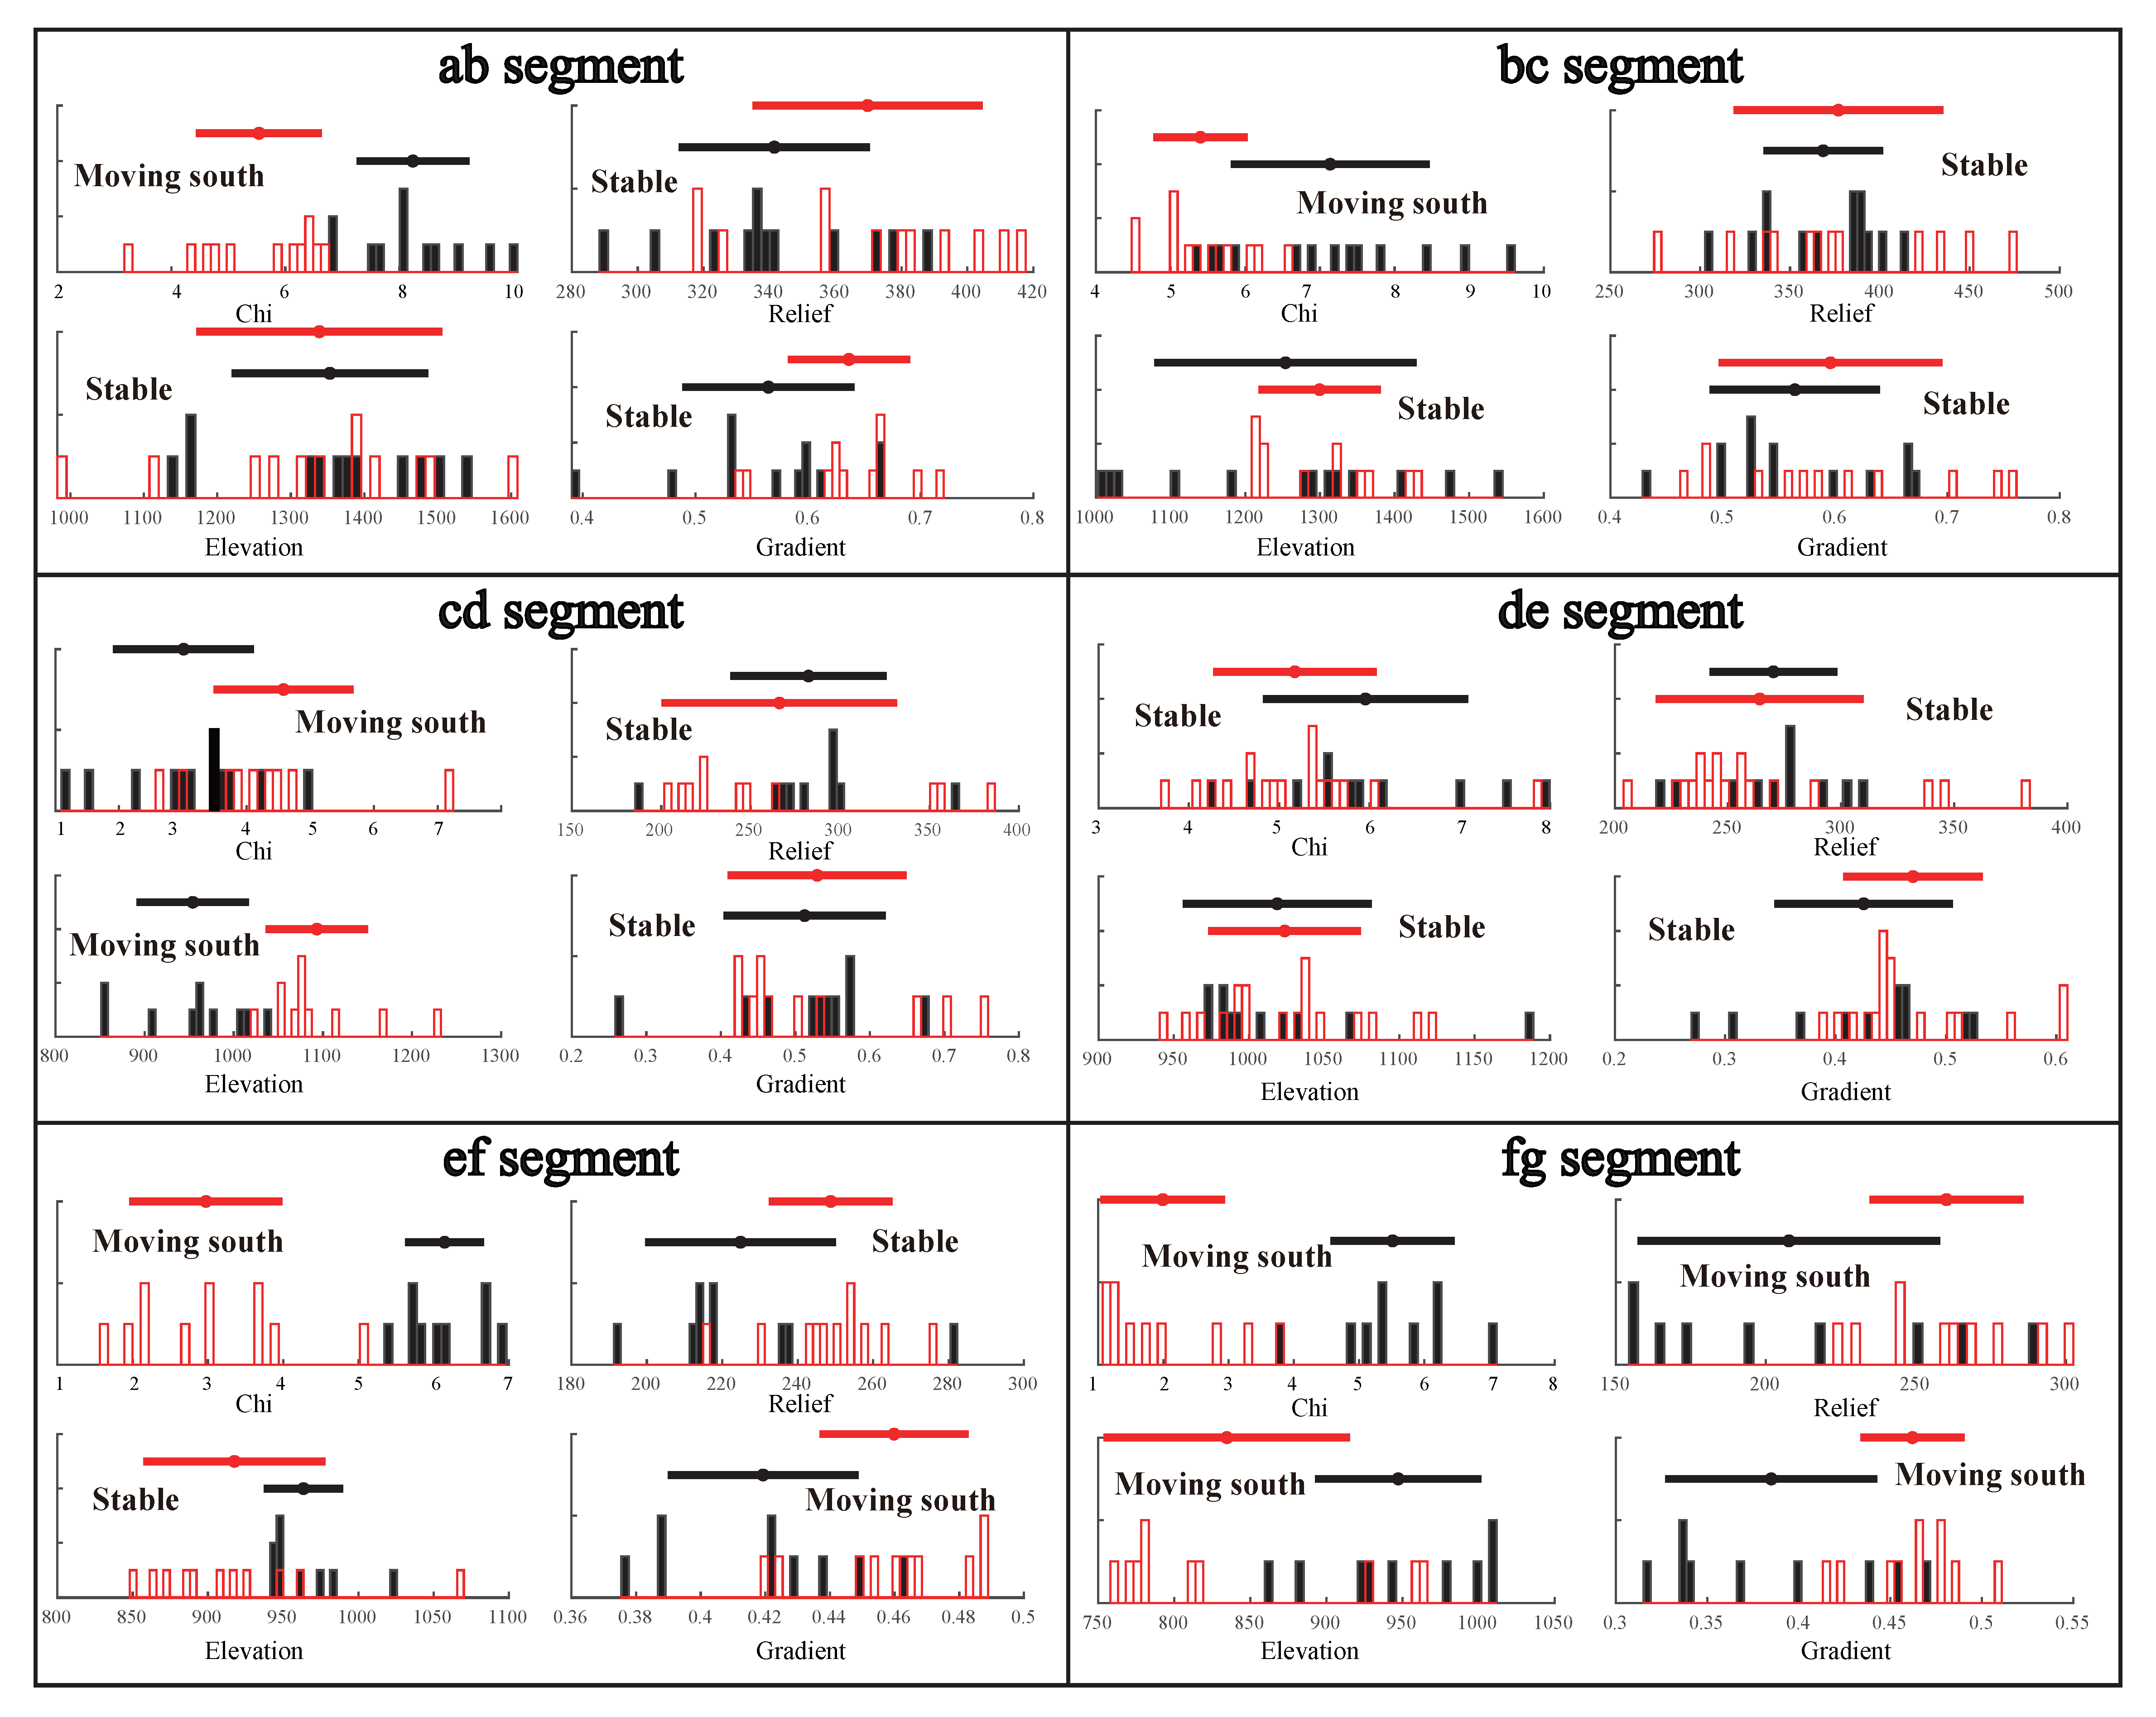
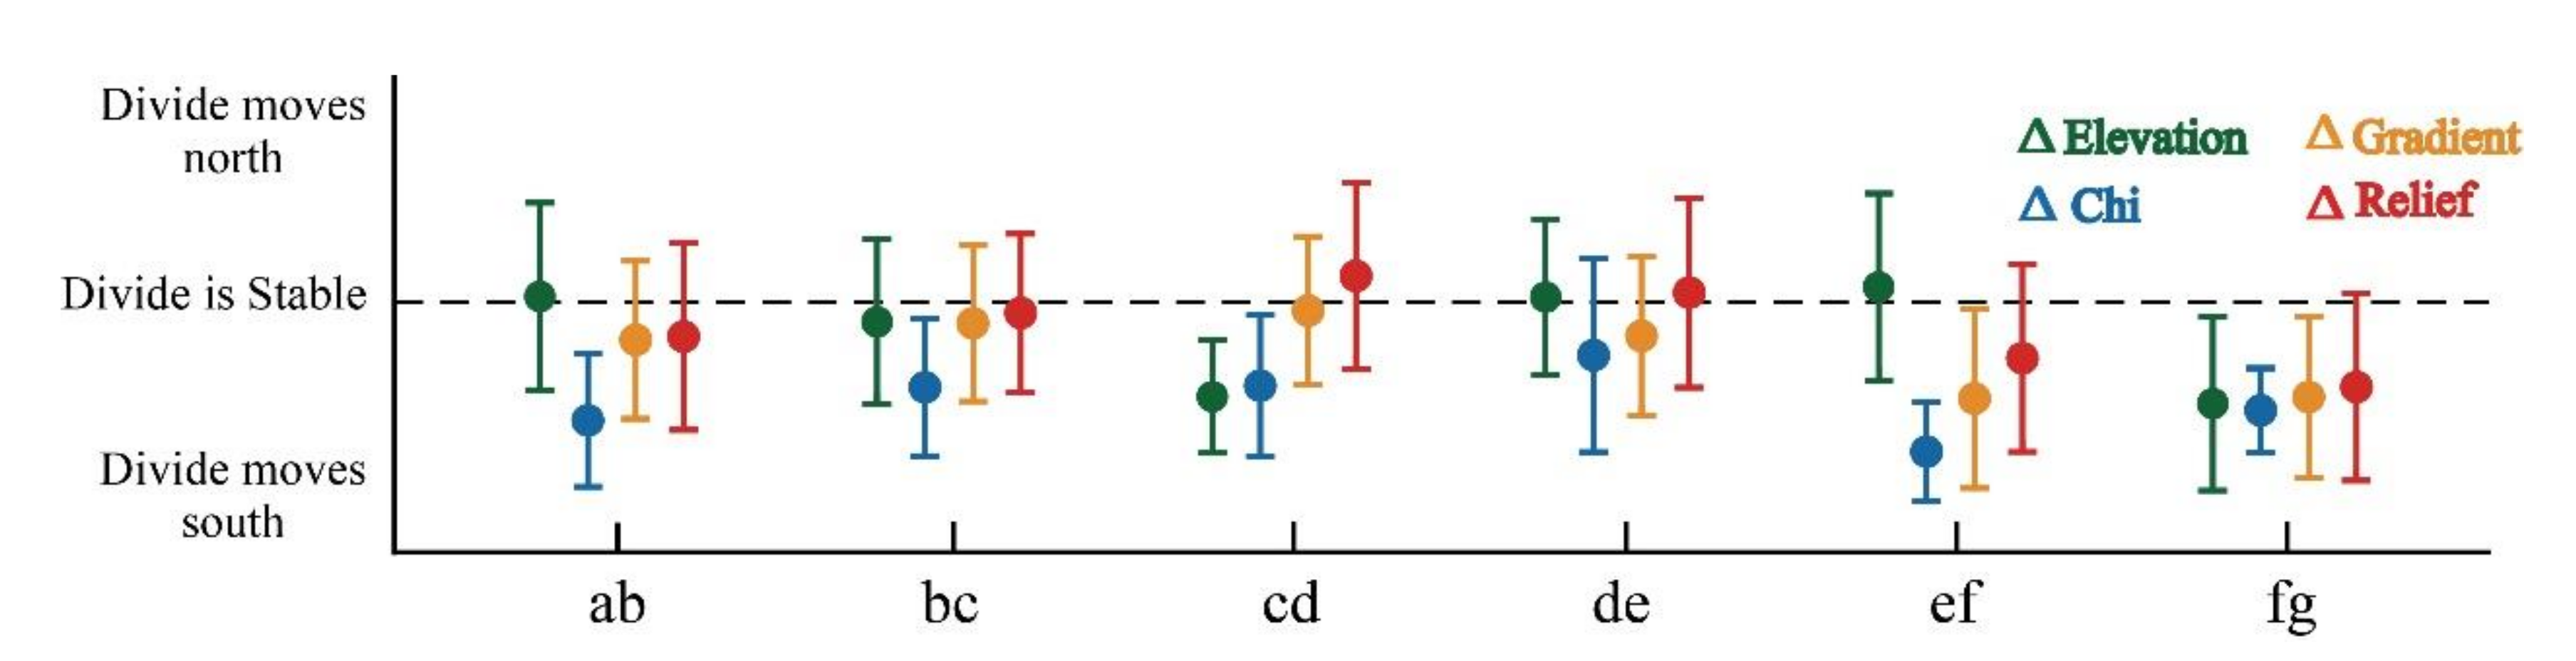
The mobility of all the six segments was calculated and analyzed for the potential different status of the main divide in different tectonic activities (Figure 3). Based on the histograms of the cross-divide values of the metrics at the reference drainage area, the ab, bc, cd, and de segments show that the current main divide is stable, while the ef and fg segments indicate that the divide is moving southward (Figure 5). More interestingly, the χ metrics of the ab, bc, and cd portions show a southward moving divide. In addition, a standardized analysis on migration direction [14] of all 6 segments was also conducted (Figure 6). The results show that, across all the six divide segments, χ and Gilbert metrics are consistent with what is predicted from the histograms (i.e., the western part of the main divide is currently stable, while the eastern part is moving southward) (Figure 6).
5. Discussion
5.1. Asymmetric Uplift and Erosion
Several studies have proved that bedrock channel steepness can be regarded as the surrogate for regional relative uplift rate [42,45,59,60,61,62], and slope distribution in tectonically active mountain belts usually positively correlates with local erosion [63,64,65]. As the slope in the Zhongtiao Shan shows exactly the same distribution as the steepness (Figure 4), here we just analyze the uplift pattern of the Zhongtiao Shan based on the steepness, and the regional erosion pattern should be the same as the uplift pattern.
In this study, the steepness distribution pattern in the Zhongtiao Shan and the Yuncheng Basin (i.e., high steepness in the mountain area and low steepness in the basin area) (Figure 4A) is similar to those observed in the Longmen Shan and Sichuan Basin [42], and the Himalaya and the Indian foreland [42,66]. As the physiography of the Zhongtiao Shan is directly controlled by the range-front fault and holds a series of metamorphic hard rocks [25] (Figure 2), we speculate that the fault activity and lithological properties may make a difference in the cliff-like drop steepness variance in the range and basin areas (Figure 4A). Previous neotectonics [29], paleoearthquake [34,37], sedimentary [40], and geophysical [26,67] records of the Zhongtiao Shan and the Yuncheng Basin confirmed that the range and the basin were formed under a regional extensional stress field. In addition, the Yuncheng Basin, bounded on the south by the NZTF, shows a wedge-shaped Neogene infilling, with the thickness of the sediments increasing moving from north to south (i.e., toward the depocenter and close to the master-fault plane) [25,40] (Figure 2B). We therefore suggest that the extensional stress, regulated by the NZTF, between the Zhongtiao Shan and the Yuncheng Basin drives unloading of the footwall (i.e., the Zhongtiao Shan) and depression of the hanging wall (i.e., the Yuncheng Basin). Therefore, the amount of tectonic uplift in the mountain and the sedimentary thickness in the basin gradually decreases, as the distance to the fault increases. For the Zhongtiao Shan, holding uniform cross-divide precipitation and rock erodibility [68], the tectonic control should be the crucial reason leading to the steepness difference between the north-range area and the south-range area (Figure 4A). Moreover, on the north Zhongtiao Shan, the steepness decreases gradually along the strike of the Zhongtiao Shan from west to east, possibly indicating higher uplift rates on the western part (Figure 4A). This uplift pattern is consistent with the geologically-constrained slip rates of the NZTF, as the slip rates of the fault also decrease from west to east (Figure 3) [34,35,36,37]. This consistency also confirms the cognition that the NZTF is the crucial factor controlling the growth of the range, and further suggests that the uplift of the Zhongtiao Shan is spatially variable.
As analyzed above, the erosion should share a same pattern as the uplift, indicating higher erosion on the northern-range area. Thus, we can conclude that the Zhongtiao Shan is experiencing the asymmetry uplift/erosion patterns, with higher uplift and erosion on north flank of the range.
5.2. The Model of Dynamic Divide Migration
As the cross-divide precipitation and rock erodibility are nearly uniform [27] (Figure 2), the Zhongtiao Shan provides a good natural example depicting the divide migration status in response to the asymmetric uplift and erosion patterns. Based on our geomorphic results discussed above, the Zhongtiao Shan is indeed experiencing the asymmetric uplift, with higher uplift and erosion on its northern flank (Figure 4). Based on the divide mobility results, the western part (ab, bc, cd, and de segments) of the main divide is currently static under the asymmetric uplift and erosion, albeit with the potential to move southward (i.e., as indicated by the χ metric). Differently, the eastern divide (ef and fg segments) is moving southward (Figure 5 and Figure 6).
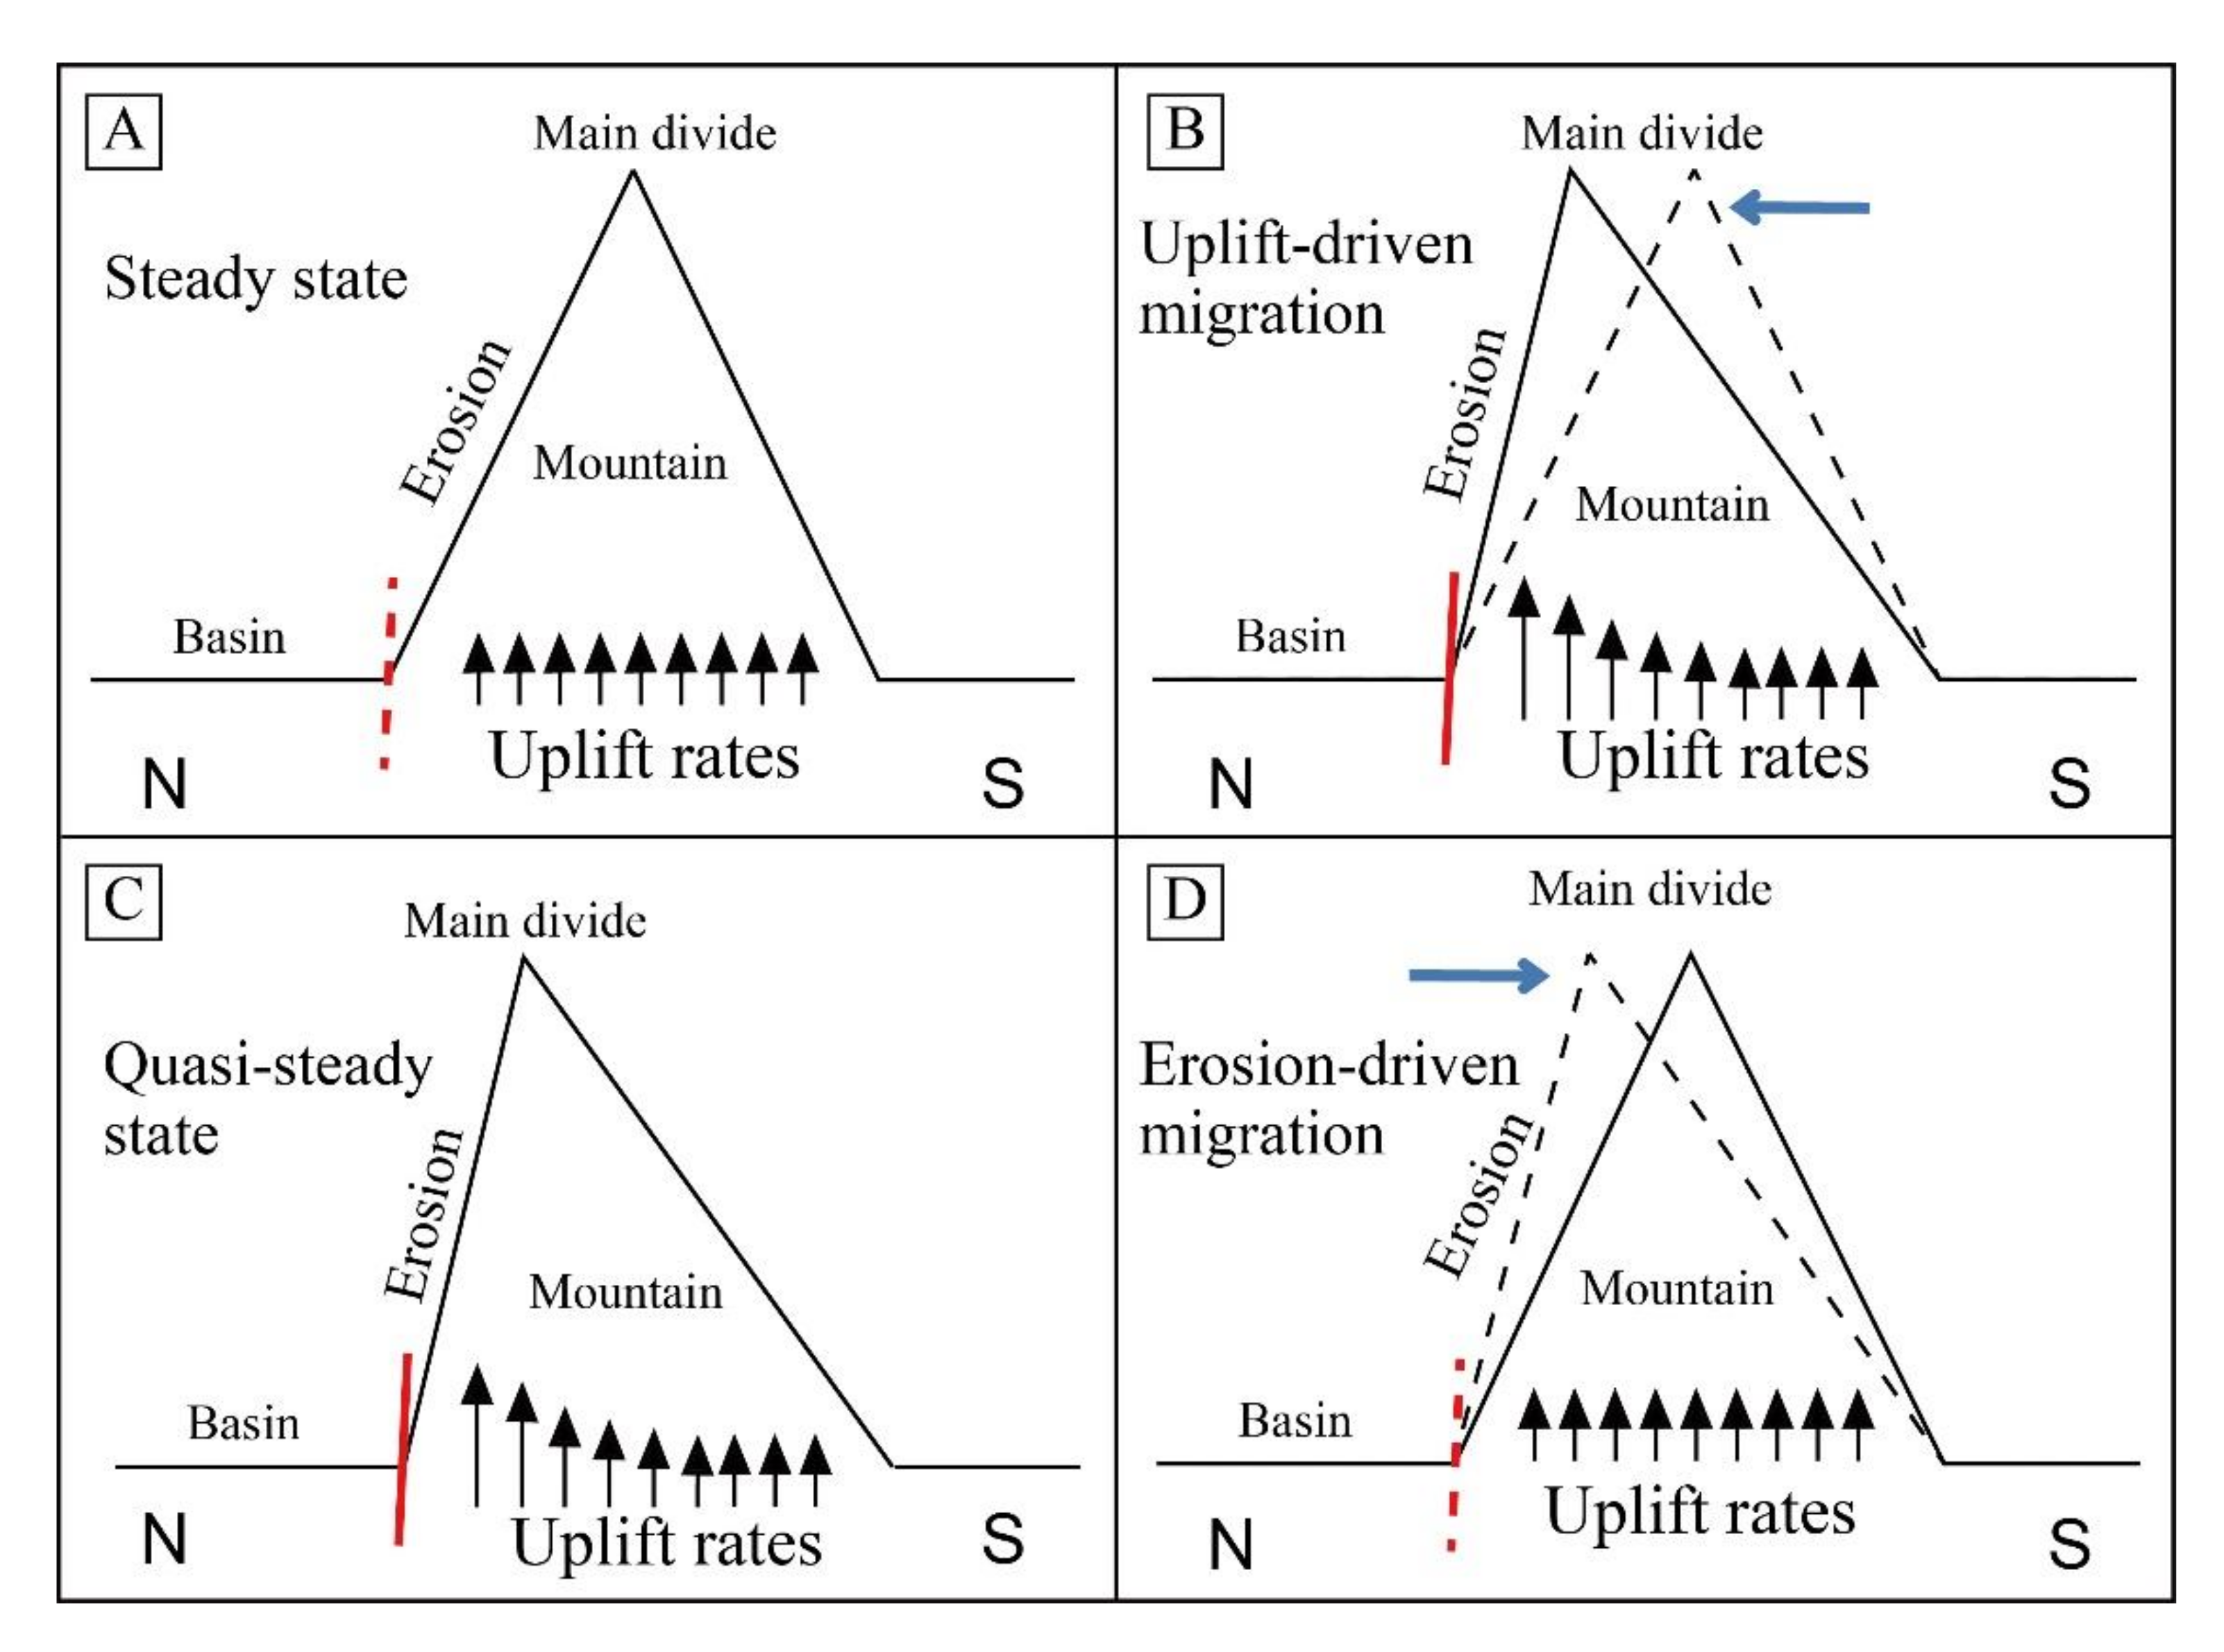
As suggested by previous studies, the main divide of a steady-state landscape, characterized by uniform tectonic uplift, precipitation distribution, lithology, and base level, should locate on the geometric center and show balanced uplift and erosion [3,69]. While, if the pre-existing steady state landscape starts to experience an asymmetric uplift (i.e., induced by fault activity), the uplift may immediately outpace the erosion on the footwall block [69]. As a consequence, the main divide will tend to migrate towards the higher uplift flank [15,21], steepening its channels to increase the erosion rate, and match it to the high uplift rate (Figure 7). When the erosion is high enough to balance the uplift, the landscape system will finally reach a quasi-steady state. While the main divide should also have the potential to migrate backward [14]. The Gilbert metrics results on the western Zhongtiao Shan divide indicate a static divide, while the χ metrics suggest a southward movement (Figure 5 and Figure 6). The results show a perfect agreement with the “Asymmetric uplift simulation” in [14], and we therefore suggest that the western divide is in a quasi-steady state and the erosion matches the uplift on the fault-uplift side. In addition, it can be expected that when the tectonic uplift becomes uniform again, the erosion may immediately outperform the footwall uplift [69,70]. Driven by the relative high erosion on the footwall block, the divide may gradually migrate back to the previous position (i.e., the geometric center). According to the divide migration results, both the Gilbert and χ metrics show that the eastern Zhongtiao Shan divide is moving southward (Figure 5 and Figure 6), indicating that uplift on the upthrown block is outpaced by the erosion. In addition, the dynamic divide migration process is also consistent with the results from the newly-proposed DULAB (Differential Uplift LAndscape evolution Box) (https://sites.google.com/site/gorenliran/dulab).
We can therefore speculate that the asymmetric uplift of the Zhongtiao Shan, controlled by the activity of the NZTF, had pushed the main divide to move northward, resulting in the asymmetric erosion. Moreover, now, the western divide is in the “Quasi-steady state step”, the uplift and erosion balance each other well and hold the divide in place (see Figure 7C). While the eastern part is in the “Erosion-driven migration step”, indicating that the uplift is obviously outpaced by the erosion, leading to the southward migration of the divide (see Figure 7D).
5.3. Fault Activity History
According to the dynamic divide migration process (Figure 7), the southward moving eastern divide should be in the “Erosion-driven migration”. We can therefore suggest that the eastern divide had reached the quasi-steady state in its geological history, indicating that the uplift balanced the erosion on the fault side. However, both the Gilbert and χ metrics reveal that the eastern divide is now migrating southward (Figure 5 and Figure 6), and the uplift is obviously outpaced by the erosion. Therefore, in its geological history, the eastern segment of the NZTF should have owned higher slip rates, driving a higher range uplift rate and pushing the eastern divide further north than its current state (i.e., the “Uplift-driven migration”), and finally reaching the “Quasi-steady state”, just as the modern state of the western divide (Figure 5, Figure 6 and Figure 7C). The modern southward migrating eastern divide must be resulted from the decrease of the slip rate of the eastern fault (i.e., the uplift rate of the eastern range), causing disequilibrium between the uplift and erosion (i.e., uplift is outperformed by erosion). Both paleo- and neo-seismological results reveal that the slip rates of the NZTF decrease eastward [34,35,36,58], while the thickness of the Yuncheng Basin infillings is quite homogeneous along the strike of basin-margin (i.e., depocenter of the hangingwall block) (~5000 m) [40,68]. This discrepancy between the slip rate variations and the sediments thickness in the Yuncheng Basin near the normal fault could also suggest that the eastern sector of the NZTF should have owned a higher slip rate than that of the more western sectors in early times. This should have coincided with a migration of the depocenter in time and space, and therefore recorded by the stratigraphic record [68]. That is, the higher slip rate of the eastern normal fault in the geological history induced higher uplift and erosion on the fault side, deposited an amount of sediments in the corresponding range-front areas. After that, the slip/uplift rate decreased, inducing smaller amount sediments accumulation, and driving southward migration of the eastern main divide. On the other hand, the current stable western divide (with the potential to move southward) may indicate that the activity of the NZTF sustains the presence of the uplift rate gradient that is "holding" the divide in place, and suggest the expected reaction of the divide if or when this uplift rate gradient dissipates. Therefore, we speculate that the western part of the NZTF may remain its slip rate along with the mountain relief generation.
6. Conclusions
In this study, we revealed the dynamic migration process of the main divide through geomorphic analysis, using the Zhongtiao Shan as a case study. We propose a dynamic divide migration model in asymmetric uplift and further suggest that it is possible to evaluate the fault activity history by the state of the main divide based on the dynamic model combining the obtained data with previous results. The conclusions can be referred as
- (1)
- It is the relative value of the uplift and erosion that controls the migration and stabilization of the main divide in the asymmetric uplift pattern.
- (2)
- When the uplift outperforms the erosion on the fault-uplift side (i.e., footwall block of normal faults), the divide will migrate towards the higher uplift flank. Conversely, the divide will migrate backwards. When the erosion balances the uplift, the landscape system will finally reach a quasi-steady state.
- (3)
- The Zhongtiao Shan is experiencing the asymmetric uplift, with higher uplift and erosion on its northern flank.
- (4)
- The eastern segment of the NZTF must have experienced higher activities in the geological history, and the western fault may remain its slip rate along with the mountain relief generation.
Author Contributions
The main contributions are as follows: conceptualization was performed by Q.S. and X.W. The methodology was developed by Q.S. Formal analysis and investigation were carried out by Q.S., X.W. and H.X. The writing and preparation of the original draft were conducted by Q.S., X.W., and H.X. and the review and editing of the finial manuscript were performed by X.W. and H.L. Funding acquisition, Q.S. and H.L. All authors have read and agreed to the published version of the manuscript.
Funding
This research was funded by the China Postdoctoral Science Foundation (2019M661789) and the National Science Foundation of China (42021001).
Acknowledgments
Wolfgang Schwanghart, Dirk Scherler, Adam Forte, and Kelin Whipple are appreciated for their efforts on the TopoToolbox, Topographic Analysis Kit and DivideTools which were invaluable to this study. Jiale Jiang is appreciated for her effort on the editing this paper. We sincerely thank two anonymous reviewers and the editor for their constructive comments and suggestions.
Conflicts of Interest
The authors declare no conflict of interest.
References
- Gilbert, G.K. Geology of the Henry Mountains; Government Printing Office: Washington, DC, USA, 1877. [Google Scholar]
- Willett, S.D.; Mccoy, S.W.; Perron, J.T.; Goren, L.; Chen, C.Y. Dynamic reorganization of river basins. Science 2014, 343, 1248765. [Google Scholar] [CrossRef] [PubMed]
- Bonnet, S. Shrinking and splitting of drainage basins in orogenic landscapes from the migration of the main drainage divide. Nat. Geosci. 2009, 2, 766–771. [Google Scholar] [CrossRef] [Green Version]
- Scherler, D.; Schwanghart, W. Drainage divide networks-Part 2: Response to perturbations. Earth Surf. Dyn. 2020, 8, 261–274. [Google Scholar] [CrossRef] [Green Version]
- Stark, C.P. Oscillatory motion of drainage divides. Geophys. Res. Lett. 2010, 37, L04401. [Google Scholar] [CrossRef]
- Whipple, K.X.; Forte, A.M.; Dibiase, R.A.; Gasparini, N.M.; Ouimet, W.B. Timescales of landscape response to divide migration and drainage capture: Implications for the role of divide mobility in landscape evolution. J. Geophys. Res. Earth Surf. 2017, 122, 248–273. [Google Scholar] [CrossRef]
- Kim, D.-E.; Seong, Y.B.; Weber, J.; Yu, B.Y. Unsteady migration of Taebaek Mountain drainage divide, Cenozoic extensional basin margin, Korean Peninsula. Geomorphology 2020, 352, 107012. [Google Scholar] [CrossRef]
- Lima, S.M.Q.; Berbel-Filho, W.M.; Araujo, T.F.P.; Lazzarotto, H.; Tatarenkov, A.; Avise, J.C. Headwater Capture Evidenced by Paleo-Rivers Reconstruction and Population Genetic Structure of the Armored Catfish (Pareiorhaphis garbei) in the Serra do Mar Mountains of Southeastern Brazil. Front. Genet. 2017, 8, 199. [Google Scholar] [CrossRef] [Green Version]
- He, C.; Rao, G.; Yang, R.; Hu, J.; Yao, Q.; Yang, C.-J. Divide migration in response to asymmetric uplift: Insights from the Wula Shan horst, North China. Geomorphology 2019, 339, 44–57. [Google Scholar] [CrossRef]
- Stokes, M.; Mather, A.; Harvey, A. Quantification of river-capture-induced base-level changes and landscape development, Sorbas Basin, SE Spain. Geol. Soc. Lond. Spec. Publ. 2002, 191, 23–35. [Google Scholar] [CrossRef]
- Struth, L.; Teixell, A.; Owen, L.A.; Babault, J. Plateau reduction by drainage divide migration in the Eastern Cordillera of Colombia defined by morphometry and 10Be terrestrial cosmogenic nuclides. Earth Surf. Process. Landf. 2017, 42, 1155–1170. [Google Scholar] [CrossRef] [Green Version]
- Lyons, N.J.; Val, P.; Albert, J.S.; Willenbring, J.K.; Gasparini, N.M. Topographic controls on divide migration, stream capture, and diversification in riverine life. Earth Surf. Dyn. 2020, 8, 893–912. [Google Scholar] [CrossRef]
- Willett, S.D.; McCoy, S.W.; Beeson, H.W. Transience of the North American High Plains landscape and its impact on surface water. Nature 2018, 561, 528–532. [Google Scholar] [CrossRef] [PubMed]
- Forte, A.M.; Whipple, K.X. Criteria and tools for determining drainage divide stability. Earth Planet. Sci. Lett. 2018, 493, 102–117. [Google Scholar] [CrossRef] [Green Version]
- Goren, L.; Willett, S.D.; Herman, F.; Braun, J. Coupled numerical-analytical approach to landscape evolution modeling. Earth Surf. Process. Landf. 2014, 39, 522–545. [Google Scholar] [CrossRef]
- Scherler, D.; Schwanghart, W. Drainage divide networks-Part 1: Identification and ordering in digital elevation models. Earth Surf. Dyn. 2020, 8, 245–259. [Google Scholar] [CrossRef] [Green Version]
- Yang, R.; Willett, S.D.; Goren, L. In situ low-relief landscape formation as a result of river network disruption. Nature 2015, 520, 526–529. [Google Scholar] [CrossRef]
- Sinclair, H.D.; Mudd, S.M.; Dingle, E.; Hobley, D.E.J.; Robinson, R.; Walcott, R. Squeezing river catchments through tectonics: Shortening and erosion across the Indus Valley, NW Himalaya. Geol. Soc. Am. Bull. 2017, 129, 203–217. [Google Scholar] [CrossRef]
- Cooper, A.F.; Beck, R.J. River capture and Main Divide migration in the Haast River catchment assessed from the fluvial distribution of sodalite-bearing dike rocks and fenites. N. Z. J. Geol. Geophys. 2009, 52, 27–36. [Google Scholar] [CrossRef]
- Buscher, J.T.; Ascione, A.; Valente, E. Decoding the role of tectonics, incision and lithology on drainage divide migration in the Mt. Alpi region, southern Apennines, Italy. Geomorphology 2017, 276, 37–50. [Google Scholar] [CrossRef]
- Forte, A.M.; Whipple, K.X.; Cowgill, E. Drainage network reveals patterns and history of active deformation in the eastern Greater Caucasus. Geosphere 2015, 11, 1343–1364. [Google Scholar] [CrossRef]
- Dahlquist, M.P.; West, A.J.; Li, G. Landslide-driven drainage divide migration. Geology 2018, 46, 403–406. [Google Scholar] [CrossRef]
- Wang, J.; Howarth, J.D.; McClymont, E.L.; Densmore, A.L.; Fitzsimons, S.J.; Croissant, T.; Gröcke, D.R.; West, M.D.; Harvey, E.L.; Frith, N.V.; et al. Long-term patterns of hillslope erosion by earthquake-induced landslides shape mountain landscapes. Sci. Adv. 2020, 6, eaaz6446. [Google Scholar] [CrossRef] [PubMed]
- Guerit, L.; Goren, L.; Dominguez, S.; Malavieille, J.; Castelltort, S. Landscape ‘stress’ and reorganization from χ-maps: Insights from experimental drainage networks in oblique collision setting. Earth Surf. Process. Landf. 2018, 43, 3152–3163. [Google Scholar] [CrossRef]
- Yan, J.; Hu, J.; Gong, W.; Liu, X.; Yin, Y.; Tan, C. Late Cenozoic magnetostratigraphy of the Yuncheng Basin, central North China Craton and its tectonic implications. Geol. J. 2020, 55, 7415–7428. [Google Scholar] [CrossRef]
- Yang, C.; Zhang, F.; Liu, R.; Hou, J.; Zhang, Q.; Zhao, C. Ground deformation and fissure activity of the Yuncheng Basin (China) revealed by multiband time series InSAR. Adv. Space Res. 2020, 66, 490–504. [Google Scholar] [CrossRef]
- Xiong, J.; Li, Y.; Zheng, W.; Zhang, P.; Lei, J.; Zhong, Y.; Hu, X.; Li, Z.; Gong, Z.; Li, T.; et al. Climatically driven formation of the Tangxian planation surface in North China: An example from northwestern Zhongtiao Shan of the Shanxi Graben System. Lithosphere 2018, 10, 530–544. [Google Scholar] [CrossRef]
- Li, X.; Zhang, H.; Wang, Y.; Zhao, X.; Ma, Z.; Liu, K.; Ma, Y. Inversion of bedrock channel profiles in the Daqing Shan in Inner Mongolia, northern China: Implications for late Cenozoic tectonic history in the Hetao Basin and the Yellow River evolution. Tectonophysics 2020, 790. [Google Scholar] [CrossRef]
- Shi, W.; Dong, S.; Hu, J. Neotectonics around the Ordos Block, North China: A review and new insights. Earth-Sci. Rev. 2020, 200, 102969. [Google Scholar] [CrossRef]
- Middleton, T.A.; Elliott, J.R.; Rhodes, E.J.; Sherlock, S.; Walker, R.T.; Wang, W.; Yu, J.; Zhou, Y. Extension rates across the northern Shanxi Grabens, China, from Quaternary geology, seismicity and geodesy. Geophys. J. Int. 2017. [Google Scholar] [CrossRef] [Green Version]
- Clinkscales, C.; Kapp, P.; Wang, H. Exhumation history of the north-central Shanxi Rift, North China, revealed by low-temperature thermochronology. Earth Planet. Sci. Lett. 2020, 536, 116146. [Google Scholar] [CrossRef]
- Liu, J.; Zhang, P.; Zheng, D.; Wan, J.; Wang, W.; Du, P.; Lei, Q. Pattern and timing of late Cenozoic rapid exhumation and uplift of the Helan Mountain, China. Sci. China Earth Sci. 2010, 53, 345–355. [Google Scholar] [CrossRef]
- Shi, W.; Cen, M.; Chen, L.; Wang, Y.; Chen, X.; Li, J.; Chen, P. Evolution of the late Cenozoic tectonic stress regime in the Shanxi Rift, central North China Plate inferred from new fault kinematic analysis. J. Asian Earth Sci. 2015, 114, 54–72. [Google Scholar] [CrossRef]
- Si, S.; Li, Y.; Lü, S.; Wang, Y. Holocene slip rate and paleoearthquake records of the Salt Lake segment of the Northern Zhongtiaoshan Fault, Shanxi Province. Sci. China Earth Sci. 2014, 57, 2079–2088. [Google Scholar] [CrossRef]
- Guo, C.; Li, W.; Tian, Q.; Xu, Y.; Du, P.; Liu, S. Study on Lte Pleistocene Rate of Haizhou Section of North Zhongtiaoshan Fault. Earthquake 2019, 39, 13–26. [Google Scholar]
- Tian, J.; Li, Y.; Si, S.; Lv, S.; Wang, Y. Discovery and Neotectonic Significance of Fault Scarps on Alluvial Fans in the Middle of Northern Piedmont of the Zhongtiao Mountains. Acta Sci. Nat. Univ. Pekin. 2013, 49, 986–992. [Google Scholar]
- Lv, S.; Li, Y.; Wang, Y.; Ci, H. The Holocene paleoseismicity of the North Zhongtiaoshan Faults in Shanxi Province, China. Tectonophysics 2014, 623, 67–82. [Google Scholar] [CrossRef]
- Xiong, J.; Li, Y.; Si, S.; Lv, S.; Wang, Y.; Zhong, Y.; Xin, W.; Ci, H. A rock fall of the north Zhongtiao Shan fault and the Yongji earthquake in 793, Shanxi Province, North China. Arab. J. Geosci. 2016, 9, 704. [Google Scholar] [CrossRef]
- Cheng, S.; Yang, G. Late Quaternary Segment ation Model of the Zhongtiaoshan Fault, Shanxi Province. Seismol. Geol. 2002, 24, 289–302. [Google Scholar]
- Wang, Q.; Li, G.; Tian, G.; Zhang, W.; Liu, C.; Ning, L.; Yue, J.; Cheng, Z.; He, C. Tremendous change of the earth surface system and tectonic setting of salt-lake formation in Yuncheng Basin since 7.1 Ma. Sci. China Ser. D 2002, 45, 110–122. [Google Scholar] [CrossRef]
- Shi, W.; Chen, L.; Chen, X.; Cen, M.; Zhang, Y. The Cenozoic tectonic evolution of the faulted basins in the northern margin of the Eastern Qinling Mountains, Central China: Constraints from fault kinematic analysis. J. Asian Earth Sci. 2019, 173, 204–224. [Google Scholar] [CrossRef]
- Kirby, E.; Whipple, K.X. Expression of active tectonics in erosional landscapes. J. Struct. Geol. 2012, 44, 54–75. [Google Scholar] [CrossRef]
- Wobus, C.; Whipple, K.X.; Kirby, E.; Snyder, N.; Johnson, J.; Spyropolou, K.; Crosby, B.; Sheehan, D. Tectonics from topography: Procedures, promise, and pitfalls. Spec. Pap. Geol. Soc. Am. 2006, 398, 55–74. [Google Scholar] [CrossRef] [Green Version]
- Whipple, K.X. Bedrock rivers and the geomorphology of active orogens. Annu. Rev. Earth Planet. Sci. 2004, 32, 151–185. [Google Scholar] [CrossRef] [Green Version]
- Hu, X.; Pan, B.; Kirby, E.; Li, Q.; Geng, H.; Chen, J. Spatial differences in rock uplift rates inferred from channel steepness indices along the northern flank of the Qilian Mountain, northeast Tibetan Plateau. Chin. Sci. Bull. 2010, 55, 3205–3214. [Google Scholar] [CrossRef]
- Kirby, E.; Whipple, K. Quantifying differential rock-uplift rates via stream profile analysis. Geology 2001, 29, 415–418. [Google Scholar] [CrossRef]
- Howard, A.D.; Dietrich, W.E.; Seidl, M.A. Modeling fluvial erosion on regional to continental scales. J. Geophys. Res. 1994, 99, 13971–13986. [Google Scholar] [CrossRef] [Green Version]
- Whipple, K.X.; Tucker, G.E. Dynamics of the stream-power river incision model: Implications for height limits of mountain ranges, landscape response timescales, and research needs. J. Geophys. Res. Solid Earth 1999, 104, 17661–17674. [Google Scholar] [CrossRef]
- Wang, Y.; Zhang, H.; Zheng, D.; Yu, J.; Pang, J.; Ma, Y. Coupling slope–area analysis, integral approach and statistic tests to steady-state bedrock river profile analysis. Earth Surf. Dyn. 2017, 5, 145–160. [Google Scholar] [CrossRef] [Green Version]
- Perron, J.T.; Royden, L. An integral approach to bedrock river profile analysis. Earth Surf. Process. Landf. 2013, 38, 570–576. [Google Scholar] [CrossRef] [Green Version]
- Royden, L.; Perron, T. Solutions of the stream power equation and application to the evolution of river longitudinal profiles. J. Geophys. Res. Earth Surf. 2013, 118, 497–518. [Google Scholar] [CrossRef]
- Gallen, S.F.; Wegmann, K.W. River profile response to normal fault growth and linkage: An example from the Hellenic forearc of south-central Crete, Greece. Earth Surf. Dyn. 2017, 5, 161–186. [Google Scholar] [CrossRef] [Green Version]
- Winterberg, S.; Willett, S.D. Greater Alpine river network evolution, interpretations based on novel drainage analysis. Swiss J. Geosci. 2019, 112, 3–22. [Google Scholar] [CrossRef] [PubMed] [Green Version]
- Chen, C.-Y.; Willett, S.D. Graphical methods of river profile analysis to unravel drainage area change, uplift and erodibility contrasts in the Central Range of Taiwan. Earth Surf. Process. Landf. 2016, 41, 2223–2238. [Google Scholar] [CrossRef]
- Forte, A.M.; Whipple, K.X. Short communication: The Topographic Analysis Kit (TAK) for TopoToolbox. Earth Surf. Dyn. 2019, 7, 87–95. [Google Scholar] [CrossRef] [Green Version]
- Schwanghart, W.; Scherler, D. Short Communication: TopoToolbox 2–MATLAB-based software for topographic analysis and modeling in Earth surface sciences. Earth Surf. Dyn. 2014, 2, 1–7. [Google Scholar] [CrossRef] [Green Version]
- Trost, G.; Robl, J.; Hergarten, S.; Neubauer, F. The destiny of orogen-parallel streams in the Eastern Alps: The Salzach-Enns drainage system. Earth Surf. Dyn. 2020, 8, 69–85. [Google Scholar] [CrossRef] [Green Version]
- Miao, D.; Li, Y.; Lv, S.; Tian, J.; Wang, Y.; Si, S. Neotectonic activity in Xiaxian segment of the North Zhongtiao Mountain Fault Zone, Shanxi. Geogr. Res. 2014, 33, 665–673. [Google Scholar] [CrossRef]
- Zhang, H.-p.; Zhang, P.-z.; Kirby, E.; Yin, J.-h.; Liu, C.-r.; Yu, G.-h. Along-strike topographic variation of the Longmen Shan and its significance for landscape evolution along the eastern Tibetan Plateau. J. Asian Earth Sci. 2011, 40, 855–864. [Google Scholar] [CrossRef]
- Su, Q.; Xie, H.; Yuan, D.-Y.; Zhang, H.-P. Along-strike topographic variation of Qinghai Nanshan and its significance for landscape evolution in the northeastern Tibetan Plateau. J. Asian Earth Sci. 2017, 147, 226–239. [Google Scholar] [CrossRef]
- Harkins, N.; Kirby, E.; Heimsath, A.; Robinson, R.; Reiser, U. Transient fluvial incision in the headwaters of the Yellow River, northeastern Tibet, China. J. Geophys. Res. 2007, 112, 112.F3. [Google Scholar] [CrossRef] [Green Version]
- Whipple, K.X.; Shirzaei, M.; Hodges, K.V.; Arrowsmith, J.R. Active shortening within the Himalayan orogenic wedge implied by the 2015 Gorkha earthquake. Nat. Geosci. 2016, 9, 711–716. [Google Scholar] [CrossRef]
- Montgomery, D.R.; Brandon, M.T. Topographic controls on erosion rates in tectonically active mountain ranges. Earth Planet. Sci. Lett. 2002, 201, 481–489. [Google Scholar] [CrossRef]
- Portenga, E.W.; Bierman, P.R. Understanding Earth’s eroding surface with 10Be. GSA Today 2011, 21, 4–10. [Google Scholar] [CrossRef]
- Delunel, R.; Schlunegger, F.; Valla, P.G.; Dixon, J.; Glotzbach, C.; Hippe, K.; Kober, F.; Molliex, S.; Norton, K.P.; Salcher, B.; et al. Late-Pleistocene catchment-wide denudation patterns across the European Alps. Earth-Sci. Rev. 2020, 211, 103407. [Google Scholar] [CrossRef]
- Wobus, C.W. Geomorphic and Thermochronologic Signatures of Active Tectonics in the Central Nepalese Himalaya; Massachusetts Institute of Technology: Cambridge, MA, USA, 2005. [Google Scholar]
- Yang, C.-s.; Zhang, Q.; Xu, Q.; Zhao, C.-y.; Peng, J.-b.; Ji, L.-y. Complex Deformation Monitoring over the Linfen–Yuncheng Basin (China) with Time Series InSAR Technology. Remote Sens. 2016, 8, 248. [Google Scholar] [CrossRef] [Green Version]
- Xiong, J. A Study on the Age of the Geomorphologic Surface with Magnetostratigraphy—Examples from the Jianshui Basin in Yunnan and Yuncheng Basin in Shanxi; Peking University: Beijing, China, 2016. [Google Scholar]
- Bonnet, S.; Crave, A. Landscape response to climate change: Insights from experimental modeling and implications for tectonic versus climatic uplift of topography. Geology 2003, 31, 123–126. [Google Scholar] [CrossRef]
- Moussirou, B.; Bonnet, S. Modulation of the erosion rate of an uplifting landscape by long-term climate change: An experimental investigation. Geomorphology 2018, 303, 456–466. [Google Scholar] [CrossRef]
Figure 1.
(A) Simplified tectonic and geomorphological map of the Tibetan Plateau and its adjacent areas. The black rectangle shows the location of Figure 1B. (B) Topographic map of the Ordos Block and its adjacent areas; reported are the major faults and the Yellow River course showing on. The yellow shaded areas show the locations of the Cenozoic sedimentary basins. The sedimentary basins and the faults are modified from [28]. The white dashed rectangle highlights the localization of Figure 2A and of the study area.

Figure 2.
(A) Simplified geological map of the Yuncheng Basin and the Zhongtiao Shan with the main geomorphic units and active faults. The red line shows the location of the NZTF. The red dot shows the location of the Xuehua Shan. The base map is revised from [27]). (B) Simplified cross-section of the Yuncheng Basin and the Zhongtiao Shan along the a-a’ profile shown in Figure 2A. The faults and the strata are adopted from [25].

Figure 3.
The main divide of the Zhongtiao Shan. The main divide was divided into six parts, namely, the ab, bc, cd, de, ef, and fg segments. The stability of each part was analyzed. The numbers along the fault indicate that slip rates of different segments of the fault [34,35,36,58].

Figure 4.
(A) Channel steepness and (B) slope distributions of the Zhongtiao Shan and Yuncheng Basin. Note that the slope and steepness values on north side of the Zhongtiao Shan are higher than those on south side. Moreover, in the northern sector of the main divide, metrics decrease moving from west to east.

Figure 5.
Divide metrics (Gilbert metrics and χ) histograms for the ab segment, bc segment, cd segment, the de segment, the ef segment, and the fg segment. Histograms with red rectangles represent watersheds on north range, and histograms with black fillings mean watershed from south flank. Note that the ab, bc, cd, and de segments indicate that the current main divide is stable, while the ef and fg segments show that the divide is moving to south. It should be noted that all the calculations on the Gilbert metrics and χ were determined with a base level of 700 m. The results are calculated by the DivideTools [14] based on TopoToolbox [56].

Figure 6.
Standardized delta plot for the 6 segments (ab, bc, cd, de, ef, and fg segments) along the divide. Bars are considering standard deviation as the uncertainty. It should be noted that all the calculations on the Gilbert metrics and χ were determined with a base level of 700 m. The results are calculated by the DivideTools [14] based on TopoToolbox [56].

Figure 7.
Schematic diagram of main divide migration. The red dotted lines represent that the fault is inactive, and the red lines show the active faults. The blue arrows show the divide migration direction. The black arrows show the uplift rate. (A) Steady state landscape without tectonic disturbance. Uplift and erosion balance each other. (B) The main divide is moving northward due to higher uplift rates on the northern range. Uplift outpaces the erosion. (C) The main divide reaches a quasi-steady state. (D) After the tectonic activity ceases, the main divide migrates back to its original location, and eventually reaches the steady state. It should be noted that there exist no scale in the Figure 7.

Publisher’s Note: MDPI stays neutral with regard to jurisdictional claims in published maps and institutional affiliations. |
© 2020 by the authors. Licensee MDPI, Basel, Switzerland. This article is an open access article distributed under the terms and conditions of the Creative Commons Attribution (CC BY) license (http://creativecommons.org/licenses/by/4.0/).
Share and Cite
MDPI and ACS Style
Su, Q.; Wang, X.; Lu, H.; Xie, H. Dynamic Divide Migration as a Response to Asymmetric Uplift: An Example from the Zhongtiao Shan, North China. Remote Sens. 2020, 12, 4188. https://0-doi-org.brum.beds.ac.uk/10.3390/rs12244188
AMA Style
Su Q, Wang X, Lu H, Xie H. Dynamic Divide Migration as a Response to Asymmetric Uplift: An Example from the Zhongtiao Shan, North China. Remote Sensing. 2020; 12(24):4188. https://0-doi-org.brum.beds.ac.uk/10.3390/rs12244188
Chicago/Turabian StyleSu, Qi, Xianyan Wang, Huayu Lu, and Hong Xie. 2020. "Dynamic Divide Migration as a Response to Asymmetric Uplift: An Example from the Zhongtiao Shan, North China" Remote Sensing 12, no. 24: 4188. https://0-doi-org.brum.beds.ac.uk/10.3390/rs12244188
Note that from the first issue of 2016, this journal uses article numbers instead of page numbers. See further details here.