Multispectral Remote Sensing of Wetlands in Semi-Arid and Arid Areas: A Review on Applications, Challenges and Possible Future Research Directions


Abstract
:1. Introduction
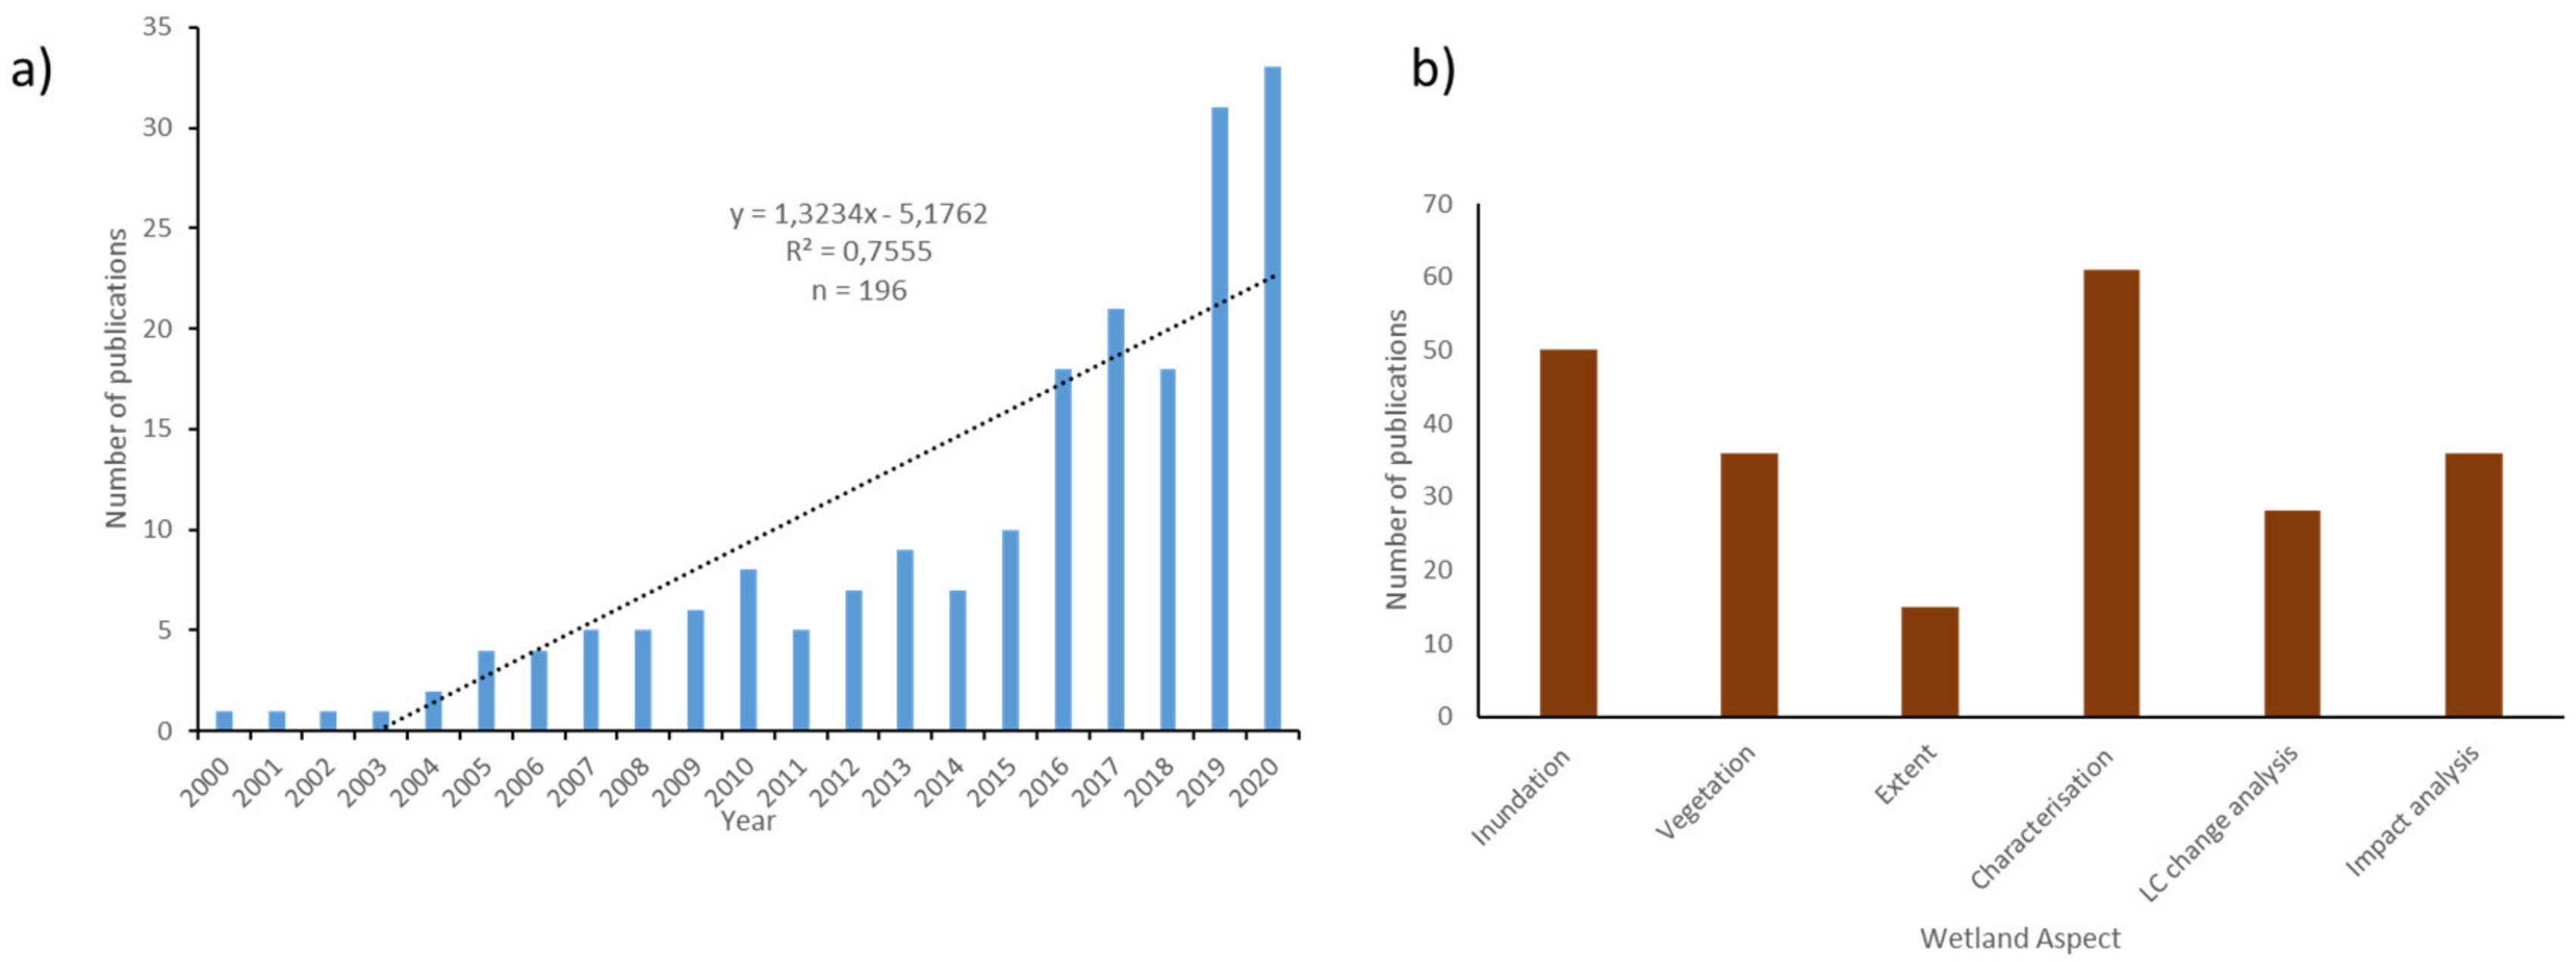
Literature Search
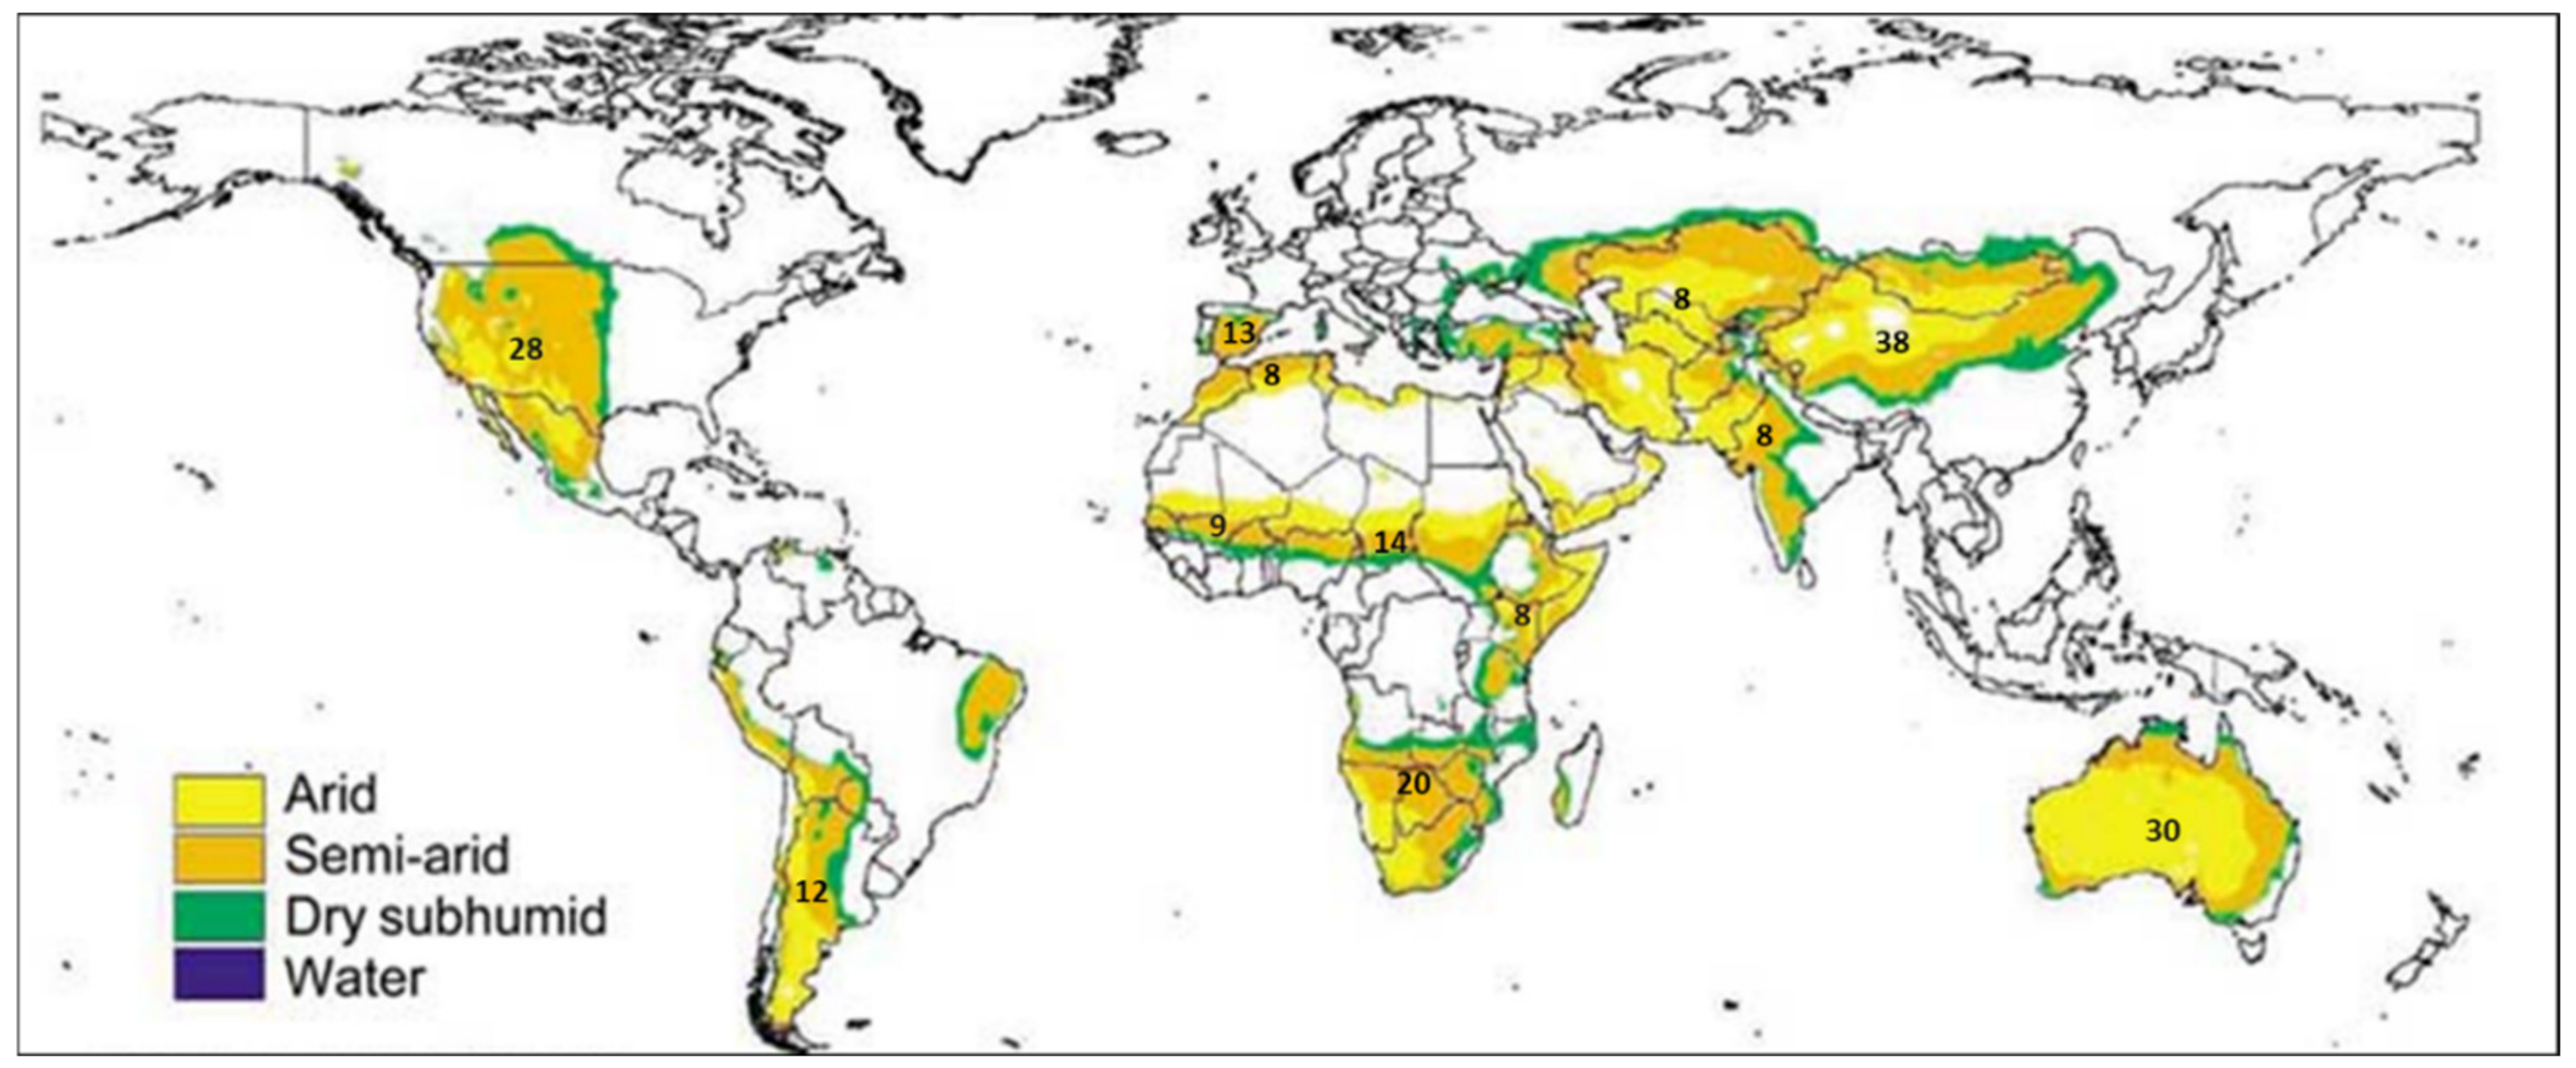
2. Semi-Arid and Arid Wetlands Characteristics and Key Monitoring and Management Challenges
3. Commonly Used Freely Available Multispectral Sensors for Semi-Arid and Arid Wetland Inventories
4. Mapping Semi-Arid and Arid Wetland Vegetation Using Freely Available Multispectral Images
5. Mapping Wetlands Inundation Using Freely Available Multispectral Images
6. Mapping Land-Use and Land-Cover Changes Impacts on Semi-Arid and Arid Wetland Systems Using Freely Available Multispectral Images
7. Low- to Medium- vs. High-Resolution Remote Sensing for Wetland Monitoring and Assessment
8. Available Satellite Image Processing Techniques for Accurate Wetland Monitoring
9. Summary of Key Challenges and Future Research Directions
10. Conclusions
Author Contributions
Funding
Acknowledgments
Conflicts of Interest
References
- Day, J.; Day, E.; Ross-Gillespie, V.; Ketley, A. The Assessment of Temporary Wetlands during Dry Conditions; WRC: Pretoria, South Africa, 2010; pp. 1–50. [Google Scholar]
- Bowman, M. The Ramsar convention on wetlands: Has it made a difference. In Year Book of International Co-Operation on Environment and Development; Stokke, O.S., Thommessen, O.B., Eds.; Earthscan: London, UK, 2002; pp. 61–68. [Google Scholar]
- Shine, C.; Klemm, C. Wetlands, Water and the Law. Using Law to Advance Wetland Conservation and Wise Use; IUCN: Cambridge, UK, 1999; p. 330. [Google Scholar]
- Rochefort, L.; Strack, M.; Poulin, M.; Price, J.S.; Graf, M.; Destrochers, A.; Lavoie, C. Northern peatlands. In Wetland Habitats of North America: Ecology and Conservation Concerns; Batzer, D.P., Andrew, P., Eds.; University of California Press, Ltd.: Berkeley, CA, USA, 2012; pp. 119–134. [Google Scholar]
- Ewart-Smith, J.; Ollis, D.; Day, J.; Malan, H. National Wetland Inventory: Development of a Wetland Classification Sstem for South Africa; Final Report 433/8; Water Research Commission: Pretoria, South Africa, 2006. [Google Scholar]
- Tooth, S.; McCarthy, T.; Brandt, D.; Hancox, P.J.; Morris, R. Geological controls on the formation of alluvial meanders and floodplain wetlands: The example of the Klip River, eastern Free State, South Africa. Earth Surf. Process. Landforms 2002, 27, 797–815. [Google Scholar] [CrossRef]
- Li, L.; Vrieling, A.; Skidmore, A.K.; Wang, T.; Muñoz, A.-R.; Turak, E. Evaluation of MODIS Spectral Indices for Monitoring Hydrological Dynamics of a Small, Seasonally-Flooded Wetland in Southern Spain. Wetlands 2015, 35, 851–864. [Google Scholar] [CrossRef] [Green Version]
- McCartney, M.P.; Houghton-Carr, H.A. Working Wetland Potential: An index to guide the sustainable development of African wetlands. Nat. Resour. Forum 2009, 33, 99–110. [Google Scholar] [CrossRef]
- Turpie, J.; Malan, H. Wetland Valuation. Volume III—A Tool for the Assessment of the Livelihood Value of Wetlands; WRC Report no. TT442/09; Water Research Commission: Pretoria, South Africa, 2010. [Google Scholar]
- Ghobadi, Y.; Pradhan, B.; Kabiri, K.; Pirasteh, S.; Shafri, H.Z.M.; Sayyad, G.A. Use of multi-temporal remote sensing data and GIS for wetland change monitoring and degradation CHUSER 2012–2014. In Proceedings of the IEEE Colloquium Humanities, Science and Engineering Research (CHUSER 2012), Kota Kinabalu, Sabah, Malaysia, 3–4 December 2012; pp. 103–108. [Google Scholar]
- Fang, C.; Wen, Z.; Li, L.; Du, J.; Liu, G.; Wang, X.; Song, K. Agricultural Development and Implication for Wetlands Sustainability: A Case from Baoqing County, Northeast China. Chin. Geogr. Sci. 2019, 29, 231–244. [Google Scholar] [CrossRef] [Green Version]
- Hu, S.; Niu, Z.; Chen, Y.; Li, L.; Zhang, H. Global wetlands: Potential distribution, wetland loss, and status. Sci. Total. Environ. 2017, 586, 319–327. [Google Scholar] [CrossRef]
- Davidson, N.C. How much wetland has the world lost? Long-term and recent trends in global wetland area. Mar. Freshw. Res. 2014, 65, 934–941. [Google Scholar] [CrossRef]
- Liu, D.; Cao, C.; Chen, W.; Ni, X.; Tian, R.; Xing, X. Monitoring and predicting the degradation of a semi-arid wetland due to climate change and water abstraction in the Ordos Larus relictus National Nature Reserve, China. Geomatics, Nat. Hazards Risk 2016, 8, 367–383. [Google Scholar] [CrossRef] [Green Version]
- Landmann, T.; Schramm, M.; Colditz, R.R.; Dietz, A.; Dech, S. Wide Area Wetland Mapping in Semi-Arid Africa Using 250-Meter MODIS Metrics and Topographic Variables. Remote Sens. 2010, 2, 1751–1766. [Google Scholar] [CrossRef] [Green Version]
- Riddell, E.S.; A Lorentz, S.; Kotze, D.C. The hydrodynamic response of a semi-arid headwater wetland to technical rehabilitation interventions. Water SA 2012, 38, 55–66. [Google Scholar] [CrossRef] [Green Version]
- Uluocha, N.O.; Okeke, I.C. Implications of wetlands degradation for water resources management: Lessons from Nigeria. Geojounral 2004, 61, 151–154. [Google Scholar] [CrossRef]
- Slagter, B.; Tsendbazar, N.-E.; Vollrath, A.; Reiche, J. Mapping wetland characteristics using temporally dense Sentinel-1 and Sentinel-2 data: A case study in the St. Lucia wetlands, South Africa. Int. J. Appl. Earth Obs. Geoinform. 2020, 86, 102009. [Google Scholar] [CrossRef]
- Schmid, T.; Koch, M.; Gumuzzio, J.; Mather, P.M. A spectral library for a semi-arid wetland and its application to studies of wetland degradation using hyperspectral and multispectral data. Int. J. Remote. Sens. 2004, 25, 2485–2496. [Google Scholar] [CrossRef]
- Chen, M.; Liu, J. Historical trends of wetland areas in the agriculture and pasture interlaced zone: A case study of the Huangqihai Lake Basin in northern China. Ecol. Model. 2015, 318, 168–176. [Google Scholar] [CrossRef]
- Li, L.; Chen, Y.; Xu, T.; Shi, K.; Liu, R.; Huang, C.; Lu, B.; Meng, L. Remote Sensing of Wetland Flooding at a Sub-Pixel Scale Based on Random Forests and Spatial Attraction Models. Remote Sens. 2019, 11, 1231. [Google Scholar] [CrossRef] [Green Version]
- Guo, M.; Li, J.; Sheng, C.; Xu, J.; Wu, L. A Review of Wetland Remote Sensing. Sensors 2017, 17, 777. [Google Scholar] [CrossRef] [Green Version]
- Klemas, V. Remote Sensing of Riparian and Wetland Buffers: An Overview. J. Coast. Res. 2014, 297, 869–880. [Google Scholar] [CrossRef] [Green Version]
- Dronova, I. Object-Based Image Analysis in Wetland Research: A Review. Remote Sens. 2015, 7, 6380–6413. [Google Scholar] [CrossRef] [Green Version]
- Amler, E.; Schmidt, M.; Menz, G. Definitions and Mapping of East African Wetlands: A Review. Remote Sens. 2015, 7, 5256–5282. [Google Scholar] [CrossRef] [Green Version]
- Adam, E.; Mutanga, O.; Rugege, D. Multispectral and hyperspectral remote sensing for identification and mapping of wetland vegetation: A review. Wetl. Ecol. Manag. 2010, 18, 281–296. [Google Scholar] [CrossRef]
- Adeli, S.; Salehi, B.; Mahdianpari, M.; Quackenbush, L.J.; Brisco, B.; Tamiminia, H.; Shaw, S. Wetland Monitoring Using SAR Data: A Meta-Analysis and Comprehensive Review. Remote Sens. 2020, 12, 2190. [Google Scholar] [CrossRef]
- Wohlfart, C.; Winkler, K.; Wendleder, A.; Roth, A. TerraSAR-X and wetlands: A review. Remote Sens. 2018, 10, 1–24. [Google Scholar] [CrossRef] [Green Version]
- Klemas, V.V. Remote sensing of emergent and submerged Wetlands: An overview. Int. J. Remote Sens. 2013, 34, 6286–6320. [Google Scholar] [CrossRef]
- Kuenzer, C.; Bluemel, A.; Gebhardt, S.; Quoc, T.V.; Dech, S. Remote Sensing of Mangrove Ecosystems: A Review. Remote Sens. 2011, 3, 878–928. [Google Scholar] [CrossRef] [Green Version]
- Hollis, G.E. Les effets sur l’environnement de la mise en valeur des zones humides dans Ses regions arides et semi arides. Hydrol. Sci. J. 1990, 35, 411–428. [Google Scholar] [CrossRef]
- Powell, M.; Hodgins, G.; Danaher, T.; Ling, J.E.; Hughes, M.G.; Wen, L. Mapping Wetland Types in Semiarid Floodplains: A Statistical Learning Approach. Remote Sens. 2019, 11, 609. [Google Scholar] [CrossRef] [Green Version]
- Sieben, E.J.; Collins, N.; Corry, F.; Kotze, D.; Job, N.; Muasya, A.; Venter, C.; Mtshali, H.; Zondo, S.; Janks, M.; et al. The vegetation of grass lawn wetlands of floodplains and pans in semi-arid regions of South Africa: Description, classification and explanatory environmental factors. S. Afr. J. Bot. 2016, 104, 215–224. [Google Scholar] [CrossRef]
- Jenkins, K.M.; Boulton, A.J.; Ryder, D. A Common Parched Future? Research and Management of Australian Arid-zone Floodplain Wetlands. Hydrobiology 2005, 552, 57–73. [Google Scholar] [CrossRef]
- Minckley, T.; Turner, D.; Weinstein, S. The relevance of wetland conservation in arid regions: A re-examination of vanishing communities in the American Southwest. J. Arid. Environ. 2013, 88, 213–221. [Google Scholar] [CrossRef]
- Gebresllassie, H.; Gashaw, T.; Mehari, A. Wetland Degradation in Ethiopia: Causes, Consequences and Remedies. J. Environ. Earch Sci. 2014, 4, 40–49. [Google Scholar]
- Rapinel, S.; Fabre, E.; Dufour, S.; Arvor, D.; Mony, C.; Hubert-Moy, L. Mapping potential, existing and efficient wetlands using free remote sensing data. J. Environ. Manag. 2019, 247, 829–839. [Google Scholar] [CrossRef]
- Cape, W.; Africa, S.; Thomas, A.; Ellery, F.; Africa, S. Wetlands in drylands: Hotspots of ecosystem services in marginal environments. In GSDR Science Brief; United Nations: New York, NY, USA, 2015; pp. 1–4. Available online: https://sustainabledevelopment.un.org/content/documents/640493 (accessed on 15 October 2020).
- Scanlon, B.; Keese, K.; Flint, A.; Gaye, C.; Edmunds, M.; Simmers, I. Advanced Bash-Scripting Guide An in-depth exploration of the art of shell scripting. Hydrol. Process. 2010, 2274, 2267–2274. [Google Scholar]
- Ozesmi, S.L.; Bauer, M.E. Satellite remote sensing of wetlands. Wetl. Ecol. Manag. 2002, 10, 381–402. [Google Scholar] [CrossRef]
- Mishra, N.B.; Wang, Y. Wetlands: Remote sensing. In Encyclopedia of Natural Resources: Land; University of Wisconsin: La Crosse, WI, USA, 2014; pp. 566–574. [Google Scholar] [CrossRef]
- Terentieva, I.E.; Glagolev, M.V.; Lapshina, E.; Sabrekov, A.F.; Maksyutov, S. Mapping of West Siberian taiga wetland complexes using Landsat imagery: Implications for methane emissions. Biogeosciences 2016, 13, 4615–4626. [Google Scholar] [CrossRef] [Green Version]
- Schmid, T.; Gumuzzio, J.; Koch, M. Multisensor approach to determine changes of wetland characteristics in semiarid environments (central Spain). IEEE Trans. Geosci. Remote Sens. 2005, 43, 2516–2525. [Google Scholar] [CrossRef]
- Gallant, A.L. The Challenges of Remote Monitoring of Wetlands. Remote Sens. 2015, 7, 10938–10950. [Google Scholar] [CrossRef] [Green Version]
- Chen, Y.; Huang, C.; Ticehurst, C.; Merrin, L.; Thew, P. An Evaluation of MODIS Daily and 8-day Composite Products for Floodplain and Wetland Inundation Mapping. Wetlands 2013, 33, 823–835. [Google Scholar] [CrossRef]
- Halabisky, M.; Babcock, C.; Moskal, L.M. Harnessing the Temporal Dimension to Improve Object-Based Image Analysis Classification of Wetlands. Remote Sens. 2018, 10, 1467. [Google Scholar] [CrossRef] [Green Version]
- Regan, S.; Gill, L.; Regan, S.; Naughton, O.; Johnston, P.; Waldren, S.; Ghosh, B. Mapping Vegetation Communities Inside Wetlands Using Sentinel-2 Imagery in Ireland. Int. J. Appl. Earth Obs. Geoinformation 2020, 88, 102083. [Google Scholar] [CrossRef]
- Thakur, J.K.; Srivastava, P.K.; Singh, S.K.; Vekerdy, Z. Ecological monitoring of wetlands in semi-arid region of Konya closed Basin, Turkey. Reg. Environ. Chang. 2011, 12, 133–144. [Google Scholar] [CrossRef]
- Martinez-Lopez, J.; Carreño, M.F.; Palazón-Ferrando, J.; Martínez-Fernández, J.; Esteve, M. Remote sensing of plant communities as a tool for assessing the condition of semiarid Mediterranean saline wetlands in agricultural catchments. Int. J. Appl. Earth Obs. Geoinform. 2014, 26, 193–204. [Google Scholar] [CrossRef]
- Gong, Z.; Cui, T.; Gong, H. Estimating wetland vegetation abundance based on spectral mixture analysis: A comparison between LSMA and FCM classification methods. Int. J. Remote Sens. 2013, 35, 189–203. [Google Scholar] [CrossRef]
- Landmann, T.; Schramm, M.; Huettich, C.; Dech, S. MODIS-based change vector analysis for assessing wetland dynamics in Southern Africa. Remote Sens. Lett. 2012, 4, 104–113. [Google Scholar] [CrossRef]
- McCarthy, J.; Gumbricht, T.; McCarthy, T.S. Ecoregion classification in the Okavango Delta, Botswana from multitemporal remote sensing. Int. J. Remote Sens. 2005, 26, 4339–4357. [Google Scholar] [CrossRef]
- Carreño, M.F.; Esteve, M.A.; Martinez, J.; Palazón, J.A.; Pardo, M. T: Habitat changes in coastal wetlands associated to hydrological changes in the watershed. Estuar. Coast. Shelf Sci. 2008, 77, 475–483. [Google Scholar] [CrossRef]
- Mazzarino, M.M. Agro-Pastoralist Livelihood in the Andes of Peru. Ph.D. Thesis, University of Massachusetts, Amherst, MA, USA, 2014. [Google Scholar]
- Klein, I.; Dietz, A.J.; Gessner, U.; Galayeva, A.; Myrzakhmetov, A.; Kuenzer, C. Evaluation of seasonal water body extents in Central Asia over thepast 27 years derived from medium-resolution remote sensing data. Int. J. Appl. Earth Obs. Geoinf. 2014, 26, 335–349. [Google Scholar] [CrossRef]
- Huang, S.; Dahal, D.; Young, C.; Chander, G.; Liu, S. Integration of Palmer Drought Severity Index and remote sensing data to simulate wetland water surface from 1910 to 2009 in Cottonwood Lake area, North Dakota. Remote Sens. Environ. 2011, 115, 3377–3389. [Google Scholar] [CrossRef] [Green Version]
- Xie, Z.; Huete, A.R.; Ma, X.; Coupe, N.R.; Devadas, R.; Clarke, K.; Lewis, M. Landsat and GRACE observations of arid wetland dynamics in a dryland river system under multi-decadal hydroclimatic extremes. J. Hydrol. 2016, 543, 818–831. [Google Scholar] [CrossRef]
- Moser, L.; Voigt, S.; Schoepfer, E.; Palmer, S.C.J. Multitemporal Wetland Monitoring in Sub-Saharan West-Africa Using Medium Resolution Optical Satellite Data. IEEE J. Sel. Top. Appl. Earth Obs. Remote Sens. 2014, 7, 3402–3415. [Google Scholar] [CrossRef] [Green Version]
- Valdez, V.C.; Ruiz-Luna, A.; Ghermandi, A.; Berlanga-Robles, C.A.; Nune, P.A.L.D. Effects of Land Use Changes on Ecosystem Services Value Provided By Coastal Wetlands: Recent and Future Landscape Scenarios. J. Coast. Zone Manag. 2016, 19, 1–7. [Google Scholar] [CrossRef] [Green Version]
- Zhang, R.; Tang, C.; Ma, S.; Yuan, H.; Gao, L.; Fan, W. Using Markov chains to analyze changes in wetland trends in arid Yinchuan Plain, China. Math. Comput. Model. 2011, 54, 924–930. [Google Scholar] [CrossRef]
- Mwita, E.; Menz, G.; Misana, S.; Nienkemper, P. Detection of Small Wetlands with Multi Sensor Data in East Africa. Adv. Remote Sens. 2012, 1, 64–73. [Google Scholar] [CrossRef] [Green Version]
- Alam, A.; Rashid, S.M.; Bhat, M.S.; Sheikh, A.H. Impact of land use / land cover dynamics on himalayan wetland ecosystem. J. Exp. Sci. 2011, 2, 60–64. [Google Scholar]
- Butt, A.; Shabbir, R.; Ahmad, S.S.; Aziz, N. Land use change mapping and analysis using Remote Sensing and GIS: A case study of Simly watershed, Islamabad, Pakistan. Egypt. J. Remote Sens. Space Sci. 2015, 18, 251–259. [Google Scholar] [CrossRef] [Green Version]
- Peter, K.H.; Nnko, H.J.; Mubako, S. Impacts of anthropogenic and climate variation on spatiotemporal pattern of water resources: A case study of Lake Babati, Tanzania. Sustain. Water Resour. Manag. 2020, 6, 1–12. [Google Scholar] [CrossRef]
- Wang, Z.; Huang, N.; Luo, L.; Li, X.; Ren, C.; Song, K.; Chen, J.M. Shrinkage and fragmentation of marshes in the West Songnen Plain, China, from 1954 to 2008 and its possible causes. Int. J. Appl. Earth Obs. Geoinform. 2011, 13, 477–486. [Google Scholar] [CrossRef]
- Mwita, E.J. Land Cover and Land Use Dynamics of Semi Arid Wetlands: A Case of Rumuruti (Kenya) and Malinda (Tanzania). J. Remote Sens. GIS 2013, S1, 1. [Google Scholar] [CrossRef] [Green Version]
- Amani, M.; Salehi, B.; Mahdavi, S.; Granger, J.E.; Brisco, B.; Hanson, A. Wetland Classification Using Multi-Source and Multi-Temporal Optical Remote Sensing Data in Newfoundland and Labrador, Canada. Can. J. Remote Sens. 2017, 43, 360–373. [Google Scholar] [CrossRef]
- Halabisky, M.; Moskal, L.M.; Hall, S.A. Object-based classification of semi-arid wetlands. J. Appl. Remote Sens. 2011, 5, 53511. [Google Scholar] [CrossRef]
- Blaschke, T. Object based image analysis for remote sensing. ISPRS J. Photogramm. Remote Sens. 2010, 65, 2–16. [Google Scholar] [CrossRef] [Green Version]
- Shoko, C.; Mutanga, O.; Dube, T. Progress in the remote sensing of C3 and C4 grass species aboveground biomass over time and space. ISPRS J. Photogramm. Remote Sens. 2016, 120, 13–24. [Google Scholar] [CrossRef]
- Na, X.; Zhang, S.; Li, X.; Yu, H.; Liu, C. Improved Land Cover Mapping using Random Forests Combined with Landsat Thematic Mapper Imagery and Ancillary Geographic Data. Photogramm. Eng. Remote Sens. 2010, 76, 833–840. [Google Scholar] [CrossRef]
- Westra, T.; De Wulf, R.R. Monitoring Sahelian floodplains using Fourier analysis of MODIS time-series data and artificial neural networks. Int. J. Remote Sens. 2007, 28, 1595–1610. [Google Scholar] [CrossRef]
- Tian, S.; Zhang, X.; Tian, J.; Sun, Q. Random Forest Classification of Wetland Landcovers from Multi-Sensor Data in the Arid Region of Xinjiang, China. Remote Sens. 2016, 8, 954. [Google Scholar] [CrossRef] [Green Version]
- Millard, K.; Richardson, M. Wetland mapping with LiDAR derivatives, SAR polarimetric decompositions, and LiDAR–SAR fusion using a random forest classifier. Can. J. Remote Sens. 2013, 39, 290–307. [Google Scholar] [CrossRef]
- Dubeau, P.; King, D.J.; Unbushe, D.G.; Rebelo, L.-M. Mapping the Dabus Wetlands, Ethiopia, Using Random Forest Classification of Landsat, PALSAR and Topographic Data. Remote Sens. 2017, 9, 1056. [Google Scholar] [CrossRef] [Green Version]
- Fu, B.; Wang, Y.; Campbell, A.; Li, Y.; Zhang, B.; Yin, S.; Xing, Z.; Jin, X. Comparison of object-based and pixel-based Random Forest algorithm for wetland vegetation mapping using high spatial resolution GF-1 and SAR data. Ecol. Indic. 2017, 73, 105–117. [Google Scholar] [CrossRef]
- Judah, A.; Hu, B. The Integration of Multi-source Remotely-Sensed Data in Support of the Classification of Wetlands. Remote Sens. 2019, 11, 1537. [Google Scholar] [CrossRef] [Green Version]
- Simioni, J.P.D.; Guasselli, L.A.; De Oliveira, G.G.; Ruiz, L.F.C.; De Oliveira, G. A comparison of data mining techniques and multi-sensor analysis for inland marshes delineation. Wetl. Ecol. Manag. 2020, 28, 577–594. [Google Scholar] [CrossRef]
- Corcoran, J.M.; Knight, J.K.; Gallant, A.L. Influence of Multi-Source and Multi-Temporal Remotely Sensed and Ancillary Data on the Accuracy of Random Forest Classification of Wetlands in Northern Minnesota. Remote Sens. 2013, 5, 3212–3238. [Google Scholar] [CrossRef] [Green Version]
- Otukei, J.; Blaschke, T. Land cover change assessment using decision trees, support vector machines and maximum likelihood classification algorithms. Int. J. Appl. Earth Obs. Geoinform. 2010, 12, S27–S31. [Google Scholar] [CrossRef]
- Ramachandra, T.V.; Kumar, U. Wetlands of Greater Bangalore, India: Automatic Delineation through Pattern Classifiers. Electron. Green J. 2008, 1. [Google Scholar] [CrossRef]
- Frohn, R.C.; Autrey, B.C.; Lane, C.R.; Reif, M. Segmentation and object-oriented classification of wetlands in a karst Florida landscape using multi-season Landsat-7 ETM+ imagery. Int. J. Remote Sens. 2011, 32, 1471–1489. [Google Scholar] [CrossRef]
- Abdi, A. Land cover and land use classification performance of machine learning algorithms in a boreal landscape using Sentinel-2 data. GIScience Remote Sens. 2020, 57, 1–20. [Google Scholar] [CrossRef] [Green Version]
- Cao, L.; Pan, J.; Li, R.; Li, J.; Li, Z. Integrating Airborne LiDAR and Optical Data to Estimate Forest Aboveground Biomass in Arid and Semi-Arid Regions of China. Remote Sens. 2018, 10, 532. [Google Scholar] [CrossRef] [Green Version]
- Hakdaoui, S.; Emran, A.; Pradhan, B.; Lee, C.W.; Fils, S.C. N: A collaborative change detection approach on multi-sensor spatial imagery for desertwetland monitoring after a flash flood in Southern Morocco. Remote Sens. 2019, 11, 1042. [Google Scholar] [CrossRef] [Green Version]
- Berberoglu, S.; Yılmaz, K.T.; Ozkan, C. Mapping and monitoring of coastal wetlands of Çukurova Delta in the Eastern Mediterranean region. Biodivers. Conserv. 2004, 13, 615–633. [Google Scholar] [CrossRef]
- Soltani, K.; Amiri, A.; Zeynoddin, M.; Ebtehaj, I.; Gharabaghi, B.; Bonakdari, H. Forecasting monthly fluctuations of lake surface areas using remote sensing techniques and novel machine learning methods. Theor. Appl. Clim. 2020, 2020, 1–23. [Google Scholar] [CrossRef]
- Mahdianpari, M.; Salehi, B.; Mohammadimanesh, F.; Homayouni, S.; Gill, E. The First Wetland Inventory Map of Newfoundland at a Spatial Resolution of 10 m Using Sentinel-1 and Sentinel-2 Data on the Google Earth Engine Cloud Computing Platform. Remote Sens. 2018, 11, 43. [Google Scholar] [CrossRef] [Green Version]


| Resolution | Landsat MSS | Landsat TM | Landsat ETM+ | Landsat OLI | Sentinel-1 | Sentinel-2 | MODIS |
|---|---|---|---|---|---|---|---|
| Spectral bands (µm) | C-band (3.75–75 cm) | ||||||
| Band 1 | 0.45–0.52 | 0.45–0.515 | 0.43–0.45 | 0.443 | 0.62–0.67 | ||
| Band 2 | 0.52–0.62 | 0.525–0.605 | 0.45–0.51 | 0.49 | 0.841–0.876 | ||
| Band 3 | 0.63–0.69 | 0.63–0.69 | 0.53–0.59 | 0.56 | 0.459–0.479 | ||
| Band 4 | 0.5–0.6 | 0.76–0.90 | 0.775–0.90 | 0.64–0.67 | 0.665 | 0.545–0.565 | |
| Band 5 | 0.6–0.7 | 1.55–1.75 | 1.55–1.75 | 0.85–0.88 | 0.705 | 1.23–1.25 | |
| Band 6 | 0.7–0.8 | 10.4–12.5 | 10.4–12.5 | 1.57–1.65 | 0.74 | 1.628–1.652 | |
| Band 7 | 0.8–1.1 | 2.08–2.35 | 2.08–2.35 | 2.11–2.29 | 0.783 | 2.105–2.155 | |
| Band 8 | 0.52–0.9 | 0.50–0.68 | 0.842 | ||||
| Band 8A | 0.865 | ||||||
| Band 9 | 1.36–1.38 | 0.945 | 0.438–0.448 | ||||
| Band 10 | 10.6–11.19 | 1.375 | |||||
| Band 11 | 11.5–12.5 | 1.61 | |||||
| Band 12 | 2.19 | ||||||
| Band 19 | 0.915–0.965 | ||||||
| Band 31 | 10.78–11.28 | ||||||
| Band 32 | 11.77–12.27 | ||||||
| Temporal | 180 days | 16 days | 16 days | 16 days | 12 days | 5 days | 1–2 days |
| Spatial (pixel-sizes) | 80 m | 30 m & 120 for Band 6 | 30 m, 15 m B8 & 60 m B6 | 30 m B1–7 & 9 | 5 m × 5 m | 60 m B1,9,10 | 250 m B1–2, 500 m B8–36 |
| 15 m B8 | 10 m B2,3,4,8 | 1000 m B8–36 | |||||
| 100 m B10–11 | 20 m-B5,6,7,11,12 | ||||||
| Period | 1972–1992 | 1982–Present | 2003–Present | 2013–Present | 2014–present for 1A | 2015–Present For 2A and 2017 for 2B | 2000–present for Terra 2002–present for Aqua |
| 2016–present For 1B |
| Sensor | Pixel Size (m) | Bands | Revisit Time | Acquisition Cost | Scale of Application | Spatial Resolution |
|---|---|---|---|---|---|---|
| AVHRR | 1100 | 5 | 1 | Readily available | Regional to global | Low |
| Hyperspectral | <1 | >100 | - | Very expensive | Plot | High |
| IKONOS | 4 | 5 | 1–2 | Expensive | Local | High |
| Landsat TM | 30 | 7 | 16 | Readily available | Local to regional | Medium |
| Landsat ETM+ | 30 | 8,11 | 16 | Readily available | Local to regional | Medium |
| Landsat MSS | 80 | 4 | 180 | Readily available | Local to regional | Low |
| Landsat OLI | 30 | 11 | 16 | Readily available | Local to regional | Medium |
| MERIS | 300 | 15 | 3 | Readily available | Regional | Low |
| MODIS | 500, 1000 | 7 | 1 | Readily available | Regional to global | Low |
| QuickBird | 2.4 | 5 | 1–3.5 | Expensive | Local | High |
| RapidEye | 5 | 5 | 5.5 | Expensive | Local | High |
| Sentinel-2 | 10, 20, 60 | 13 | 5 | Readily available | Local to regional | High/medium |
| SPOT | 10, 20 | 4 | 26 | Readily available | Local to regional | High |
| Worldview-2 | <1 | 8 | 1 | Very expensive | Local | High |
| Sentinel-1 | 5m | 1 | 12 | Readily available | Local to regional | High |
| Algorithm | Remote Sensing Data | Performance Range | Reference |
|---|---|---|---|
| RF | Landsat TM, Sentinel 1A, 2A, MODIS, LiDAR, SAR, ALOS-PALSAR, RADARSAT | 80–98% | [70,72,73,74,75,76,77] |
| CART | Landsat TM, Sentinel-1A, 2A, PALSAR, Landsat ETM+ | 89.2–92% | [71,78,79,80] |
| MLC | Landsat TM, MODIS, Landsat MSS, Landsat ETM+ | 83.6–94% | [71,72,80,81,82] |
| SVM | Sentinel-2,1A, Landsat OLI | 75–87% | [78,80,83,84,85,86] |
| ANN | Sentinel-2, Landsat TM, ETM+, OLI | 90–96% | [72,78,86,87] |
| KNN | Sentinel-2, Landsat TM, ETM+, OLI, RADARSAT-2, Sentinel-1 | 83–97% | [77,78,84,87] |
| Unsupervised classification | Landsat TM, ETM+, MSS, Sentinel-2 | 82–96% | [71,78,81] |
Publisher’s Note: MDPI stays neutral with regard to jurisdictional claims in published maps and institutional affiliations. |
© 2020 by the authors. Licensee MDPI, Basel, Switzerland. This article is an open access article distributed under the terms and conditions of the Creative Commons Attribution (CC BY) license (http://creativecommons.org/licenses/by/4.0/).
Share and Cite
Gxokwe, S.; Dube, T.; Mazvimavi, D. Multispectral Remote Sensing of Wetlands in Semi-Arid and Arid Areas: A Review on Applications, Challenges and Possible Future Research Directions. Remote Sens. 2020, 12, 4190. https://0-doi-org.brum.beds.ac.uk/10.3390/rs12244190
Gxokwe S, Dube T, Mazvimavi D. Multispectral Remote Sensing of Wetlands in Semi-Arid and Arid Areas: A Review on Applications, Challenges and Possible Future Research Directions. Remote Sensing. 2020; 12(24):4190. https://0-doi-org.brum.beds.ac.uk/10.3390/rs12244190
Chicago/Turabian StyleGxokwe, Siyamthanda, Timothy Dube, and Dominic Mazvimavi. 2020. "Multispectral Remote Sensing of Wetlands in Semi-Arid and Arid Areas: A Review on Applications, Challenges and Possible Future Research Directions" Remote Sensing 12, no. 24: 4190. https://0-doi-org.brum.beds.ac.uk/10.3390/rs12244190