Characteristics of Coastline Changes on Southeast Asia Islands from 2000 to 2015

1
Yantai Institute of Coastal Zone Research, Chinese Academy of Sciences, Yantai 264003, China
2
University of Chinese Academy of Sciences, Beijing 100049, China
3
Key Laboratory of Coastal Environmental Processes and Ecological Remediation, Yantai Institute of Coastal Zone Research, Chinese Academy of Sciences, Yantai 264003, China
4
Center for Ocean Mega-Science, Chinese Academy of Sciences, Qingdao 266071, China
*
Author to whom correspondence should be addressed.
Remote Sens. 2020, 12(3), 519; https://0-doi-org.brum.beds.ac.uk/10.3390/rs12030519
Submission received: 2 January 2020
/
Revised: 31 January 2020
/
Accepted: 3 February 2020
/
Published: 5 February 2020
(This article belongs to the Special Issue Remote Sensing of Islands)
Abstract
:The future of islands has been the subject of international concern, scientific debate and media interest in the last decade. As a result of global warming and sea level rise, increasingly more research and speculations about the morphology and positions of island coastlines have been produced. However, some assumptions are not well documented due to the lack of large-scale research and data support. This paper contributes to filling this gap by extracting and assessing coastline changes on Southeast Asian islands overall during 2000–2015 based on Landsat remote sensing images. The results are as follows: ① the coastline, defined by the mean high water line (MHWL), of Southeast Asia remained relatively stable but showed considerable variability in space, especially in estuaries, bays and straits. ② A total of 9035 islands were extracted, among which approximately 10% of islands witnessed locational changes in coastlines, resulting in net reductions of nearly 86 km2 in area and 50,000 km in centroid displacement. Additionally, the coastline length increased by 532 km from 2000 (148,508 km) to 2015 (149,040 km). Natural coastlines decreased by 2503 km, while artificial coastlines increased by 3035 km. Among the total coastlines, 11% changed: 5% exhibited deposition, while 6% experienced retreat. ③ The temporal and spatial changes in coastlines were the result of interactions between natural processes and human activities. Climatic and environmental changes had wide impacts, while human activities caused more dramatic local changes. In addition, the sizes, shapes and landforms of the islands played significant roles in coastline changes. ④ Coastal erosion and expansion often coexisted in dynamic equilibrium under the influence of coastal hydrodynamics, such as cyclical tides and near-shore sediment transport. Our findings reveal spatial–temporal variations in island coastlines in Southeast Asia from 2000–2015 and provide critical information for the current study of islands. This work has great significance for the study of global climate change impacts and the integrated management of island coastal zones.
1. Introduction
As one of the 27 surface elements identified by the International Geographic Data Committee [1], coastlines are not only the embodiment of coastal ecosystem evolution but also important symbols of coastal economic development activities [2,3,4]. Because of their special geographic locations and demographic characteristics, islands are considered particularly vulnerable to coastal hazards against the background of global climate change, such as sea level rise, sea surface temperature increase, and ocean acidification [5,6,7,8]. Small island states around the world will face even greater threats in the future [9,10]. Temporal and spatial variations in island coastlines can effectively reveal numerous ecological environmental problems, such as resource development, ecosystem evolution, coastal erosion and integrated island management. Therefore, it is especially necessary to study the temporal and spatial changes in island coastlines.
However, research on island coastlines had a late start. In fact, related research only gradually increased until the 21st century. Different temporal and spatial scales were chosen to study the change characteristics of island coastlines based on individual islands, atolls or other archipelagos [11,12,13]. For example, Romine and Fletcher (2013) [14] analysed the temporal and spatial variation characteristics of three volcanic island coastlines in the Hawaiian Islands on both long-term (early 1900s–2013) and short-term (mid-1940s–2013) time scales. The results showed that on a small spatial scale, coastline changes seemed to be more closely related to local hydrodynamic and sediment budgets. Moreover, the shape and geomorphology of the islands affected the trends of the coastlines. Note that sea level rise would accelerate the erosion of coastlines, especially along vulnerable parts. Based on historical aerial photographs (1943–1978) and high-resolution remote sensing images (2010–2013), Ford and Kench (2015) [15] conducted a long-term analysis of coastline changes on six atolls and two marine reefs in the Republic of the Marshall Islands. This study found that since the mid-20th century, the coastlines aggraded more than they eroded; erosion accounted for 17.23%, expansion accounted for 39.74% and no change accounted for 43.03%. The qualitative analysis indicated that sea level rise, storm surges, island morphology and geomorphology played important roles in island coastline changes. Duvat (2019) [16] summarized 709 islands in 30 atolls in the Pacific Ocean and the Indian Ocean based on coastline datasets (1896–2014) from the literature. The results indicated that 518 of the 709 islands remained stable (73.1%), 110 islands exhibited deposition (15.5%) and 81 islands experienced retreat (11.4%). He proposed a global trend in which the atolls remained stable, even in areas where sea level rose rapidly.
To date, most research has focused only on a few islands and atolls to study the temporal and spatial characteristics and drivers of island coastline changes based on natural and human activities, such as island morphology and geomorphology, cyclical tides, tropical cyclones, sediment transport, ecosystem driving, dam interception and commercial sand mining [14,17,18,19]. Furthermore, under the circumstances of global warming and rising sea level, many studies have focused on sea level rise and island coastline changes. It has therefore commonly been considered that atoll reef islands would disappear as a result of rising seas and accelerating coastline erosion [20,21]. Nevertheless, some scholars have held the opposite view [15,22,23,24]. McLean and Kench (2015) believed that by the end of the 21st century, atolls would continue to exist and be inhabited. Notably, one of the major differences is whether islands are natural or inhabited. Densely inhabited islands cannot grow because their growth potential has been weakened or even fully stopped by artificial infrastructure on these islands. However, there is currently insufficient evidence to verify either viewpoint because of a lack of suitable coastline databases and large-scale studies [25,26].
Southeast Asia has a large number of islands, and the Indonesian archipelago is the largest archipelago in the world with more than 17,000 islands [27]. This area is a hotspot for studying changes in the coastlines of islands, estuary ecological protection, disaster risk management and so on. However, research has concentrated on only a certain sea area, one island or a specific coast. Few studies have focused on all islands of Southeast Asia to reveal coastline changes.
We defined the mean high water line (MHWL) as the coastline and obtained coastline data for all extractable islands in Southeast Asia based on Landsat images (30 m/pixel) with visual interpretation method. Overall, regional and local scales of analysis were used to analyse the temporal and spatial characteristics of coastline changes on Southeast Asia islands. We found (1) approximately 1.6 × 10³ km (11%) of coastlines changed in location, involving 870 islands; (2) great spatial variability in coastline changes; and (3) human activities and natural elements both play important but different roles in coastline changes. Such results can provide significant information to evaluate the development of and ecological risks to island coastal zones. Thus, the integrated coastal zone management (ICZM) practices can strengthen protection and utilization of coastlines scientifically and reasonably.
The paper is structured as follows: Section 2 describes the features of the study area, data sets, and methods. Section 3 presents the results that include (i) the length and structure of island coastline changes; (ii) the area, shape and position of island changes; and (iii) the land–sea patterns of island changes. These results are discussed in Section 4, and Section 5 summarizes the main conclusions.
2. Data and Methods
2.1. Study Area
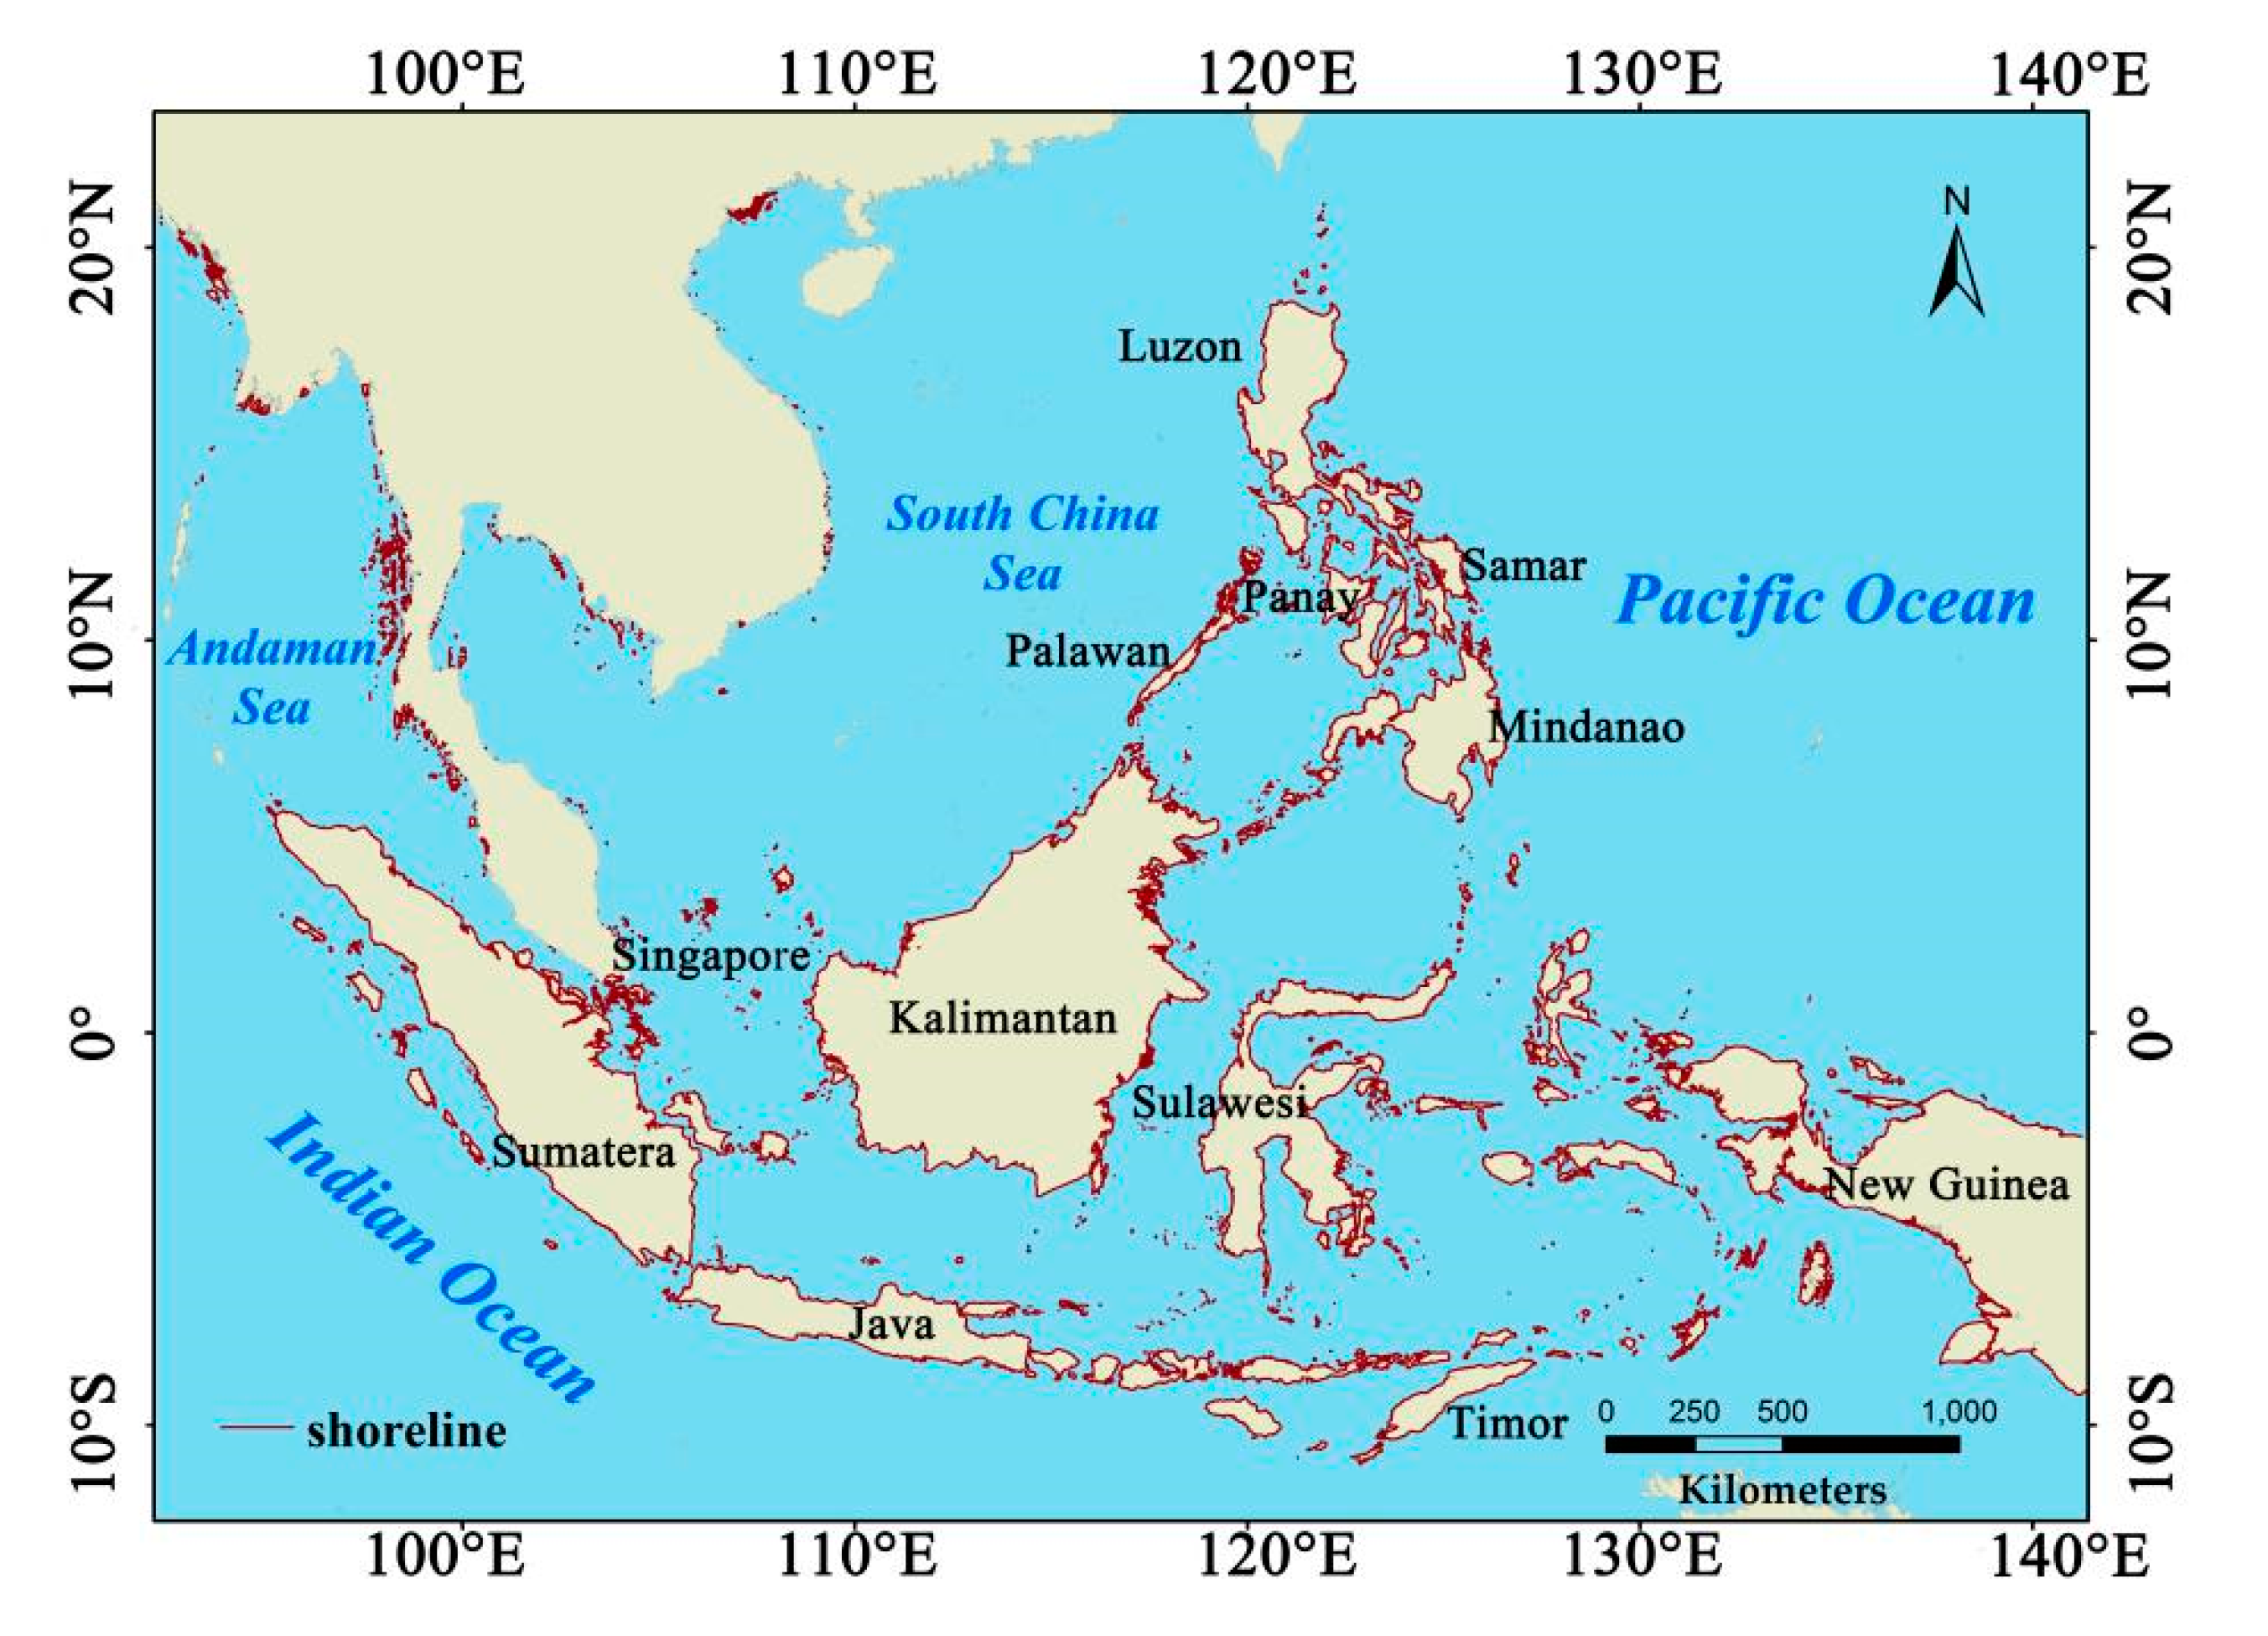
Southeast Asia is located at the intersection of Asia and Oceania, the Pacific Ocean and the Indian Ocean, and lies between 92°~140°E and 10°S~28.5°N; it includes the Indo-China Peninsula, the Malay Archipelago and 11 countries, namely, Vietnam, Laos, Cambodia, Thailand, Myanmar, Malaysia, Singapore, Indonesia, Brunei, Philippines and East Timor (Figure 1). Southeast Asia is one of the most complex areas in the world and is composed of continental plates and oceanic plates. Its continental plates consist of the Indian-Sinian Plate and the Australian Plate, and the oceanic plates are the Indian Ocean Plate, the Pacific Plate, and the Philippine Sea Plate. Moreover, the interactions between these plates (such as earthquakes) are liable to change the shapes and locations of the coastlines [28,29]. The region is 80% mountains and hills, 5% plateaus and only 15% plains and swamps. The population of Southeast Asia is mainly distributed in the delta areas with low elevations. Southeast Asia is widely accepted to be one of the most sensitive and vulnerable regions affected by climate change due to its large population and ecological pressure [30,31,32]. The climates in Southeast Asia are dominated by tropical monsoon climate, tropical dry and wet monsoon climates and tropical rainforest climate, with high temperature and abundant rainfall. As a consequence, many estuary deltas and rainforests have developed. Affected by sediment transport along the coast (mainly driven by local hydrodynamics), monsoons and rainfall, island changes in estuary deltas have been key and popular issues concurrently [33,34,35,36].
Southeast Asia is one of the most dynamic regions in the world with great potential and abundant natural and human resources. The urbanisation process has continued to develop in recent decades, especially in large cities along the coast. Agriculture, forestry, animal husbandry and fishery, mining, processing industry, international trade and tourism are the major industries, resulting in considerable crops (rice, oil palm, coconut, abaca, rubber, etc.) and mineral resources (oil, natural gas, tin, copper, etc.). Moreover, since the 1950s and 1960s, major cities in Southeast Asia have experienced the development and evolution of agriculture and traditional trade to industrial development and then to export-oriented trade and port economy, which is bound to result in great changes in the coastal structure of coastal cities [37].
2.2. Data
Landsat images have been widely used in the extraction of coastlines and coastal zone research because of their long time sequence, high resolution and free availability since the advent of satellite remote sensing technology in the 1970s [26,38,39,40,41]. At least 325 scenes of Landsat images were needed to cover all the coastal zones in Southeast Asia. However, multiple images were often needed in the same location when images were strongly affected by clouds. Hence, a total of 784 scenes of Landsat Thematic Mapper (TM) and Enhanced TM-Plus (ETM+) images in 2000 and 615 scenes of Operational Land Imager (OLI) images in 2015 were used (Figure 2). All images were downloaded from the USGS database (https://glovis.usgs.gov/app?fullscreen=1). These images were processed for level 1 terrain-corrected data, corrected using ground control points and a digital elevation model to achieve high geodetic accuracies and subsequently processed by band fusion and enhancement with different algorithms (standard deviations, histogram equalization, etc.).
Previous studies have confirmed that different types of coastlines can be extracted well from Landsat images [40,42,43]. However, similar texture or colour characteristics may be exhibited in the images by different types of coastlines, such as salt and aquaculture dikes and sandy and silty coastlines. Thus, extracting the real position of the coastline is difficult in some local regions with complicated geographic features. Therefore, high-resolution images provided by Google Earth and several global scale land-use datasets [44,45,46,47] were used for reference to improve the accuracy of locations and types of coastlines. In addition, considering that mangroves are important biological resources and are widely distributed in Southeast Asia, the dataset of the global distribution of mangroves [48], derived from approximately 1000 scenes of Landsat images, was also applied as auxiliary data to identify mangrove forests.
2.3. Coastline Definition and Classification
An idealized and simple definition of coastline is the physical interface between land and water [49]. However, this line is not fixed and is highly dynamic because of cross-shore and alongshore sediment movement, waves, tides, storm surges and human activities. Therefore, coastline proxies have often been employed in practice, such as wet/dry boundaries, vegetation lines, debris lines, beach ridge lines, mean high water line (MHWL), instantaneous high water line (IHWL) and low water line (LWL). The MHWL is usually recognized as the best coastline indicator because of its high stability and easy identification both in remote sensing images and in the field. Thus, the MHWL was also adopted in this paper. The average location of the high tide line over a year was emphasized in our study; therefore, the influences of tidal and seasonal changes could be reduced and even ignored.
The coastline classification system for Southeast Asia was established according to the composition and utilization of coastlines, as presented in Table 1. A detailed description of various coastlines and corresponding MHWL locations can be found in Table 1. Different types of coastlines were extracted more accurately from the satellite images because of their divergence in colour and texture based on this classification system.
2.4. Technical Methods of Coastline Extraction
There are various methods of coastline extraction. For example, Nandi et al. (2016) [13] delineated the coastline of Sagar Island using an automatic Tasseled Cap transformation technique; Abu et al. (2018) [50] and Xu (2006) [51] extracted the locations of coastlines with the normalized difference water index (NDWI); and Hou et al. (2016) [52] extracted the mainland coastline of China manually by referring to landforms and nearby surface features. In general, coastline extraction methods are divided into automatic extraction, semi-automatic extraction and manual visual interpretation. The evidence suggests that practising the method of visual interpretation can usually lead to the most accurate results, which is often used as the “true value” to verify other kinds of coastline data [53,54].
A reliable methodology for coastline delineation and classification was applied in this research. We delineated and researched the spatial–temporal characteristics of long-term mainland coastline changes in China. Specifically, we carried out 11 field trips that covered the whole coastal zone of mainland China [52,55] as well as that of Hainan Island, China. The itinerary amounted to 1.80 × 10⁴ km in total; furthermore, more than six thousand photos and 629 in situ GPS coordinates accompanied by detailed textual descriptions of coastline survey sites were acquired. Based on these primary data and abundant knowledge, identification criteria for coastlines (MHWLs) in different geomorphologic sites and corresponding interpretation standards on remote sensing images were established. Briefly, for locational identification, a rocky coastline was generally delineated at the wet/dry boundary on satellite images or the baseline of a bluff/cliff in situ, a sandy coastline was delineated at the beach crest or vegetation line, a muddy coastline was delineated at the vegetation line or debris line (the morphology and distribution of tidal creeks could be used as supplementary information) and a biogenic coastline of vegetation patches was delineated at the vegetation line on the landward side [55]. All of the MHWLs were delineated manually in the ArcMap software and stored as GIS data with line features, and the categorical information about each MHWL segment was compiled in its attribute tables.
Applying the methodology outlined above, the coastlines of islands in Southeast Asia were extracted manually based on Landsat images. First, considering the fractal features of the coastline and standardising the extraction rules for the islands, the screen scale of the ArcGIS 10.2 software was strictly fixed at 1:10,000. Then, under the screen display scale, all the islands that could be clearly interpreted were bound to be extracted, generally more than 10 pixels (9 × 10³ m2) in a Landsat image. Second, in estuary deltas, numbers of islands were separated by narrow watercourses. Hence, we stipulated that if the average distance between adjacent islands was less than 10 pixels, they were regarded as a single island for coastline extraction. Third, during the on-screen digitisation, sufficient sampling density with the mouse cursor was required to minimise the displacement as much as possible. Sampling points were densified where the coast was tortuous or reduced where the coast was smooth or straight. High-resolution Google Earth images were fully used for the accurate identification of coastline types due to the impossibility of field surveys in the study area.
2.5. Uncertainty in Coastline Position
The minimum distance from the points obtained using Landsat images to the reference points in Google Earth images was considered the error at each point. Taking 2015 coastline data as an example, verification samples were captured based on Google Earth images, and the average error was calculated using the random sampling method in this paper. In total, 1030 sample points were randomly generated based on the 2015 coastlines. Then, these samples were imported into the Google Earth platform and adjusted them to more accurate locations based on 2015 Google Earth images. The adjusted points were called verification points. Finally, the distance between the sample point and the verification point was calculated as the position error. The results showed that the average error was 20 m and the standard deviation was 17 m, both of which were almost less than one image pixel (30 m/pixel) of Landsat image, in specific, 74% of the points had an error less than 30 m, which was acceptable for this research.
2.6. Analytical Methods
2.6.1. Concept Diagram for a Single Island
Taking a single island as an example, the shoreline swings and the changes in area and location of the island are shown in Figure 3.
2.6.2. Length and Structure Changes
1. Length Change in Island Coastline
To avoid errors caused by the different lengths of research units and intervals of the monitoring period, the annual average change percentage of coastline length in a certain period was used to indicate the intensity of the coastline change, as shown in Formula (1):
where LI is the intensity of coastline length change on the island, and L2015 and L2000 represent the coastline lengths of the island in 2015 and 2000, respectively. A negative LI indicates that the coastline length of the island decreased, and a larger absolute value of LI indicates that the change in coastline length was more pronounced.
2. Structure Change in Island Coastline
The type of coastline might also change with changes in the location of the coastline because of natural and human activities, especially the development and utilisation of coastal zones by humans. For example, a number of natural coastlines were displaced by traffic dikes or urban coasts after seaward expansion, as shown in Figure 3.
The coastline structure was defined as the length ratio of different types of coastlines in a certain area during a given period. The artificial rate of a coastline is the proportion of artificial coastline length to the total length, as shown in Formula (2):
2.6.3. Island Morphology Changes
1. Area Change
The intensity of island area change was expressed as the percentage of island area change, as shown in Formula (3):
where AI is the intensity of island area change. A2015 and A2000 represent the areas of the island in 2015 and 2000, respectively. A negative AI indicates that the area of the island decreased, and a larger absolute value of AI indicates that the change in island area was more pronounced.
2. Shape Change
The shape index was introduced to analyse the characteristics and complexity of the island shape, in other words, the shape index quantified how close the island shape was to a circle in this study. Formula (4) shows the definition:
where LSI is the shape index of the island. L is the coastline length of the island. A is the area of the island. The larger the LSI is, the more complex the shape of the island.
3. Position Movement
As shown in Figure 3, the land–sea patterns of the island may change along with the coastline position, while the position of the island’s centroid changes concurrently. In Figure 3b, l and α were defined as the moving distance and azimuth of the island centroid, respectively. Moreover, the displacements and azimuths of all changed islands were counted in this study and are shown by a rose diagram in Figure in Section 3.2.3.
2.6.4. Island Land–Sea Pattern Changes
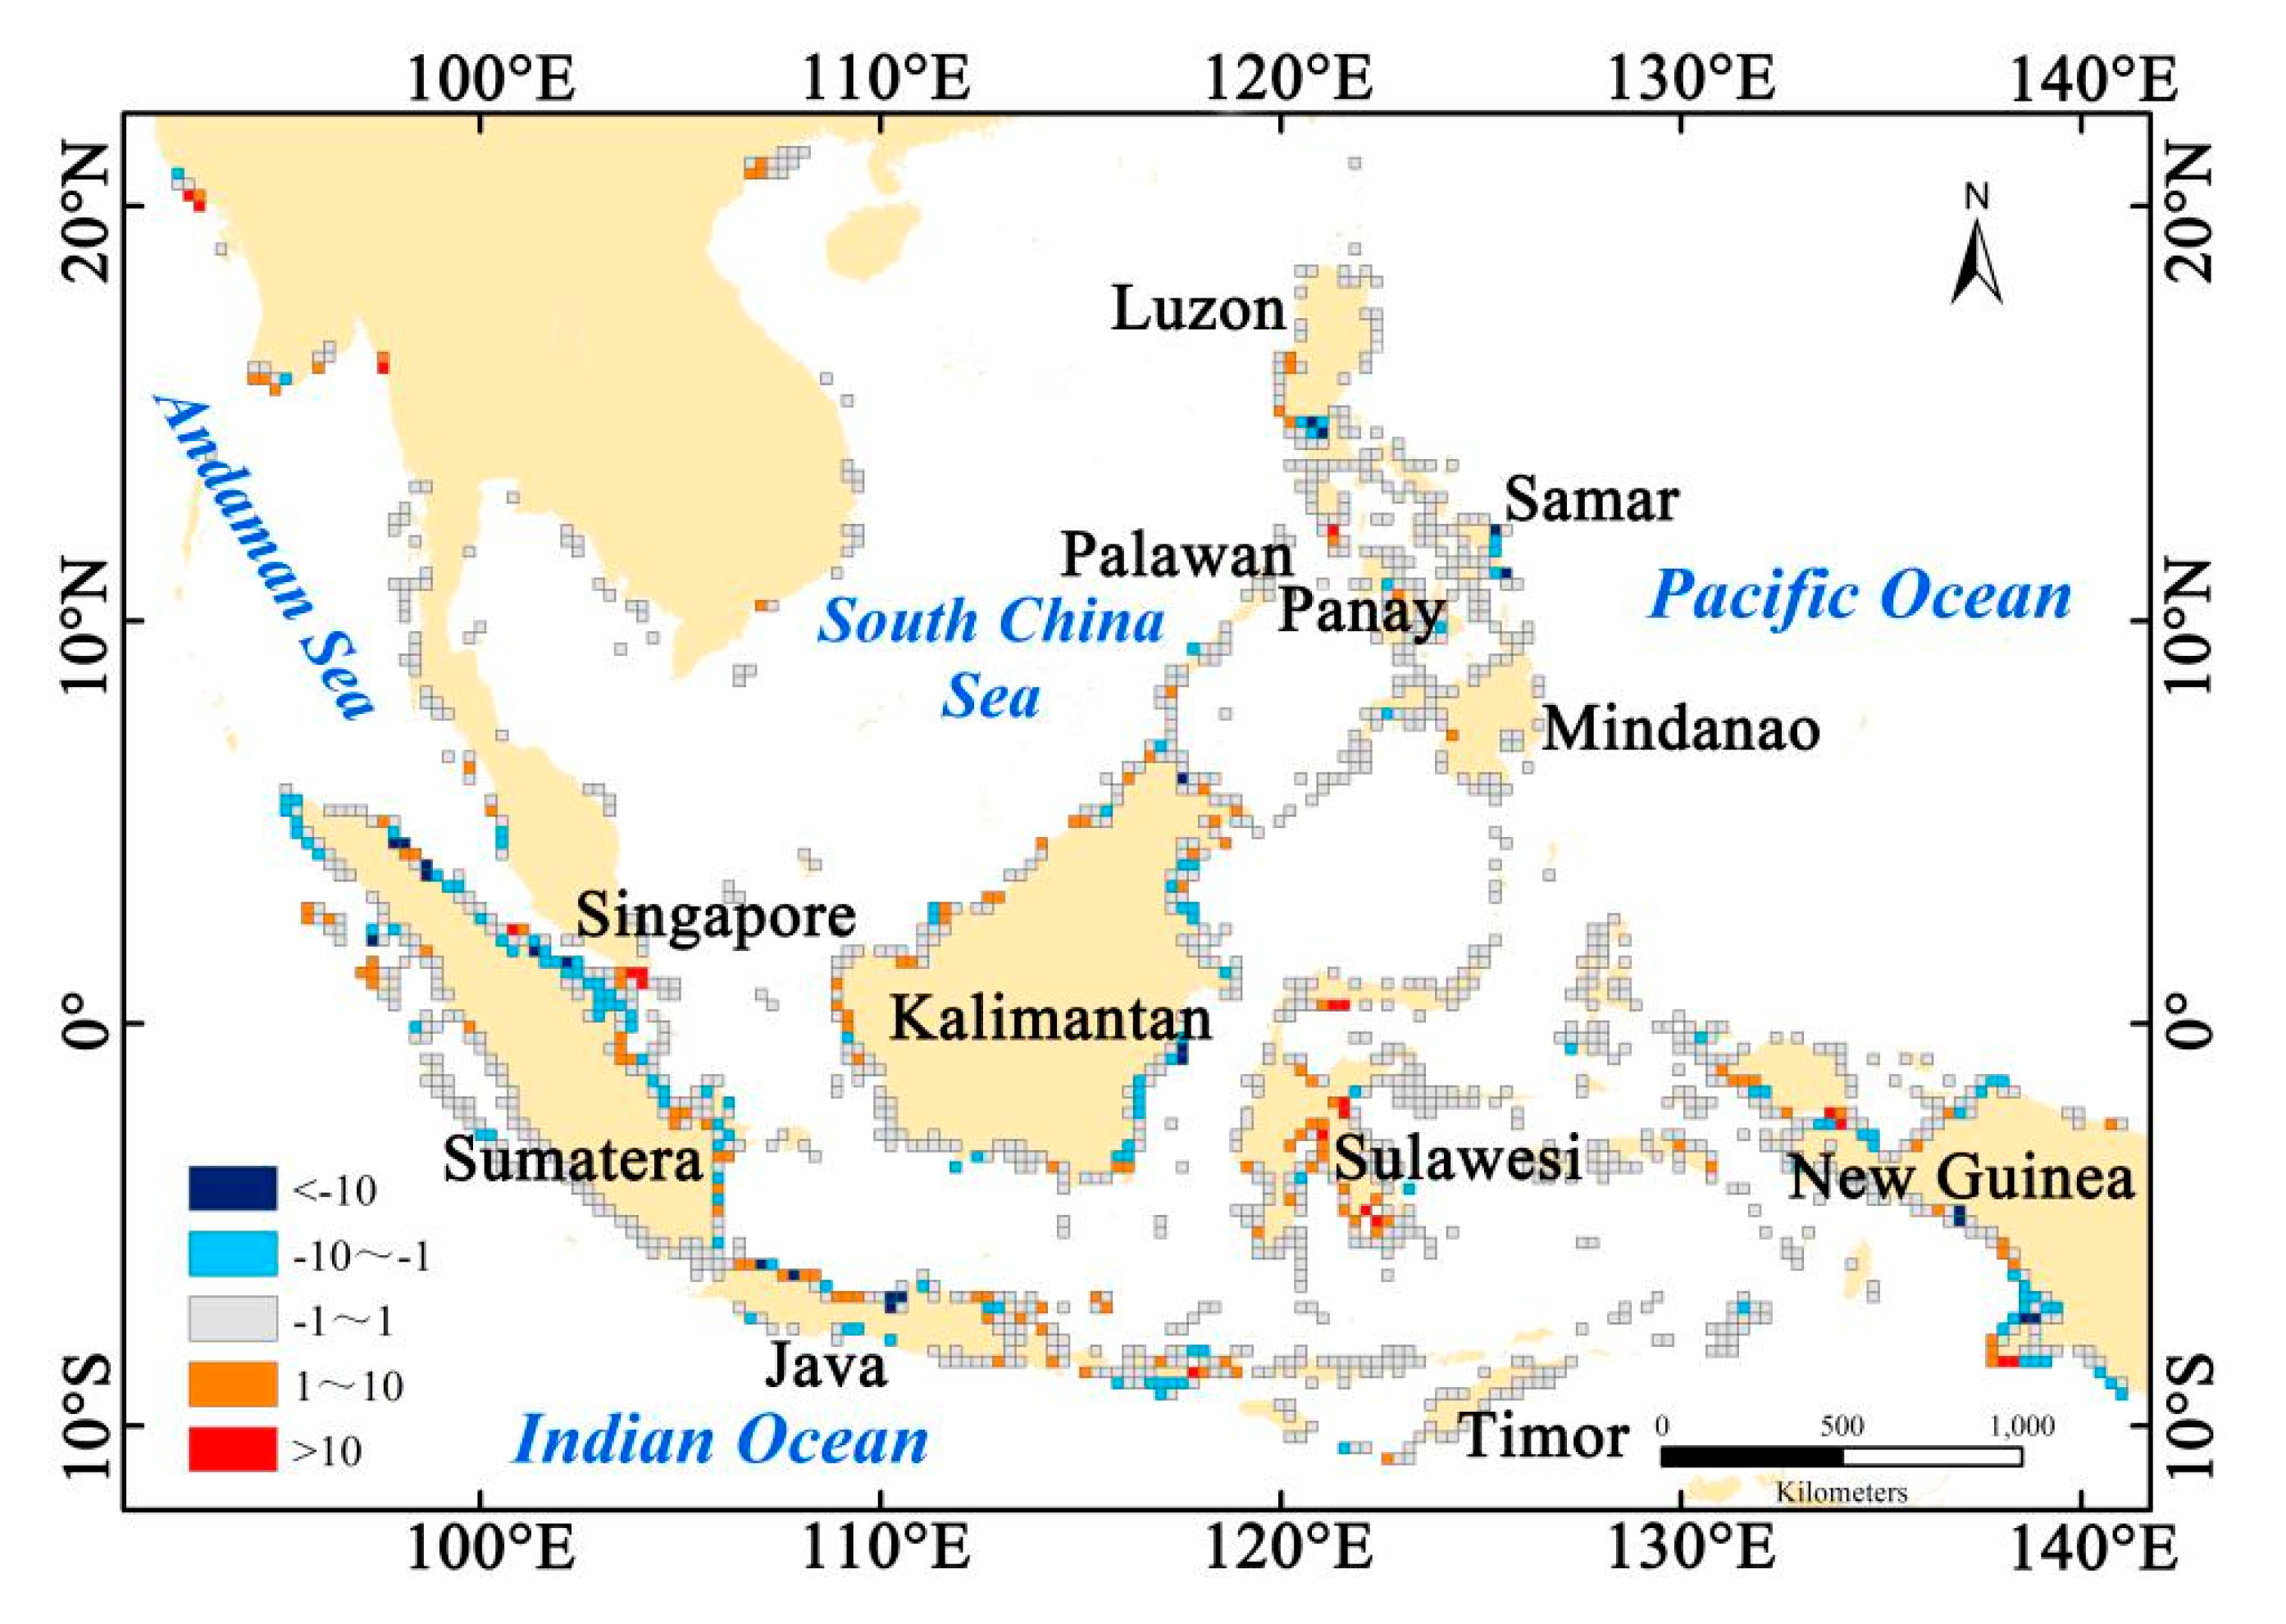
As shown in Figure 3a, areas changed by coastlines expanding seaward were defined as expansion regions; conversely, areas changed by coastlines receding landward were defined as erosion regions. The land–sea patterns of islands seemed to change with the location of the coastline. Therefore, to obtain a better spatial visualisation and to describe the characteristics of land–sea pattern changes quantitatively in Southeast Asian islands, a 30 × 30 km cell was generated to calculate the changed area within each cell. Then, we defined the changed areas whose absolute values were within 1 km2 as stable areas, those within 1–10 km2 as micro-expansion areas (negative values represented micro-erosion areas), and those exceeding 10 km2 as strong expansion areas (negative values represented strong erosion areas). The results are shown in the first figure in Section 3.3.
3. Results
Coastline structures, land–sea patterns, areas, perimeters and locations of the islands were analysed on three scales: overall, regional and local. Specifically, 12 major islands were regarded as objects on a regional scale, and the regions with dramatic changes were regarded as objects on a local scale.
3.1. Island Coastline Changes
3.1.1. Change in Coastline Length
The total lengths of the coastlines in 2000 and 2015 were 148,508 and 149,040 km, respectively, with a net increase of 532 km; 379 islands perimeter lengthened, and 484 islands perimeters shortened. In addition, the length of coastlines in the Indonesian archipelago increased significantly, while that in the Philippine archipelago barely changed. Moreover, it is worth noting that the variations in the length of coastlines and the area of islands were not always consistent. Specifically, as the area of an island increased, the length of the coastline did not necessarily increase, and it might even decrease. Similarly, a reduction in the area did not consequently result in a shorter length; on the contrary, it might have been accompanied by a greater length. For instance, the length of a coastline would tend to decrease when reclamation occurred in the sunken places of a bay; conversely, filling on a straight coast generally resulted in increased coastline length.
Coastal erosion has been suggested to generally lead to a reduction in coastline length due to natural processes, such as tides, storm surges and sediment transport. A sharp increase in coastline length on a large scale is generally caused by human activities, such as reclamation. The intensities of island coastline length changes are shown in Table 2. Overall, intensities changed slightly. There were 640 islands with absolute values of less than 0.5%, accounting for nearly 75%. Additionally, an interesting phenomenon was that the number of islands with coastline shortening was greater than that with coastline lengthening in the range of different transition strengths. However, in terms of average intensity change, it was 0.8% for islands with coastline increased, while it was 0.6% for islands with coastline decreased. These findings indicated that natural processes generally caused a wider range of changes in coastline location than human activities. However, human activities generally resulted in more severe changes than natural processes.
Except for Singapore, the lengths of the 11 major islands remained relatively stable, as shown in Table 3. The coastline lengths of Luzon, Mindanao, Samar and Palawan decreased, while those of the remaining islands increased. In particular, Java Island increased the most by approximately 100 km, and Singapore’s coastline change intensity was the strongest, as high as 15.5%, with an increase in coastline length of nearly 60 km.
3.1.2. Changes in Coastline Structure
The rates of artificial coastlines along Southeast Asian islands were generally low. In 2000, the proportion of artificial coastlines was only 3.7%, and it increased to 5.7% in 2015, along with a growth of 3035 km. The increases in different types of artificial coastlines are shown in Figure 4. The lengths of groins and jetties, harbours and wharves, aquaculture dikes, traffic dikes and urban coasts increased significantly, and aquaculture dikes grew the most by far, approximately 2000 km over 15 years. Therefore, the aquaculture industry can be seen to have developed rapidly during this period in Southeast Asia [56,57], and industrial development and adjustment could have large impacts on coastlines. In addition, since the 21st century, the level of urbanisation in Southeast Asian countries has been increasing. As a consequence, the level of urbanisation in Indonesia and East Timor increased by more than 10% in 2014 compared with 2000, which is confirmed very well by this study.
At the single island level, 8840 islands had completely natural coastlines in 2000; then, this number decreased to 8769 by 2015. In 2000, there were 52 and 93 islands with ports and urban coasts, respectively, and these numbers increased to 68 and 117 by 2015. Therefore, these comparisons indicated that certain numbers of natural shores and even uninhabited islands have been developed and utilized, driven by population growth, urbanisation and the development of port economies over the past 15 years.
As listed in Table 4, except for Palawan, the island length percentages increased by different degrees. The artificial coastline lengths of Kalimantan and New Guinea increased by more than 100%. Furthermore, the details in Table 4 illustrates that the variations in the coastline structures for the 12 islands were quite different, as some of them had rapid growth in port and urban coasts, while others experienced considerable growth in aquaculture and salt dikes. For example, the length of jetties on Mindanao increased by 802%, aquaculture dikes on Kalimantan increased by 363%, harbour coastlines on Sulawesi increased by 1446% and urban coasts on New Guinea increased by 709%. Differences in natural resources and environments and levels of social development among islands played important roles in the differences among coastline structure changes.
People changed coastline structures by large-scale development in the use of coasts. Human activities were undoubtedly the main cause of local changes in coastline types compared with climate changes. However, over a longer period and given the tendency towards increased sea level rise (SLR), SLR may overrule the effects of other man-made interventions by the end of the century if considering the largest predicted SLR scenarios (RCP 8.5) [58].
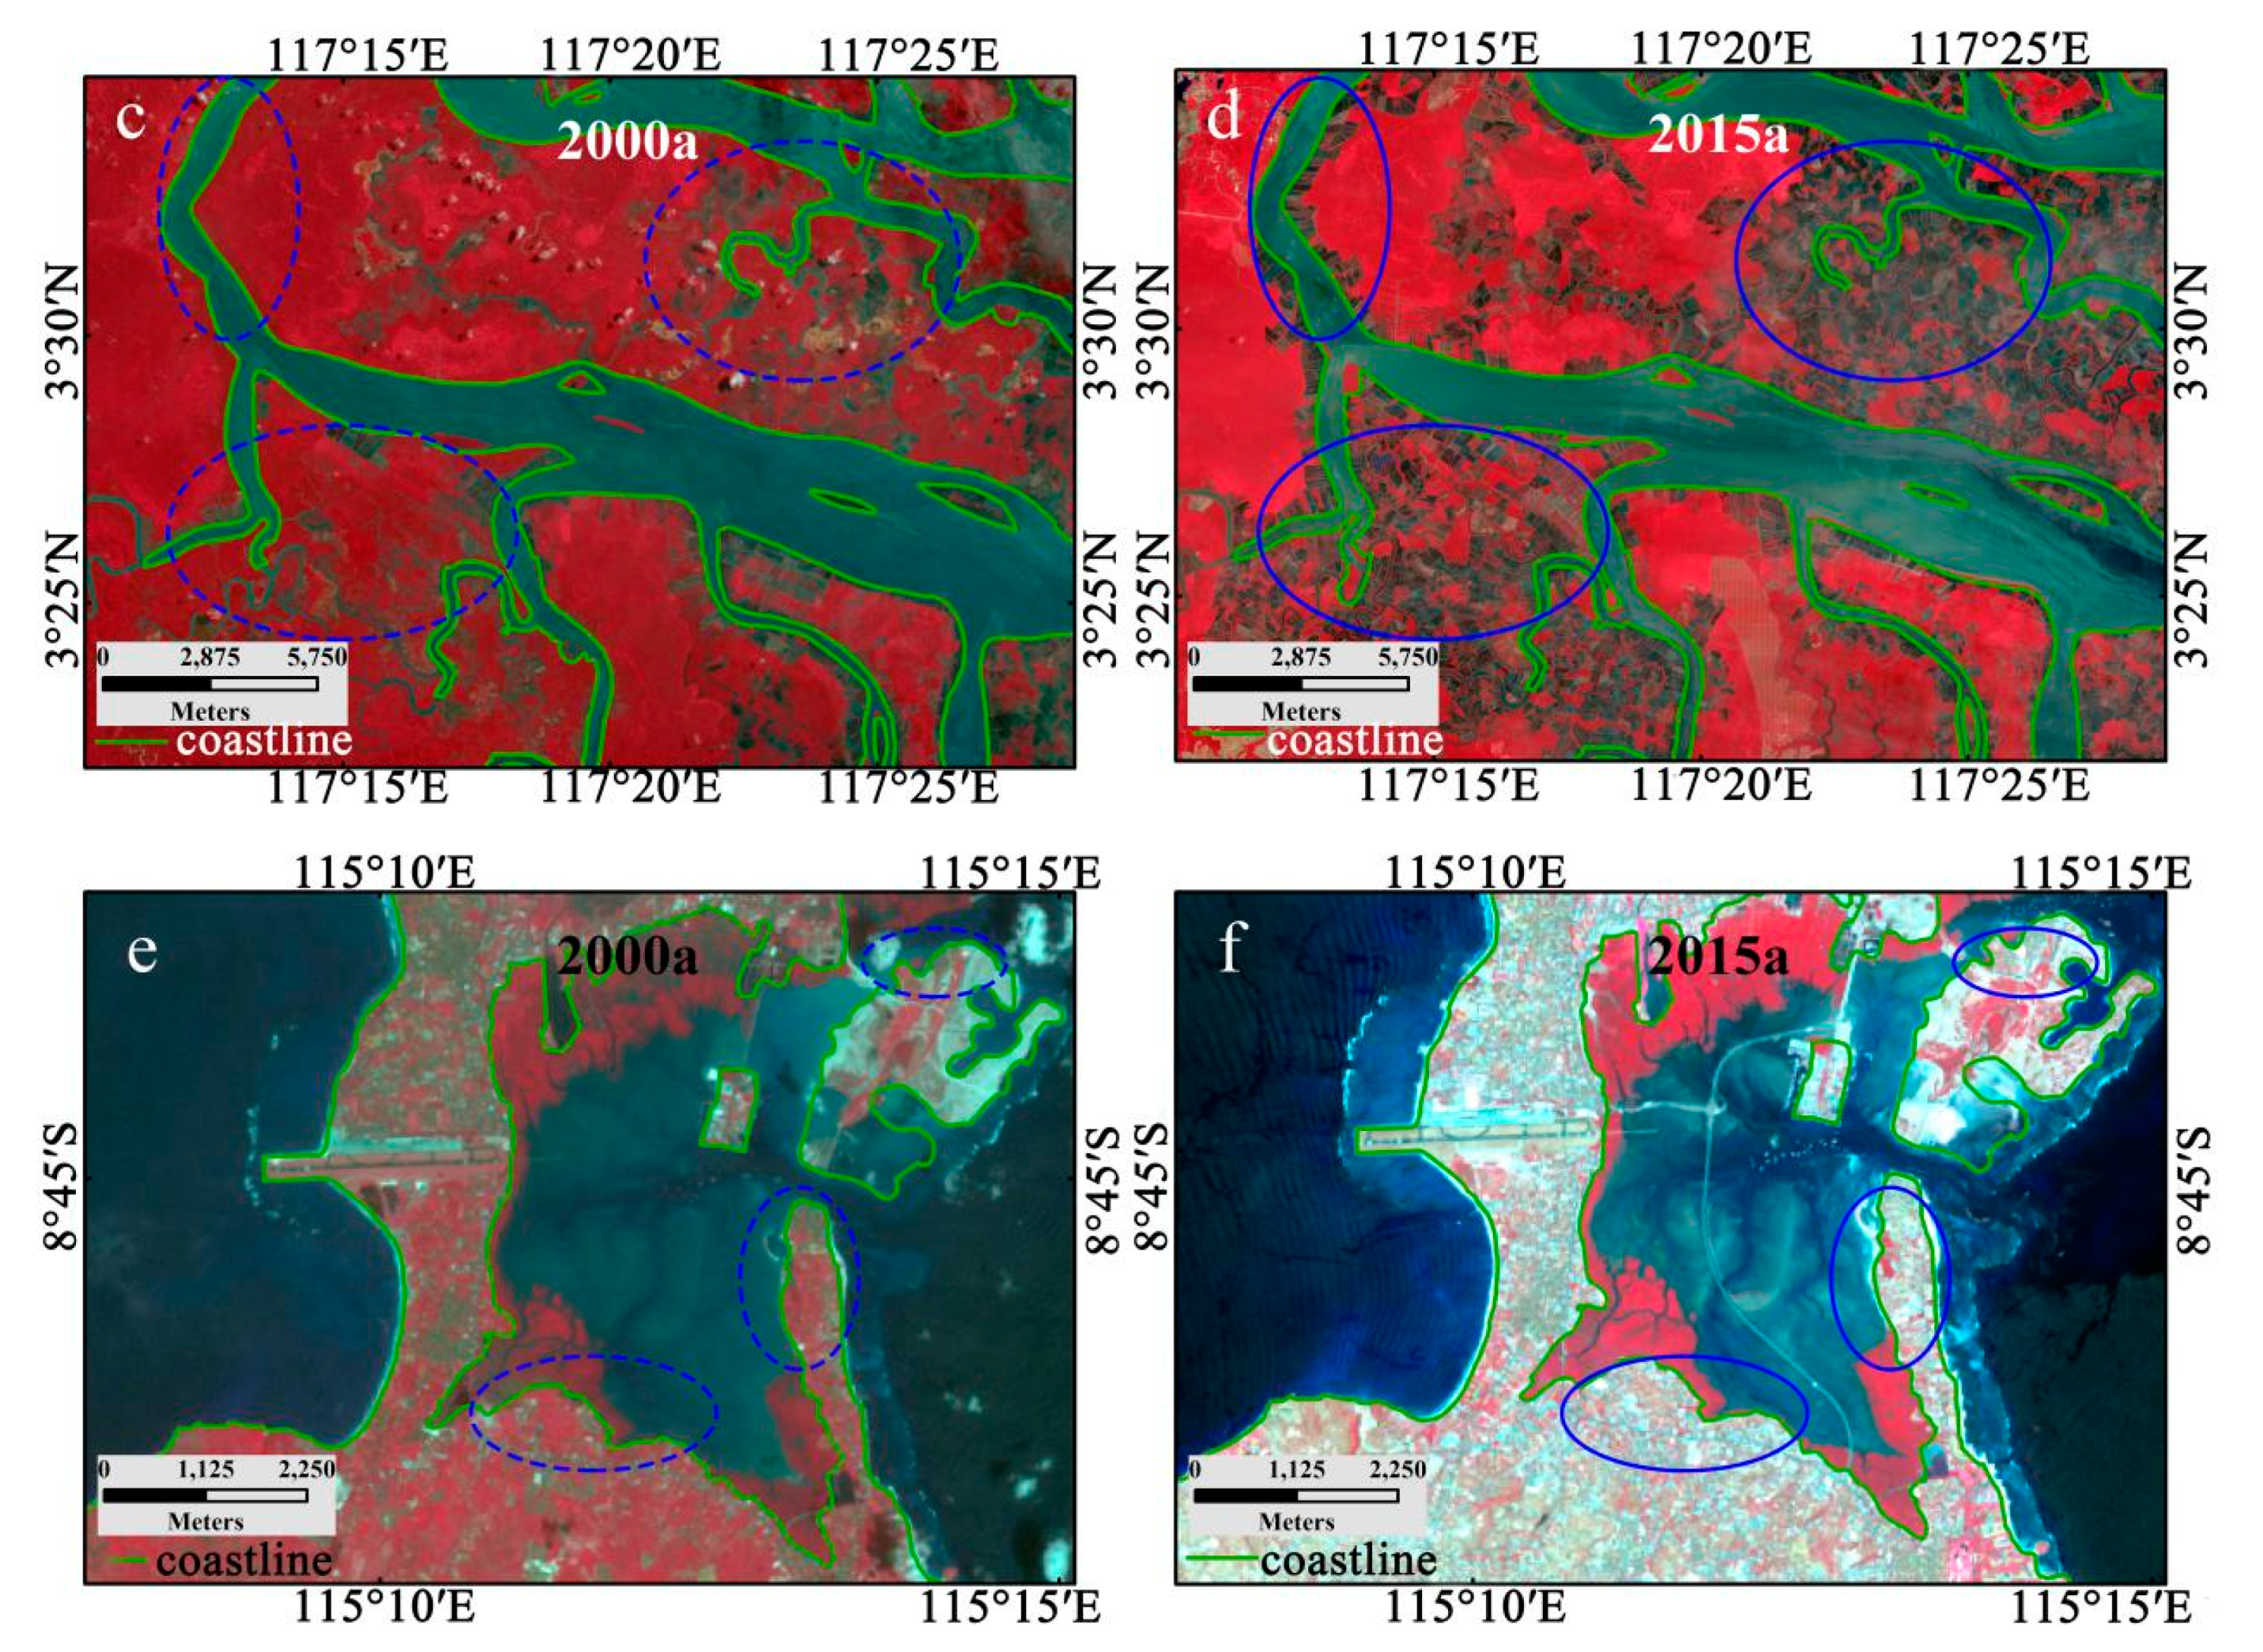
Common incidents included land reclamation, port construction, urban expansion, large-scale deforestation of mangroves and reclamation of coastal wetlands. For instance, significant increases in city areas and harbour coastlines occurred due to the expansion of cities, such as Jayapura, Sorong, and Lobo in New Guinea; large amounts of vegetation along the coasts of Samarinda and Balikpapan in North Kalimantan and East Kalimantan were cleared to develop aquaculture, which resulted in considerable increases in aquaculture dikes. Therefore, we present some remote sensing images from the two years on parts of coasts in Figure 5 to illustrate the traces of human activities.
3.2. Island Morphology Changes
3.2.1. Change in Island Area
A total of 9035 islands were extracted for 2000. Among them, 6734 were less than 1 km2, accounting for approximately 75%; 1519 islands, 1 to 10 km2, accounting for 17%; 782 islands greater than 10 km2, less than 10%; and only 20 islands, more than 10,000 km2. It was therefore inferred that Southeast Asia was still dominated by small islands. In addition, over the past 15 years, 870 islands showed changes in coastline position, concomitantly decreasing by 1453 km2 due to coastline retreat and increasing by 1367 km2 due to coastline expansion. In contrast, 372 islands showed a net increase in area, and 491 islands experienced a net decrease.
The intensities of island area changes are detailed in Table 5. Approximately 38% of the islands changed less than 1%, and approximately 71% of islands changed less than 10%. Concurrently, more islands revealed decreases in area to a considerable degree. However, many islands also varied by more than 50% in area, and 15 islands even more than 100% due to large-scale coastal wetland reclamation activities.
Table 6 indicates that, except for Singapore, the remaining 11 islands were relatively stable. Among them, the areas of 7 islands such as Luzon Island decreased, Sumatra by the most, and the areas of 5 islands such as Mindanao increased, Sulawesi by the most. Furthermore, the intensity of the area change in Singapore was as high as 7.1%, which mainly resulted from the expansion of ports and cities.
3.2.2. Change in Island Shape Index
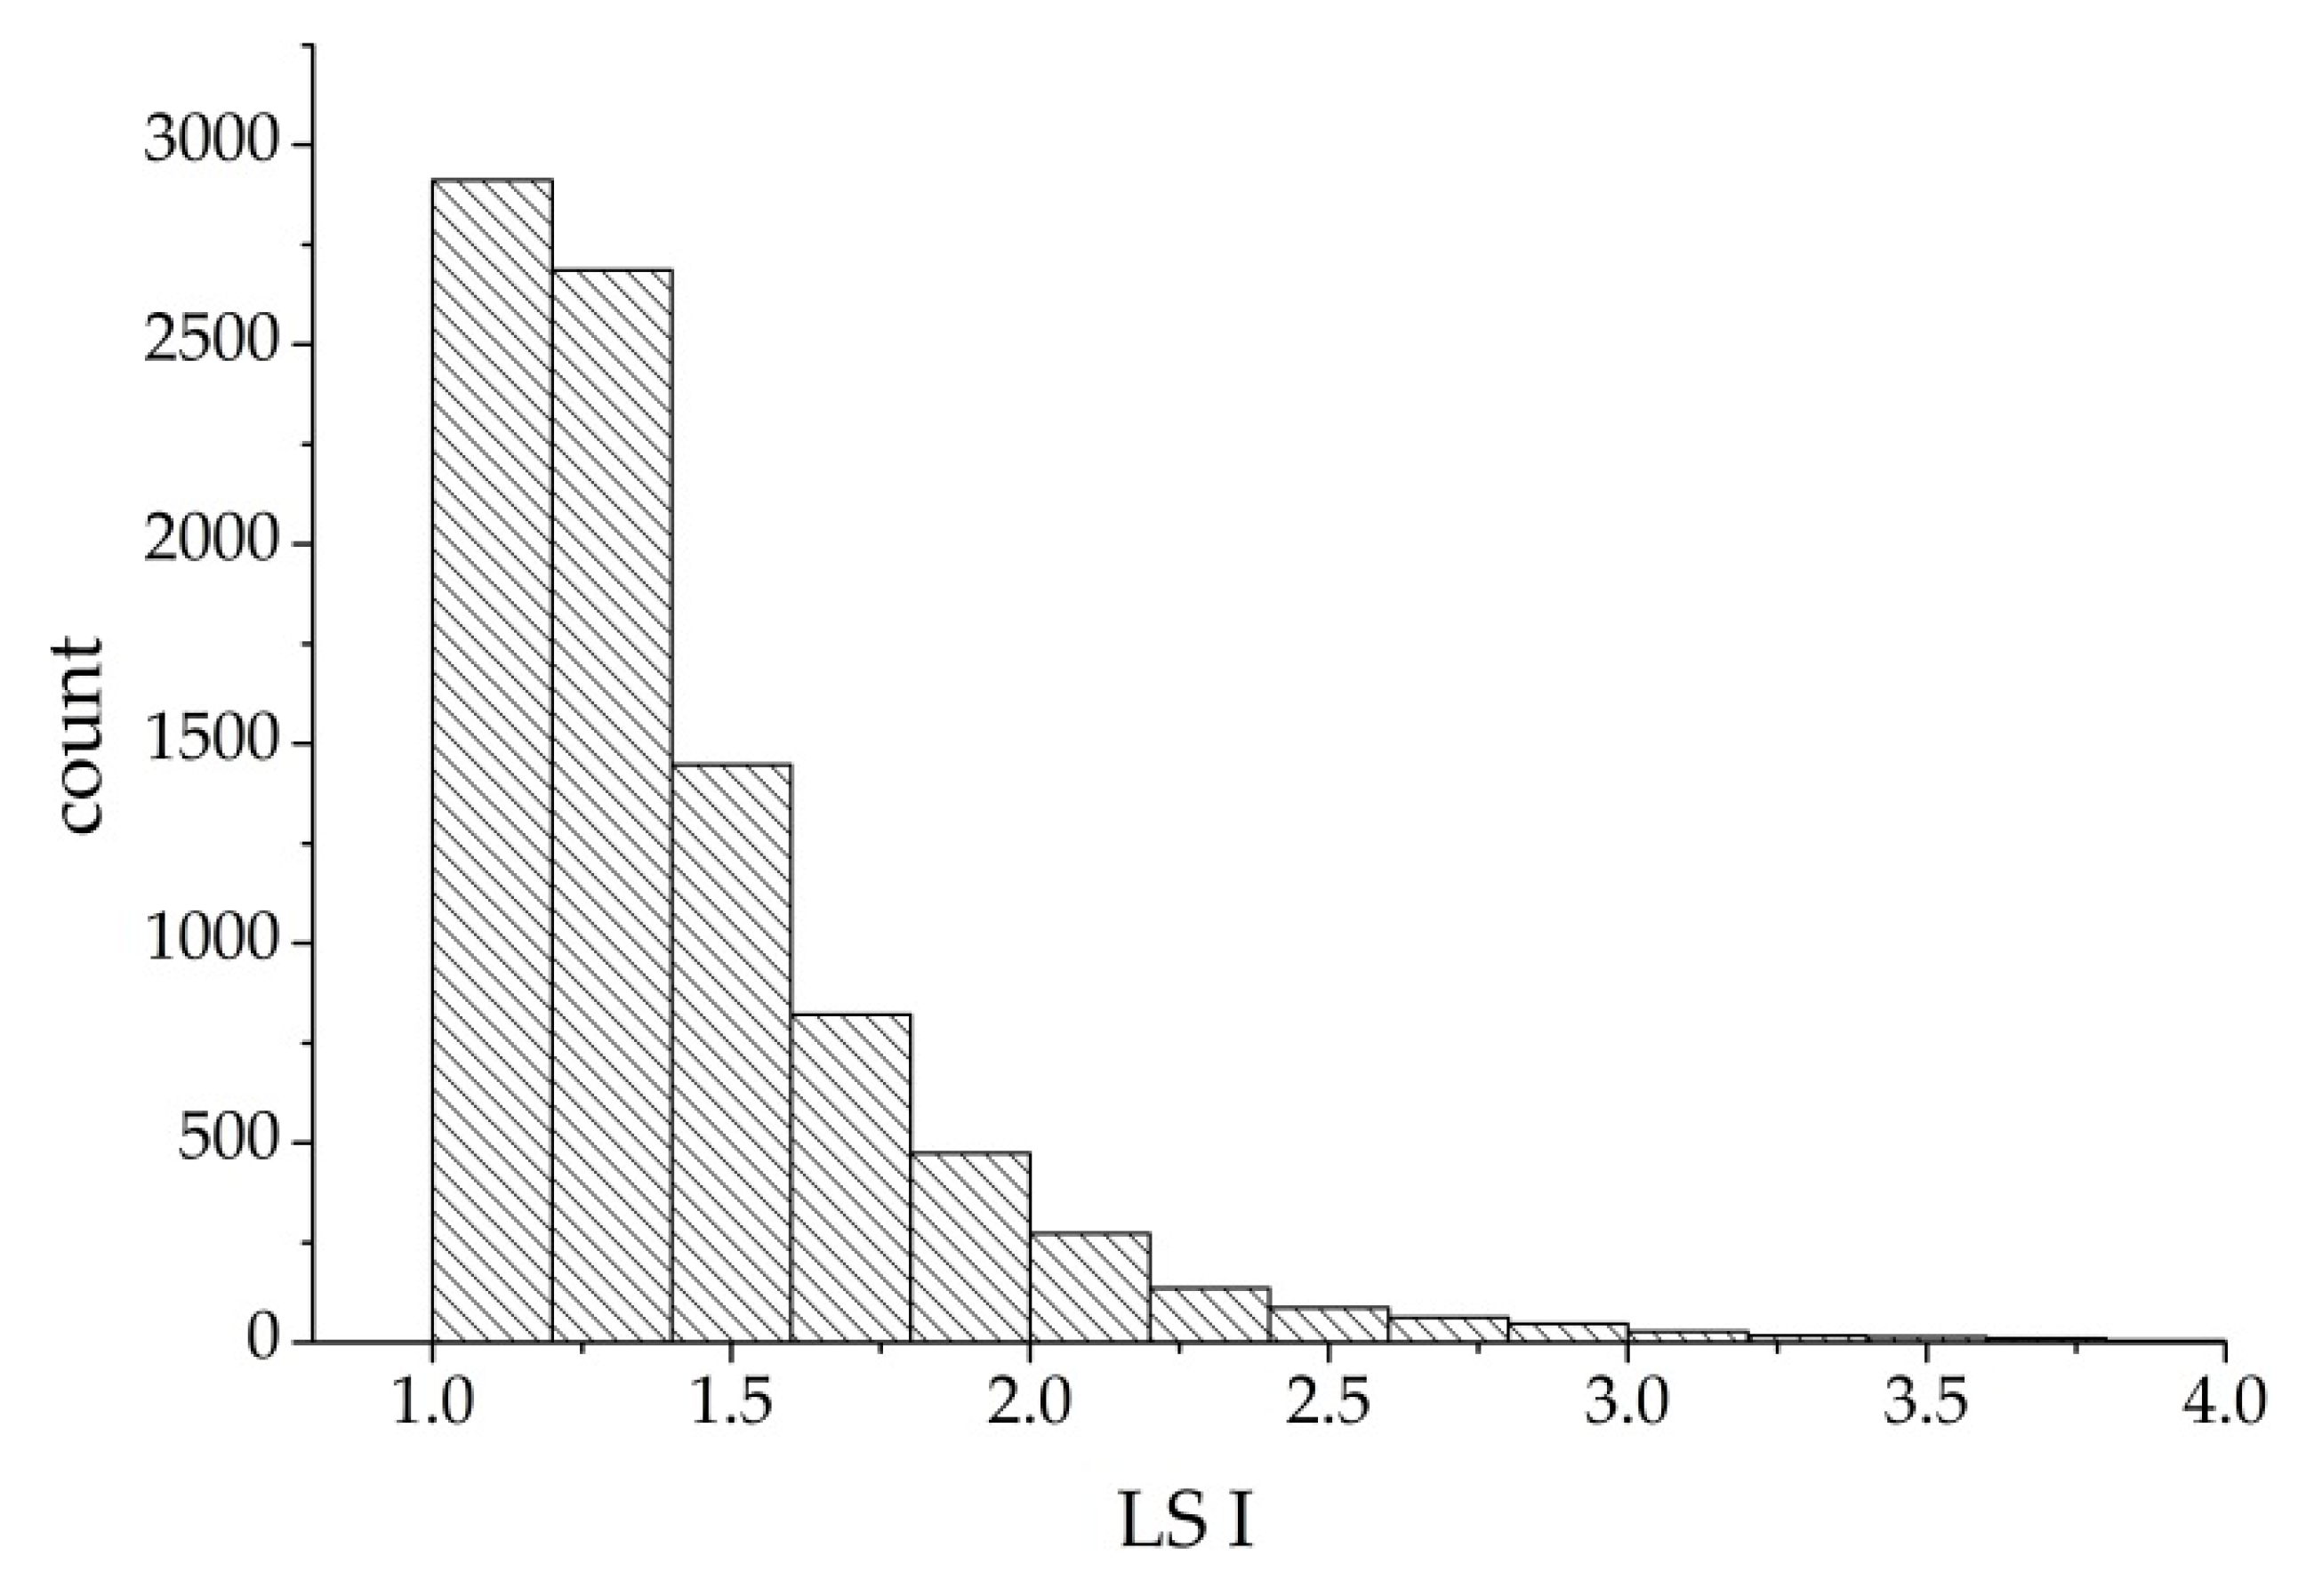
In 2015, the average shape index of more than 9000 islands in Southeast Asia was 1.427, an increase of only 0.01 compared with that in 2000. Figure 6 shows the histogram of the shape indexes for the islands. It can be seen that the island shape indexes were small overall, mainly between 1 and 1.5.
In terms of the shape index of the changed islands, 438 of them increased, and 428 decreased. In addition, while the shape index was calculated on the basis of island size, we found that the shape index presented a decreasing trend with decreasing island area, as detailed in Table 7. Therefore, this index illustrated that the larger the island area was, the more complicated the shape of the island, and that the smaller the island area was, the more regular and the closer to circular the shape of the island.
3.2.3. Change in Island Position
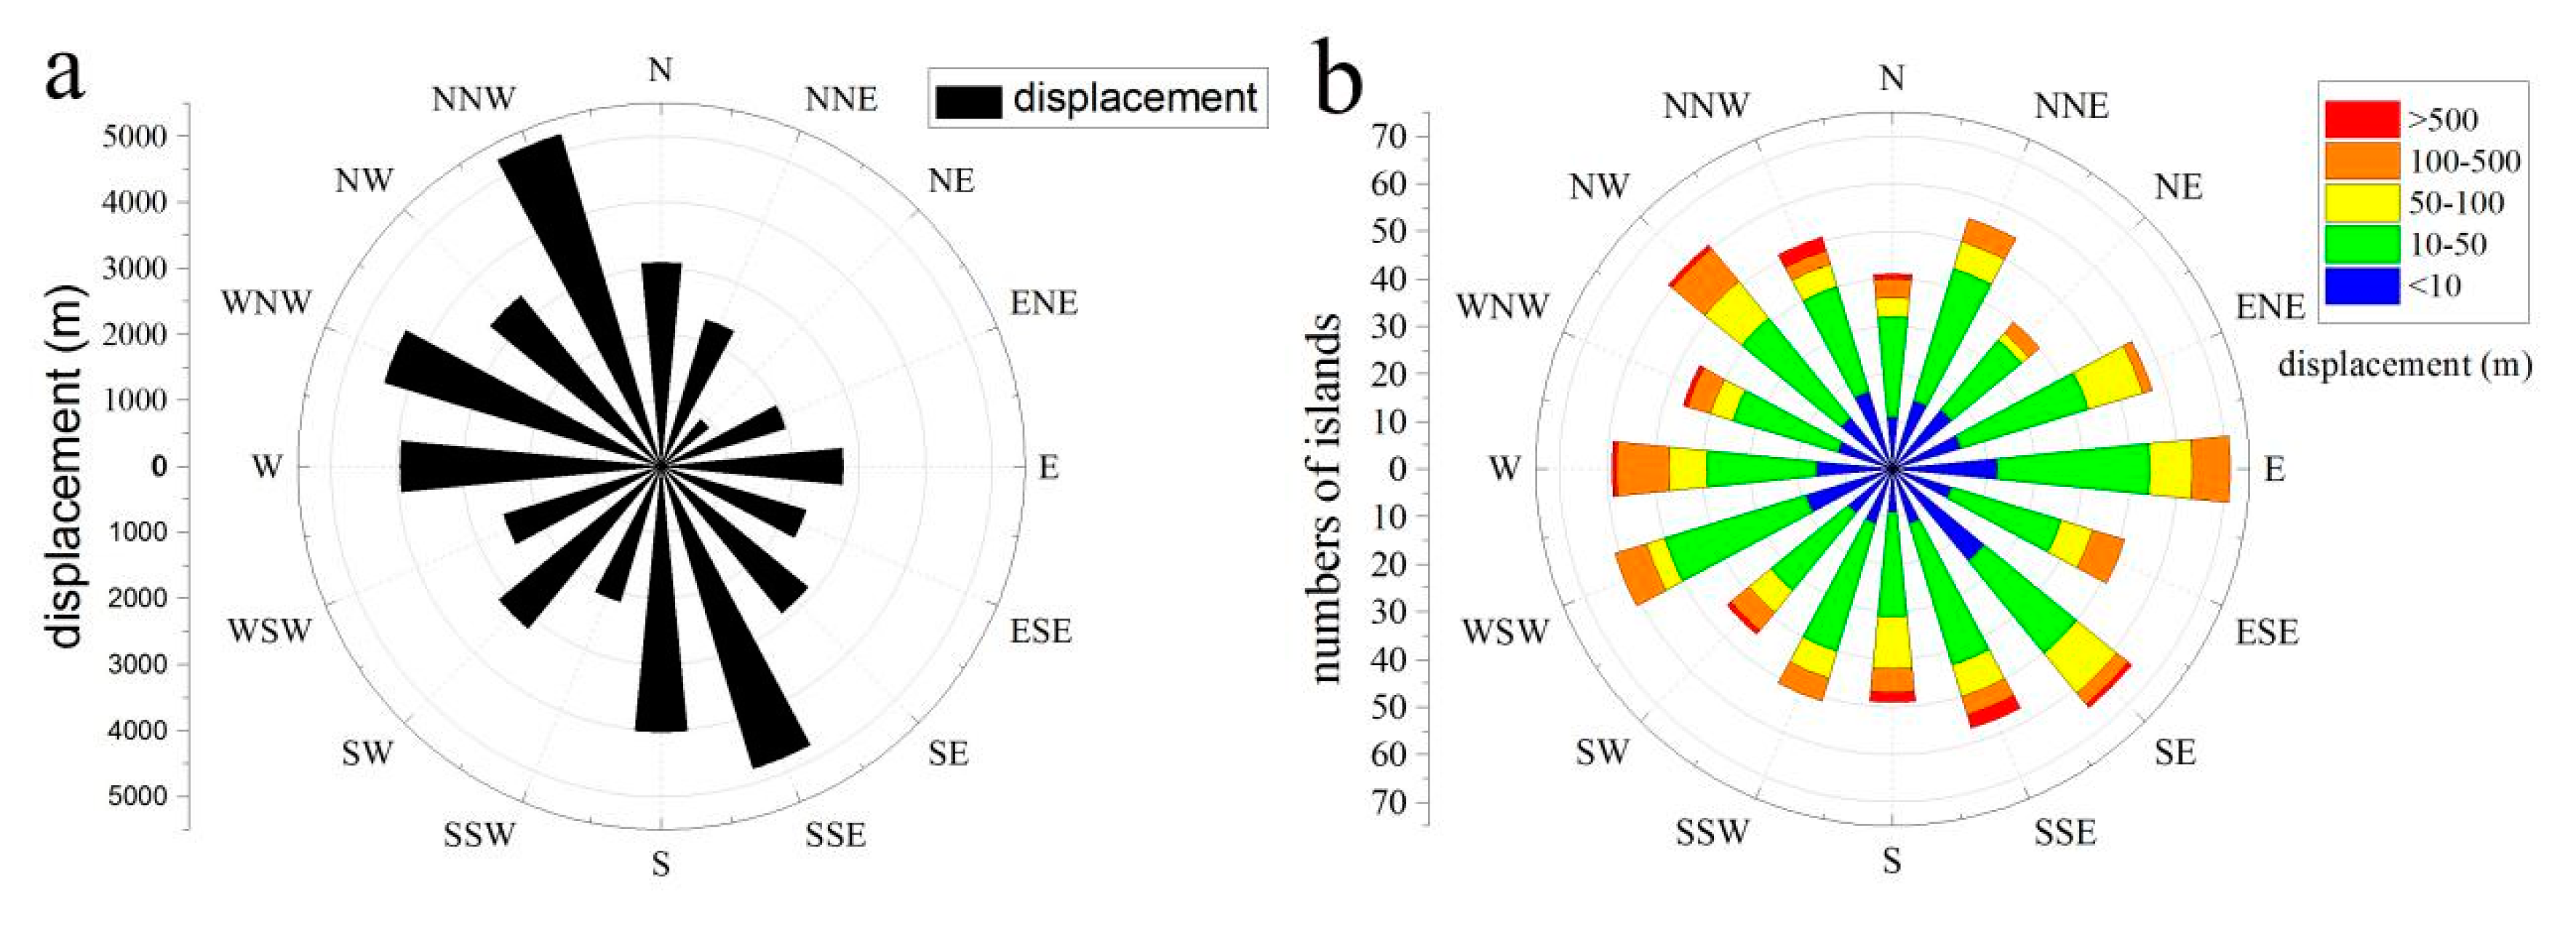
As noted in Section 2.6.3 (3), a rose diagram is shown in Figure 7. In addition, to describe the migration of islands clearly according to the migration distance of the centroid, 10, 50, 100 and 500 m were selected as thresholds, and the displacements were divided into five levels: slight movement, weak movement, moderate movement, strong movement and extremely strong movement.
Over the past 15 years, the cumulative total displacements of the island centroids in Southeast Asia were nearly 50,000 m. There were 647 islands with displacements less than 50 m, accounting for 75% of the changed islands, and the number of islands with displacements between 10 and 50 m was the highest at 407. Additionally, the numbers of islands displaced in the 16 directions varied from 40 to 70. The displacements were homologous in all directions, prevailing even in the E direction. Moreover, the cumulative displacements were considerable in the SSE–S and W–NNW directions. In addition, the displacements of island centroid were related to earthquakes that were triggered by the displacement of tectonic plates. For example, the 2004 tsunami that occurred in Indonesia, which caused a considerable area loss on islands located in the Bay of Bengal, and the island centroids also changed synchronously [59].
The displacements of centroids on the 12 major islands varied greatly, with a range of 5–250 m and a total of 10 directions, as detailed in Table 8. The mass displacements of Sumatra and Singapore were the largest, both exceeding 200 m; correspondingly, Mindanao and Timor Island had the smallest displacements, both less than 10 m.
The literature reveals that sediment transport and large-scale reclamation are bound to result in migrations of island centroids in virtually all cases. Accordingly, six islands had centroid displacements greater than 1000 m in this study, three of which were located in estuaries, and the remaining three islands changed due to large-scale reclamation from human activities.
3.3. Island Land–Sea Pattern Changes
The natural erosion and deposition along coastlines as well as the retreat and expansion caused by human activities necessarily caused regional and overall changes in land–sea patterns. The total lengths of the coastline were 148,508 km and 149,040 km in 2000 and 2015, respectively. There were 16,596 km (11%) of coastlines that changed in location, among which 9291 km (6%) were eroded and 7305 km (5%) were expanded. On the other hand, more than 9035 islands were extracted in this paper, with nearly 10% of them having erosion phenomena and nearly 9% having expansion phenomena.
As expounded in Section 2.6.4, a total of 2901 grids were generated (Figure 8), among which 1499 grids experienced changes, accounting for 52%. In terms of the changed grids, 817 (55%) were eroded and 682 (45%) were expanded. Furthermore, more than 1185 (79%) were stable with absolute values of island area changes within 1 km2; 9% showed micro-erosion or micro-expansion, only 2% indicated strong erosion, and merely 1% underwent strong expansion.
The details in Table 9 illustrate that Sulawesi, Mindanao and Singapore had higher expansion ratios than erosion ratios. Meanwhile, the proportions of eroded coastlines on Samar, Panay, Sumatra, Kalimantan and New Guinea were greater than those of expanded coastlines. The erosion and expansion ratios of the other four islands were similar, varying by no more than 1%. Furthermore, note that the coastlines of Singapore, Java, Kalimantan and Sumatra all varied by far more than 20%. Even more extreme, the coastline of Sumatra changed as much as 43.7%.
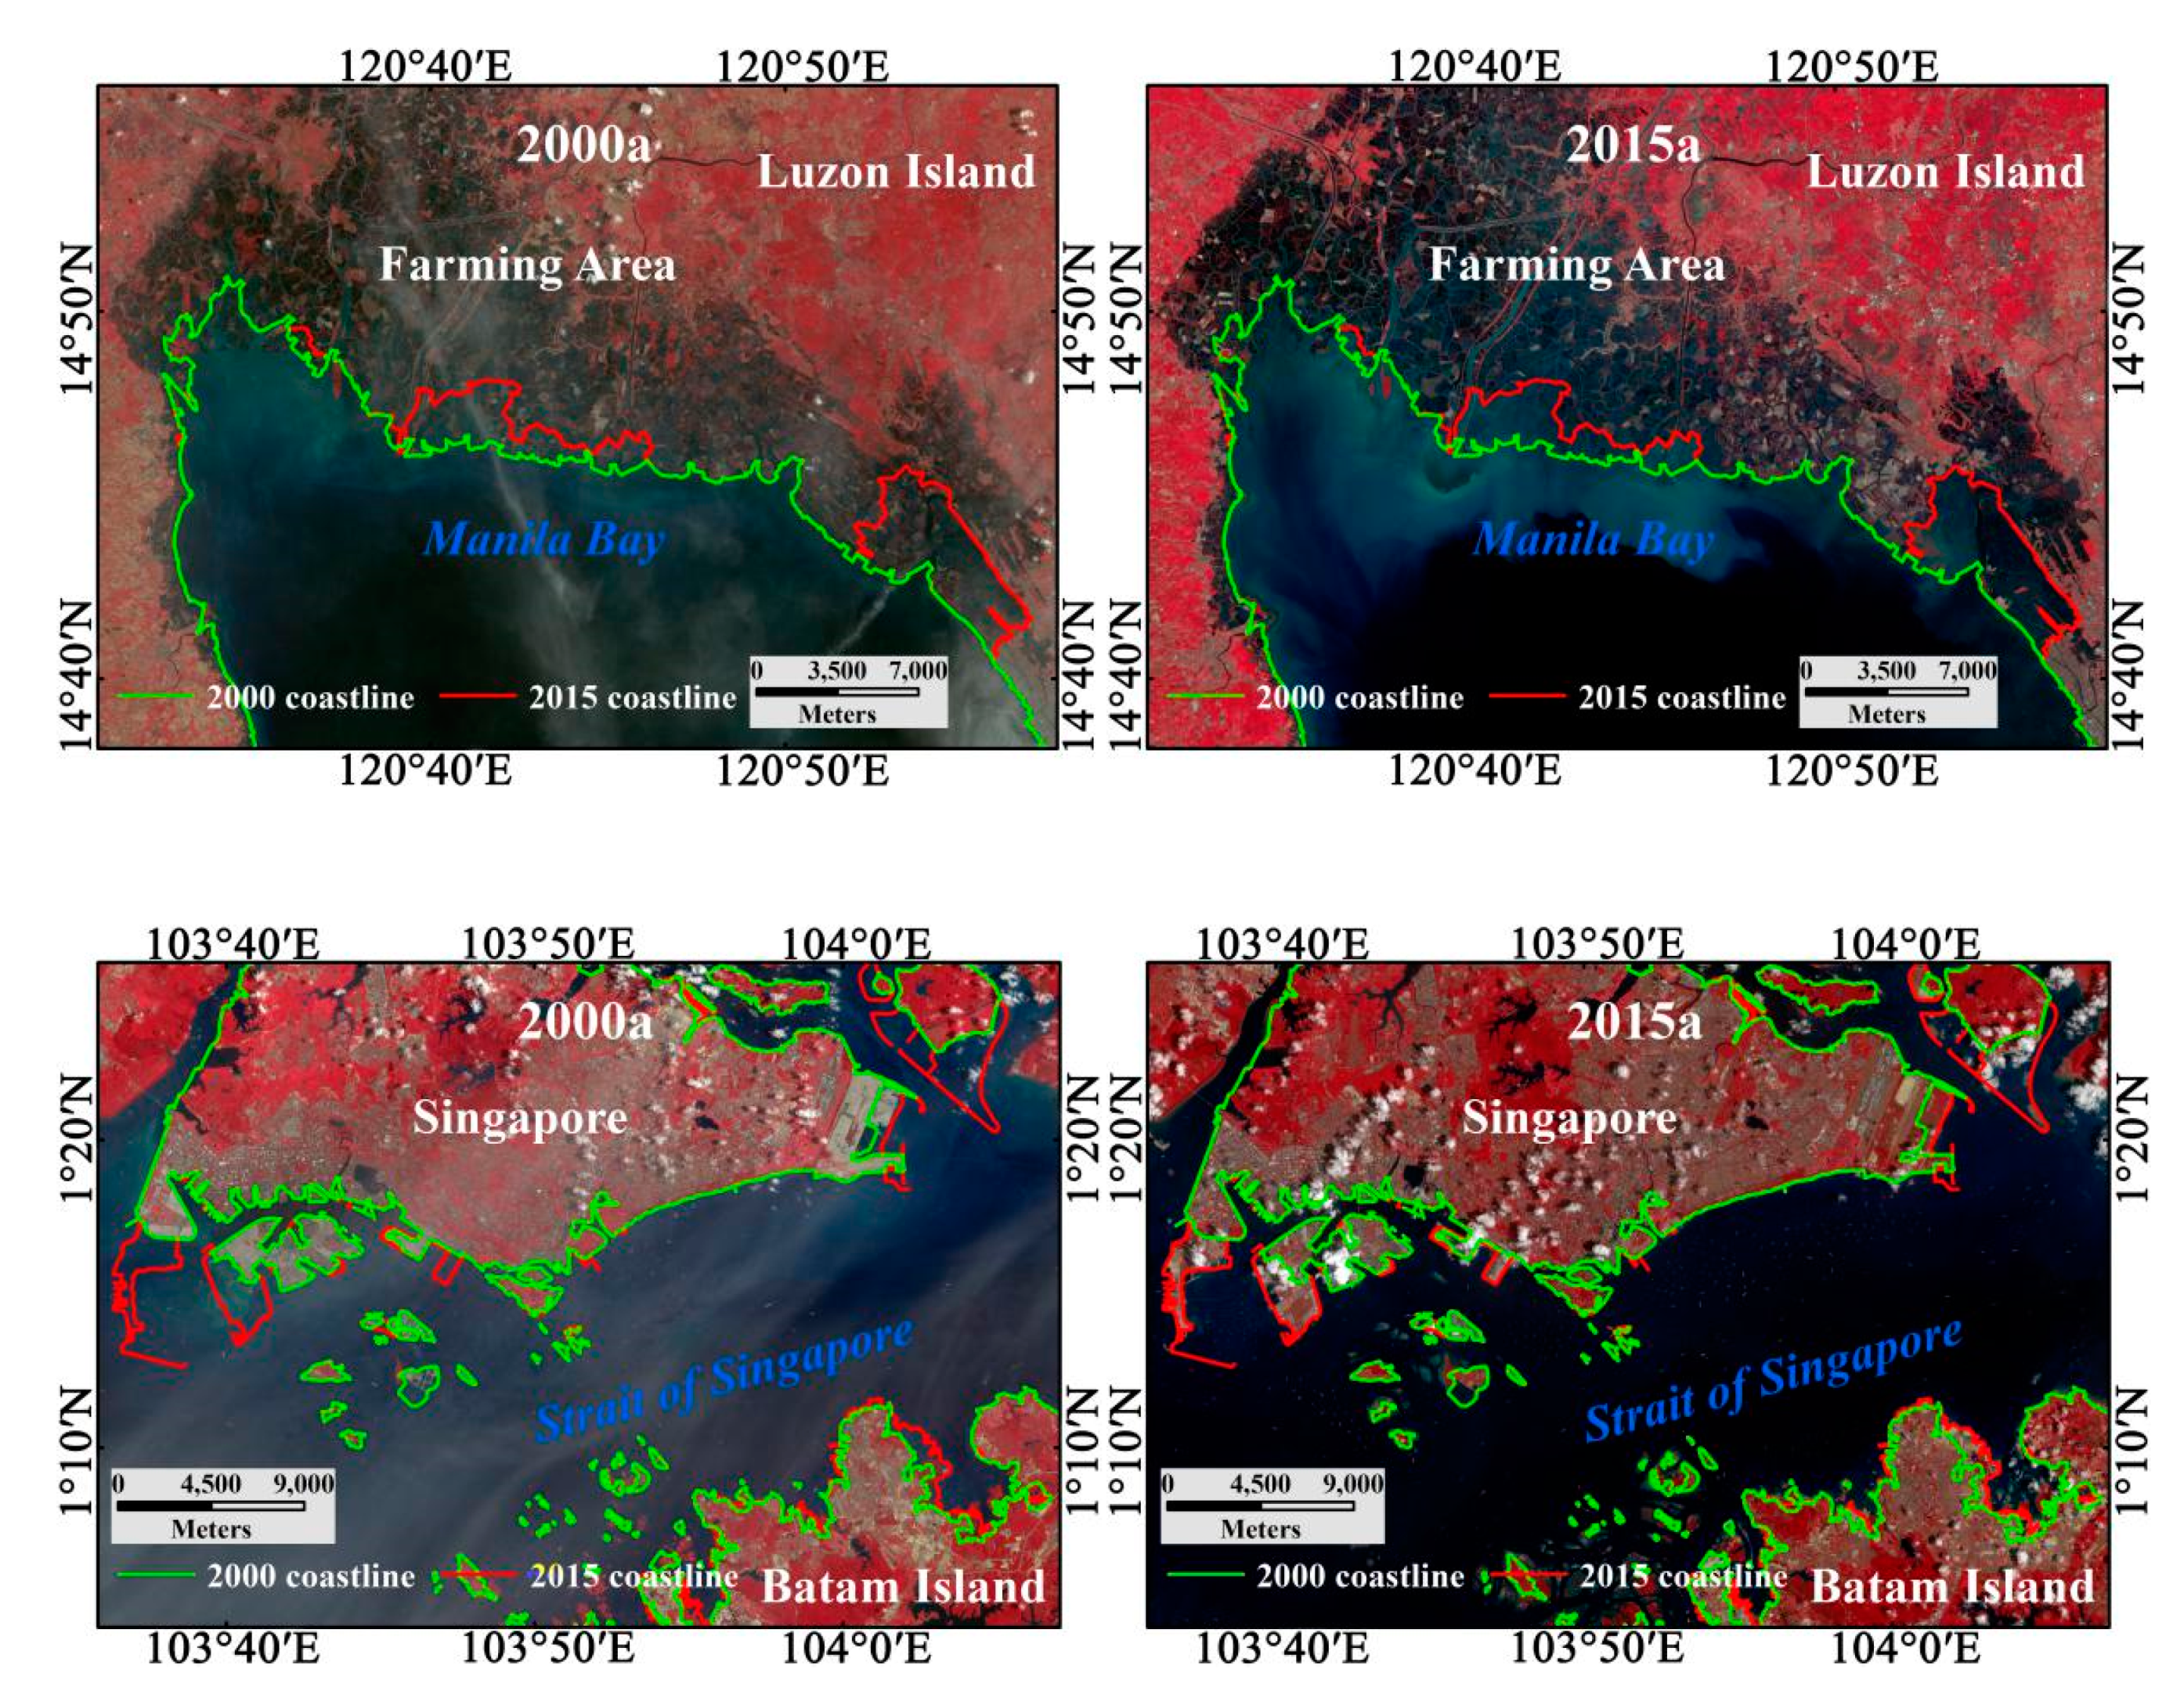
Addressing local changes, a number of hotspots were discovered in this study, such as the Wangari Strait in northeastern Sumatra, the northwestern coast of Java, the coast of East Kalimantan, Pawnee Bay in Sulawesi and Dolac Island. Taking Manila Bay and the Singapore Strait as examples, shown in Figure 9, the erosion area of Manila Bay was as high as 66 km2, and many aquaculture areas were submerged, which was most likely caused by rising sea level. On the other hand, considerable numbers of harbours and other infrastructure were constructed over the past 15 years, which caused expansion areas of nearly 80 km2 on Singapore and Batam Island. Therefore, factors such as seawater intrusion caused by rising sea level, estuarine sediment transport, ecological drivers such as self-adjustment of mangroves and coral reef ecosystems, and large-scale reclamation of coastal wetlands are all generally acknowledged to result in large erosion or expansion of island areas.
4. Discussion
4.1. High Spatial Variability of Coastline Change
Coastline changes, especially on island reefs, have been confirmed to have high spatial variability [12,15,24,60,61], which is mainly attributed to local factors, especially sediment transport, earthquakes and tsunamis, climate variability (i.e., storms and El Niño–Southern Oscillation (ENSO) phases), periodic tides and human activities [62,63]. Additionally, due to the lack of sediment, alongshore sediment transport generally plays an important role in estuary coastline changes. This study provides compelling evidence about the variability of coastline changes over a large spatial scale and with a large sample.
On a large scale, the Indonesian archipelago experienced more significant erosion and expansion than the islands of the Philippines. Meanwhile, great spatial differences also occurred within the archipelagos. For example, considerable expansion phenomena were evident on the western sides of Philippine islands and the northern sides of nearly all Indonesian islands, both towards Eurasia. This effect was produced mainly because Indonesia and the Philippines are both large exporters; thus, the demands of foreign trade and social and economic development inevitably led to the migration of human populations and economically developed regions.
At the single island level, large spatial differences also occurred. For example, the northern coast of Java and the Teluk Bone in Sulawesi experienced more evident expansion, affected by human activities. The eastern coast of Sumatra was heavily eroded, while the western coast was stable. Because extensive low and flat swamps were located on the eastern coast, which was more susceptible to SLR and subsidence; conversely, the western coast was dominated by mountains and hard rocky coasts, which were weakly influenced by SLR. More noteworthy, even on a small atoll or reef island, spatial differences could be discovered. For example, Duvat and Pillet (2017) [64] found that the leeward and windward sides of an atoll experienced differing trends over a long period of time.
4.2. Estuaries: Highlighted Hotspots of Island Coastline Change
Deltas and estuaries are of high ecological and economic value resulting from the services they provide and the large populations and extensive infrastructure they accommodate. However, over the last several decades, unregulated urbanisation, industry, tourism and reclamation have destroyed many near-shore habitats and have deeply modified coastal landscapes and seascapes. As a consequence, deltas and estuaries are among the most severely degraded systems in the world and have become the most vulnerable and sensitive areas in the context of economic development and climate change [65,66,67,68]. Many studies on coastline changes in representative deltas, such as the Nile River delta in Egypt, the Yellow River and Yangtze River deltas in China, and the Mekong River delta in Vietnam [69,70,71,72], have been considered during the past few decades. Analysing the spatio–temporal changes in delta coastlines certainly contributes to understanding how coastlines respond to natural and human activities.
In this paper, the coastline within 3 km of the centre of an estuary was defined as the estuary coastline. Quite remarkably, the proportion of changed estuary coastlines was as high as 40%; moreover, this number might be even higher because the range of impacts caused by estuarine sediment transport was most likely greater than 3 km. On the other hand, in terms of island position, we found 101 islands with migration greater than 100 m, 57 of which were situated in estuaries. Notably, almost all islands with migration greater than 500 m were located in estuaries, especially the islands with the largest migrations located in the Mahakam River mouth on Kalimantan.
4.3. Dynamic Balance of Coastlines
The location of the coastline was highly dynamic due to multiple stresses, including land, sea and air processes. However, it generally expressed dynamic equilibrium in the natural state, while human activities could upset this balance and cause widespread erosion or expansion on a certain coast (e.g., cutting down mangroves and reclaiming land).
This paper revealed two implications of equilibrium. First, in the model of coexistence between erosion and deposition, part of a coast would be eroded due to loss of sediment during scouring by tides and waves, and concurrently, the coast in another location would usually receive deposits due to the influx of sediments transported by alongshore hydrodynamics. On the other hand, previous evidence suggested that erosion and deposition on the same coast could be reversible at certain periods of time, mainly attributed to seasonal wave conditions, and such a coast was therefore also understood to be in dynamic balance. Second, self-balancing coastal ecosystems such as mangroves and coral reefs, especially those with native plants, exhibit strong resistance during and rapid renewal after tropical cyclones, which tended to weaken storm erosion on coasts and lead to balance [16,63]. In contrast, while a tropical cyclone could produce a large area of coastal retreat, it would also deposit sediments on the island [64,73]; thus, the coastline would be restored to its pre-storm position in a few years. Therefore, we also called the self-recovery of coastlines a dynamic balance.
4.4. Typological Characteristics of Coastline Change
The morphology and geomorphology of coasts generally played considerable roles in coastline changes [59,74]; for example, hard rocky shores were more stable than soft muddy and biological shores. Therefore, we counted different coastal types of coastline changes to explore the impacts of diverse types on coastlines and distinguish the influences between natural factors and human activities (Table 10 and Table 11).
Two main points are illustrated in Table 10. First, biogenic coastlines were more unstable and accounted for a larger proportion than the other three types of coastlines, whether in erosion or deposition. Several reasons explain this observation. (1) Southeast Asia mainly has a tropical rainforest climate, with widely distributed tropical rainforests and coral reefs, which resulted in a large proportion of biological coasts. (2) The biological coasts were mainly distributed in low-lying and flat areas, most of which were less than 1 m above sea level, so they were more susceptible to natural processes such as SLR, storm surges and wave action. (3) The biological coasts were mainly composed of tropical plants, such as mangroves and coral reefs, then the self-growth and extinction of these plants generally led to significant migration of coastline positions. (4) Large-scale forest fires and human deforestation along the shore also caused considerable changes in biological coastlines. Second, compared with the retreating coastlines, sandy and muddy coasts increased in proportion along expanded coastlines. This feature illustrated that human activities were mainly concentrated on sandy and muddy coasts. This effect might have occurred because these two types of coasts were more stable and easier to develop than biological coasts and thus more suitable for human life. Sandy beaches were more suitable for the development of the tourism sector.
Two main points are also presented in Table 11. First, most of the changed coastlines were still natural and lacked interference by human activities, whether retreating or expanding. This phenomenon further illustrated that the influences of natural processes on coastline changes were more extensive than those of human activities. Second, more harbours and urban coasts emerged after the coastlines expanded, which similarly demonstrated that human activities such as port economies, foreign trade and coastal urbanisation had strong correlations with coastline expansion.
4.5. Hierarchical Characteristics of Island Coastline Change
Duvat (2019) demonstrated that island behaviour correlated with island size through statistics and analysis of more than 30 atolls, including 709 reef islands in the Pacific Ocean and the Indian Ocean [15]. Specifically, the smaller the islands, the more significant the changes the areas experienced and the more prone they were to erosion. He also considered the 10-ha threshold relevant to defining atoll island areal stability. Large sample datasets were essential to deduce these results. In this paper, similar deductions were inferred by analysing the area changes on islands less than 100 ha.
The rates of area change for nearly 300 islands less than 100 ha were counted, as detailed in Table 12. A considerable trend revealed that as islands decreased in size, the rates of island area change increased; specifically, an increase in island area was more common than a decrease on small islands. To illustrate, the erosion rate was 29%, and the expansion rate was 39% for islands less than 5 ha. Comparing our results with those mentioned above from Duvat (2019), the difference is that a decrease in island area was more common than an increase on small islands in his study. The difference between the objects seems to be the main reason for the distinction. The objects in this paper included not only reef islands but also volcanic and alluvial islands. Therefore, the landforms and morphology of the islands also played significant roles in island changes.
This work is not without limitations; hence, a number of improvements to this study are necessary in future works. First, there are only two years of coastline data in this paper. Some coastline changes may be neglected, magnified or diminished during a single time interval due to the dynamic characteristics of coastlines. In addition, short-term investigations do not exhaustively treat the characteristics of coastline changes in great details. Second, coastline changes are the result of land–sea interactions involving natural and human processes; therefore, more elements and related data can be combined with coastline changes to address the causes and influences of such changes.
5. Conclusions
Based on remote sensing images from 2000 and 2015 and GIS techniques, a coastline database of islands in Southeast Asia including approximately 9035 islands was established. The lengths and structures of coastlines, island forms (shapes, areas and positions) and land–sea patterns all showed dramatic changes on overall, regional and local scales because of the complex processes and interactions operating from natural factors (precipitation, monsoons, topography, hydrodynamics, sea level rise, etc.) and human activities (reclamation, dam building, deforestation, migration of populations, urbanisation, etc.). Approximately 1.6 × 10³ km (11%: 5% deposition and 6% retreat) of coastlines changed in location, involving 870 islands, resulting in net reductions of nearly 86 km2 in area and 50,000 km in centroid displacement. Additionally, the coastline length increased by 532 km from 2000 (148,508 km) to 2015 (149,040 km). Natural coastlines decreased by 2503 km, while artificial coastlines increased by 3035 km. Note that natural processes were still the most considerable long-term elements in coastline evolution in most areas of Southeast Asia, but human activities generally caused more conspicuous and pronounced changes in the region. In addition, similar to the results of previous studies, the substrates and landforms of the coast usually played more crucial roles than sea level rise in coastline changes.
The main conclusions of this study are important in the context of climate change and economic development that present serious threats to the future of islands. First, we have mastered the spatial and temporal characteristics of coastlines in Southeast Asian islands from 2000 to 2015 on a large spatial scale. Second, our data are a considerable supplement to the coastlines for Southeast Asia and can be a first step towards improved coastal management. Based on these observations, future work should focus on further supplementing the data (coastline data, climatic and topographic data, economic and population data, etc.) and exploring the driving factors of coastline changes and their impacts on the ecological environment.
Author Contributions
Conceptualization, Y.Z. and X.H.; methodology, Y.Z. and X.H.; software and formal analysis, Y.Z.; validation and outcome investigation, Y.Z.; writing–original draft preparation, Y.Z.; writing–review and editing, Y.Z. and X.H.; supervision, X.H.; project administration, X.H.; funding acquisition, X.H. All authors have read and agree to the published version of the manuscript.
Funding
This work was supported by the Strategic Priority Research Program of the Chinese Academy of Sciences, Grant No. XDA19060205, and the Self–deployment Project of the Yantai Institute of Coastal Zone Research, Chinese Academy of Sciences, Grant No. YICY755011031.
Acknowledgments
We would like to express thanks for the constructive comments from the editor and anonymous referees.
Conflicts of Interest
The authors declare no conflicts of interest.
References
- Mujabar, P.S.; Chandrasekar, N. Shoreline change analysis along the coast between Kanyakumari and Tuticorin of India using remote sensing and GIS. Arab. J. Geosci. 2013, 6, 647–664. [Google Scholar] [CrossRef]
- Bulleri, F.; Chapman, M.G. The introduction of coastal infrastructure as a driver of change in marine environments. J. Appl. Ecol. 2010, 47, 26–35. [Google Scholar] [CrossRef]
- Hein, C.J.; Fitzgerald, D.M.; Cleary, W.J.; Albernaz, M.B.; de Menezes, J.T.; Klein, A.H.D. Evidence for a transgressive barrier within a regressive strandplain system: Implications for complex coastal response to environmental change. Sedimentology 2013, 60, 469–502. [Google Scholar] [CrossRef]
- Tian, B.; Wu, W.T.; Yang, Z.Q.; Zhou, Y.X. Drivers, trends, and potential impacts of long-term coastal reclamation in China from 1985 to 2010. Estuar. Coast. Shelf Sci. 2016, 170, 83–90. [Google Scholar] [CrossRef]
- Diaz, R.J.; Rosenberg, R. Spreading dead zones and consequences for marine ecosystems. Science 2008, 321, 926–929. [Google Scholar] [CrossRef] [PubMed]
- Halpern, B.S.; Walbridge, S.; Selkoe, K.A.; Kappel, C.V.; Micheli, F.; D’Agrosa, C.; Bruno, J.F.; Casey, K.S.; et al. A global map of human impact on marine ecosystems. Science 2008, 319, 948–952. [Google Scholar] [CrossRef] [Green Version]
- Nicholls, R.J.; Cazenave, A. Sea-level rise and its impact on coastal zones. Science 2010, 328, 1517–1520. [Google Scholar] [CrossRef]
- Quataert, E.; Storlazzi, C.; van Rooijen, A.; Cheriton, O.; van Dongeren, A. The influence of coral reefs and climate change on wave-driven flooding of tropical coastlines. Geophys. Res. Lett. 2015, 42, 6407–6415. [Google Scholar] [CrossRef]
- Storlazzi, C.D.; Gingerich, S.B.; van Dongeren, A.; Cheriton, O.M.; Swarzenski, P.W.; Quataert, E.; Voss, C.I.; Field, D.W.; et al. Most atolls will be uninhabitable by the mid-21st century because of sea-level rise exacerbating wave-driven flooding. Sci. Adv. 2018, 4, eaap9741. [Google Scholar] [CrossRef] [Green Version]
- Giardino, A.; Nederhoff, K.; Vousdoukas, M. Coastal hazard risk assessment for small islands: Assessing the impact of climate change and disaster reduction measures on Ebeye (Marshall Islands). Environ. Chang. 2018, 18, 2237–2248. [Google Scholar] [CrossRef] [Green Version]
- Anderson, T.R.; Fletcher, C.H.; Barbee, M.M.; Frazer, L.N.; Romine, B.M. Doubling of coastal erosion under rising sea level by mid-century in Hawaii. Nat. Hazards. 2015, 78, 75–103. [Google Scholar] [CrossRef]
- Mclean, R.; Kench, P. Destruction or persistence of coral atoll islands in the face of 20th and 21st century sea-level rise? Wiley Interdiscip. Rev. Clim. Chang. 2015, 6, 445–463. [Google Scholar] [CrossRef]
- Nandi, S.; Ghosh, M.; Kundu, A.; Dutta, D.; Baksi, M. Shoreline shifting and its prediction using remote sensing and GIS techniques: A case study of Sagar Island, west Bengal (India). J. Coast. Conserv. 2016, 20, 61–80. [Google Scholar] [CrossRef]
- Romine, B.M.; Fletcher, C.H. A summary of historical shoreline changes on beaches of Kauai, Oahu, and Maui, Hawaii. J. Coast. Res. 2013, 288, 605–614. [Google Scholar] [CrossRef]
- Ford, M.R.; Kench, P.S. Multi-decadal shoreline changes in response to sea level rise in the marshall islands. Anthropocene 2015, 11, 14–24. [Google Scholar] [CrossRef] [Green Version]
- Duvat, V.K.E. A global assessment of atoll island planform changes over the past decades. Wiley Interdiscip. Rev. Clim. Chang. 2019, 10, 1–16. [Google Scholar] [CrossRef] [Green Version]
- Krien, Y.; Dudon, B.; Roger, J.; Arnaud, G.; Zahibo, N. Assessing storm surge hazard and impact of sea level rise in the Lesser Antilles case study of Martinique. Nat. Hazards Earth Syst. Sci. 2017, 17, 1559–1571. [Google Scholar] [CrossRef] [Green Version]
- Kench, P.S.; Thompson, D.; Ford, M.R.; Ogawa, H.; McLean, R.F. Coral islands defy sea-level rise over the past century: Records from a central Pacific atoll. Geology 2015, 43, 515–518. [Google Scholar] [CrossRef]
- Nguyen, H.H.; Mcalpine, C.; Pullar, D.; Leisz, S.J.; Galina, G. Drivers of coastal shoreline change: Case study of Hon Dat Coast, Kien Giang, Vietnam. Environ. Manag. 2015, 55, 1093–1108. [Google Scholar] [CrossRef]
- Connell, J. Losing ground? Tuvalu, the greenhouse effect and the garbage can. Asia Pac. Viewp. 2003, 44, 89–106. [Google Scholar] [CrossRef]
- Dickinson, W.R. Pacific atoll living: How long already and until when? GSA Today 2009, 19, 124–132. [Google Scholar] [CrossRef] [Green Version]
- Webb, A.P.; Kench, P.S. The dynamic response of reef islands to sea-level rise: Evidence from multi-decadal analysis of island change in the Central Pacific. Glob. Planet. Chang. 2010, 72, 234–246. [Google Scholar] [CrossRef]
- Woodroffe, C.D. Reef-island topography and the vulnerability of atolls to sea-level rise. Glob. Planet. Chang. 2008, 62, 0–96. [Google Scholar] [CrossRef]
- Rankey, E.C. Nature and stability of atoll island shorelines: Gilbert Island chain, Kiribati, equatorial Pacific. Sedimentology 2011, 58, 1831–1859. [Google Scholar] [CrossRef]
- Mimura, N. Vulnerability of island countries in the South Pacific to sea level rise and climate change. Clim. Res. 1999, 12, 137–143. [Google Scholar] [CrossRef]
- Luijendijk, A.; Hagenaars, G.; Ranasinghe, R.; Baart, F.; Donchyts, G.; Aarninkhof, S. The State of the World’s Beaches. Sci. Rep. 2018, 8, 6641. [Google Scholar] [CrossRef]
- As-Syakur, A.R.; Tanaka, T.; Osawa, T.; Mahendra, M.S. Indonesian rainfall variability observation using TRMM multi-satellite data. Int. J. Remote Sens. 2013, 34, 7723–7738. [Google Scholar] [CrossRef]
- Pirazzoli, P.A.; Montaggioni, L.F.; Saliege, J.F.; Segonzac, G.; Thommeret, Y.; Vergnaud-Grazzini, C. Crustal block movements from Holocene shorelines: Rhodes island (Greece). Tectonophysics 1989, 170, 89–114. [Google Scholar] [CrossRef]
- Sato, T.; Higuchi, H.; Miyauchi, T.; Endo, K.; Tsumura, N.; Ito, T.; Noda, A.; Matsu’ura, M. The source model and recurrence interval of Genroku-type Kanto earthquakes estimated from paleo-shoreline data. Earth Planets Space. 2016, 68, 17. [Google Scholar] [CrossRef] [Green Version]
- Small, C.; Nicholls, R.J. A global analysis of human settlement in coastal zones. J. Coast. Res. 2003, 19, 584–599. [Google Scholar]
- Hinkel, J.; Nicholls, R.J.; Tol, R.S.J.; Wang, Z.B.; Hamilton, J.M.; Boot, G.; Vafeidis, A.T.; McFadden, L.; Ganopolski, A.; Klein, R.J.T. A global analysis of erosion of sandy beaches and sea-level rise: An application of diva. Glob. Planet. Chang. 2013, 111, 150–158. [Google Scholar] [CrossRef]
- Hallegate, S.; Green, C.; Nicholls, R.J.; Corfee-Morlot, J. Future flood losses in major coastal cities. Nat. Clim. Chang. 2013, 3, 802–806. [Google Scholar] [CrossRef]
- Tamura, T.; Saito, Y.; Bateman, M.D.; Nguyen, V.L.; Ta, T.K.O.; Matsumoto, D. Luminescence dating of beach ridges for characterizing multi-decadal to centennial deltaic shoreline changes during late Holocene, Mekong river delta. Mar. Geol. 2012, 326, 140–153. [Google Scholar] [CrossRef]
- Kundu, S.; Mondal, A.; Khare, D.; Mishra, P.K.; Shukla, R. Shifting shoreline of Sagar island delta, India. J. Maps. 2014, 10, 612–619. [Google Scholar] [CrossRef] [Green Version]
- Besset, M.; Anthony, E.J.; Bouchette, F. Multi-decadal variations in delta shorelines and their relationship to river sediment supply: An assessment and review. Earth Sci. Rev. 2019, 193, 199–219. [Google Scholar] [CrossRef] [Green Version]
- Li, X.; Liu, J.P.; Saito, Y.; Nguyen, V.L. Recent evolution of the Mekong Delta and the impacts of dams. Earth Sci. Rev. 2017, 175, 1–17. [Google Scholar] [CrossRef]
- Lai, S.; Loke, L.H.L.; Hilton, M.J.; Bouma, T.J.; Todd, P.A. The effects of urbanisation on coastal habitats and the potential for ecological engineering: A Singapore case study. Ocean. Coast. Manag. 2015, 103, 78–85. [Google Scholar] [CrossRef]
- Athanasiou, P.; van Dongeren, A.; Giardino, A.; Vousdoukas, M.; Gaytan-Aguilar, S.; Ranasinghe, R. Global distribution of nearshore slopes with implications for coastal retreat. Earth Syst. Sci. Data 2019, 11, 1515–1529. [Google Scholar] [CrossRef] [Green Version]
- Pardo-Pascual, J.E.; Almonacid-Caballer, J.; Ruiz, L.A.; Palomar-Vázquez, J.; Rodrigo-Alemany, R. Evaluation of storm impact on sandy beaches of the gulf of Valencia using Landsat imagery series. Geomorphology 2014, 214, 388–401. [Google Scholar] [CrossRef] [Green Version]
- Almonacid-Caballer, J.; Sanchez-Garcia, E.; Pardo-Pascual, J.E.; Balaguer-Beser, A.A.; Palomar-Vazquez, J. Evaluation of annual mean shoreline position deduced from Landsat imagery as a mid-term coastal evolution indicator. Mar. Geol. 2016, 372, 79–88. [Google Scholar] [CrossRef]
- Choung, Y.J.; Jo, M.H. Shoreline change assessment for various types of coasts using multi-temporal Landsat imagery of the east coast of south Korea. Remote Sens. Lett. 2016, 7, 91–100. [Google Scholar] [CrossRef]
- Zhang, T.; Yang, X.M.; Hu, S.S.; Su, F.Z. Extraction of Coastline in Aquaculture Coast from Multispectral Remote Sensing Images: Object-Based Region Growing Integrating Edge Detection. Remote Sens. 2013, 5, 4470–4487. [Google Scholar] [CrossRef] [Green Version]
- Kuleli, T.; Guneroglu, A.; Karsli, F.; Dihkan, M. Automatic detection of shoreline change on coastal Ramsar wetlands of Turkey. Ocean. Eng. 2011, 38, 1141–1149. [Google Scholar] [CrossRef]
- Hansen, M.C.; Defries, R.S.; Townshend, J.R.G.; Sohlberg, R. Global land cover classification at 1 km spatial resolution using a classification tree approach. Int. J. Remote Sens. 2000, 21, 1331–1364. [Google Scholar] [CrossRef]
- Friedl, M.A.; McIver, D.K.; Hodges, J.C.F.; Zhang, X.Y.; Muchoney, D.; Strahler, A.H.; Woodcock, C.E.; Gopal, S.; Schneider, A.; et al. Global land cover mapping from MODIS: Algorithms and early results. Remote Sens. Environ. 2002, 83, 287–302. [Google Scholar] [CrossRef]
- Gong, P.; Wang, J.; Yu, L.; Zhao, Y.C.; Zhao, Y.Y.; Liang, L.; Niu, Z.G.; Huang, X.M.; Fu, H.H.; Liu, S.; et al. Finer resolution observation and monitoring of global land cover: First mapping results with Landsat TM and ETM+ data. Int. J. Remote Sens. 2013, 34, 2607–2654. [Google Scholar] [CrossRef] [Green Version]
- Yu, L.; Liu, X.X.; Zhao, Y.Y.; Yu, C.Q.; Gong, P. Difficult to map regions in 30 m global land cover mapping determined with a common validation dataset. Int. J. Remote Sens. 2018, 39, 4077–4087. [Google Scholar] [CrossRef]
- Giri, C.; Ochieng, E.; Tieszen, L.L.; Zhu, Z.; Singh, A.; Loveland, T.; Masek, J.; Duke, N. Status and distribution of mangrove forests of the world using Earth observation satellite data (version 1.3, updated by UNEP-WCMC). Glob. Ecol. Biogeogr. 2011, 20, 154–159. [Google Scholar] [CrossRef]
- Dolan, R.; Hayden, B. Templates of Change: Storms and Shoreline. Hazards 1980, 23, 32–37. [Google Scholar]
- Abu Zed, A.A.; Soliman, M.R.; Yassin, A.A. Evaluation of using satellite image in detecting long term shoreline change along El-Arish coastal zone, Egypt. Alex. Eng. J. 2018, 57, 2687–2702. [Google Scholar] [CrossRef]
- Xu, H. Modification of normalised difference water index (NDWI) to enhance open water features in remotely sensed imagery. Int. J. Remote Sens. 2006, 27, 3025–3033. [Google Scholar] [CrossRef]
- Hou, X.Y.; Wu, T.; Hou, W.; Chen, Q.; Wang, Y.D.; Yu, L.J. Characteristics of Shoreline changes in mainland China since the early 1940s. Sci. China Earth Sci. 2016, 59, 1791–1802. [Google Scholar] [CrossRef]
- Misra, A.; Balaji, R. A Study on the Shoreline Changes and LAND-use/Land-cover along the South Gujarat Coastline. Procedia Eng. 2015, 116, 381–389. [Google Scholar] [CrossRef] [Green Version]
- Aguilar, F.J.; Fernandez-Luque, I.; Aguilar, M.A.; Lorca, A.M.G.; Viciana, A.R. The integration of multi-source remote sensing data for the modelling of shoreline change rates in a mediterranean coastal sector. Int. J. Remote Sens. 2019, 40, 1148–1174. [Google Scholar] [CrossRef]
- Hou, X.Y.; Wu, T.; Wang, Y.D.; Xu, X.L.; Chen, Q.; Yu, L.J. Extraction and accuracy evaluation of multi-temporal coastlines of mainland China since 1940s. Mar. Sci. 2014, 38, 66–73. [Google Scholar]
- FAO. The State of World Fisheries and Aquaculture; Food and Agriculture Organization of the United Nations: Rome, Italy, 2016.
- Rimmer, M.A.; Sugama, K.; Rakhmawati, D.; Rofiq, R.; Habgood, R.H. A review and SWOT analysis of aquaculture development in Indonesia. Rev. Aquac. 2013, 5, 255–279. [Google Scholar] [CrossRef]
- Giardino, A.; Schrijvershof, R.; Nederhoff, C.M.; de Vroeg, H.; Briere, C.; Tonnona, P.K.; Caires, S.; Walstra, D.J. A quantitative assessment of human interventions and climate change on the West African sediment budget. Ocean. Coast. Manag. 2018, 156, 249–265. [Google Scholar] [CrossRef]
- Kench, P.S.; Nichol, S.L.; Smithers, S.G.; McLean, R.F.; Brander, R.W. Tsunami as agents of geomorphic change in mid-ocean reef islands. Geomorphology 2008, 95, 361–383. [Google Scholar] [CrossRef]
- Ford, M.R. Shoreline changes interpreted from multi-temporal aerial photographs and high resolution satellite images: Wotje Atoll, Marshall Islands. Remote Sens. Environ. 2013, 135, 130–140. [Google Scholar] [CrossRef]
- Mann, T.; Bayliss-Smith, T.; Westphal, H. A Geomorphic Interpretation of Shoreline Change Rates on Reef Islands. J. Coast. Res. 2016, 32, 500–507. [Google Scholar] [CrossRef]
- Biribo, N.; Woodroffe, C.D. Historical area and shoreline change of reef islands around Tarawa Atoll, Kiribati. Sustain. Sci. 2013, 8, 345–362. [Google Scholar] [CrossRef]
- Duvat, V.K.E.; Volto, N.; Salmon, C. Impacts of category 5 tropical cyclone Fantala (April 2016) on Farquhar atoll, Seychelles islands, Indian ocean. Geomorphology 2017, 298, 41–62. [Google Scholar] [CrossRef]
- Duvat, V.K.E.; Pillet, V. Shoreline changes in reef islands of the Central Pacific: Takapoto Atoll, Northern Tuamotu, French Polynesia. Geomorphology 2017, 282, 96–118. [Google Scholar] [CrossRef]
- Meire, P.; Ysebaert, T.; Van Damme, S.; Van den Bergh, E.; Maris, T.; Struyf, E. The Scheldt estuary: A description of a changing ecosystem. Hydrobiologia 2005, 540, 1–11. [Google Scholar] [CrossRef]
- Lotze, H.K.; Lenihan, H.S.; Bourque, B.J.; Bradbury, R.H.; Cooke, R.G.; Kay, M.C.; Kidwell, S.M.; Kirby, M.X.; et al. Depletion, degradation, and recovery potential of estuaries and coastal seas. Science 2006, 312, 1806–1809. [Google Scholar] [CrossRef]
- Rodriguez, A.B.; Simms, A.R.; Anderson, J.B. Bay-head deltas across the northern gulf of Mexico back step in response to the 8.2 ka cooling event. Quat. Sci. Rev. 2010, 29, 3983–3993. [Google Scholar] [CrossRef]
- Islam, M.A.; Mitra, D.; Dewan, A.; Akhter, S.H. Coastal multi-hazard vulnerability assessment along the Ganges deltaic coast of Bangladesh–a geospatial approach. Ocean. Coastal Manag. 2016, 127, 1–15. [Google Scholar] [CrossRef]
- Frihy, O.E.; Komar, P.D. Long-term shoreline changes and the concentration of heavy minerals in beach sands of the Nile Delta, Egypt. Mar. Geol. 1993, 115, 253–261. [Google Scholar] [CrossRef]
- Kong, D.X.; Miao, C.Y.; Borthwick, A.G.L.; Duan, Q.Y.; Liu, H.; Sun, Q.H.; Ye, A.Z.; Di, Z.H.; Gong, W. Evolution of the Yellow River Delta and its relationship with runoff and sediment load from 1983 to 2011. J. Hydrol. 2015, 520, 157–167. [Google Scholar] [CrossRef] [Green Version]
- Han, L.F.; Xu, Y.P.; Yang, L.; Deng, X.J.; Hu, C.S.; Xu, G.L. Temporal and spatial change of stream structure in Yangtze River Delta and its driving forces during 1960s–2010s. J. Geogr. Sci. 2015, 70, 819–827. [Google Scholar]
- Liu, J.P.; DeMaster, D.J.; Nguyen, T.T.; Saito, Y.; Nguyen, V.L.; Ta, T.K.O.; Li, X. Stratigraphic formation of the Mekong River Delta and its recent shoreline changes. Oceanography 2017, 30, 72–83. [Google Scholar] [CrossRef]
- Duvat, V.K.E.; Magnan, A.K.; Etienne, S.; Salmon, C.; Pignon-Mussaud, C. Assessing the impacts of and resilience to tropical cyclone Bejisa, Reunion Island (Indian ocean). Nat. Hazards 2016, 83, 601–640. [Google Scholar] [CrossRef]
- Meilianda, E.; Dohmen-Janssen, C.M.; Maathuis, B.H.P.; Hulscher, S.J.M.H.; Mulder, J.P.M. Short-term morphological responses and developments of Banda Aceh coast, Sumatra Island, Indonesia after the tsunami on 26 December 2004. Mar. Geol. 2010, 275, 96–109. [Google Scholar] [CrossRef]
Figure 1.
Location map of Southeast Asia.

Figure 2.
Image frequency per month in this study.
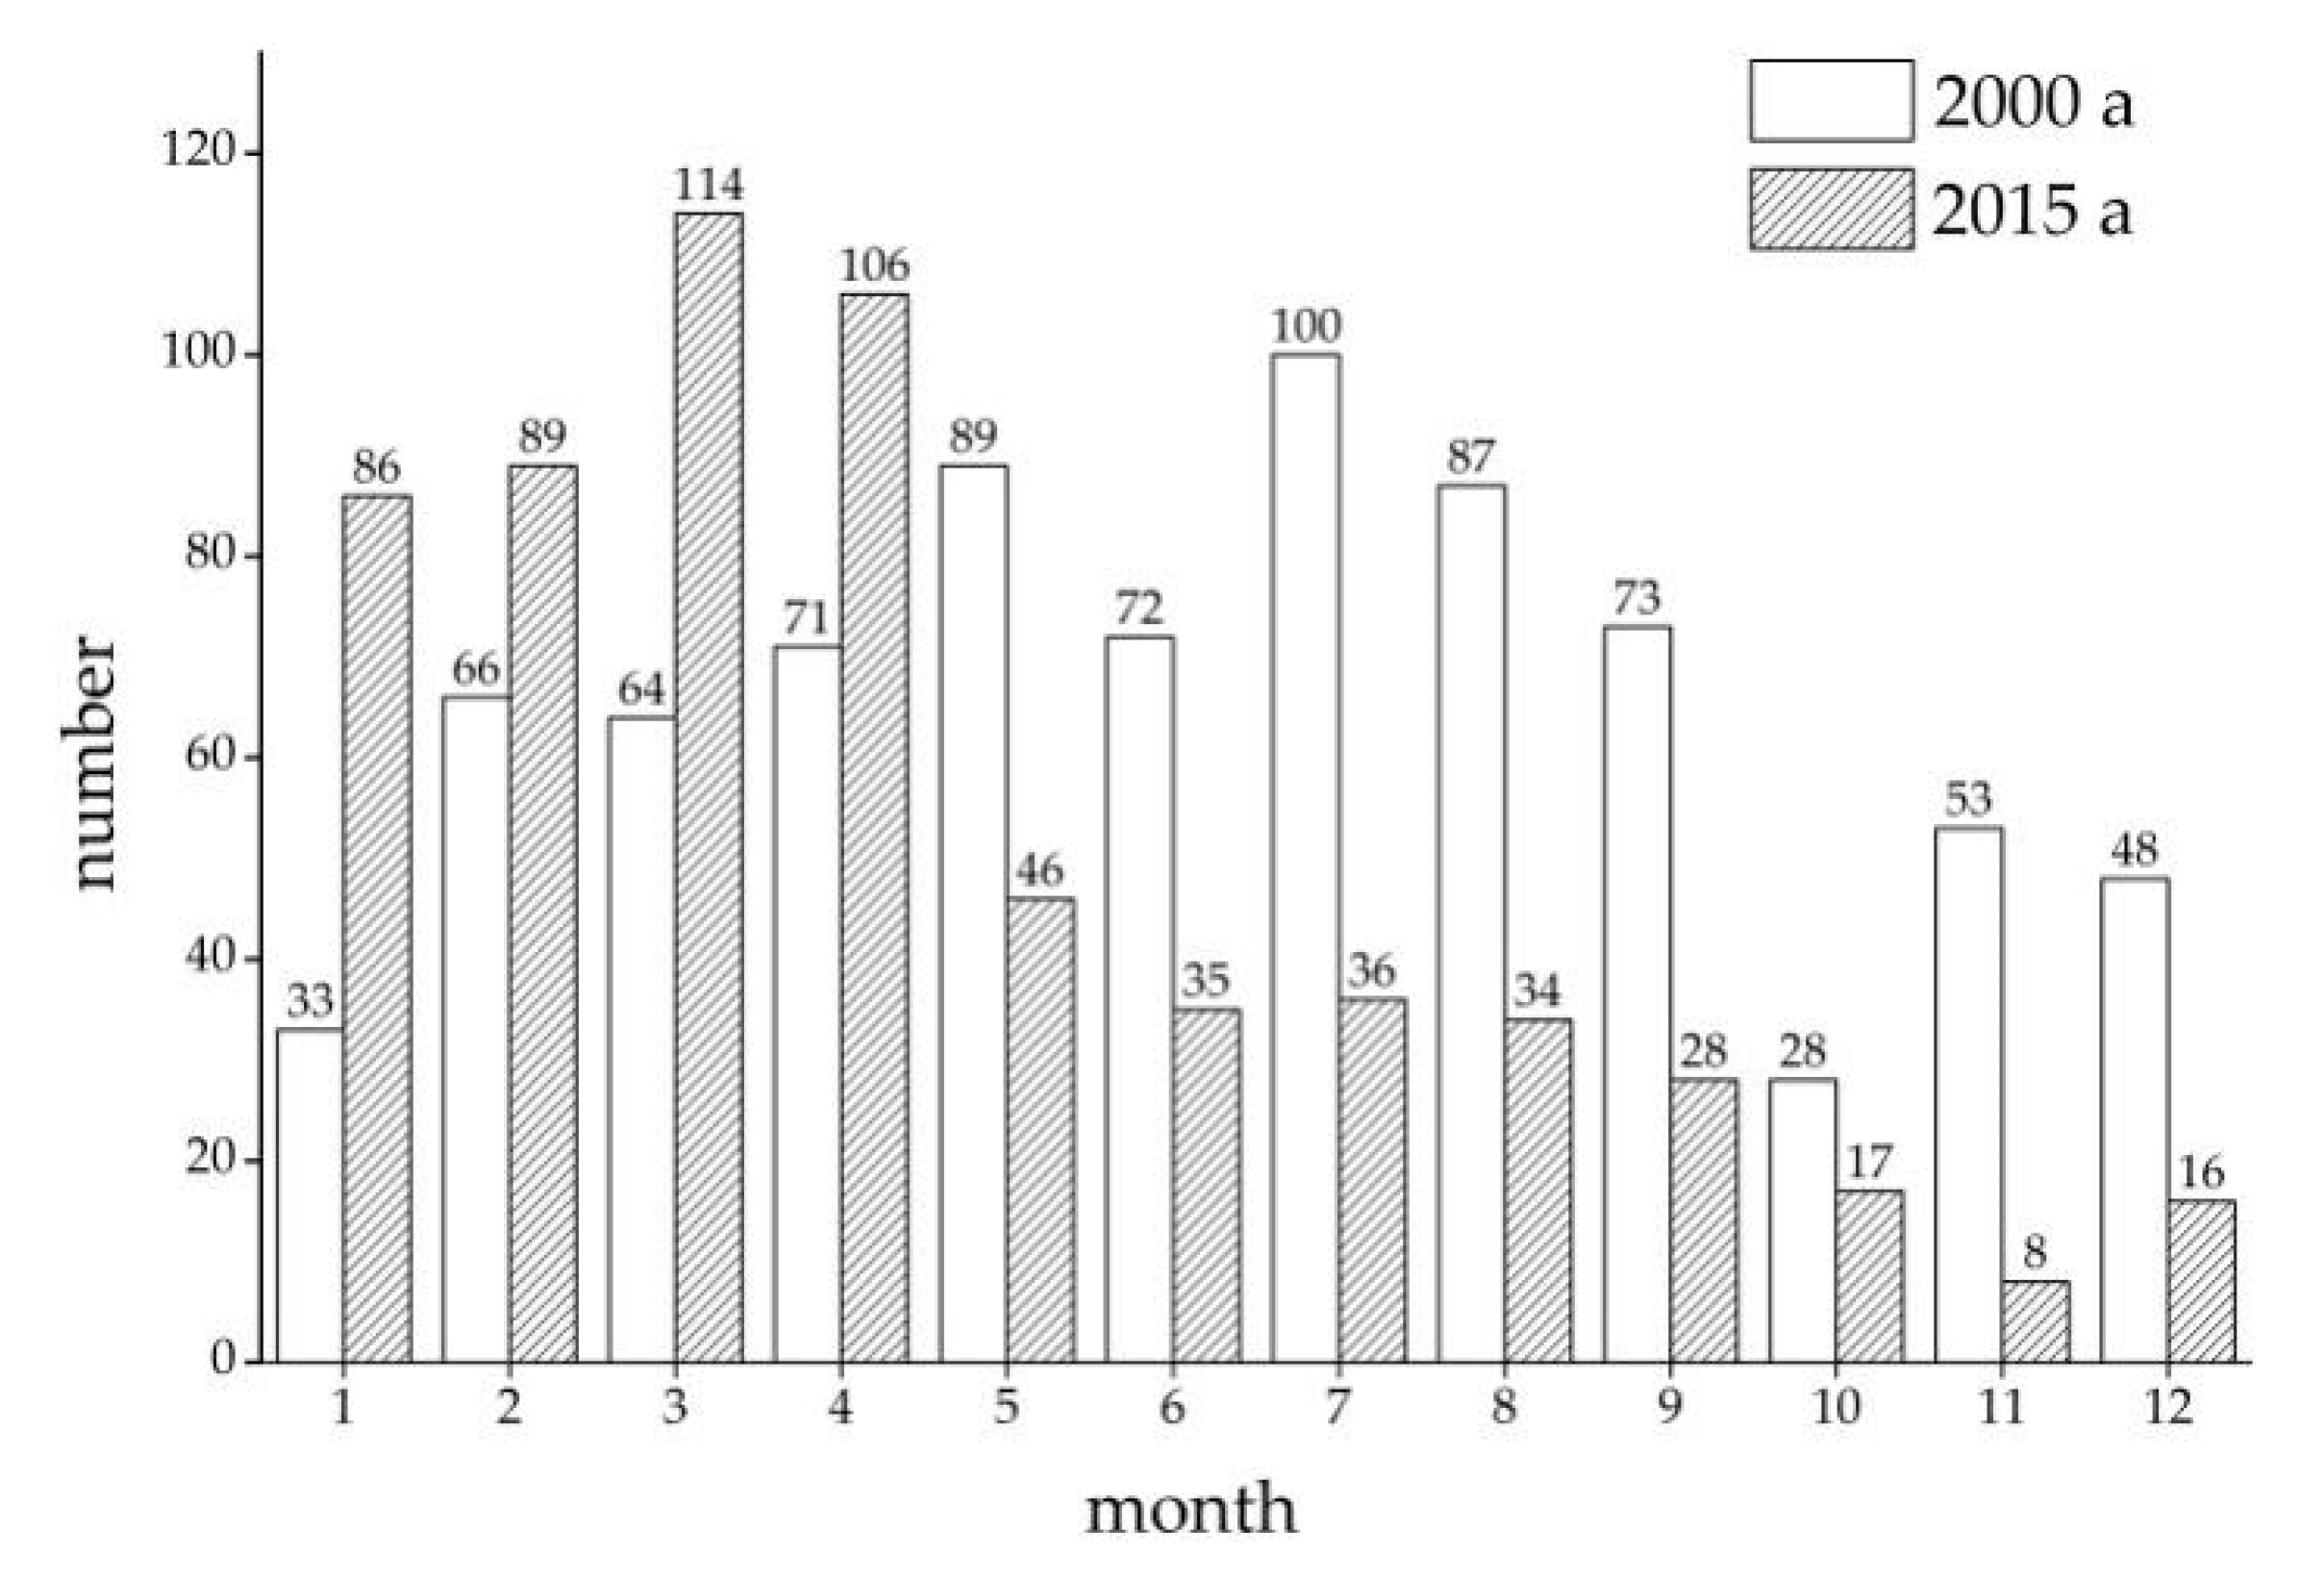
Figure 3.
Schematic diagram of coastline change. (a) shows changes in the location and types of coastlines and changes in the island area. (b) shows the change in the centroid of the island.
Figure 3.
Schematic diagram of coastline change. (a) shows changes in the location and types of coastlines and changes in the island area. (b) shows the change in the centroid of the island.
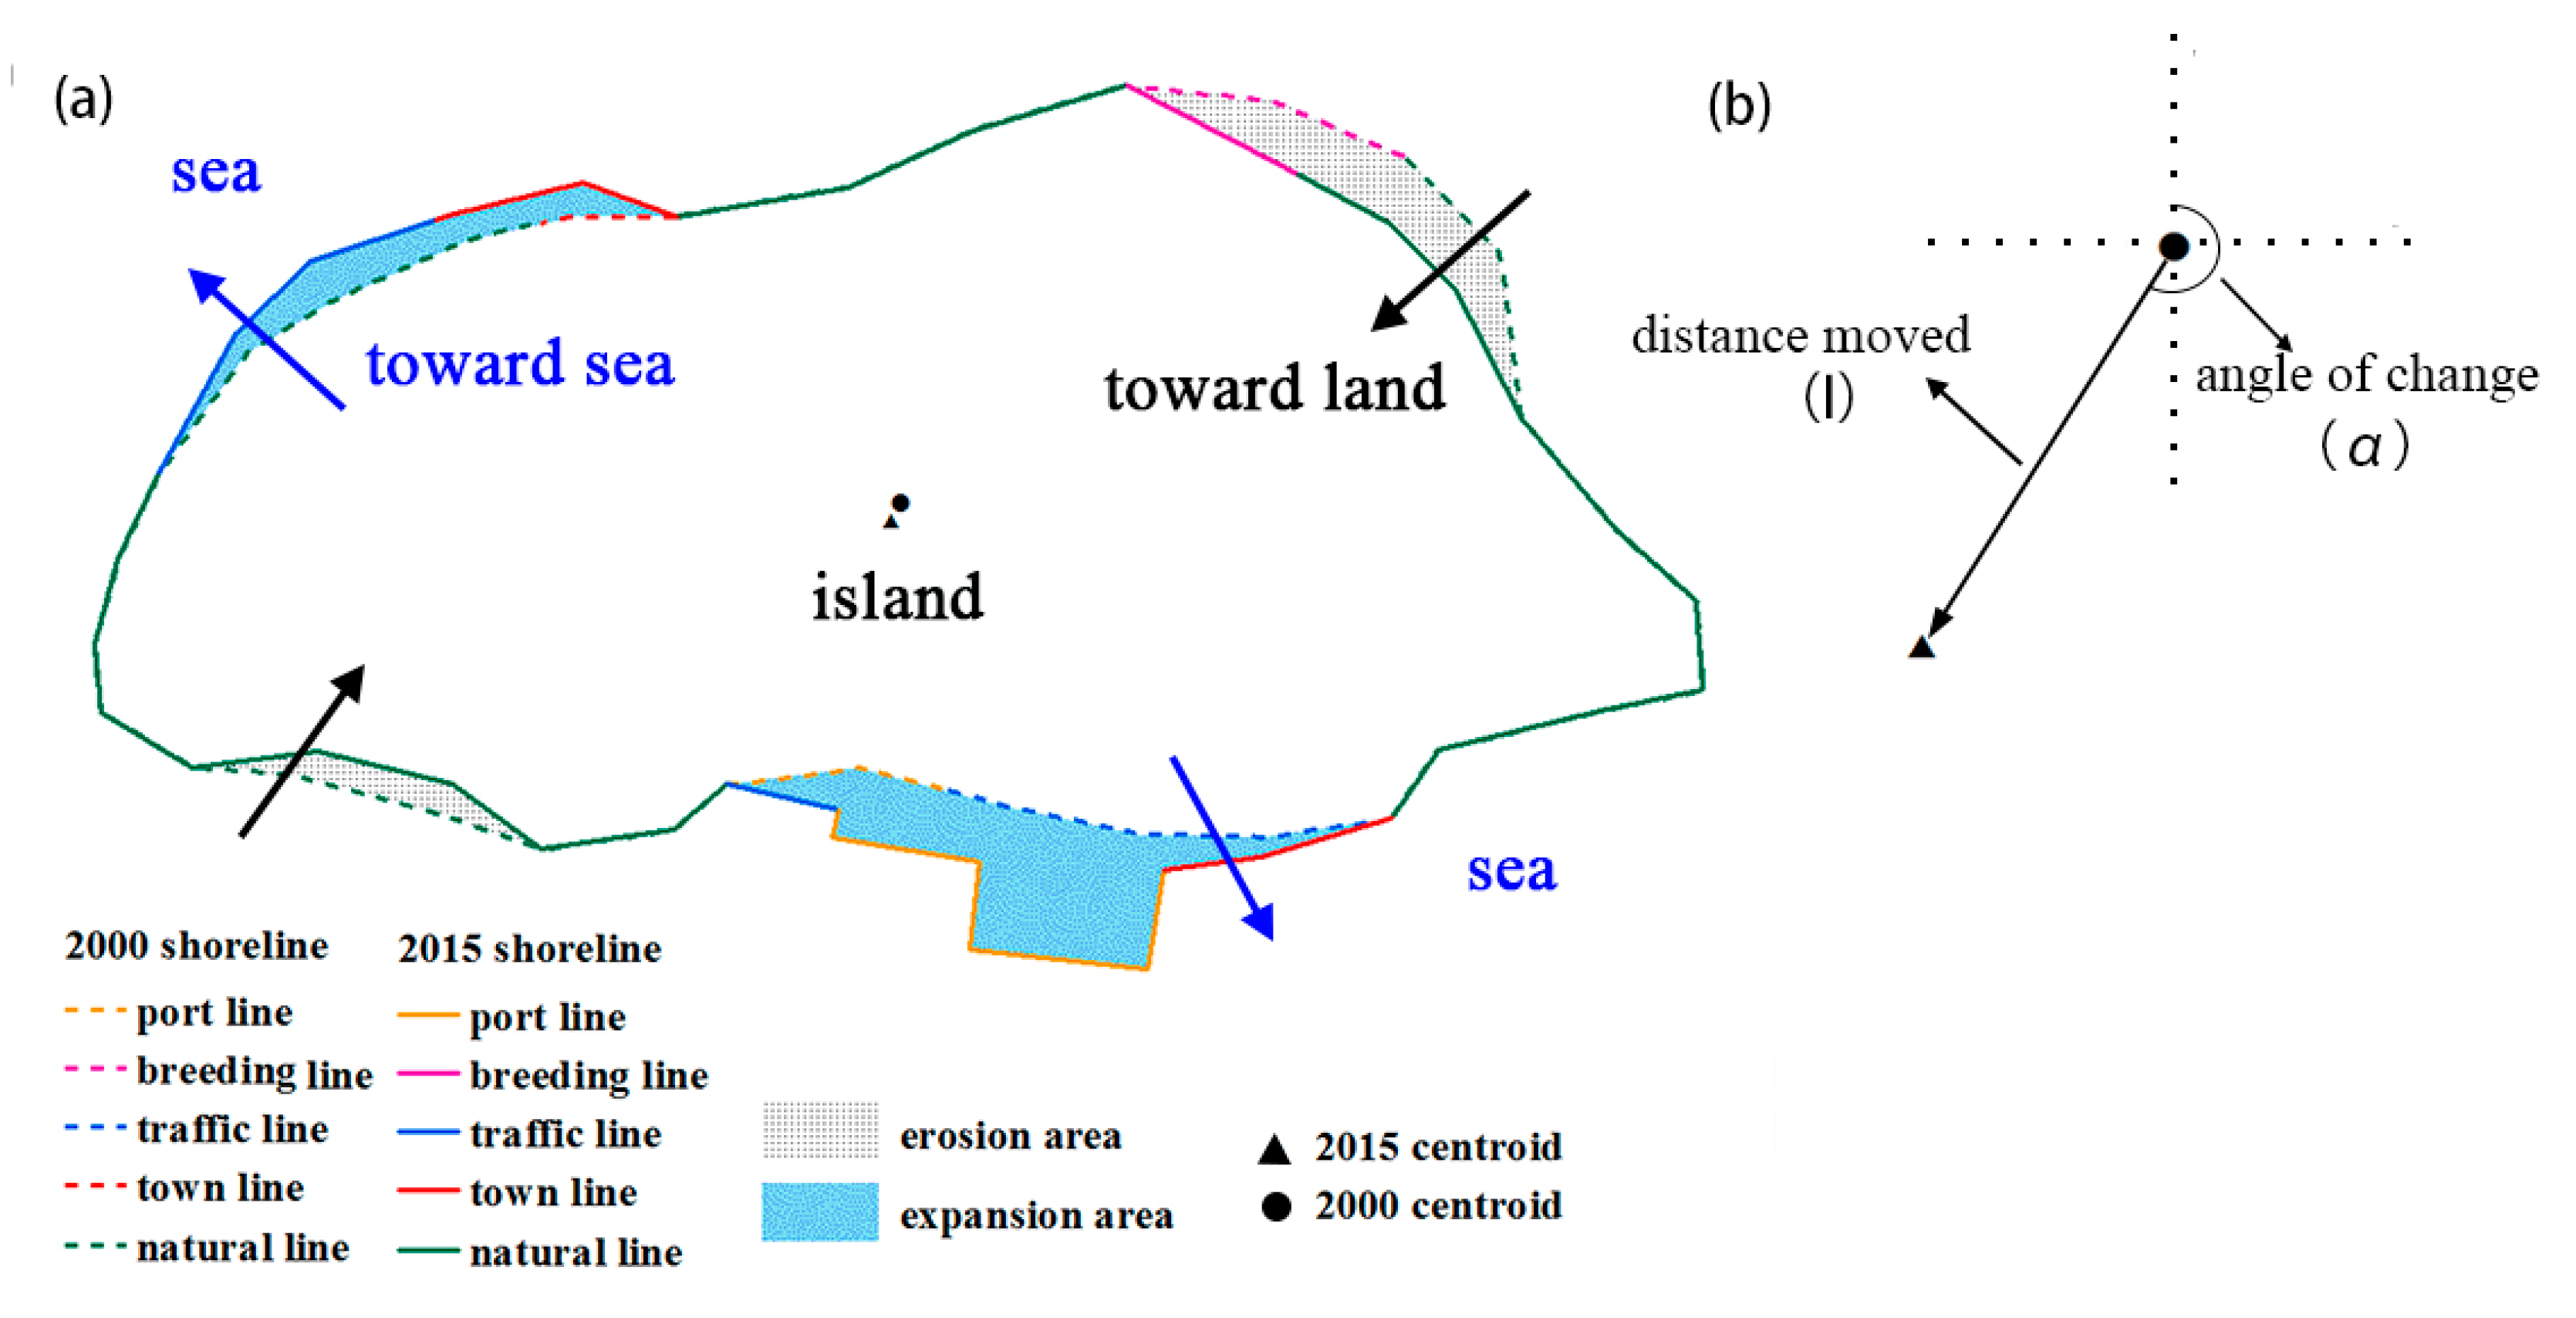
Figure 4.
Lengths of different artificial coastlines in 2000 and 2015.
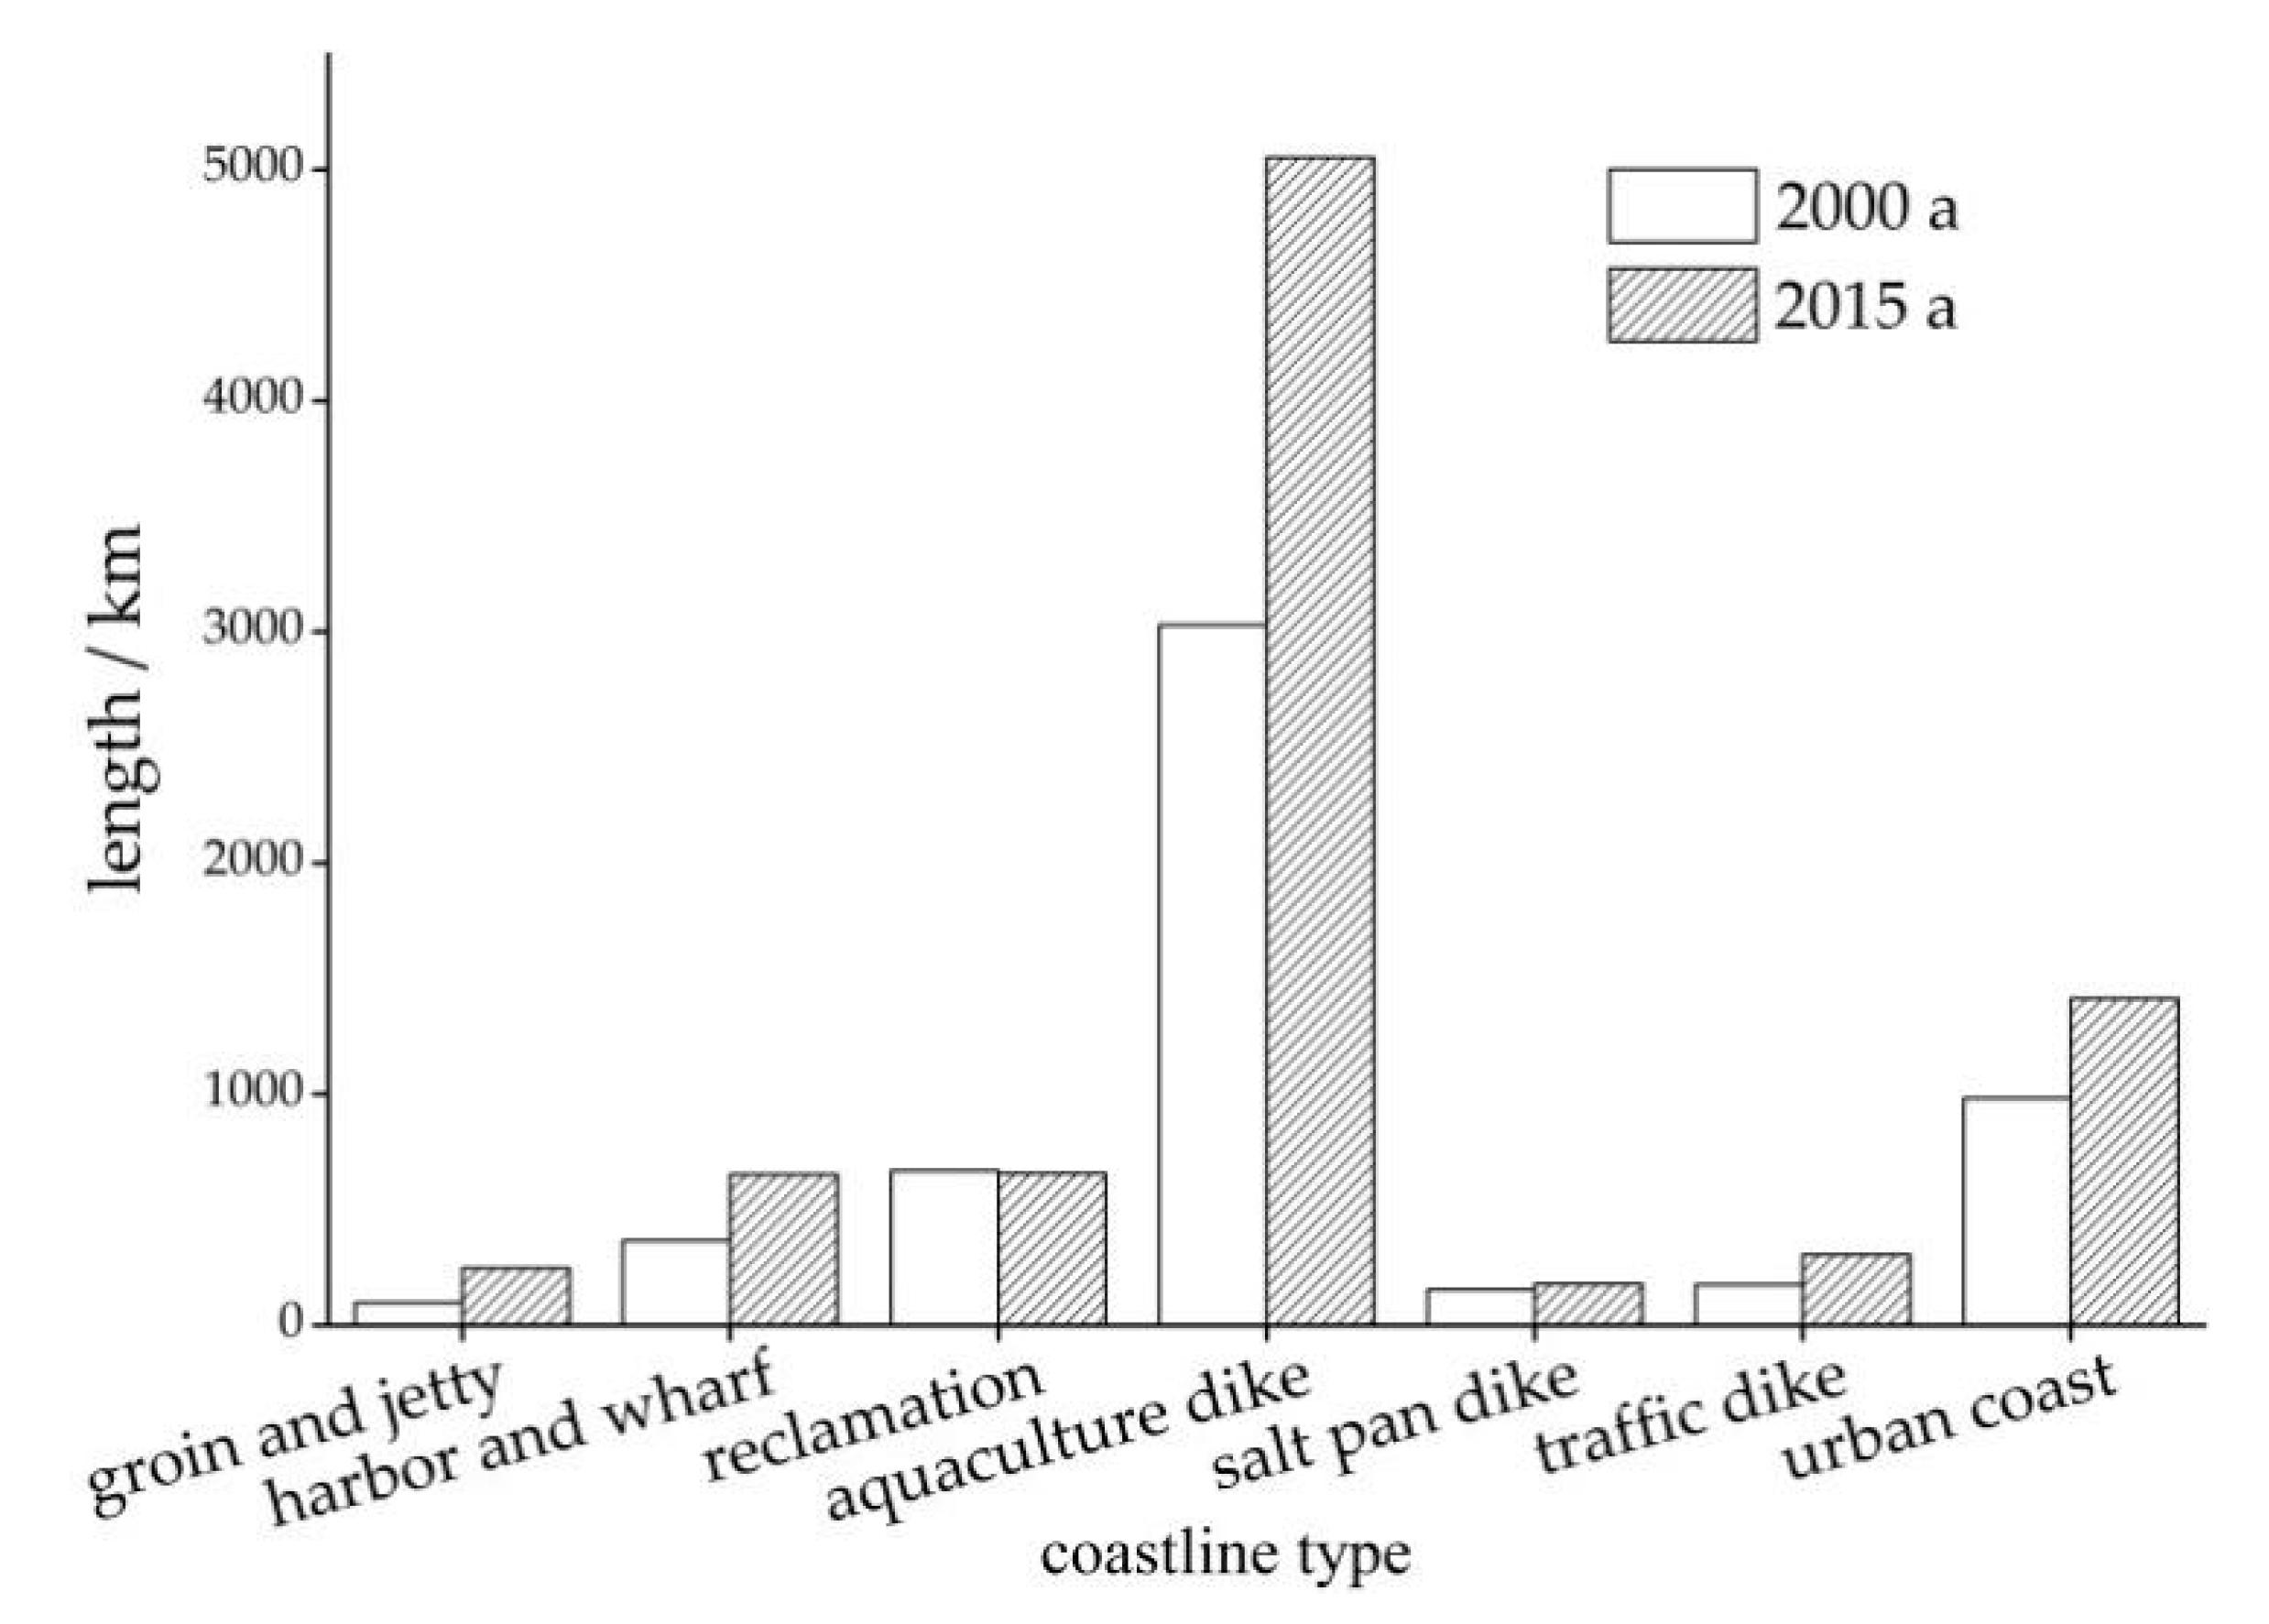
Figure 5.
Traces of human activities on the images. (a,b) show conspicuous increases in groin, jetty, harbour and wharf coastlines; (c,d) show that considerable biological coastlines were replaced by aquaculture dikes due to deforestation; (e,f) show that considerable urban coastlines replaced many natural coastlines because of urbanisation.


Figure 6.
Histogram of the shape index distribution of Southeast Asian islands in 2015.

Figure 7.
The rose diagram of island centroid displacements. (a) shows the total displacements in 16 directions and (b) shows the numbers of islands in 16 directions with varying displacement thresholds.
Figure 7.
The rose diagram of island centroid displacements. (a) shows the total displacements in 16 directions and (b) shows the numbers of islands in 16 directions with varying displacement thresholds.

Figure 8.
Map of land and sea patterns of Southeast Asian islands.

Figure 9.
Images of changes in sea and land patterns in Manila Bay and Singapore Strait.

Table 1.
Coastline classification system.
| First Level | Second Level | Introduction |
|---|---|---|
| Natural coastline | Rocky Coastline | Coastline on rocky coast, and is generally located at the base of bluff/cliff |
| Sandy Coastline | Coastline on sandy beach, and is generally located at the beach crest | |
| Muddy Coastline | Coastline on muddy or silt coast, and is generally located at the vegetation line where distribution patterns of salt-tolerant plants apparently change | |
| Biogenic Coastline | Coastline covered with mangroves, coral reefs or reeds and generally located on the landward side of the vegetation patch | |
| Hardened coastline | Groin and Jetty | Groin: low wall built out into the sea obliquely to prevent the washing away of sand and stones from beaches and to regulate alongshore current; Jetty: a wall built out into the sea with one side on shore for defence against waves |
| Harbour and Wharf | Hardened walls that belong to harbour and wharf | |
| Urban coast | Coastal sections for public and infrastructure construction, such as cities, towns and coastal development areas | |
| Reclamation | Districts that are being reclaimed or not yet utilized | |
| Aquaculture dike | Dikes built for aquaculture | |
| Salt pan dike | Dikes built for salt extraction | |
| Traffic dike | Dikes built for traffic, including sea walls with traffic functions |
Table 2.
Intensity of coastline change.
| LI (%) | <−1 | −1 ~ −0.5 | −0.5 ~ 0.5 | 0.5 ~ 1 | >1 |
|---|---|---|---|---|---|
| Number of Island | 63 | 71 | 640 | 44 | 52 |
Table 3.
Changes in coastline length for major islands.
| Island Name | Length Change (km) | Intensity of Length Change (%) |
|---|---|---|
| Luzon | −13.55 | 0 |
| Samar | −27.09 | −0.1 |
| Panay | 2.33 | 0 |
| Mindanao | −14.34 | 0 |
| Palawan | −1.01 | 0 |
| Sumatera | 81.21 | 0.1 |
| Kalimantan | 63.47 | 0 |
| Java | 99.38 | 0.2 |
| Sulawesi | 49.87 | 0 |
| Timor | 5.81 | 0 |
| New Guinea | 60.85 | 0 |
| Singapore | 58.17 | 15.5 |
Table 4.
The intensities of coastline structural changes in the 12 islands.
| Island Name | Percentage in Coastline Length Change (%) | ||||||||
|---|---|---|---|---|---|---|---|---|---|
| Groin and Jetty | Harbour and Wharf | Reclama-tion | Aquaculture Dike | Salt Pan Dike | Urban Coast | Traffic Dike | Hardened Coastline | Natural Coastline | |
| Luzon | 53 | 20 | 0 | 6 | 0 | 43 | 29 | 15 | −2 |
| Samar | 26 | 236 | 0 | 0 | 0 | 19 | 0 | 6 | −3 |
| Panay | −12 | 123 | 0 | 11 | 0 | −20 | 0 | 9 | −3 |
| Mindanao | 802 | 947 | −18 | 3 | 0 | −5 | 0 | 3 | −1 |
| Palawan | 50 | 0 | −49 | 212 | 0 | −2 | 0 | −6 | 0 |
| Sumatera | 336 | 67 | −95 | 56 | 50 | 29 | 240 | 46 | −2 |
| Kalimantan | 53 | 51 | 117 | 363 | 11 | 225 | 275 | 222 | −7 |
| Java | 308 | 55 | 46 | 3 | −15 | 88 | 2892 | 20 | −1 |
| Sulawesi | 330 | 1446 | −62 | 67 | 43 | 58 | 236 | 57 | −6 |
| Timor | 33 | 344 | 49 | 0 | 0 | 4 | 0 | 34 | 0 |
| New Guinea | 0 | 403 | −36 | 0 | 0 | 709 | 44 | 305 | 0 |
| Singapore | 232 | 68 | −48 | 0 | 0 | 94 | 85 | 39 | −14 |
Table 5.
Intensities of island area changes.
| Intensity of Area Change (%) | <−50 | −50 ~ −10 | −10 ~ −1 | −1 ~ 1 | 1 ~ 10 | 10 ~ 50 | 50 ~ 100 | >100 |
|---|---|---|---|---|---|---|---|---|
| Number of Island | 15 | 136 | 173 | 334 | 112 | 70 | 15 | 15 |
Note: The islands listed in the table are islands with coastline changes.
Table 6.
Area changes on major islands.
| Island Name | Area Change (km2) | Intensity of Area Change (%) |
|---|---|---|
| Luzon | −47.35 | 0 |
| Samar | −24.86 | −0.2 |
| Panay | −6.21 | −0.1 |
| Mindanao | 3.19 | 0 |
| Palawan | −0.92 | 0 |
| Sumatera | −186.52 | 0 |
| Kalimantan | 2.98 | 0 |
| Java | −69.69 | −0.1 |
| Sulawesi | 258.74 | 0.2 |
| Timor | 1.50 | 0 |
| New Guinea | −163.94 | 0 |
| Singapore | 48.85 | 7.1 |
Table 7.
Relationship between island area and shape index (2015a).
| Area (km2) | >10,000 | 1000 ~ 10,000 | 100 ~ 1000 | 10 ~ 100 | 1 ~ 10 | <1 | |
|---|---|---|---|---|---|---|---|
| LSI | Min | 1.32 | 1.23 | 1.07 | 1.04 | 1.01 | 1.01 |
| Max | 5.99 | 5.71 | 4.57 | 5.08 | 3.49 | 3.46 | |
| Median | 3.10 | 2.40 | 1.94 | 1.69 | 1.51 | 1.26 | |
| Mean | 3.16 | 2.42 | 2.13 | 1.85 | 1.61 | 1.32 | |
Table 8.
Centroid movements of the 12 islands.
| Island Name | Azimuth (Degree) | Displacement (m) | Island Name | Azimuth (Degree) | Displacement (m) |
|---|---|---|---|---|---|
| Mindanao | 145 | 5.22 | Sulawesi | 69 | 79.81 |
| Timor | 208 | 6.02 | Samar | 295 | 95.97 |
| Palawan | 57 | 16.22 | Luzon | 18 | 97.56 |
| Panay | 308 | 21.47 | New Guinea | 324 | 131.36 |
| Kalimantan | 293 | 28.90 | Sumatera | 147 | 210.21 |
| Java | 133 | 70.19 | Singapore | 211 | 254.48 |
Table 9.
Characteristics of land and sea patterns on the 12 islands.
| Island Name | Change Proportion in Length (%) | Island Name | Change Proportion in Length (%) | ||||
|---|---|---|---|---|---|---|---|
| Erosion | Expansion | Total | Erosion | Expansion | Total | ||
| Luzon | 4.3 | 4.7 | 9.0 | Kalimantan | 12.2 | 8.8 | 20.9 |
| Samar | 14.2 | 4.4 | 18.6 | Java | 12.7 | 12.6 | 25.3 |
| Panay | 4.4 | 1.7 | 6.1 | Sulawesi | 2.9 | 8.7 | 11.7 |
| Mindanao | 2.3 | 4.5 | 6.8 | Timor | 6.7 | 5.9 | 12.6 |
| Palawan | 0.9 | 1.2 | 2.1 | New Guinea | 11.3 | 7.9 | 19.2 |
| Sumatera | 29.0 | 14.6 | 43.7 | Singapore | 1.5 | 18.7 | 20.2 |
Table 10.
Length and proportion of coastlines with different coastal types before coastline change.
| Type of Coastline | Length of Retreat Coastline (km) | Proportion of Retreat Coastline (%) | Length of Expanded Coastline (km) | Proportion of Expanded Coastline (%) |
|---|---|---|---|---|
| Rocky Coastline | 767.97 | 8 | 652.71 | 9 |
| Sandy Coastline | 531.83 | 6 | 665.80 | 9 |
| Muddy Coastline | 1,092.42 | 12 | 1213.39 | 17 |
| Biogenic Coastline | 6,898.31 | 74 | 4773.35 | 65 |
| In total | 9,290.53 | 100 | 7305.24 | 100 |
Table 11.
Length and proportion of coastlines with different types of utilisation after coastline change.
Table 11.
Length and proportion of coastlines with different types of utilisation after coastline change.
| Type of Coastline | Length of Retreat Coastline (km) | Proportion of Retreat Coastline (%) | Length of Expanded Coastline (km) | Proportion of Expanded Coastline (%) |
|---|---|---|---|---|
| Harbour and Wharf | 50.54 | 0.54 | 279.02 | 3.67 |
| Reclamation | 64.47 | 0.69 | 231.78 | 3.05 |
| Aquaculture dike | 1025.91 | 10.92 | 882.23 | 11.62 |
| Salt pan dike | 35.15 | 0.37 | 44.99 | 0.59 |
| Traffic dike | 35.53 | 0.38 | 51.00 | 0.67 |
| Urban coasts | 86.95 | 0.93 | 311.66 | 4.10 |
| Natural coastline | 8096.40 | 86.18 | 5793.01 | 76.29 |
| In total | 9394.95 | 100 | 7593.69 | 100 |
Table 12.
Area change rates for islands less than 100 ha.
| Island Area (ha) | Change Rate in Island Area (%) | ||
|---|---|---|---|
| Erosion | Expansion | Net Change | |
| 10–100 | 13 | 14 | 20 |
| 5–10 | 22 | 20 | 30 |
| <5 | 29 | 39 | 33 |
© 2020 by the authors. Licensee MDPI, Basel, Switzerland. This article is an open access article distributed under the terms and conditions of the Creative Commons Attribution (CC BY) license (http://creativecommons.org/licenses/by/4.0/).
Share and Cite
MDPI and ACS Style
Zhang, Y.; Hou, X. Characteristics of Coastline Changes on Southeast Asia Islands from 2000 to 2015. Remote Sens. 2020, 12, 519. https://0-doi-org.brum.beds.ac.uk/10.3390/rs12030519
AMA Style
Zhang Y, Hou X. Characteristics of Coastline Changes on Southeast Asia Islands from 2000 to 2015. Remote Sensing. 2020; 12(3):519. https://0-doi-org.brum.beds.ac.uk/10.3390/rs12030519
Chicago/Turabian StyleZhang, Yuxin, and Xiyong Hou. 2020. "Characteristics of Coastline Changes on Southeast Asia Islands from 2000 to 2015" Remote Sensing 12, no. 3: 519. https://0-doi-org.brum.beds.ac.uk/10.3390/rs12030519
Note that from the first issue of 2016, this journal uses article numbers instead of page numbers. See further details here.