GNSS/INS Integration with Integrity Monitoring for UAV No-fly Zone Management


1
College of Civil Aviation, Nanjing University of Aeronautics and Astronautics, Nanjing 211106, China
2
College of Civil Engineering, Nanjing Forestry University, Nanjing 210037, China
3
Department of Civil and Environmental Engineering, Imperial College London, London SW7 2AZ, UK
*
Author to whom correspondence should be addressed.
Remote Sens. 2020, 12(3), 524; https://0-doi-org.brum.beds.ac.uk/10.3390/rs12030524
Submission received: 11 January 2020
/
Revised: 28 January 2020
/
Accepted: 1 February 2020
/
Published: 6 February 2020
(This article belongs to the Special Issue Real-time GNSS Precise Positioning Service and its Augmentation Technology)
Abstract
:The rapidly increasing use of unmanned aerial vehicles pose a significant challenge to no-fly zone management. The vehicle state in flight should be available for the whole mission, enabling an alert to be issued to the relevant users and entities at an appropriate time and location before intrusion into a no-fly zone. In addition to spatial databases and other control mechanisms, the navigation system used must have the required accuracy, integrity, continuity, and availability. In this paper, the accuracy and integrity requirements, and the positioning system for no-fly zone unmanned aerial vehicle management are specified. The proposed positioning system integrates global navigation satellite systems (GNSS) and inertial navigation system (INS) in the measurement domain. An integrity monitoring layer is incorporated for fault detection and exclusion as well as real-time horizontal protection level computation functions. Experimental results show that the algorithm proposed is capable of delivering accuracy and integrity requirements for unmanned aerial vehicle (UAV) no-fly zone management.

1. Introduction
There has been a rapid increase in unmanned aerial vehicles (UAVs) for commercial activities. However, this has been accompanied by an increasing number of reported events or incidents, including flights at or proximate to airports and military bases. Currently, traditional technologies such as radar and signal jamming sensors are used to detect and neutralize, respectively, suspicious incoming UAVs. While effective to a certain extent, these methods suffer from the limitations of low performance and high cost. Therefore, in order to reliably manage UAVs, it is recommended that every UAV should have an effective control and management system [1]. The system is required to alert registered UAV users or operators when they are about to enter a no-fly zone or when to avoid certain areas, such as where emergency responders are active. The registered users or operators could also be required to report the trajectory to the authorities after completing the flight mission to determine any violations [2]. Therefore, a crucial part of the management system is that the navigation system used must have the required navigation performance (RNP) to offer the right level of protection of restricted areas.
Advanced technologies, including global navigation satellite systems (GNSS), sensor networks, and communication devices, are widely applied for UAV position determination. These technologies and their outputs of vehicle state (position, velocity and timing) are used, albeit without an agreed set of performance requirements to support aspects of no-fly zone management [3]. Hence, it is paramount to firstly, specify the RNP and then the corresponding positioning and navigation system. In this process, the level of criticality of each mission or application must be considered, usually categorized into: (1) high, for missions related to safety-of-life and military activities; (2) medium, for commercial/liability critical missions (e.g., UAVs for delivery applications); and (3) low, for non-mission critical applications (e.g., private UAVs for domestic use). Hence, to cater for different levels of criticality, navigation systems must meet the targets for the RNP parameters of accuracy, integrity, continuity, and availability [4].
Accuracy measures the nominal performance of a system in the absence of failure through conformality between the estimated position to the true position at the 95th percentile. This means that the probability of position errors that meet the accuracy requirements should be at least 95%. Integrity is defined as a measure of the trust that can be placed on the correctness of the information provided by a navigation system. Integrity, focuses on the “tail” of the error density with the goal of protection against hazardously misleading information (HMI). Continuity defines the capability of the navigation system to provide a navigation solution with the specified level of accuracy and integrity during the intended period of operation (POP), given that the system was usable for the operation at the start. Availability is the percentage of time during which the service of a navigation system is usable with the required accuracy, integrity, and continuity requirements satisfied simultaneously [5]. UAV no-fly zone management is mission critical, and therefore, accuracy and integrity are key parameters that are addressed in this paper.
In terms of characteristics, GNSS measurements are have a long stability but are inherently noisy, while the INS measurements have less noise but with short term stability. Hence, integrating GNSS with INS, delivers improved performance by exploiting the complementary features of long stability and low noise [6]. The integration of GNSS and INS not only avoids positioning outage and/or inaccuracy caused by GNSS signal jamming and/or interference but also provides redundant measurements for integrity monitoring. Although GNSS integration has been widely applied in UAV state estimation [7], there has been very limited research on UAV no-fly zone management. In addition, for the purpose of designing a navigation system that can be used onboard a UAV for no-fly zone management, the service level requirements (and hence system requirements) of the corresponding navigation system are still to be specified.
In order to bridge the current research gap on the concept and framework for GNSS-based UAV no-fly zone management, this paper clarifies the definitions of service level and system level requirements focusing on accuracy and integrity. In addition, an algorithm for GNSS/INS integration incorporating integrity monitoring is developed to underpin the application for no-fly zone management. In particular, fault detection and exclusion and horizontal protection level computation are incorporated into the designed algorithm for integrity monitoring to enhance the robustness of the on-board navigation system. The contributions are summarized below.
(1) Clarification of service and system requirements of accuracy and integrity in the context of UAV no-fly zone based management;
(2) Proposal of an improved positioning system with an integrity monitoring algorithm for an integrated GNSS/INS system in the measurement domain to support UAV no-fly zone management;
(3) Development of a novel hybrid fault detection and exclusion method. A dual-mode detector is generated by combing historical and real-time innovation sequences to allow fast detection of both step and ramp errors. The detection threshold is determined by imposing chi-square distribution assumption of the constructed detector. In addition, a W-test statisticsbased algorithm is proposed to map the test statistic errors to the measurement for the fault exclusion.
2. Related Work
The related literature is summarized in two parts: (1) UAV monitoring and air traffic management, and (2) sensor fusion based positioning and integrity monitoring.
2.1. UAV Monitoring and Air Traffic Management
UAV monitoring and management involves three main elements: pilots, UAVs, and airspace. The operation of UAVs includes application of flight plan, real time monitoring of flight data, and issuance of alert and countering of illegal flights. In recent years, several methods have been developed to address the problem of monitoring and managing UAVs to ensure the safety of low altitude airspace. Mason et al. [8] proposed a cloud-based web application that provides real-time flight monitoring and management for UAVs. The system reads the flight data from UAV sensors and transfers them onto maps, allowing users or operators to dynamically monitor aircraft on a user interface. The United States National Aeronautics and Space Administration (NASA) has implemented a cloud-based unmanned aircraft traffic management (UTM) system that provides a way for civilian pilots to reserve airspace [2,9]. This system maintains a database of reserved and active flights, providing information to pilots about adverse weather conditions and restricted airspace. The UTM project consists of four technical capability levels, the ultimate goal of which is to enable the management of UAVs in high-density urban areas with large-scale contingency mitigation. Damilano et al. [10] developed a flight mission planning methodology based on the use of a ground control station to create and verify a flight mission. Geng et al. [11] also presented a mission planning system that generates mission plans for a group of UAVs to provide continuous surveillance over an urban area. Torens and Adolf [12] proposed a method to validate a sampling-based mission planner for autonomous UAV.
The current UAV monitoring and management systems above do no account for the mission criticality of no-fly zone management. In order to do this, research on service level and hence system level requirements are required, which in turn drive the specification of the positioning and navigation system architecture. This paper addresses these issues.
2.2. Sensor Fusion Based Positioning and Integrity Monitoring
To implement a an GNSS/INS navigation system, the first concern should be the coupling scheme selection. There are three mainstream schemes: loosely coupled scheme, tightly coupled scheme, and ultra-tightly coupled scheme [13]. It is worth noting that the loosely coupled scheme (also referred to as position domain integration), although with the simplest structure, cannot provide redundant measurements, and the ultra-tightly coupled scheme with the most complex structure cannot ensure the mutual independence of measurements. Obviously, the tightly coupled scheme (also referred to as position domain integration) with medium complexity is the best choice, since measurement redundancy and inter-independence of measurements, which are key requirements for integrity monitoring, can be obtained at the same time [14]. The carrier and code phase measurements are two types of raw GNSS measurements. Positioning with code phase measurements can provide meter-level accuracy with a higher reliability and lower computation cost than carrier phase and therefore, when used together with INS measurements, has the potential to provide the required accuracy and integrity for UAV no-fly zone management. Therefore, a tightly coupled GNSS/INS integrated system incorporating an integrity monitor is selected for further development in this paper.
The existing integrity monitoring methods are reviewed and summarized as follows. In the context of state-of-the-art integrity monitoring technique, there are two major categories: (1) receiver autonomous integrity monitoring (RAIM) and its variations, and (2) special augmentation mechanisms. The latter consists of the ground based augmentation system (GBAS), satellite based augmentation system (SBAS), and aircraft based augmentation system (ABAS) [15]. In particular, RAIM is a satellite navigation integrity monitoring scheme within the receiver for detecting significant measurement errors arising from satellite malfunctions, propagation environment, and others by the use of information including redundant measurements, geometrical configuration of satellites relative to the users, and knowledge of nominal error behavior [14]. There are four basic RAIM methods: (1) range and position comparison method [16]; (2) least squares residuals method [17]; (3) parity space method [18]; and (4) maximum slope (MS) method [19]. Various methods are further developed based on these basic methods. Brown [20] applied the improved MS method, denoted as slope-max-max method, by imposing a worst-case hypothetical two-failure requirement on RAIM to handle dual satellite failures. As the traditional RAIM algorithms are designed only for horizontal position monitoring, advanced RAIM (ARAIM) emerged along with the prospect of handling any number of simultaneous significant measurement errors and providing vertical integrity monitoring [21]. In order to handle the limitations caused by the Gaussian assumptions, Blanch et al. [22] characterized the range error distribution by a mixture of Gaussian modes, which helps account for heavy tails without losing the advantage of Gaussian distributions. Results show that the computed vertical protection levels are reduced by 50% without degrading integrity. Panagiotakopoulos et al. [23] applied extreme value theory to the tails of position errors, and the generalized extreme value (GEV) distribution is derived to capture residual navigation errors. The results indicated that GEV is more powerful in characterizing the tails than Gaussian models when “blunder” errors are present.
Besides satellite navigation, the integrity monitoring for GNSS-based integrated systems has received increasing attention. Escher et al. [24] used the multiple solution separation (MSS) method based fault detection and exclusion (FDE) for the integrated GNSS/INS systems. In particular, INS aids in detecting GNSS faults, and the primary Kalman filter is used to estimate the state vector. Sub-solutions offered by sub-filters are compared to their “parent” filter, and the differences are utilized to form various test statistics with a threshold. Further developments resulted in the autonomous integrity monitored extrapolation (AIME) method also used for integrated systems [25]. In AIME, the historical Kalman filter innovation sequence is used to form the test statistic. It is shown that the AIME method delivers higher availability over the MSS method, while the latter is much easier to demonstrate analytically in terms of integrity performance [26]. Considering the various types of failure modes in integrated GNSS/INS systems, Bhatti et al. [14] developed a rate detector algorithm for the detection of slowly growing errors.
In summary, positioning accuracy and integrity are both critical for the reliability of navigation sensors and therefore, to support the applications. In particular, for monitoring the integrity of integrated GNSS/INS systems, the AIME method is more popular due to its fast detection of the slowly growing errors with a high detection accuracy. Nevertheless, considering the application characteristics of the UAV no-fly zone management, both ramp and step errors of the navigation system need to be detected during the UAV operation. Therefore, in this paper, we design a tightly coupled sensor fusion scheme with a novel integrity monitoring algorithm to enhance the reliability of the on-board GNSS/INS integrated system. The proposed hybrid dual-mode detector-based integrity monitoring algorithm improves the historical innovation sequence based detector in AIME by integrating the real-time innovation sequence for the detection of step and ramp errors.
3. Concept and Requirement of No-Fly Zone Management
This section introduces the concept of no-fly zone management, and clarifies the different levels: service, positioning and integrity for the location-based UAV no-fly zone management.
3.1. Concept of Location Based No-Fly Zone Management
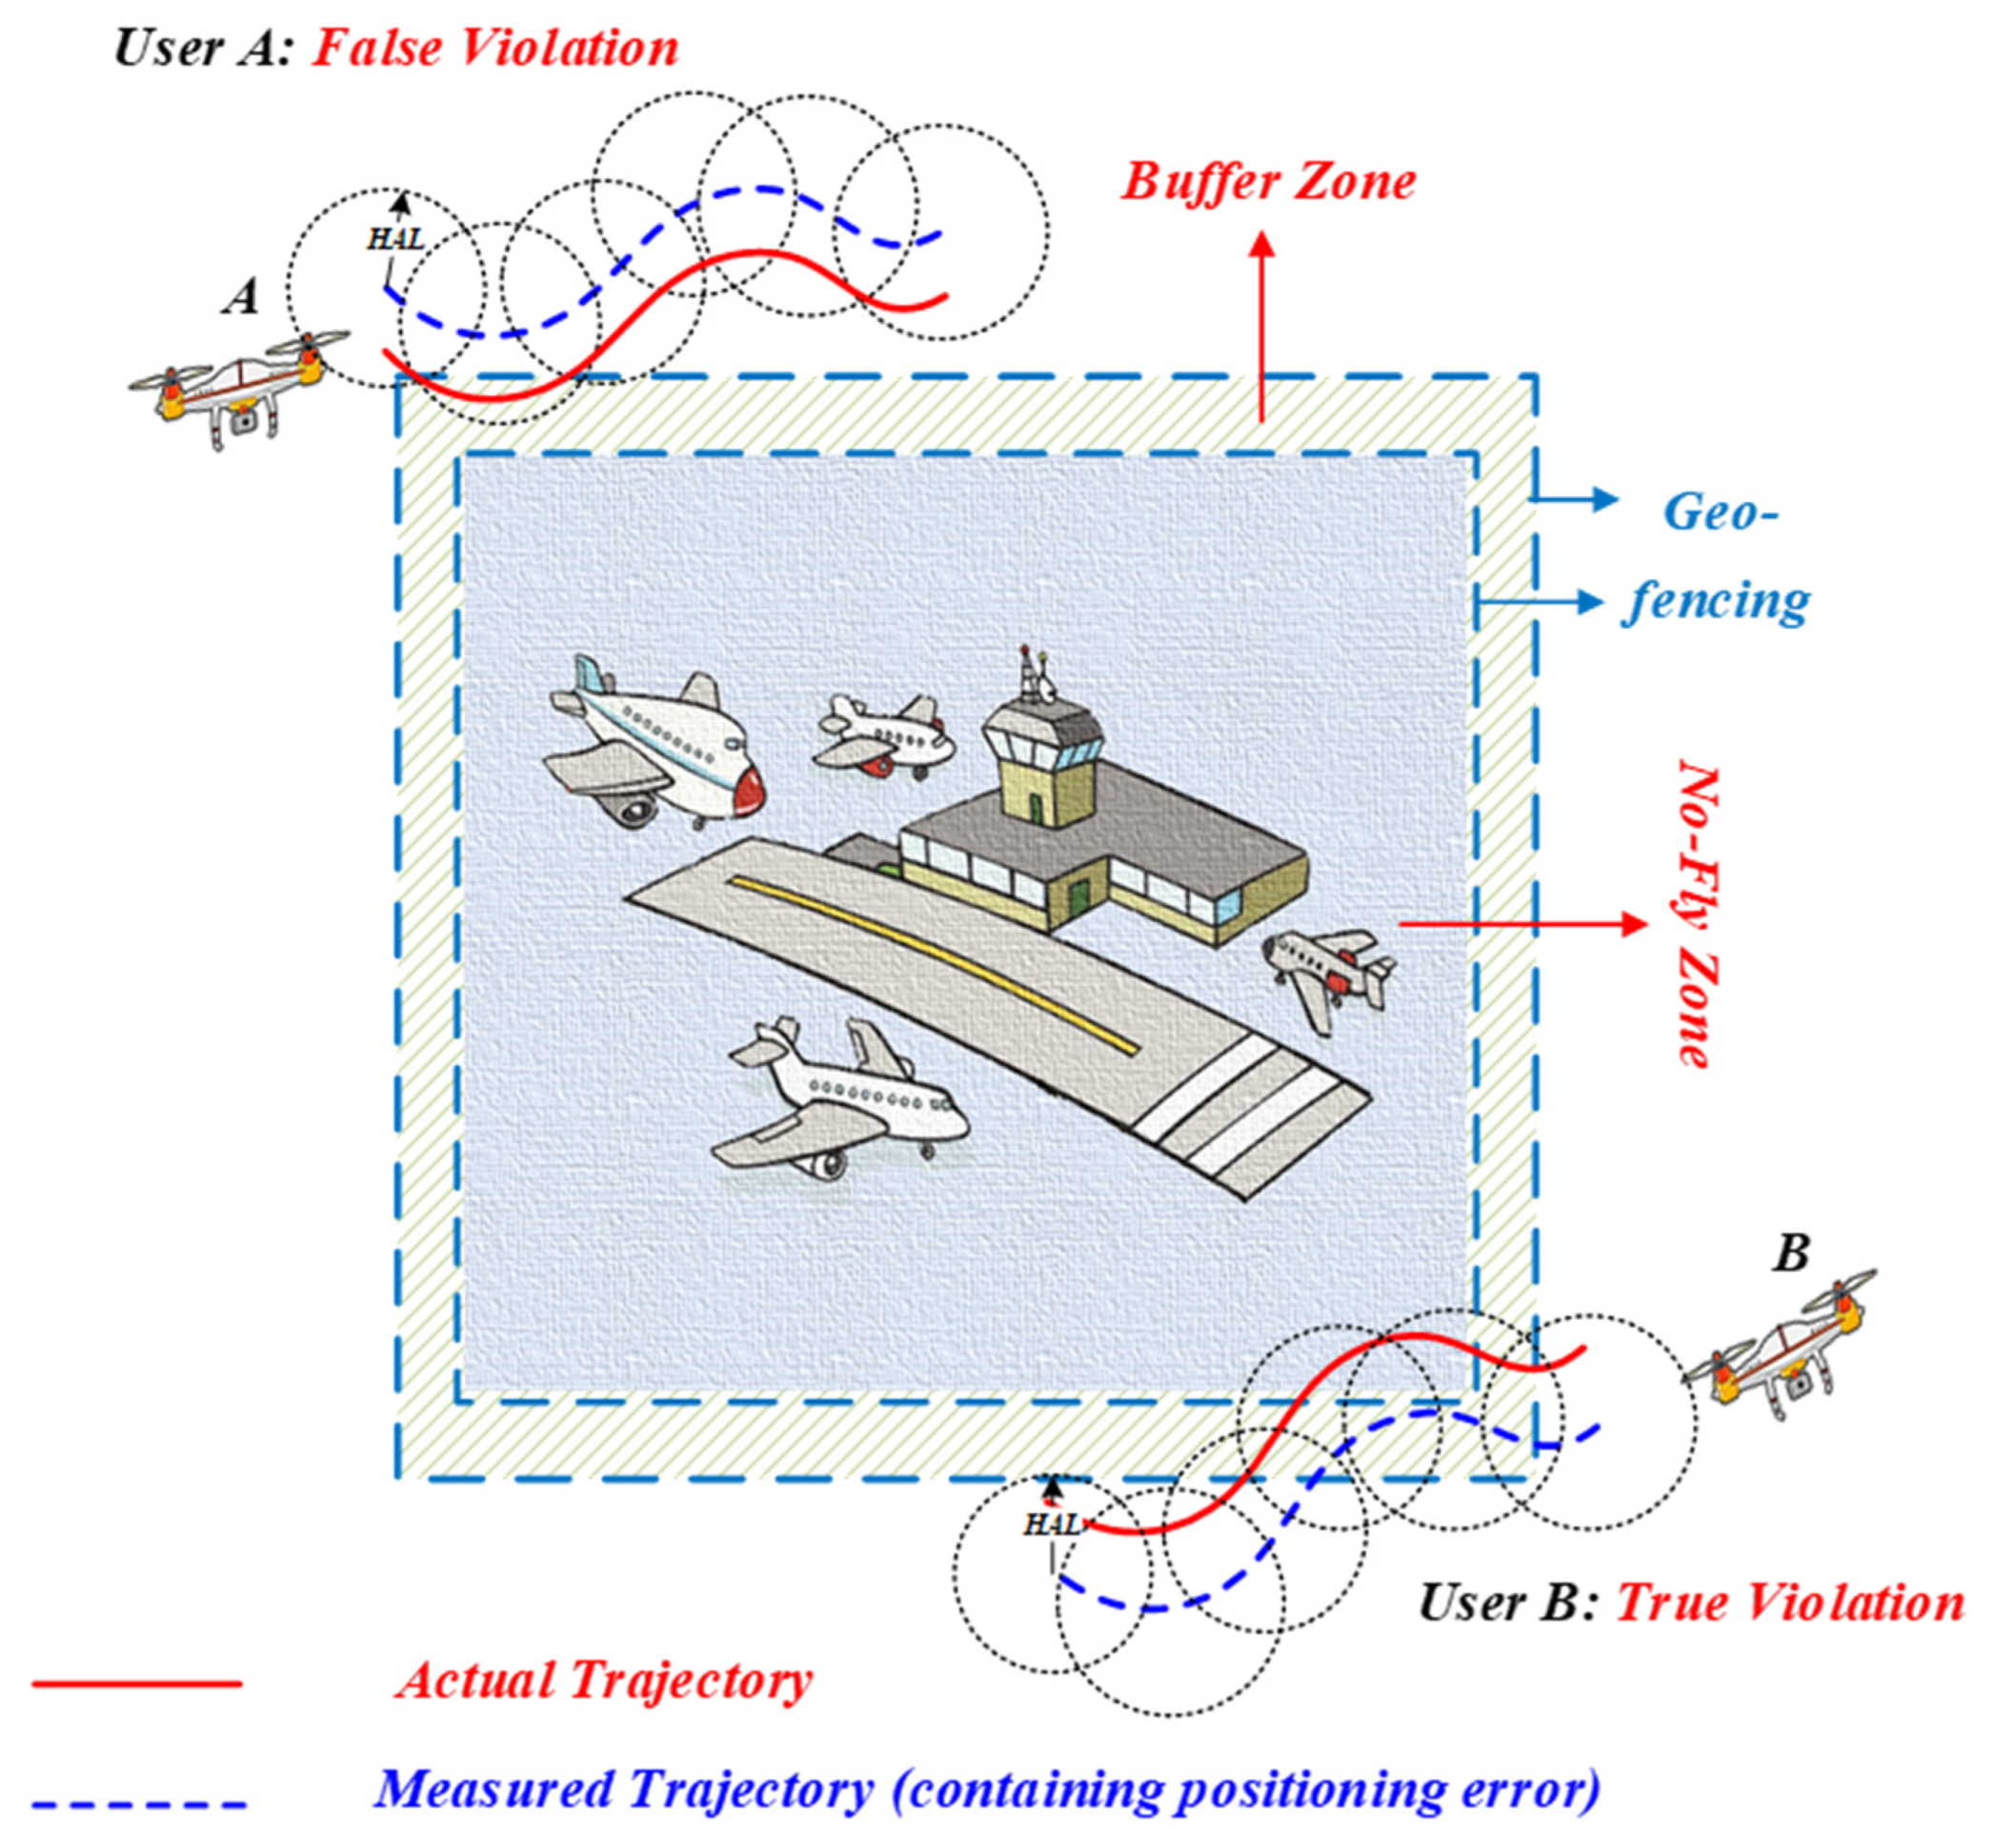
A plan view of a no-fly zone is illustrated in Figure 1. The blue area is the no-fly zone created through geo-fencing, a specific airspace restricted to specific activities such as military (e.g., bases), commercial aviation (e.g., airports), and other secured protected areas. Therefore, unauthorized entry of UAVs into such areas is prohibited. Considering the inevitability of navigation error and some unforeseen circumstances, a buffer zone (the dashed area) is added to provide redundancy to the passing air vehicles to protect the no-fly zone from being violated. There is a negative correlation between the extent of the buffer zone and the positioning error, i.e. the smaller the position error is, the smaller the extent of the buffer zone. In this case, we can relate the width of buffer zone with the maximum horizontal position error, i.e., the horizontal alert limit, which is further analyzed in Section 3.4. When the circle of uncertainty of the estimated UAV position whose radius represents the horizontal alert limit intersects the buffer zone, an alarm is issued.
The UAV navigation system alongside a supporting management module is designed for “friendly” (those unintended to make trouble) UAV users or entities. The no-fly zone management module on the management client can allow an administrator to add or delete temporary no-fly zones on a map. The main functions of flight management systems include: application of flight plan, monitoring and extraction of flight information, and countering unauthorized flights. In particular, prevention of UAV violation of restricted zones is a key function of the system. If the UAV is on course to enter the buffer zone unintentionally, the control software should correct the UAV trajectory away from the no-fly zone and send an “intrusion alert” to the UAV operator and owner of the no-fly zone. In order to support the violation detection, the related requirement must be clarified. Typical requirements of the GNSS/INS integration based no-fly zone management system include the service level requirements and the navigation or system level requirements. The service level requirements are mainly measured by violation detection rate, false detection rate, and misdetection rate, while the navigation systems, the underpinning technologies to support this user level requirement, include positioning level and integrity level requirements.
3.2. Requirements at Service Level
The UAV no-fly zone management system should only detect and collect the positioning data for each UAV that crosses the boundary of the buffer zone. The detection technique is commonly considered as belonging to the so-called geo-fencing techniques, in which the alarm function is referred to as an intrusion alert. When the estimation of the location of a UAV and its intent proximate and in the direction of the outer boundary of the buffer zone, the intrusion alert should be triggered so that the user can maneuver the UAV away from the zone as soon as possible.
The performance of violation events detection could be illustrated in Table 1.
In Table 1, there are two successful scenarios (correct detection and correct non-detection) and two unsuccessful scenarios (missed detection and false detection). Missed detection has the potential to result in significantly compromising the safety and security of the no-fly zone, with in some cases those responsible not being punished. Although false detection does not pose a threat to the no-fly zone, it may result in unfair punishment of the operators or wastage of resources by the owner of the non-fly zone and therefore, risks eroding trust in the system. Thus, both missed detection and false detection have a negative impact on the system, necessitating their probabilities of occurrence to be low (typical values of 10−3 and 10−5 per hour, respectively).
3.3. Requirements at Positioning Level
Accuracy is the basic element in positioning techniques and is of great importance to violation event detection for UAV no-fly zone management. Based on the RNP approach applied in our previous work on UAV, 5 m (95%) accuracy was specified. In particular, the spatial requirements for UAV landing were considered, as a UAV could be hijacked for malicious purposes [27]. Therefore, considering the importance of UAV no-fly zone management and the relationship to other applications, such as that discussed above, this paper adopts 5 m at the 95th percentile for the accuracy requirement, which means that the probability of position errors larger than 5 m should be at most 5%.
3.4. Requirements at Integrity Level
Navigation system integrity monitoring is critical to no-fly zone management, as it is the parameter most directly related to mission (e.g., safety) criticality. The definition of related indicators for integrity, including horizontal alert limit (HAL), target integrity risk (TIR), and horizontal protection level (HPL), are described as follows.
- Horizontal alert limit (HAL): this is the maximum horizontal position error () that must not be exceeded without issuing an alert to the user. A horizontal position failure (HPF) occurs when the exceeds the .
- Target integrity risk (): this is calculated by multiplying the probability of position failure and the probability of missed detection in Equation (1). is typically very low (e.g., 1E−7) for mission critical (e.g., safety of life) applications.
- Horizontal protection level (): the threshold value of the that satisfies the . Thus, should bound the position error in line with the . The probabilistic relationship is expressed as:
The should be computed in real time to examine the availability of integrity algorithm and to provide a position-domain check if the final solutions could be used for navigation. Only the horizontal condition is considered because it is enough for the intrusion detection of the no-fly zone management. An integrity alert is triggered when the exceeds , indicating the unavailability of the integrity monitoring of the system. When the integrity alert is issued, the user should also give a resolution order to the UAV if the UAV location is around the no-fly zone.
When determining the target integrity risk, we follow the assumption made in traditional RAIM on the basis of a nominal eight-satellite-in-view situation: the position failure rate is chosen as 10−4 per hour, and the missed detection rate is chosen as 10−3 per hour. Hence, will be 10−7 per hour. Thus, we have the worst-case violation rate for UAV no-fly zone management: per year, which is fairly tolerable.
The required is correlated with the required horizontal accuracy and distribution. The required accuracy, 5 m as we determined, is specified at 95th percentile. When the goes beyond 5 m but still within the , the system is degrading but still available. Once the exceeds the , the maximum allowable value, the system exhibits loss of integrity. Given that the empirical distribution usually tends to have much heavier tails than Gaussian, we specify the value of as 50 m. The specification of seems to be generous on account that: (1) we are more pessimistic in the “tails” of error distribution; (2) the overbounding value, i.e., , should be between and , thus the should not be too tight to ensure the basic availability of the system.
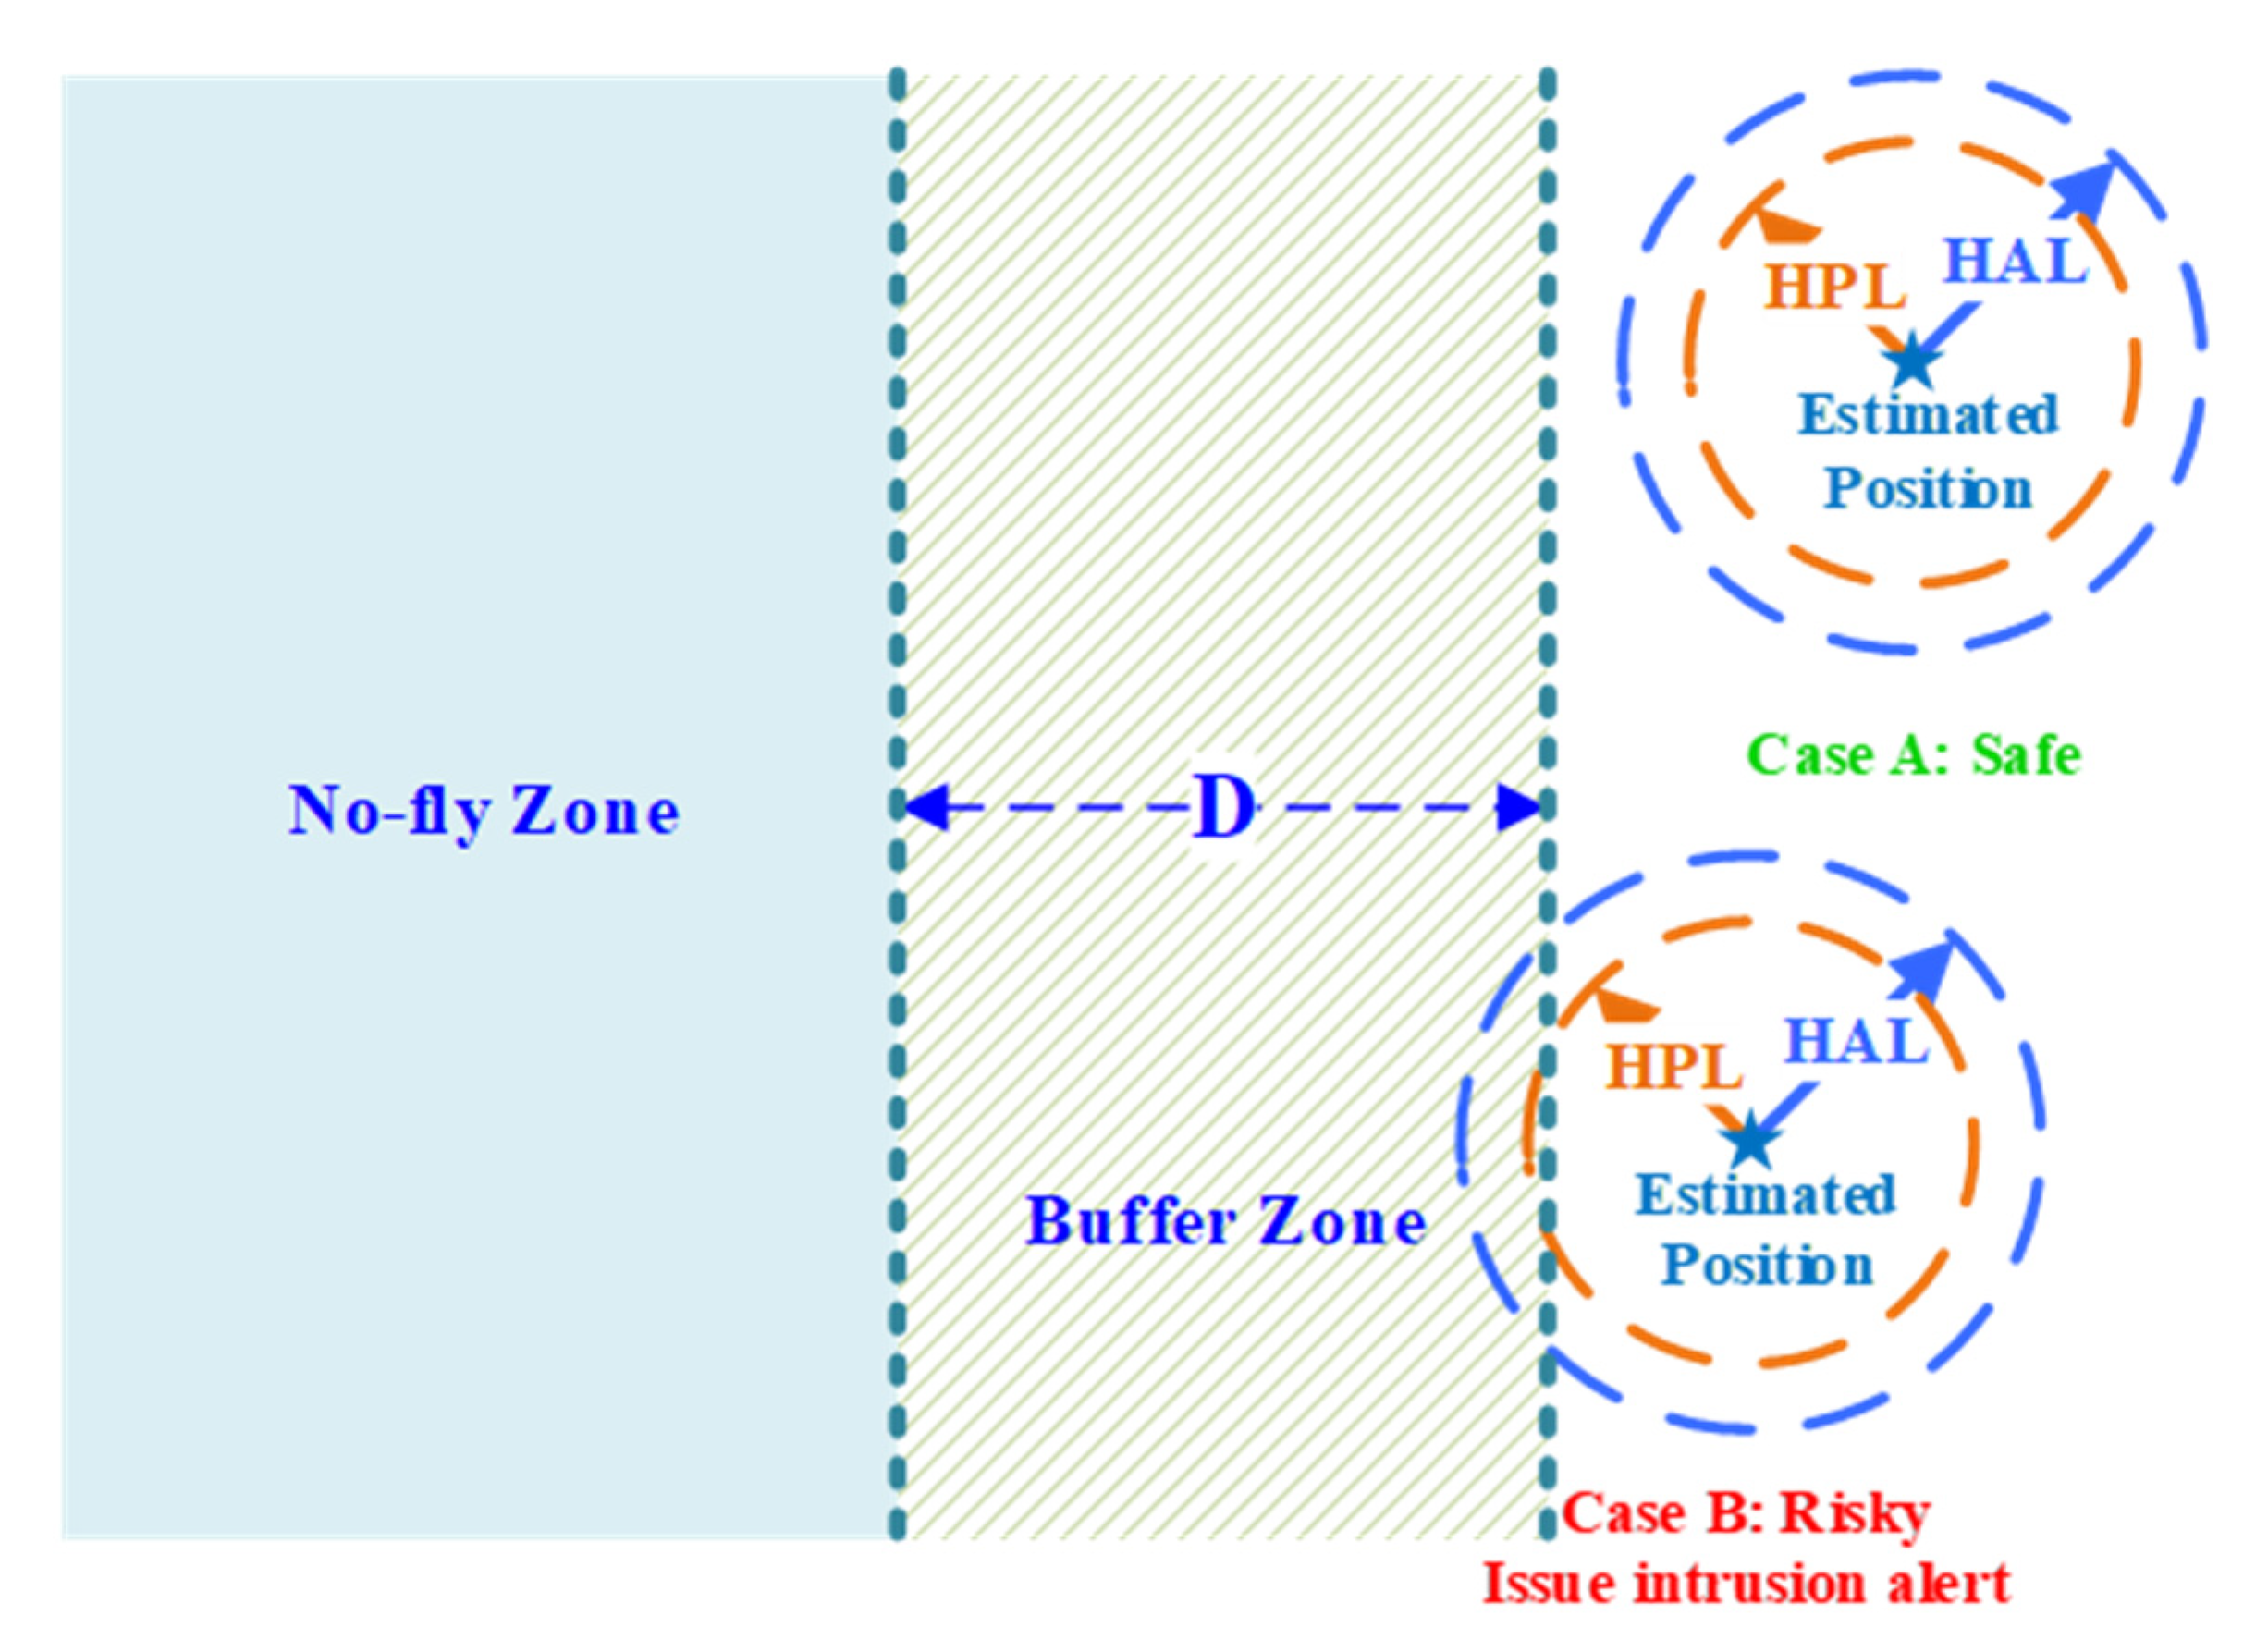
The determination of can be an important reference when we designate the buffer zone (see Figure 2), while the navigation system integrity is available, i.e., , the circle with the estimated UAV position at the center and the radius of should be outside of the buffer zone. Once the circle overlaps the buffer zone, a risky event happens, and an intrusion alert must be issued at once. We can conclude that the minimum width of buffer zone should be the value of in case of intrusion into a no-fly zone.
4. Integrated Navigation with Integrity Monitoring for the UAV No-Fly Zone Management
4.1. System Framework
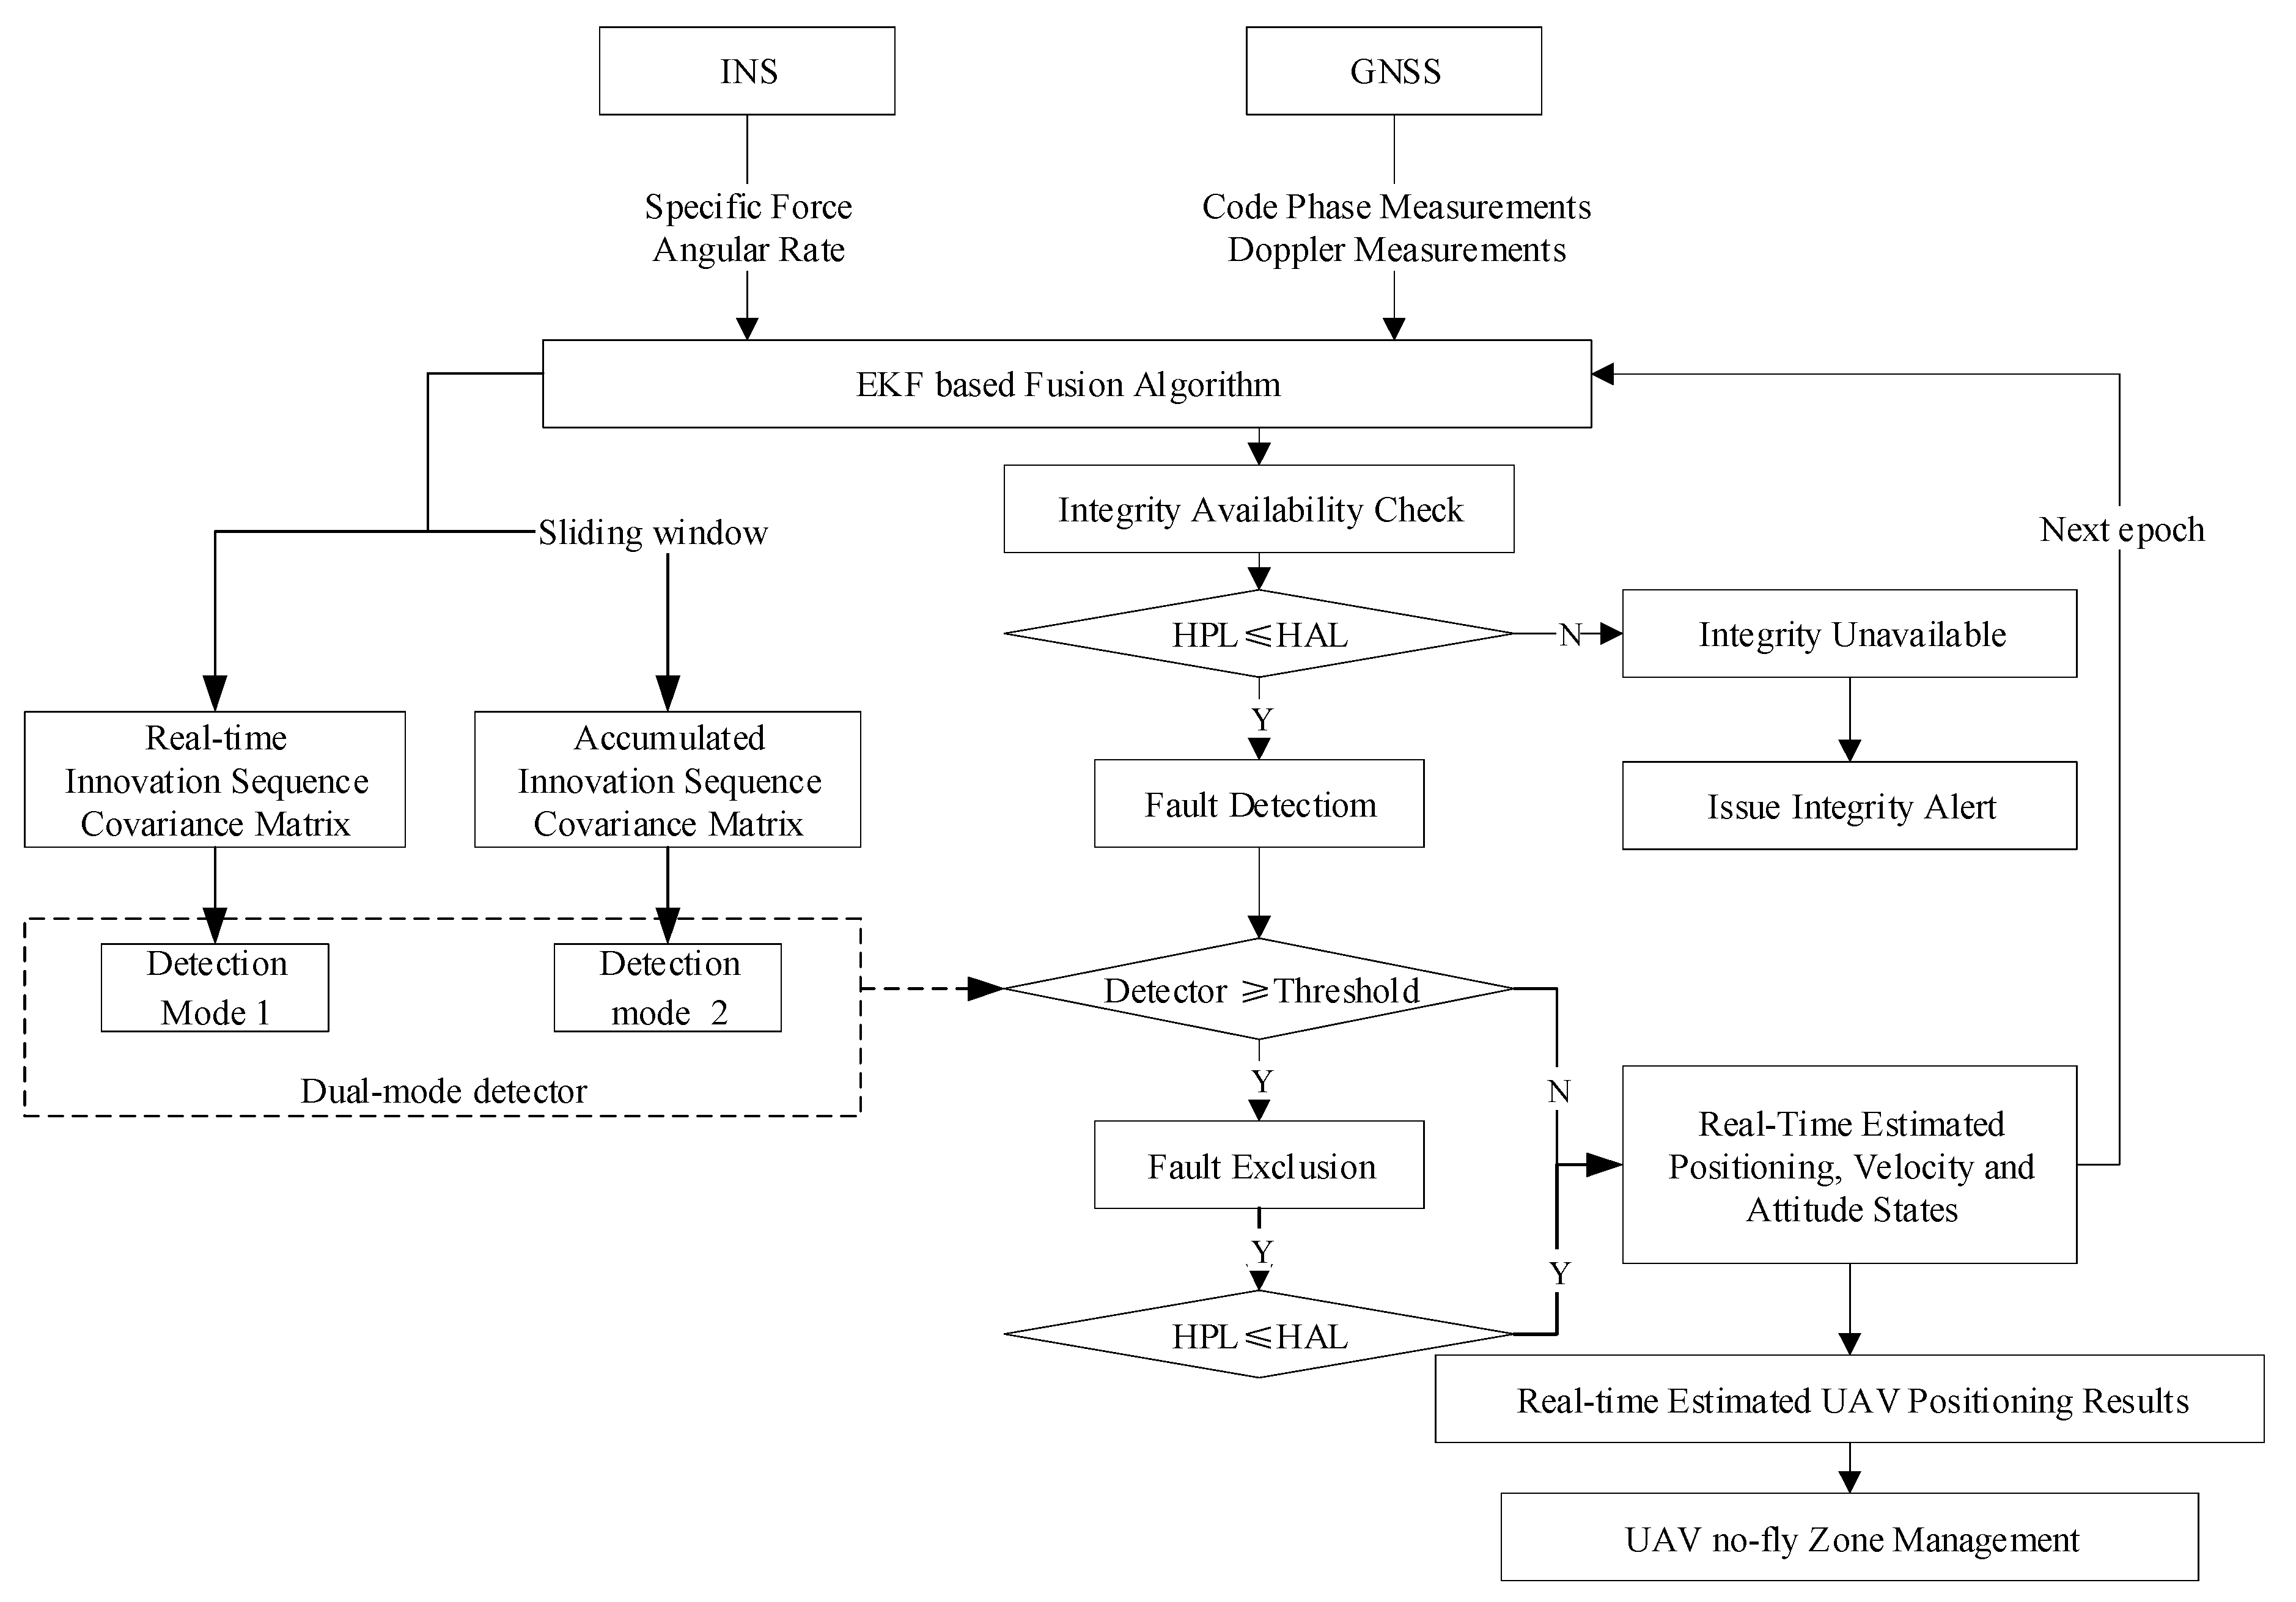
A flow chart of the designed integrated navigation system with integrity monitoring is depicted in Figure 3. The positioning algorithm is realized by fusing the GNSS code phase/Doppler measurements and INS specific force/angular rate measurements. The algorithm starts from the availability check by calculating , which is compared with . The computation of uses information, including satellite geometry, measurement distribution assumption etc. to determine if the integrity monitoring function is available. If is larger than , the integrity is considered as unavailable with an integrity alert issued. Otherwise, the conditions suffice to perform fault detection. Dual detectors were constructed based on the innovation sequence generated in the Kalman filter for step and ramp errors detection, respectively. If the value of the detector is larger than the predefined threshold, then fault exclusion is executed. After exclusion, is re-calculated and compared with again. The navigation solutions can be considered as trustable when computed is equal or smaller than . After FDE, the system outputs the navigation solutions and the process repeated at the next epoch. The real-time estimated UAV results with integrity are used to support the UAV no-fly zone management.
4.2. Tightly Coupled GNSS/INS Integration
In this section, an Extended Kalman Filter (EKF)-based, tightly coupled GNSS/INS data fusion is designed to output the KF innovation, the basis for the integrity monitoring. The steps are as follows.
The defined state vector for the EKF is:
where is composed of INS position error vector expressed in the Earth Centered Earth Fixed (ECEF) coordinates ; INS velocity error vector expressed in the ECEF coordinates ; INS attitude error vector (roll, yaw, and pitch error separately); gyroscope three-axis bias vector and scale factor vector ; accelerometer three-axis bias vector and scale factor vector ; GNSS receiver clock bias and GNSS receiver clock drift .
The UAV system model is then formed as a first-order state equation in (4):
where is the first derivative of the state vector , is the dynamic transition matrix, is the noise driven matrix, and is the system noise.
The measurement model is given by:
where is the measurements, is the measurement mapping matrix, and represents the measurement noise. In this paper, if the number of visible satellites is , the pseudo-range error and the Doppler measurement error are used to form measurement vector as:
where and denote INS derived pseudo-range and Doppler measurements respectively. and refer to pseudo-range and Doppler measurements decoded from GNSS observation data, respectively. Systematic error (tropospheric, ionospheric, clock related error, etc.) corrections were applied in advance to .
After discretization of (4) and (5), the discrete form of Kalman filtering procedure can be split into two stages as follows:
Prediction stage:
Update stage:
where,
: system state vector estimates at time epoch
: system transition matrix at time epoch
: error covariance matrix at time epoch
: system noise covariance matrix at time epoch
: measurement noise covariance matrix at time epoch
: measurement matrix at time epoch
: Kalman gain matrix at time epoch
: matrix/vector propagation from time epoch to
4.3. Integrity Monitoring Algorithm
The process of integrity monitoring includes fault detection, exclusion, and real-time HPL computation. The steps for the proposed integrity monitoring algorithm are as follows.
1. Dual-mode detector determination
A dual-mode detector is generated based on the EKF innovation and its covariance matrix. The first mode of the detector is formed using the real-time measurements to detect step errors. The second mode of the detector is generated by using both historical and current measurements. In particular, the averaging mechanism with windowing size of 10 (from experience) is applied in the second mode of the detector for fast detection of ramp errors.
The innovation sequence in the Kalman filter is generated for fault detection and system state monitoring:
exhibits a white Gaussian sequence of mean zero and covariance where [28].
The first mode of detector is expressed as:
The innovation sequence accumulated by a sliding window can be effective for the detection of ramp errors. The innovation generated during the extrapolation process is expressed as:
where T is the length of the sliding window, and . Considering the changeable satellite state in the current sliding window, we may shorten the size of the sliding window during the process (e.g., for the cases when the number of satellites decreases/increases or the visible satellites change). In these cases, the size of the sliding window is changed to −1 once the changes of the satellite state are detected at the th epoch.
Hence, the second mode of the detector is given as:
where,
The test statistic exhibits central chi-square distribution for fault-free cases and non-central chi-square distributions for faulty conditions [25].
2. Detection threshold
The detection threshold is also determined based on the chi-square distribution and is selected based on the false alert rate , whose value is related to different phases of flight. The in-between relationship is given by:
where denotes the probability density of the chi-square distribution, and is the degrees of freedom. The detection threshold can thereby be calculated accounting for the maximum allowable of 10−5/hr and the number of satellites-in-view (see Table 2).
3. Fault exclusion
Following fault detection, fault exclusion is proposed based on the w-test. Test statistic errors can be mapped to the measurement for the fault exclusion based on the w-test as follows [29].
Integrating the predicted state with the measurement vector , the extended measurement model is expressed as:
where .
The error covariance matrix of the extended measurement vector is:
The optimal estimates for the error covariance matrix of the predicted system error states is:
The cofactor matrix of the filtering residuals is:
The test statistics for fault exclusion is:
where,
= residual vector of measurement vector
= residual vector of predicted system state vector
= identity matrix
= a unit vector with its th component is 1 and other components are 0.
The measurement with the largest value is selected as the candidate fault and is excluded.
4. Horizontal protection level computation
Protection level computation is performed twice for integrity availability check and dependability check of the final navigation solutions in the position domain, see Figure 3. The computation of is the combination of two limits [26]:
is given by 5.33 where is determined from the horizontal position error covariance matrix, and 5.33 is chosen to reflect the missed detection rate of 10−3/hr.
The determination of is similar to the traditional maximum-slope method based RAIM given by:
where,
is the horizontal position error due to measurement
is the bias in measurement
is the transformed residual formed by the introduction of range bias error
and are the latitude and longitude error states in the state vector respectively
is the diagonal matrix of the eigenvalues of the covariance matrix for the innovation
is calculated by:
where is the square-root of the non-centrality parameter of the chi-square distribution that would make the probability of missed detection rate equal to 10−3/hr.
Then, we can obtain by:
5. Field Test and Results Analysis
5.1. Data Collection and Sensitivity Analysis
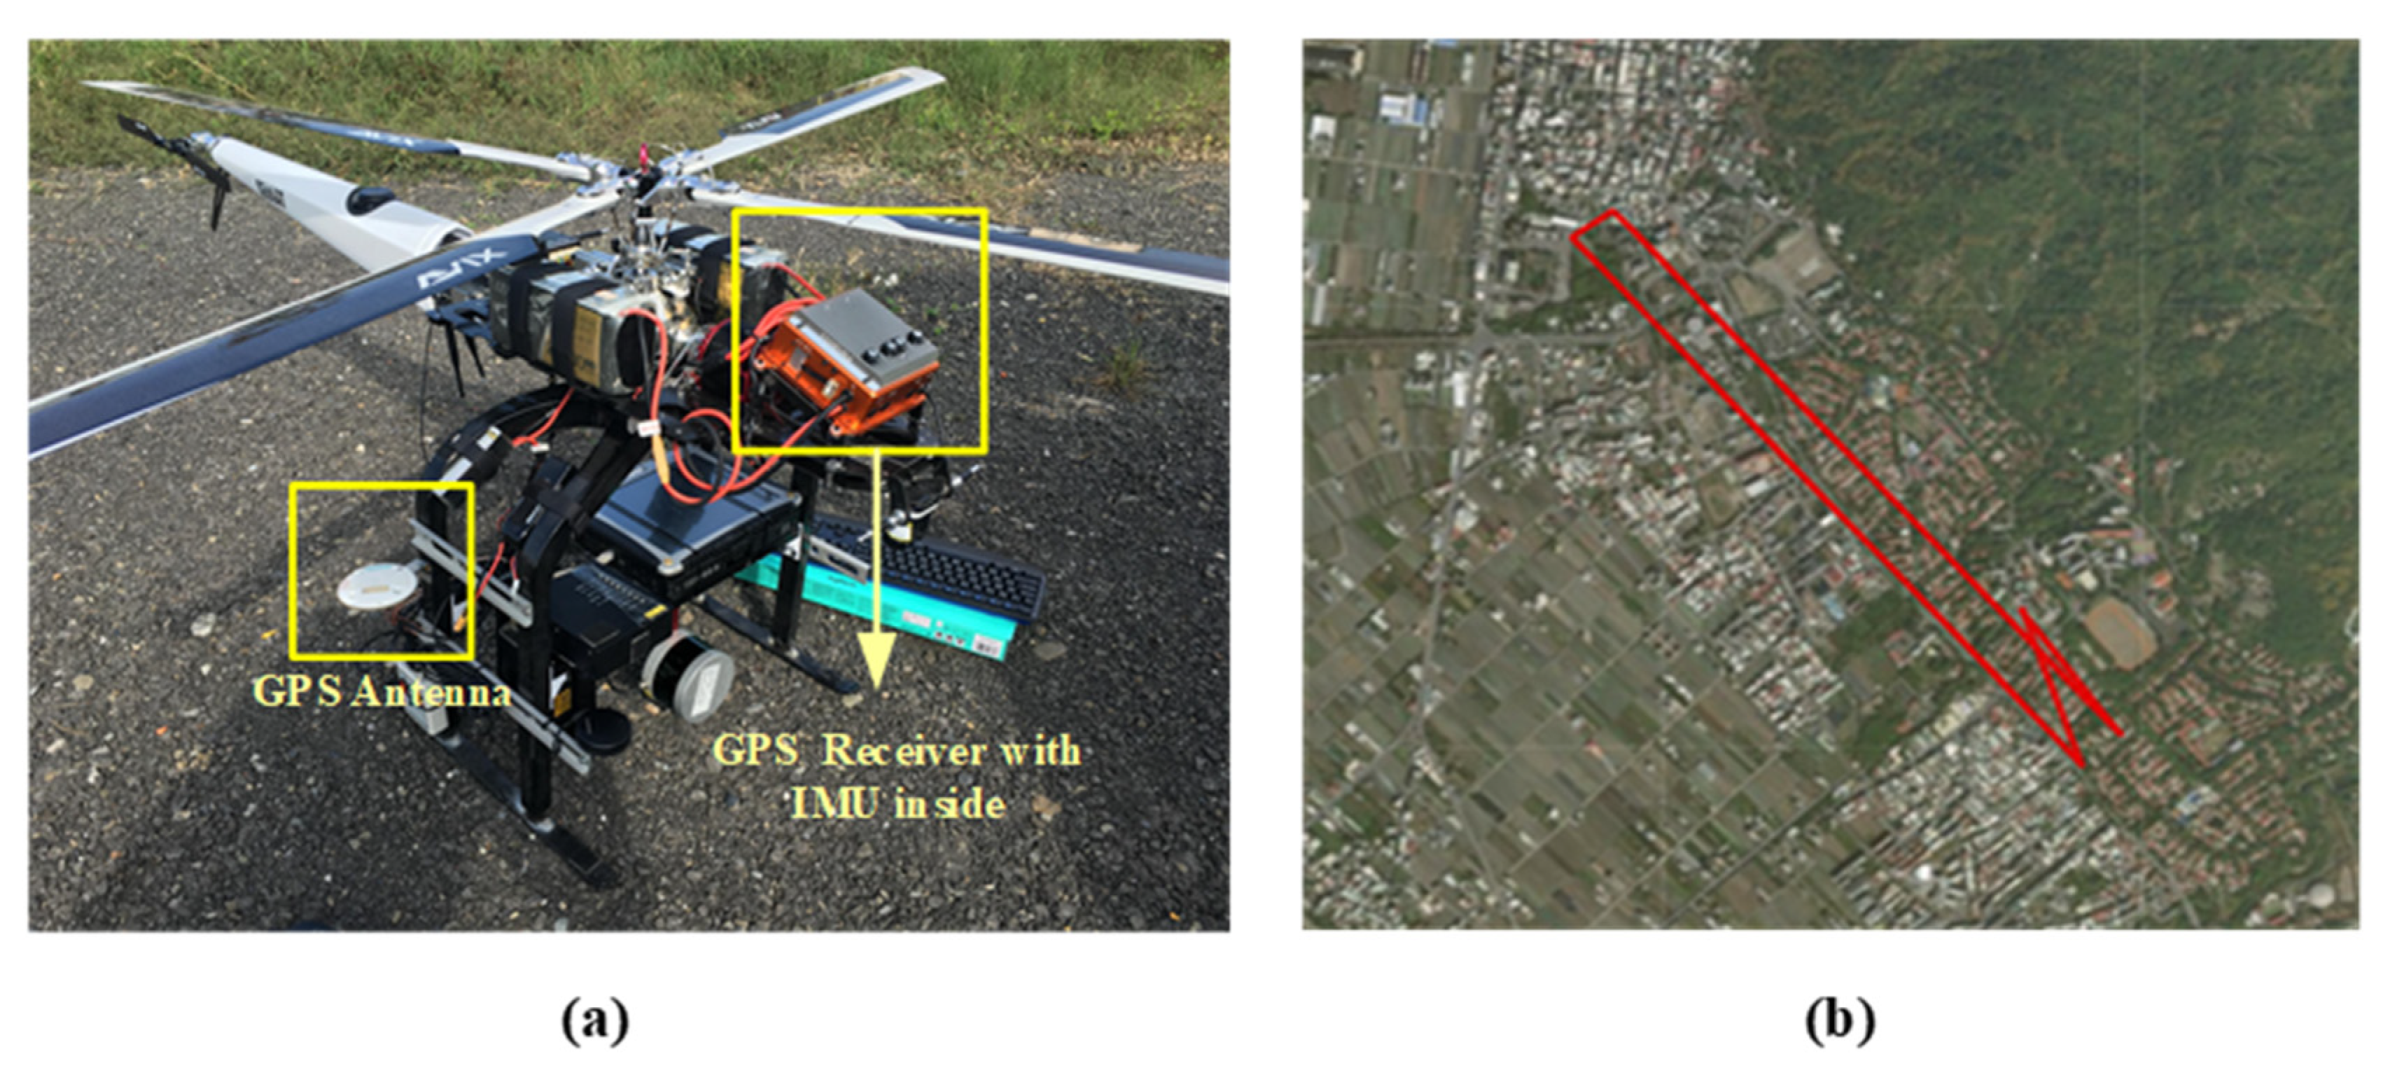
In order to validate the proposed positioning and integrity algorithm of the on-board GNSS/INS integrated system for the no-fly zone based UAV management, a field test was carried out in Nantou City, Taiwan. The UAV flight route is shown in Figure 4b. The UAV used in the test is AXH-E230 from AVIX Technology. The real-time three-axis yaw rates and accelerations were collected from gyroscopes and accelerometers of the onboard MEMS INS, STIM-300 from Sensonor, and the raw pseudorange and velocity measurements were collected from a dual-frequency GNSS receiver, Trimble BD 982 with a sampling rate of 10 Hz. The experimental setup is shown in Figure 4a. In particular, the reference trajectory used in the experiment was obtained from close range photogrammetry providing centimeter-level positioning accuracy using the on-board VLP-16 Velodyne Lidar. With the collected data, the designed algorithm was tested in a real-time replay mode.
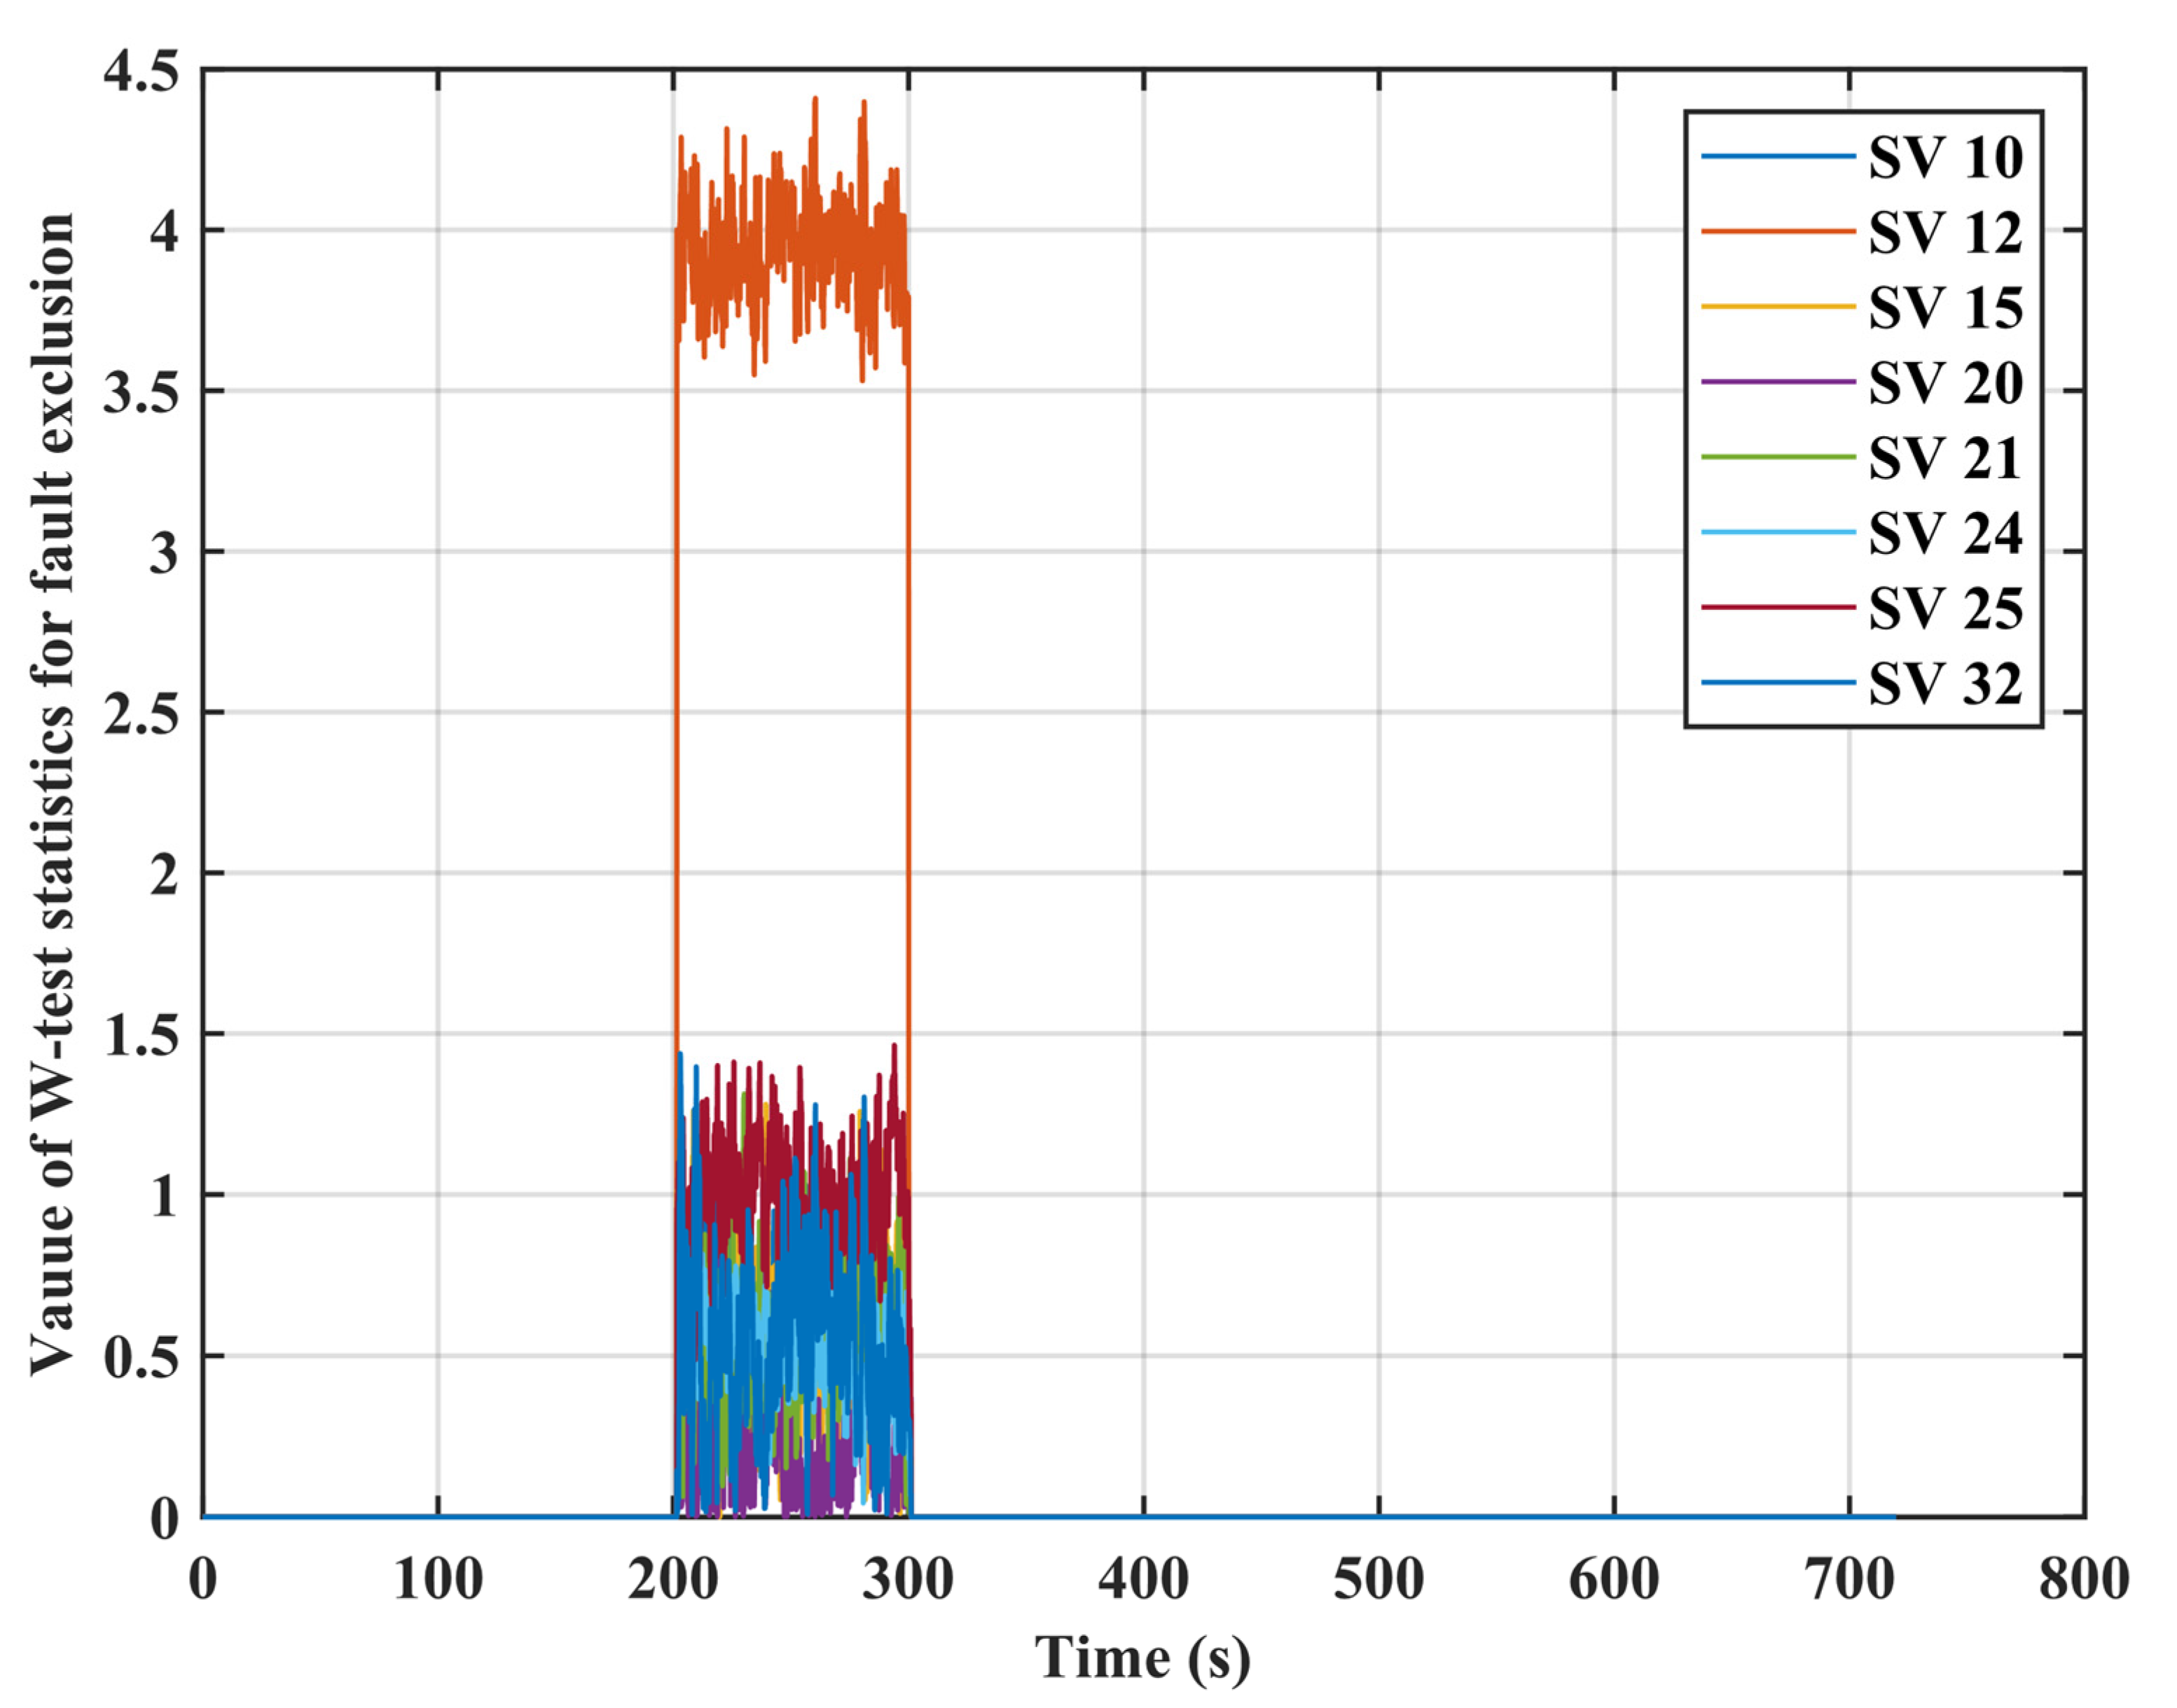
The two defined fault scenarios were added to the real trajectory: (1) step errors in scenario 1 and (2) ramp errors in scenario 2. The details for the two scenarios are described in Table 3. A sensitivity analysis was carried out to evaluate the performance of the algorithm with different ranges and types of error sources added to the trajectory. The eight visible satellites were SV10, SV12, SV15, SV20, SV21, SV24, SV25, and SV32 during the flight. In Scenario 1, step errors ranging from 10 to 90 m were added to the pseudorange measurements from SV12 at an interval of 20 m. The performance statistics of the detector is shown in Figure 5, and the time to detection of the algorithm is shown in Table 4. From the results, the larger the value of the errors in the pseudorange measurement, the easier it is to detect the fault. It is worth noting that the time to detection with 30 to 90 m step faults added is 0.1 s, while it is 1.6 s for a 10 m step error. This indicates that, in the detection of 10 m step error, the detection mode 2, i.e., historical innovation sequence based detection, is triggered by our algorithm. Figure 6 illustrates that SV12 with a 10 m step error is effectively identified and excluded.
Since the difficulty of detection increases when the magnitude of error becomes smaller, the hazardousness of small and undetectable faults must be considered. The sensitivity analysis results show that the dual-mode detector is no longer sensitive when a 3 m step error is added, see Figure 7. The 3D positioning errors with the 3 m step error added to the pseudorange measurements are shown in Figure 8. It can be seen that the positioning accuracy is not affected and therefore, meets the accuracy requirement. Hence, for some non-detected errors, the final positioning accuracy was not affected with the error included in the calculation; therefore, it is tolerable for the no-fly zone based UAV management. The analysis results show the effectiveness of the proposed dual-mode detector with fast detection and exclusion ability to support the UAV management application.
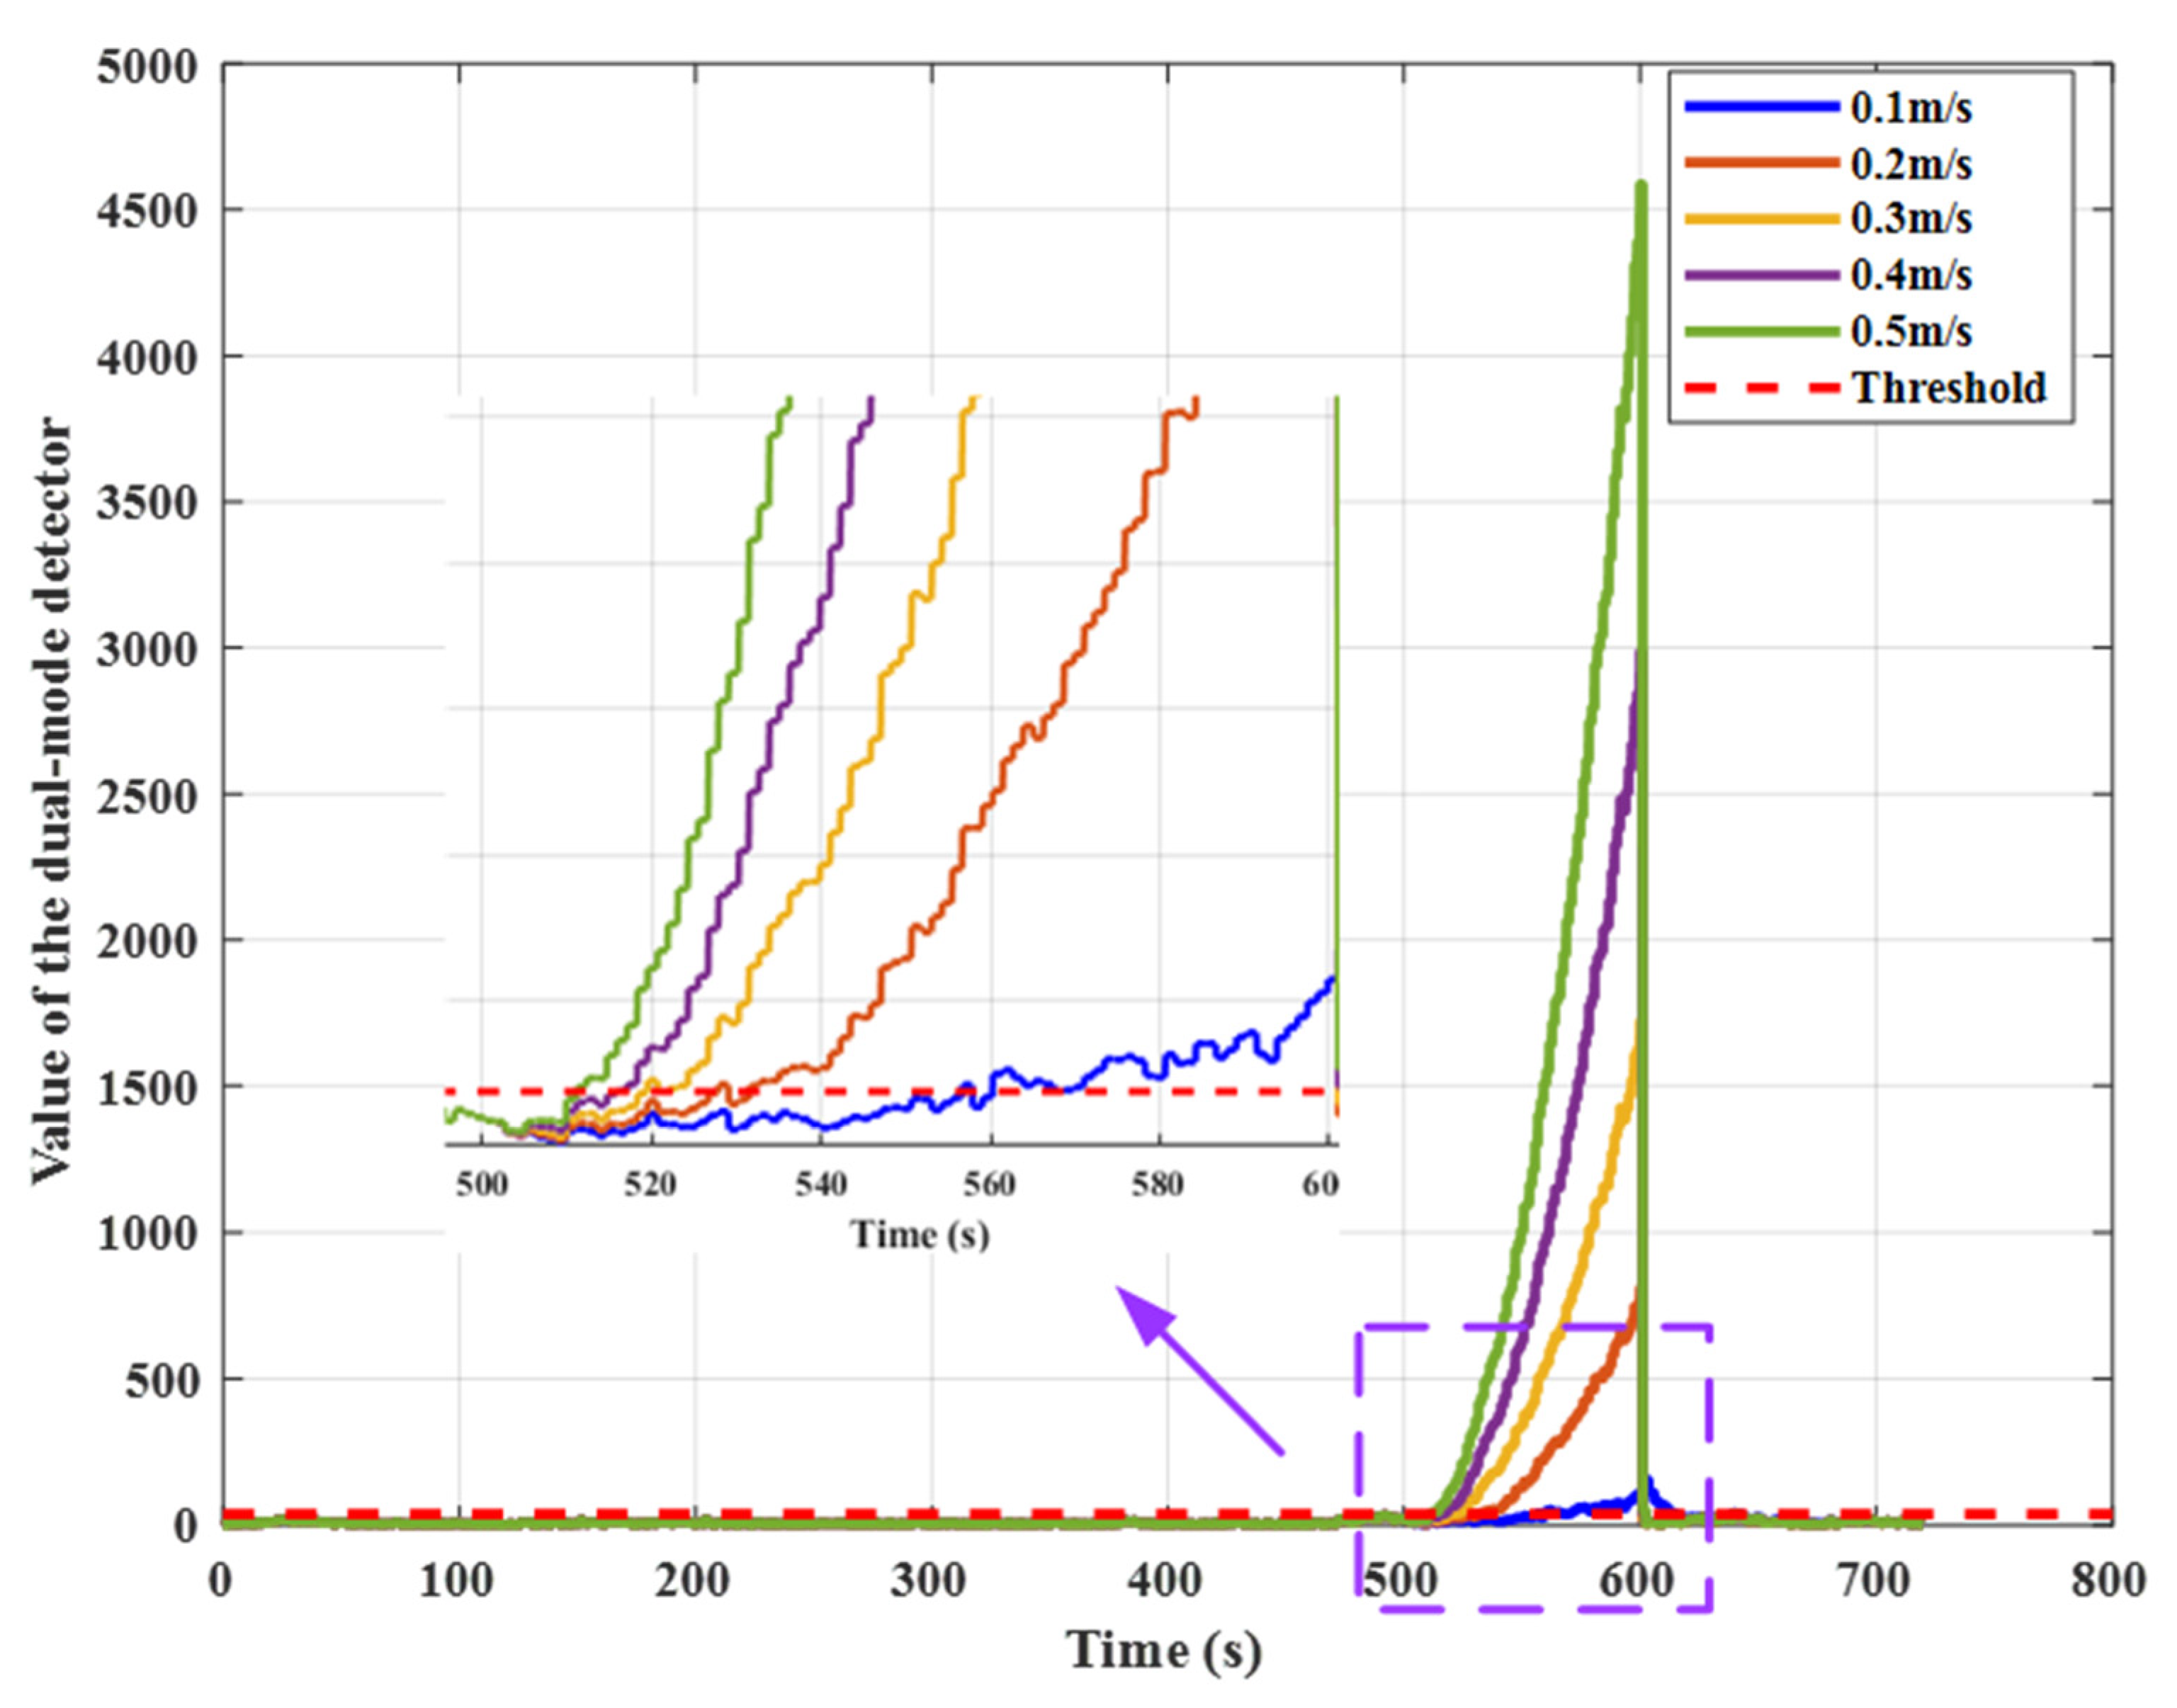
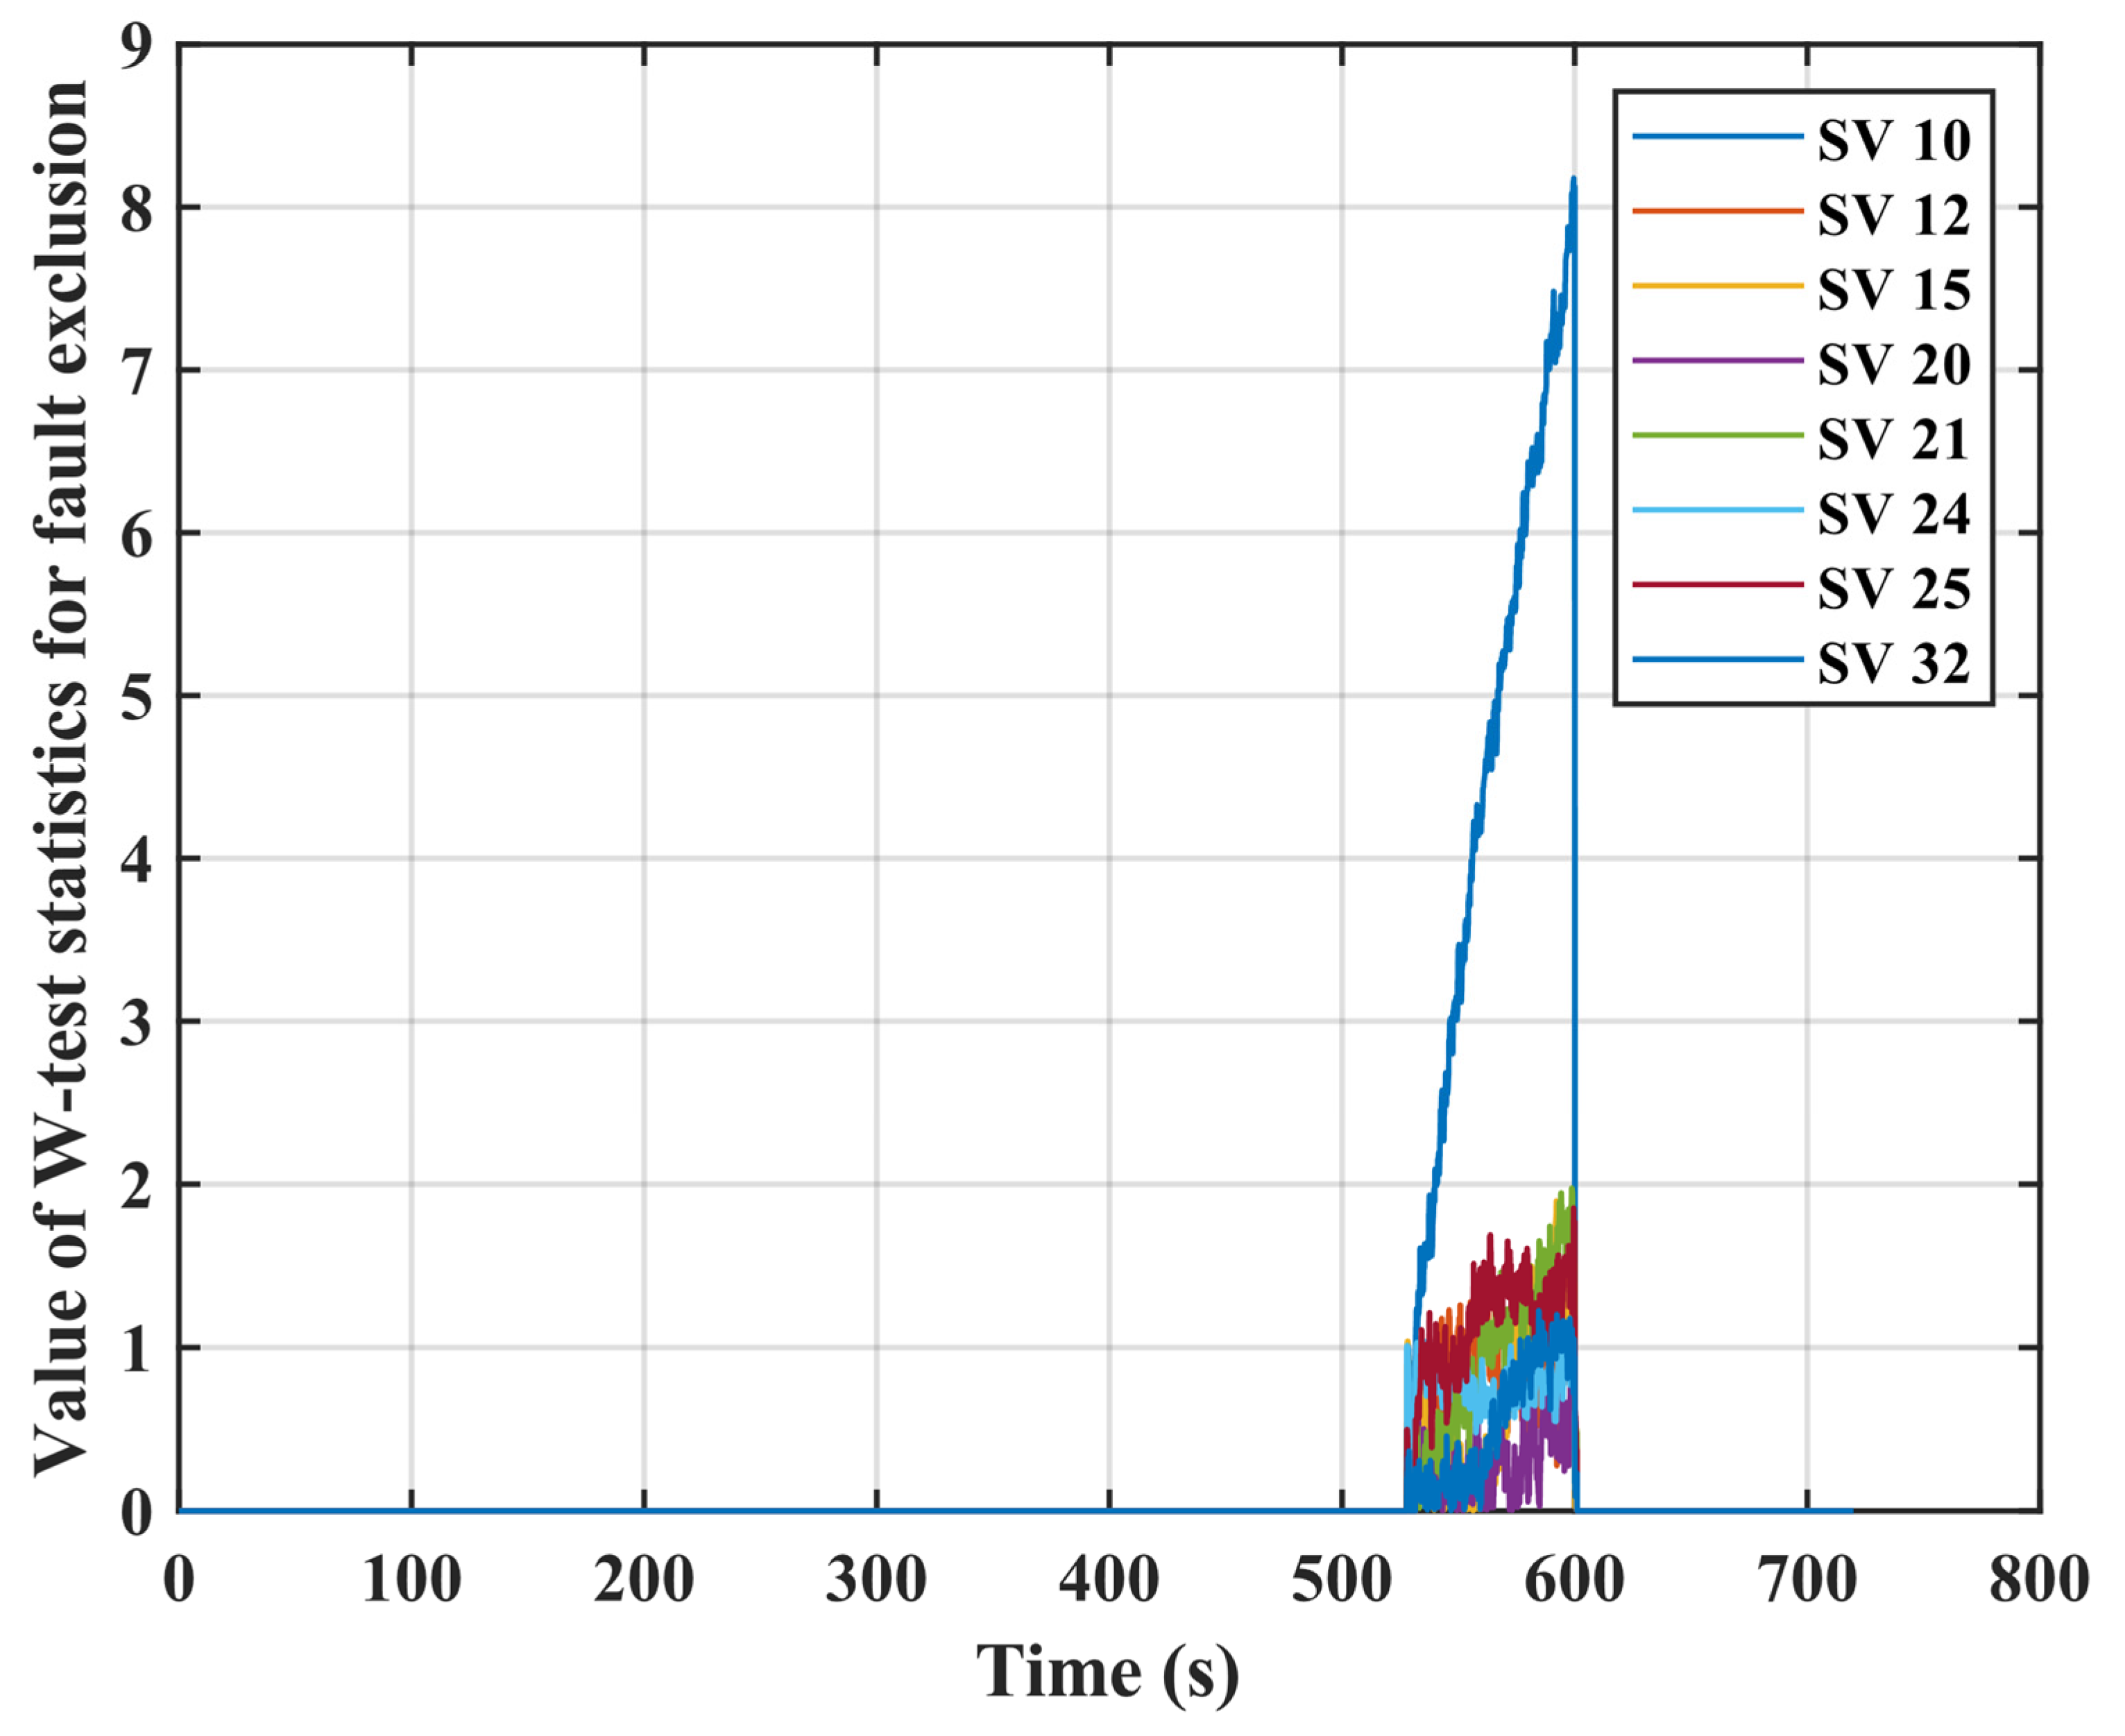
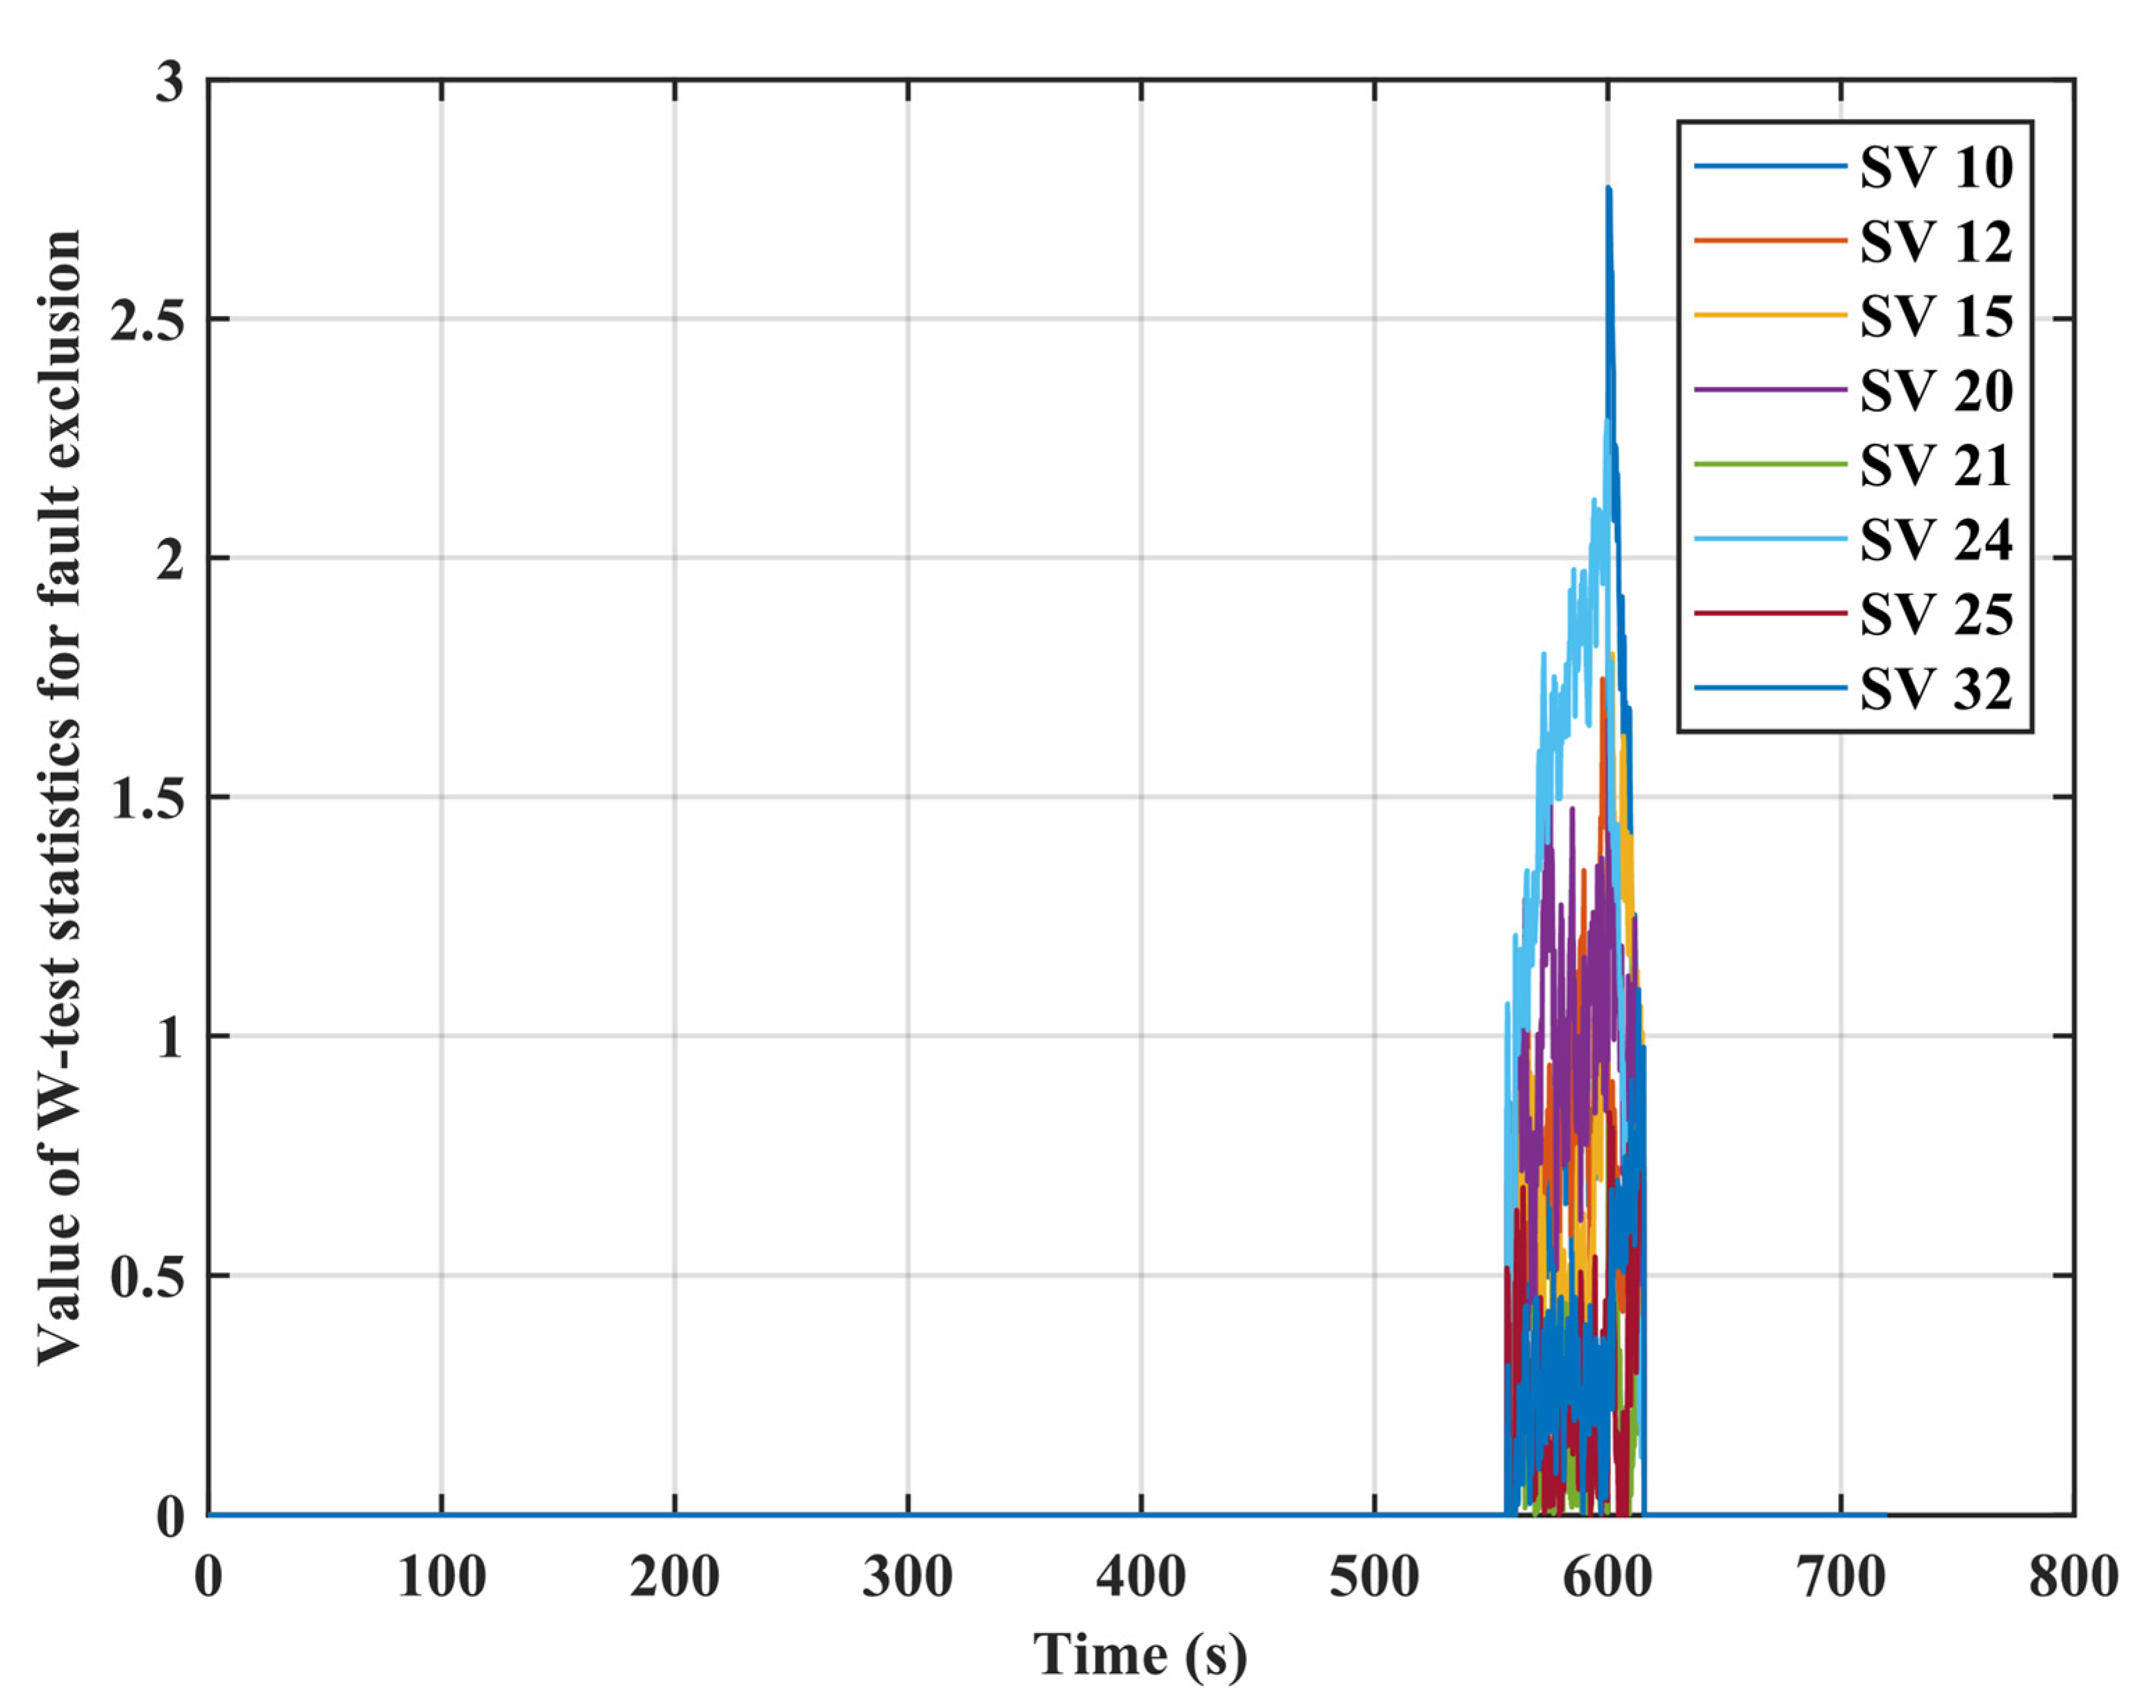
In scenario 2, with the 0.1~0.5 m/s clock drift equivalent range error added to SV10 at an interval of 0.1 m/s, the performance statistics of the detector is shown in Figure 9, and the detection time performance of the dual-mode detector for the ramp error detection is shown in Table 5. It is shown that the errors can be detected by the designed algorithm, and the detection time for the ramp errors varies with the value of the error sources. The larger errors are detected earlier, e.g., the detection time is 11.1 s for the 0.5 m/s errors, while it is 60.3 s for the 0.1 m/s errors. The 0.2 m/s ramp error added to SV 10 during 500 s–600 s is effectively identified and excluded (see Figure 10). However, although the 0.1 m/s ramp error could be detected within 60.3 s, it is not be excluded by our algorithm, see Figure 11. This implies that, with the 0.1 m/s ramp error added, the intercorrelation between the w-test statistics increased and thus invalidated the fault exclusion ability of W-test statistics.
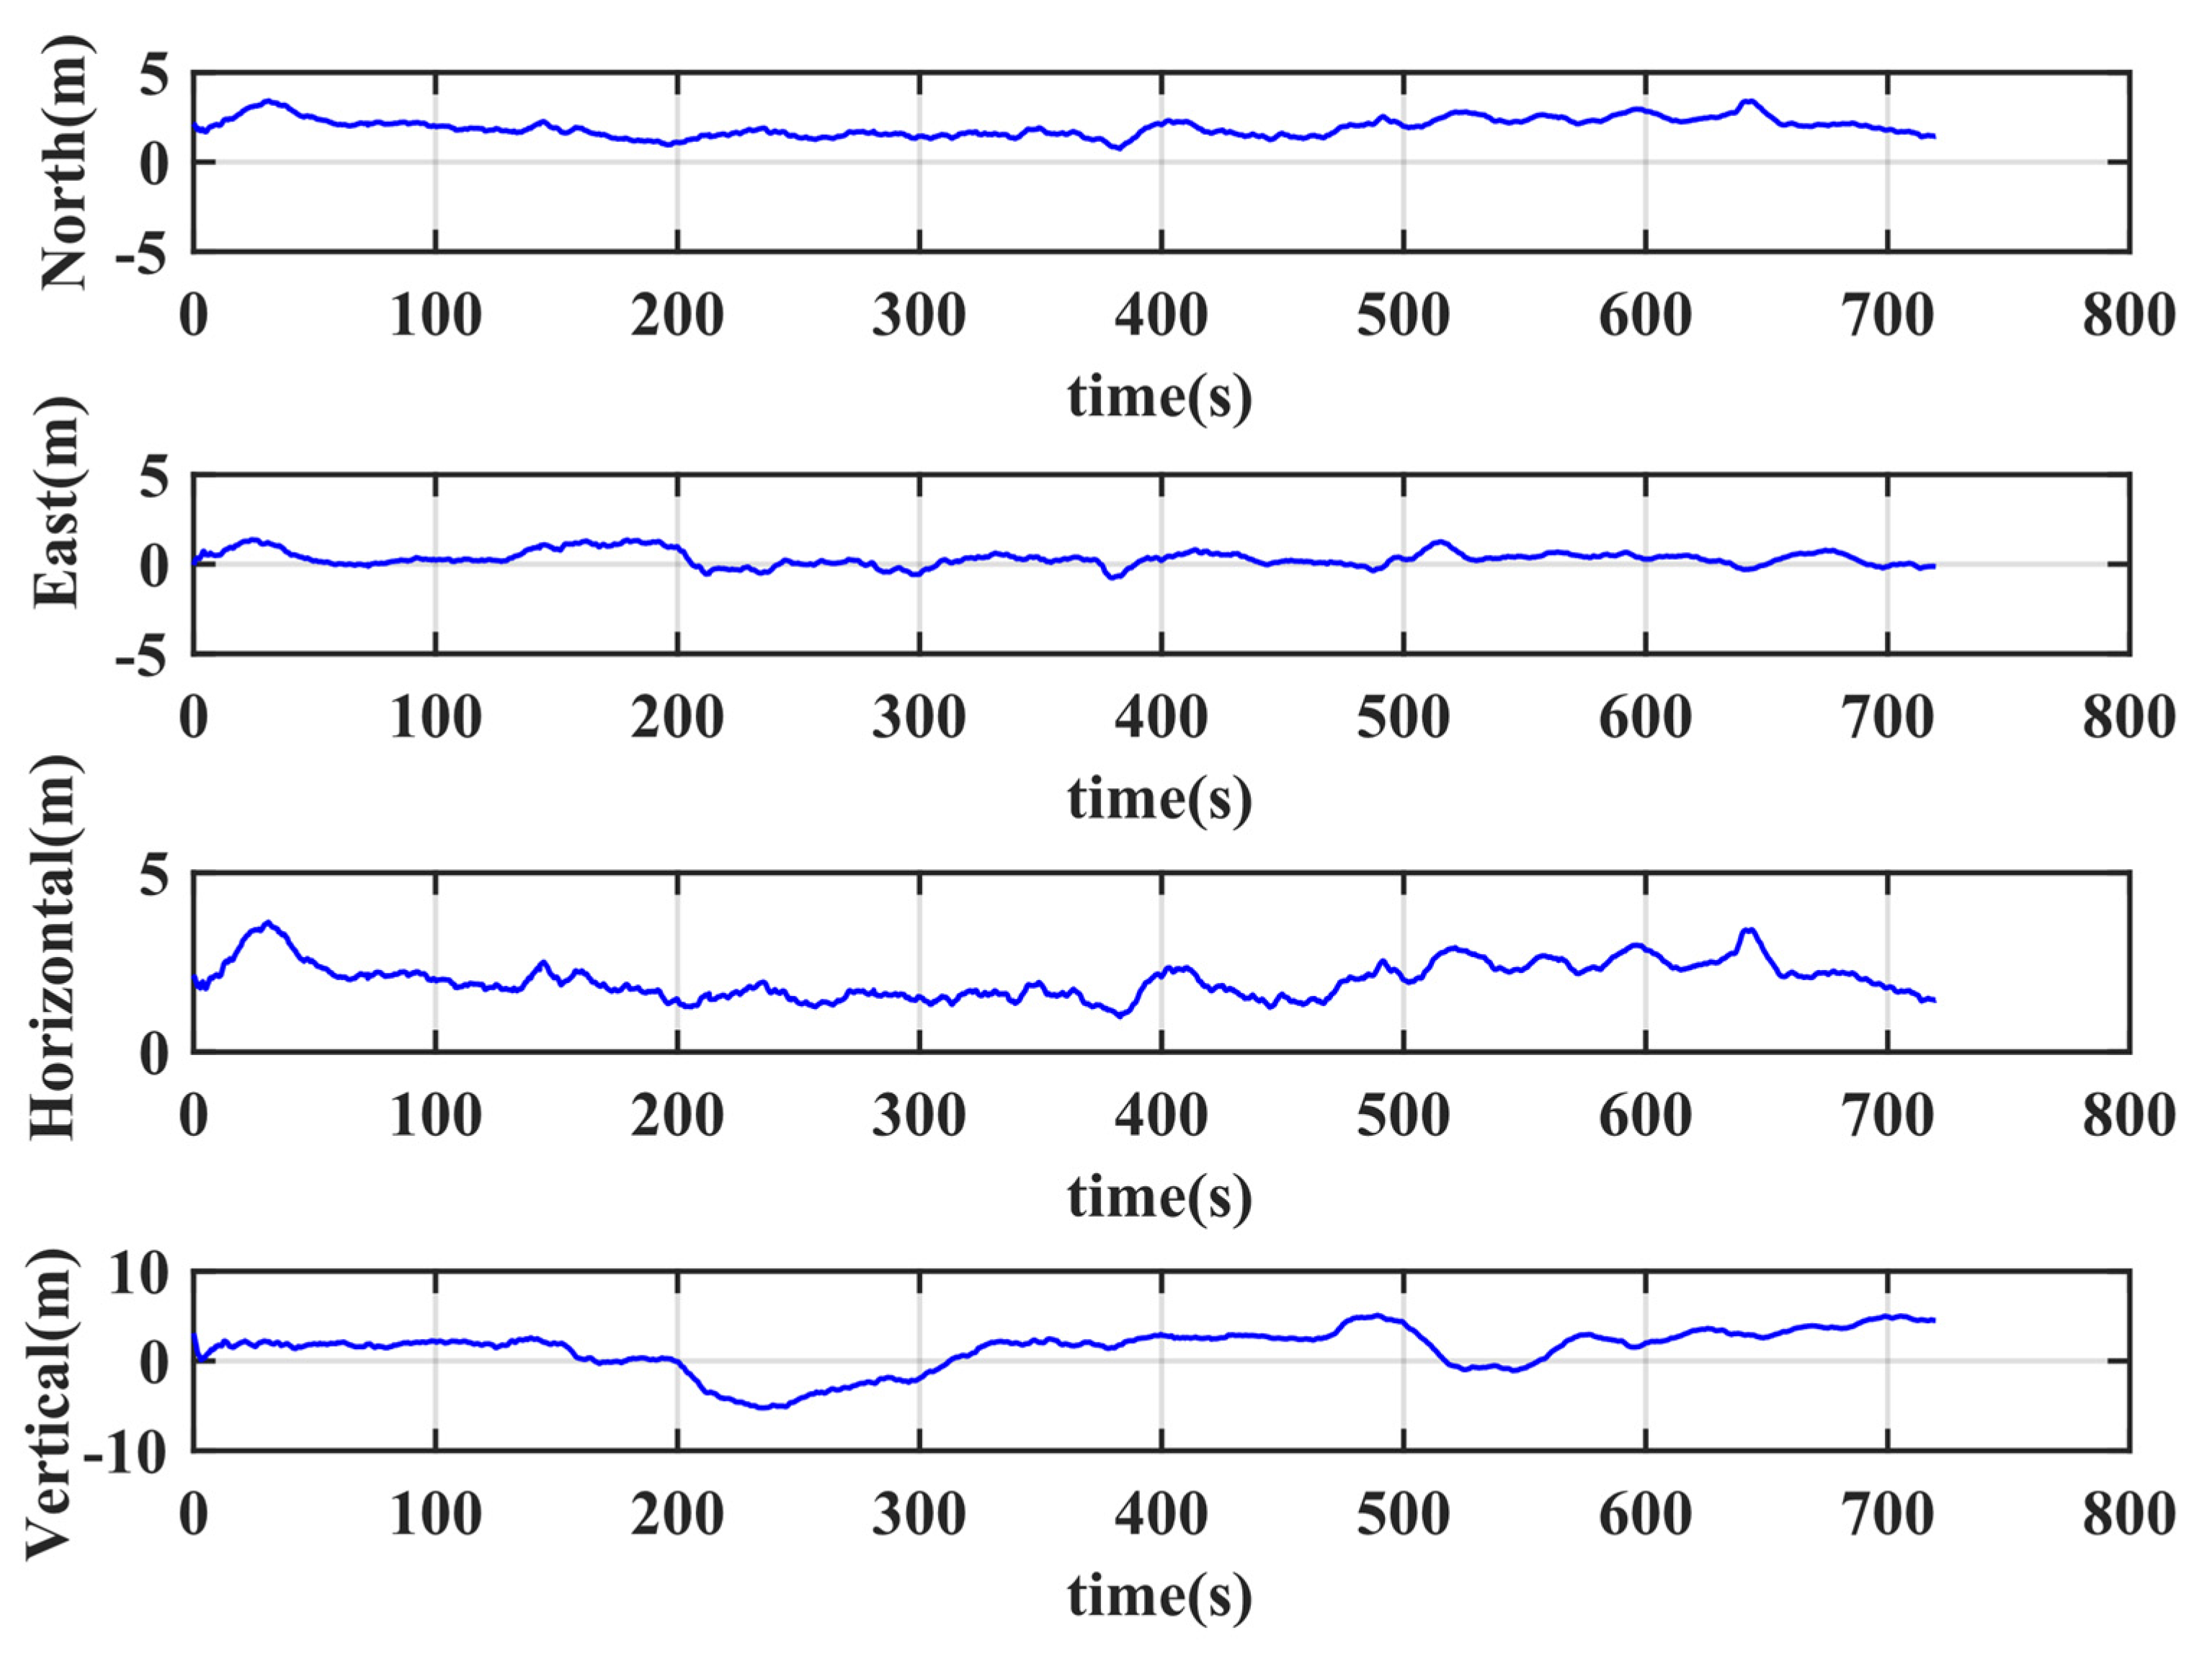
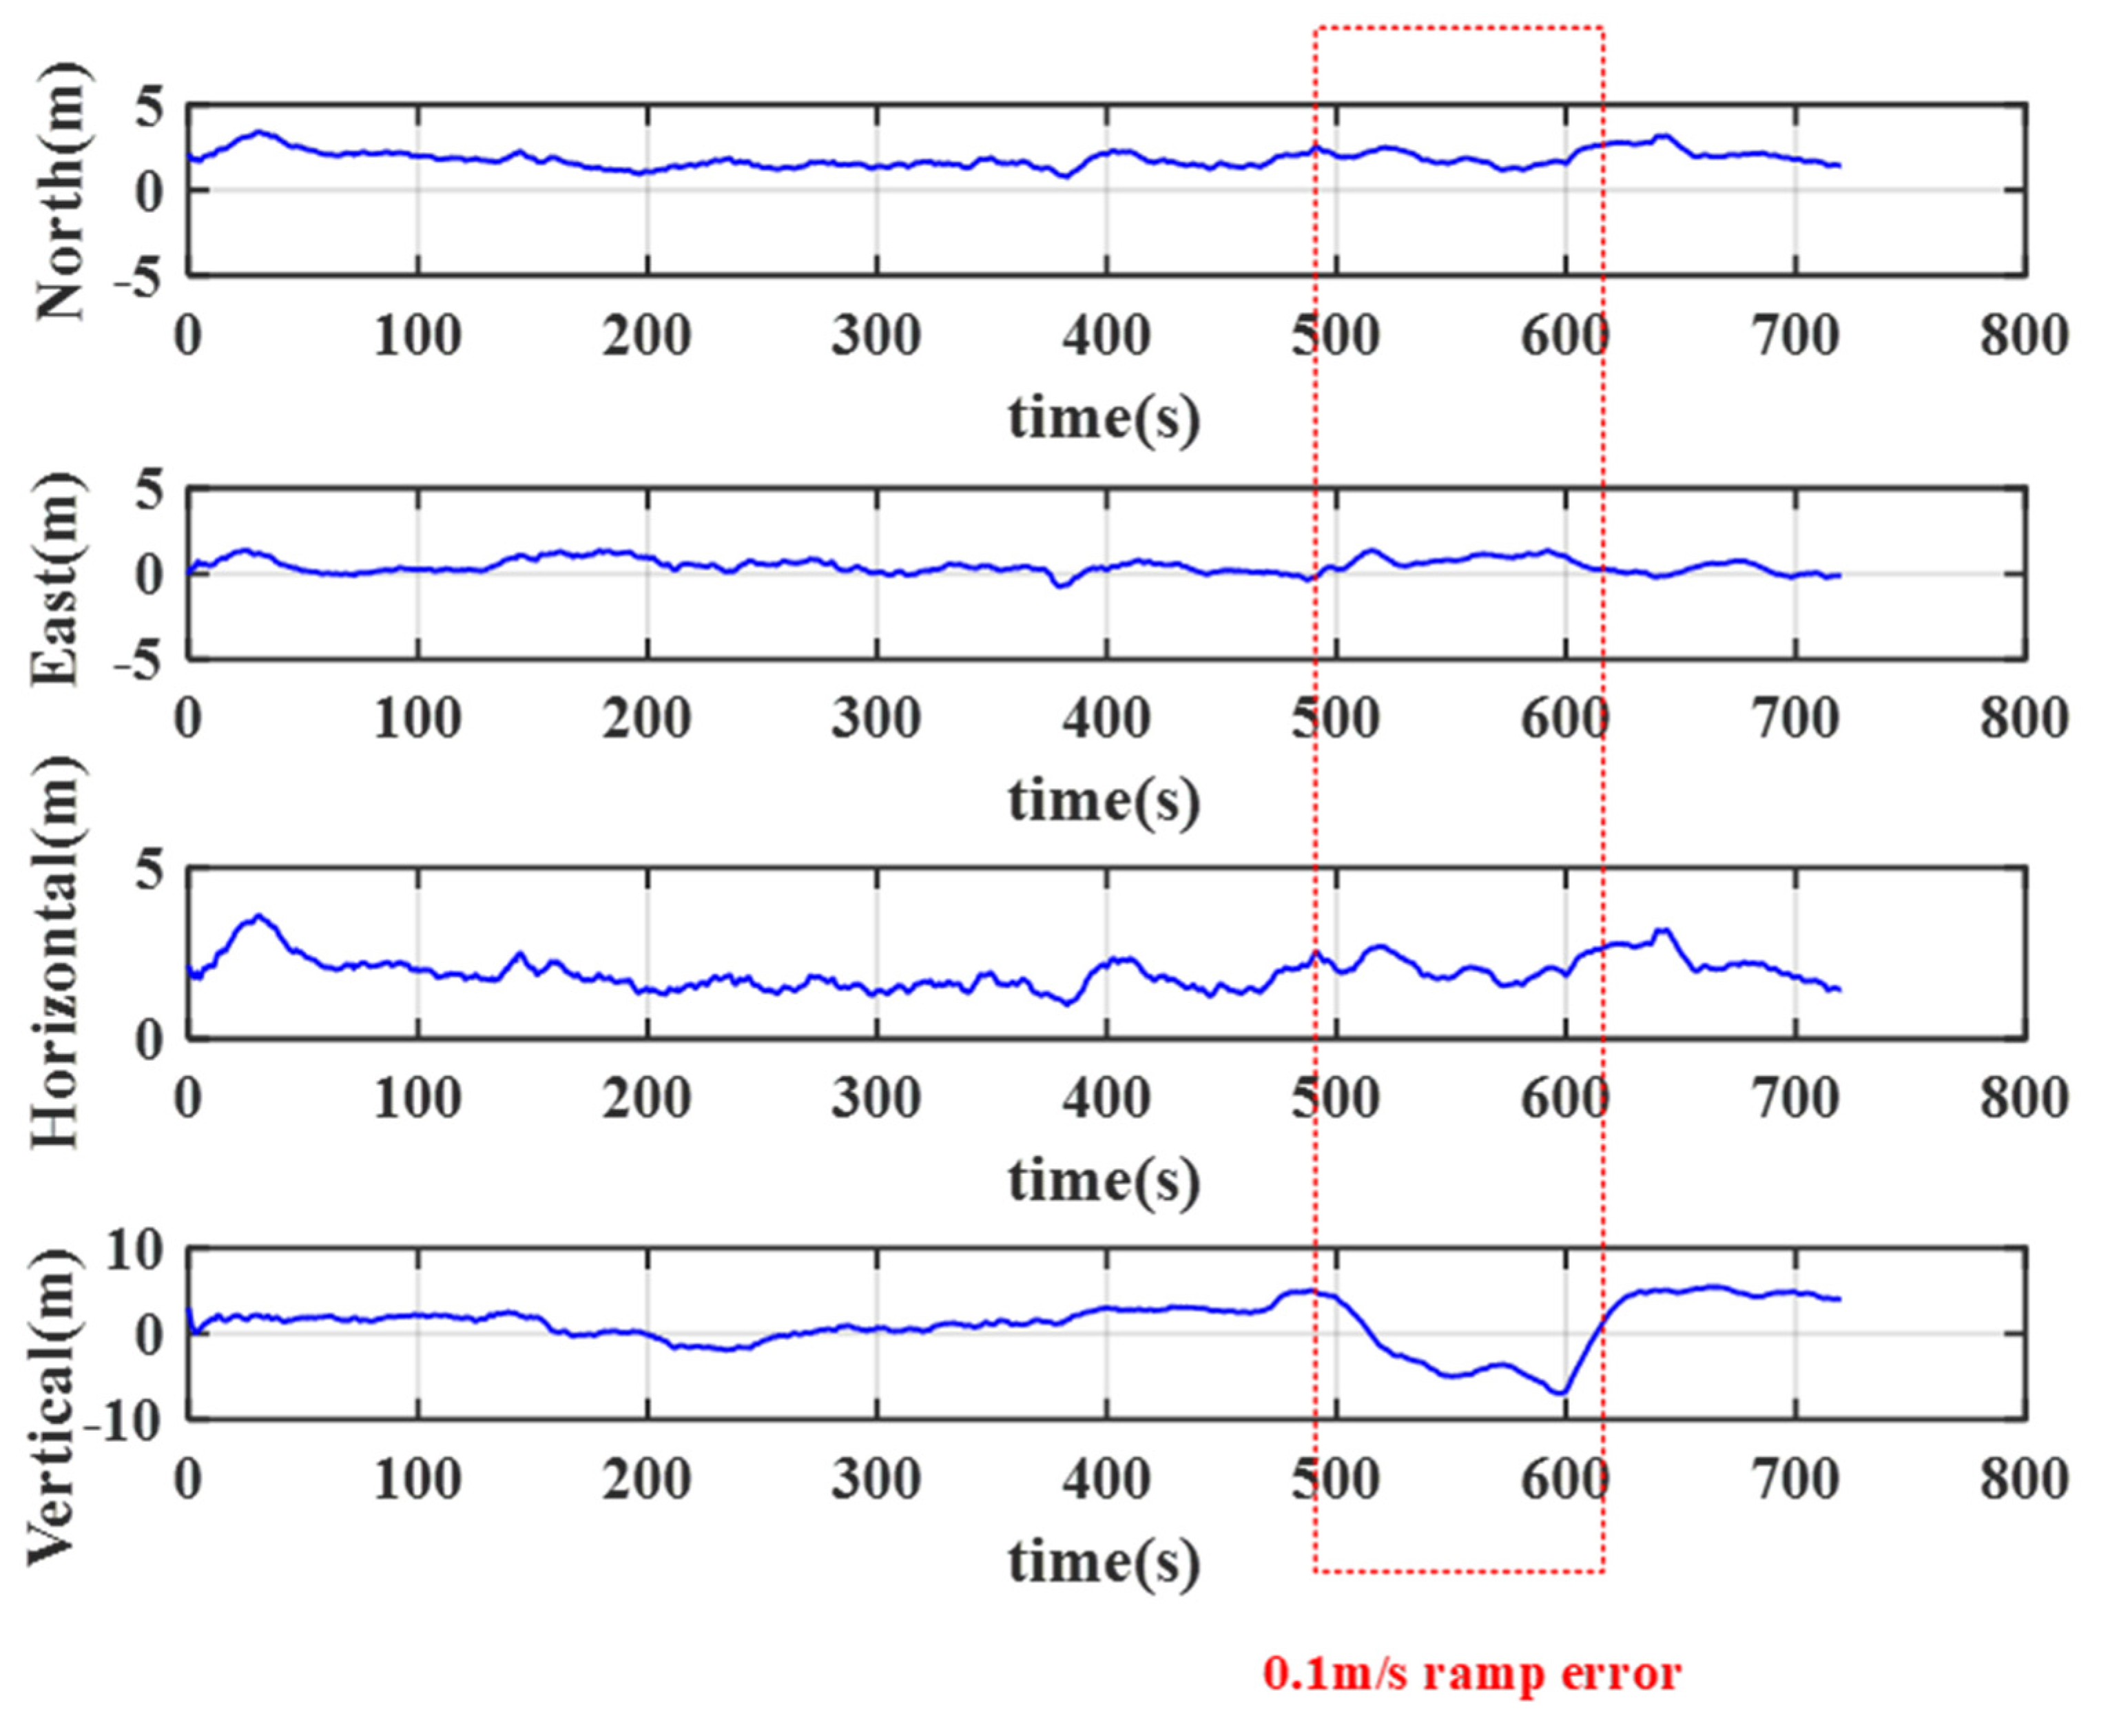
The positioning performance with the 0.1 m/s ramp error added during 500 s–600 s is shown in Figure 12. Although the 0.1 m/s ramp error is difficult to detect, the impact on positioning accuracy is also limited, and the positioning accuracy still meets our requirements. Hence, for detectable fault without exclusion an alert can still be issued to the user to be cautious within a certain time duration.
5.2. Results Analysis of the Positioning with Integrity Monitoring
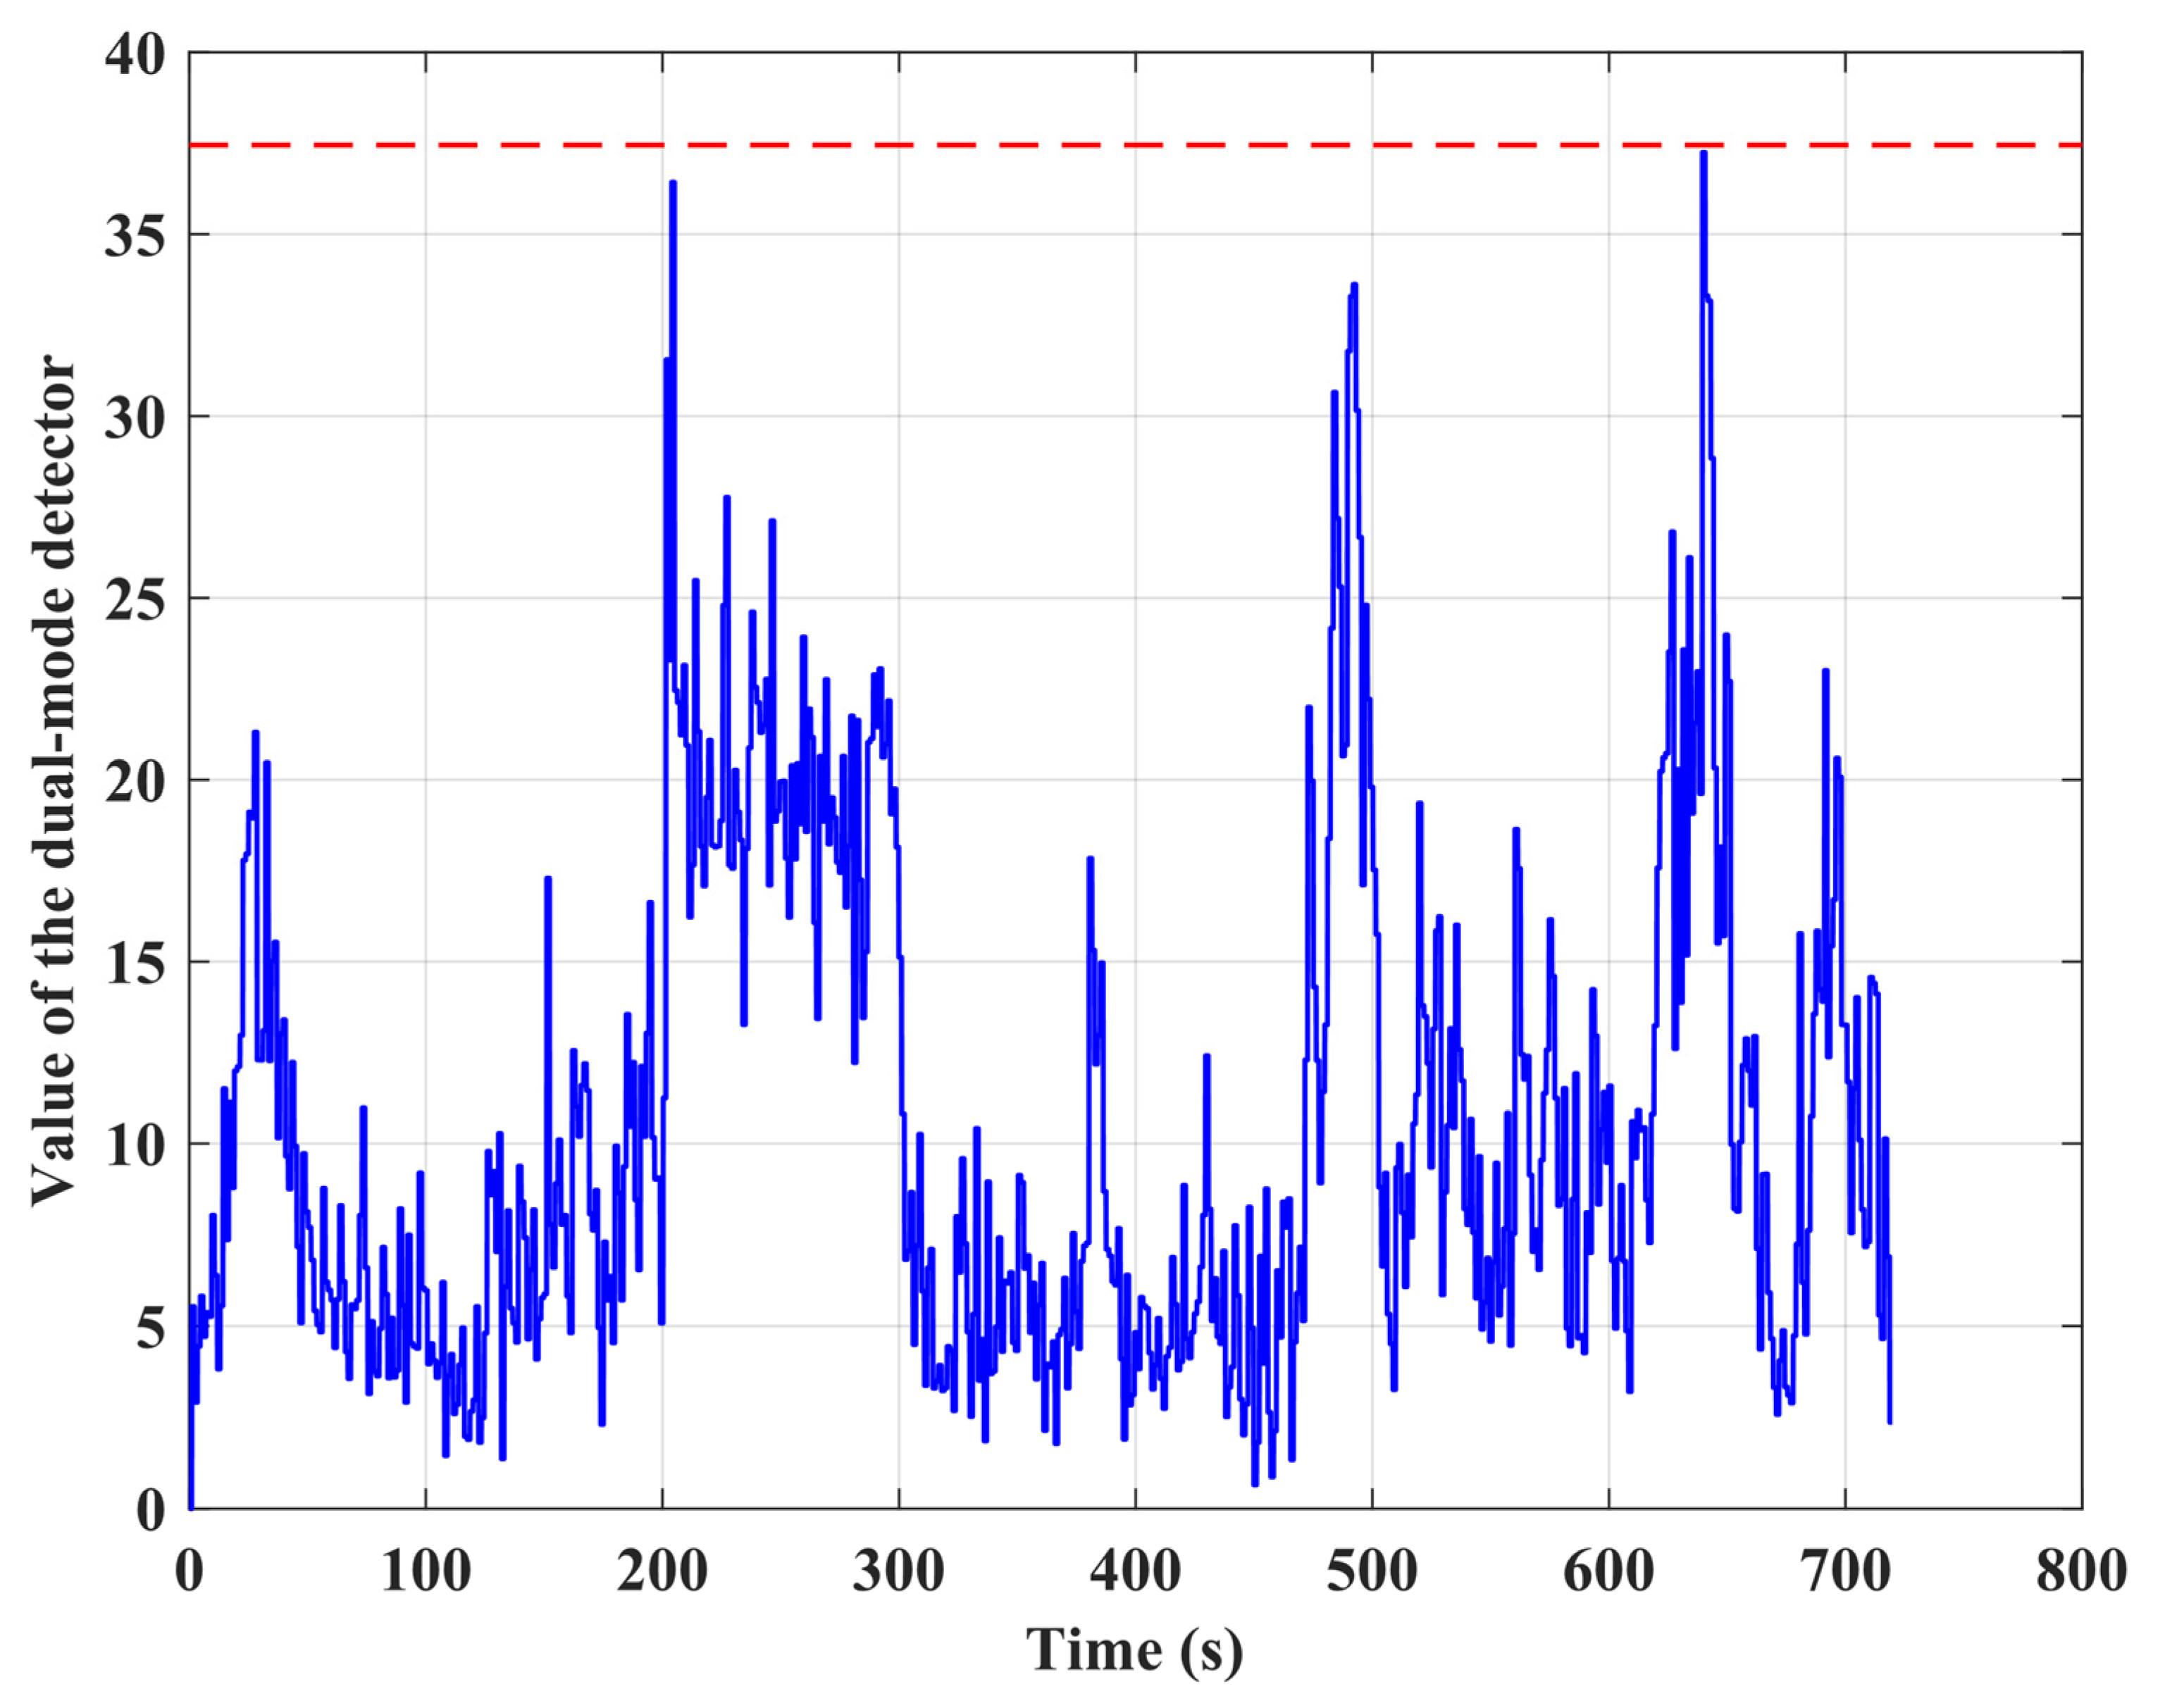
From the results of the sensitivity analysis, we combined two scenarios to design a typical test with both type of errors, in which a step error of 90 m was added to SV32 during 200–300 s, and a ramp error of 0.5 m/s was added to SV20 during 500–600 s. The reaction of the dual-mode detector to the errors is depicted in Figure 13. The step error added at 200 s was detected at 200.1 s, and the ramp error added at 500 s was detected at 511.1 s. Positioning results performance before and after FDE are illustrated in Figure 14. This validates that our algorithm is efficient in detecting and excluding step and ramp errors and therefore, provides the required accuracy for the UAV no-fly zone management. The corresponding positioning accuracy after FDE is analyzed in Table 6. The 95% percentile accuracies with FDE for the horizontal and the vertical are 2.943 m and 4.845 m, respectively, which are within 5 m and 10 m requirements for the UAV no-fly zone management. Therefore, although failure occurred, the navigation system could still meet the accuracy requirements after applying FDE.
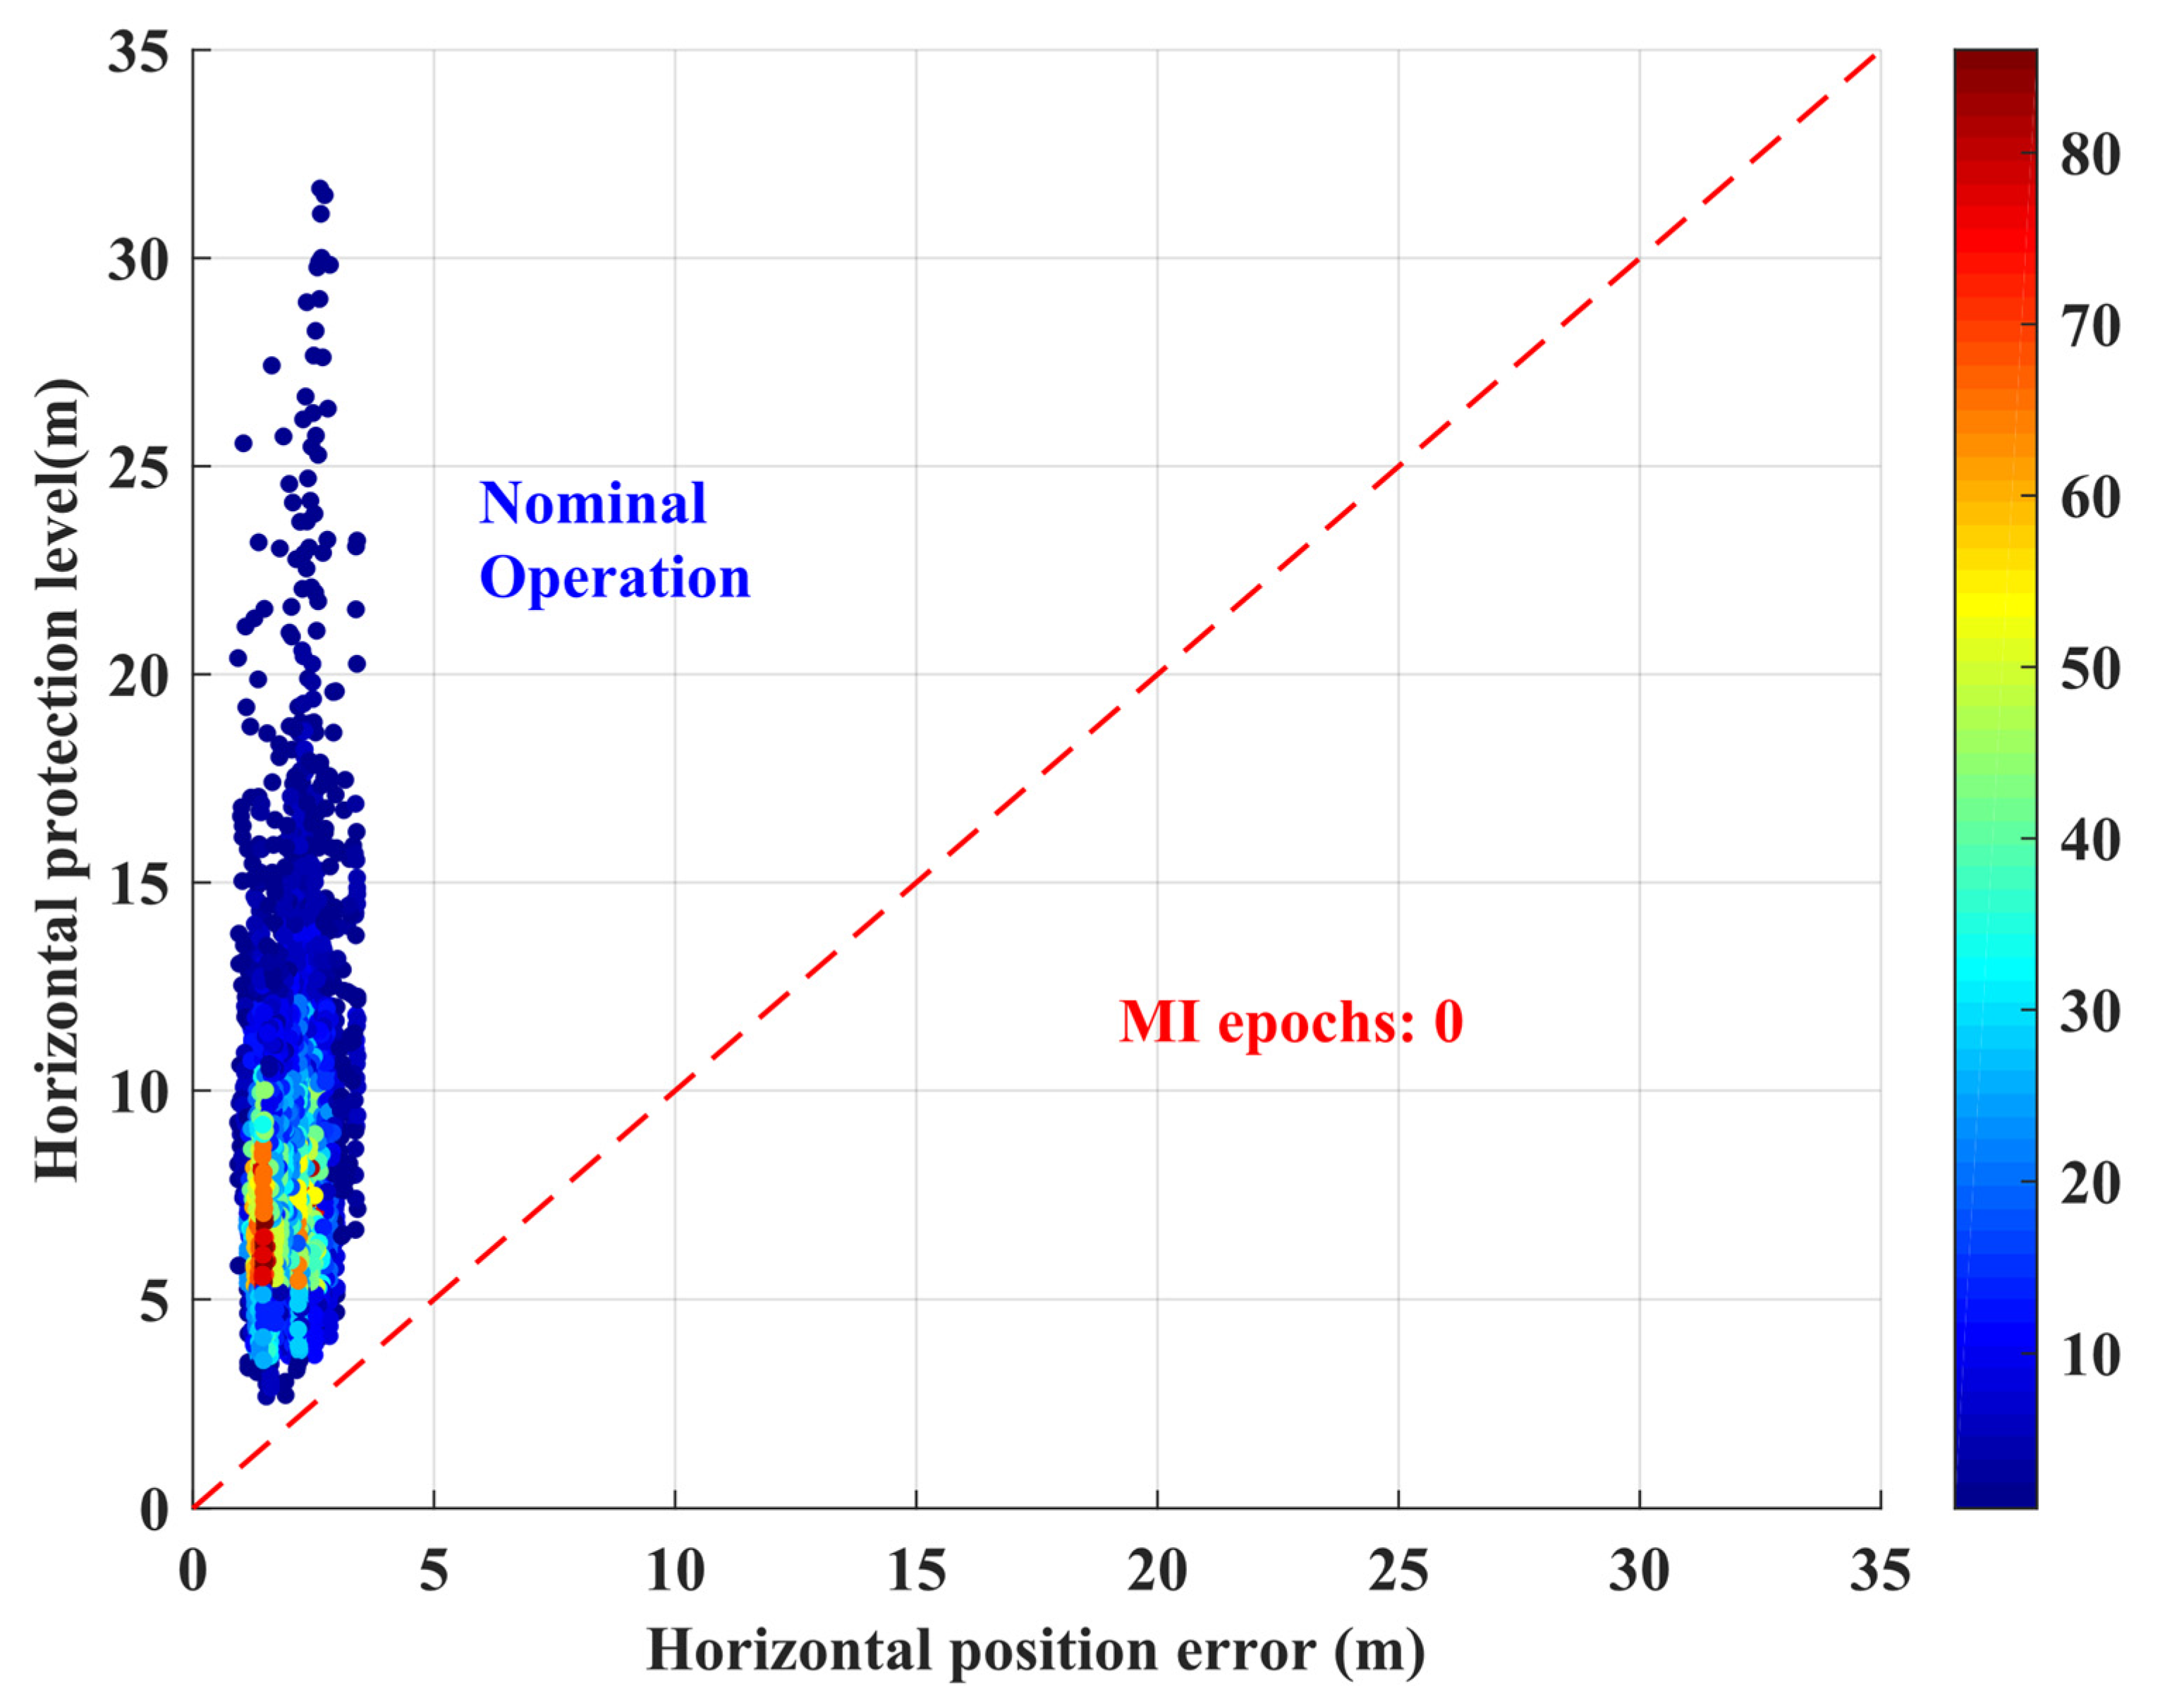
The integrity monitoring performance was further analyzed by the Stanford diagram (Figure 15), in which the relationship between and is briefly presented. As shown, during the whole flight mission, the UAV navigation system was in nominal operation with neither integrity risk arising nor integrity hole appearing. The calculated real-time s, overbound s. Additionally, the maximum is still within 35 m, within a predefined of 50 m (Section 3.4). Hence, the integrity requirements determined in Section 3.4 are satisfied. The results indicate that the algorithm proposed is capable of delivering the accuracy and the integrity requirements for UAV no-fly zone management.
6. Conclusions
In this paper, UAV no-fly zone management is addressed from the perspective of the relationship between the service level requirements and the required navigation performance (RNP) parameters of accuracy, integrity, continuity, and availability, with particular attention paid to the first two parameters. Based on accuracy and integrity requirements, a tightly coupled GNSS/INS integration scheme was developed for the UAV no-fly zone management. The navigation system incorporates an integrity monitoring algorithm failure detection and exclusion and real-time horizontal protection level computation. Simulation and field test results show that the proposed algorithm is capable of delivering the accuracy and integrity requirements for UAV no-fly zone management.
In future work, further improvements to positioning and navigation performance, including the introduction of other positioning methods such as wireless local area networks (WLAN), and aiding through map matching will be investigated for UAV no-fly zone management.
Author Contributions
Writing–original draft, R.S.; Methodology, W.Z.; Data curation, J.Z.; Supervision, W.Y.O. All authors have read and agreed to the published version of the manuscript.
Funding
This research was funded by the National Natural Science Foundation of China, grant number 41704022, 41974033, 61773202 and the Natural Science Foundation of Jiangsu Province, grant number BK20170780.
Acknowledgments
The authors are grateful for the sponsorship of the National Natural Science Foundation of China (Grant No. 41974033, 41704022) and the Natural Science Foundation of Jiangsu Province (Grant No. BK20170780).
Conflicts of Interest
The authors declare no conflict of interest.
References
- Birnbaum, Z.; Dolgikh, A.; Skormin, V.; O’Brien, E.; Muller, D.; Stracquodaine, C. Unmanned Aerial Vehicle Security Using Recursive Parameter Estimation. J. Intell. Robot. Syst. 2016, 84, 107–120. [Google Scholar] [CrossRef]
- Kopardekar, P.H. Airspace Systems Program: Next Generation Air Transportation System Concepts and Technology Development FY2010 Project Plan Version 3.0. 2010. Available online: https://core.ac.uk/reader/10559957 (accessed on 4 January 2020).
- Bo, L.; Wei, G.; Xi, W.; Fu, X. Multi-UAVs Cooperative Area Search with No-Fly Zones Constraints. In Proceedings of the Control Conference, Hangzhou, China, 28–30 July 2015. [Google Scholar]
- Feng, S.; Ochieng, W.; Moore, T.; Hill, C.; Hide, C. Carrier phase-based integrity monitoring for high-accuracy positioning. GPS Solut. 2009, 13, 13–22. [Google Scholar] [CrossRef]
- Ochieng, W.Y.; Sauer, K.; Walsh, D.; Brodin, G.; Griffin, S.; Denney, M. GPS Integrity and Potential Impact on Aviation Safety. J. Navig. 2003, 56, 51–65. [Google Scholar] [CrossRef]
- Godha, S.; Cannon, M.E. GPS/MEMS INS integrated system for navigation in urban areas. GPS Solut. 2007, 11, 193–203. [Google Scholar] [CrossRef]
- Angelino, C.V.; Baraniello, V.R.; Cicala, L. UAV Position and Attitude Estimation Using IMU, GNSS and Camera. In Proceedings of the 15th International Conference on Information Fusion, Singapore, 9–12 July 2012. [Google Scholar]
- Itkin, M.; Kim, M.; Park, Y. Development of Cloud-Based UAV Monitoring and Management System. Sensors 2016, 16, 1913. [Google Scholar] [CrossRef] [PubMed]
- Prevot, T.; Rios, J.; Kopardekar, P.; Robinson, J.E., III; Johnson, M.; Jung, J. UAS Traffic Management (UTM) Concept of Operations to Safely Enable Low Altitude Flight Operations. In Proceedings of the 16th AIAA Aviation Technology, Integration, and Operations Conference on American Institute of Aeronautics and Astronautics, Washington, DC, USA, 13–17 June 2016. [Google Scholar]
- Damilano, L.; Guglieri, G.; Quagliotti, F.; Sale, I.; Lunghi, A. Ground Control Station Embedded Mission Planning for UAS. J. Intell. Robot. Syst. 2013, 69, 241–256. [Google Scholar] [CrossRef]
- Geng, L.; Zhang, Y.F.; Wang, J.J.; Fuh, J.Y.H.; Teo, S.H. Mission Planning of Autonomous UAVs for Urban Surveillance with Evolutionary Algorithms. In Proceedings of the 2013 10th IEEE International Conference on Control and Automation (ICCA), Hangzhou, China, 12–14 June 2013; pp. 828–833. [Google Scholar]
- Torens, C.; Adolf, F. Automated Verification and Validation of an Onboard Mission Planning and Execution System for UAVs. In Proceedings of the AIAA Infotech@Aerospace (I@A) Conference, American Institute of Aeronautics and Astronautics, Boston, MA, USA, 19–22 Augest 2013. [Google Scholar]
- Gautier, J.D. GPS/INS Generalized Evaluation Tool (GIGET) for the Design and Testing of Integrated Navigation Systems. Ph.D. Thesis, Harvard University, Cambridge, MA, USA, 2003. [Google Scholar]
- Bhatti, U.I. Improved Integrity Algorithms for the Integrated GPS/INS Systems in the Presence of Slowly Growing Errors. Ph.D. Thesis, Imperial College London, London, UK, 2007. [Google Scholar]
- Salos, D.; Macabiau, C.; Martineau, A.; Bonhoure, B.; Kubrak, D. Analysis of GNSS Integrity Requirements for Road User Charging Applications. In Proceedings of the 2010 5th ESA Workshop on Satellite Navigation Technologies and European Workshop on GNSS Signals and Signal Processing (NAVITEC), Noordwijk, The Netherlands, 8–10 December 2010; pp. 1–8. [Google Scholar]
- Lee, Y.C. Analysis of Range and Position Comparison Methods as a Means to Provide GPS Integrity in the User Receiver. In Proceedings of the 42nd Annual Meeting of The Institute of Navigation, Seattle, WA, USA, 24–26 June 1986. [Google Scholar]
- Parkinson, B.W.; Axelrad, P. Autonomous GPS Integrity Monitoring Using the Pseudorange Residual. Navigation 1988, 35, 255–274. [Google Scholar] [CrossRef]
- Sturza, M.A. Navigation System Integrity Monitoring Using Redundant Measurements. Navigation 1988, 35, 483–501. [Google Scholar] [CrossRef]
- Brown, R.G.; McBurney, P.W. Self-Contained GPS Integrity Check Using Maximum Solution Separation. Navigation 1988, 35, 41–53. [Google Scholar] [CrossRef]
- Brown, R.G. Solution of the Two-Failure GPS RAIM Problem under Worst-Case Bias Conditions: Parity Space Approach. Navigation 1997, 44, 425–431. [Google Scholar] [CrossRef]
- Rippl, M.; Spletter, A.; Günther, C. Parametric Performance Study of Advanced Receiver Autonomous Integrity Monitoring (ARAIM) for Combined GNSS Constellations. In Proceedings of the 2011 International Technical Meeting of The Institute of Navigation, San Diego, CA, USA, 24–26 January 2011. [Google Scholar]
- Blanch, J.; Walter, T.; Enge, P. Position error bound calculation for GNSS using measurement residuals. IEEE Trans. Aerosp. Electron. Syst. 2008, 44, 977–984. [Google Scholar] [CrossRef]
- Panagiotakopoulos, D.; Majumdar, A.; Ochieng, W.Y. Extreme value theory-based integrity monitoring of global navigation satellite systems. GPS Solut. 2014, 18, 133–145. [Google Scholar] [CrossRef] [Green Version]
- Escher, A.-C.; Macabiau, C.; Martin, N.; Roturier, B.; Vogel, V. GNSS/IRS Hybridization: Fault Detection and Isolation of More than One Range Failure. In Proceedings of the 15th International Technical Meeting of the Satellite Division of The Institute of Navigation, Portland, OR, USA, 24–27 September 2002. [Google Scholar]
- Diesel, J.; King, J. Integration of Navigation Systems for Fault Detection, Exclusion, and Integrity Determination—Without WAAS. Int. J. Res. Med. Sci. 1995, 1, 619–620. [Google Scholar]
- Lee, Y.C.; O’Laughlin, D.G. Performance Analysis of a Tightly Coupled GPS/Inertial System for Two Integrity Monitoring Methods. Navigation 2001, 47, 175–189. [Google Scholar] [CrossRef]
- Sun, R.; Zhang, Y.; Ye, B.; Ochieng, W.Y. A Required Navigation Performance Based Approach to Monitor the Accuracy and Integrity Performance of UAVs for Delivery Applications. In Proceedings of the China Satellite Navigation Conference (CSNC) 2018 Proceedings CSNC 2018, Harbin, China, 23–25 May 2018. [Google Scholar]
- Maybeck, P.S. Stochastic Models, Estimation, and Control; Academic Press: Washington, DC, USA, 1982; Volume 1. [Google Scholar]
- Hewitson, S.; Kyu Lee, H.; Wang, J. Localizability Analysis for GPS/Galileo Receiver Autonomous Integrity Monitoring. J. Navig. 2004, 57, 245–259. [Google Scholar] [CrossRef] [Green Version]
Figure 1.
Upper view of a no-fly zone.

Figure 2.
Relationship between the width of buffer zone and horizontal alert limit.

Figure 3.
System flow chart.

Figure 4.
(a) Experimental setup; (b) unmanned aerial vehicle (UAV) flight trajectory.

Figure 5.
Value of dual-mode detector for step error detection with error ranges from 10–90 m added at an interval of 20 m during 200 s–300 s.
Figure 5.
Value of dual-mode detector for step error detection with error ranges from 10–90 m added at an interval of 20 m during 200 s–300 s.
Figure 6.
W-test statistics value with a 10 m step error added during 200 s–300 s.

Figure 7.
Value of dual-mode detector with 3 m step error added during 200 s–300 s.

Figure 8.
The positioning error with the 3 m step error in the calculation.

Figure 9.
Test statistics value for ramp error detection with the 0.1~0.5 m/s clock drift equivalent range error added at an interval of 0.1 m/s in SV10.
Figure 9.
Test statistics value for ramp error detection with the 0.1~0.5 m/s clock drift equivalent range error added at an interval of 0.1 m/s in SV10.

Figure 10.
W-test statistics value with 0.2 m/s ramp error added during 500 s–600 s.

Figure 11.
W-test statistics value with 0.1 m/s ramp error added during 500 s–600 s.

Figure 12.
3D position error with 0.1 m/s ramp error added.

Figure 13.
Dual-mode detector’s reaction to step and ramp errors.
Figure 14.
Positioning performance before and after fault detection and exclusion (FDE).
Figure 15.
Stanford Diagram for the integrity monitoring performance.


Table 1.
Violation detection outcomes.
| System Detects a Violation Vvent | |||
|---|---|---|---|
| Yes | No | ||
| Actual violation event | Yes | Correct detection | Missed detection (True violation but not detected) |
| No | False detection (False violation) | Correct non-detection | |
Table 2.
Values of detection threshold for different number of satellites view.
| Number of Satellites-in-View | 1 | 2 | 3 | 4 | 5 | 6 | 7 | 8 |
|---|---|---|---|---|---|---|---|---|
| 19.51 | 23.03 | 25.90 | 28.47 | 30.86 | 33.11 | 35.26 | 37.45 |
Table 3.
The defined scenarios.
| Scenarios | Fault Start Time (s) | Fault End Time (s) | Error Types | Error Sources |
|---|---|---|---|---|
| Scenario 1 | 200 | 300 | Step error | 10~90 m range error added to SV12 with an interval of 20 m |
| Scenario 2 | 500 | 600 | Ramp error | 0.1~0.5 m/s clock drift equivalent range error added to SV10 with an interval of 0.1 m/s |
Table 4.
The detection time of the step errors with error ranges from 10–90 m added at an interval of 20 m in SV12.
Table 4.
The detection time of the step errors with error ranges from 10–90 m added at an interval of 20 m in SV12.
| Error Source | Error Detected Time (s) |
|---|---|
| 10 m | 1.6 s |
| 30 m | 0.1 s |
| 50 m | 0.1 s |
| 70 m | 0.1 s |
| 90 m | 0.1 s |
Table 5.
The detection time of the ramp errors with the 0.1~0.5 m/s clock drift equivalent range error added at an interval of 0.1 m/s in SV10.
Table 5.
The detection time of the ramp errors with the 0.1~0.5 m/s clock drift equivalent range error added at an interval of 0.1 m/s in SV10.
| Error Source | Error Detected Time (s) |
|---|---|
| 0.1 m/s | 60.3 s |
| 0.2 m/s | 31.5 s |
| 0.3 m/s | 21.8 s |
| 0.4 m/s | 15.9 s |
| 0.5 m/s | 11.1 s |
Table 6.
Positioning accuracy analysis after FDE.
| Direction | East | North | Horizontal | Vertical |
|---|---|---|---|---|
| RMSE (m) | 0.557 | 2.007 | 2.083 | 2.503 |
| 95% percentile (m) | 1.148 | 2.879 | 2.943 | 4.845 |
| MAX (m) | 1.468 | 3.404 | 3.498 | 8.857 |
RMSE: root mean square error.
© 2020 by the authors. Licensee MDPI, Basel, Switzerland. This article is an open access article distributed under the terms and conditions of the Creative Commons Attribution (CC BY) license (http://creativecommons.org/licenses/by/4.0/).
Share and Cite
MDPI and ACS Style
Sun, R.; Zhang, W.; Zheng, J.; Ochieng, W.Y. GNSS/INS Integration with Integrity Monitoring for UAV No-fly Zone Management. Remote Sens. 2020, 12, 524. https://0-doi-org.brum.beds.ac.uk/10.3390/rs12030524
AMA Style
Sun R, Zhang W, Zheng J, Ochieng WY. GNSS/INS Integration with Integrity Monitoring for UAV No-fly Zone Management. Remote Sensing. 2020; 12(3):524. https://0-doi-org.brum.beds.ac.uk/10.3390/rs12030524
Chicago/Turabian StyleSun, Rui, Wenyu Zhang, Jiazhu Zheng, and Washington Yotto Ochieng. 2020. "GNSS/INS Integration with Integrity Monitoring for UAV No-fly Zone Management" Remote Sensing 12, no. 3: 524. https://0-doi-org.brum.beds.ac.uk/10.3390/rs12030524
Note that from the first issue of 2016, this journal uses article numbers instead of page numbers. See further details here.