A New Framework for Automatic Airports Extraction from SAR Images Using Multi-Level Dual Attention Mechanism

 , , , and
Abstract
:1. Introduction
- (1)
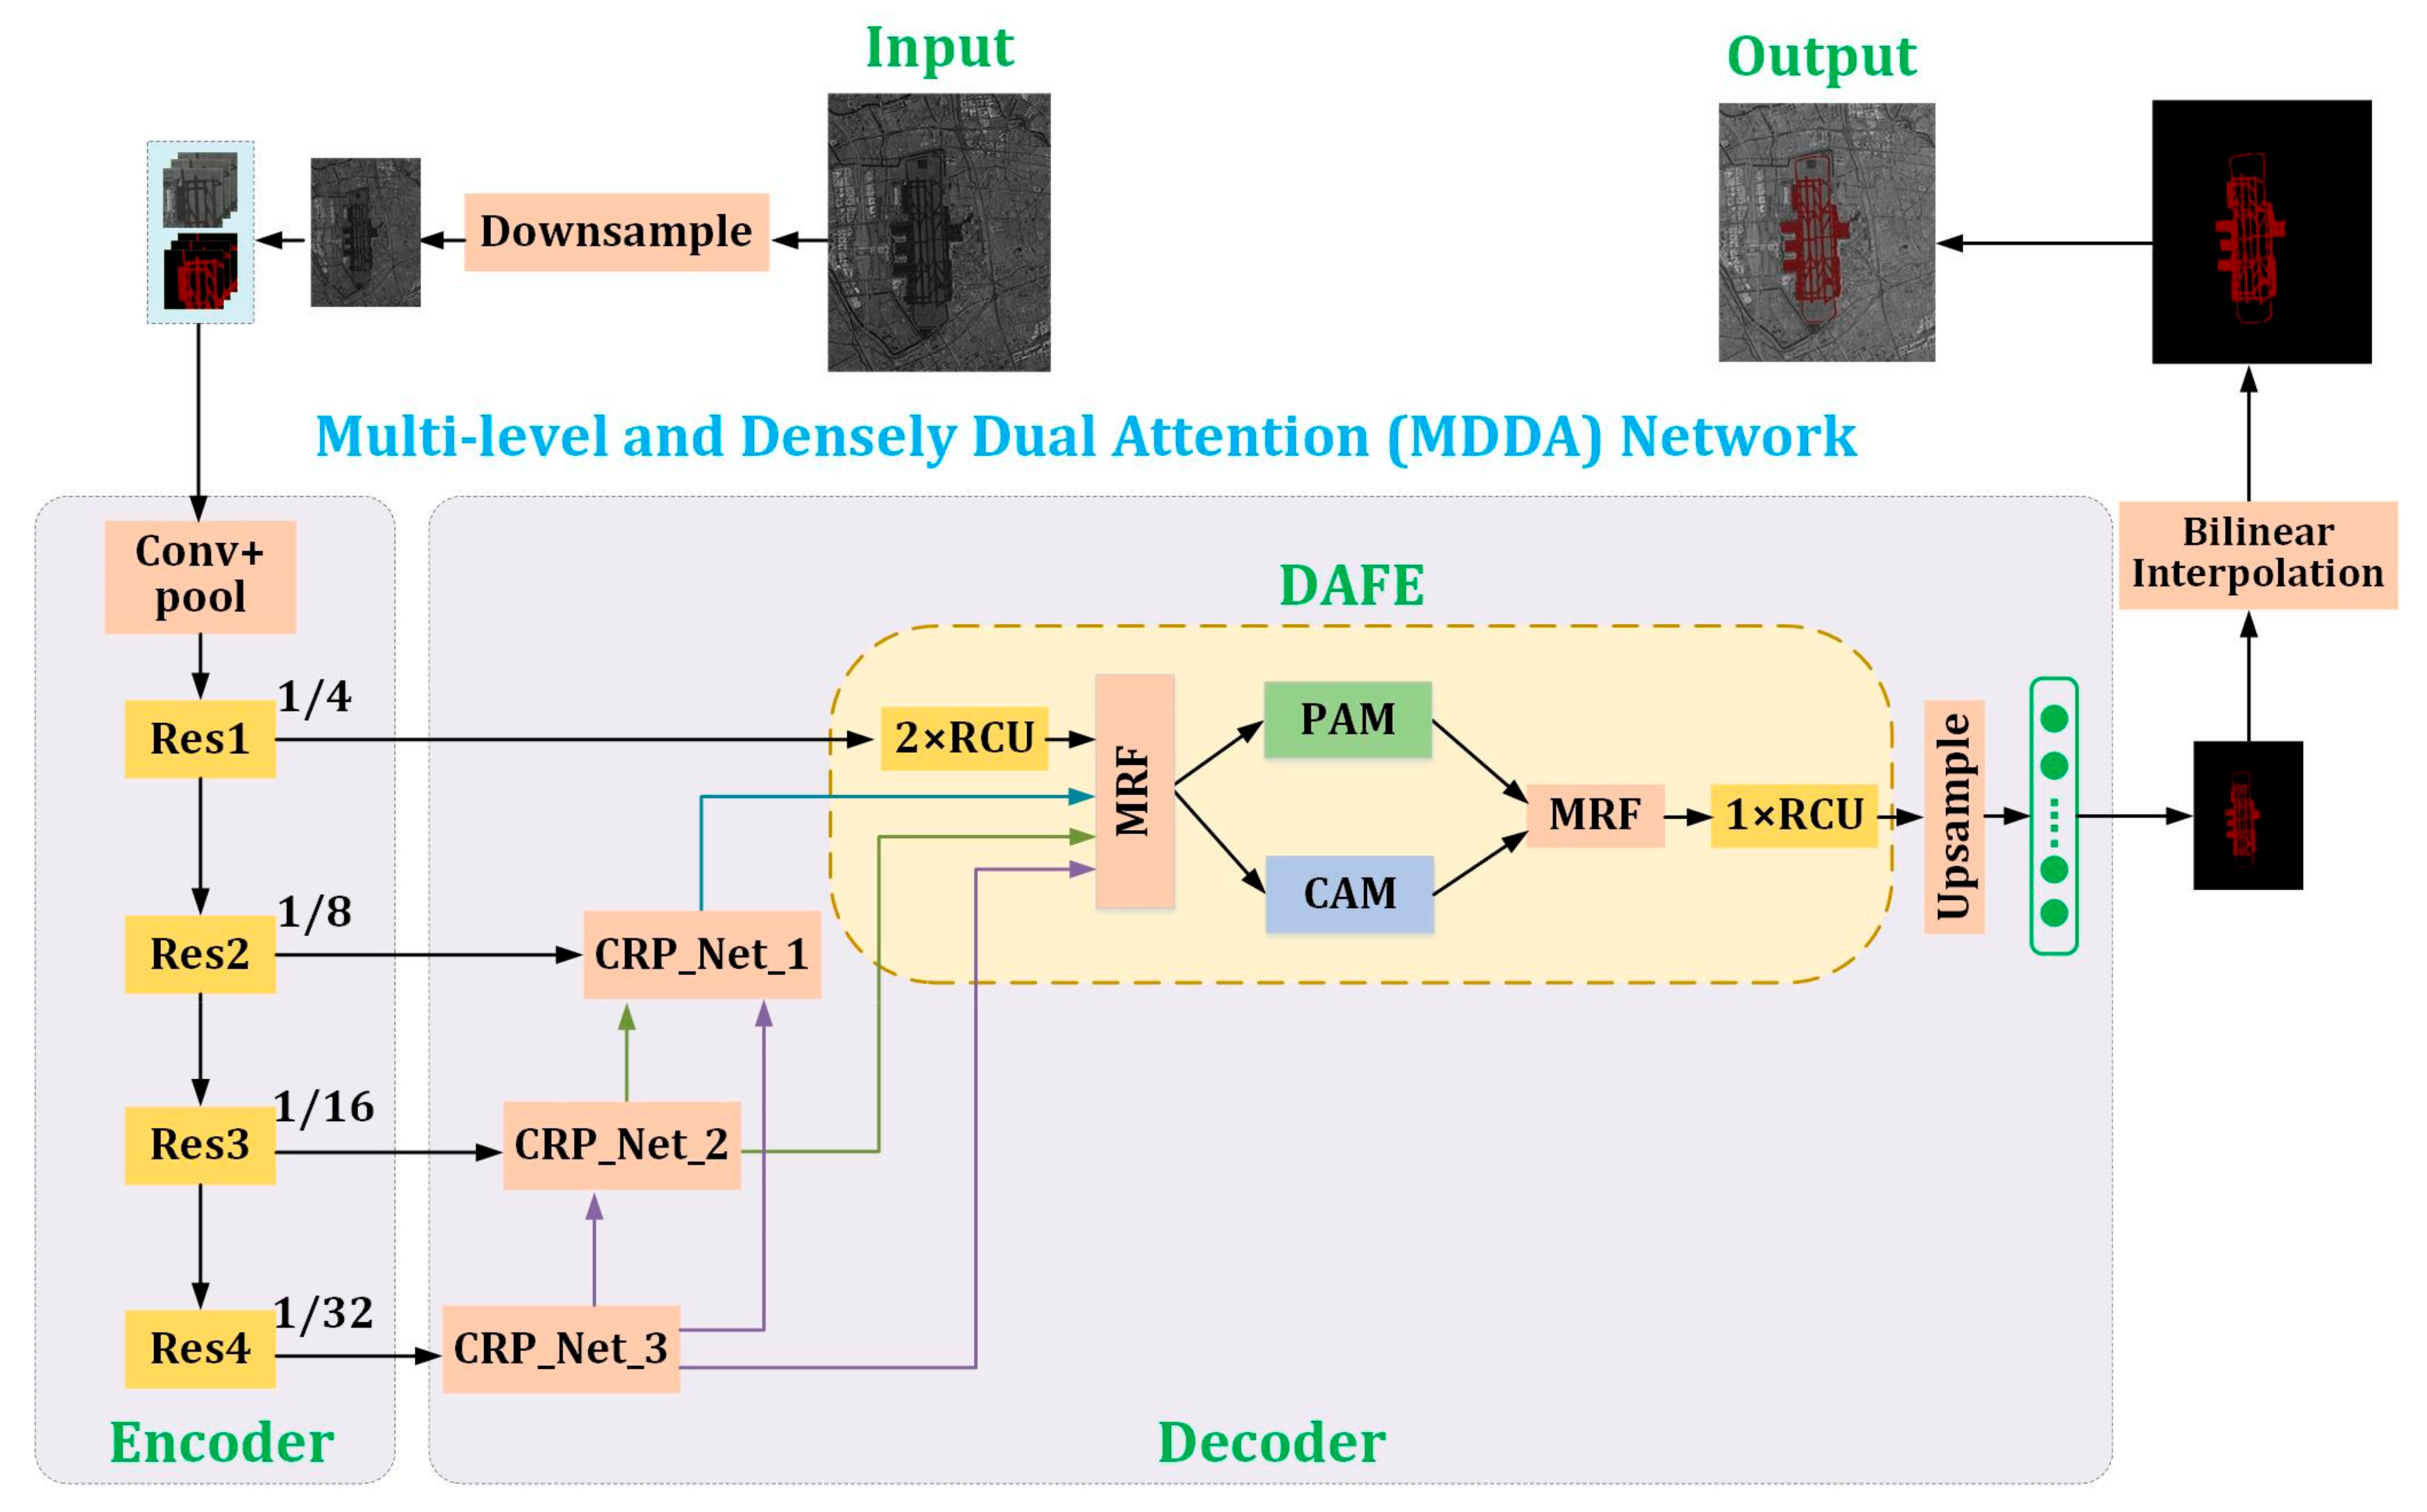
- A new framework for airport extraction is proposed. It includes three parts: down-sampling of the original SAR images, deep learning network for the airport extraction, and bilinear interpolation to acquire the extraction result of high-resolution SAR images. For SAR images with high-precision, down-sampling is performed to produce medium resolution (5 m–10 m resolution) SAR images, and then datasets are generated. After extracting airports of medium SAR images by the deep learning network, up-sampling is carried out to produce the results with the same size as the original SAR images with high-resolution.
- (2)
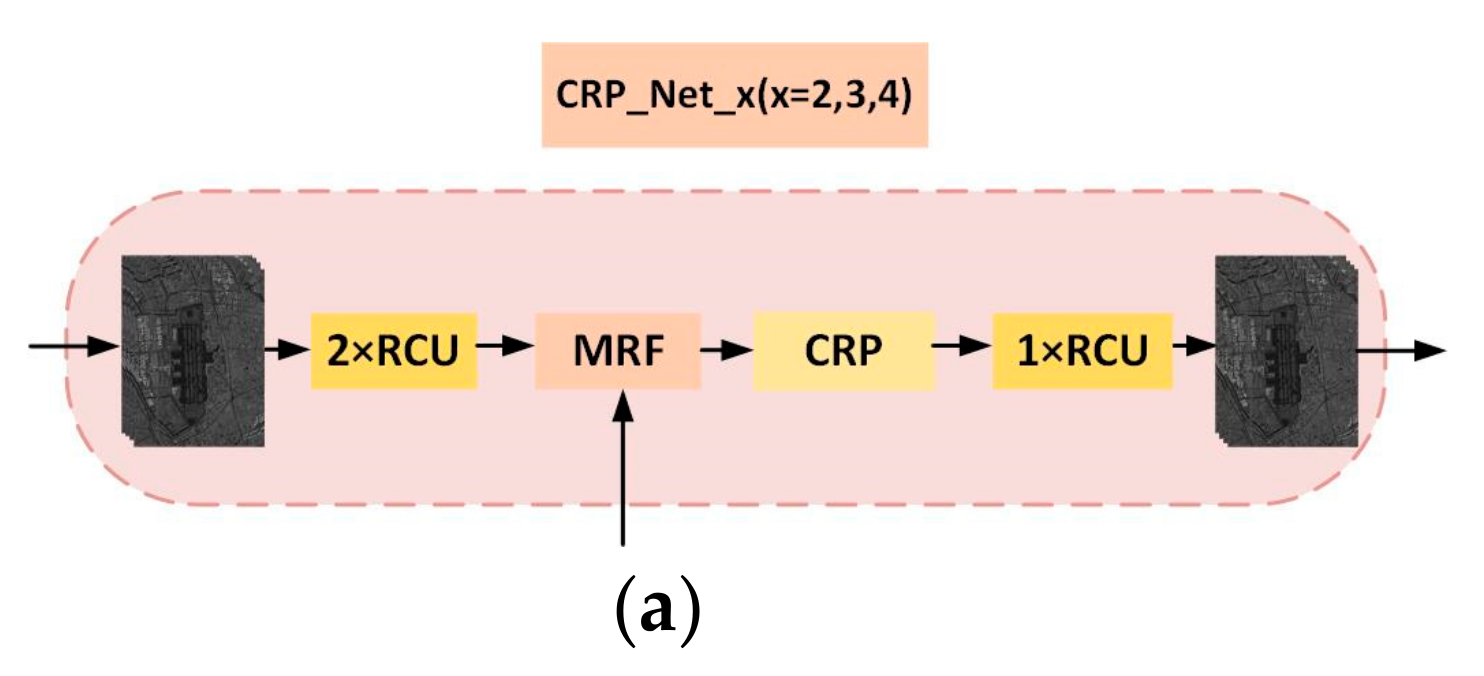
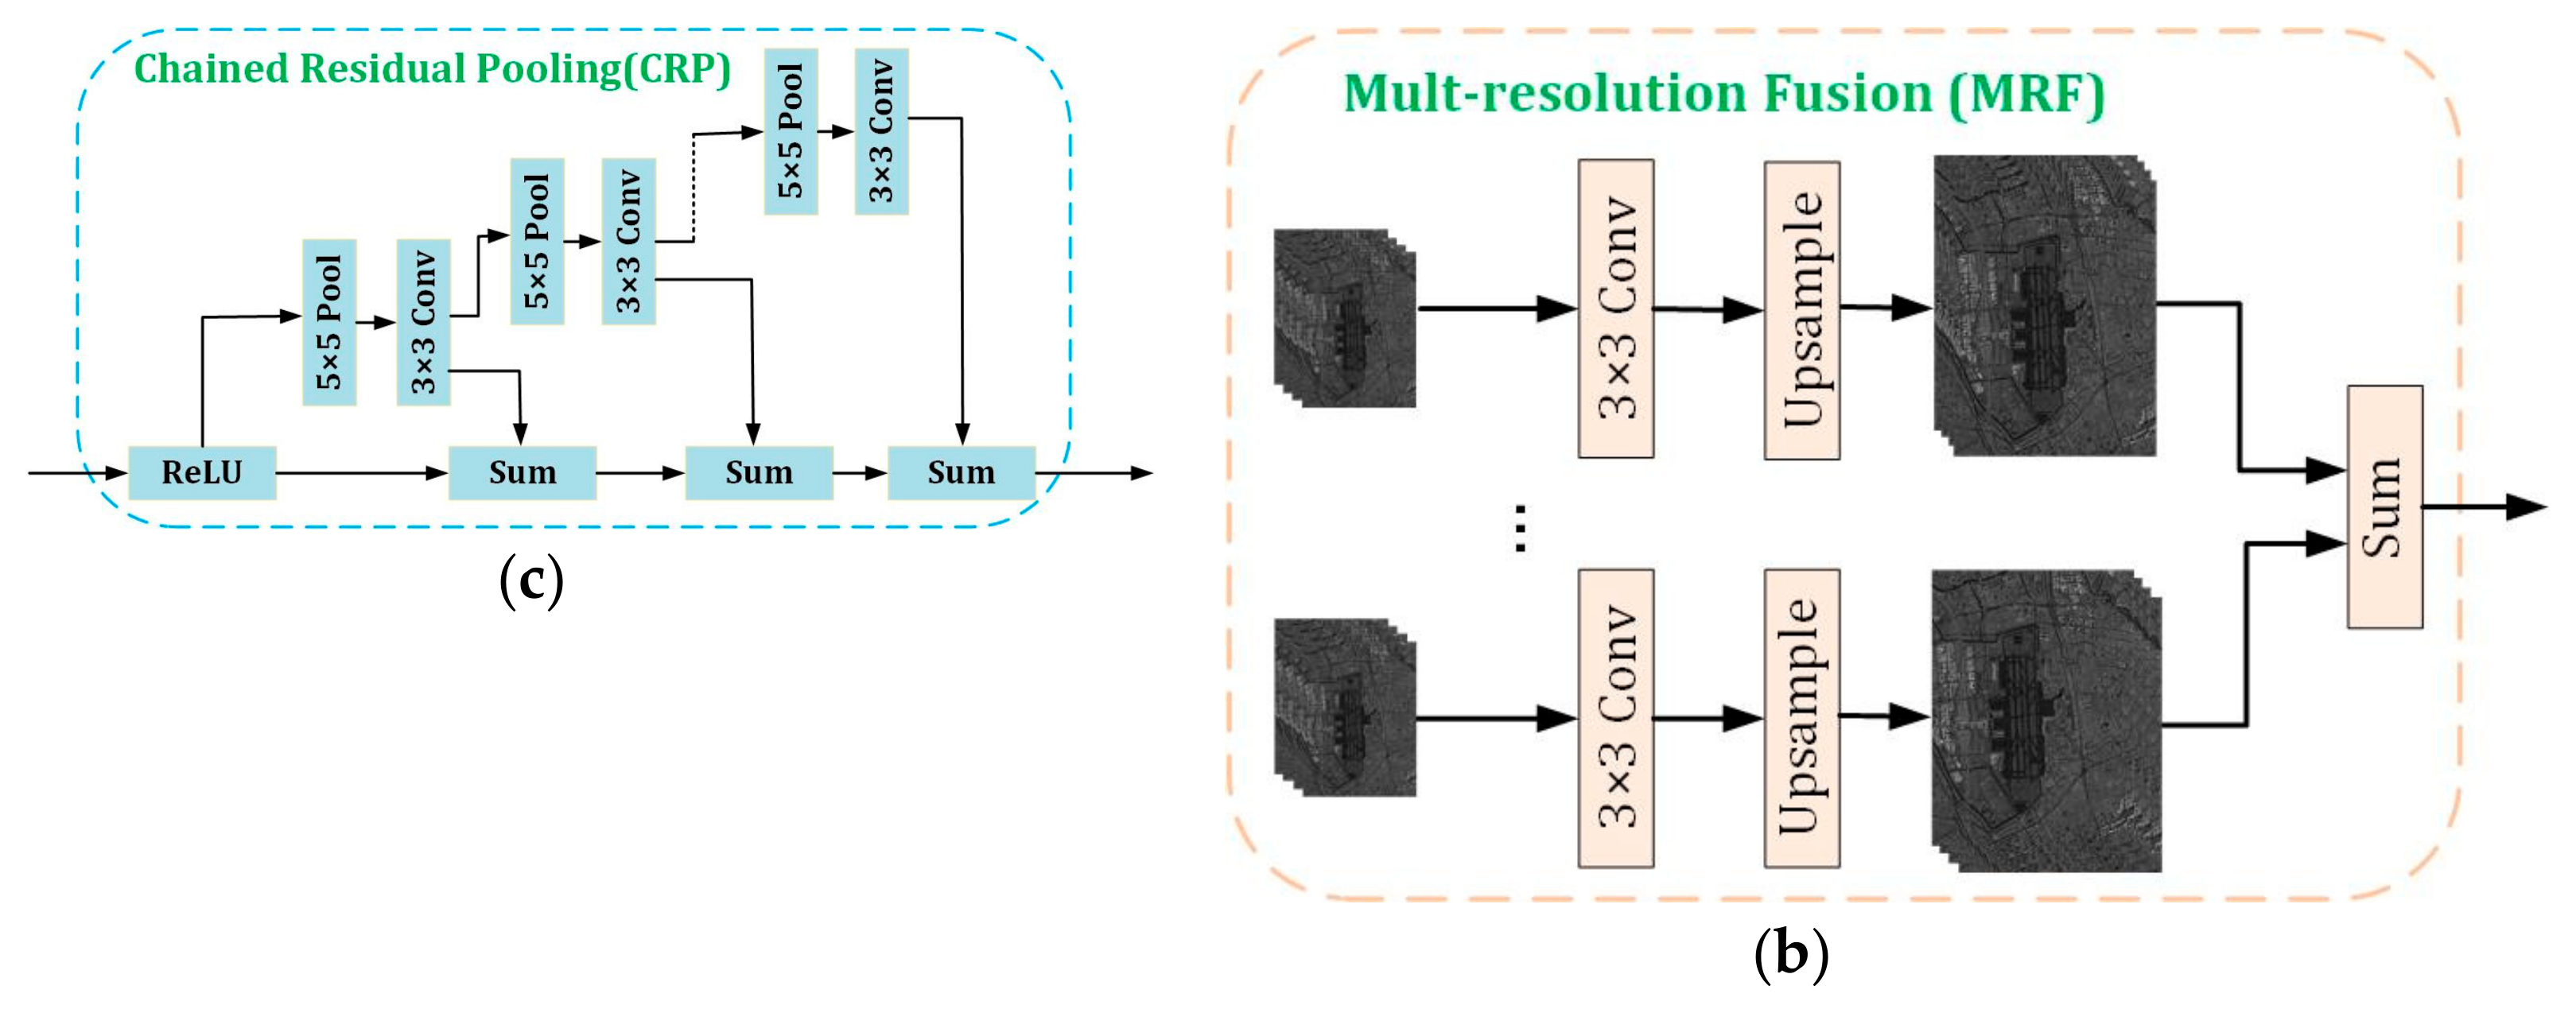
- A new deep neural network is presented to accomplish airport extraction from SAR images, which is the multi-level and densely dual attention (MDDA) network. It mainly contains two parts, the encoder and the decoder. The encoder employs the ResNet-101 to extract features with different levels. In the decoder, the features of different levels are fully utilized through dense connection, and then the essential features of the airport are extracted by using the CRP_Net_x (1, 2, 3) modules and dual attention fusion and extraction (DAFE) module to realize the airport extraction. In the DAFE module, the dual attention is introduced to fuse global semantic information via weighting spatial position and channels to extract more distinguishing features.
- (3)
- The proposed framework MDDA is implemented and the performance of airport extraction is evaluated by using large-scale Gaofen-3 SAR images with a 1-m resolution.
2. State-Of-The-Art
3. Methodology
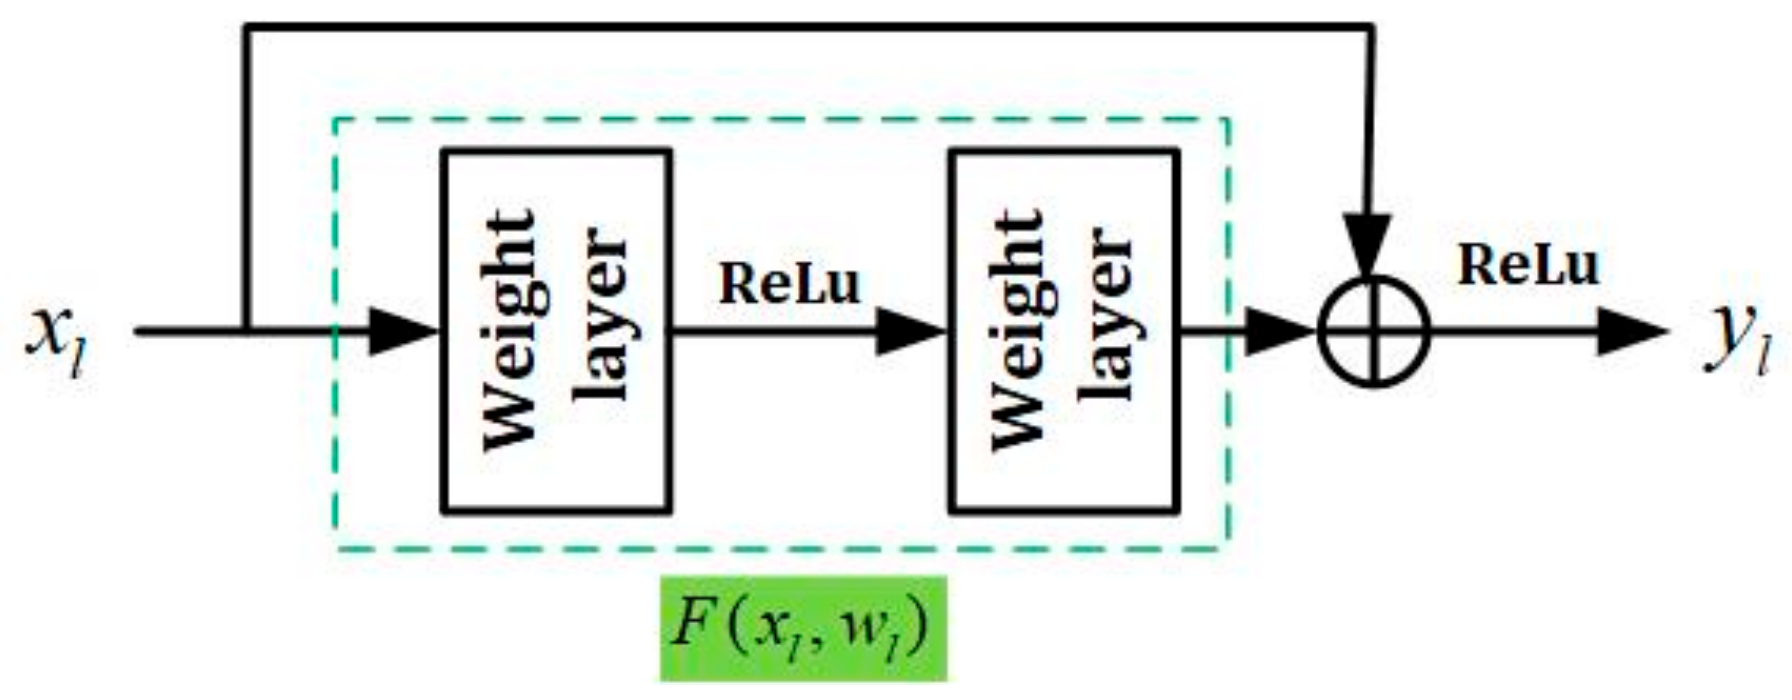
3.1. Residual Network
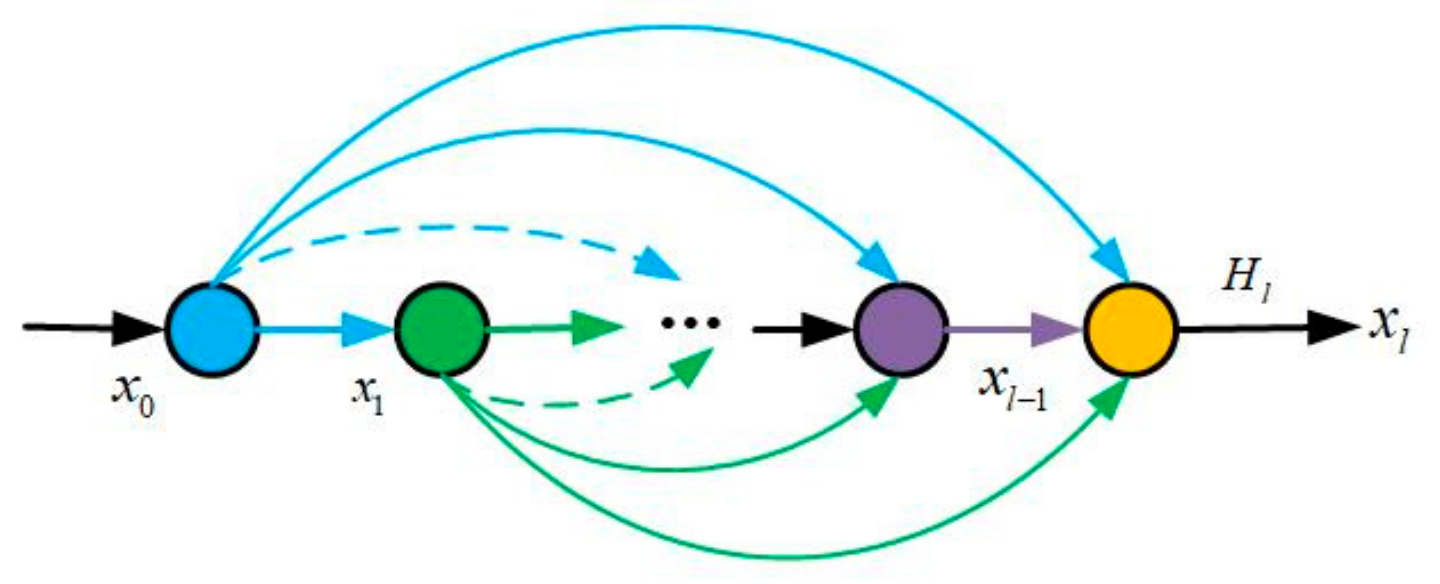
3.2. Dense Connection
3.3. Dual-Attention Mechanism
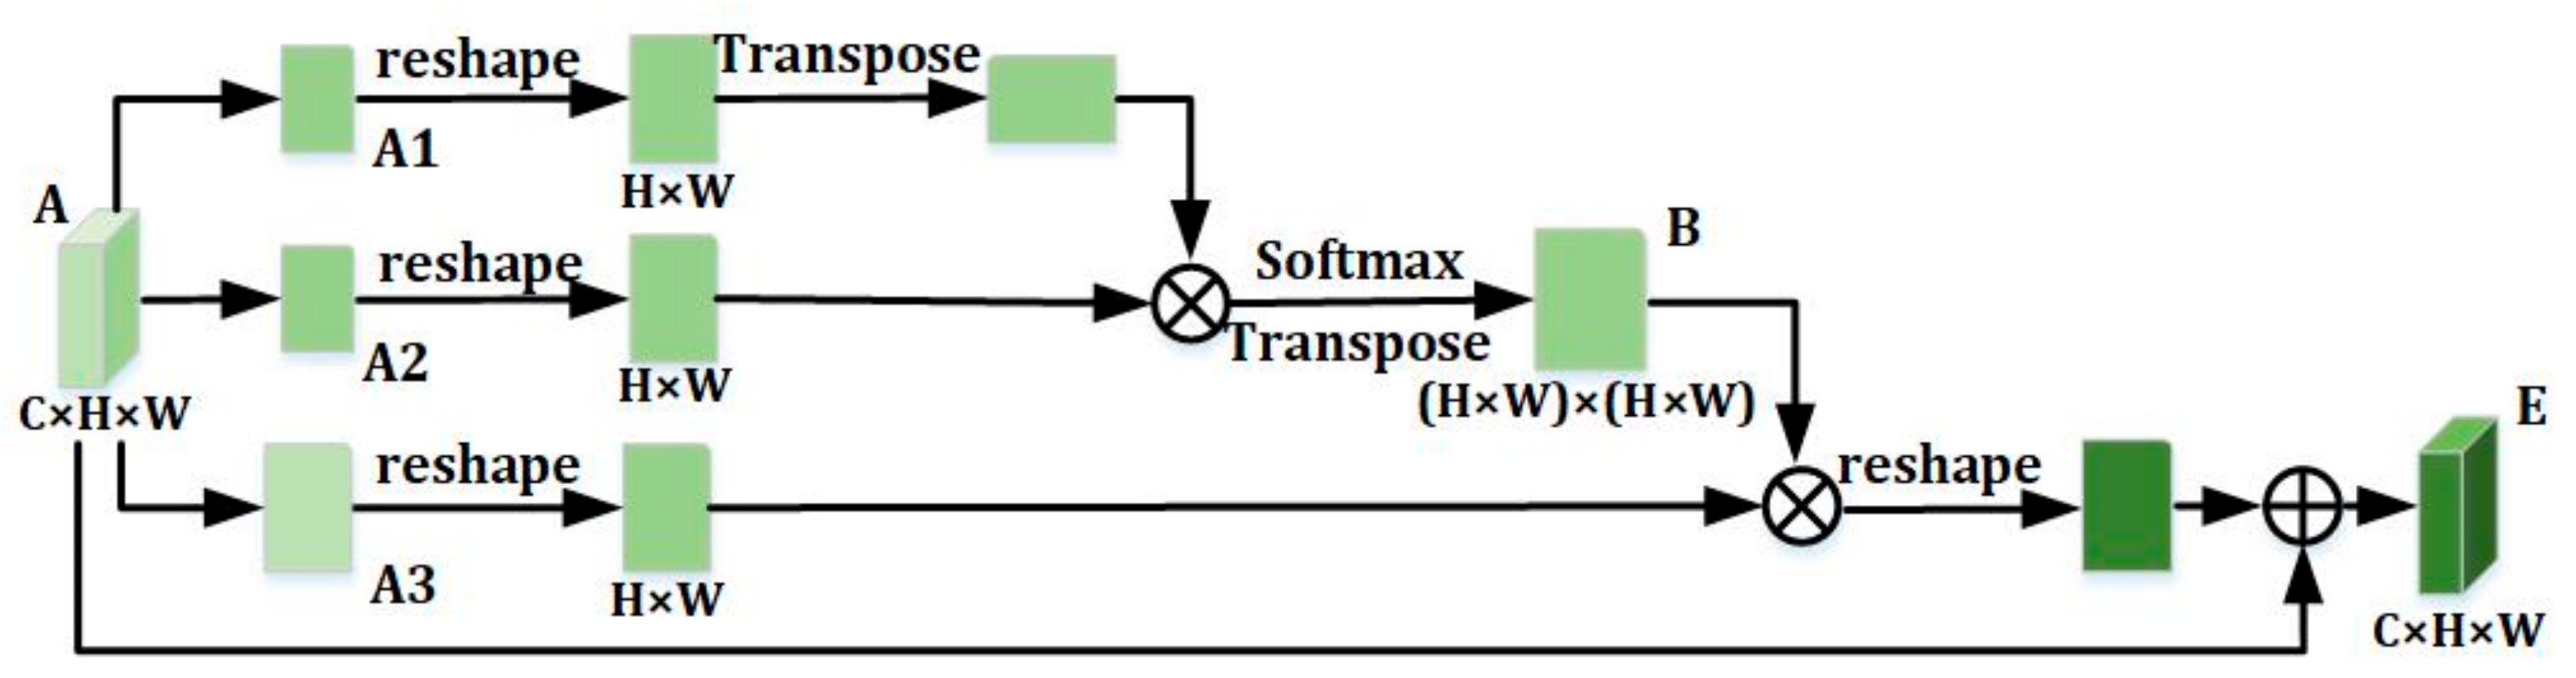
- Position Attention Module (PAM)
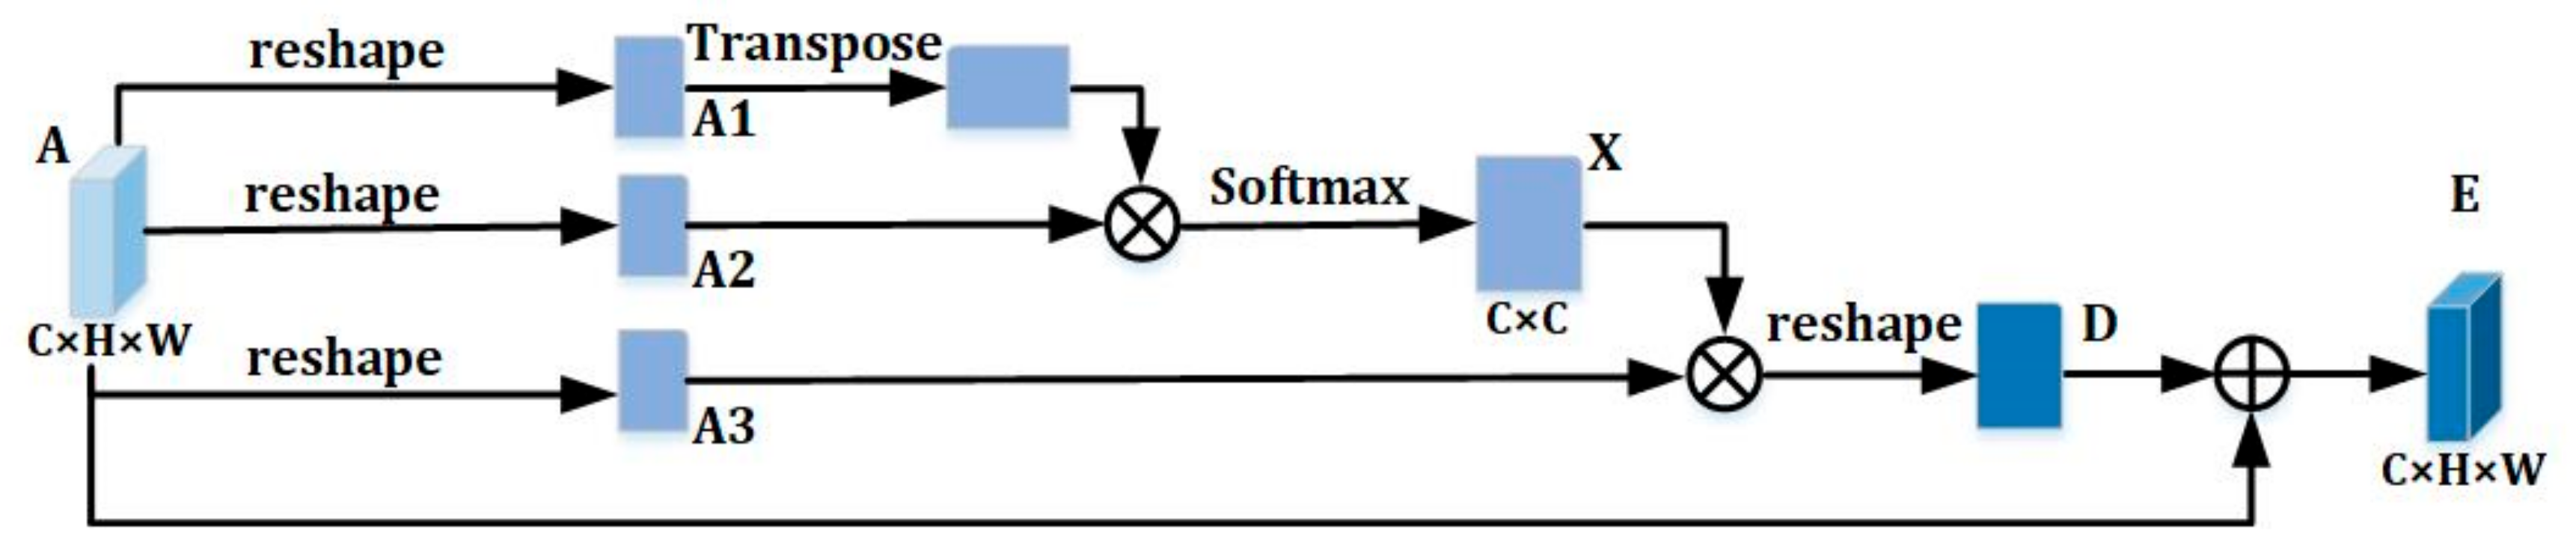
- Channel Attention Module (CAM)
3.4. The Proposed Automatic Airport Extraction Algorithm
3.4.1. Dense Connection
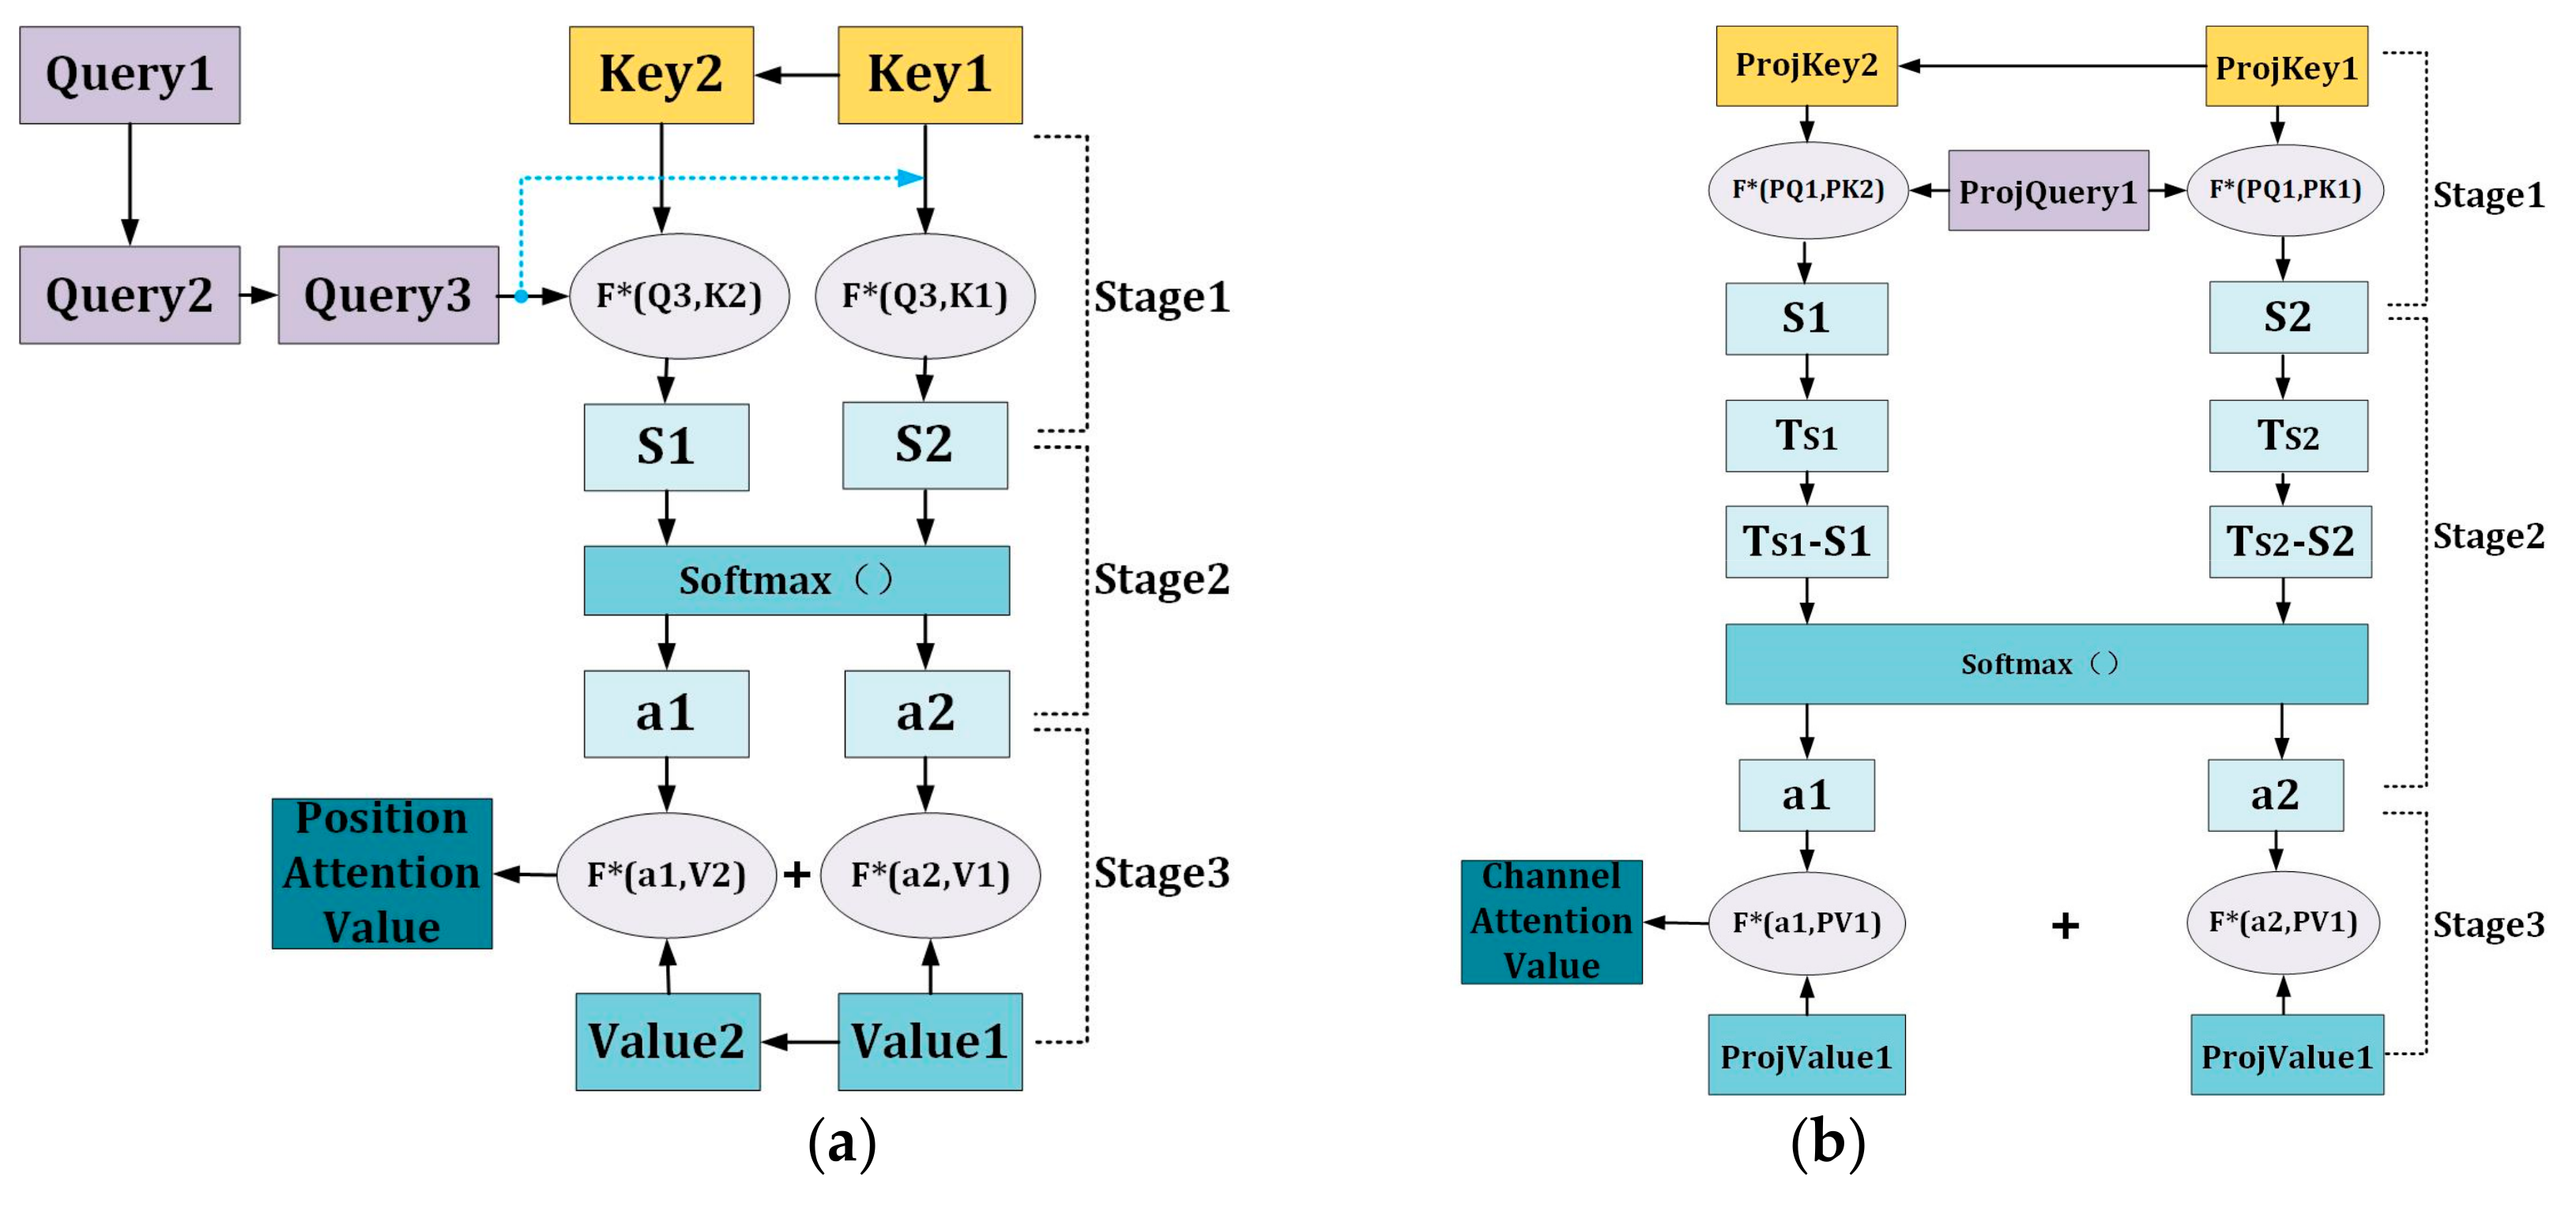
3.4.2. Dual Attention Mechanism
- The implementation of PAM
- The implementation of CAM
3.5. The Training Process of the Framework
- (1)
- Initializing of input data: the coding network loads training data from the ImageNet pre-trained model.
- (2)
- The loaded training data are input to ResNet-101 to extract multi-level features.
- (3)
- The decoding network fuses and re-extracts the features extracted by the coding network. Of which, dense connections enhance gradient propagation between features, and dual-attention selects the features by weights.
- (4)
- Back propagation (BP) algorithm performs end-to-end training for the whole network.
- (5)
- The softmax function calculates the probabilities that the network output is mapped to the runway and background categories by the following formula.
4. Experiment and Results
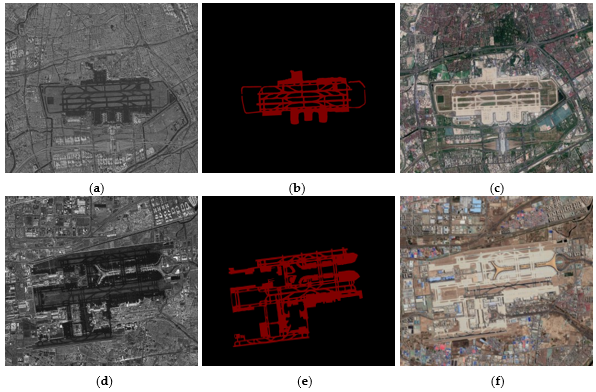
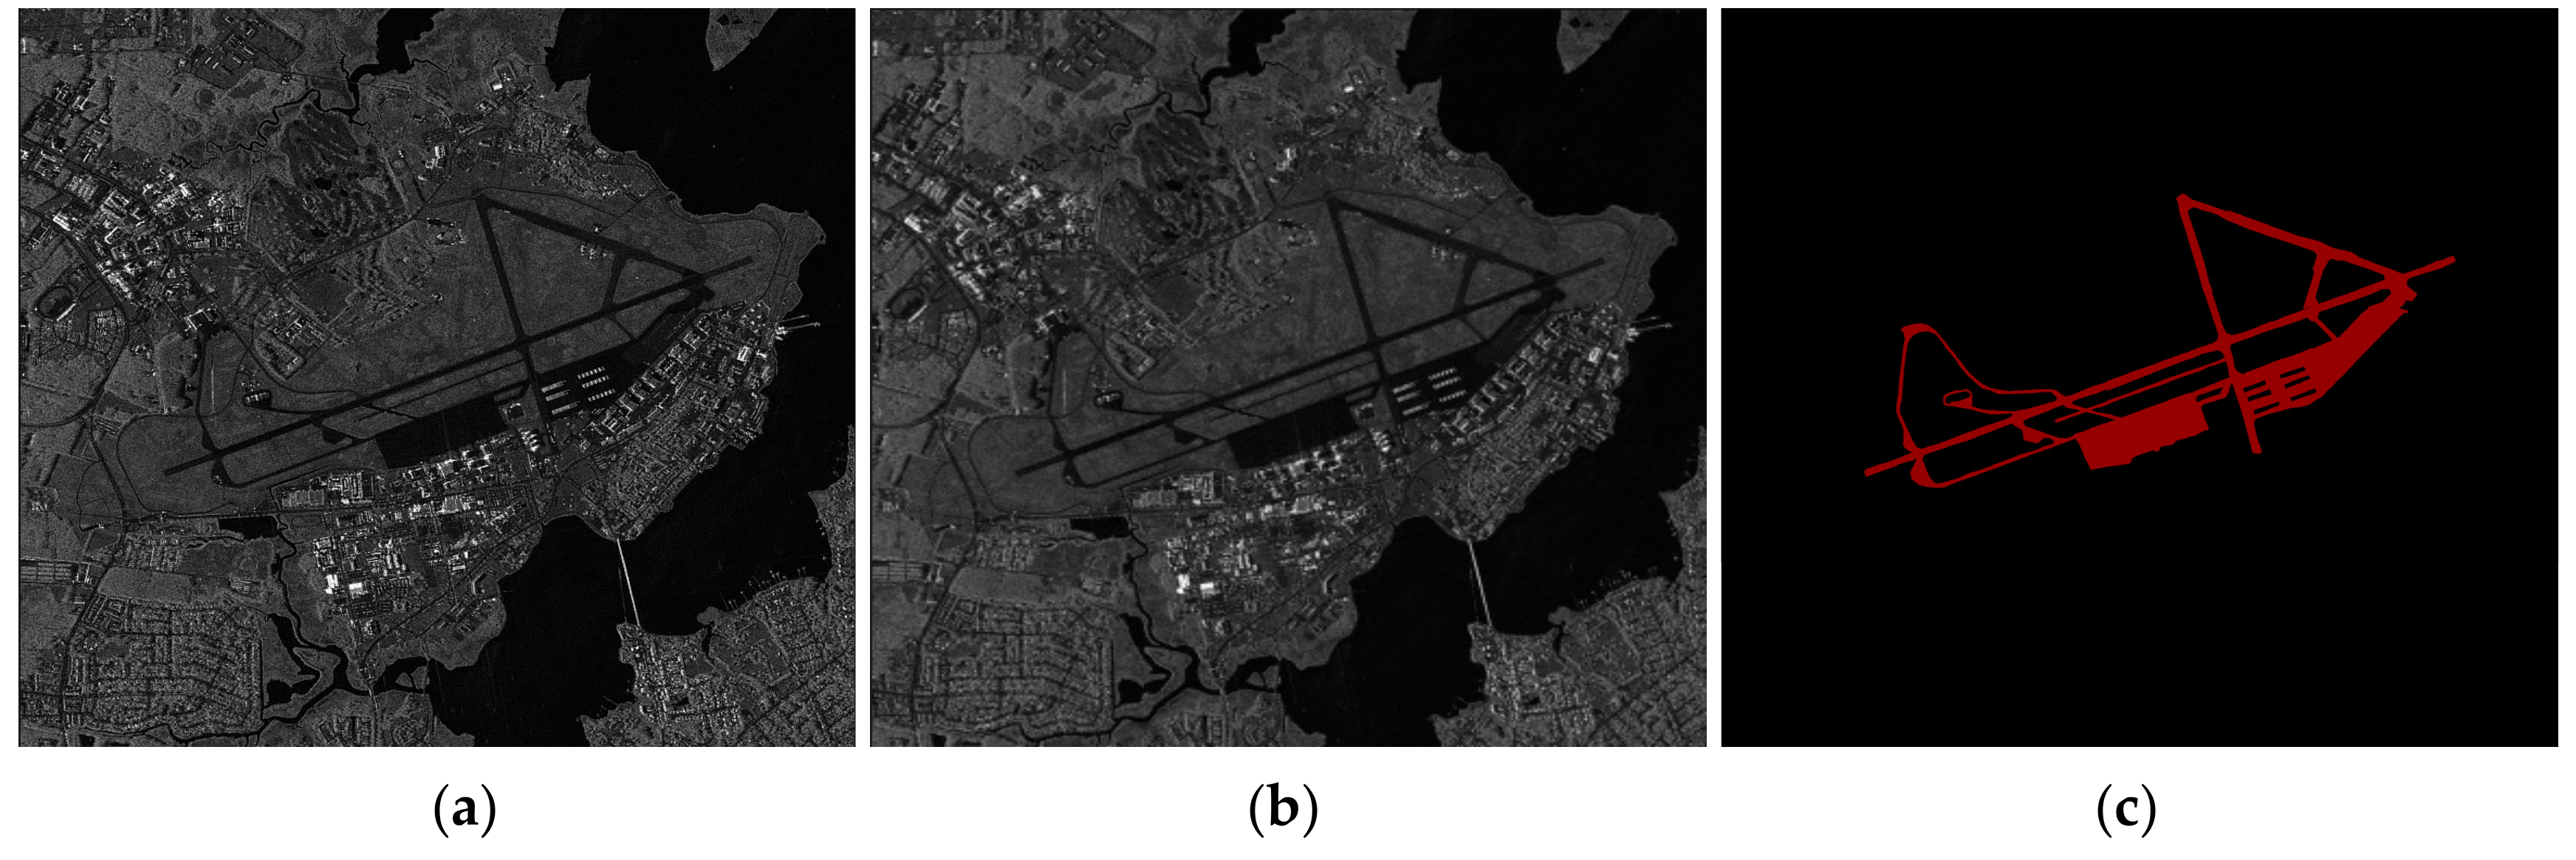
4.1. Dataset Used in the Experiment
4.2. Evaluation Measurements
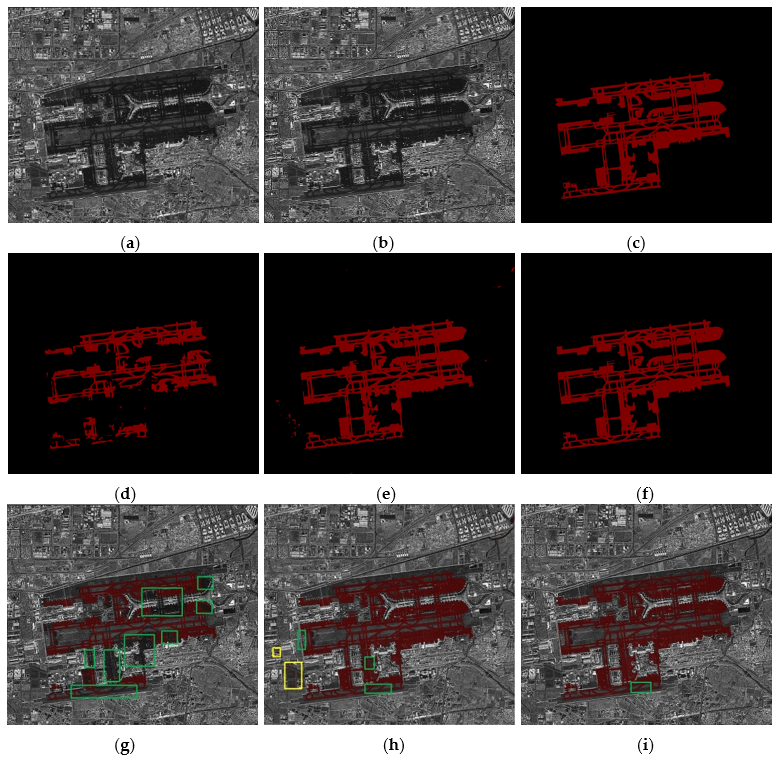
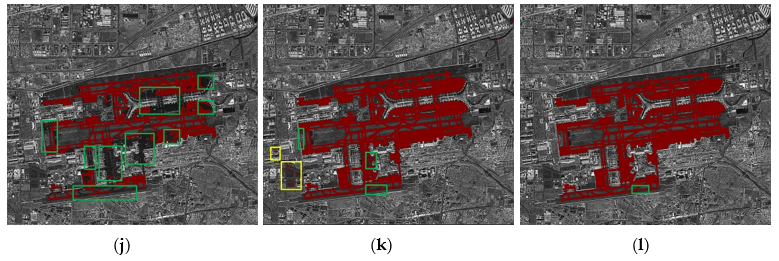
4.3. Experiment Analysis and Evaluation
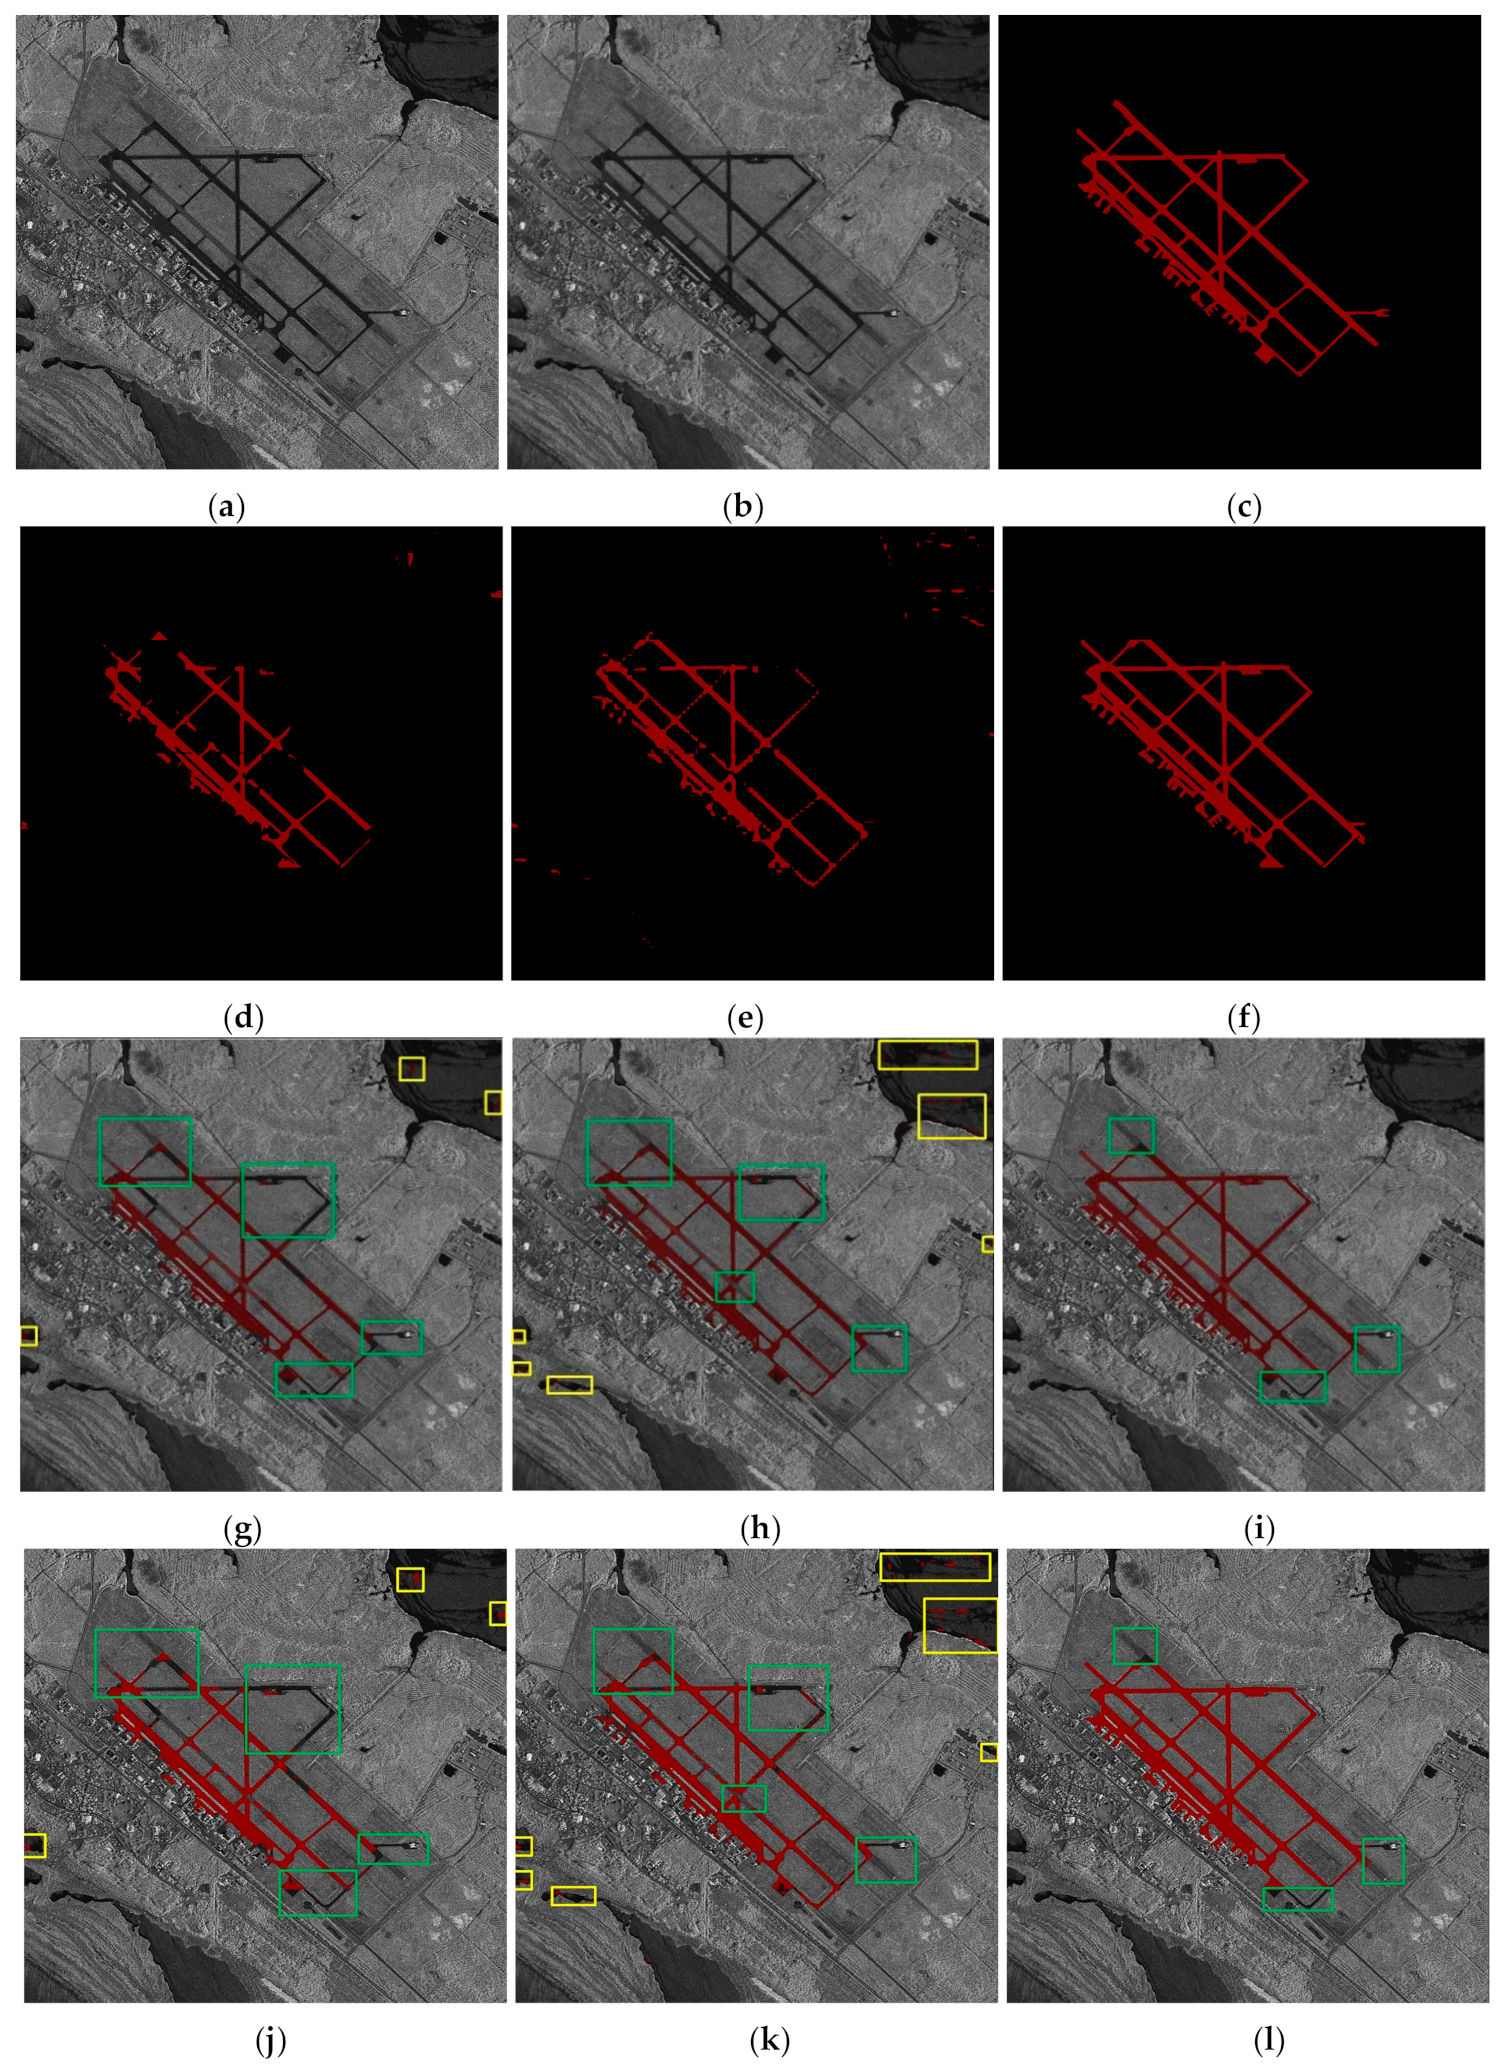
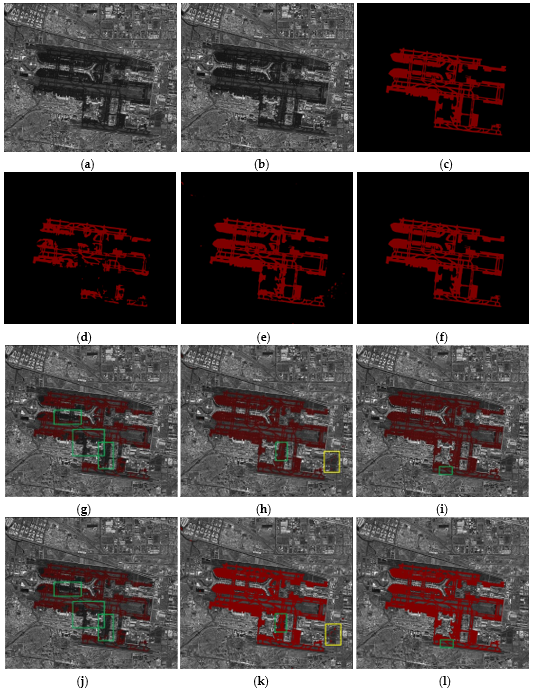
- The extraction result of Airport I
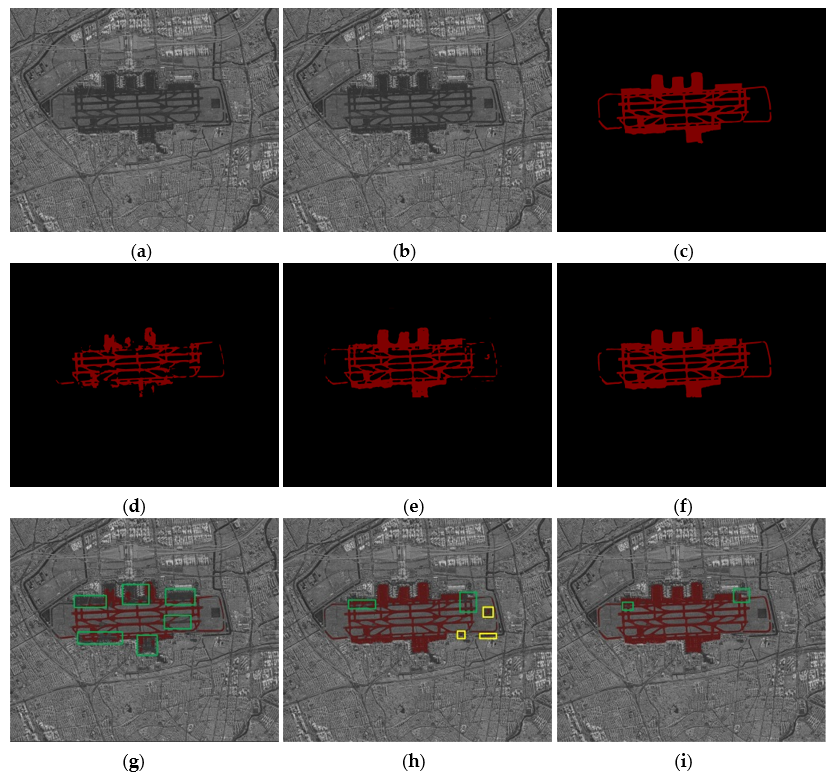
- The result of Airport II
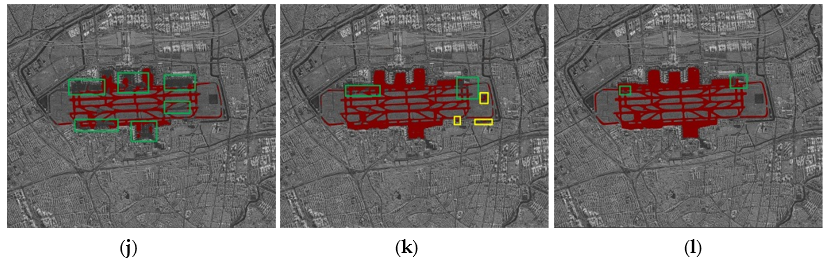
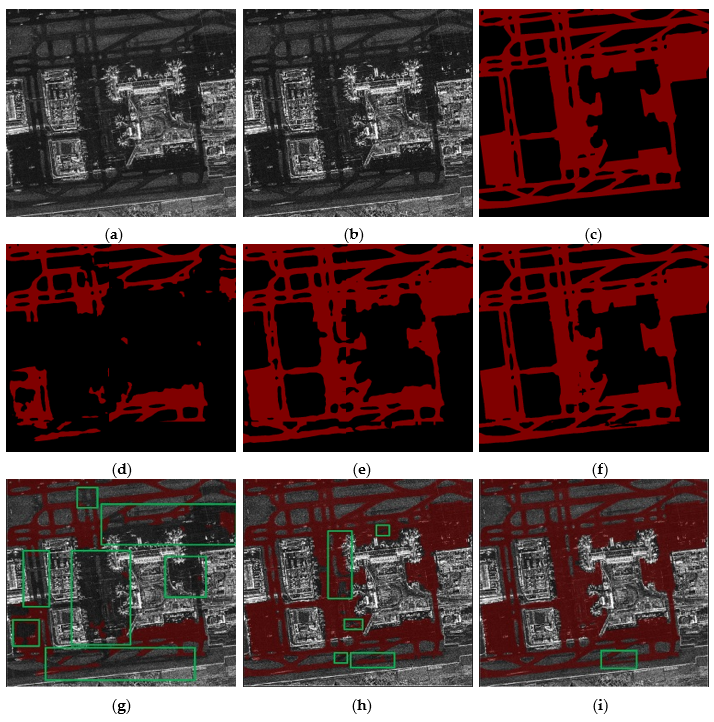
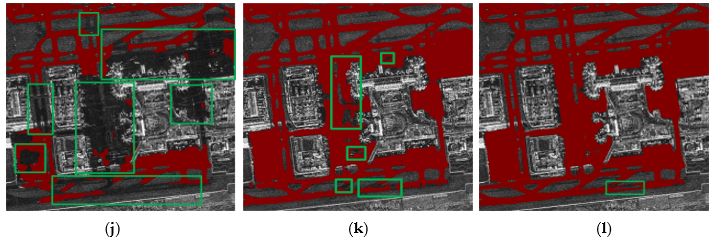
- The result of Airport III
- The result of Airport IV
5. Discussion
6. Conclusions
Author Contributions
Funding
Conflicts of Interest
References
- Ferretti, A.; MontiGuarnieri, A. InSAR Principles-Guidelines for SAR Interferometry Processing and Interpretation. J. Financ. Stabil. 2007, 19, 156–162. [Google Scholar] [CrossRef] [Green Version]
- Zhang, L.P.; Zhang, H. A Fast Method of Airport Detection in Large 2 scale SAR Image with High Resolution. J. Image Gr. 2010, 15, 1112–1120. [Google Scholar] [CrossRef]
- Yan, J.; Xu, J.; Ai, S.; Li, D.; Wang, Z. Airport runway detection algorithm based on local multi-features. Chin. J. Sci. Instrum. 2014, 35, 1714–1720. [Google Scholar]
- Zhu, D.; Wang, B. Airport detection based on near parallelity of line segments and GBVS saliency. J. Infrared Millim. Waves 2015, 34, 375–384. [Google Scholar] [CrossRef]
- Kou, Z.; Shi, Z.; Liu, L. Airport detection based on Line Segment Detector. In Proceedings of the International Conference on Computer Vision in Remote Sensing, Xiamen, China, 16 December 2012; pp. 1–6. [Google Scholar]
- Xiong, W.; Zhong, J.; Zhou, Y. Automatic recognition of airfield runways based on Radon transform and hypothesis testing in SAR images. In Proceedings of the Global Symposium on Millimeter-Waves, Harbin, China, 27–30 May 2012; pp. 462–465. [Google Scholar]
- Zhu, D.; Wang, B. Airport Target Detection in Remote Sensing Images: A New Method Based on Two-Way Saliency. IEEE Geosci. Remote Sens. Lett. 2015, 12, 1096–1100. [Google Scholar] [CrossRef]
- Liu, N.; Cui, Z. Airport Detection in Large-Scale SAR Images via Line Segment Grouping and Saliency Analysis. IEEE Geosci. Remote Sens. 2018, 15, 434–438. [Google Scholar] [CrossRef]
- Zhang, L.; Zhang, H. A method of Airport Extraction Based on Template searching from High Resolution SAR Image. Remote Sens. Inf. 2010, 2, 30–35. [Google Scholar] [CrossRef]
- Hinton, G.E.; Salakhutdinov, R.R. Reducing the dimensionality of data with neural networks. Science 2006, 313, 504–507. [Google Scholar] [CrossRef] [Green Version]
- Chang, L.; Deng, X.M. Convolutional Neural Networks in Image Understanding. Acta Autom. Sin. 2016, 42, 1300–1312. [Google Scholar] [CrossRef]
- Jonathan, L.; Shelhamer, E.; Darrell, T. Fully Convolutional Networks for Semantic Segmentation. In Proceedings of the IEEE Conference on Computer Vision and Pattern Recognition, Boston, MA, USA, 7–12 June 2015; pp. 3431–3440. [Google Scholar]
- Tang, H.; He, C. SAR image scece classification with fully convolutional network and modified conditional random field-recurrent neural network. J. Comput. Appl. 2016, 36, 3436–3441. [Google Scholar] [CrossRef]
- Badrinarayanan, V.; Kendall, A. SegNet: A Deep Convolutional Encoder-Decoder Architecture for Scene Segmentation. IEEE Trans. Pattern Anal. Mach. Intell. 2017, 39, 2481–2495. [Google Scholar] [CrossRef]
- Chen, L.C.; George, P. Semantic Image Segmentation with Deep Convolutional Nets and Fully Connected CRFs. arXiv 2014, arXiv:1412.7062v4. [Google Scholar]
- Chen, L.C.; George, P. DeepLab: Semantic Image Segmentation with Deep Convolutional Nets, Atrous Convolution, and Fully Connected CRFs. IEEE Trans. Pattern Anal. Mach. Intell. 2016, 40, 834–848. [Google Scholar] [CrossRef] [PubMed]
- Lin, G.; Anton, M.; Shen, C. RefineNet: Multi-path Refinement Networks for High-Resolution Semantic Segmentation. In Proceedings of the IEEE Conference on Computer Vision and Pattern Recognition, Honolulu, HI, USA, 21–26 July 2017; pp. 1925–1934. [Google Scholar]
- Peng, C.; Zhang, X.; Yu, G. Large Kernel Matters—Improve Semantic Segmentation by Global Convolutional Network. In Proceedings of the IEEE Conference on Computer Vision and Pattern Recognition, Honolulu, HI, USA, 21–26 July 2017; pp. 1743–1751. [Google Scholar]
- Zhang, Z.; Zhang, X.; Peng, C. ExFuse: Enhancing Feature Fusion for Semantic Segmentation. In Proceedings of the European Conference on Computer Vision, Munich, Germany, 8–14 September 2018; pp. 273–288. [Google Scholar]
- Zhang, H.; Shi, J.; Qi, X. Pyramid Scene Parsing Network. In Proceedings of the IEEE Conference on Computer Vision and Pattern Recognition, Honolulu, HI, USA, 21–26 July 2017; pp. 6230–6239. [Google Scholar]
- Liang-Chieh, C.; Papandreou, G. Rethinking Atrous Convolution for Semantic Image Segmentation. arXiv 2017, arXiv:1706.05587v3. [Google Scholar]
- Chen, L.; George, P. Encoder-Decoder with Atrous separable convolution for semantic image segmentation. In Proceedings of the European Conference on Computer Vision, Munich, Germany, 8–14 September 2018; pp. 801–818. [Google Scholar]
- Liu, C.; Chen, L.C.; Schroff, F. Auto-DeepLab: Hierarchical Neural Architecture Search for Semantic Image Segmentation. In Proceedings of the IEEE Conference on Computer Vision and Pattern Recognition, Long Beach, CA, USA, 16–20 June 2019; pp. 82–92. [Google Scholar]
- Yu, D.; Zhang, N. Airport detection using convolutional neural network and salient feature. Bull. Surv. Mapp. 2019, 7, 44–49. [Google Scholar] [CrossRef]
- Xiao, Z.; Gong, Y. Airport Detection Based on a Multiscale Fusion Feature for Optical Remote Sensing Images. IEEE Geosci. Remote Sens. Lett. 2017, 14, 1469–1473. [Google Scholar] [CrossRef]
- Zeng, F.; Cheng, L. A Hierarchical Airport Detection Method Using Spatial Analysis and Deep Learning. Remote Sens. 2019, 11, 2204. [Google Scholar] [CrossRef] [Green Version]
- Li, S.; Xu, Y. Remote Sensing Airport Detection Based on End-to-End Deep Transferable Convolutional Neural Networks. IEEE Geosci. Remote Sens. Lett. 2019, 16, 1640–1644. [Google Scholar] [CrossRef]
- He, K.; Zhang, X.; Ren, S. Deep Residual Learning for Image Recognition. In Proceedings of the IEEE Conference on Computer Vision and Pattern Recognition, Las Vegas, NV, USA, 26 June–1 July 2016; pp. 770–778. [Google Scholar]
- He, K.; Zhang, X.; Ren, S. Identity Mappings in Deep Residual Networks. In Proceedings of the European Conference on Computer Vision, Amsterdam, The Netherlands, 11–14 October 2016; pp. 630–645. [Google Scholar]
- Huang, G.; Liu, Z.; Laurens, V.D.M. Densely Connected Convolutional Networks. In Proceedings of the IEEE Conference on Computer Vision and Pattern Recognition, Honolulu, HI, USA, 21–26 July 2017; pp. 4700–4708. [Google Scholar]
- Zhang, P.; Chen, L. Automatic Extraction of Water and Shadow from SAR Images Based on a Multi-Resolution Dense Encoder and Decoder Network. Sensors 2019, 19, 3576. [Google Scholar] [CrossRef] [Green Version]
- Chen, L.; Cui, X. A New Deep Learning Algorithm for SAR Scene Classification Based on Spatial Statistical Modeling and Features Re-Calibration. Sensors 2019, 19, 2479. [Google Scholar] [CrossRef] [Green Version]
- Fu, J.; Liu, J.; Tian, H. Dual Attention Network for Scene Segmentation. In Proceedings of the IEEE Conference on Computer Vision and Pattern Recognition, Long Beach, CA, USA, 16–20 June 2019; pp. 3146–3154. [Google Scholar]
- Garcia-Garcia, A.; Orts-Escolano, S. A Review on Deep Learning Techniques Applied to Semantic Segmentation. arXiv 2017, arXiv:1704.06857. [Google Scholar]


| Network | Airports | Runway Areas | Background | ||||
|---|---|---|---|---|---|---|---|
| PA | IoU | PA | IoU | MPA | MIoU | ||
| RefineNet | Airport I | 0.6386 | 0.6306 | 0.9980 | 0.9447 | 0.8188 | 0.7877 |
| Airport II | 0.8995 | 0.8552 | 0.9977 | 0.9932 | 0.9486 | 0.9242 | |
| Airport III | 0.6062 | 0.5957 | 0.9990 | 0.9772 | 0.8026 | 0.7865 | |
| Airport IV | 0.6024 | 0.5946 | 0.9990 | 0.9698 | 0.8007 | 0.7822 | |
| Mean | 0.8427 | 0.8202 | |||||
| DeepLabV3 | Airport I | 0.9452 | 0.8891 | 0.9901 | 0.9817 | 0.9677 | 0.9354 |
| Airport II | 0.8875 | 0.4619 | 0.9588 | 0.9540 | 0.9232 | 0.7228 | |
| Airport III | 0.6689 | 0.6411 | 0.9975 | 0.9792 | 0.8332 | 0.8102 | |
| Airport IV | 0.8288 | 0.8166 | 0.9989 | 0.9861 | 0.9139 | 0.9014 | |
| Mean | 0.9095 | 0.8425 | |||||
| MDDA Net | Airport I | 0.9849 | 0.9706 | 0.9977 | 0.9953 | 0.9913 | 0.9830 |
| Airport II | 0.9845 | 0.9609 | 0.9989 | 0.9982 | 0.9917 | 0.9796 | |
| Airport III | 0.9189 | 0.9016 | 0.9989 | 0.9943 | 0.9589 | 0.9480 | |
| Airport IV | 0.9664 | 0.9486 | 0.9986 | 0.9960 | 0.9825 | 0.9723 | |
| Mean | 0.9811 | 0.9707 | |||||
| Network | Airports | Runway Areas | Background | ||||
|---|---|---|---|---|---|---|---|
| PA | IoU | PA | IoU | MPA | MIoU | ||
| RefineNet | Airport I | 0.6384 | 0.6305 | 0.9982 | 0.9448 | 0.8189 | 0.7878 |
| Airport II | 0.8998 | 0.8555 | 0.9978 | 0.9933 | 0.9488 | 0.9245 | |
| Airport III | 0.6058 | 0.5955 | 0.9988 | 0.9770 | 0.8022 | 0.7860 | |
| Airport IV | 0.6029 | 0.5948 | 0.9993 | 0.9700 | 0.8010 | 0.7826 | |
| Mean | 0.8427 | 0.8200 | |||||
| DeepLabV3 | Airport I | 0.9458 | 0.8896 | 0.9906 | 0.9822 | 0.9681 | 0.9359 |
| Airport II | 0.8879 | 0.4622 | 0.9594 | 0.9545 | 0.9237 | 0.7232 | |
| Airport III | 0.6695 | 0.6415 | 0.9981 | 0.9797 | 0.8338 | 0.8107 | |
| Airport IV | 0.8286 | 0.8165 | 0.9986 | 0.9860 | 0.9137 | 0.9013 | |
| Mean | 0.9098 | 0.8428 | |||||
| MDDA Net | Airport I | 0.9855 | 0.9709 | 0.9981 | 0.9956 | 0.9916 | 0.9833 |
| Airport II | 0.9844 | 0.9608 | 0.9990 | 0.9982 | 0.9918 | 0.9796 | |
| Airport III | 0.9187 | 0.9015 | 0.9991 | 0.9945 | 0.9590 | 0.9482 | |
| Airport IV | 0.9665 | 0.9487 | 0.9988 | 0.9961 | 0.9827 | 0.9724 | |
| Mean | 0.9813 | 0.9709 | |||||
© 2020 by the authors. Licensee MDPI, Basel, Switzerland. This article is an open access article distributed under the terms and conditions of the Creative Commons Attribution (CC BY) license (http://creativecommons.org/licenses/by/4.0/).
Share and Cite
Chen, L.; Tan, S.; Pan, Z.; Xing, J.; Yuan, Z.; Xing, X.; Zhang, P. A New Framework for Automatic Airports Extraction from SAR Images Using Multi-Level Dual Attention Mechanism. Remote Sens. 2020, 12, 560. https://0-doi-org.brum.beds.ac.uk/10.3390/rs12030560
Chen L, Tan S, Pan Z, Xing J, Yuan Z, Xing X, Zhang P. A New Framework for Automatic Airports Extraction from SAR Images Using Multi-Level Dual Attention Mechanism. Remote Sensing. 2020; 12(3):560. https://0-doi-org.brum.beds.ac.uk/10.3390/rs12030560
Chicago/Turabian StyleChen, Lifu, Siyu Tan, Zhouhao Pan, Jin Xing, Zhihui Yuan, Xuemin Xing, and Peng Zhang. 2020. "A New Framework for Automatic Airports Extraction from SAR Images Using Multi-Level Dual Attention Mechanism" Remote Sensing 12, no. 3: 560. https://0-doi-org.brum.beds.ac.uk/10.3390/rs12030560