Article

A Semiautomatic Pixel-Object Method for Detecting Landslides Using Multitemporal ALOS-2 Intensity Images

1
Geoinformatics Unit, RIKEN Center for Advanced Intelligence Project, Tokyo 103-0027, Japan
2
Graduate School of Engineering, Hiroshima University, Higashi-Hiroshima 739-8527, Japan
3
Department of Architecture and Building Engineering, Tokyo Institute of Technology, Yokohama 226-8502, Japan
4
International Research Institute of Disaster Science, Tohoku University, Aoba-Ku, Sendai 980-8752, Japan
*
Author to whom correspondence should be addressed.
Submission received: 10 January 2020 / Revised: 3 February 2020 / Accepted: 5 February 2020 / Published: 8 February 2020

Abstract

:
The rapid and accurate mapping of large-scale landslides and other mass movement disasters is crucial for prompt disaster response efforts and immediate recovery planning. As such, remote sensing information, especially from synthetic aperture radar (SAR) sensors, has significant advantages over cloud-covered optical imagery and conventional field survey campaigns. In this work, we introduced an integrated pixel-object image analysis framework for landslide recognition using SAR data. The robustness of our proposed methodology was demonstrated by mapping two different source-induced landslide events, namely, the debris flows following the torrential rainfall that fell over Hiroshima, Japan, in early July 2018 and the coseismic landslide that followed the 2018 Mw6.7 Hokkaido earthquake. For both events, only a pair of SAR images acquired before and after each disaster by the Advanced Land Observing Satellite-2 (ALOS-2) was used. Additional information, such as digital elevation model (DEM) and land cover information, was employed only to constrain the damage detected in the affected areas. We verified the accuracy of our method by comparing it with the available reference data. The detection results showed an acceptable correlation with the reference data in terms of the locations of damage. Numerical evaluations indicated that our methodology could detect landslides with an accuracy exceeding 80%. In addition, the kappa coefficients for the Hiroshima and Hokkaido events were 0.30 and 0.47, respectively.

1. Introduction

Landslides are significant disasters that occur around the world, causing severe damage to infrastructures and widespread loss of human lives [1,2]. Landslides triggered by seismic activity or heavy rain are often among the most destructive and largest in scale [3,4,5]. For instance, in early August 2010, debris flows in Zhouqu, western China, wrought destruction over a land area exceeding 11,472 m 2 , damaging 53 buildings and killing 1765 people [6,7]. In addition, the aftershocks of the 2015 M7.5 Nepal earthquake triggered landslides at several locations, including on Mount Everest, where 21 people were killed; the most destructive landslide struck Langtang Valley, where 350 people lost their lives [8,9]. In this context, Earth observation technologies represent some of the best methods for monitoring and assessing post-disaster damage following major landslides. Particularly in the post-disaster phase, it is essential to rapidly identify the extent of destruction to support rescue and aid efforts. In recent years, optical and synthetic aperture radar (SAR) datasets have often been used for large-scale landslide mapping and monitoring. On the one hand, optical imaging can provide an easy-to-interpret overview of affected areas. As described by Guzzettiat et al. [10], the visual interpretation of optical imagery is particularly efficient for detecting fresh landslides; additionally, in areas where signs left by terrain failure are visible, images acquired before and after the landslide event can be utilized effectively. On the other hand, this technique is ordinarily time-consuming and requires significant human effort; as such, this method is not suitable for rapid damage response endeavors.
Approaches that adopt optical data traditionally exploit the spectral characteristics of soil and vegetation to detect landslide-induced damage. Yang et al. [11] presented a methodology using images of the normalized difference vegetation index (NDVI) computed from a multitemporal Moderate Resolution Imaging Spectroradiometer (MODIS) dataset to identify the spatial distribution of landslides induced by the 2008 Wenchuan earthquake in China; they proposed a suitable threshold value for the temporal difference between NDVI images by using visually interpreted landslide segments from high-resolution images as a reference. A similar NDVI-based approach using higher-resolution SPOT-5 imagery was utilized to detect and classify the landslides triggered in northern Taiwan by Typhoon Aere in 2004 and Typhoon Matsa in 2005 [12]; in addition to finding an appropriate threshold for NDVI difference images, they introduced an object-based image segmentation approach to classify the debris flow areas resulting from both events. Kurtz et al. also performed a study using multiresolution optical data [3]. Mondini et al., [13,14] implemented semiautomatic approaches to classify rainfall-induced landslides using machine learning algorithms and a combination of features derived from high-resolution aerial photographs, multitemporal satellite imagery, and high-resolution topography data. They used historical information to train their adopted machine learning classifiers; then mapped landslides produced by a later event in the same area. They found that landslide areas can be detected accurately in non-urban using NDVI and spectral relationships derived from multitemporal optical imagery. Object-oriented approaches have also been suggested to support feature extraction tasks. Such methodologies that leverage the application of object-based analysis to optical imagery primarily apply segmentation techniques to form objects composed of neighboring pixels with similar textural and color features; then, objects that capture the patterns produced by landslides can be detected using classification techniques [15,16]. Similar to previous pixel-based approaches, these methodologies have also been developed and validated using specific landslide types.
On the other hand, SAR remote sensing datasets, which can be acquired under almost all weather and illumination conditions, are primarily employed to analyze the damage caused by seismically induced mass movements [17,18]. The phase information derived from bitemporal or multitemporal SAR datasets is broadly used to compute coherence maps that illustrate the phase changes before and after the disasters linked to damaged areas. In this context, SAR interferometry (InSAR) analysis is utilized primarily to detect variations in the land surface caused by landslides [19,20,21,22,23]. The fusion of Earth observation platforms with other technologies can provide further details regarding the damage condition of a particular region. For instance, pixel offset tracking was applied to a high-resolution SAR dataset together with ground measurements to monitor temporal landslide deformation [24]. Mondini [25] introduced a different procedure to measure landslide-induced changes from multitemporal SAR intensity imagery; this method computes pixel-based correlation images to analyze the areas corresponding to landslides. Mondini found that the size of a landslide limits the ability of SAR data to detect areas linked to slope failures. Alternatively, Miura [5] proposed a methodology for estimating the volume of a debris flow using a fusion of optical data, a digital surface model, and numerical simulation analysis.
In recent years, machine learning algorithms have become popular for mapping landslide damage using primarily optical imagery [26,27,28]. Nevertheless, although these approaches can yield a good accuracy for the classification of damage caused by a landslide, the strong dependency of these algorithms on extensive and high-quality training data hampers their applicability to rapid disaster response scenarios. The abovementioned methodologies share common characteristics:
  • These techniques were applied predominantly to relatively small site-specific study areas. This condition is applied mainly to methodologies based on optical imagery, for which the acquisition of data is always hampered by the weather conditions around the affected area.
  • These techniques were originally developed for specific types of disasters. Consequently, the accuracies of these methodologies in the characterization of different types of landslide events, such as rainfall- and seismic-induced landslides, are unknown.
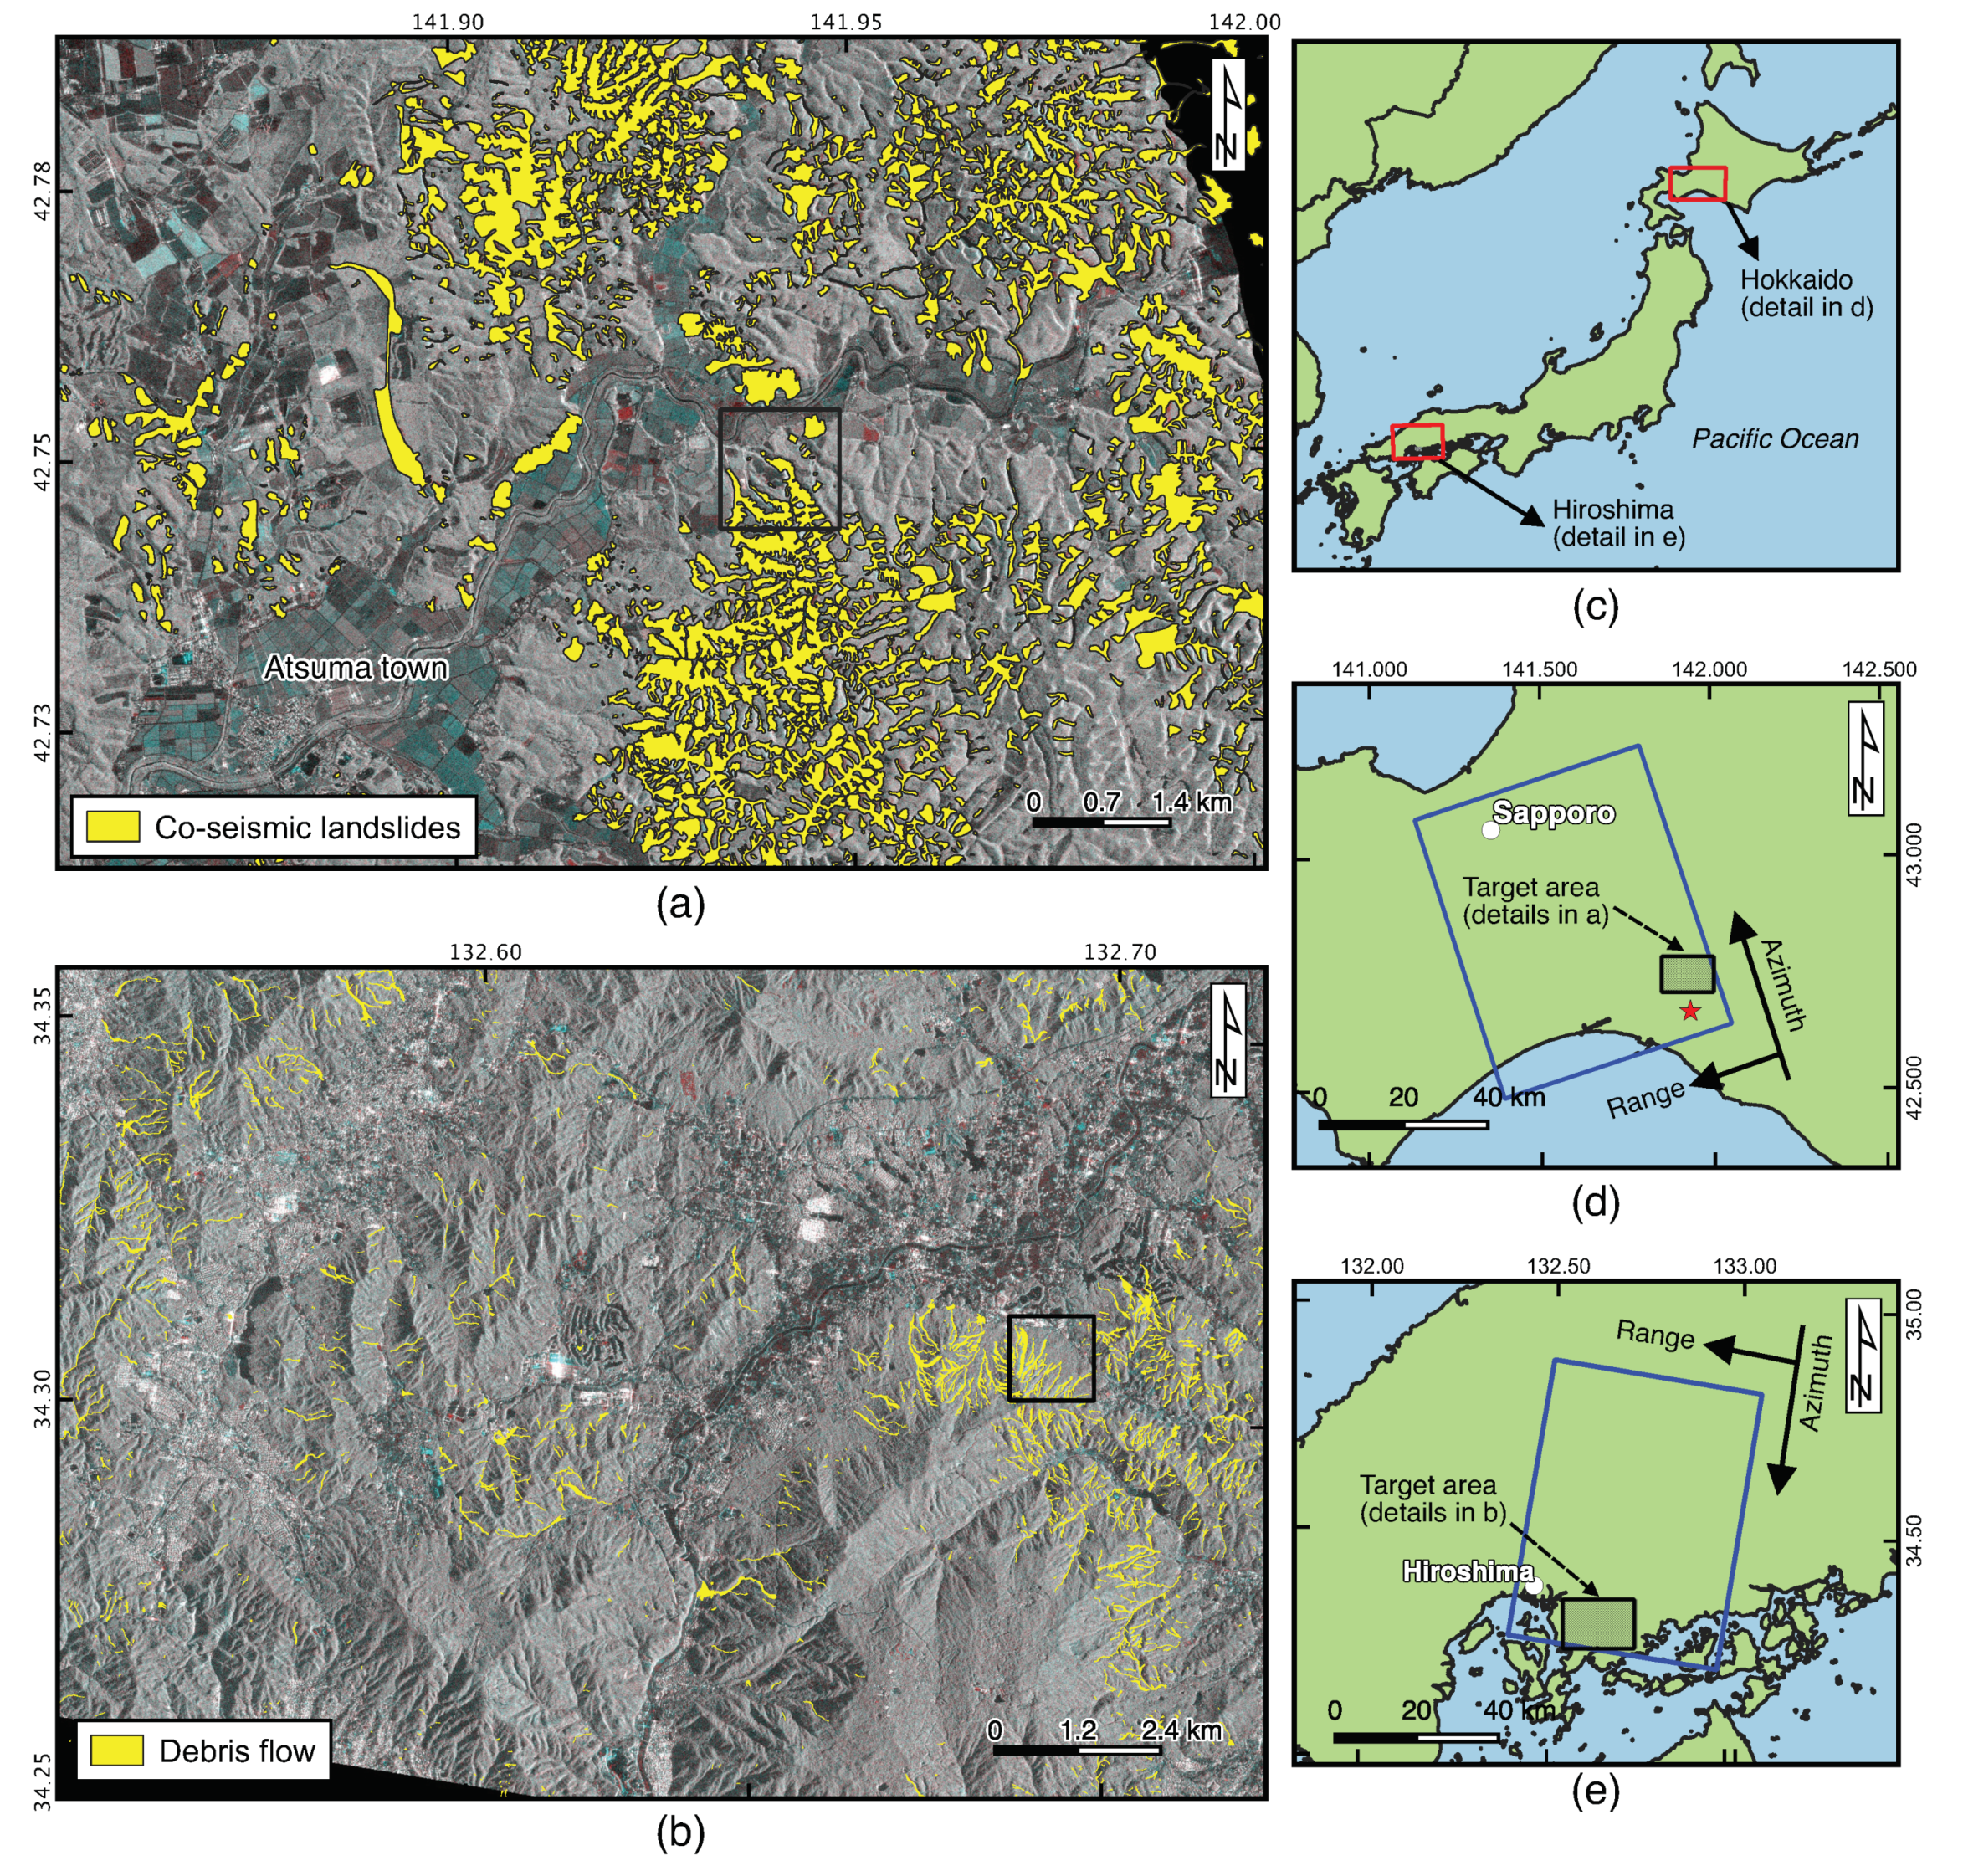
In this study, we propose a fusion of pixel- and object-based image analysis techniques to detect the damage attributable to mass movements, such as debris flows and coseismic landslides, using multitemporal SAR intensity images for two different source-induced landslide events. The objective of the proposed method is to rapidly estimate the location, shape, and size of a landslide. Accordingly, the proposed framework, which utilizes an adaptive threshold and object analysis in consideration of the geometric properties of SAR intensity images, is capable of detecting different types of landslides accurately with robustness against both speckle noise and intensity variations due to the SAR sensing geometry.

2. Case Studies

We select two target areas for testing our proposed methodology. Both study areas are located in Japan (Figure 1c). The first study area corresponds to the Hiroshima region, which was affected by large debris flows and flooding that were triggered by torrential rains. The second study area is located in the Hokkaido region (Figure 1c), where a relatively large earthquake triggered numerous landslides. In Figure 1d,e, the location of each target area is indicated by the dashed polygon.

2.1. The 2018 Torrential Rainfall Event in Western Japan

This study area is located in Hiroshima Prefecture, western Japan (Figure 1c). The land elevation in this region reaches approximately 700 m, and the land use is characterized predominantly by mountainous areas covered by forest (Figure 2). Rice paddy fields and urban settlements are also present between these mountainous regions. According to the Geological Survey of Japan, in this area, the primary types of rocks are Late Cretaceous granite (also known as Hiroshima Granite) and Middle to Late Jurassic accretionary complexes [29]. Additionally, heavy rainfall events have triggered debris flows throughout this study area in the past. In terms of property damage and human casualties, the most significant events occurred in July 1982, June 1999, and August 2014, while the most recent occurred in July 2018 [29,30]. In the July 2018 event, approximately 100 mm of rainfall was observed over a period of 3 h, and heavy rainfall was recorded for a total duration of 72 h [31].
In early July 2018, torrential rains that fell during Typhoon Prapiroon caused severe property damage and casualties throughout western Japan. This event affected several cities in Hiroshima and Okayama Prefectures. In particular, Okayama suffered extensive flooding that killed fifty-one people and inundated approximately 4600 homes [32]. In contrast, Hiroshima was affected mainly by numerous debris flows, resulting in a toll of 216 deaths and more than 20,000 damaged houses [33]. In this paper, we focus on the debris flows that occurred throughout Hiroshima Prefecture, which was the most heavily impacted during this event, with 108 human lives lost and infrastructure losses comprising approximately 15,551 damaged buildings [5]. The Geospatial Information Authority of Japan (GSI; https://www.gsi.go.jp/BOUSAI/H30.taihuu7gou.html) analyzed the starting point or source of each debris flow by visually interpreting aerial photographs. Additionally, the Association of Japanese Geographers (AJG) visually identified debris flow segments using high-resolution aerial photogrammetry [34]. Figure 1b shows the locations of the interpreted debris flows within the target area. In this study, we employ the AJG dataset as reference data to evaluate our results.

2.2. The 2018 Hokkaido Earthquake

This study area is located in the southwestern area of central Hokkaido (Figure 1c). This region is characterized by rugged, high-elevation terrain that is affected by two active faults, which trend almost northwest-southeast. Sandstone, mudstone, conglomerate, and tuffaceous sandstone originating mainly from the middle to late Miocene compose the geological strata in this area [35]. Figure 2 depicts the land use characteristics of the target region, showing that rice paddy fields and forested areas are predominant.
On 6 September 2018, a M6.7 earthquake occurred in the Hokkaido region (Figure 1c,d), eastern Japan, causing severe damage and casualties. This event, also known as the 2018 Hokkaido eastern Iburi earthquake, occurred one day after experiencing the heavy rain from Typhoon Jebi. According to Yamagishi and Yamazaki [36], the massive number of landslides reported during this event occurred because the ground shaking impacted the already soaked volcanic soil subsurface after the heavy rain. Most of the co-seismic landslides occurred around the town of Atsuma, where more than 5600 individual landslides were registered. Zhang et al. [35] performed a comprehensive analysis of the landslides in the study area. Most of the coseismic landslides were classified as shallow translation landslides with sizes of approximately 250 m. Crushed pumice with a thickness of approximately 1 m to 2 m covers most of the landslides. Official reports indicated that this earthquake destroyed more than 390 houses and damaged approximately 1061 buildings. A total of 41 human lives were lost, and more than 690 people were injured [35,37]. After the earthquake, GSI analyzed high-resolution aerial photographs and produced a detailed vector (polygon) map of the damage attributable to these landslides (the data are available at https://www.gsi.go.jp/BOUSAI/H30-hokkaidoiburi-east-earthquake-index.html). Figure 1a shows the locations of the interpreted coseismic landslides within the target area. In this study, we use the GSI dataset as reference data to evaluate our results.

3. Materials

The proposed methodology is developed primarily for multitemporal SAR intensity images using supporting information, such as land cover classes and digital elevation data. For both study areas, we utilize a set of scenes acquired before and after each disaster by the Advanced Land Observing Satellite-2 (ALOS-2) follow-on mission equipped with the second-generation Phased Array type L-band Synthetic Aperture Radar (PALSAR-2) sensor. Other sources of freely available datasets (aerial photographs acquired by Sentinel-2 and GSI) are used for reference only.

3.1. Synthetic Aperture Radar Dataset

In May 2014, the Japan Aerospace Exploration Agency (JAXA) launched the PALSAR-2 sensor onboard ALOS-2. The new PALSAR-2 sensor expands the observation range by implementing a right- and left-looking functionality with a revisit cycle of 14 days. The PALSAR-2 sensor has three acquisition modalities: (i) Spotlight mode, which provides a swath area of 25 × 25 km 2 and provides the finest resolutions of 3 m and 1 m in the range and azimuth directions, respectively; (ii) Stripmap mode, which offers a swath length between 50 km and 70 km with average resolutions of 3 m, 6 m, and 10 m for the ultrafine, highly sensitive, and fine submodes; and (iii) ScanSAR mode, which boasts the largest swath length (490 km for the wide submode) [38,39]. Disaster monitoring on a global scale is one of the main missions of the ALOS-2 system. As such, soon after the torrential rain that fell over the Hiroshima region in early July 2018 and the M6.7 earthquake that struck the Hokkaido region in early September 2018, high-resolution SAR data were acquired for post-disaster response purposes.
In the case of the early July event, most of the debris flows occurred between the evening of the 6th and the morning of the 7th [5]. For this event, we use a scene (acquired on 8 July) taken soon after the disaster. This PALSAR-2 scene was captured in Stripmap ultrafine mode on a descending track with a 48.5 incident angle; the scene was provided in single look complex (SLC) format (product level 1.1) with HH polarization. Additionally, a pre-event PALSAR-2 scene was acquired on 19 May 2015 under acquisition conditions similar to those in which the post-event scene was taken. On the other hand, in the case of the 2018 Hokkaido earthquake, a post-event PALSAR-2 image was acquired immediately after the seismic event; the origin time of the earthquake was 03:07:59 Japan Standard Time (JST), and the acquisition time for the post-event scene was 4:37:40 JST. The closest pre-event PALSAR-2 scene with similar acquisition conditions was acquired on 23 August 2018. Both of these PALSAR-2 images were similarly captured in Stripmap ultrafine mode but on an ascending track with a 37.8 incident angle; these data were also provided in product level 1.1 (SLC) with HH polarization. Table 1 lists the details of the PALSAR-2 data used in this study.

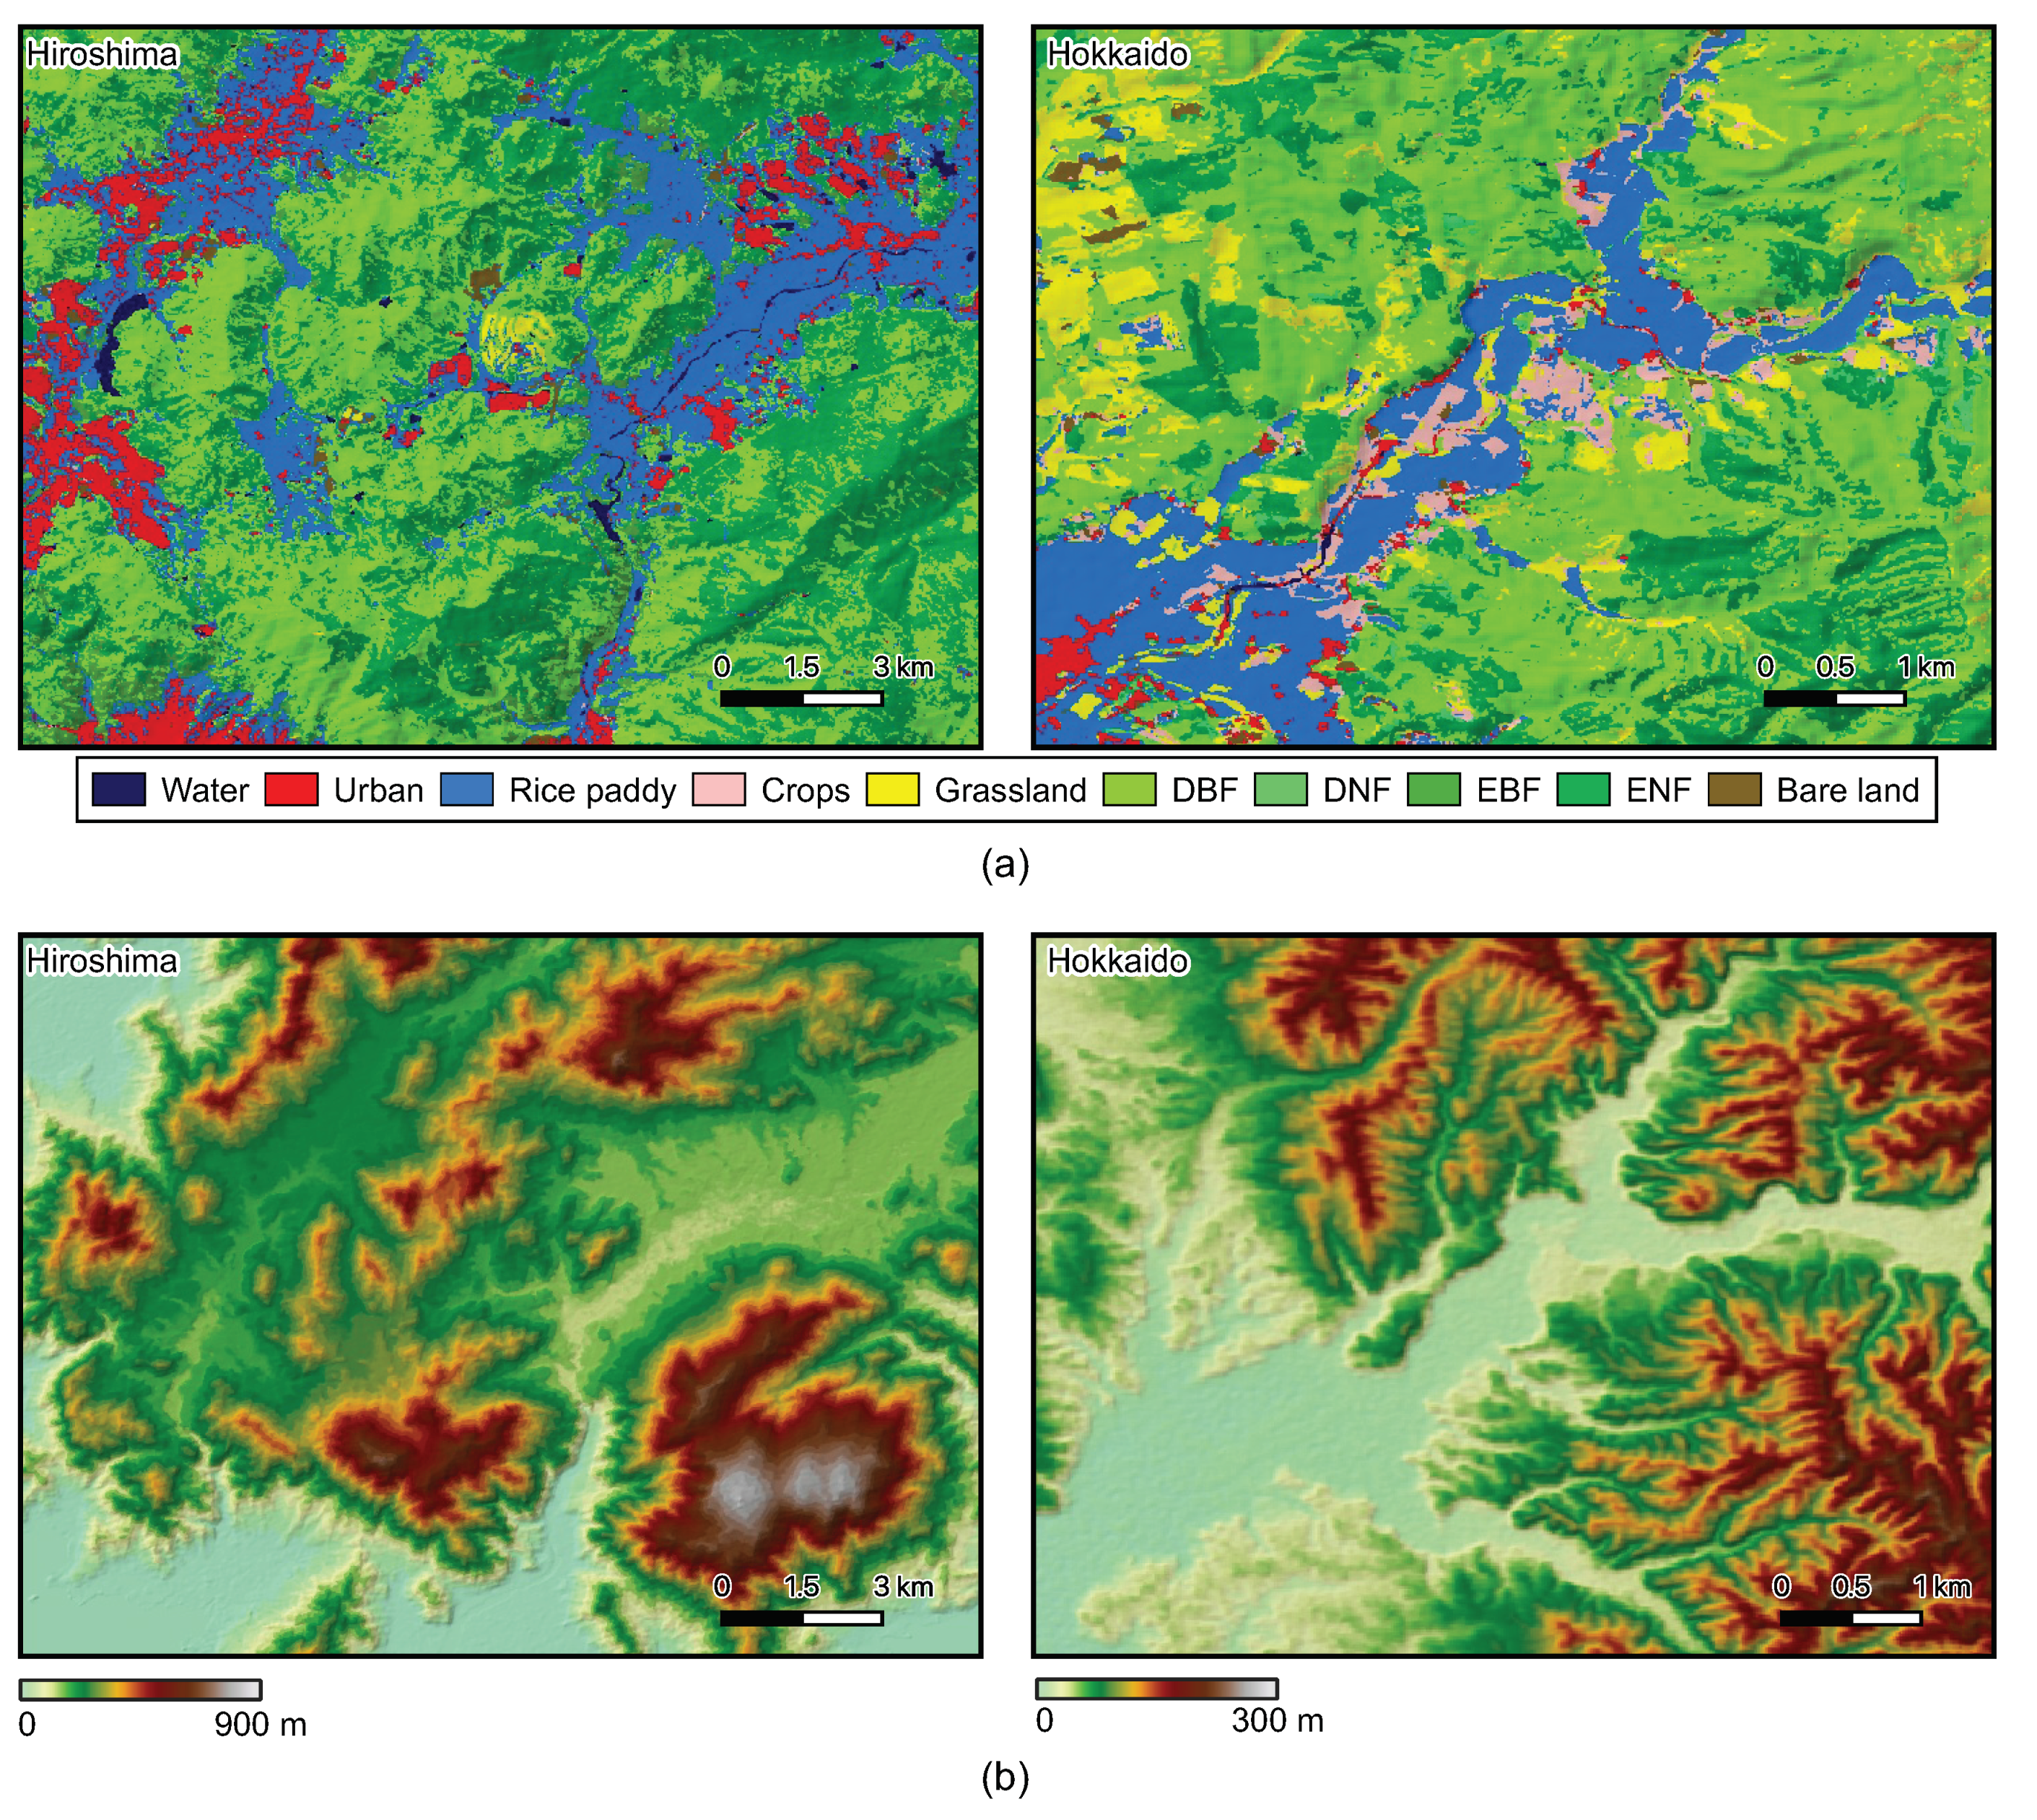
3.2. Land Cover and Digital Elevation Datasets
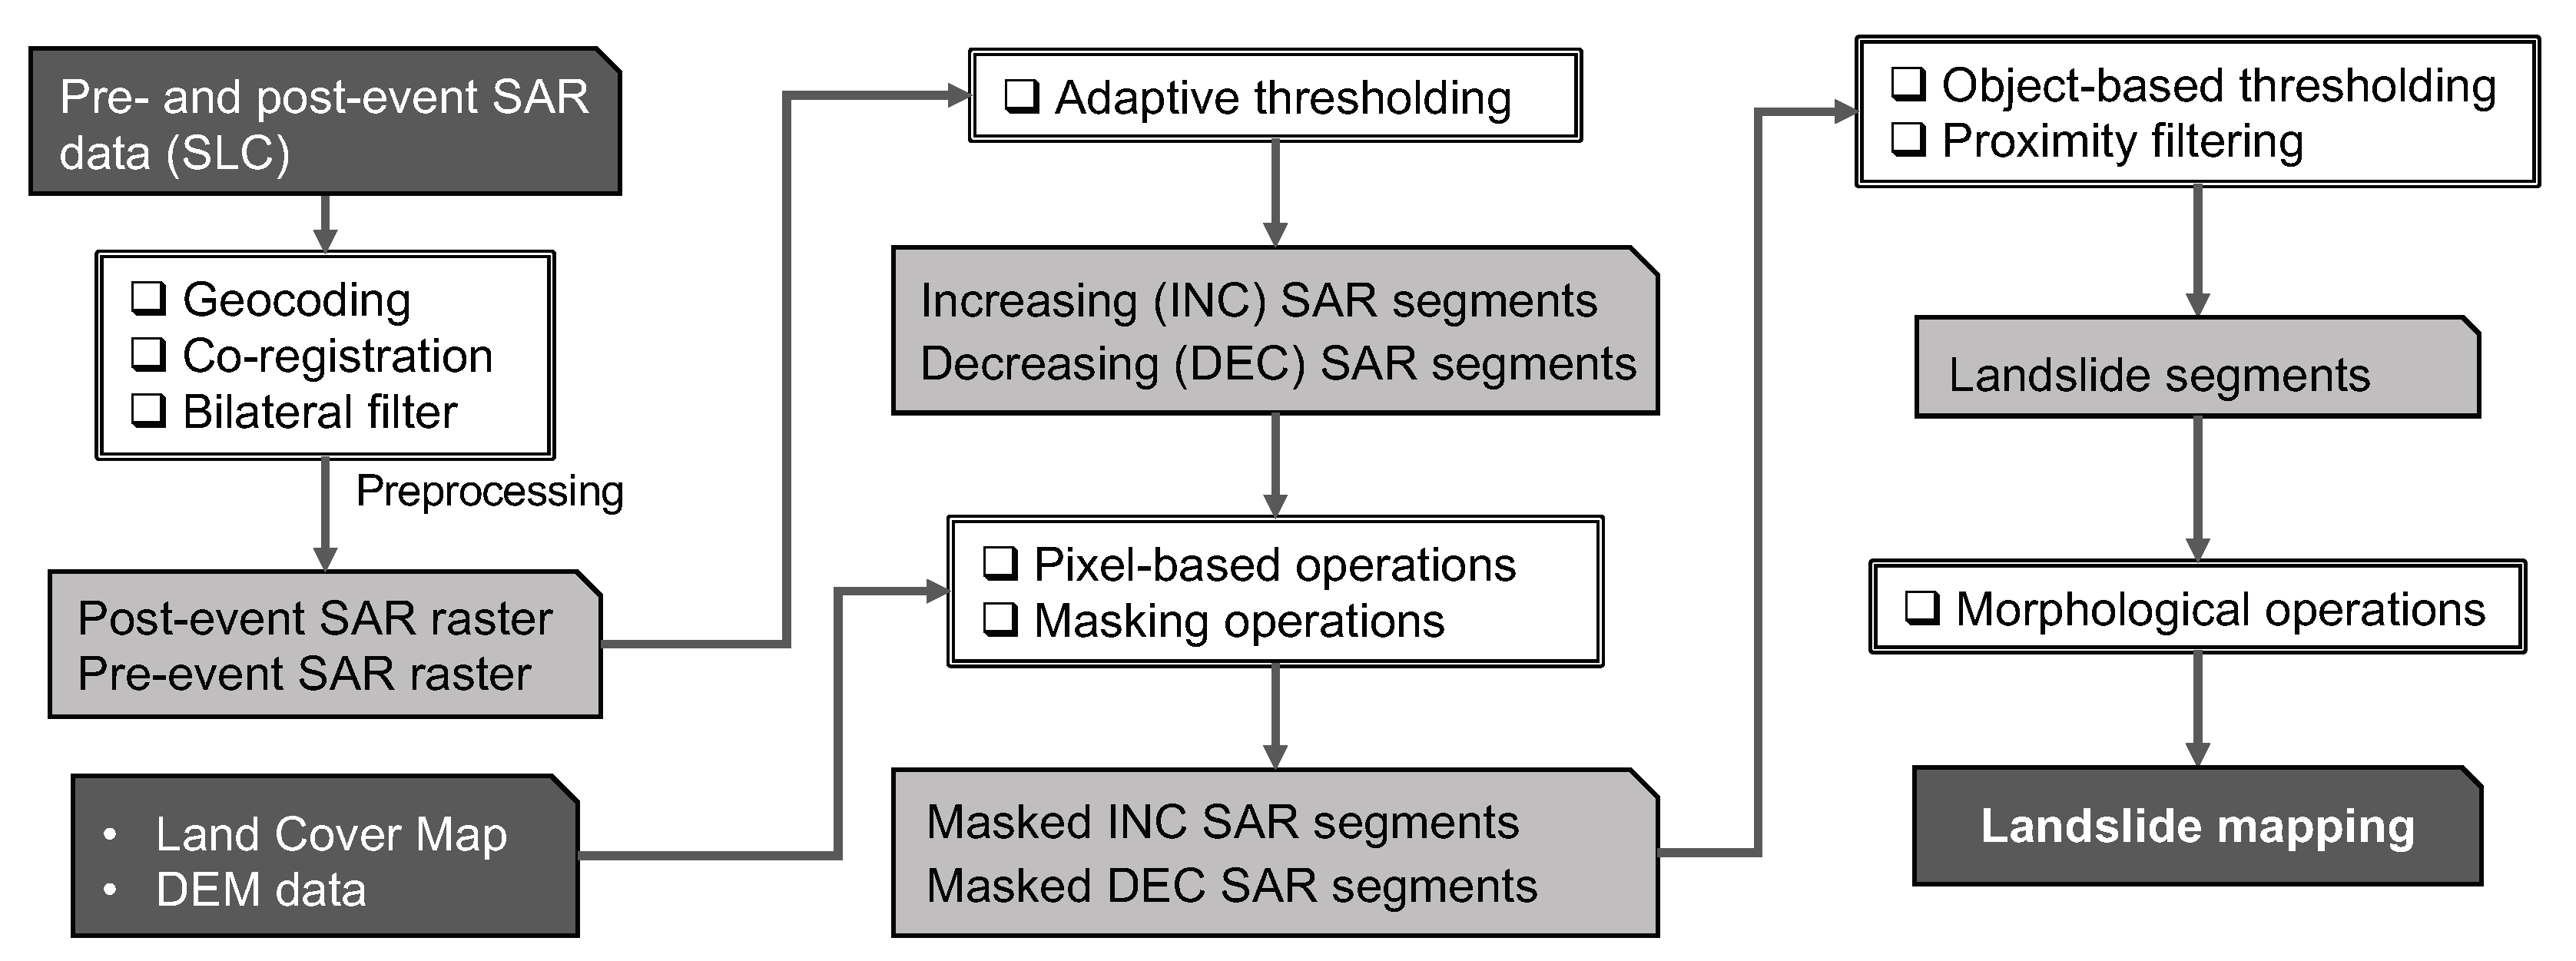
To accurately detect landslide segments from surfaces with different characteristics, we use the land cover classification created by JAXA [40]. These data contain a land use and land cover map of almost the entire Japanese territory using an approximate ground sampling distance of 30 m. This land classification dataset was created using several remote sensing sources, including Landsat-8 [41] and PALSAR-2, and the dataset provides 11 land surface categories. A Bayesian classifier was employed with kernel density estimation using approximately 35,000 points of training data, which were collected from ground survey campaigns and the visual interpretation of high-resolution online satellite images.
Topography information is crucial for identifying landslides that occur in mountainous areas [42]. In this study, we use freely available Shuttle Radar Topography Mission (SRTM) data [43], which provide a digital elevation model (DEM) of almost the whole globe. Before 2015, only low-resolution (3 arcseconds, approximately 90 m) SRTM data were available for all regions outside the territory of the U.S. Currently, globally accessible SRTM data have a ground sampling distance boasting a high resolution of 1 arcsecond (approximately 30 m), and the relative vertical accuracy is approximately 6 m.
Figure 2 shows the land cover and DEM data for both study areas. The predominant land cover corresponds to green spaces, which range from rice paddy fields to evergreen needle forests. In the case of Hiroshima, urban environments are concentrated mainly across the west side of the target area; however, the land elevation changes significantly from 0 m to 900 m. In the case of Hokkaido, the maximum land elevation is only approximately 300 m with a relatively planar area traversing the target area from the southwest to the northeast.

4. Methodology

The proposed methodology integrates a series of pixel- and object-based operations to detect the landslides triggered by two different disasters by taking advantage of the damage-induced changes observed from PALSAR-2 images. The SAR backscattering intensity is strongly affected by the surface roughness, and different types of shapes and sizes of objects on the ground generate distinct features in SAR images. As a result, highly rough surface areas produce higher SAR intensities (brighter pixels), whereas darker areas indicate smooth surfaces or regions that SAR microwaves cannot reach (known as the shadow effect) [44,45].
Figure 3 shows the pre-event SAR image, post-event SAR image, RGB color-coded images, and optical images of two typical damage areas from both study sites. As observed from the top panels (left: Pre-event, right: Post-event), the visual interpretation of the distribution of landslide damage in the SAR imagery is not a straightforward task in comparison with the optical images, where the destruction of vegetation clearly reflects the presence of landslide damage. The RGB color-coded images (R: Pre-event, G and B: Post-event), however, depict a SAR pattern of landslide damage spots (bottom-left panels in Figure 3), where cyan and red segments trace the changes related to landslide-induced damage.
Figure 4 illustrates schematic cross-sections of the SAR backscattering characteristics before and after the disaster. In the pre-event situation, uniform SAR backscattering can be observed in the damaged areas and their surroundings; these areas are depicted as a constant grey color in the pre-event SAR imagery (top-left panels in Figure 3). On the other hand, the masses displaced by debris flows or coseismic landslide disasters cause visible scar-like depressions in the post-event imagery. These scars generate two distinct backscattering patterns in the SAR imagery, with the width and length of the patterns depending on the SAR incident angle and the size of the lost mass. The first pattern is observed in the sectors where the backscattering intensity decreases, as indicated by the red segments in the RGB color-coded images; these red segments appear because of the shadow effect created by the depth of the depressions and the SAR incident angle. The second pattern is discovered in the areas where the backscattering intensity increases because of the changes in the land surface; in these areas, the emitted SAR microwaves exhibit higher reflection intensities due to the modified surface roughness of the side walls of the scar-like depressions. Furthermore, one particular attribute of the cyan-red pattern is that the red segments always appear closest to the radar beam’s line of sight (LOS) (bottom-left panels in Figure 3).
The methodology proposed in this study detects debris flows and coseismic landslides by analyzing cyan-red patterns. Figure 5 illustrates the workflow process for identifying landslide segments using PALSAR-2 intensity images. The workflow is divided into three blocks. The first block involves preprocessing tasks, while the second block contains two central pixel-based operations, namely, adaptive thresholding and masking analysis, and the third block consists of object-based operations, such as morphological operations. In addition to the preprocessing block, our method is fully implemented using a high-level and general-purpose programming language (Python 3.6). Moreover, Numpy 1.17 and openCV 3.4 libraries are used to manipulate the raster data.

4.1. Data Preprocessing

To generate SAR intensity images, we perform identical preprocessing operations on the SAR datasets of both study areas using the SARscape v5.5 toolbox running under ENVI 5.5 software. First, both datasets are coregistered using the pre-event scenes as master images. During the multi-looking process, the number of looks is set to 1 to maintain a high resolution for the SAR data and generate the intensity images. Then, we apply a radiometric correction to obtain the SAR backscattering coefficient. Next, we use an enhanced Lee filter with a window size of 3 × 3 pixels to reduce the speckle effect [46]. Subsequently, we employ the 1 arcsecond SRTM DEM to apply a terrain correction (orthorectification) and geocode all the intensity images with a final ground sampling distance of 2.5 m. Finally, we apply a bilateral filter to the geocoded dataset to further smooth the SAR images. This image processing technique reduces image noise while enhancing the edges by preserving their visual structure [47,48].

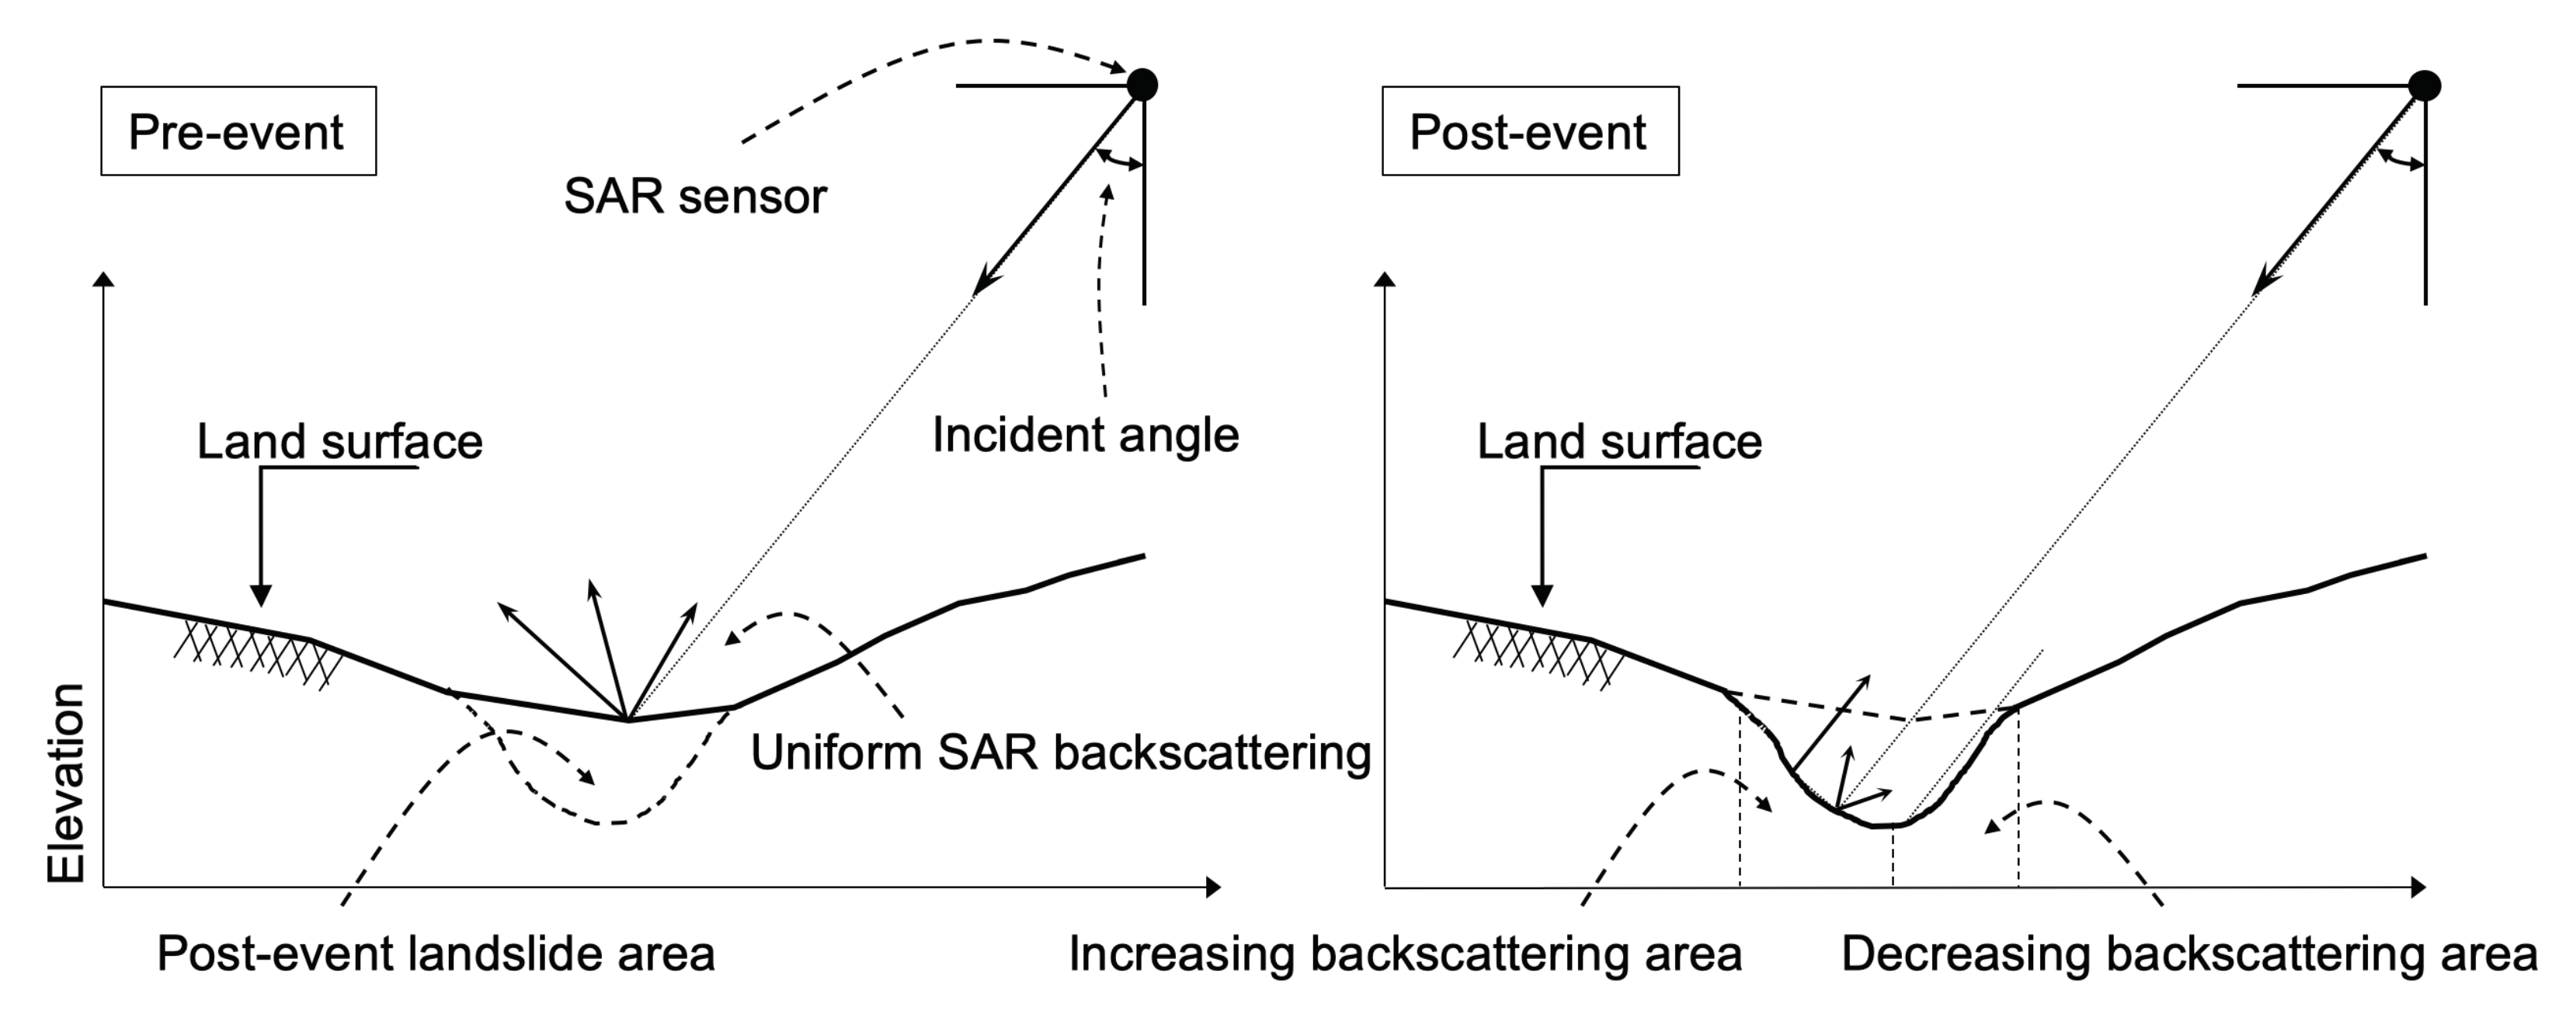
4.2. Pixel-Based Image Analysis

In this processing block, we utilize an adaptive thresholding approach [49] to extract the sectors with increasing and decreasing SAR backscattering intensities. Traditional image thresholds are set based on a linear relation ( μ ± k · σ ) between the mean ( μ ) and standard deviation ( σ ) and are globally computed [50,51]. In the past, such an approach yielded good performance using moderate- and high-resolution optical imagery because of the almost uniform surface radiance in cloud-free imagery [52]. However, due to the effects of shadows present in SAR intensity imagery, a global threshold approach is not suitable for detecting segments of increasing and decreasing SAR backscattering intensities. To overcome this drawback, we implement an adaptive throttling B ( x , y ) according to Equation (1), where B applies a variable threshold T x , y computed in a neighborhood with dimensions of k × k in the input image I x , y . The value of T is computed for each pixel and corresponds to the weighted sum of Gaussian filter coefficients (Equation (2)), where the scale factor α is chosen to satisfy G i = 1 , and i = 0 , , ( k 1 ) .
B I ( x , y ) k × k = m a x ( I ( x , y ) ) if I ( x , y ) < T ( x , y ) ; 0 otherwise .
G i = α · exp ( i ( k 1 ) 2 2 2 · σ 2 )
I N C ( x , y ) = B ( I p r e I p o s t )
D E C ( x , y ) = B ( I p o s t I p r e )
The classifications of increasing ( I N C ) and decreasing ( D E C ) segments are computed using Equations (3) and (4), respectively. The kernel size ( k × k ) is selected according to the predominant dimensions of the landslide segments observed in the PALSAR-2 data for the target areas. A smaller kernel size will yield a relatively noisy classification; conversely, a larger kernel size will underestimate the classification. Figure 6a shows the locations of the black rectangle in Figure 1 from each study area using the same map scale. Because of the different sources that triggered each event, the landslide thickness at the Hokkaido site is greater than that at the Hiroshima site. In addition, at both sites, the red patterns (decreasing pixels) are generally larger than the cyan patterns (increasing pixels). To simplify the methodology and ensure its accuracy, we conduct a sensitivity analysis of each kernel size by comparing the detection results of the subset areas shown in Figure 6a. Kernel sizes ranging from 25 m × 25 m to 115 m × 115 m are tested for both study sites. The analysis suggests that preliminary landslide detection can be achieved by using kernels of 45 m × 45 m for debris flows, and 85 m × 85 m for coseismic landslides. The kernel sizes for extracting the increasing and decreasing pixels for the Hiroshima site are 17 × 17 pixels (42.5 m × 42.5 m) and 19 × 19 pixels (47.5 m × 47.5 m), respectively, while the corresponding kernel sizes for the Hokkaido site are 31 × 31 pixels (77.5 m × 77.5 m) and 35 × 35 pixels (87.5 m × 87.5 m), respectively.
Following the filtering operation, we use the land cover and DEM datasets to constrain the areas where landslides are likely to occur. Mass movement disasters such as debris flows and coseismic landslides are often associated with mountainous regions exhibiting small but steep stream channels and steep slope morphologies, respectively [53]. Hence, to consider the influence of the topography, we compute the dip angles of the slopes from the SRTM DEM data. According to previous studies [54,55], mountainous areas with slopes steeper than 20 degrees are susceptible to the development of mass movements. Therefore, for both study areas, we evaluate slope values ranging from 12 degrees to 22 degrees. This analysis suggests that preliminary landslide mapping can be performed by using slope angles between 16 degrees and 18 degrees. Thus, for both study sites, we adopt the recommended slope ranges and mask out pixels located in areas with a slope angle gentler than 18 degrees in the corresponding I N C and D E C images.
Slope failure can also occur in areas of different types of land cover. For instance, Geertsema et al. [56] reported a rockslide–debris avalanche in a mountainous region of sandstone rubble deposits with shrubland as the predominant land cover type. Lauknes et al. [57] similarly reported rockslides preceded by many years of slow movement in mountainous areas consisting of shrubland and grassland. In the case of the selected study sites, according to Figure 2b, because most of the mountainous regions in JAXA’s land cover dataset correspond to forest categories, the pixels located in areas not classified as forest or grassland are also masked out. Thus, pixels with land cover classes composed of only rice paddies, urban areas, or crops are not considered in the proposed methodology. Figure 6c illustrates the masked image results.

4.3. Object-Based Image Analysis
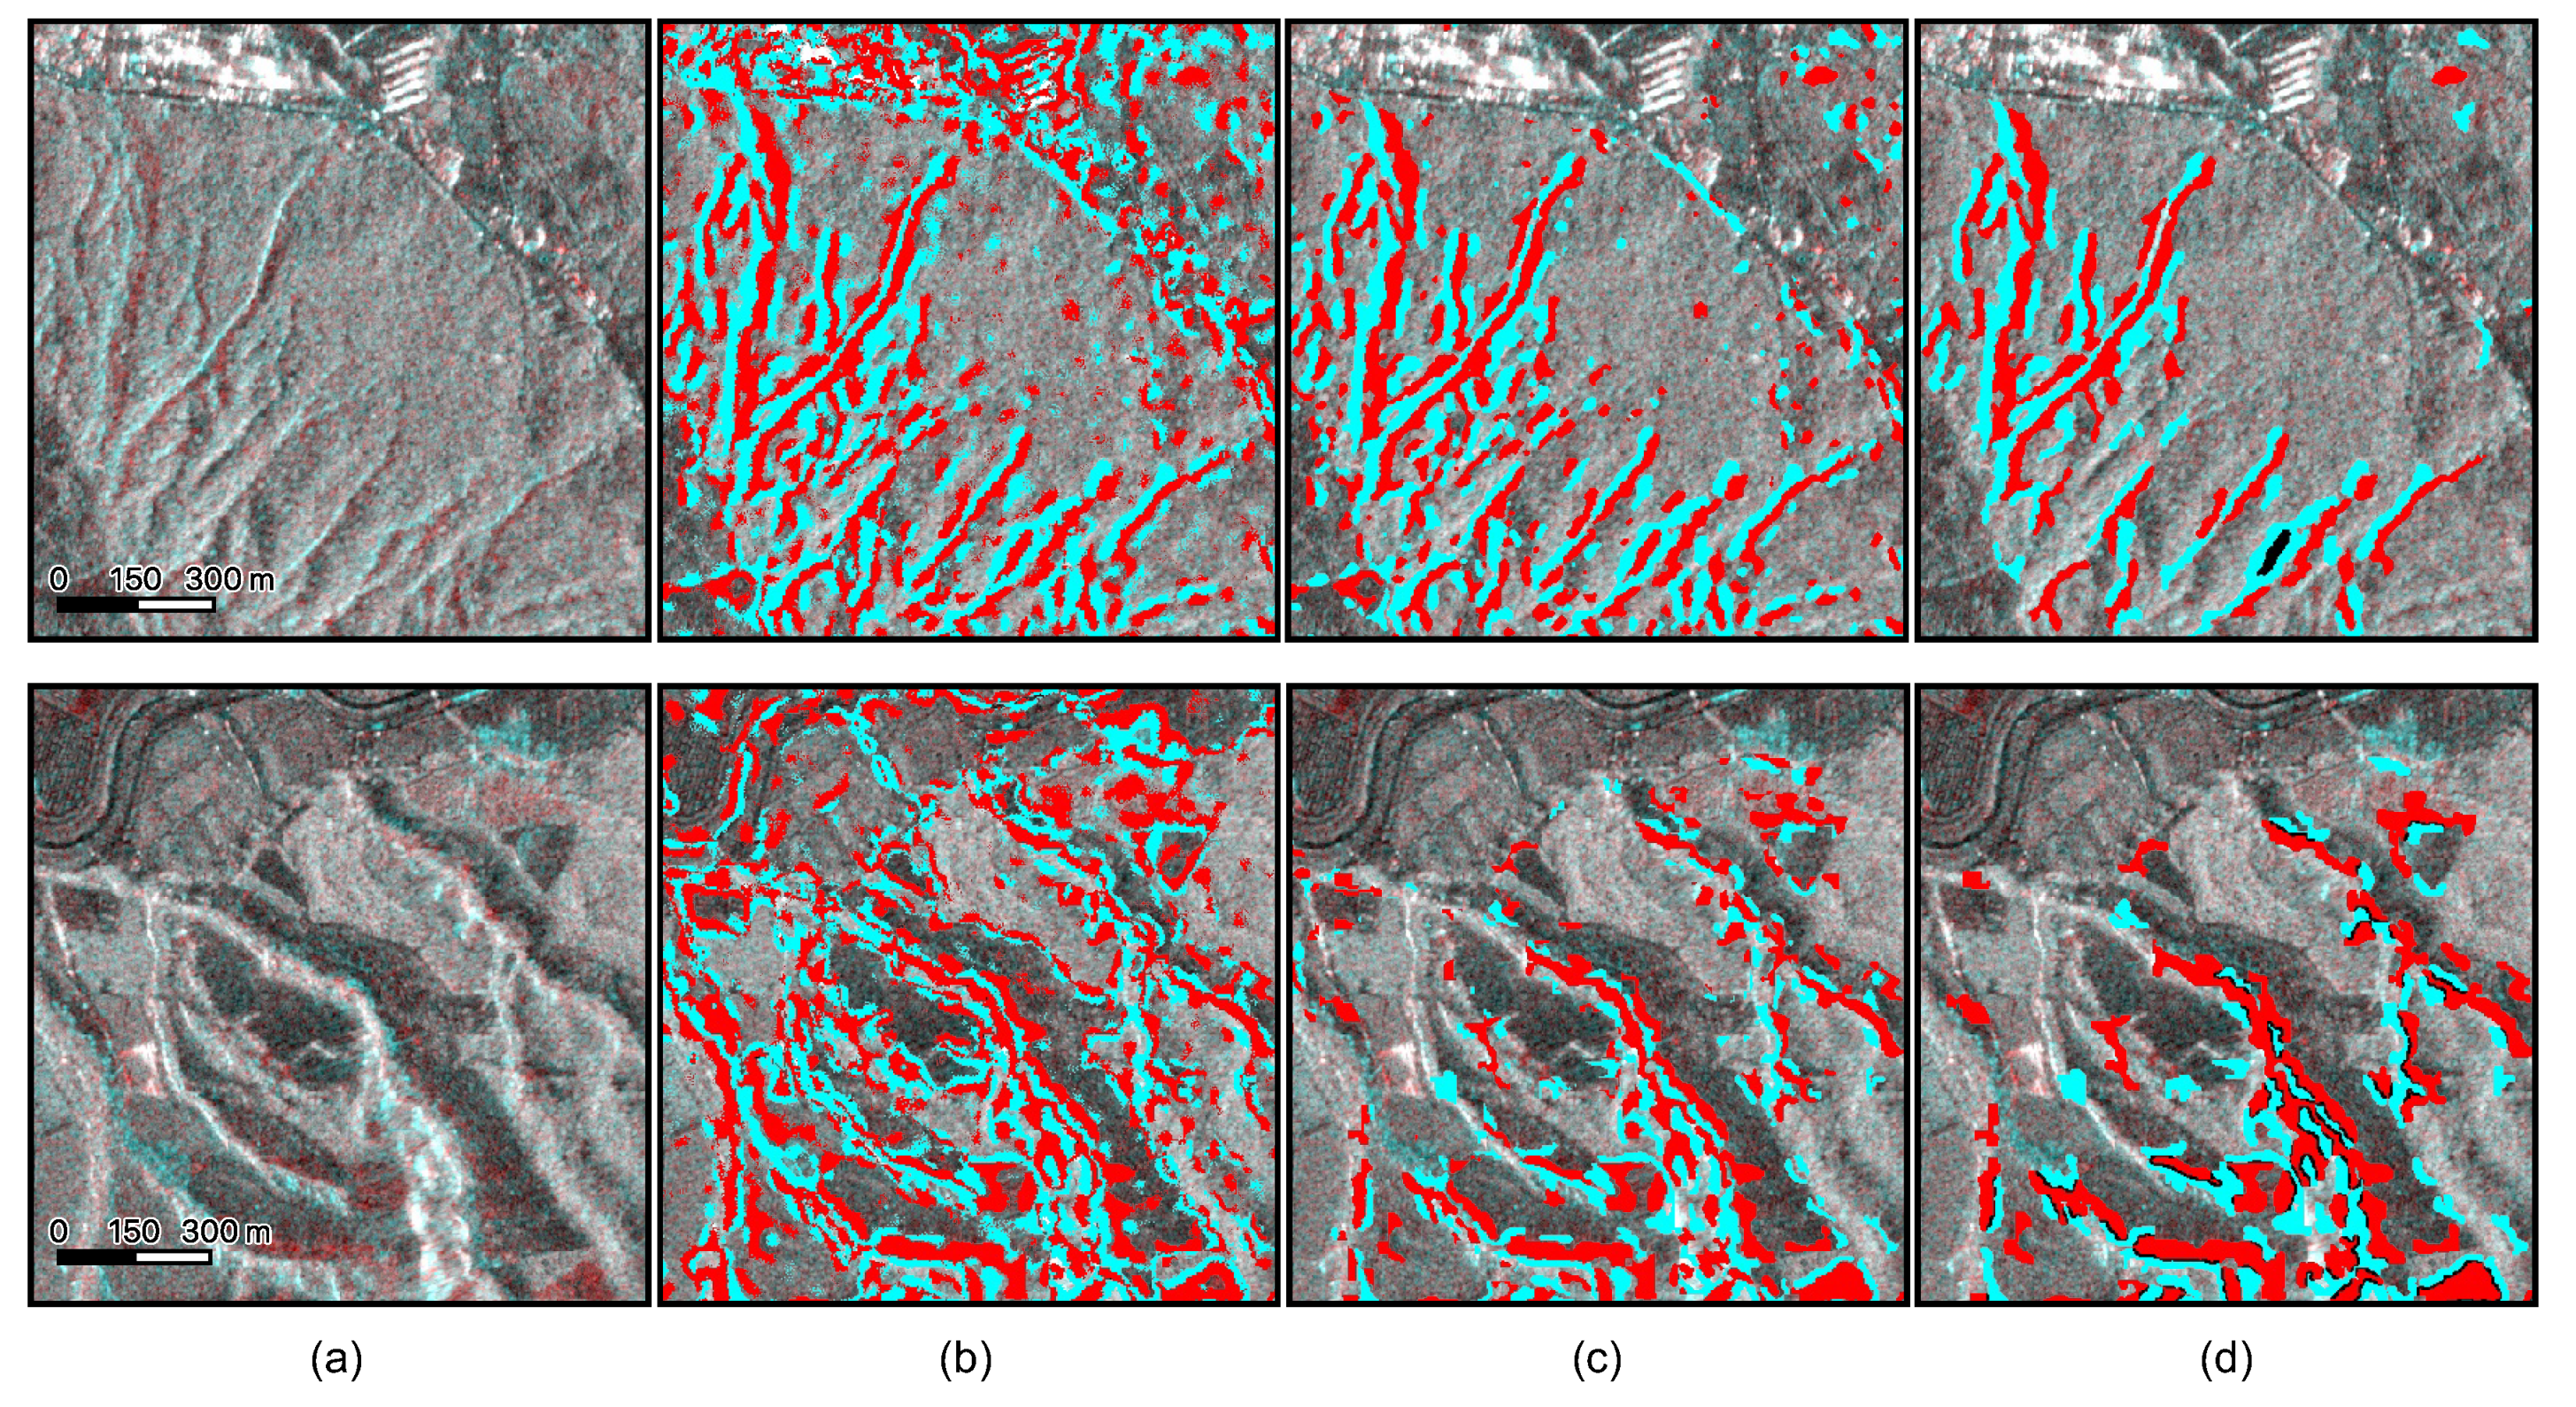
Following the previous steps, two masked images with increasing and decreasing backscattering pixels are obtained. These images correspond to the cyan and red patterns found in the RGB color-coded PALSAR-2 image, as shown in Figure 6c. However, small and isolated segments are also detected in places where the SAR intensity varies because of natural shifts in the topographic slope and along the boundary between two land cover classes. As such, these misdetected segments do not correspond to landslide scars. Here, we introduce a series of object-based operations to remove these misdetected segments.
First, we evaluate the size of each segment by computing a cumulative frequency function, as shown in Figure 7, which shows that the sizes of the segments at the Hokkaido site are generally larger than those at the Hiroshima site. For instance, at the 90% percentile, the average segment area at the Hokkaido site is approximately 190 m 2 , while that at the Hiroshima site is approximately 1000 m 2 . Furthermore, in the case of the Hiroshima site, the number of increasing segments is higher than the number of decreasing segments; conversely, in the case of the Hokkaido site, the opposite relation is discovered for relatively small objects. To remove misdetected small objects, we conduct a sensitivity analysis to find an optimal threshold by visually comparing the detected segments and the RGB color-coded image (Figure 3a–d). When 80∼90% percentiles are adopted, most of the segments located at the bases of the mountains are removed. While most of these objects appear due to SAR intensity changes along boundaries between flat and steep terrain, this threshold also eliminates several segments that represent the continuation of larger downslope landslides. This fact is especially true in the case for the Hiroshima site, where the thicknesses of the debris flows are relatively small.
Following our sensitivity analysis, we discover that the optimal percentile thresholds are 70% and 60% for the Hiroshima and Hokkaido sites, respectively. At the Hiroshima site, the detected I N C and D E C segments have almost proportional sizes; in this case, objects with areas of approximately 80 m 2 and 96 m 2 are removed. At the Hokkaido site, for small segments, the number of D E C segments is larger than the number of I N C segments (Figure 6c); in this case, the area thresholds are approximately 255 m 2 and 300 m 2 for I N C and D E C segments, respectively.
Next, to exclude isolated segments, we evaluate the spatial locations of I N C and D E C objects simultaneously. As discussed earlier, the landslide patterns in the SAR intensity images exhibit unique characteristics; that is, cyan and red segments appear next to each other with almost parallel orientations (Figure 3a). Our algorithm takes advantage of this feature by eliminating all pairs of I N C and D E C objects that do not satisfy this condition. We compute the vector distance between the centroids of I N C and D E C objects and classify the pairs of objects with a centroid distance of less than 70 pixels. After this operation, only the pairs with corresponding I N C and D E C segments are detected. The algorithms developed by Suzuki and Abe [58] that are implemented in the OpenCV-python library are used to carry out the abovementioned object-based operations on the masked images. Finally, a morphological closing filter with a 5 × 5 moving window is applied to fill holes in the segments.

5. Results

The objective of the proposed mapping framework is to detect landslides from two types of events, namely, debris flows and coseismic landslides, using SAR data and image processing techniques. To achieve this objective, we selected target areas that include all different types of land cover and topography conditions throughout the affected region. We applied the proposed methodology to two different study sites. The dimensions of the study areas were 18 km × 12 km and 12 km × 9 km for the Hiroshima and Hokkaido sites, respectively. The total computation time after acquiring the SAR dataset was approximately 30 min; most of this time was consumed by the preprocessing operations, which took approximately 20∼30 min. The two remaining processing blocks took on average approximately 1.5 min to produce the landslide images in raster format.

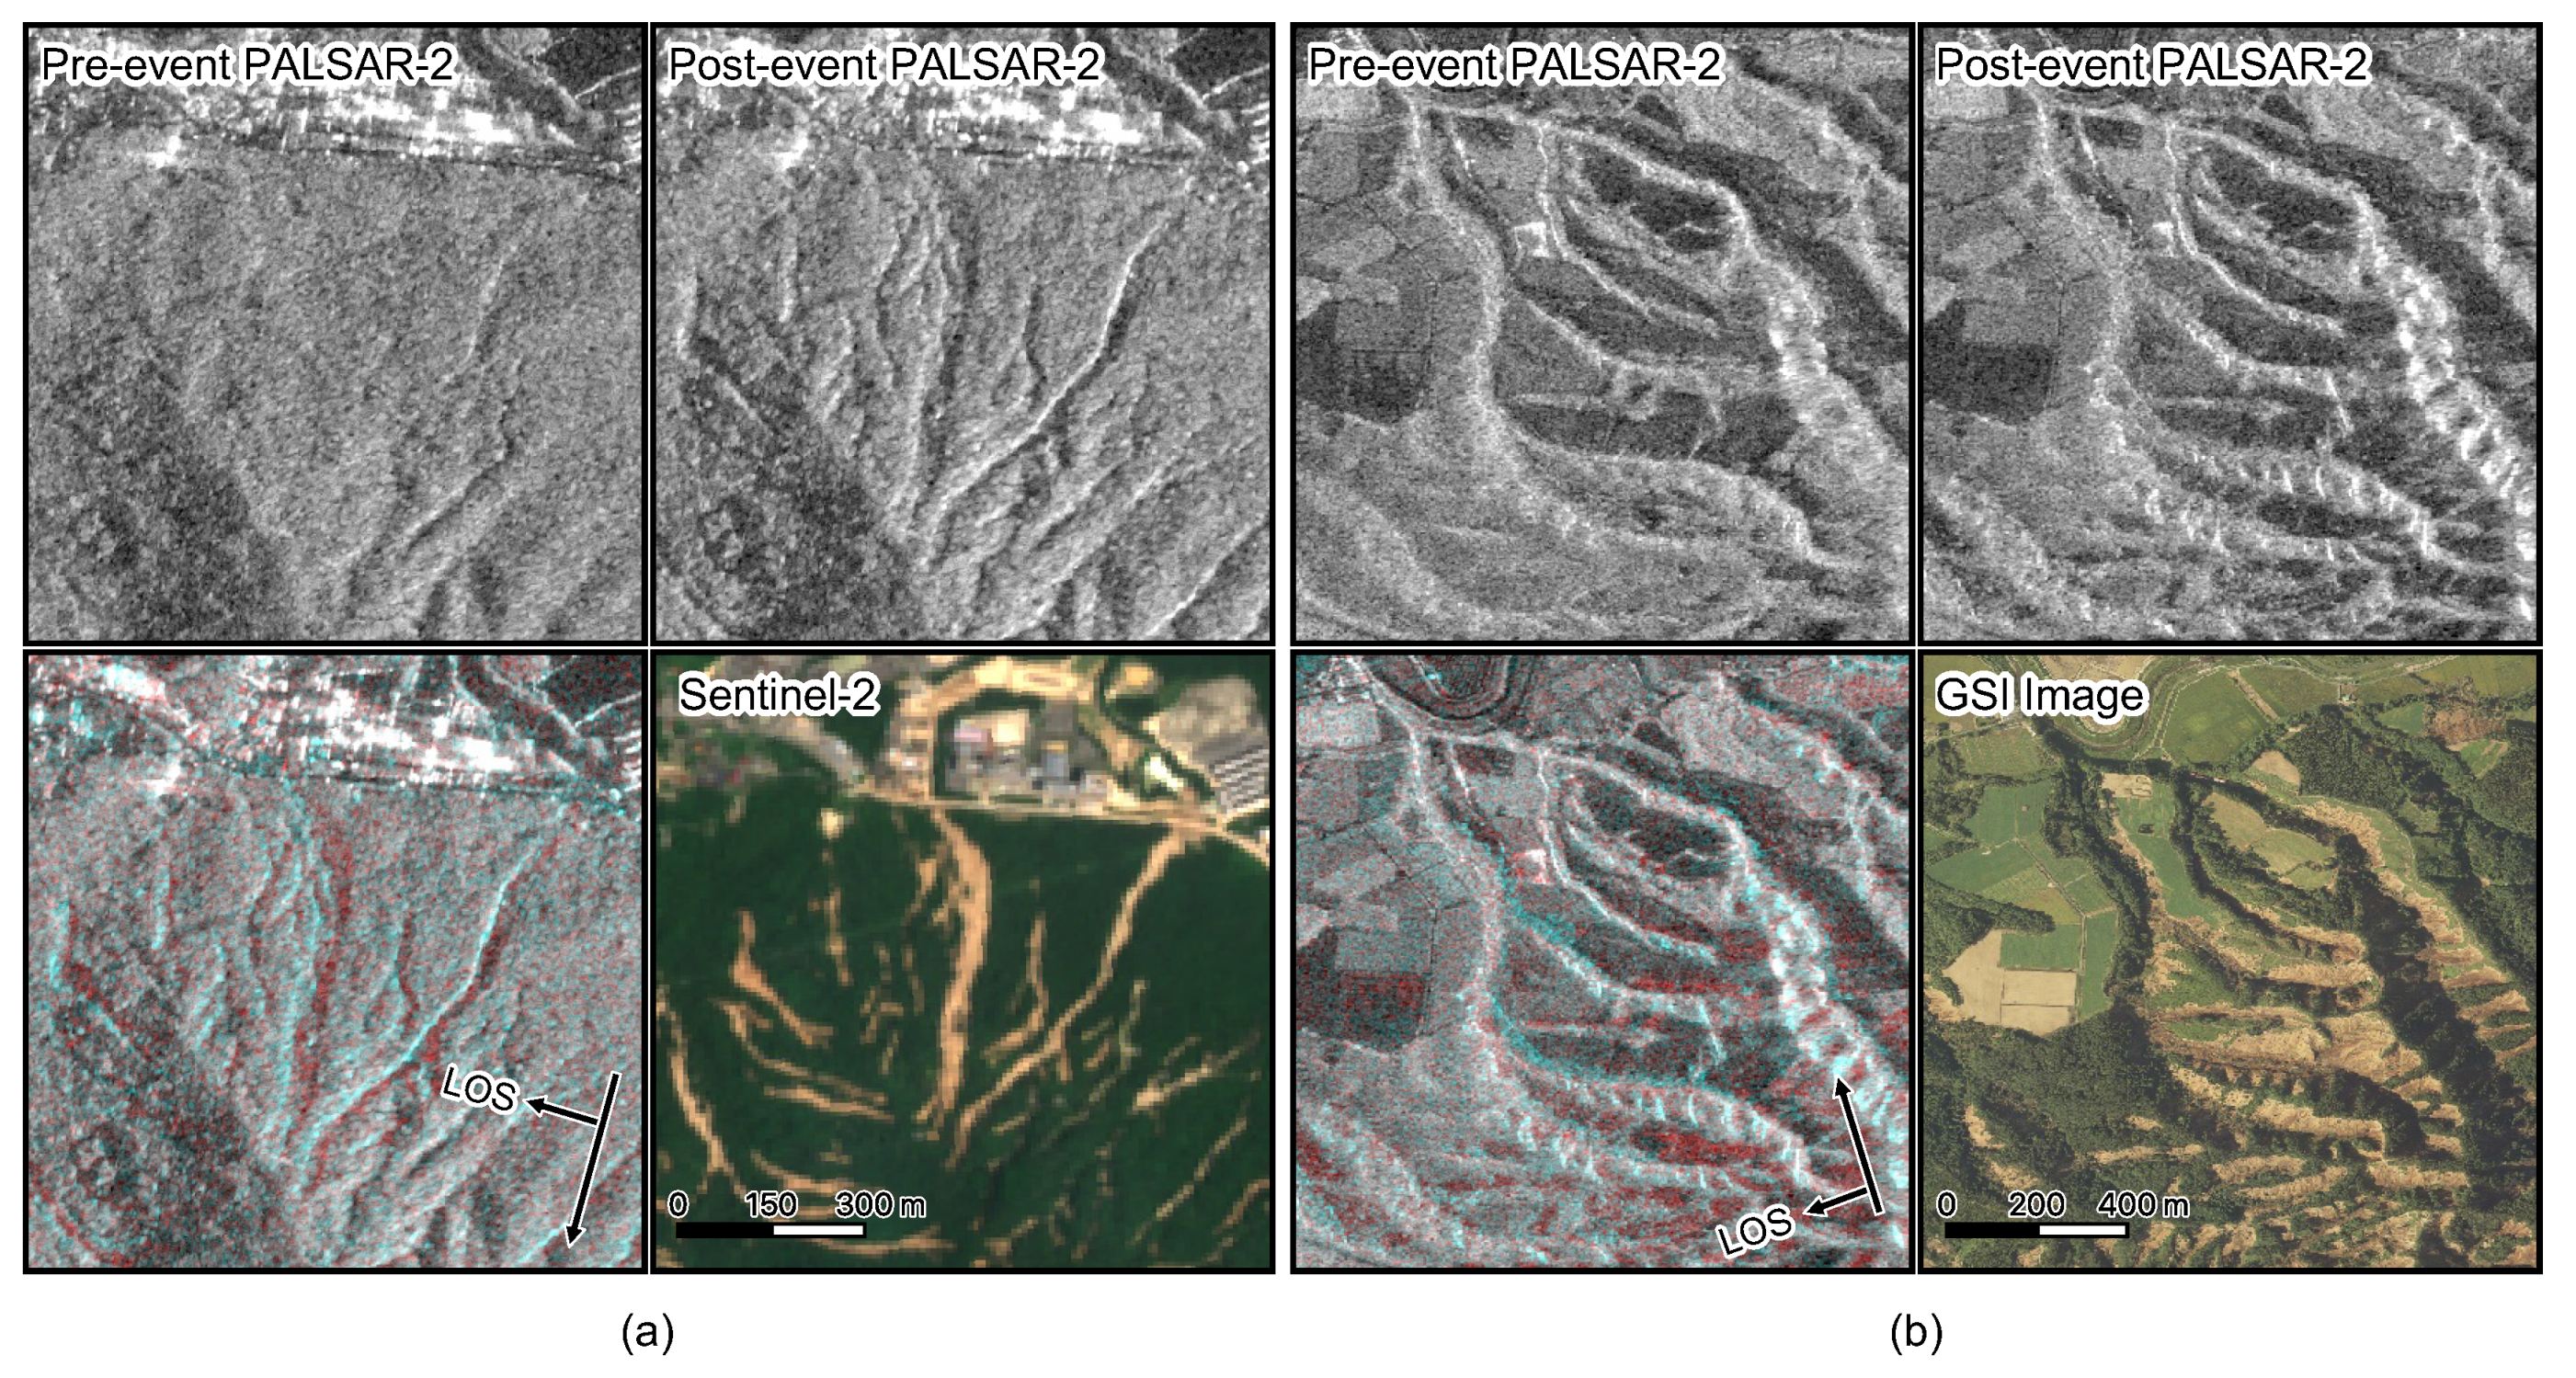
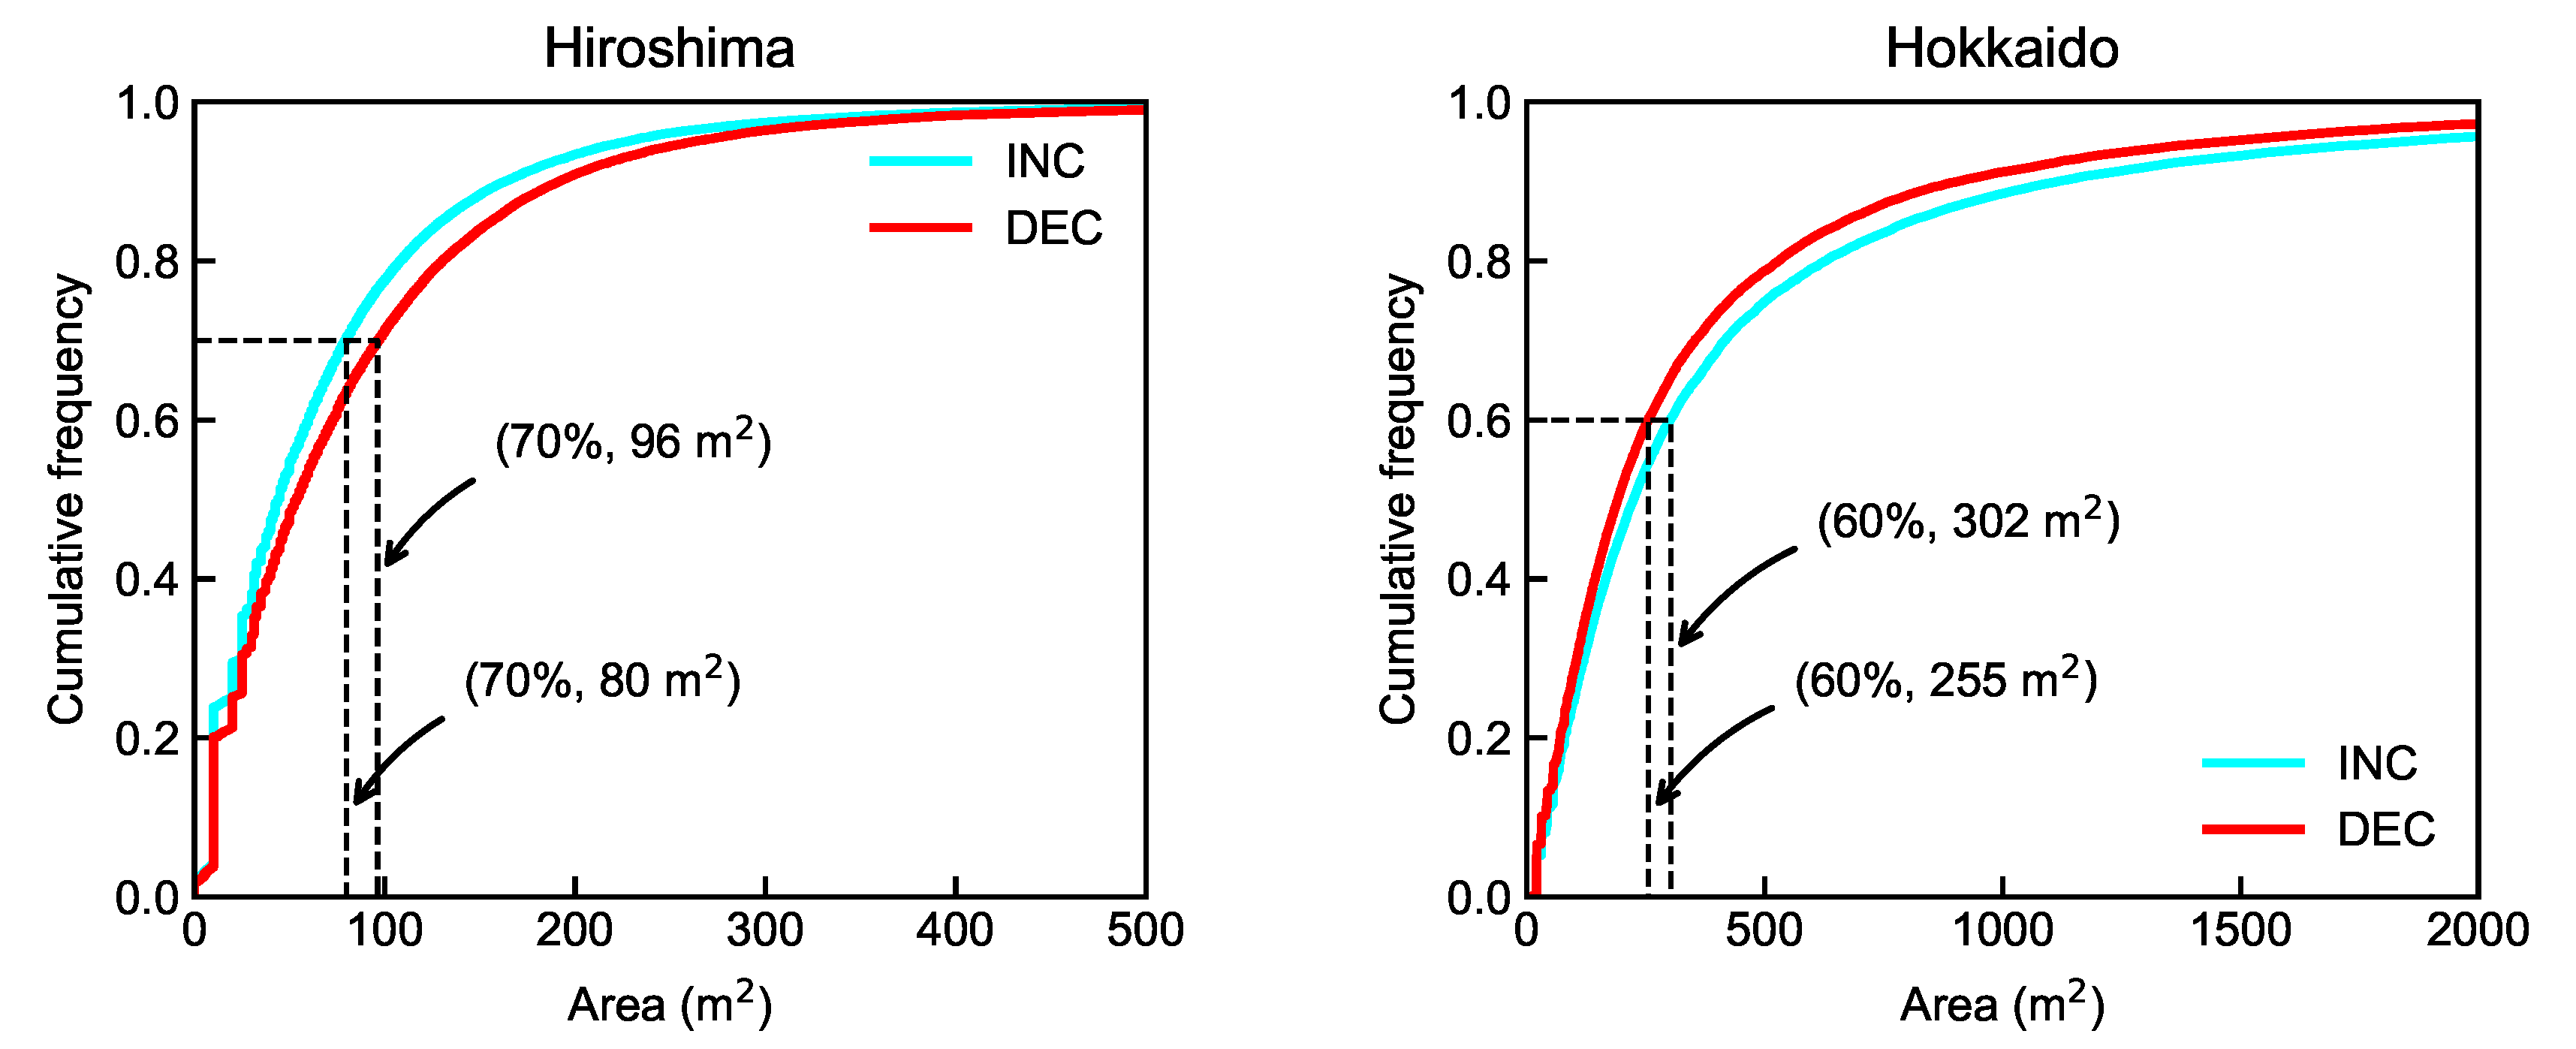
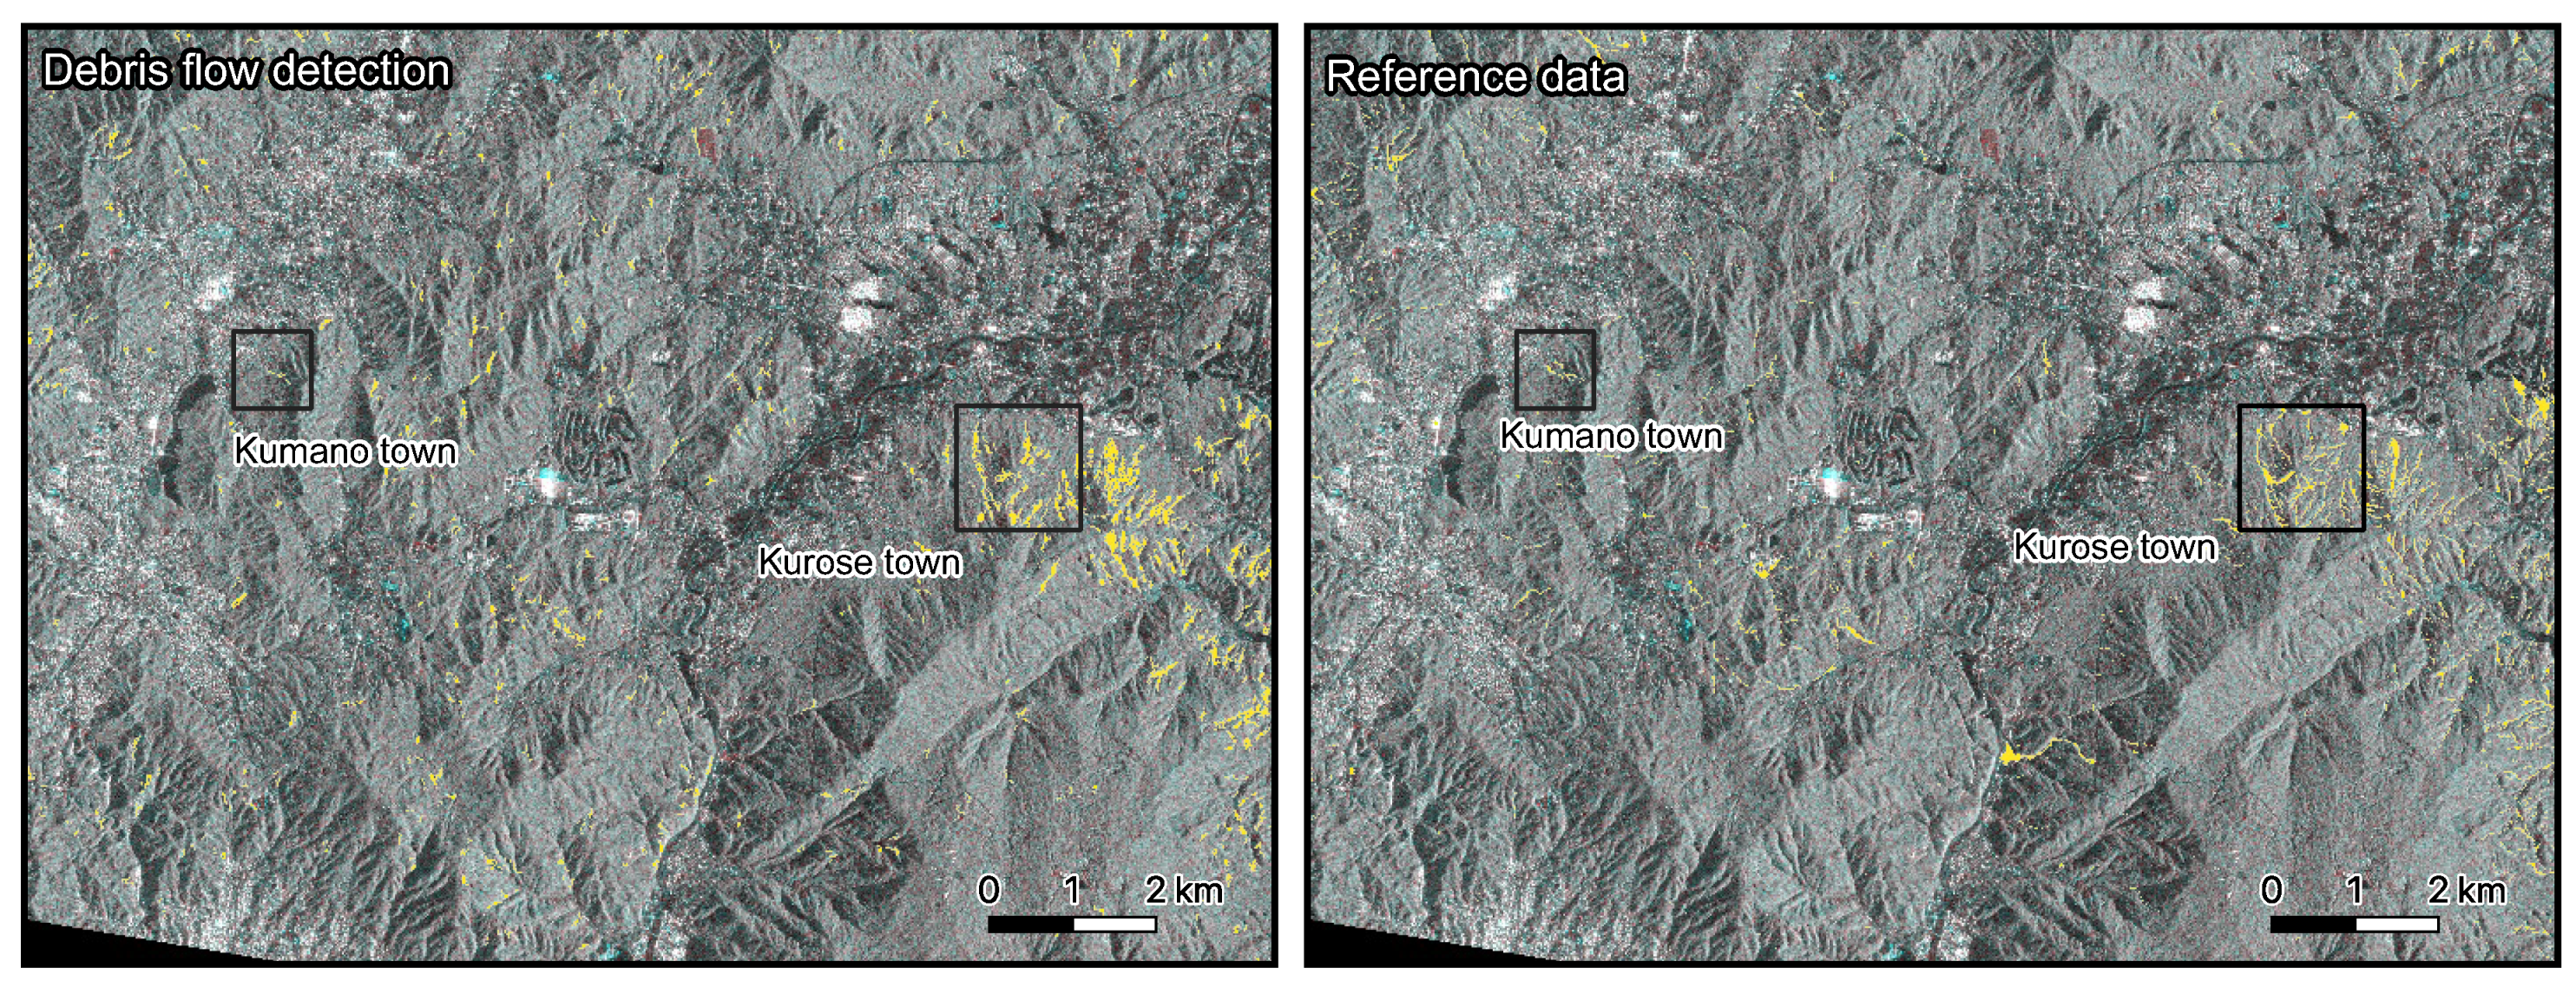
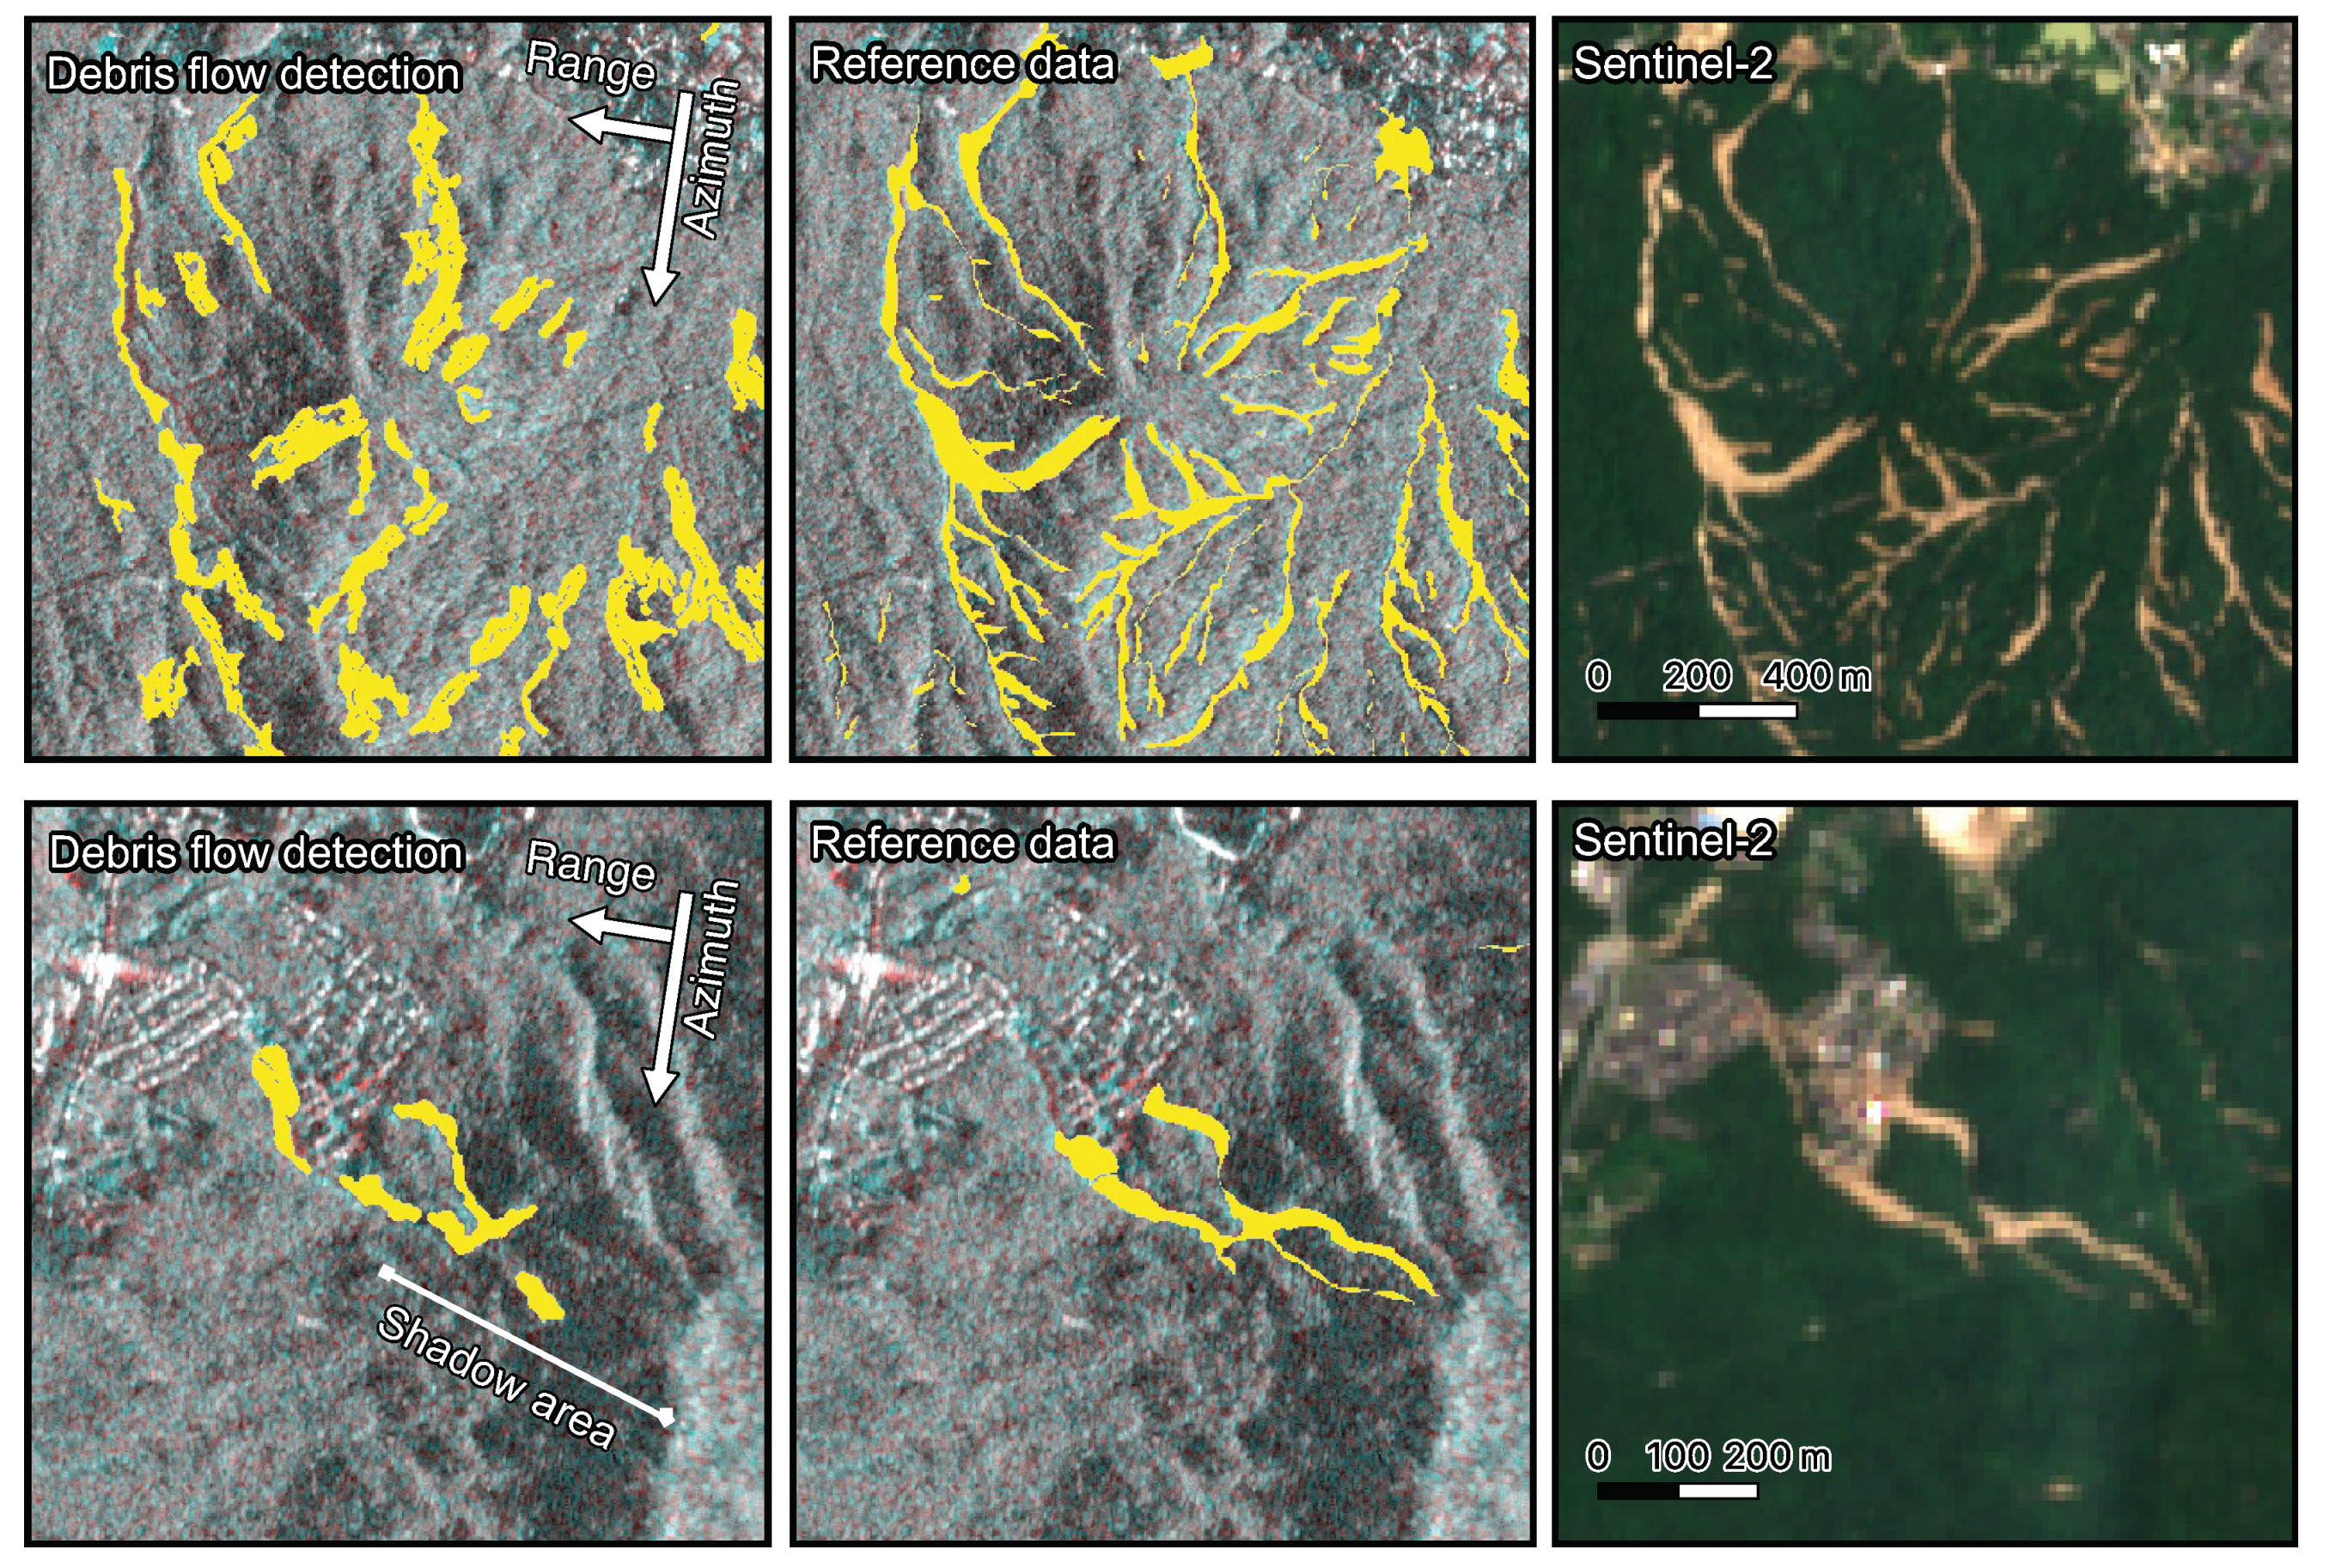
5.1. Debris Flow Detection

We applied our proposed methodology to detect debris flows following the 2018 torrential rain event that occurred in the Hiroshima region. Figure 8 shows a comparison between the detected debris flows (left panels) and the AJG reference data (center panels). The spatial distribution of the detected debris flows shows generally good agreement with the reference data. The obtained results indicate that most massive debris flows occurred around the east side of the target area, which is also indicated by the reference data; in this same area, however, the results reveal slightly overestimated thicknesses of the debris flow traces. On the other hand, the proposed methodology also detected sparse and relatively small debris flows that occurred on the west side of the target area. According to the reference data, the total area of debris damage is approximately 1.81 km 2 in the target area. Our detection yielded a total damage area of approximately 2.19 km 2 . A possible explanation for the overestimated damage area is that the segment thicknesses in areas with a high concentration of debris flows (e.g., the areas surrounding the town of Kurose in Figure 8) are slightly increased during object-based operations. Deposition segments are frequently placed downstream of debris flow damage, affecting urban environments and agricultural fields located at the base of mountainous terrain; however, the proposed methodology removes such surfaces to limit regions where landslides are more likely to occur. Thus, the obtained prediction does not include deposition segments.
Table 2 describes the numerical evaluation of the prediction results. We employed a confusion matrix of debris flows and other areas by calculating the number of pixels corresponding to each class and transforming the units into km 2 using the ground sampling distance of the SAR imagery (2.5 m). Furthermore, considering the unbalanced proportions of the two classes (debris flows and other), we also compute the kappa coefficient ( κ ) to provide complementary information with which to evaluate the detection results.
The user and producer accuracies were 29.9% and 36.3%, respectively. Since the thicknesses of many detected segments are more significant than those in the reference data (Figure 9), the user accuracy was relatively low. However, the producer accuracy, which evaluates the ratio of relevant results correctly detected, was relatively high. Figure 9 shows the detection results of two locations with different SAR backscattering intensities and different orientation angle between the debris flow scars and the microwave direction (range direction). The area around Kamiboda in the town of Kurose (top panels), where most of the debris flow occurred almost perpendicular to the range direction, reflects an example of the overestimation of the detected segment thickness. On the other hand, our methodology accurately identified most of the scars produced by debris flows; however, segments that are not visible in the PALSAR-2 intensity images could not be detected due to the presence of speckle noise and the relatively low spatial resolution. The bottom panels show the area around the town of Kumano, where debris flows were effectively detected in downstream areas. However, the uphill regions are located in the SAR shadow zone, and thus, identifying debris flow segments therein is a very challenging task. One possible explanation is that the radiometric calibration, in the preprocessing stage, was conducted based on a local-incidence-angle algorithm using the SRTM 1 arcsecond data. While this approach is faster in terms of processing time, it is not accurate in the existence of topographic features such as mountainous areas. To overcome this issue, a more precise scattering area should be computed using a high-quality and high-resolution DEM data. This method (true-area algorithm) generates the most accurate SAR image in mountainous regions. However, this approach is significantly more computation expensive than the previous one [59,60]. Nevertheless, due to the adaptive threshold approach adopted in the proposed method, some damaged segments were accurately detected. Furthermore, taking into account that the debris flow orientations were almost parallel to the SAR range direction, the extracted segments also indicate that our algorithm is robust to different orientation angles between debris flows and microwave radiation. The accuracy metrics indicate that when used with only PALSAR-2 intensity images, our proposed methodology cannot precisely identify the dimensions of individual segments in the case of a debris flow disaster. However, the proposed methodology could perform better using SAR data with a higher spatial resolution acquired under different observation conditions. Considering that the total debris flow area covered only approximately 4.7% of the target area, the overall accuracy exceeded 98%. Furthermore, the computed κ -coefficient (0.32) indicates that the proposed methodology could still be used for detecting potential debris flow locations during the early stages of disaster response scenarios.

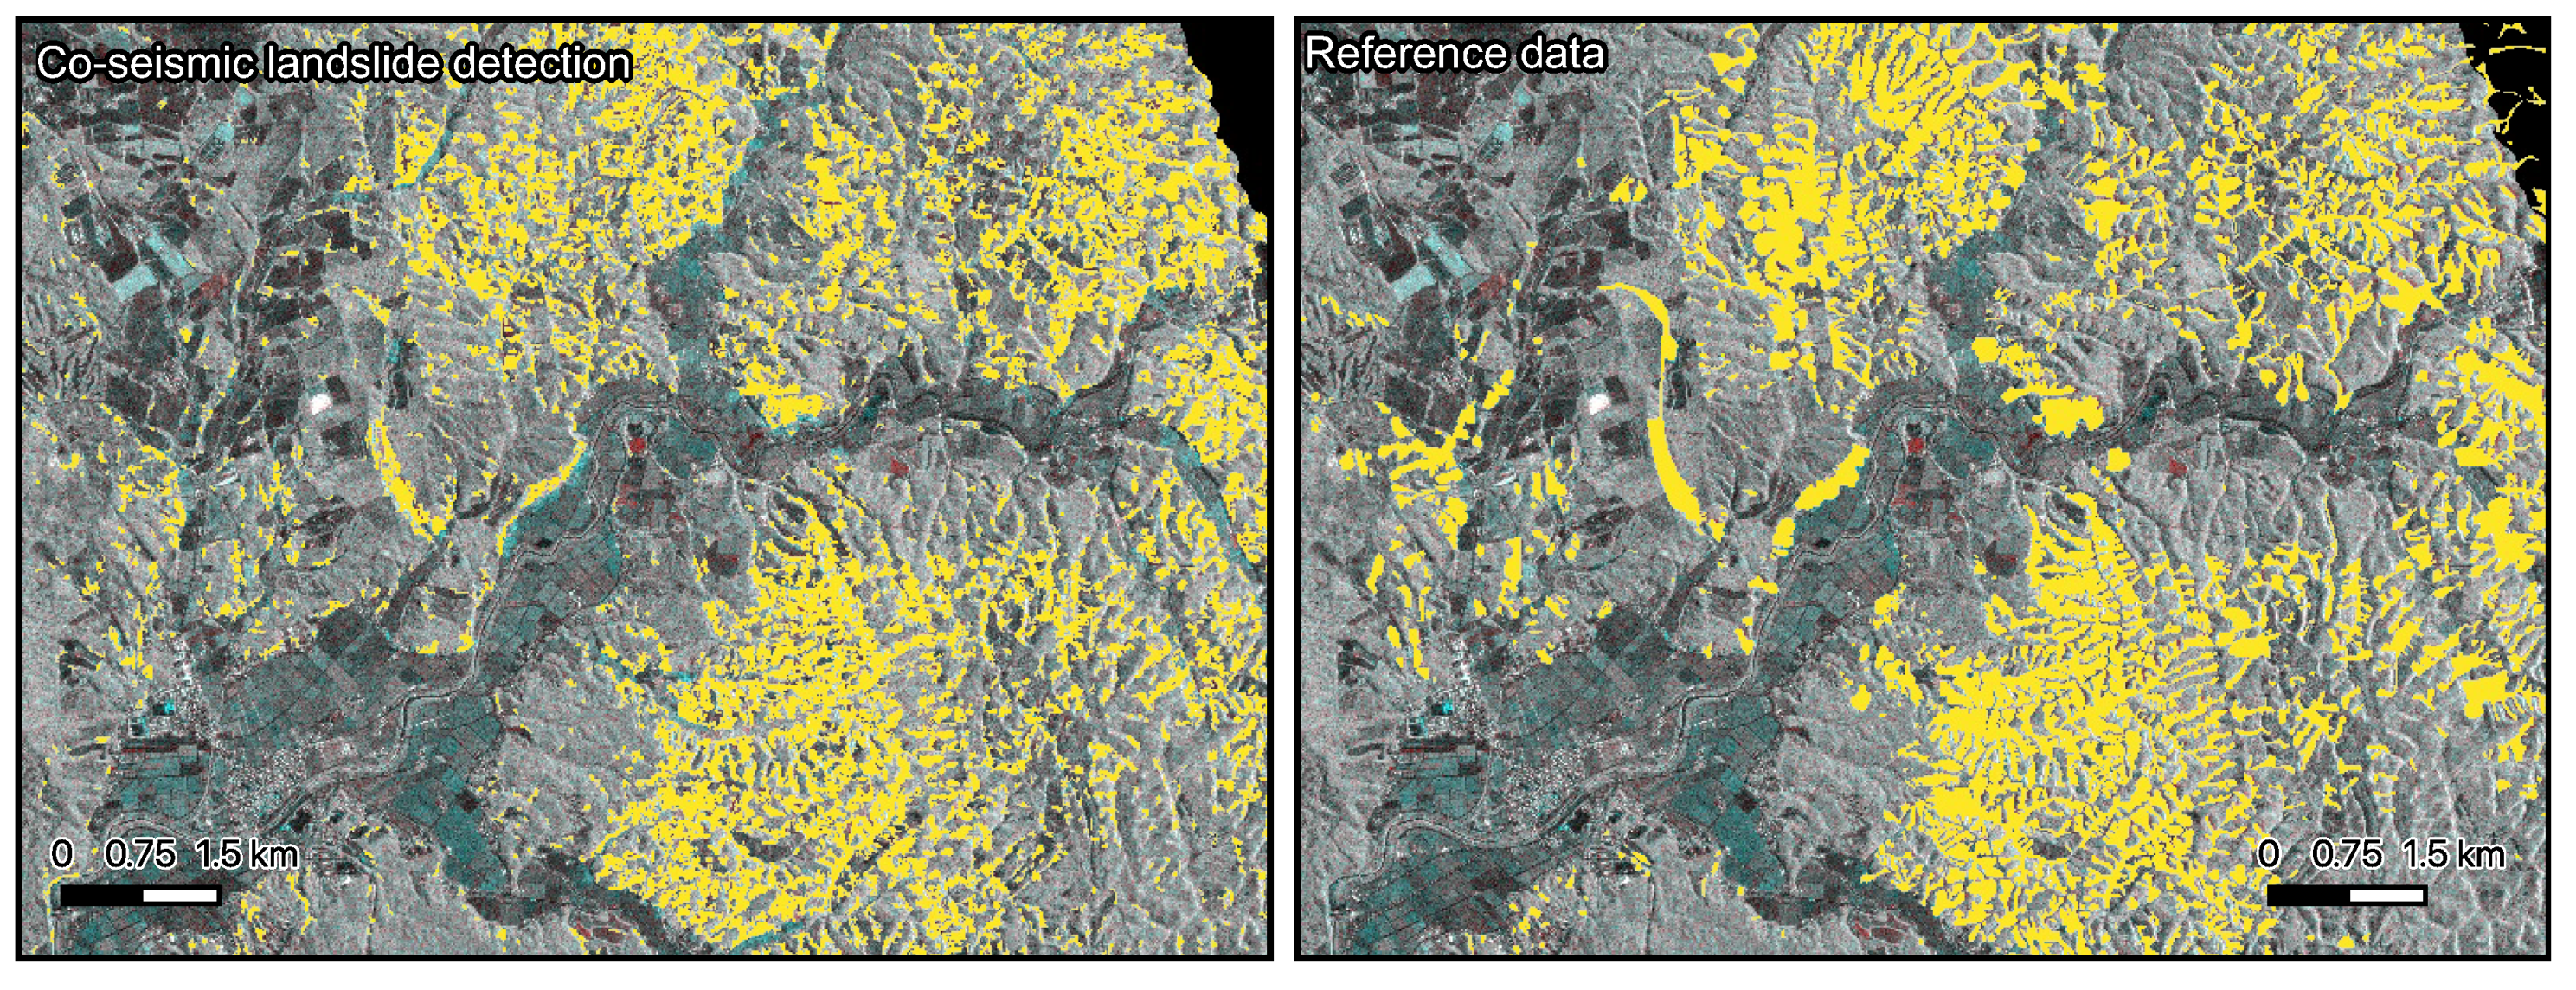
5.2. Coseismic Landslide Detection

We also tested our proposed methodology on the detection of the coseismic landslide triggered by the 2018 Hokkaido earthquake. Figure 10 shows the detection results (left panel) and the GSI reference data (right panel). The spatial distribution of the extracted landslide segments is excellently correlated with the reference data. Most of the landslides were consistently detected on the eastern side of the target area. In terms of the segment size, the obtained results also agree well with the interpreted reference data. According to the reference data, the total damage area, including the areas of surface rupture and deposition, was approximately 24.3 km 2 , and the ratio between the landslide area and the total area was approximately 30%. The detection results yielded a total damage area of approximately 21 km 2 , indicating a slight underestimation. This fact is derived from the same logic as that at the Hiroshima site; that is, the proposed methodology does not include debris deposited at the base of mountainous terrain because of the land cover-based masking operations.
Table 3 describes the numerical evaluation of the predicted result for the landslide area and other areas. The user and producer accuracies were approximately 54.1% and 62.4%, respectively. These accuracies indicate that the proposed methodology can exhibit an excellent performance when mapping coseismic landslides. Aimaiti et al. [61] also detected the coseismic landslide caused by this event using a larger remote sensing dataset and a decision-tree classifier approach; in addition to the same descending-track SAR dataset used in this study, they employed an additional set of ascending-track PALSAR-2 data acquired before and after the earthquake. Their best classification results were 54.8% and 61.8% for the user and producer accuracies, respectively. Our result using only one pair of PALSAR-2 images achieved a similar performance, indicating the reliability of the proposed methodology for detecting the damage induced by a coseismic landslide. The overall accuracy was approximately 82.8%, and the kappa coefficient was 0.47. The obtained metric values further indicate that the proposed methodology could be applicable for mapping the damage caused by mass movements, especially coseismic landslides, using bitemporal pairs of PALSAR-2 intensity images.

6. Discussion

In the detection and mapping of debris flows and coseismic landslides, the proposed method explores only the backscattering patterns found in SAR intensity images. External information, such as land cover type and DEM data, were used only to help reduce false detections in areas where slope failure could not have been produced, such as plain and rice paddy regions. Although the proposed framework can be applied to map two types of mass movement disasters, this technique is limited insomuch that case-dependent threshold parameters are required to ensure a high detection accuracy. In this work, to simplify the methodology and ensure its accuracy, we conduct a sensitivity analysis of each parameter by comparing the detection results in subset areas. The results of this analysis indicate that the slope angle and window size (kernel) for adaptive thresholding are essential parameters. Therefore, to ensure the transferability of the proposed framework, we further evaluate these two parameters (Figure 11). For the slope angle, values between 16 degrees and 18 degrees are recommended for initial detection. In contrast, the kernel size depends on the average size of the landslide segment; thus, the suggested values range from 17 pixels (42.5 m) to 19 pixels (47.5 m) and from 29 pixels (72.5 m) to 31 pixels (77.5 m) for debris flows and coseismic landslides, respectively.
Finally, it is important to emphasize that a mapping framework capable of rapidly and semiautomatically extracting landslides represents a vital service in rapid damage response endeavors immediately following disasters. By using only SAR intensity images and image processing tools, our framework is an improvement over other optical image-based methods, which are limited by weather conditions, and InSAR analysis, which is generally used for seismic-induced events.

7. Conclusions

In this work, a methodology using a fusion of pixel- and object-based operations was proposed to detect the damage induced by the mass movements of two different source-induced events. The proposed method was applied to map the debris flow-induced damage following the 2018 torrential rain event in the Hiroshima area and the coseismic landslide-induced damage triggered by the 2018 M6.7 Hokkaido earthquake. We employed PALSAR-2 intensity images acquired before and after each disaster event. A series of optimal threshold values were identified using corresponding RGB color-coded PALSAR-2 images. In the detection of debris flow damage, a comparison with the reference data indicated that our methodology could reliably detect the spatial distributions and scar traces of debris flow segments.
Furthermore, the detection of the coseismic landslide yielded a good accuracy performance (kappa coefficient equal to 0.47) similar to the performance of other methods employing relatively extensive datasets and numerical classifiers. The proposed methodology can rapidly (taking approximately 30 min to complete) detect damage associated with mass movements, and this processing time indicates that the proposed method is suitable for rapid response scenarios, as this method can provide the preliminary shape and location of landslide damage. However, to obtain the precise dimensions, further improvements are required. In follow-up studies, the fusion of different SAR sensor datasets under several acquisition conditions will be explored to improve upon the current results.

Author Contributions

B.A. and N.Y. were responsible for the overall design of the study. B.A. and N.Y. performed the data preprocessing. B.A. conducted the SAR image analysis experiments. H.M., M.M., and S.K. supported the revision of the manuscript. B.A. drafted the initial manuscript. All authors have read and agreed to the published version of the manuscript.

Funding

This research was funded by the Japan Society for the Promotion of Science (KAKENHI 19H02408, 18K18067, and 17H06108), the Japan Science and Technology Agency (JST) CREST project number JP-MJCR1411.

Acknowledgments

The authors would like to thank JAXA for providing the ALOS-2 PALSAR-2 dataset through the 2nd Research Announcement on the Earth Observations (EO-RA2), the Sentinel missions for providing the Sentinel-2 imagery. All cartographic maps were created using QGIS software version 3.4. The SAR dataset preprocessing was conducted using the SARscape v5.5 toolbox operating under ENVI 5.5 software.

Conflicts of Interest

The authors declare no conflicts of interest.

References

  1. Tien Bui, D.; Tuan, T.A.; Klempe, H.; Pradhan, B.; Revhaug, I. Spatial prediction models for shallow landslide hazards: A comparative assessment of the efficacy of support vector machines, artificial neural networks, kernel logistic regression, and logistic model tree. Landslides 2016, 13, 361–378. [Google Scholar] [CrossRef]
  2. Froude, M.J.; Petley, D.N. Global fatal landslide occurrence from 2004 to 2016. Nat. Hazards Earth Syst. Sci. 2018, 18, 2161–2181. [Google Scholar] [CrossRef] [Green Version]
  3. Kurtz, C.; Stumpf, A.; Malet, J.P.; Gançarski, P.; Puissant, A.; Passat, N. Hierarchical extraction of landslides from multiresolution remotely sensed optical images. ISPRS J. Photogramm. Remote Sens. 2014, 87, 122–136. [Google Scholar] [CrossRef] [Green Version]
  4. Massey, C.; Townsend, D.; Rathje, E.; Allstadt, K.E.; Lukovic, B.; Kaneko, Y.; Bradley, B.; Wartman, J.; Jibson, R.W.; Petley, D.N.; et al. Landslides Triggered by the 14 November 2016 Mw 7.8 Kaikōura Earthquake, New ZealandLandslides Triggered by the 14 November 2016 Mw 7.8 Kaikōura Earthquake, New Zealand. Bull. Seismol. Soc. Am. 2018, 108, 1630–1648. [Google Scholar] [CrossRef]
  5. Miura, H. Fusion Analysis of Optical Satellite Images and Digital Elevation Model for Quantifying Volume in Debris Flow Disaster. Remote Sens. 2019, 11. [Google Scholar] [CrossRef] [Green Version]
  6. Hu, K.H.; Cui, P.; Zhang, J.Q. Characteristics of damage to buildings by debris flows on 7 August 2010 in Zhouqu, Western China. Nat. Hazards Earth Syst. Sci. 2012, 12, 2209–2217. [Google Scholar] [CrossRef]
  7. Xiao, H.; Luo, Z.; Niu, Q.; Chang, J. The 2010 Zhouqu mudflow disaster: possible causes, human contributions, and lessons learned. Nat. Hazards 2013, 67, 611–625. [Google Scholar] [CrossRef]
  8. Zhao, W.; Li, A.; Nan, X.; Zhang, Z.; Lei, G. Postearthquake Landslides Mapping From Landsat-8 Data for the 2015 Nepal Earthquake Using a Pixel-Based Change Detection Method. IEEE J. Sel. Top. Appl. Earth Obs. Remote Sens. 2017, 10, 1758–1768. [Google Scholar] [CrossRef]
  9. Lacroix, P. Landslides triggered by the Gorkha earthquake in the Langtang valley, volumes and initiation processes. Earth Planets Space 2016, 68, 46. [Google Scholar] [CrossRef] [Green Version]
  10. Guzzetti, F.; Mondini, A.C.; Cardinali, M.; Fiorucci, F.; Santangelo, M.; Chang, K.T. Landslide inventory maps: New tools for an old problem. Earth-Sci. Rev. 2012, 112, 42–66. [Google Scholar] [CrossRef] [Green Version]
  11. Yang, W.; Wang, M.; Shi, P. Using MODIS NDVI Time Series to Identify Geographic Patterns of Landslides in Vegetated Regions. IEEE Geosci. Remote Sens. Lett. 2013, 10, 707–710. [Google Scholar] [CrossRef]
  12. Hölbling, D.; Friedl, B.; Eisank, C. An object-based approach for semi-automated landslide change detection and attribution of changes to landslide classes in northern Taiwan. Earth Sci. Inf. 2015, 8, 327–335. [Google Scholar] [CrossRef] [Green Version]
  13. Mondini, A.C.; Guzzetti, F.; Reichenbach, P.; Rossi, M.; Cardinali, M.; Ardizzone, F. Semi-automatic recognition and mapping of rainfall induced shallow landslides using optical satellite images. Remote Sens. Environ. 2011, 115, 1743–1757. [Google Scholar] [CrossRef]
  14. Mondini, A.C.; Marchesini, I.; Rossi, M.; Chang, K.T.; Pasquariello, G.; Guzzetti, F. Bayesian framework for mapping and classifying shallow landslides exploiting remote sensing and topographic data. Geomorphology 2013, 201, 135–147. [Google Scholar] [CrossRef]
  15. Rau, J.Y.; Jhan, J.P.; Rau, R.J. Semiautomatic object-oriented landslide recognition scheme from multisensor optical imagery and DEM. IEEE Trans. Geosci. Remote Sens. 2014, 52, 1336–1349. [Google Scholar] [CrossRef]
  16. Yong Lv, Z.; Shi, W.; Zhang, X.; Benediktsson, J.A. Landslide Inventory Mapping From Bitemporal High-Resolution Remote Sensing Images Using Change Detection and Multiscale Segmentation. IEEE J. Sel. Top. Appl. Earth Obs. Remote Sens. 2018, 11, 1520–1532. [Google Scholar] [CrossRef]
  17. Riedel, B.; Walther, A. InSAR processing for the recognition of landslides. Adv. Geosci. 2008, 14, 189–194. [Google Scholar] [CrossRef] [Green Version]
  18. Cascini, L.; Fornaro, G.; Peduto, D. Analysis at medium scale of low-resolution DInSAR data in slow-moving landslide-affected areas. ISPRS J. Photogramm. Remote Sens. 2009, 64, 598–611. [Google Scholar] [CrossRef]
  19. Rabus, B.; Pichierri, M. A New InSAR Phase Demodulation Technique Developed for a Typical Example of a Complex, Multi-Lobed Landslide Displacement Field, Fels Glacier Slide, Alaska. Remote Sens. 2018, 10. [Google Scholar] [CrossRef] [Green Version]
  20. Zhao, F.; Mallorqui, J.J.; Iglesias, R.; Gili, J.A.; Corominas, J. Landslide Monitoring Using Multi-Temporal SAR Interferometry with Advanced Persistent Scatterers Identification Methods and Super High-Spatial Resolution TerraSAR-X Images. Remote Sens. 2018, 10. [Google Scholar] [CrossRef] [Green Version]
  21. Kang, Y.; Zhao, C.; Zhang, Q.; Lu, Z.; Li, B. Application of InSAR Techniques to an Analysis of the Guanling Landslide. Remote Sens. 2017, 9. [Google Scholar] [CrossRef] [Green Version]
  22. Nobile, A.; Dille, A.; Monsieurs, E.; Basimike, J.; Bibentyo, T.M.; D’Oreye, N.; Kervyn, F.; Dewitte, O. Multi-Temporal DInSAR to Characterise Landslide Ground Deformations in a Tropical Urban Environment: Focus on Bukavu (DR Congo). Remote Sens. 2018, 10. [Google Scholar] [CrossRef] [Green Version]
  23. Strozzi, T.; Klimeš, J.; Frey, H.; Caduff, R.; Huggel, C.; Wegmüller, U.; Rapre, A.C. Satellite SAR interferometry for the improved assessment of the state of activity of landslides: A case study from the Cordilleras of Peru. Remote Sens. Environ. 2018, 217, 111–125. [Google Scholar] [CrossRef] [Green Version]
  24. Shi, X.; Zhang, L.; Balz, T.; Liao, M. Landslide deformation monitoring using point-like target offset tracking with multi-mode high-resolution TerraSAR-X data. ISPRS J. Photogramm. Remote Sens. 2015, 105, 128–140. [Google Scholar] [CrossRef]
  25. Mondini, A.C. Measures of spatial autocorrelation changes in multitemporal SAR images for event landslides detection. Remote Sens. 2017, 9. [Google Scholar] [CrossRef] [Green Version]
  26. Wang, Y.; Fang, Z.; Hong, H. Comparison of convolutional neural networks for landslide susceptibility mapping in Yanshan County, China. Sci. Total Environ. 2019, 666, 975–993. [Google Scholar] [CrossRef]
  27. Lei, T.; Zhang, Y.; Lv, Z.; Li, S.; Liu, S.; Nandi, A.K. Landslide Inventory Mapping From Bitemporal Images Using Deep Convolutional Neural Networks. IEEE Geosci. Remote Sens. Lett. 2019, 16, 982–986. [Google Scholar] [CrossRef]
  28. Ghorbanzadeh, O.; Blaschke, T.; Gholamnia, K.; Meena, S.R.; Tiede, D.; Aryal, J. Evaluation of Different Machine Learning Methods and Deep-Learning Convolutional Neural Networks for Landslide Detection. Remote Sens. 2019, 11. [Google Scholar] [CrossRef] [Green Version]
  29. Wang, F.; Wu, Y.H.; Yang, H.; Tanida, Y.; Kamei, A. Preliminary investigation of the 20 August 2014 debris flows triggered by a severe rainstorm in Hiroshima City, Japan. Geoenviron. Disasters 2015, 2, 17. [Google Scholar] [CrossRef] [Green Version]
  30. Wang, G.; Sassa, K.; Fukuoka, H. Downslope volume enlargement of a debris slide–debris flow in the 1999 Hiroshima, Japan, rainstorm. Eng. Geol. 2003, 69, 309–330. [Google Scholar] [CrossRef]
  31. Tsuguti, H.; Seino, N.; Kawase, H.; Imada, Y.; Nakaegawa, T.; Takayabu, I. Meteorological overview and mesoscale characteristics of the Heavy Rain Event of July 2018 in Japan. Landslides 2019, 16, 363–371. [Google Scholar] [CrossRef]
  32. Liu, W.; Yamazaki, F.; Maruyama, Y. Extraction of Inundation Areas Due to the July 2018 Western Japan Torrential Rain Event Using Multi-Temporal ALOS-2 Images. J. Disaster Res. 2019, 14, 445–455. [Google Scholar] [CrossRef]
  33. Hirota, K.; Konagai, K.; Sassa, K.; Dang, K.; Yoshinaga, Y.; Wakita, E.K. Landslides triggered by the West Japan Heavy Rain of July 2018, and geological and geomorphological features of soaked mountain slopes. Landslides 2019, 16, 189–194. [Google Scholar] [CrossRef]
  34. The Association of Japanese Geographers. The 2018 July Heavy rain in West Japan. Available online: http://ajg-disaster.blogspot.com/2018/07/3077.html (accessed on 1 November 2019). (In Japanese).
  35. Zhang, S.; Li, R.; Wang, F.; Iio, A. Characteristics of landslides triggered by the 2018 Hokkaido Eastern Iburi earthquake, Northern Japan. Landslides 2019, 16, 1691–1708. [Google Scholar] [CrossRef]
  36. Yamagishi, H.; Yamazaki, F. Landslides by the 2018 Hokkaido Iburi-Tobu Earthquake on September 6. Landslides 2018, 15, 2521–2524. [Google Scholar] [CrossRef] [Green Version]
  37. Osanai, N.; Yamada, T.; Hayashi, S.I.; Kastura, S.; Furuichi, T.; Yanai, S.; Murakami, Y.; Miyazaki, T.; Tanioka, Y.; Takiguchi, S.; et al. Characteristics of landslides caused by the 2018 Hokkaido Eastern Iburi Earthquake. Landslides 2019, 16, 1517–1528. [Google Scholar] [CrossRef]
  38. Japan Aerospace Exploration Agency (JAXA). ALOS-2 Project/PALSAR-2. Available online: https://www.eorc.jaxa.jp/ALOS-2/en/about/palsar2.htm (accessed on 1 November 2019).
  39. Motohka, T.; Isoguchi, O.; Sakashita, M.; Shimada, M. Results of ALOS-2 PALSAR-2 Calibration and Validation After 3 Years of Operation. In Proceedings of the IGARSS 2018 IEEE International Geoscience and Remote Sensing Symposium, Valencia, Spain, 22–29 July 2018; pp. 4169–4170. [Google Scholar] [CrossRef]
  40. Japan Aerospace Exploration Agency (JAXA). High-Resolution Land Use and Land Cover Map Products. Available online: https://www.eorc.jaxa.jp/ALOS/en/lulc/lulc_index.htm (accessed on 1 November 2019).
  41. United States Geological Survey. Landsat Missions-Landsat-8. Available online: https://www.usgs.gov/land-resources/nli/landsat/landsat-8?qt-science_support_page_related_con=0#qt-science_support_page_related_con (accessed on 1 November 2019).
  42. Kirschbaum, D.; Stanley, T.; Zhou, Y. Spatial and temporal analysis of a global landslide catalog. Geomorphology 2015, 249, 4–15. [Google Scholar] [CrossRef]
  43. Rabus, B.; Eineder, M.; Roth, A.; Bamler, R. The shuttle radar topography mission—A new class of digital elevation models acquired by spaceborne radar. ISPRS J. Photogramm. Remote Sens. 2003, 57, 241–262. [Google Scholar] [CrossRef]
  44. Martinez-Agirre, A.; Álvarez-Mozos, J.; Lievens, H.; Verhoest, N.E.C.; Giménez, R. Influence of Surface Roughness Sample Size for C-Band SAR Backscatter Applications on Agricultural Soils. IEEE Geosci. Remote Sens. Lett. 2017, 14, 2300–2304. [Google Scholar] [CrossRef] [Green Version]
  45. Parrens, M.; Wigneron, J.P.; Richaume, P.; Mialon, A.; Bitar, A.A.; Fernandez-Moran, R.; Al-Yaari, A.; Kerr, Y.H. Global-scale surface roughness effects at L-band as estimated from SMOS observations. Remote Sens. Environ. 2016, 181, 122–136. [Google Scholar] [CrossRef]
  46. Park, J.; Song, W.J.; Pearlman, W.A. Speckle filtering of SAR images based on adaptive windowing. IEE Proc.-Vis. Image Signal Process. 1999, 146, 191–197. [Google Scholar] [CrossRef] [Green Version]
  47. Aurich, V.; Weule, J. Non-Linear Gaussian Filters Performing Edge Preserving Diffusion. In Mustererkennung 1995; Sagerer, G., Posch, S., Kummert, F., Eds.; Springer: Berlin, Heidelberg, 1995; pp. 538–545. [Google Scholar]
  48. Buades, A.; Coll, B.; Morel, J. The staircasing effect in neighborhood filters and its solution. IEEE Trans. Image Process. 2006, 15, 1499–1505. [Google Scholar] [CrossRef] [PubMed] [Green Version]
  49. Blayvas, I.; Bruckstein, A.; Kimmel, R. Efficient computation of adaptive threshold surfaces for image binarization. Pattern Recognit. 2006, 39, 89–101. [Google Scholar] [CrossRef]
  50. Lai, Y.; Rosin, P.L. Efficient Circular Thresholding. IEEE Trans. Image Process. 2014, 23, 992–1001. [Google Scholar] [CrossRef] [PubMed]
  51. Zhang, Y.; Wu, L. Optimal Multi-Level Thresholding Based on Maximum Tsallis Entropy via an Artificial Bee Colony Approach. Entropy 2011, 13, 841–859. [Google Scholar] [CrossRef] [Green Version]
  52. Liu, W.; Yamazaki, F.; Maruyama, Y. Detection of Earthquake-Induced Landslides during the 2018 Kumamoto Earthquake Using Multitemporal Airborne Lidar Data. Remote Sens. 2019, 11. [Google Scholar] [CrossRef] [Green Version]
  53. United States Geological Survey. Landslide Types and Processes. Available online: https://pubs.usgs.gov/fs/2004/3072/pdf/fs2004-3072.pdf (accessed on 1 November 2019).
  54. Mahalingam, R.; Olsen, M.J. Evaluation of the influence of source and spatial resolution of DEMs on derivative products used in landslide mapping. Geomat. Nat. Hazards Risk 2016, 7, 1835–1855. [Google Scholar] [CrossRef]
  55. Kritikos, T.; Davies, T. Assessment of rainfall-generated shallow landslide/debris-flow susceptibility and runout using a GIS-based approach: application to western Southern Alps of New Zealand. Landslides 2015, 12, 1051–1075. [Google Scholar] [CrossRef]
  56. Geertsema, M.; Hungr, O.; Schwab, J.W.; Evans, S.G. A large rockslide–debris avalanche in cohesive soil at Pink Mountain, northeastern British Columbia, Canada. Eng. Geol. 2006, 83, 64–75. [Google Scholar] [CrossRef]
  57. Lauknes, T.; Shanker, A.P.; Dehls, J.; Zebker, H.; Henderson, I.; Larsen, Y. Detailed rockslide mapping in northern Norway with small baseline and persistent scatterer interferometric SAR time series methods. Remote Sens. Environ. 2010, 114, 2097–2109. [Google Scholar] [CrossRef]
  58. Suzuki, S.; Abe, K. Topological structural analysis of digitized binary images by border following. Comput. Vis. Graph. Image Process. 1985, 30, 32–46. [Google Scholar] [CrossRef]
  59. Holecz, F.; Meier, E.; Piesbergen, J.; Nuesch, D. Topographic effects on radar cross section. In SAR Calibration Workshop; CEOS Calibration Sub-Group: Noordwijk, The Netherlands, 1993. [Google Scholar]
  60. Small, D. Flattening Gamma: Radiometric Terrain Correction for SAR Imagery. IEEE Trans. Geosci. Remote Sens. 2011, 49, 3081–3093. [Google Scholar] [CrossRef]
  61. Aimaiti, Y.; Liu, W.; Yamazaki, F.; Maruyama, Y. Earthquake-Induced Landslide Mapping for the 2018 Hokkaido Eastern Iburi Earthquake Using PALSAR-2 Data. Remote Sens. 2019, 11. [Google Scholar] [CrossRef] [Green Version]
Figure 1. (a) Locations of the target areas where the studied events occurred. (b,c) show the target regions (black dashed rectangles) encompassing the Hokkaido and Hiroshima regions, respectively. (d) Hokkaido study area. The red star shows the location of the epicenter. The blue rectangle shows the footprint covered by Advanced Land Observing Satellite-2 (ALOS-2). (e) Hiroshima study area. The blue rectangles show the footprints covered by ALOS-2.
Remotesensing 12 00561 g001
Figure 2. (a) JAXA’s land cover maps for the Hiroshima and Hokkaido areas (shown in the left and right panels, respectively). Land cover labels: DBF: Deciduous broadleaf forest, DNF: Deciduous needle-leaved forest, EBF: Evergreen broadleaf forest, and ENF: Evergreen needle-leaved forest. (b) Shuttle Radar Topography Mission (SRTM) digital elevation model (DEM) data used for the two study areas.
Remotesensing 12 00561 g002
Figure 3. Pre-event PALSAR-2, post-event PALSAR-2, RGB color-coded PALSAR-2 images (R: Pre-event, G and B: Post-event), and optical images. (a) Debris flow in Hiroshima after torrential rainfall. (b) Coseismic landslide in the Hokkaido study area.
Remotesensing 12 00561 g003
Figure 4. Schematic cross-sections of the landslide (debris flow) areas observed in synthetic aperture radar (SAR) intensity images.
Remotesensing 12 00561 g004
Figure 5. Research workflow for the detection and mapping of landslides using multitemporal SAR intensity images.
Remotesensing 12 00561 g005
Figure 6. (a) PALSAR-2 RGB color-coded images (top: Hiroshima area, bottom: Hokkaido area). (b) Result of applying an adaptive threshold to the PALSAR-2 dataset. Increasing and decreasing segments are indicated by cyan and red colors, respectively. (c) Masked increasing and decreasing intensity images using the land cover information and slope angles computed from the SRTM DEM dataset. (d) Result of applying object-based operations.
Remotesensing 12 00561 g006
Figure 7. Cumulative frequency function of the segment size from each target area (INC: Increasing segments; DEC: Decreasing segments). The segments detected from the Hiroshima site are smaller than those from the Hokkaido site.
Remotesensing 12 00561 g007
Figure 8. Comparison between the detected coseismic landslide (left panel) and the Geospatial Information Authority of Japan (GSI) reference data (right panel) for the Hokkaido study area.
Remotesensing 12 00561 g008
Figure 9. Debris flow detection results in the Hiroshima study area. The top and bottom panels show the areas around Kamiboda in the town of Kurose and the town of Kumano, respectively. The left panels show the detection results, the center panels correspond to the AJG reference data, and the right panels show the Sentinel-2 images.
Remotesensing 12 00561 g009
Figure 10. Comparison between the detected coseismic landslide (left panel) and the GSI reference data (right panel) for the Hokkaido study area.
Remotesensing 12 00561 g010
Figure 11. Analysis of optimal values for slope angle (left panel), and kernel size for adaptive thresholding that used in the proposed framework. The vertical frames show the range of recommended values for detecting landslides using ALOS-2 intensity images.
Remotesensing 12 00561 g011
Table 1. Phased Array type L-band Synthetic Aperture Radar (PALSAR-2) scenes used in this study.
EventAcquisition DatePolarizationIncident Angle
2018 Torrential Rain in Western Japan8 July 2018HH48.4
19 May 2015HH48.4
2018 Mw6.7 Hokkaido Earthquake6 September 2018HH37.8
23 August 2018HH37.8
Table 2. Accuracy metrics for the Hiroshima study area (U.A.: User accuracy; P.A.: Producer accuracy).
Detection Results
Landslides (km 2 )Others (km 2 )Total (km 2 )P.A. (%)
Reference DataLandslides (km 2 )0.661.532.1929.93
Others (km 2 )1.15212.66213.8199.46
Total (km 2 )1.81214.19216.00
U.A. (%)36.2699.28
Overall Accuracy = 98.76%Kappa Coefficient = 0.32
Table 3. Accuracy metrics for the Hokkaido study area (U.A.: User accuracy; P.A.: Producer accuracy).
Detection Results
Landslides (km 2 )Others (km 2 )Total (km 2 )P.A. (%)
Reference DataLandslides (km 2 )13.237.9921.2262.35
Others (km 2 )11.2479.2790.5187.58
Total (km 2 )24.4787.26111.73
U.A. (%)54.0790.85
Overall Accuracy = 82.79%Kappa Coefficient = 0.47

