Article

Broad-Scale Weather Patterns Encountered during Flight Influence Landbird Stopover Distributions

by
Hannah L. Clipp
1,*,†,
Emily B. Cohen
2,‡,
Jaclyn A. Smolinsky
1,
Kyle G. Horton
3,§,
Andrew Farnsworth
3 and
Jeffrey J. Buler
1
1
Department of Entomology and Wildlife Ecology, University of Delaware, Newark, DE 19716, USA
2
Migratory Bird Center, Smithsonian Conservation Biology Institute, National Zoological Park, Washington, DC 20013, USA
3
Cornell Lab of Ornithology, Cornell University, Ithaca, NY 14850, USA
*
Author to whom correspondence should be addressed.
Current affiliation: Division of Forestry and Natural Resources, West Virginia University, Morgantown, WV 26506, USA.
Current affiliation: Appalachian Laboratory, University of Maryland Center for Environmental Science, Frostburg, MD 21532, USA.
§
Current affiliation: Department of Fish, Wildlife, and Conservation Biology, Colorado State University, Fort Collins, CO 80523, USA.
Submission received: 16 January 2020 / Revised: 5 February 2020 / Accepted: 6 February 2020 / Published: 8 February 2020
(This article belongs to the Special Issue Radar Aeroecology)

Abstract

:
The dynamic weather conditions that migrating birds experience during flight likely influence where they stop to rest and refuel, particularly after navigating inhospitable terrain or large water bodies, but effects of weather on stopover patterns remain poorly studied. We examined the influence of broad-scale weather conditions encountered by nocturnally migrating Nearctic-Neotropical birds during northward flight over the Gulf of Mexico (GOM) on subsequent coastal stopover distributions. We categorized nightly weather patterns using historic maps and quantified region-wide densities of birds in stopover habitat with data collected by 10 weather surveillance radars from 2008 to 2015. We found spring weather patterns over the GOM were most often favorable for migrating birds, with winds assisting northward flight, and document regional stopover patterns in response to specific unfavorable weather conditions. For example, Midwest Continental High is characterized by strong northerly winds over the western GOM, resulting in high-density concentrations of migrants along the immediate coastlines of Texas and Louisiana. We show, for the first time, that broad-scale weather experienced during flight influences when and where birds stop to rest and refuel. Linking synoptic weather patterns encountered during flight with stopover distributions contributes to the emerging macro-ecological understanding of bird migration, which is critical to consider in systems undergoing rapid human-induced changes.

Graphical Abstract

1. Introduction

Weather shapes the biogeographical distributions of migrating organisms. The defining role of weather patterns in bird migration has a long history [1,2], including observations of unusually early migrant arrivals and occurrences of regionally rare birds in response to intense storms [3]. More recent research supports the influence of weather on many aspects of avian migration, including energetic costs of flight [4], timing [5], flight duration [4], route choice [6], and risk of mortality [7,8]. Relationships of wind and precipitation with the flight behavior of nocturnally migrating landbirds (i.e., passerines and related species with terrestrial life histories) are particularly well studied. For example, favorable wind speed and direction increase the abundance [9,10,11,12,13] and flight speeds [14,15,16] of migrating birds in the air and decrease the degree to which they compensate for drift [17,18,19]. Precipitation and adverse winds delay departure from terrestrial stopover habitat used to rest and refuel between migratory flights [20,21,22,23]. Although we have some understanding of how birds migrating over land respond directly to discrete weather conditions (e.g., wind speed/direction and air pressure) at short time scales [24], the influence of broad-scale weather conditions encountered during flight on where birds stop in terrestrial habitat has not been well studied.
Migrants “fall out” after crossing water when weather conditions along a coastline are unfavorable, but they can fly farther inland when weather is favorable [25,26]. Broad-scale weather conditions encountered during flight over ecological barriers (e.g., large water bodies or terrain inhospitable for landing) presumably influence subsequent stopover distributions [7]. However, support for this has been difficult to measure because neither precise locations of small birds in airspace over such regions nor origins of their flights are known. Direct associations of individual birds with discrete weather conditions (e.g., wind speed/direction, precipitation) during these long-distance and long-duration flights (e.g., 18–24 hours over the Gulf of Mexico (GOM), covering >1,000 km [21]) is not currently possible. Until methodologies are available to follow thousands of small individual birds during their flights across large ecological barriers while concurrently measuring the environmental conditions they encounter in real-time, local and discrete weather variables remain inadequate to explain the influence of weather on broad-scale migration during or after barrier crossings.
Alternatively, the meteorological community often uses synoptic weather types [27,28] to describe weather systems occurring over broad (>1000 km) spatial extents holistically over 1–2 day periods, based on general wind patterns, air pressure gradients, and frontal boundaries [29,30,31,32,33,34,35,36,37]. Synoptic-scale weather is important in shaping migratory flight behavior of birds at take-off [4,38] and en route [39]. Anecdotal observations and local studies (e.g., Yaukey and Powell [40]) suggest that synoptic weather types could be used to also predict region-wide stopover distributions adjacent to barriers. Ultimately, cumulative effects of individual responses to synoptic weather conditions may shape evolution of migratory flyways and determine where migrating birds stop to rest and refuel at broad temporal and spatial scales [41,42,43,44].
In the western hemisphere, billions of migratory birds [45] fly non-stop across the GOM [46,47], where they may encounter unpredictable and complex weather conditions [7]. This system presents a unique opportunity to test the impacts of synoptic weather types on migratory bird distributions in the spring. In support of this, the abundance of migrating birds on offshore oil and gas platforms varies with synoptic weather, such that migrants are most abundant on platforms in the far western GOM and along the Texas coast when winds over the GOM are blowing from the east [48]. There is also support for the influence of weather fronts along the GOM coast on local stopover distributions on barrier islands [25,26]. Yet no study has assessed if or how synoptic-scale weather over the GOM influences migratory stopover distributions in terrestrial habitat at the conclusion of northward flights.
The NEXRAD (“NEXt generation RADars”) network comprises approximately 143 Doppler radar stations (hereafter weather radars) located throughout the conterminous United States and maintained by the National Weather Service. Although primarily used to study meteorological phenomena, weather radars also detect signatures of biological targets such as migrating birds in the airspace. Data collected daily by weather radars around the GOM, covering nearly the entire United States coast, can characterize large-scale spatial distributions of birds in stopover habitat [49,50,51]. Our objective was to use weather radar data to understand region-wide distributions of migrating birds in terrestrial habitat during spring after encountering broad-scale weather conditions in the course of the previous night’s flight over an ecological barrier. We predicted that synoptic weather experienced en route over the GOM influences broad-scale stopover distributions, while controlling for other known influential factors, including habitat abundance [52,53], longitude, and distance from the coastline [45,53]. In addition, we assessed how specific synoptic weather types influence stopover distributions and whether synoptic weather types categorized as “favorable” or “unfavorable” to northward migration have a stronger influence on stopover distributions. We expected the influence of specific synoptic weather types to interact strongly with that of longitude and distance from the coast by affecting where birds make landfall along the coast and how far they fly inland [52,53]. For example, favorable synoptic weather with strong tailwinds and little to no precipitation is likely to minimize energetic costs of flight over the GOM. Therefore, we expected birds to continue migration farther inland (i.e., fewer birds stopping along the GOM coast) under these conditions [25,26]. Conversely, unfavorable synoptic weather characterized by strong headwinds or precipitation associated with boundaries between air masses (e.g., cold fronts) over the GOM is likely to increase energetic costs of flight. Therefore, we expected birds to stop in higher numbers within the region, particularly along the immediate coast and at longitudes corresponding to the locations of headwinds or fronts, because after encountering adverse flight conditions, migrants may land in the first available habitat [54].

2. Materials and Methods

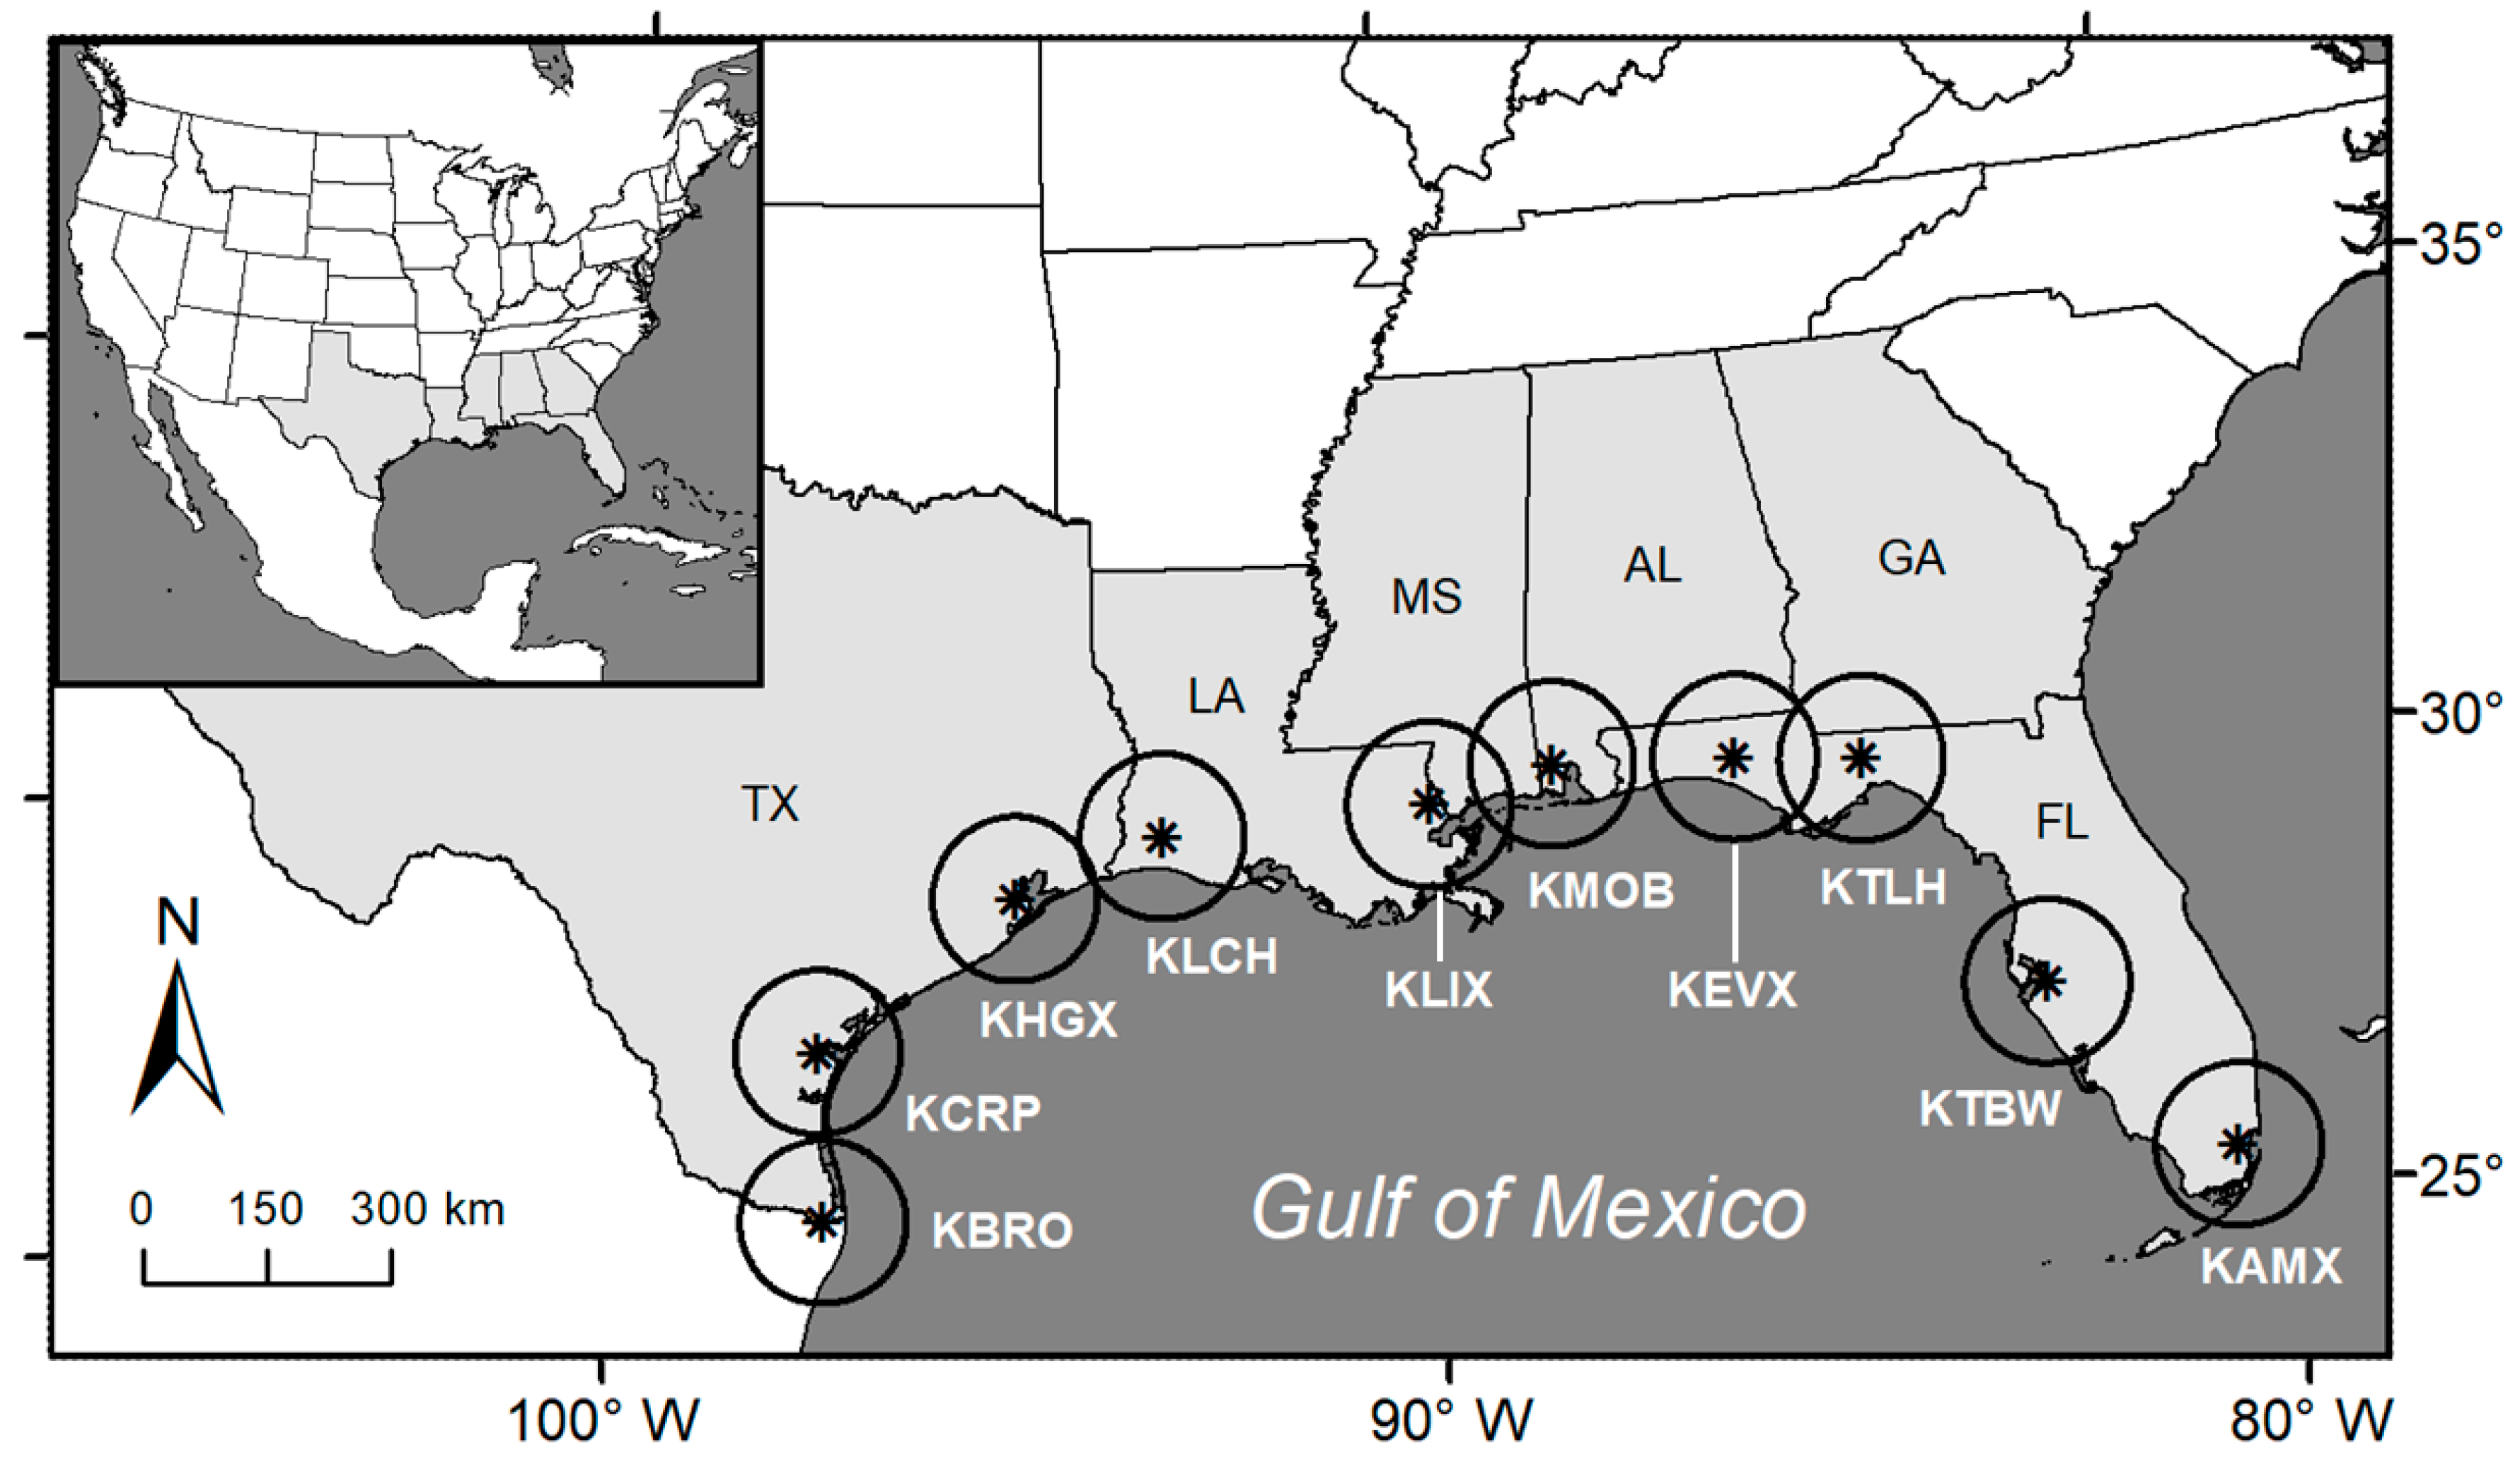
2.1. Quantifying Stopover Density and Distributions with Weather Surveillance Radars

We used archived Level II NEXRAD data from the National Oceanic and Atmospheric Administration to calculate bird stopover density during the peak of spring migration (1 March to 31 May [46]). The data were collected during 2008–2015 from 7.5 km to 100 km around ten weather radars across the United States coast of the GOM (Figure 1). Weather radars measure reflectivity (i.e., a volumetric measure of migrant density) and radial velocity (i.e., a measure of the inbound or outbound radial speeds relative to the radar) within individual radar sample volumes that are 250 m in range and 0.5° in width, scanning the air with 360° sweeps of the beam at multiple elevation angles in 5–10 min intervals. Because nocturnally migrating birds generally depart en masse near civil twilight [49], we visually screened the lowest elevation (0.5° angle) radar scans from 30 minutes before sunset to an hour after sunset and eliminated periods of migratory departure that contained potential sources of contamination (e.g., precipitation, clutter, anomalous propagation of the radar beam). Following McLaren et al. [55], we used animal airspeeds, derived by integrating radial velocity and North American Regional Reanalysis wind measurements [56], to also eliminate sampling periods of migratory departure containing biological reflectivity dominated by organisms other than birds. Specifically, we discarded sampling periods with mean animal airspeeds of less than 5 m s−1 because we considered them dominated by insects [57,58]. Of the 736 calendar days considered during the 2008–2015 study period, we kept an average of 120 radar−1 for analysis. We also excluded any individual sample volume that experienced more than 25% topographic blockage of the radar beam or reflectivity from persistent ground clutter, or were located over open water or Mexican free-tailed bat (Tadarida brasiliensis) roosts [49].
For each suitable migratory departure period at each radar, we measured the density of birds aloft at the onset of nocturnal flight by interpolating observed radar reflectivity for all elevation scans within each radar sample volume to the single daily instance of peak evening bird departure from stopover sites (i.e., when the rate of change in mean reflectivity within 10–40 km of the radar during departure reaches its maximum), in terms of sun elevation angle [59]. Peak evening bird departure generally occurred when the sun was 8° below the horizon (i.e., shortly after the end of evening civil twilight) and within 15 minutes after the NEXRAD site-specific en masse initiation of migratory flight. Flight initiation is the instant when the mean reflectivity within 10–40 km of the radar reaches 10% of the maximum mean reflectivity during evening departure. During the next steps of data processing, we accounted for measurement bias of reflectivity within radar sample volumes due to changing beam height with range from the radar. Specifically, we censored data from sample volumes where the radar beam was too high above the migratory bird layer according to criteria of Buler and Dawson [49]: when the radar beam sampled <10% of the vertical distribution of birds in the air or the measurement bias adjustment factor was less than 0.05. Typically, this meant that the effective detection range was about 80 km from the radar. We then integrated the mean vertical distribution of birds in the air within a radar domain with the observed reflectivity from the lowest elevation scan to produce estimates of vertically integrated reflectivity (VIR) for each radar sample volume at the onset of nocturnal flight, following Buler and Dawson [49]. VIR is a standardized measure of the total reflected cross-sectional area of birds within a one-hectare vertical column (cm2 ha−1) over a radar sample volume. Mean daily VIR at the onset of nocturnal migration is correlated with mean daily observed stopover bird density at the ground within a migration season [50]. Therefore, we interpret mean daily VIR of birds aloft at the onset of nocturnal migration as an index of their stopover distributions on the ground.

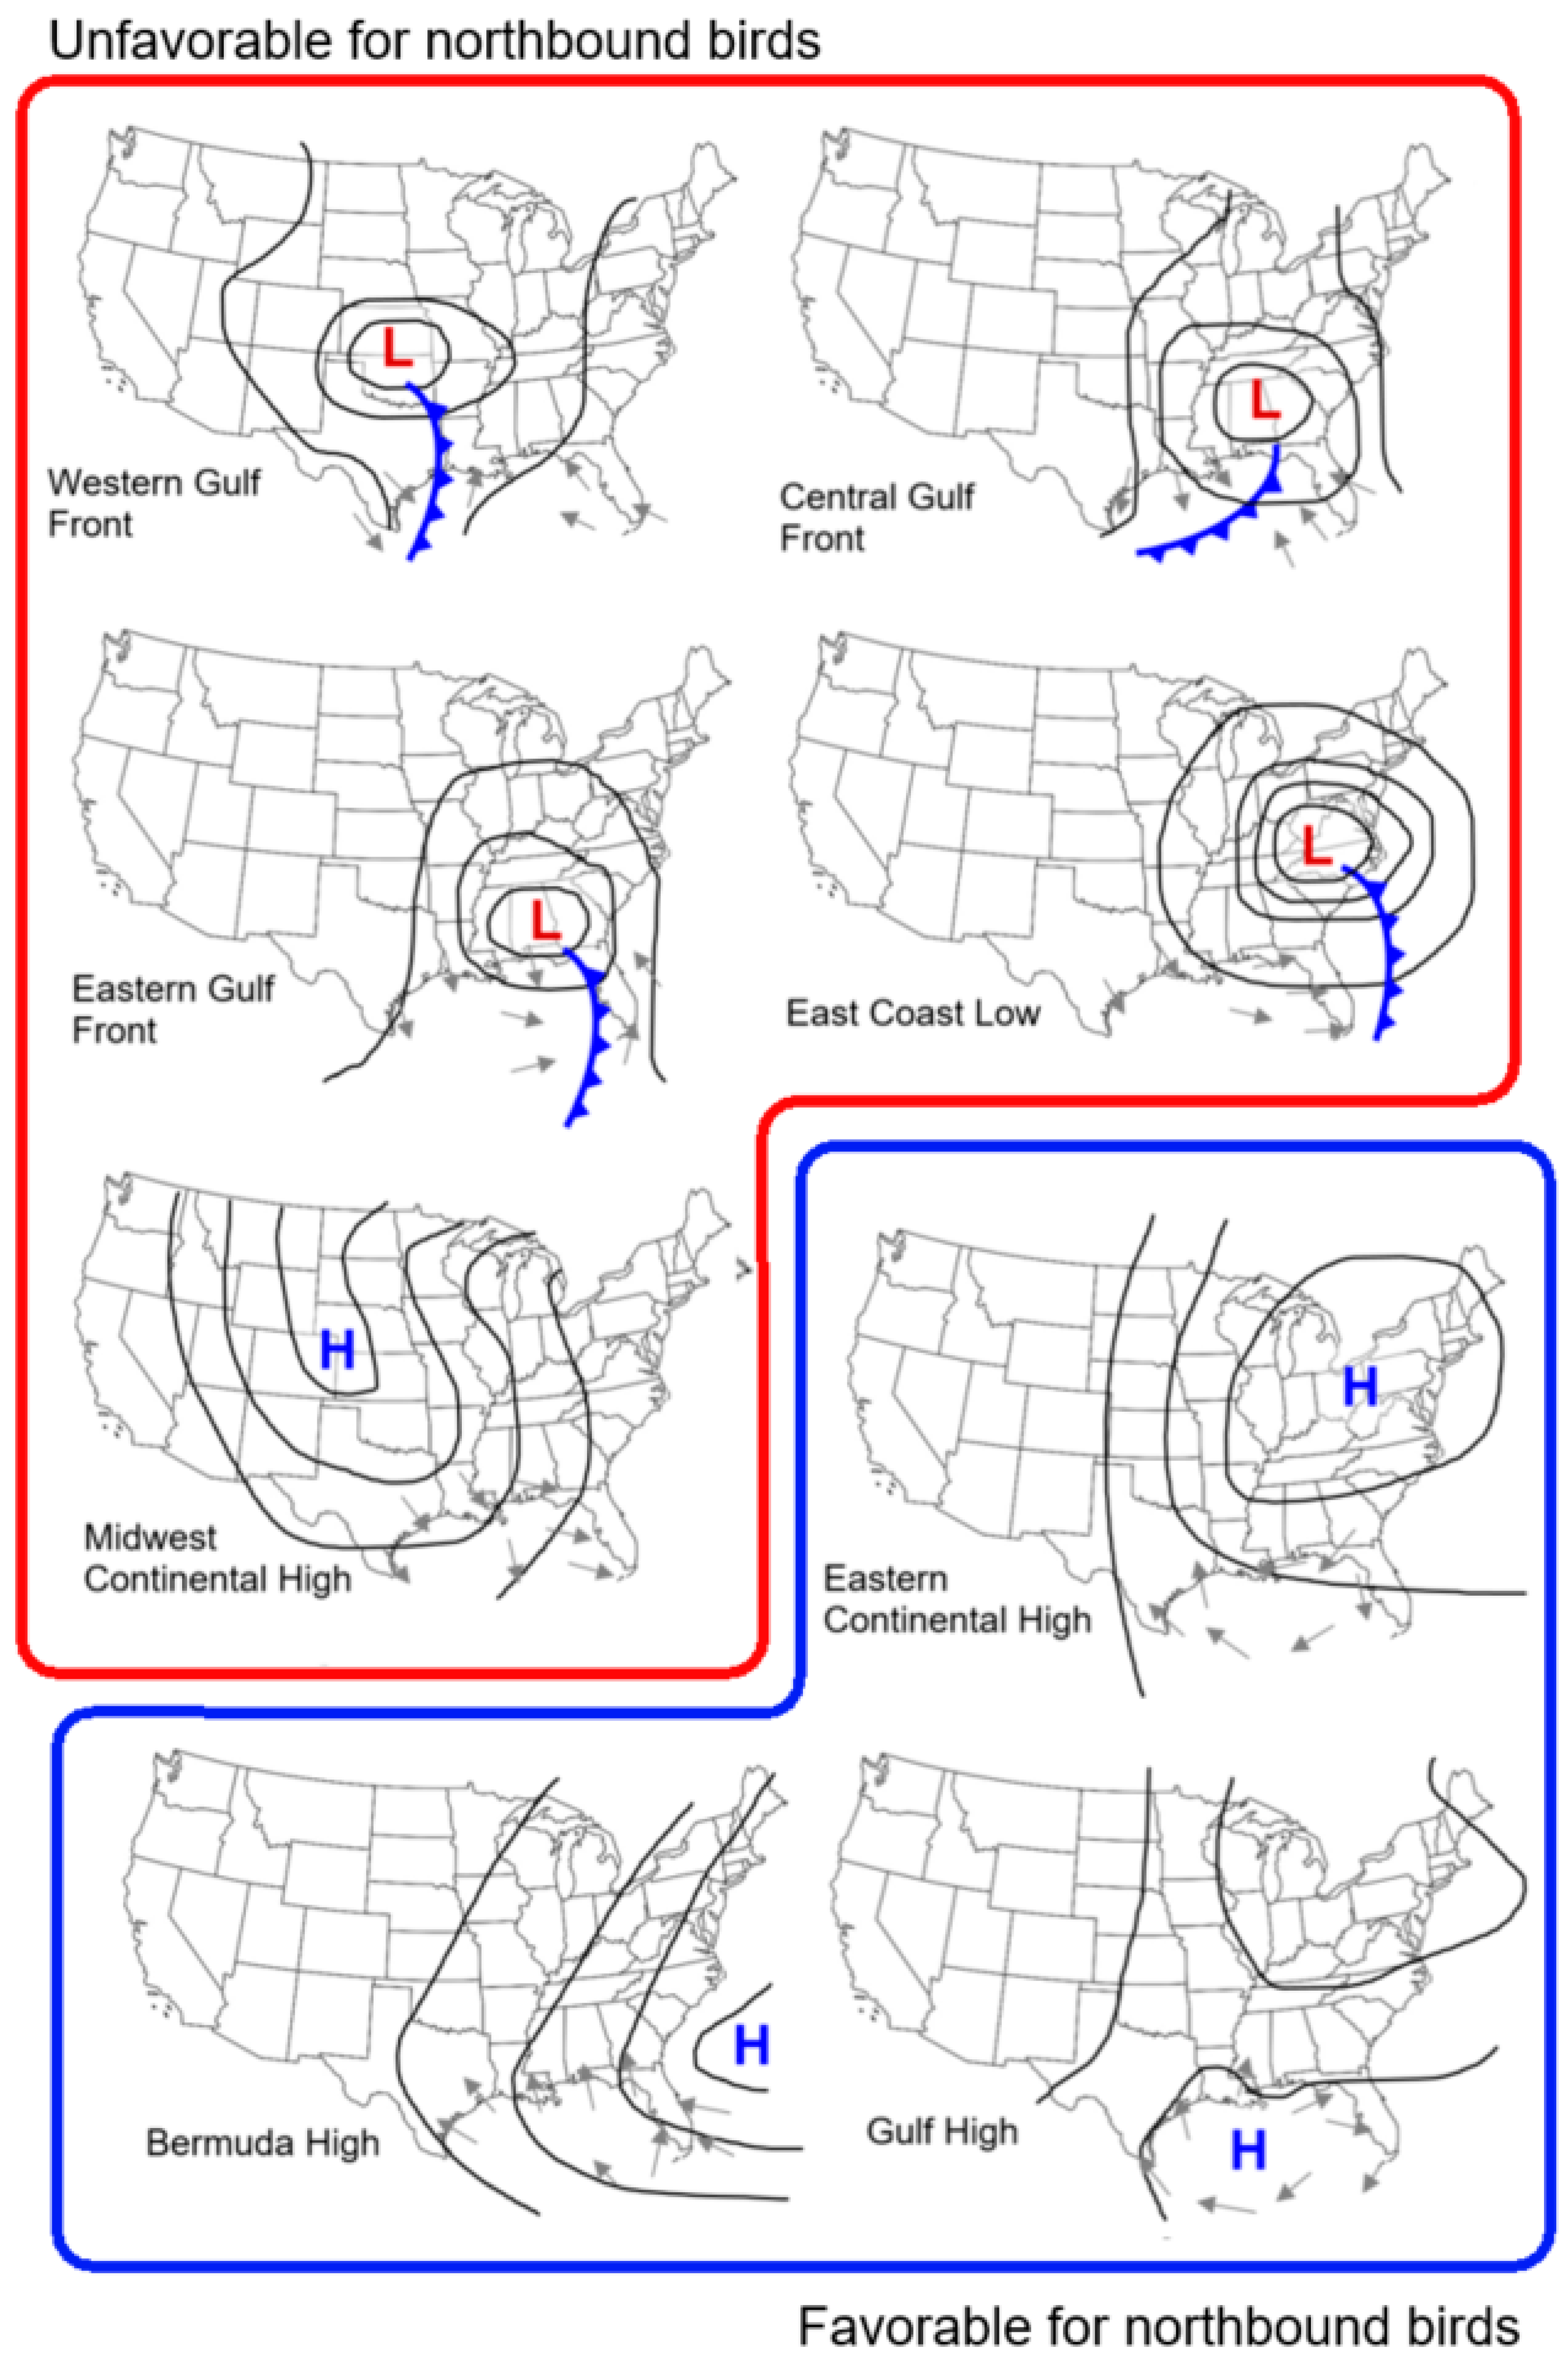
2.2. Classifying Synoptic Weather Types

Using online archived weather maps (originally archived [but since removed] by Unisys at http://weather.unisys.com/archive/sfc_map/ [48]; equivalent maps can be freely accessed from the National Oceanic and Atmospheric Administration National Weather Service’s Surface Analysis Archive at https://www.wpc.ncep.noaa.gov/archives/web_pages/sfc/sfc_archive.php), we classified synoptic weather at 5:05 UTC on the night prior to migratory departure periods (i.e., en route synoptic weather type) when many birds made circum- or trans-Gulf arrival flights to the study area. We focused on synoptic weather conditions occurring the previous night because they are strongly correlated with spring bird stopover densities along the GOM Coast [40] and most migrants along the coast stop over for less than 24 hours in the spring [25]. We used the synoptic weather types (Figure 2; see Table A1 for specific definitions) adapted by Russell [48] from the meteorological work of Muller [33], Muller and Wax [32], and Yocke et al. [36] based on surface pressure contours, high- and low-pressure systems, frontal passage, and wind flow patterns. Approximately 9% of calendar days had complex pressure system configurations that did not fit into these categories, and we considered these uncommon cases together as “other” in our analyses.
Because synoptic weather types are broad-scale categories of a dynamic suite of continuous weather components, we used a canonical correspondence analysis to confirm that en route synoptic weather types were quantitatively different (Table A2; see Tables S1 and S2 in Supplementary Materials) among the combination of the following four discrete weather characteristics measured over the entire GOM at 6:00 UTC, concurrent with the time when synoptic weather type was assigned: (1) mean zonal (blowing east or west) and (2) meridional (blowing north or south) wind speed (m s−1) at 925 hPa (~760 m altitude, which is the pressure level nearest the mean flight height during migration [5,60,61]); (3) mean air pressure at the surface (Pa); and (4) accumulated total precipitation (kg m−2) over the GOM (Figure 3). The zonal wind component estimates wind speed in the east–west direction (positive if blowing towards the east and negative if blowing towards the west), and the meridional wind component estimates wind speed in the north–south direction (positive if blowing towards the north and negative if blowing towards the south). We used weather data for this analysis from the North American Regional Reanalysis pressure level and monolevel datasets [56].
We considered synoptic weather types to be favorable or unfavorable for northward migration based on frontal activity and wind direction, such that unfavorable weather types were associated with either heavy precipitation or headwinds. We considered five synoptic weather types to be unfavorable: (1) Western Gulf Fronts, characterized by a cold front over the western GOM; (2) Central Gulf Fronts, characterized by a cold front in the central GOM; (3) Eastern Gulf Fronts, characterized by a cold front over the eastern GOM; (4) East Coast Lows, characterized by a low-pressure system east of the Mississippi River and a cold front that has entered the Atlantic Ocean; and (5) Midwest Continental Highs, characterized by a high-pressure system between the Mississippi River and Rocky Mountains. Precipitation accompanies the frontal systems of Western, Central, and Eastern Gulf Fronts and East Coast Lows. During East Coast Lows and Midwest Continental Highs, winds are blowing from the north, particularly within the western GOM coastal region. Three synoptic weather types were considered favorable for northward migration: (6) Eastern Continental Highs, characterized by a high-pressure system between the Mississippi River and the Atlantic Coast; (7) Bermuda Highs, characterized by a high-pressure system over the western Atlantic Ocean; and (8) Gulf Highs, characterized by high pressure centered over the GOM and usually associated with slow to nonexistent winds. The three favorable synoptic weather types can support northward migration within the western GOM coastal region, with winds blowing from the south.

2.3. Statistical Analyses
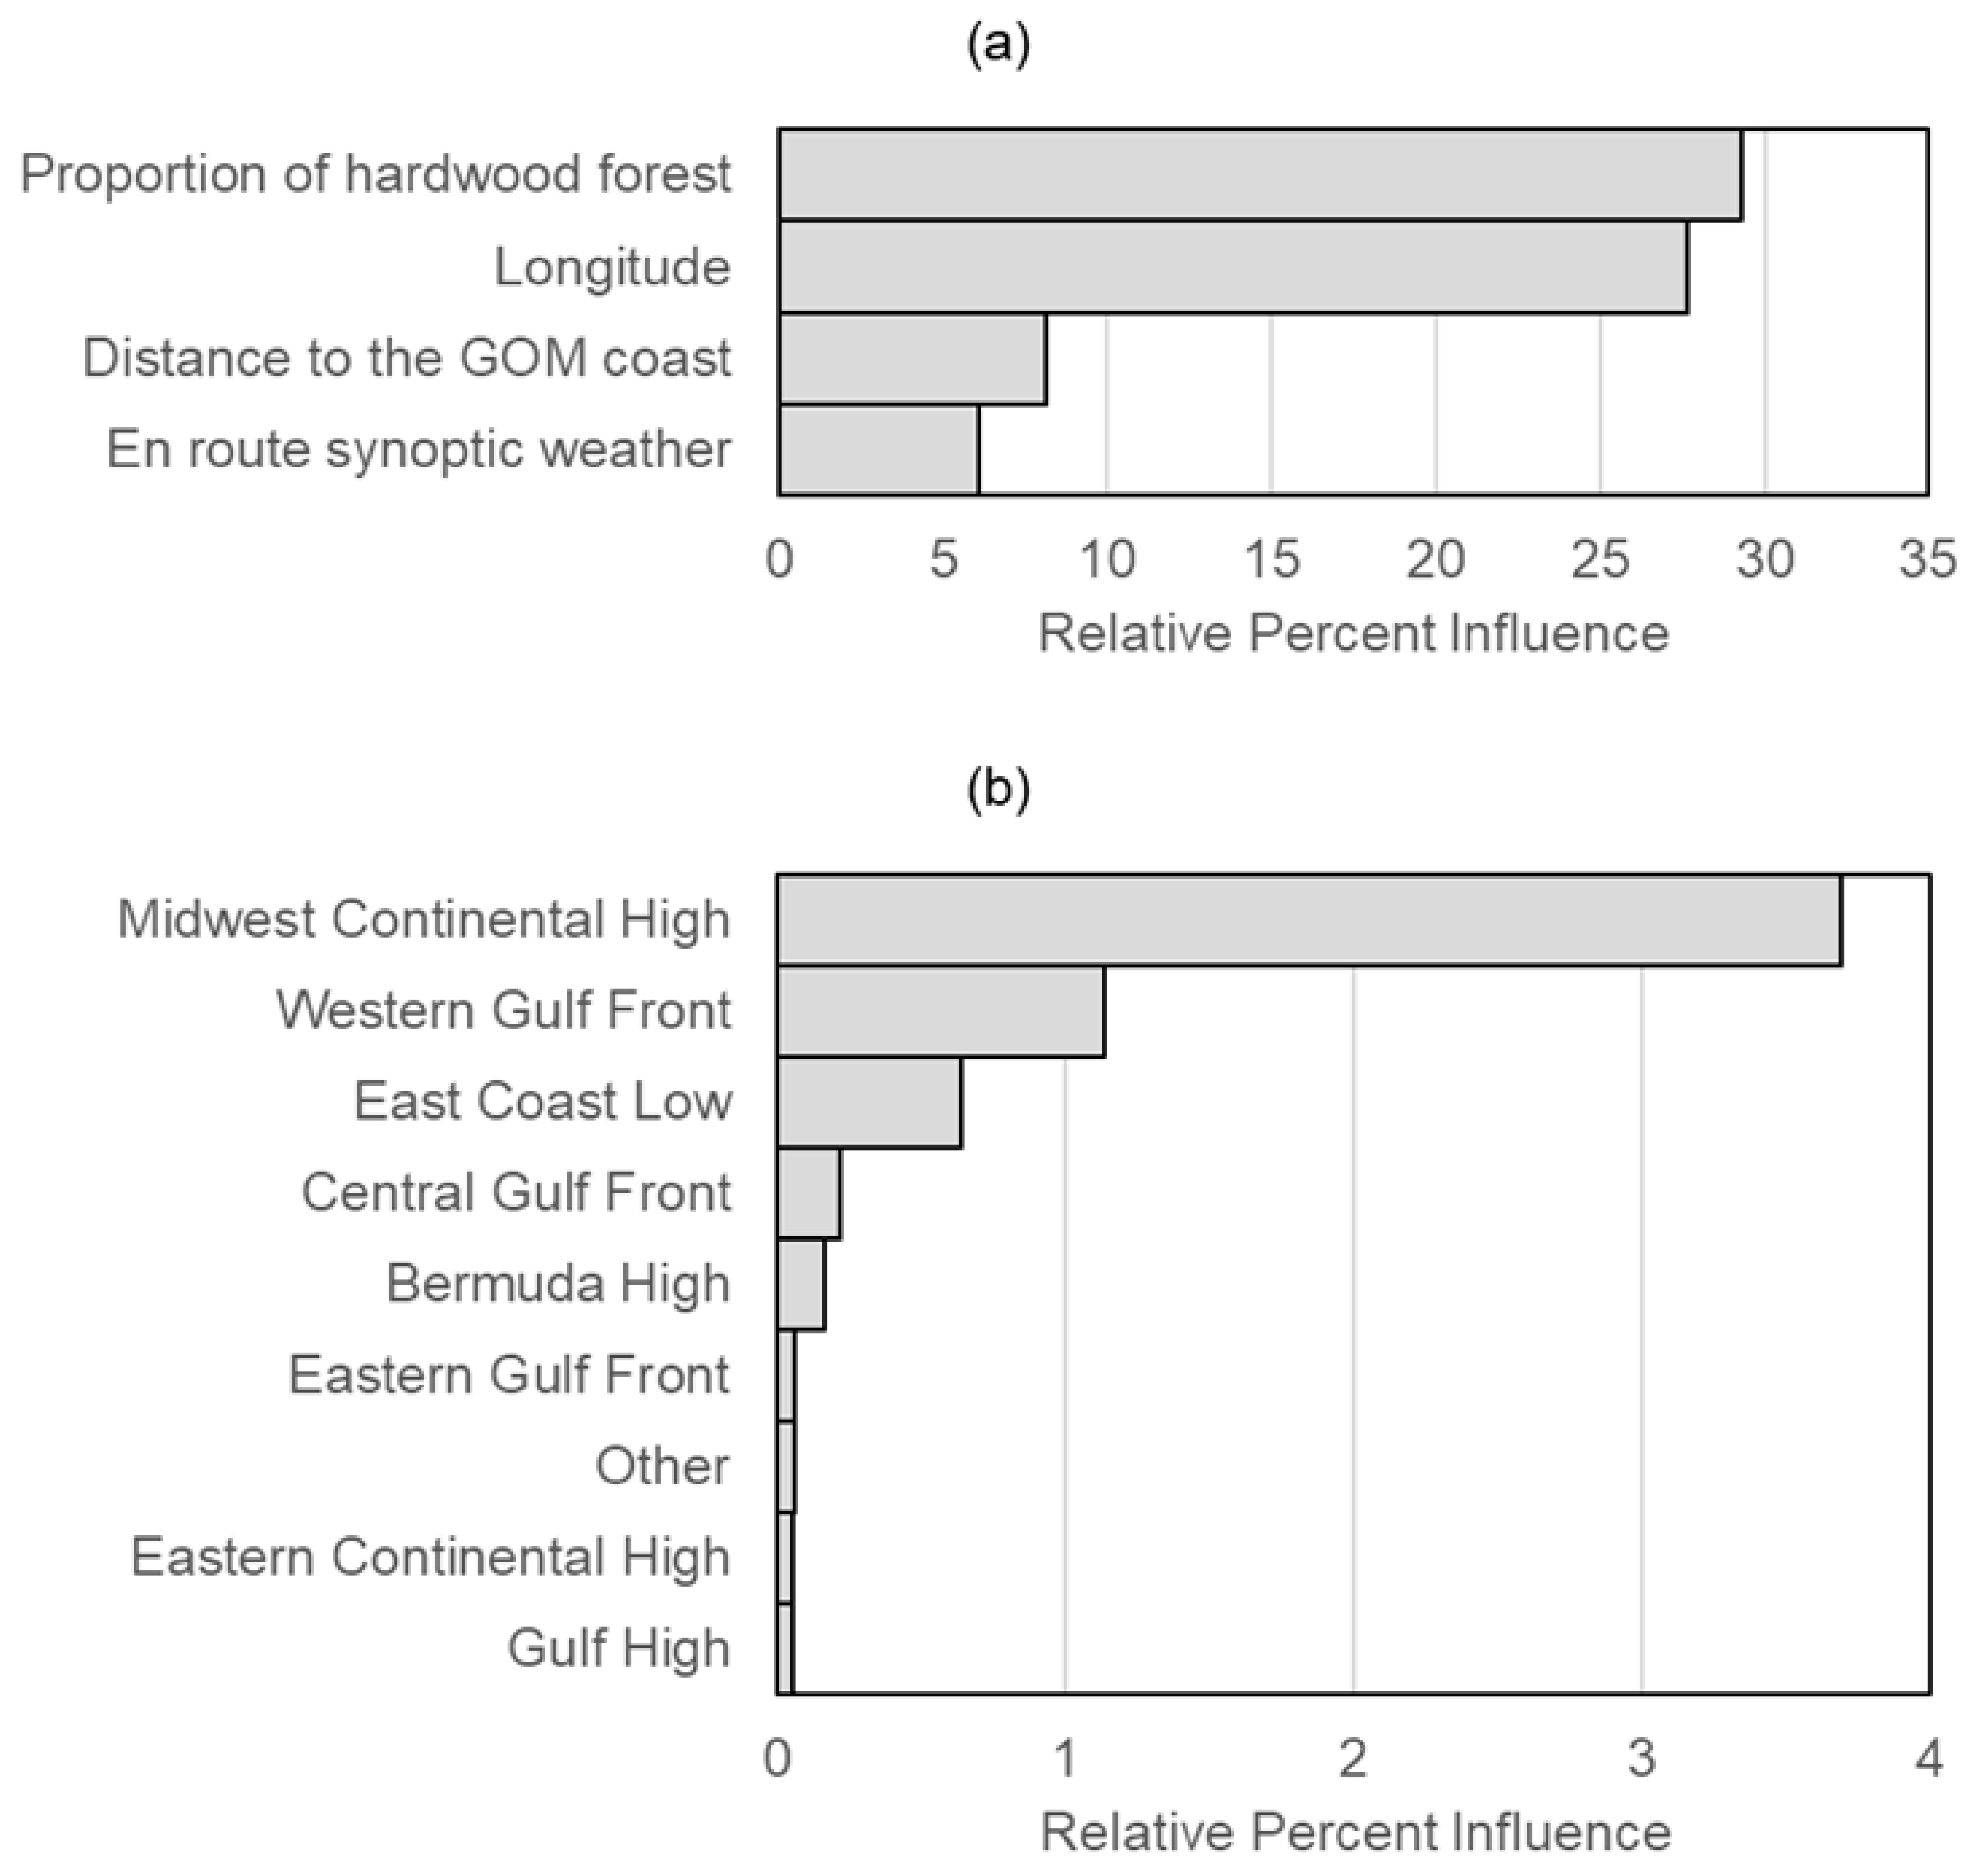
We fitted a single explanatory model with mean VIR as the response variable to: (1) quantify the cumulative influence of en route synoptic weather on broad-scale stopover distributions while controlling for the known influence of habitat abundance, longitude, and distance from the coast; and (2) determine which of the various en route synoptic weather types are most influential. We calculated the geometric mean of VIR values across sampling periods of migratory departure for each synoptic weather type and spatially aggregated them to a 1-km2 grid encompassing the area surrounding the 10 radars. Thus, the sample unit was the mean VIR within a grid cell, corresponding to a specific synoptic weather type.
To explain variation in stopover densities across the GOM coastal region, our model included a total of 14 predictor variables, with each of the nine synoptic weather types as a binary predictor, as well as five other geographic and landscape predictor variables. Previous work has found support for effects of longitude, distance from the GOM coast, and the proportion of hardwood forest within a 5-km radius on stopover density in this region [52,53]. Longitudinal variability of bird densities across the northern GOM coast is likely associated with broad flight paths of migrants when negotiating the GOM [43,45,62]. We measured longitude and distance from the GOM coastline (km) to the centroid of each grid cell. We calculated the proportion of land cover as hardwood forest (combined categories of Deciduous Forest, Mixed Forest, and Forested Wetland) within a 5-km moving window around each 30-m raster cell of the 2011 National Land Cover Database [63], which we then aggregated into the 1-km study area grid cells. We further included relative elevation (m; ground height above sea level minus the radar antenna height above sea level) and distance to the radar (m) to account for residual range bias in the radar data [55]. We considered incorporating a variable to represent synoptic weather on the night of departure from the GOM coastal region because atmospheric conditions can influence the decision to depart stopover habitat [64,65,66] and thus the proportion of birds leaving on a given night independent of the density of birds stopping over in an area per se. However, we found that departure weather was significantly correlated with en route synoptic weather, so we elected to retain only en route synoptic weather as a predictor variable. For the final model, all correlation coefficients (r) for the numeric predictor variables were <0.59, below the traditional threshold (0.7) indicating strong multicollinearity [67].
We used boosted regression trees (“dismo” package in R [68]) because they can provide easily-interpretable responses of complex nonlinear relationships and interactions among predictors [69]. The model had a tree complexity (i.e., the number of nodes in individual trees) of 2, learning rate of 0.70, bag fraction (i.e., the proportion of data used to train models) of 0.5, a minimum of 1,000 trees, and a Gaussian error distribution [69]. Tree complexity was kept low to aid in interpretation of the results, and the learning rate and minimum number of trees were determined to optimize prediction and decrease processing time. We identified the optimal number of trees at which the average holdout residual deviance among cross-validated datasets was minimized with the “gbm.step” function within the “dismo” package [70]. To reduce the influence of spatial autocorrelation, we used a single subset of grid cells that were separated by 5 km [49], resulting in a total subset of 30,414 observations. We used a correlogram to further confirm negligible spatial autocorrelation in model residuals (see Figure S2 in Supplementary Materials).
We were particularly interested in the interactions of the influence of en route synoptic weather with that of longitude and distance from the coast, as these interactions help indicate where changes in distributions relative to expected patterns occur along the GOM coastal region in response to synoptic weather. Therefore, we quantified the relative strength of all two-way interactions among predictors using the “gbm.interactions” function within the “dismo” package, which creates predictions on the linear scale for each predictor pair, fits a linear model that relates these predictions to the predictor pair, and then calculates the mean value of the residuals, the magnitude of which increases with the strength of any interaction effect.

3. Results

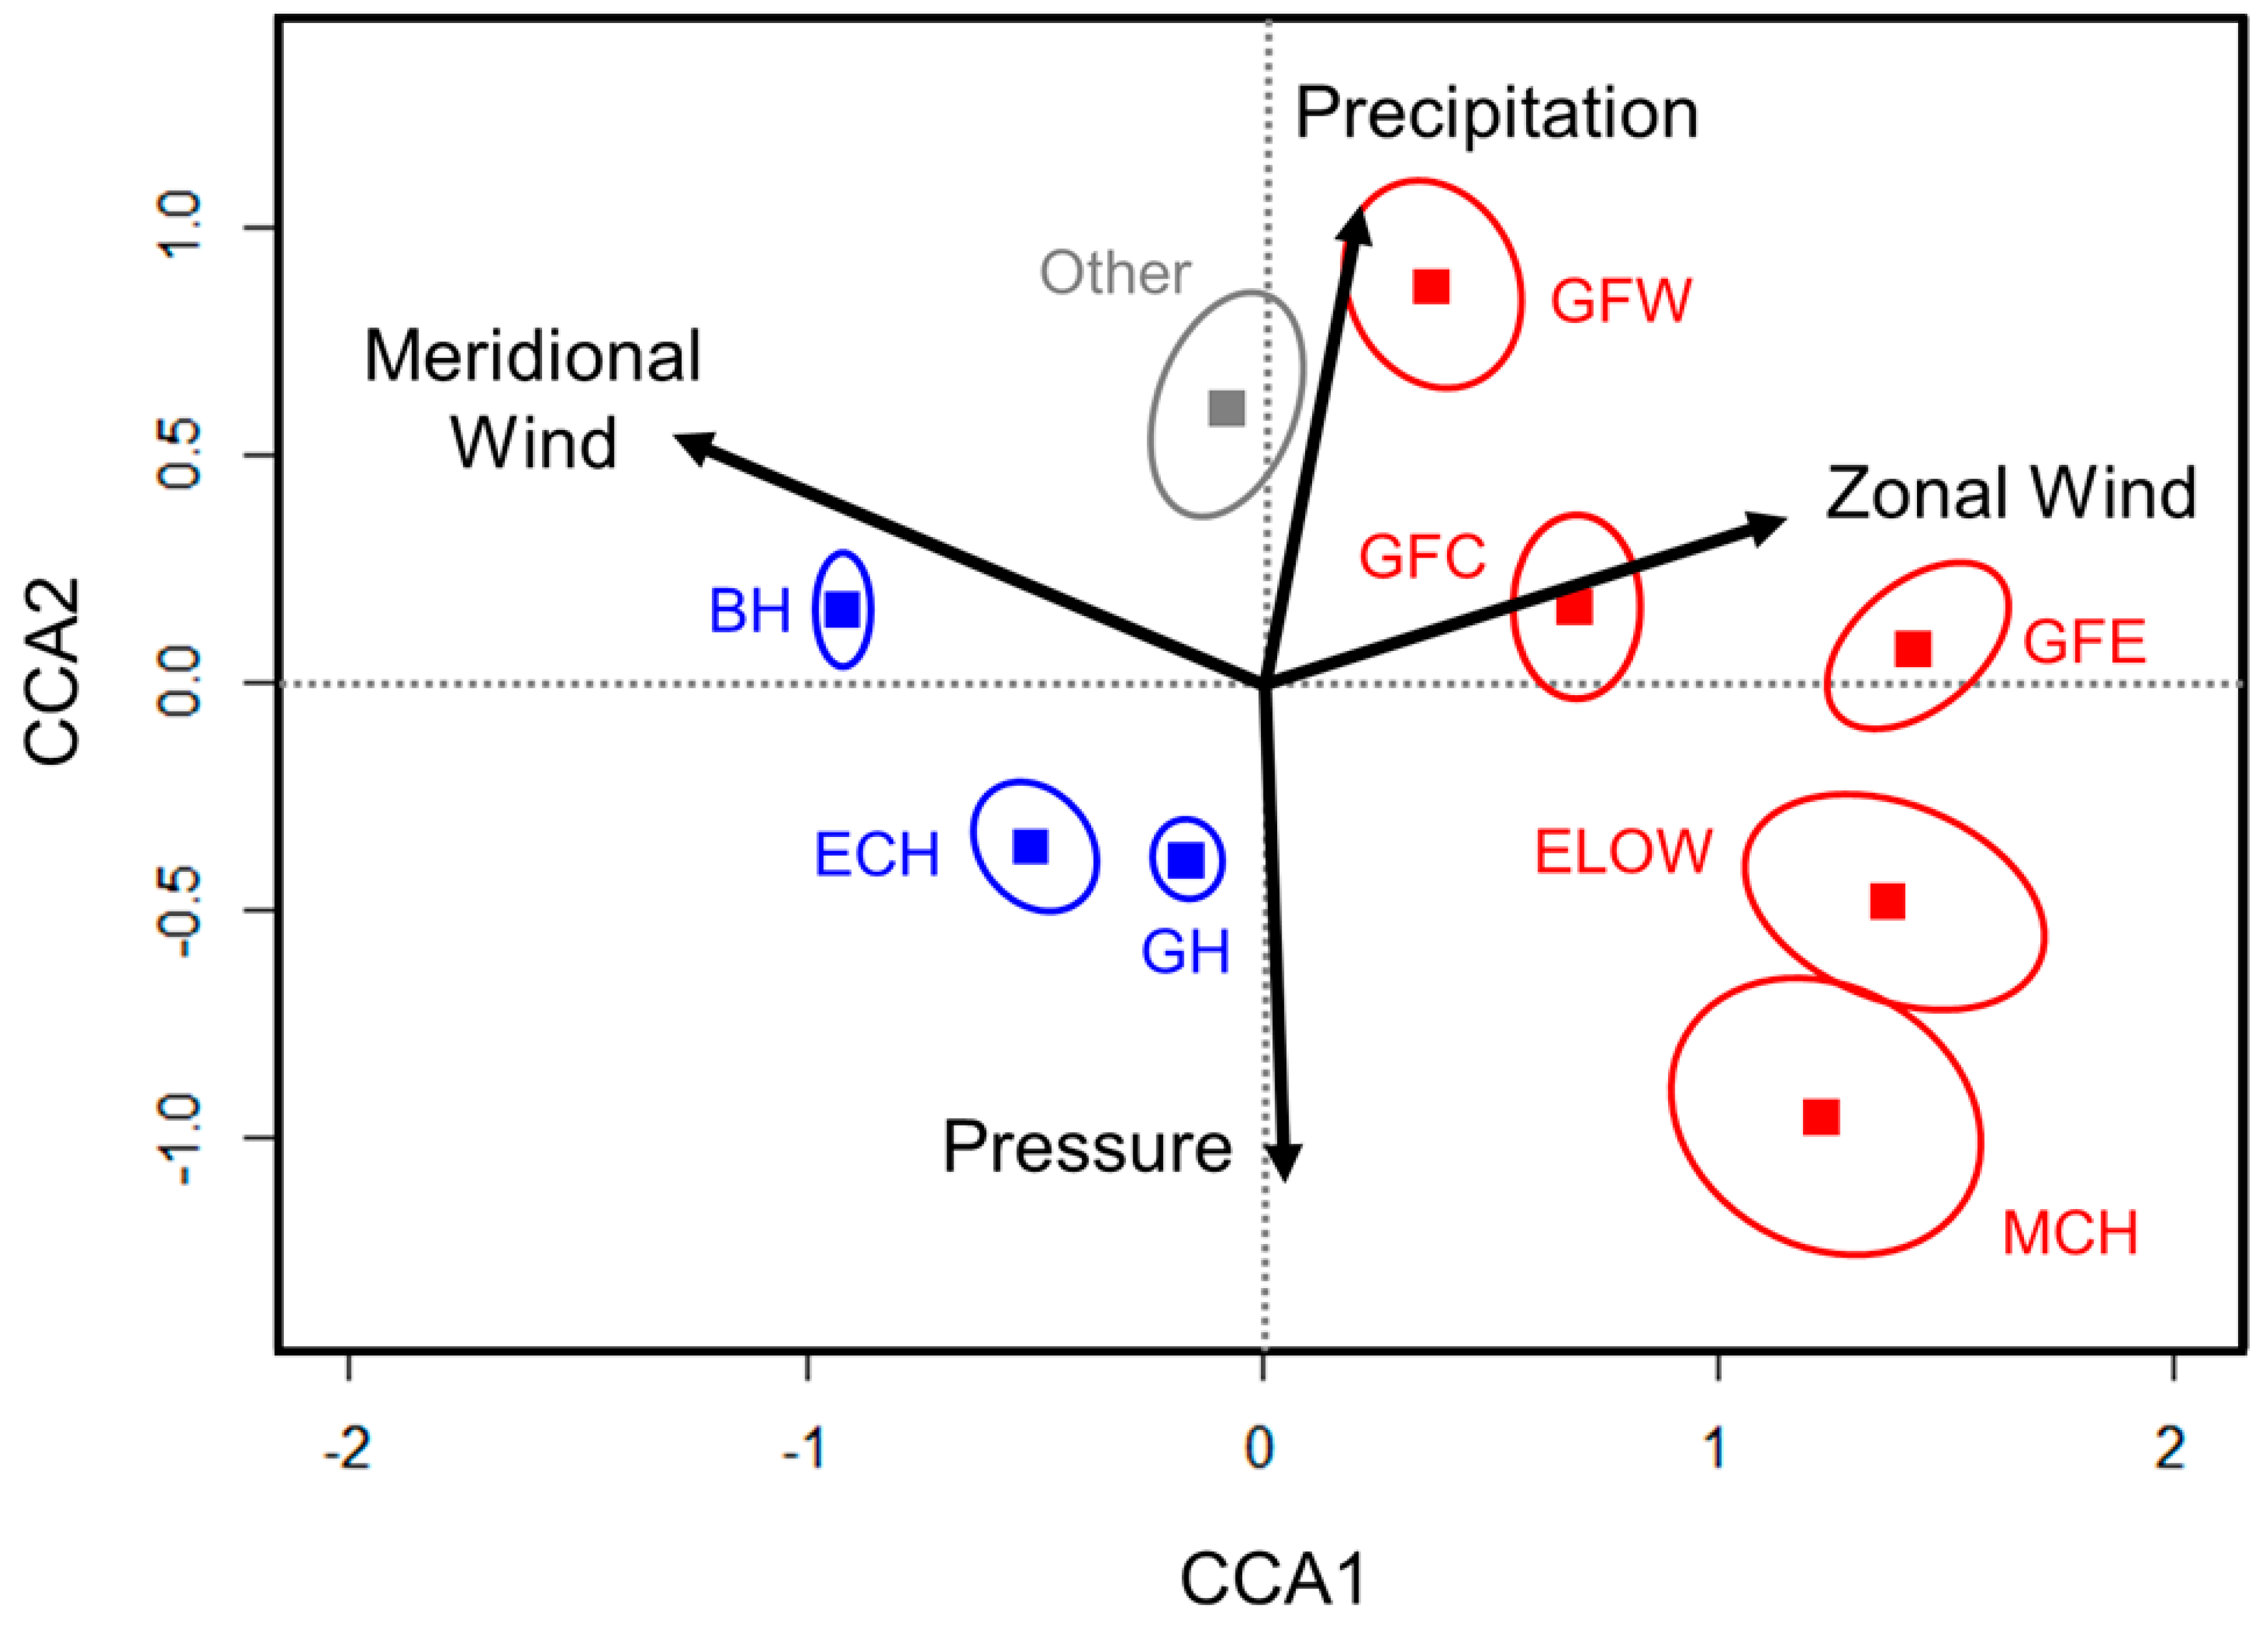
3.1. Frequency of Synoptic Weather Types

We sampled stopover departure from a total of 524 calendar days across spring migration (March 1–May 31) among the 8 years. Throughout the entire spring migration period (736 calendar days), favorable synoptic weather conditions over the GOM occurred 58% of the time, whereas 33% of the time, weather was unfavorable. Synoptic weather types varied significantly among measures of wind speed and direction, air pressure, and total precipitation (Table A2), with Bermuda High producing the strongest winds from the south and Midwest Continental High producing the strongest winds from the north. With the exception of East Coast Low and Midwest Continental High, all synoptic weather types occurred every year, but the frequency varied annually (Table A3). Of the three favorable synoptic weather types, Gulf and Bermuda Highs were most common (27% and 19% of all calendar days in the entire study period, respectively). Of the five unfavorable synoptic weather types, Central Gulf Front (12% of calendar days) was the most prevalent and produced a moderate amount of precipitation, while East Coast Low and Midwest Continental High were uncommon (4% and 2% of calendar days, respectively) and produced low-to-moderate amounts of precipitation.

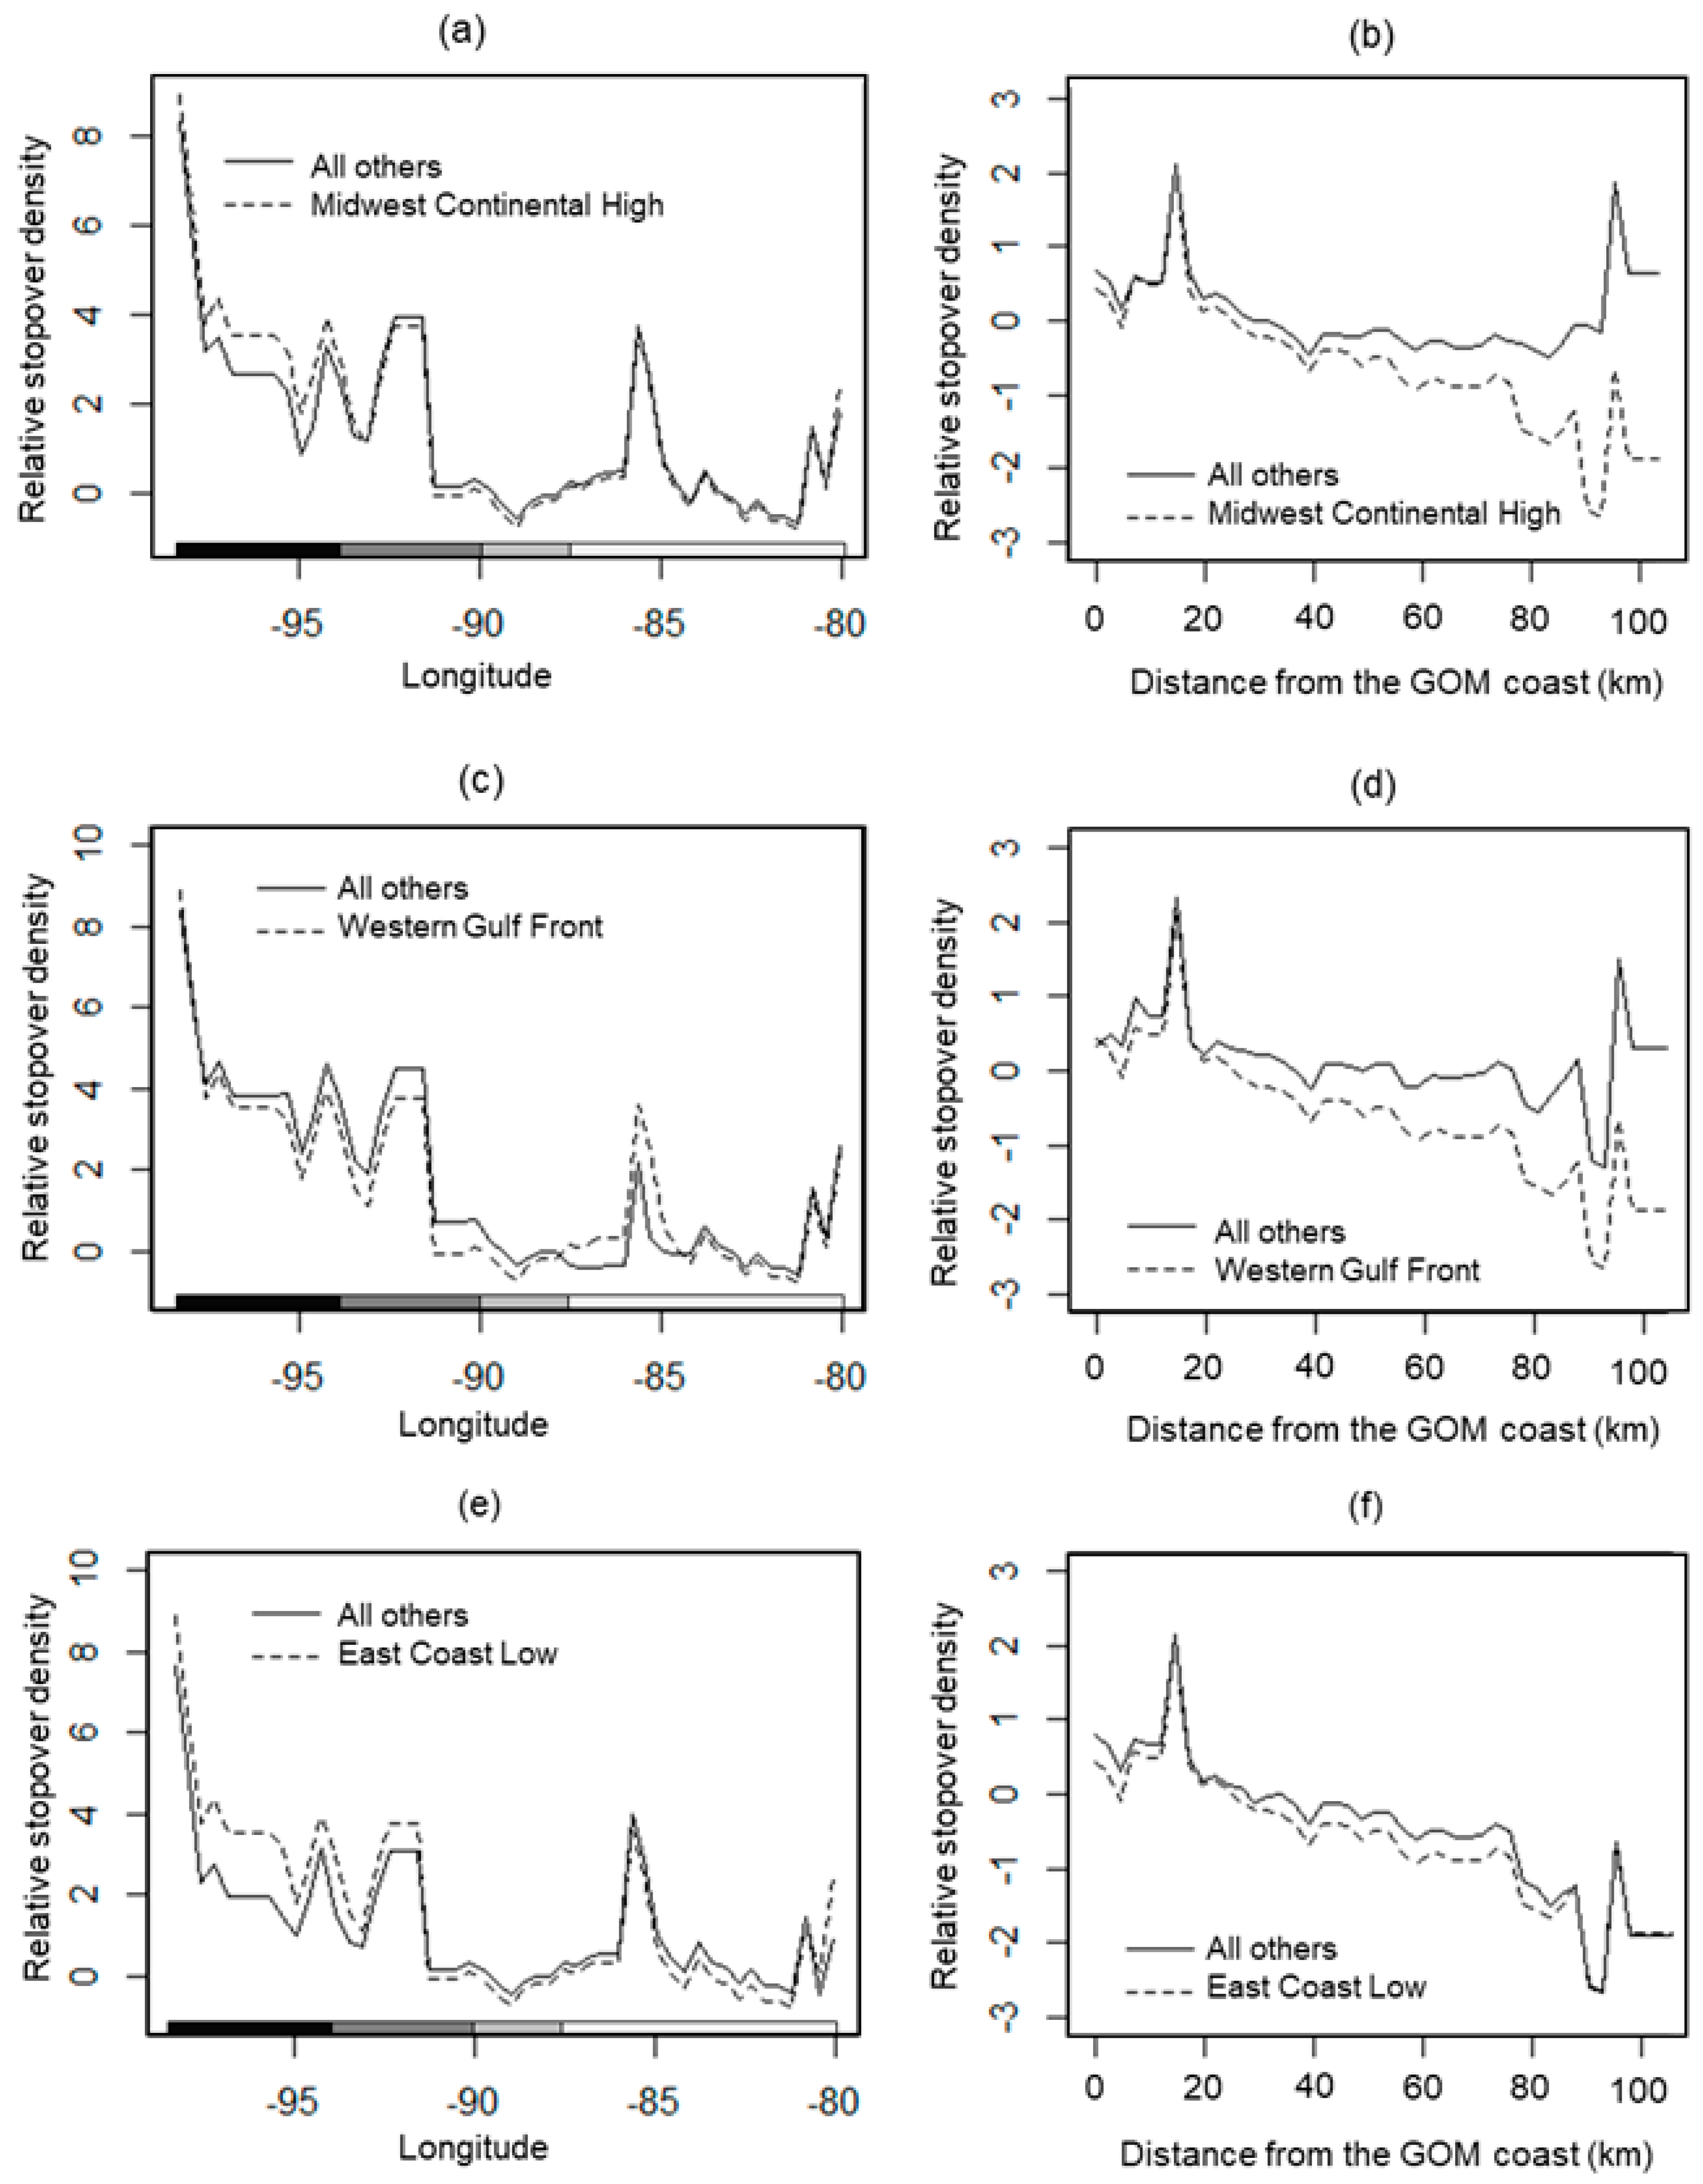
3.2. Influence of Synoptic Weather on Stopover Distributions

The model (63.2% deviance explained; see Table S3 and Figure S1 in Supplementary Materials) indicated that en route synoptic weather (i.e., encountered during migration over the GOM the previous night) influenced mean VIR (i.e., density of landbirds departing stopover sites) along the northern GOM coast to a small degree, with a cumulative relative influence of 6.0% (Figure 4a). En route synoptic weather was nearly as influential as distance from the GOM coast (8.1%) but less influential than the amount of hardwood forest in the landscape (29.3%) or longitude (27.7%).

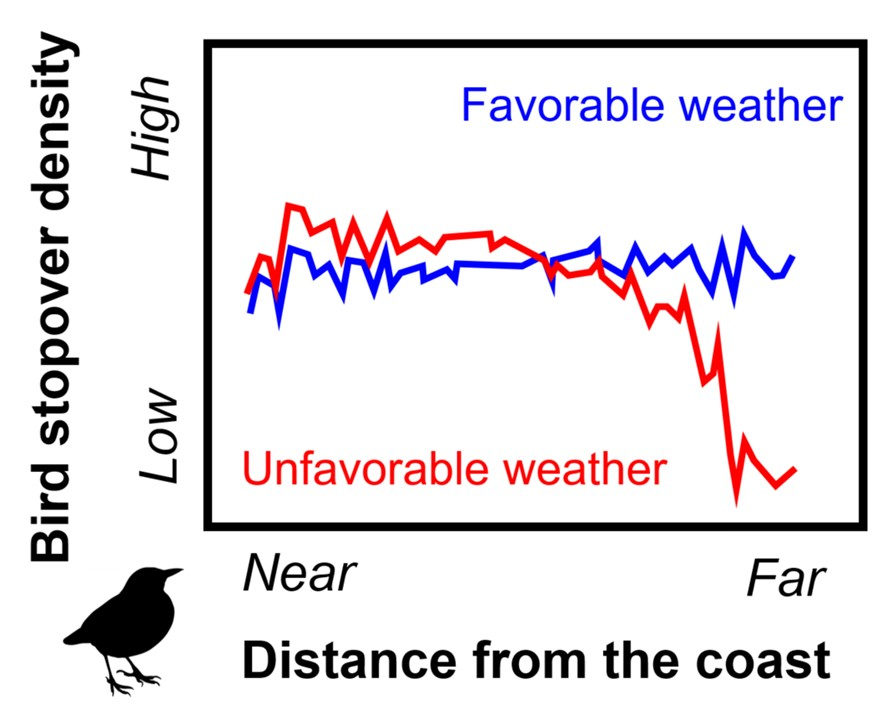
3.3. Influence of Favorable vs. Unfavorable Synoptic Weather Types on Stopover Distributions

Three en route synoptic weather types with unfavorable conditions (Midwest Continental High, Western Gulf Front, East Coast Low) had the strongest relative influence on mean VIR (Figure 4b), with 3–73 times more relative influence than the other synoptic weather types. Midwest Continental Highs and Western Gulf Fronts both interacted most strongly with distance from the coast, while East Coast Lows interacted most strongly with longitude (Table 1). Midwest Continental Highs produced higher mean VIR in the western GOM coastal region (i.e., Louisiana and Texas) (Figure 5a), as well as distinct coastal concentrations (Figure 5b) compared to the other synoptic weather types. Western Gulf Fronts produced lower mean VIR across most of the GOM coastal region, except for within the western Florida panhandle (Figure 5c), and distinct coastal concentrations (Figure 5d). Meanwhile, East Coast Lows produced higher mean VIR in the western GOM coastal region (Figure 5e), with little evidence for coastal concentrations (Figure 5f).

4. Discussion

The GOM is a prominent geographic feature in the western hemisphere that billions of birds in transit from tropical wintering grounds to the United States and Canada must navigate on an annual basis [45,46,71]. We provide new empirical evidence to link broad-scale weather encountered by migrating birds during flight over this large water body and their subsequent departure densities (i.e., mean VIR), which correspond to their terrestrial stopover distributions, at a regional scale. We show that en route weather broadly influences stopover distributions along the northern GOM coast in conjunction with other geographic, regional, and landscape-level factors. Specifically, unfavorable synoptic weather during the previous night leads to changes in longitudinal patterns throughout the entire GOM coastal region and greater coastal concentrations of migrants than following favorable weather. The influence of weather on bird stopover distributions along the northern GOM is modest in comparison to the influences of longitude and landscape-scale forest cover. These findings are consistent with evidence that winds aloft over the Gulf have a weak influence on the longitude of peak trans-Gulf arrival [72] and that forest cover is a strong predictor of bird stopover density [52,53]. Yet our results highlight the potential value of publicly available synoptic weather forecast maps for both biologists and non-biologists to make broad predictions about subsequent bird stopover patterns, such as the likelihood of above average migrant stopover volumes in particular regions. Additionally, the most common synoptic weather types provide supportive tailwinds and are favorable for birds moving northward during spring migration. Thus, migrating birds typically receive wind support facilitating migration across the GOM in spring, corroborating other wind studies [9,73].
The GOM has been considered a migratory barrier because migrants must fly 18–24 hours nonstop, longer than the typical duration of overland flights (<12 hours), to reach the opposite coast [21], or they take detours around it [41,74]. However, our results indicate that the degree of difficulty and risk of crossing the GOM in the spring may be weather-dependent, such that unfavorable weather can make trans-GOM flight costly in terms of energy and potential mortality, but favorable weather encourages northward flight. Overall, there may exist an atmospheric corridor over the GOM, supporting bird migration in spring. Similarly, oceans are also considered ecological barriers, but favorable wind conditions can facilitate the nonstop transoceanic flight of shorebirds [75,76], just as northward winds likely facilitate the nonstop crossing of landbirds over the GOM during spring migration.
Although unfavorable conditions occurred about half as frequently as favorable conditions, three of the five unfavorable synoptic weather types with headwinds or precipitation along cold fronts were particularly influential and resulted in relatively moderate changes in stopover distributions, despite comprising only 15% of all the calendar days we considered. Among the weather types, Midwest Continental High had the most influence on stopover density, and it was distinguished by the strongest mean wind speed blowing towards the south (i.e., headwind) and the highest mean air pressure. Similarly, East Coast Low, the third most influential weather type, was associated with the second strongest headwind and second highest air pressure. Both unfavorable synoptic weather types led to changes in longitudinal patterns throughout the entire GOM coastal region; they were particularly associated with higher bird densities within the western GOM coastal region (i.e., Texas), perhaps because migrants facing headwinds landed soon after encountering the coast. Headwinds, which are more energetically costly for flying, can negatively affect orientation [77], airspeed of migrants [78], and departure for migratory flight [20,79]. Therefore, birds may benefit by pausing flight when headwinds are encountered, resulting in a higher number of birds stopping over within the western GOM coastal region after contending with Midwest Continental Highs and East Coast Lows, which both feature headwinds over the western GOM. Meanwhile, Western Gulf Front, the second most influential weather type, involved cold fronts over the western GOM and was distinguished by the highest amount of total accumulated precipitation. Western Gulf Fronts were associated with lower bird densities in the western GOM coastal region, perhaps because migrants were diverted east by the cold front [62], but relatively high densities close to the coast. This corroborates observations of migrants “falling out” in high densities along the immediate coastline and on offshore oil and gas platforms with the passage of cold fronts and other weather conditions unfavorable for northward movement (e.g., heavy rains, strong head winds, or weak tailwinds) [4,40,48,54]. Because mass mortality of migrants can occur when flying through adverse weather conditions, particularly if landing is not possible [8], encountering unfavorable weather en route has implications for migratory success. Our results indicate that strong headwinds, high air pressure, and precipitation during flight over the GOM may be the most influential weather-related factors determining stopover distributions and perhaps migratory success. Ultimately, if birds passing over large water bodies such as the GOM during migration must frequently contend with unfavorable weather, their reduced migratory success would likely have negative consequences for future population dynamics and potentially pose a conservation challenge.
Much work has focused on how weather affects bird flight, but this study focuses on ecological barrier crossings and is the first to quantify the influence of broad-scale weather on the terrestrial stopover distributions of migrating birds after crossing a large water body. The influence of en route synoptic weather on stopover densities and distributions after barrier crossing may also apply to other regions in which landbirds must navigate ecological barriers. For example, favorable wind conditions allow birds migrating at night over the Sahara Desert to prolong their flight into the day, influencing stopover distributions [80]. At the same time, unlike birds migrating over water, birds navigating large deserts have the option to make landfall when encountering unfavorable weather, often displaying an intermittent strategy [81]. Thus, weather conditions aloft can modulate the strategies adopted by migrants to cross the Sahara Desert [82] and likely alter stopover patterns. Furthermore, synoptic weather potentially influences the broad-scale distributions of diurnal migrants, such as soaring raptors or aerial insectivores, and likely have even stronger effects on organisms with weaker flying abilities, such as migratory arthropods [83]. For instance, synoptic weather conditions such as the passage of depressions or frontal systems are associated with long-range movements or migrations of potato leafhoppers (Empoasca fabae) in the United States [84,85], planthoppers (Sogatella furcifera and Nilaparvata lugens) in Japan [86], and moths in Australia [87]. In particular, winds ahead of or behind cold fronts can transport flying insects hundreds of kilometers from their source regions [83].
Quantifying the influence of synoptic weather on stopover informs our macro-ecological understanding of species distribution patterns and deserves more attention. We suspect that synoptic weather may influence migrating birds to an even greater extent than we observed. Because we restricted our analyses to en route synoptic weather that occurred solely the night before migratory departure, it is likely that the relative influence of synoptic weather would increase if we considered the weather occurring during multiple nights before migratory departure (e.g., two nights prior, three nights prior), as migrants may stop over for varying lengths of time [88]. Our approach adopted a more straightforward process of elucidating the influence of en route synoptic weather, but future research could address that question by examining the relative influence of the different nights during which synoptic weather occurred on stopover densities. In addition, our results could be applied in the future to continental bird migration forecasting [24] and investigations into the effects of artificial light during migration [55,89,90,91]. Ultimately, synoptic weather types are themselves models of more continuous components of the environment and due to the lack of fine-scale weather data presently available, we could not quantify the relative contributions of the components of the synoptic weather in our analyses. Future studies tracking individual migrating birds over the GOM while concurrently measuring environmental conditions at finer spatial scales will provide an important opportunity to refine our results about the influence of weather on stopover. With current projections of changes in climate and habitat availability, particularly along the northern coast of the GOM [51,92], considering our research results in conjunction with previous and future studies will be critically important for understanding how shifting weather dynamics affect the movements and potential migratory success of billions of birds through the region.

5. Conclusions

In this study, we empirically link broad-scale weather encountered by migrating birds during flight over the Gulf of Mexico with subsequent terrestrial distributions along the coast. Synoptic weather patterns tend to be underappreciated or at least under-utilized outside of meteorology, but in situations where data needed to directly associate local and discrete weather variables with individual bird migration routes are unavailable, they are well-suited to address the influence of weather on broad-scale migration. Both biologists and interested members of the public can access freely available synoptic weather maps and make broad-scale predictions about landbird stopover distributions along the Gulf of Mexico coast based on the relationships with distance from the coast and longitude we uncovered in this study. We found en route weather conditions while crossing the Gulf of Mexico during spring migration were most often favorable for migrating birds, with winds assisting northward flight, and that fewer birds stopped after encountering these favorable conditions. However, unfavorable weather that comprised strong headwinds or precipitation led to variable shifts in longitudinal distributions and higher coastal concentrations of migrants. Ultimately, this study advances our macro-ecological understanding of bird migration inclusive of stopover ecology by identifying broad-scale weather as one of the fundamental drivers of when and where migrating birds land after long flights over inhospitable terrain. Furthermore, our results have broad applications to other regions and migratory taxa and could be used to inform models projecting Nearctic-Neotropical bird responses to changing weather patterns associated with climate change.

Supplementary Materials

The following are available online at https://0-www-mdpi-com.brum.beds.ac.uk/2072-4292/12/3/565/s1. Tables S1 and S2 contain results from a canonical correspondence analysis quantifying how the mean measurements of zonal and meridional wind speeds, surface air pressure, and precipitation differ among the nine synoptic weather types. Table S3 reflects the relative influence of predictor variables on bird stopover density from the boosted regression tree models. Figure S1 shows the partial dependence plots for geographic, landscape, and corrective predictor variables produced by the boosted regression tree models. Figure S2 is a correlogram used to test for spatial autocorrelation in the boosted regression tree model residuals.

Author Contributions

J.J.B., H.L.C., E.B.C., and A.F. conceived the study; J.J.B., H.L.C., and E.B.C. designed methodology; H.L.C. and J.A.S. compiled and processed data; H.L.C. analyzed the data and led writing of the manuscript; K.G.H. assisted with visualization; all authors contributed to review and editing of the drafts. All authors have read and agreed to the published version of the manuscript.

Funding

This research was supported by funding of the Southern Company through their partnership with the National Fish and Wildlife Foundation. We received additional support from Leon Levy Foundation, NSF DBI-1661329, ICER-1927743, and IIS-1633206.

Acknowledgments

We thank W. Barrow, L. Randall, and T.J. Zenzal for access to screened radar data, and we thank A. Adams, K. Bird, M. Burgess, A. Dougherty, L. Donahue, D. Green, B. Kaselow, N. Kimani, J. Lafleur, C. Lambert, S. Locker, R. Lyon, and E. Moorman for their assistance with screening radar data. An earlier version of this manuscript was improved with comments from D. Narango.

Conflicts of Interest

The authors declare no conflict of interest. Furthermore, the funders had no role in the design of the study; in the collection, analyses, or interpretation of data; in the writing of the manuscript, or in the decision to publish the results.

Appendix A. Synoptic Weather Types

Appendix A provides more information about the synoptic weather types used in this study. Table A1 contains the synoptic weather type definitions from Russell (2005). Table A2 summarizes the differences among the synoptic weather types with mean measurements of zonal and meridional wind speeds, surface air pressure, and precipitation. Table A3 displays the annual variability in frequency of occurrence for each synoptic weather type.
Table A1. Detailed descriptions of each synoptic weather type from Russell (2005).
Synoptic Weather TypeDescription
Bermuda HighThis type is a subdivision of Muller’s [33] “Coastal Return” type (with the remainder of the “Coastal Return” type falling under Eastern Continental High). It is very similar to the Eastern Continental High type, but the high-pressure system is centered over the Atlantic Ocean. A ridge of tropical air extends westward from the Atlantic over the southeastern states, and surface winds in the northern Gulf of Mexico may be from the southeast or south.
East Continental HighThis type devised by Yocke et al. [36] subsumes Muller’s [33] “Coastal Return” type as well as some situations that would be classified under Muller’s [33] “Continental High” type. On Eastern Continental High days, winds over the northern Gulf of Mexico are dominated by anticyclonic flow around a high-pressure system located east of the Mississippi River and west of the eastern seaboard, somewhere between the Gulf Coast and southern Canada. Surface winds may be from the east or southeast (eastern areas) or from the south (western areas).
East Coast LowThis new type described by Yocke et al. [36] is similar to Gulf Front except that the low-pressure system has moved east of the Mississippi River and the front has correspondingly swept over the Gulf of Mexico, through Florida, and into the Atlantic. Winds over the Yucatan on East Coast Low days will generally be unfavorable for the initiation of spring trans-Gulf migration.
Gulf FrontThis type subsumed Yocke et al.’s [36] “Gulf Front or Trough N/S” and “Gulf Front or Trough E/W” types, which correspond respectively to Muller’s [33] “Pacific High” and “Frontal Overrunning” types. On days characterized by this type, cyclonic circulation around a deep surface low over the Mississippi Valley brings mild and dry air following the cold front across the northern Gulf of Mexico. An east-west or northeast-southwest oriented front or trough is located in the northern Gulf of Mexico region within about 100 km of the coastline. Winds in the northern Gulf of Mexico are variable, but generally have a northerly component on the northern or western side of the front and a southerly component on the southern or eastern side. Frequently waves develop along the front over the western Gulf of Mexico, and then sweep northeastward bringing heavy clouds and precipitation to the Gulf Coast.
Gulf HighThis type corresponds to Muller’s [33] type of the same name. On Gulf High days, high pressure is centered over the Gulf of Mexico or over the immediate Gulf Coast and usually associated with a weak pressure gradient and weak or nonexistent winds.
Midwest Continental HighThis type corresponds to Muller’s [33] “Continental High” type. On Midwest Continental High days, winds over the northern Gulf of Mexico are dominated by anticyclonic flow around a high-pressure system centered west of the Mississippi River, over or east of the Rocky Mountains, and north of the Texas/Mexico border. Surface winds are from the northeast, and the region is dominated by fair weather associated with the core of the anticyclone.
Table A2. Mean (and standard error) measurements of zonal wind (blowing east or west) and meridional wind (blowing north or south) speed (m/s) at 925 mb, air pressure (Pa) at surface, and accumulated total precipitation (kg/m2) at surface from North American Regional Reanalysis points over the Gulf of Mexico associated with each synoptic weather type. The zonal wind component estimates wind speed in the east–west direction (positive if blowing towards the east and negative if blowing towards the west), and the meridional wind component estimates wind speed in the north–south direction (positive if blowing towards the north and negative if blowing towards the south). All measurements were taken at 6:00 UTC the night prior to migrants departing stopover sites. The first five synoptic weather types were considered unfavorable (Western Gulf Front, Central Gulf Front, Eastern Gulf Front, East Coast Low, and Midwest Continental High) and the following three favorable (Eastern Continental High, Bermuda High, and Gulf High). The last synoptic weather type consisted of a subset of instances that did not fit into one of the eight prior categories.
Synoptic Weather TypeZonal WindMeridional WindPressurePrecipitation
Western Gulf Front−2.28
(0.35)
2.77
(0.66)
100872.6
(52.0)
0.44
(0.05)
Central Gulf Front−2.29
(0.33)
0.34
(0.44)
101055.9
(46.3)
0.31
(0.05)
Eastern Gulf Front0.08
(0.54)
−2.08
(0.48)
101003.3
(44.5)
0.23
(0.05)
East Coast Low0.20
(0.81)
−2.47
(1.09)
101152.2
(98.2)
0.07
(0.02)
Midwest Continental High−1.58
(0.85)
−3.84
(1.16)
101473.3
(99.3)
0.18
(0.05)
Eastern Continental High−6.00
(0.29)
4.04
(0.47)
101134.8
(41.2)
0.13
(0.03)
Bermuda High−5.59
(0.23)
6.93
(0.24)
101021.7
(30.7)
0.19
(0.03)
Gulf High−4.09
(0.18)
3.24
(0.25)
101149.0
(26.7)
0.08
(0.01)
Other−2.96
(0.48)
4.72
(0.47)
100844.5
(48.2)
0.26
(0.06)
Table A3. Annual and total frequency (and proportion of the total) of the unfavorable (in italics; Western Gulf Front, Central Gulf Front, Eastern Gulf Front, East Coast Low, Midwest Continental High) and favorable (East Continental High, Bermuda High, Gulf High) synoptic weather types corresponding to all sampled calendar days (N = 524) throughout our study period (March to May 2008–2015). The synoptic weather types are listed in descending order of total frequency.
Synoptic Weather TypeYear
20082009201020112012201320142015Total
Gulf High611172526202214141
(0.08)(0.22)(0.31)(0.37)(0.46)(0.26)(0.27)(0.22)(0.27)
Bermuda High1391186171918101
(0.18)(0.18)(0.20)(0.12)(0.11)(0.22)(0.23)(0.28)(0.19)
Central Gulf Front743861191563
(0.10)(0.08)(0.05)(0.12)(0.11)(0.14)(0.11)(0.23)(0.12)
Eastern Continental High171269563361
(0.23)(0.24)(0.11)(0.13)(0.09)(0.08)(0.04)(0.05)(0.12)
Other17443336848
(0.23)(0.08)(0.07)(0.04)(0.05)(0.04)(0.07)(0.12)(0.09)
Western Gulf Front6346588545
(0.08)(0.06)(0.07)(0.09)(0.09)(0.10)(0.10)(0.08)(0.09)
Eastern Gulf Front3334468233
(0.04)(0.06)(0.05)(0.06)(0.07)(0.08)(0.10)(0.03)(0.06)
East Coast Low1345114019
(0.01)(0.06)(0.07)(0.07)(0.02)(0.01)(0.05)(0.00)(0.04)
Midwest Continental High3030052013
(0.04)(0.00)(0.05)(0.00)(0.00)(0.06)(0.02)(0.00)(0.02)
Yearly Total7349556856778165524

References

  1. Lack, D. The influence of weather on passerine migration: A review. Auk 1960, 77, 171–209. [Google Scholar] [CrossRef]
  2. Smith, F. The correlation between the migratory flights of birds and certain accompanying meteorological conditions. Wilson Bull. 1917, 29, 32–35. [Google Scholar]
  3. Gunn, W.W.H.; Crocker, A.M. Analysis of unusual bird migration in North America during the storm of April 4-7, 1947. Auk 1951, 68, 139–163. [Google Scholar] [CrossRef]
  4. Richardson, W.J. Timing and amount of bird migration in relation to weather: A review. Oikos 1978, 30, 224. [Google Scholar] [CrossRef]
  5. La Sorte, F.A.; Hochachka, W.M.; Farnsworth, A.; Sheldon, D.; Fink, D.; Geevarghese, J.; Winner, K.; Van Doren, B.M.; Kelling, S. Migration timing and its determinants for nocturnal migratory birds during autumn migration. J. Anim. Ecol. 2015, 84, 1202–1212. [Google Scholar] [CrossRef] [Green Version]
  6. Sjöberg, S.; Alerstam, T.; Åkesson, S.; Schulz, A.; Weidauer, A.; Coppack, T.; Muheim, R. Weather and fuel reserves determine departure and flight decisions in passerines migrating across the Baltic Sea. Anim. Behav. 2015, 104, 59–68. [Google Scholar] [CrossRef]
  7. Bolus, R.T.; Diehl, R.H.; Moore, F.R.; Deppe, J.L.; Ward, M.P.; Smolinsky, J.; Zenzal, T.J. Swainson’s Thrushes do not show strong wind selectivity prior to crossing the Gulf of Mexico. Sci. Rep. 2017, 7, 14280. [Google Scholar] [CrossRef] [Green Version]
  8. Newton, I. Weather-related mass-mortality events in migrants. Ibis 2007, 149, 453–467. [Google Scholar] [CrossRef]
  9. Able, K.P. The role of weather variables and flight direction in determining the magnitude of nocturnal bird migration. Ecology 1973, 54, 1031–1041. [Google Scholar] [CrossRef]
  10. Erni, B.; Liechti, F.; Underhill, L.G.; Bruderer, B. Wind and rain govern the intensity of nocturnal bird migration in central Europe—A log-linear regression analysis. Ardea 2002, 90, 155–166. [Google Scholar]
  11. Ma, Z.; Hua, N.; Zhang, X.; Guo, H.; Zhao, B.; Ma, Q.; Xue, W.; Tang, C. Wind conditions affect stopover decisions and fuel stores of shorebirds migrating through the south Yellow Sea. Ibis 2011, 153, 755–767. [Google Scholar] [CrossRef]
  12. Nisbet, I.C.T.; Drury, W.H. Short-term effects of weather on bird migration: A field study using multivariate statistics. Anim. Behav. 1968, 16, 496–530. [Google Scholar] [CrossRef]
  13. Wainwright, C.E.; Stepanian, P.M.; Horton, K.G. The role of the US Great Plains low-level jet in nocturnal migrant behavior. Int. J. Biometeorol. 2016, 60, 1531–1542. [Google Scholar] [CrossRef] [PubMed]
  14. Bloch, R.; Bruderer, B. The air speed of migrating birds and its relationship to the wind. Behav. Ecol. Sociobiol. 1982, 11, 19–24. [Google Scholar] [CrossRef]
  15. Shamoun-Baranes, J.; Baharad, A.; Alpert, P.; Berthold, P.; Yom-Tov, Y.; Dvir, Y.; Leshem, Y. The effect of wind, season and latitude on the migration speed of white storks Ciconia ciconia, along the eastern migration route. J. Avian Biol. 2003, 34, 97–104. [Google Scholar] [CrossRef]
  16. Vansteelant, W.M.G.; Bouten, W.; Klaassen, R.H.G.; Koks, B.J.; Schlaich, A.E.; van Diermen, J.; van Loon, E.E.; Shamoun-Baranes, J. Regional and seasonal flight speeds of soaring migrants and the role of weather conditions at hourly and daily scales. J. Avian Biol. 2015, 46, 25–39. [Google Scholar] [CrossRef]
  17. Alerstam, T. Wind as selective agent in bird migration. Ornis Scand. 1979, 10, 76. [Google Scholar] [CrossRef]
  18. Horton, K.G.; Van Doren, B.M.; Stepanian, P.M.; Hochachka, W.M.; Farnsworth, A.; Kelly, J.F. Nocturnally migrating songbirds drift when they can and compensate when they must. Sci. Rep. 2016, 6, 21249. [Google Scholar] [CrossRef] [Green Version]
  19. Van Doren, B.M.; Horton, K.G.; Stepanian, P.M.; Mizrahi, D.S.; Farnsworth, A. Wind drift explains the reoriented morning flights of songbirds. Behav. Ecol. 2016, 27, 1122–1131. [Google Scholar] [CrossRef] [Green Version]
  20. Åkesson, S.; Hedenström, A. Wind selectivity of migratory flight departures in birds. Behav. Ecol. Sociobiol. 2000, 47, 140–144. [Google Scholar] [CrossRef]
  21. Deppe, J.L.; Ward, M.P.; Bolus, R.T.; Diehl, R.H.; Celis-Murillo, A.; Zenzal, T.J.; Moore, F.R.; Benson, T.J.; Smolinsky, J.A.; Schofield, L.N.; et al. Fat, weather, and date affect migratory songbirds’ departure decisions, routes, and time it takes to cross the Gulf of Mexico. Proc. Natl. Acad. Sci. USA 2015, 112, E6331–E6338. [Google Scholar] [CrossRef] [PubMed] [Green Version]
  22. Morganti, M.; Mellone, U.; Bogliani, G.; Saino, N.; Ferri, A.; Spina, F.; Rubolini, D. Flexible tuning of departure decisions in response to weather in black redstarts Phoenicurus ochruros migrating across the Mediterranean Sea. J. Avian Biol. 2011, 42, 323–334. [Google Scholar] [CrossRef]
  23. Schaub, M.; Liechti, F.; Jenni, L. Departure of migrating European robins, Erithacus rubecula, from a stopover site in relation to wind and rain. Anim. Behav. 2004, 67, 229–237. [Google Scholar] [CrossRef]
  24. Van Doren, B.M.; Horton, K.G. A continental system for forecasting bird migration. Science 2018, 361, 1115–1118. [Google Scholar] [CrossRef]
  25. Moore, F.; Kerlinger, P. Stopover and fat deposition by North American wood-warblers (Parulinae) following spring migration over the Gulf of Mexico. Oecologia 1987, 74, 47–54. [Google Scholar] [CrossRef]
  26. Moore, F.R.; Kerlinger, P.; Simons, T. Stopover on a Gulf Coast barrier island by spring trans-Gulf migrants. Wilson Bull. 1990, 102, 487–500. [Google Scholar]
  27. Pielke, R.A.; Garstang, M.; Lindsey, C.; Gusdorf, J. Use of a synoptic classification scheme to define seasons. Theor. Appl. Climatol. 1987, 38, 57–68. [Google Scholar] [CrossRef]
  28. Sheridan, S.C. The redevelopment of a weather-type classification scheme for North America. Int. J. Climatol. 2002, 22, 51–68. [Google Scholar] [CrossRef]
  29. Diem, J.E. Influences of the Bermuda High and atmospheric moistening on changes in summer rainfall in the Atlanta, Georgia region, USA. Int. J. Climatol. 2013, 33, 160–172. [Google Scholar] [CrossRef]
  30. Hardin, A.W.; Liu, Y.; Cao, G.; Vanos, J.K. Urban heat island intensity and spatial variability by synoptic weather type in the northeast U.S. Urban Clim. 2018, 24, 747–762. [Google Scholar] [CrossRef]
  31. Lewis, A.B.; Keim, B.D. A hybrid procedure for classifying synoptic weather types for Louisiana, USA. Int. J. Climatol. 2015, 35, 4247–4261. [Google Scholar] [CrossRef]
  32. Muller, R.A.; Wax, C.L. A comparative synoptic climatic baseline for coastal Louisiana. Geosci. Man 1977, 18, 121–129. [Google Scholar]
  33. Muller, R.A. A synoptic climatology for environmental baseline analysis: New Orleans. J. Appl. Meteorol. 1977, 16, 20–33. [Google Scholar] [CrossRef] [Green Version]
  34. Shen, L.; Mickley, L.J.; Tai, A.P.K. Influence of synoptic patterns on surface ozone variability over the eastern United States from 1980 to 2012. Atmos. Chem. Phys. 2015, 15, 10925–10938. [Google Scholar] [CrossRef] [Green Version]
  35. Sheridan, S.C.; Pirhalla, D.E.; Lee, C.C.; Ransibrahmanakul, V. Evaluating linkages of weather patterns and water quality responses in south Florida using a synoptic climatological approach. J. Appl. Meteorol. Climatol. 2013, 52, 425–438. [Google Scholar] [CrossRef] [Green Version]
  36. Yocke, M.A.; Emery, C.A.; Roberts, P.; MacDonald, C.; Ladner, D.; Prouty, J.; Barnett, A. Meteorology of the northeastern Gulf of Mexico: Data from 1995 to 1997, Final Report; U.S. Department of the Interior, Minerals Management Service, Gulf of Mexico OCS Region: New Orleans, LA, USA, 2000.
  37. Zhu, J.; Liang, X.Z. Impacts of the Bermuda high on regional climate and ozone over the United States. J. Clim. 2013, 26, 1018–1032. [Google Scholar] [CrossRef]
  38. Richardson, W.J. Timing of bird migration in relation to weather: Updated review. In Bird Migration; Springer Berlin Heidelberg: Berlin/Heidelberg, Germany, 1990; pp. 78–101. ISBN 978-3-642-74544-7. [Google Scholar]
  39. Dokter, A.M.; Shamoun-Baranes, J.; Kemp, M.U.; Tijm, S.; Holleman, I. High altitude bird migration at temperate latitudes: A synoptic perspective on wind assistance. PLoS ONE 2013, 8, e52300. [Google Scholar] [CrossRef] [Green Version]
  40. Yaukey, P.H.; Powell, S.C. Numbers of migratory birds stopping over in New Orleans, Louisiana, USA in relation to weather. Wilson J. Ornithol. 2008, 120, 286–295. [Google Scholar] [CrossRef]
  41. Alerstam, T. Detours in bird migration. J. Theor. Biol. 2001, 209, 319–331. [Google Scholar] [CrossRef]
  42. Erni, B.; Liechti, F.; Bruderer, B. The role of wind in passerine autumn migration between Europe and Africa. Behav. Ecol. 2005, 16, 732–740. [Google Scholar] [CrossRef] [Green Version]
  43. La Sorte, F.A.; Fink, D.; Hochachka, W.M.; Farnsworth, A.; Rodewald, A.D.; Rosenberg, K.V.; Sullivan, B.L.; Winkler, D.W.; Wood, C.; Kelling, S. The role of atmospheric conditions in the seasonal dynamics of North American migration flyways. J. Biogeogr. 2014, 41, 1685–1696. [Google Scholar] [CrossRef]
  44. Shamoun-Baranes, J.; Liechti, F.; Vansteelant, W.M.G. Atmospheric conditions create freeways, detours and tailbacks for migrating birds. J. Comp. Physiol. A 2017, 203, 509–529. [Google Scholar] [CrossRef]
  45. Horton, K.G.; Van Doren, B.M.; La Sorte, F.A.; Cohen, E.B.; Clipp, H.L.; Buler, J.J.; Fink, D.; Kelly, J.F.; Farnsworth, A. Holding steady: Little change in intensity or timing of bird migration over the Gulf of Mexico. Glob. Chang. Biol. 2019, 25, 1106–1118. [Google Scholar] [CrossRef] [PubMed]
  46. Cohen, E.B.; Barrow, W.C.; Buler, J.J.; Deppe, J.L.; Farnsworth, A.; Marra, P.P.; McWilliams, S.R.; Mehlman, D.W.; Wilson, R.R.; Woodrey, M.S.; et al. How do en route events around the Gulf of Mexico influence migratory landbird populations? Condor 2017, 119, 327–343. [Google Scholar] [CrossRef]
  47. Lowery, G.H. Evidence of Trans-Gulf Migration. Auk 1946, 63, 175–211. [Google Scholar] [CrossRef]
  48. Russell, R.W. Interactions between Migrating Birds and Offshore Oil and Gas Platforms in the Northern Gulf of Mexico: Final Report; U.S. Department of the Interior, Minerals Management Service, Gulf of Mexico OCS Region: New Orleans, LA, USA, 2005.
  49. Buler, J.J.; Dawson, D.K. Radar analysis of fall bird migration stopover sites in the northeastern U.S. Condor 2014, 116, 357–370. [Google Scholar] [CrossRef] [Green Version]
  50. Buler, J.J.; Diehl, R.H. Quantifying bird density during migratory stopover using weather surveillance radar. IEEE Trans. Geosci. Remote Sens. 2009, 47, 2741–2751. [Google Scholar] [CrossRef]
  51. Buler, J.J.; Moore, F.R. Migrant-habitat relationships during stopover along an ecological barrier: Extrinsic constraints and conservation implications. J. Ornithol. 2011, 152, 101–112. [Google Scholar] [CrossRef]
  52. Buler, J.J.; Moore, F.R.; Woltmann, S. A multi-scale examination of stopover habitat use by birds. Ecology 2007, 88, 1789–1802. [Google Scholar] [CrossRef] [Green Version]
  53. Lafleur, J.M.; Buler, J.J.; Moore, F.R. Geographic position and landscape composition explain regional patterns of migrating landbird distributions during spring stopover along the northern coast of the Gulf of Mexico. Landsc. Ecol. 2016, 31, 1697–1709. [Google Scholar] [CrossRef]
  54. Gauthreaux, S.A. A radar and direct visual study of passerine spring migration in southern Louisiana. Auk 1971, 88, 343–365. [Google Scholar] [CrossRef]
  55. McLaren, J.D.; Buler, J.J.; Schreckengost, T.; Smolinsky, J.A.; Boone, M.; Emiel van Loon, E.; Dawson, D.K.; Walters, E.L. Artificial light at night confounds broad-scale habitat use by migrating birds. Ecol. Lett. 2018, 21, 356–364. [Google Scholar] [CrossRef] [PubMed]
  56. Mesinger, F.; DiMego, G.; Kalnay, E.; Mitchell, K.; Shafran, P.C.; Ebisuzaki, W.; Jović, D.; Woollen, J.; Rogers, E.; Berbery, E.H.; et al. North American Regional Reanalysis. Bull. Am. Meteorol. Soc. 2006, 87, 343–360. [Google Scholar] [CrossRef] [Green Version]
  57. Cabrera-Cruz, S.A.; Mabee, T.J.; Patraca, R.V. Using theoretical flight speeds to discriminate birds from insects in radar studies. Condor 2013, 115, 263–272. [Google Scholar] [CrossRef]
  58. Larkin, R.P. Flight speeds observed with radar, a correction: Slow “birds” are insects. Behav. Ecol. Sociobiol. 1991, 29, 221–224. [Google Scholar] [CrossRef]
  59. Buler, J.J.; Barrow, W.C.; Boone, M.E.; Dawson, D.K.; Diehl, R.H.; Moore, F.R.; Randall, L.A.; Schreckengost, T.D.; Smolinsky, J.A. Linking animals aloft with the terrestrial landscape. In Aeroecology; Springer International Publishing: Cham, Switzerland, 2017; pp. 347–378. [Google Scholar]
  60. Able, K.P. A radar study of the altitude of nocturnal passerine migration. Bird-Banding 1970, 41, 282. [Google Scholar] [CrossRef]
  61. Kerlinger, P.; Moore, F.R. Atmospheric structure and avian migration. In Current Ornithology; Springer: Boston, MA, USA, 1989; pp. 109–142. [Google Scholar]
  62. Gauthreaux, S.A. The flight behavior of migrating birds in changing wind fields: Radar and visual analyses. Integr. Comp. Biol. 1991, 31, 187–204. [Google Scholar] [CrossRef] [Green Version]
  63. Homer, C.G.; Dewitz, J.A.; Yang, L.; Jin, S.; Danielson, P.; Xian, G.; Coulston, J.; Herold, N.D.; Wickham, J.D.; Megown, K. Completion of the 2011 National Land Cover Database for the conterminous United States-Representing a decade of land cover change information. Photogramm. Eng. Remote Sensing 2015, 81, 345–354. [Google Scholar]
  64. Andueza, M.; Arizaga, J.; Jorge Belda, E.; Barba, E. The role of extrinsic and intrinsic factors on the departure decisions of a long-distance migratory passerine. Ardeola 2013, 60, 59–72. [Google Scholar] [CrossRef]
  65. Arizaga, J.; Belda, E.J.; Barba, E. Effect of fuel load, date, rain and wind on departure decisions of a migratory passerine. J. Ornithol. 2011, 152, 991–999. [Google Scholar] [CrossRef]
  66. Covino, K.M.; Holberton, R.L.; Morris, S.R. Factors influencing migratory decisions made by songbirds on spring stopover. J. Avian Biol. 2015, 46, 73–80. [Google Scholar] [CrossRef]
  67. Hinkle, D.E.; Wiersma, W.; Jurs, S.G. Rule of Thumb for Interpreting the Size of a Correlation Coefficient. In Applied Statistics for the Behavioral Sciences, 5th ed.; Houghton Mifflin: Boston, MA, USA, 2003; Volume 5, ISBN 0618124055. [Google Scholar]
  68. De’ath, G. Boosted regression trees for ecological modeling and prediction. Ecology 2007, 88, 243–251. [Google Scholar] [CrossRef]
  69. Elith, J.; Leathwick, J.R.; Hastie, T. A working guide to boosted regression trees. J. Anim. Ecol. 2008, 77, 802–813. [Google Scholar] [CrossRef]
  70. Hijmans, R.J.; Phillips, S.; Leathwick, J.; Elith, J.; Hijmans, M.R.J. Package “dismo”. 2017. Available online: https://cran.r-project.org/web/packages/dismo/dismo.pdf (accessed on 16 August 2017).
  71. Dokter, A.M.; Farnsworth, A.; Fink, D.; Ruiz-Gutierrez, V.; Hochachka, W.M.; La Sorte, F.A.; Robinson, O.J.; Rosenberg, K.V.; Kelling, S. Seasonal abundance and survival of North America’s migratory avifauna determined by weather radar. Nat. Ecol. Evol. 2018, 2, 1603–1609. [Google Scholar] [CrossRef]
  72. Gauthreaux, S.A.; Belser, C.G.; Welch, C.M. Atmospheric trajectories and spring bird migration across the Gulf of Mexico. J. Ornithol. 2006, 147, 317–325. [Google Scholar] [CrossRef]
  73. Gauthreaux, S.A.; Michi, J.E.; Belser, C.G. The temporal and spatial structure of the atmosphere and its influence on bird migration strategies. In Birds of Two Worlds: The Ecology and Evolution of Migration; Greenberg, R., Marra, P.P., Eds.; University Press/Wiley: West Sussex, UK, 2005; pp. 182–192. [Google Scholar]
  74. Able, K.P. Fall migration in coastal Louisiana and the evolution of migration patterns in the Gulf region. Wilson Bull. 1972, 84, 231–242. [Google Scholar]
  75. Gill, R.E.; Tibbitts, T.L.; Douglas, D.C.; Handel, C.M.; Mulcahy, D.M.; Gottschalck, J.C.; Warnock, N.; McCaffery, B.J.; Battley, P.F.; Piersma, T. Extreme endurance flights by landbirds crossing the Pacific Ocean: Ecological corridor rather than barrier? Proc. R. Soc. B Biol. Sci. 2009, 276, 447–457. [Google Scholar] [CrossRef] [Green Version]
  76. La Sorte, F.A.; Fink, D. Projected changes in prevailing winds for transatlantic migratory birds under global warming. J. Anim. Ecol. 2017, 86, 273–284. [Google Scholar] [CrossRef] [Green Version]
  77. Alerstam, T. Ecological causes and consequences of bird orientation. Experientia 1990, 46, 405–415. [Google Scholar] [CrossRef]
  78. Liechti, F. Birds: Blowin’ by the wind? J. Ornithol. 2006, 147, 202–211. [Google Scholar] [CrossRef]
  79. Dänhardt, J.; Lindström, Å. Optimal departure decisions of songbirds from an experimental stopover site and the significance of weather. Anim. Behav. 2001, 62, 235–243. [Google Scholar] [CrossRef] [Green Version]
  80. Schmaljohann, H.; Liechti, F.; Bruderer, B. Daytime passerine migrants over the Sahara—Are these diurnal migrants or prolonged flights of nocturnal migrants? Ostrich 2007, 78, 357–362. [Google Scholar] [CrossRef]
  81. Schmaljohann, H.; Liechti, F.; Bruderer, B. Songbird migration across the Sahara: The non-stop hypothesis rejected! Proc. R. Soc. B Biol. Sci. 2006, 274, 735–739. [Google Scholar] [CrossRef] [PubMed]
  82. Jenni-Eiermann, S.; Almasi, B.; Maggini, I.; Salewski, V.; Bruderer, B.; Liechti, F.; Jenni, L. Numbers, foraging and refuelling of passerine migrants at a stopover site in the western Sahara: Diverse strategies to cross a desert. J. Ornithol. 2011, 152, 113–128. [Google Scholar] [CrossRef]
  83. Drake, V.; Farrow, R.A. The influence of atmospheric structure and motions on insect migration. Annu. Rev. Entomol. 1988, 33, 183–210. [Google Scholar] [CrossRef]
  84. Huff, F.A. Relation between leafhopper influxes and synoptic weather conditions. J. Appl. Meteorol. 1963, 2, 39–43. [Google Scholar] [CrossRef] [Green Version]
  85. Pienkowski, R.L.; Medler, J.T. Synoptic weather conditions associated with long-range movement of the potato leafhopper, Empoasca fabae, into Wisconsin. Ann. Entomol. Soc. Am. 1964, 57, 588–591. [Google Scholar] [CrossRef]
  86. Kisimoto, R. Synoptic weather conditions inducing long-distance immigration of planthoppers, Sogatella furcifera Horvath and Nilaparvata lugens Stal. Ecol. Entomol. 1976, 1, 95–109. [Google Scholar] [CrossRef]
  87. Gregg, P.C.; Fitt, G.P.; Coombs, M.; Henderson, G.S. Migrating moths collected in tower-mounted light traps in northern New South Wales, Australia: Influence of local and synoptic weather. Bull. Entomol. Res. 1994, 84, 17–30. [Google Scholar] [CrossRef]
  88. Yong, W.; Moore, F.R. Spring stopover of intercontinental migratory thrushes along the northern coast of the Gulf of Mexico. Auk 1997, 114, 263–278. [Google Scholar] [CrossRef] [Green Version]
  89. Horton, K.G.; Nilsson, C.; Van Doren, B.M.; La Sorte, F.A.; Dokter, A.M.; Farnsworth, A. Bright lights in the big cities: Migratory birds’ exposure to artificial light. Front. Ecol. Environ. 2019, 17, 209–214. [Google Scholar] [CrossRef]
  90. La Sorte, F.A.; Fink, D.; Buler, J.J.; Farnsworth, A.; Cabrera-Cruz, S.A. Seasonal associations with urban light pollution for nocturnally migrating bird populations. Glob. Chang. Biol. 2017, 23, 4609–4619. [Google Scholar] [CrossRef] [PubMed]
  91. Cabrera-Cruz, S.A.; Cohen, E.B.; Smolinsky, J.A.; Buler, J.J. Artificial light at night is related to broad-scale stopover distributions of nocturnally migrating landbirds along the Yucatan Peninsula, Mexico. Remote Sens. 2020, 12, 395. [Google Scholar] [CrossRef] [Green Version]
  92. Doyle, T.W.; Krauss, K.W.; Conner, W.H.; From, A.S. Predicting the retreat and migration of tidal forests along the northern Gulf of Mexico under sea-level rise. For. Ecol. Manage. 2010, 259, 770–777. [Google Scholar] [CrossRef]
Figure 1. The locations and coverage of the 10 NEXRAD sites (the circles represent a 100-km radius sampling area) within the northern Gulf of Mexico coastal region, which encompasses six states: Texas (TX), Louisiana (LA), Mississippi (MS), Alabama (AL), Georgia (GA), and Florida (FL).
Remotesensing 12 00565 g001
Figure 2. Generalized diagrams of the eight defined synoptic weather types considered in this study, with labeled pressure systems (“L” = low pressure, “H” = high pressure), pressure isobars (black lines), frontal system boundaries (blue lines with triangles denoting direction of movement), and general wind direction over the coast and Gulf of Mexico (indicated by the arrows). The first five synoptic weather types were considered unfavorable (Western Gulf Front, Central Gulf Front, Eastern Gulf Front, East Coast Low, and Midwest Continental High) and the last three favorable (Eastern Continental High, Bermuda High, and Gulf High).
Remotesensing 12 00565 g002
Figure 3. Canonical correspondence analysis plot showing the mean canonical variate values of the nine daily synoptic weather types and the canonical vectors of four continuous weather variables measured throughout the night over the Gulf of Mexico including zonal (blowing east or west) and meridional (blowing north or south) wind speeds (m s−1) at 925 mb, surface air pressure (kPa), and accumulated total precipitation (kg m−2) from North American Regional Reanalysis points over the Gulf of Mexico relative to the first two canonical axes (CCA1 & CCA2). The zonal wind component estimates wind speed in the east–west direction (positive if blowing towards the east and negative if blowing towards the west), and the meridional wind component estimates wind speed in the north–south direction (positive if blowing towards the north and negative if blowing towards the south). All measurements were taken at 6:00 UTC the night prior to migrants departing stopover sites. Ellipses denote the 95% confidence intervals of means for the synoptic weather types, which include five unfavorable for northward migration (e.g., winds blowing south and/or moderate to high amounts of precipitation) in red: Western Gulf Front (GFW), Central Gulf Front (GFC), Eastern Gulf Front (GFE), East Coast Low (ELOW), and Midwest Continental High (MCH); and three favorable for northwards migration (e.g., winds blowing north and little to no precipitation) in blue: Eastern Continental High (ECH), Bermuda High (BH), and Gulf High (GH). The last synoptic weather type of “Other” consisted of a subset of instances that did not fit into one of the eight prior categories.
Remotesensing 12 00565 g003
Figure 4. Relative influence of (a) en route synoptic weather (i.e., encountered during migration over the Gulf of Mexico [GOM]) summed across weather types compared to other ecological predictor variables (i.e., excluding distance from the radar and relative elevation) and (b) individual en route synoptic weather types on bird stopover density from the boosted regression tree model (percent deviance explained = 63.2%, CV correlation = 0.655). Other predictor variables pertained to geography (longitude, distance from the GOM coast) and landscape (proportion of hardwood forest within 5 km). CV correlation is the mean correlation of predictions using cross-validated (i.e., out-of-bag) data.
Remotesensing 12 00565 g004
Figure 5. Plots of interactions among longitude (a,c,e) and distance from the Gulf of Mexico (GOM) coast (b,d,f) and the three most influential en route synoptic weather types (a,b: Midwest Continental High; c,d: Western Gulf Front; e,f: East Coast Low) from a boosted regression tree model predicting mean bird stopover density within the northern GOM coastal region. The solid line represents the combined response of all the other synoptic weather types. The shaded bars underneath the longitude interactions indicate the state, with Texas on the far left, followed by Louisiana, Mississippi/Alabama, and Florida.
Remotesensing 12 00565 g005
Table 1. The strength of two-way interactions among selected predictor variables indicated by the boosted regression tree model, with each synoptic weather type as an individual predictor variable and mean vertically-integrated reflectivity as the response variable. The full set of predictor variables included longitude, distance from the Gulf of Mexico (GOM) coast, en route synoptic weather type encountered during migration over the Gulf of Mexico, and the proportion of hardwood forest within 5 km, distance from the radar, and relative elevation.
Synoptic Weather TypeInteraction: LongitudeInteraction: Distance from the GOM Coast
Western Gulf Front61.3146.8
Central Gulf Front28.422.4
Eastern Gulf Front10.10.4
East Coast Low151.35.2
Midwest Continental High42.7222.7
Eastern Continental High2.90.0
Bermuda High7.013.2
Gulf High1.02.6
Other5.10.3

