Results from Developments in the Use of a Scanning Sonar to Support Diving Operations from a Rescue Ship


Department of Navigation and Hydrography, Faculty of Navigation and Naval Weapons, Polish Naval Academy, 81-127 Gdynia, Poland
Remote Sens. 2020, 12(4), 693; https://0-doi-org.brum.beds.ac.uk/10.3390/rs12040693
Submission received: 31 January 2020
/
Revised: 14 February 2020
/
Accepted: 17 February 2020
/
Published: 20 February 2020
(This article belongs to the Special Issue 2nd Edition Radar and Sonar Imaging and Processing)
Abstract
:In recent years, widespread use of scanning sonars for acoustic imaging of the seabed surface can be observed. These types of sonars are mainly used with tripods or special booms, or are mounted onboard remotely operated or unmanned vehicles. Typical scanning sonar applications include search and recovery operations, imaging of underwater infrastructure, and scour monitoring. The use of these sonars is often limited to shallow waters. Diver teams or underwater remotely operated vehicles (ROV) are commonly used to inspect shipwrecks, port wharfs, and ship hulls. However, reduced underwater visibility, submerged debris, and extreme water depths can limit divers’ capabilities. In this paper, a novel, nonstandard technique for use of a scanning sonar is proposed. The new application for scanning sonar technology is a practical solution developed on the Polish Navy’s search and rescue ship “Lech.” To verify the effectiveness of the proposed technique, the author took part in four different studies carried out in the southeastern Baltic Sea. The tests were performed using the MS 1000 scanning sonar. The results demonstrate that the proposed technique has the potential to provide detailed sonar images of the seabed and underwater objects before the descent of divers. The divers get acquainted with the underwater situation, which undoubtedly increases the safety of the entire operation. Scanning sonars are unlikely to completely replace the work of divers but may reduce the number and duration of dives. The sonar use technique turned out to be useful when rescuing a crew of a submarine that crashed and settled on the sea bottom as part of a naval exercise. The sonar data obtained during four experimental tests performed in the Baltic Sea prove the validity, usefulness, and significance of the proposed technique, especially from the standpoint of safety of underwater work.

1. Introduction
Most of the world’s oceans are inaccessible to humans. When exploring wreckages and studying the seabed or other navigation obstacles, people must rely on advanced measurement technology. With the development of measurement techniques and the progress of science, the number of sensors and platforms intended for visualization of the seabed and wreckages is increasing. If there is little knowledge of possible objects on the bottom of a water reservoir, the basic task (purpose) of hydrographic surveys is to find and detect any obstacles lying on the bottom or floating in the water. Due to the strong attenuation of electromagnetic waves in the aquatic environment, video sensors and radar equipment are not suitable for searching for underwater objects and imaging the surface of the seabed. The only practical way to visualize large areas of the seabed is to use acoustic waves. Acoustic measurement methods, due to their advantages, play a leading role in this field. The great role of hydroacoustic bottom surveying techniques is primarily due to the beneficial properties of propagation of sound waves in the aquatic environment. These devices enable complete search of relatively large areas of the seabed in a relatively short time.
Currently, several acoustic devices are available for hydrographic measurements of sea and inland waters. These include multibeam echosounders (MBES) [1,2], singlebeam echosounders (SBES) [3,4,5], side scan sonars (SSS) [6,7], interferometric sonars, and synthetic aperture sonars (SAS) [8,9,10]. These systems differ in terms of their use, purpose, technical measurement capabilities, and different test results.
The quickly evolving techniques of underwater space monitoring are successfully used to search for and locate underwater objects, assess the technical condition of underwater parts of hydrotechnical structures, and control the seabed clearance. Currently, underwater inspections are based on standard equipment and measurement systems mounted on towed platforms, remotely operated vehicles (ROV), and autonomous underwater vehicles (AUV) [11]. The methods and techniques used to measure depth and search for underwater objects have evolved over the years from very simple and primitive (sounding pole, lead line) to computerized, fully digital systems of the latest generation, such as multipulse sonars, chirp sonars, and multibeam probes [12,13].
Side scan sonars use the motion of the sensor host platform to form the acoustic image of the seabed and objects. The operating frequencies range from approximately 20 kHz to 1000 kHz, depending on the range (depth) and size of the seabed objects [14]. There are higher resolution imaging sonars commercially available which operate at frequencies of 1.3 MHz or even 2.1 MHz [15,16]. On the other hand, hydroacoustic measuring systems are not ideal, especially with regard to searching for and identifying very small objects. Such activities may require the use of optical underwater inspection methods. These methods consist of dive reconnaissance or use of a submarine vehicle to identify or verify the detected targets. Consequently, the characteristics of the seabed to be analyzed should be examined in detail by divers or autonomous underwater vehicles.
1.1. Acoustic Systems for Imaging of Seabed and Underwater Objects
Modern survey equipment makes it possible to find, identify, and examine different objects resting on the seabed. Choice of the right hydrographic equipment depends on the task to be completed and the environmental conditions. The basic means for searching and exploring the marine environment include mostly acoustic devices, such as the singlebeam echosounder, the multibeam echosounder, and the side scan sonar [17,18]. Although multibeam echosounder systems are irreplaceable in hydrographic measurements, singlebeam echosounder systems are still used by many entities, companies, and training centers. Singlebeam echosounders have evolved from analogue to digital recording, but most importantly they have increased their accuracy. The technique of searching for underwater objects using the SBES consists in moving along closely planned parallel survey lines while recording the depth associated with precisely defined geographical coordinates [19]. However, due to the shape, size, and orientation of the acoustic beam, the ability of a singlebeam echosounder to detect small underwater objects is very limited.
In recent decades, thanks to advances in sonar technology and digital signal processing, the swath bathymetric technique has been developed with equipment that includes multibeam echosounders, multichannel echosounders, side scan sonars, and bathymetric sonar. According to Calder and Mayer [20], the most effective way to conduct precise bathymetric measurements of large seabed surfaces is to use a multibeam echosounder. They are used mainly by hydrographers, navigators, engineers, marine geologists, the military sector, marine explorers, archaeologists, fishery biologists, and geomorphologists [21]. The undoubted advantage of these devices is their ability to search a much larger area compared to singlebeam echosounders in the same unit of time [22]. The first models of multibeam echosounders appeared in the 1960s as a part of a secret naval project [23]. Over the last decades, the MBES have been successfully used to obtain bathymetric data of shallow water reservoirs and deep sea areas [24,25,26].
Today, the MBES are widely used in marine geological and oceanographic surveys [27,28,29], in the offshore industry, and in underwater pipeline-laying operations [30,31,32]. Very often measurement data sets are so large that scientists have made efforts to develop 3D measurement point reduction methods [33,34]. MBES systems also enable recording of acoustic images of the seabed by recording the strength of the backscattering signal. However, the images are of lower resolution and poorer quality than acoustic backscattering images provided by side scan sonars [35].
In general, as demonstrated by Bates et al. [36], side scan sonars are better suited for detection of objects and MBES effectively provide full bathymetric coverage of the seabed area where a wreckage is located. Side scan sonar (SSS) systems are mainly designed for seabed searching, detection of shipwrecks, pipelines, artifacts, and mine-like objects [37,38,39,40], and are considered to be an irreplaceable tool for underwater archaeological research. SSS systems first appeared in the 1950s as a result of experiments conducted using transducers tilted from the vertical [41] (p. 85). Issues related to the methodology of use of a side scan sonar and the technical capabilities and limitations are presented in publications [6,42].
In very shallow waters, multiple transducer echo sounder (MTES) systems work perfectly. This system was developed in the early 1970s and consists of a spatial array of single transducers [43]. Currently, the MTES is designed for use in ports, rivers, canals, and other shallow bodies of water. Its primary purposes are to search for and locate underwater obstacles and bottom debris, to monitor the depth of navigable waterways, and to support dredging operations. Roll and yaw angles of the platform determine the measurement accuracy of each individual transducer. Another system used for acoustic seabed surface imaging is the synthetic aperture sonar (SAS). It is well known that as the sonar range increases, the resolution of the measurement decreases. SAS sonars use advanced sonar data processing to generate a very narrow beam. The basis for the operation of SAS sonars is the combination of successive acoustic impulses (pings) as they move along a defined survey line to increase the longitudinal resolution of the system [44]. SAS sonars are capable of capturing sonar images with the resolution of several centimeters over a range of up to several hundred meters. This makes SAS sonars a seabed imaging technique designated for applications such as small object search, wreckage imaging, pipeline inspection, and underwater archaeology.
A sonar with a synthetic aperture produces images whose quality does not depend on the range or the frequency. The resolution is limited by the bandwidth at a distance and by the size of the transducer, and can be equal to just a few centimeters in both dimensions [45]. The idea behind the SAS is to ensonify a single object on the seabed with a wide beam several times as the sonar moves along a planned survey line. All acoustic signals reflected from the object are combined and postprocessed. The prerequisite for proper signal processing is accurate information about the movement (position) of the sonar [46].
Between 1920 and 2020, significant technological advances were made in seabed mapping techniques. Today, new technologies make it easier for hydrographers to perform various tasks. Depending on the requirements and applications, different measuring techniques have both advantages and disadvantages, and it is the hydrographer’s job to choose the optimal measuring technology that will do best in specific conditions. There are several factors that determine the choice of the measurement system, but the most important ones to consider are (1) the required object detection, (2) the size of the area to be covered by the measurements, and (3) the depth ranges in the area covered by the acoustic survey.
1.2. Major Application Methods of Scanning Sonar
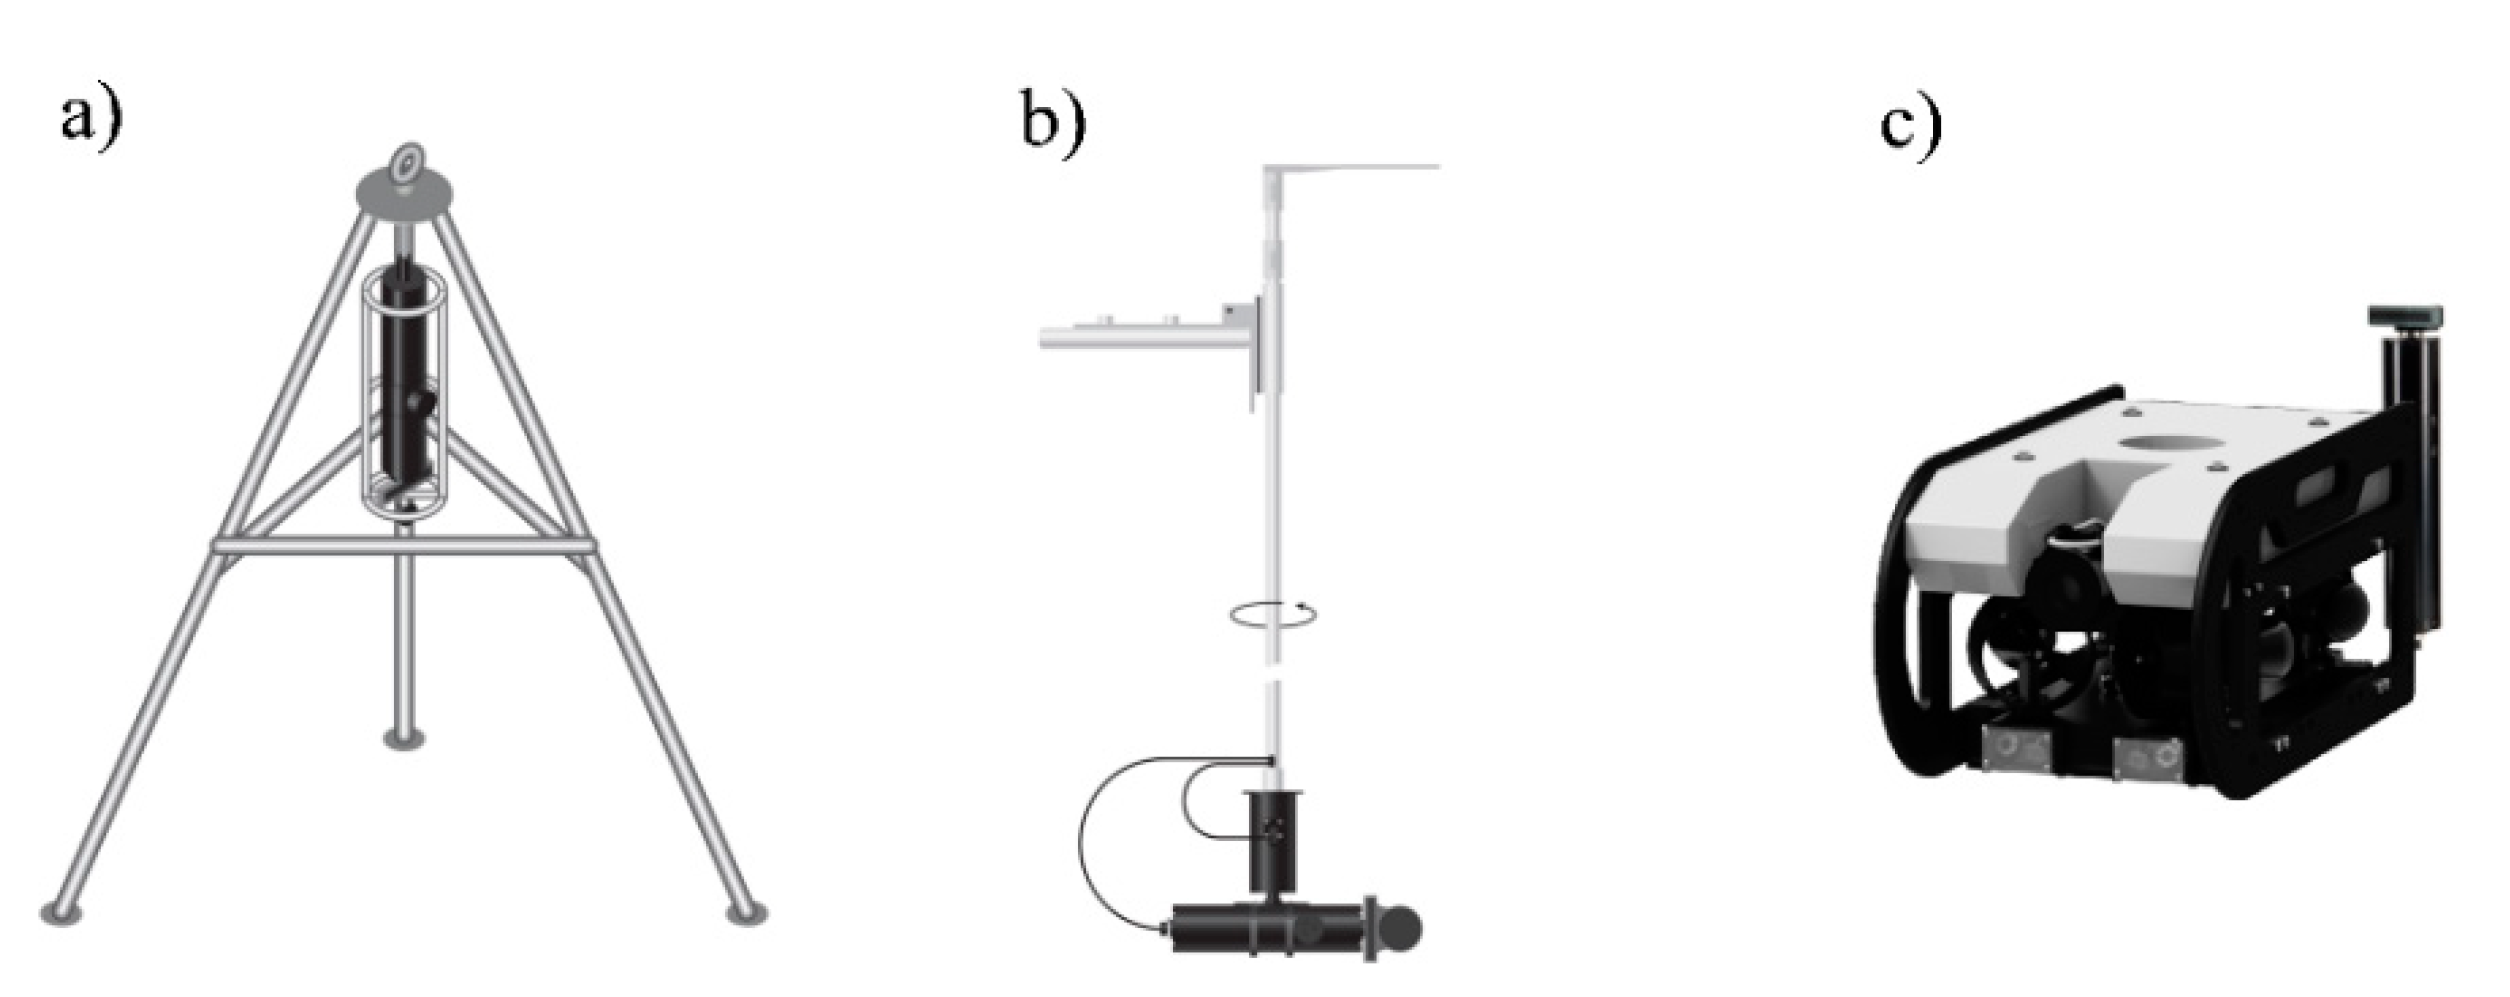
The MS 1000 sonar head can be used in several versions. In a static system, it can be mounted on a special tripod and lowered to the seabed from the deck of the anchored platform or from the port wharf. For the purpose of monitoring the condition of the underwater hydrotechnical structures and bridge pillars, the sonar can be lowered from the wharf on a special boom. The scanning sonar can also be used to determine the distance from and the direction to a detected object. In this case, the sonar is usually mounted on an underwater ROV. The operator of such a vehicle has the ability to obtain an acoustic image of the seabed, which certainly is an advantage, especially when the visibility in the water environment is low [47]. This version is used, among others, to inspect underwater pipelines and cables. The sonar can be mounted on a tripod, attached to a ROV platform, or used with a pole-mount on the hull of a ship or boat (Figure 1).
Scanning sonars are also increasingly used for inspections of vertical hydrotechnical structures and for assessment of the condition of quays, weirs, bridge pillars, and other structures [48,49]. When registering underwater walls of quays, a scanning sonar is usually installed in a horizontal position. Details for using the sonar head in these ways are presented in [49]. Of note is the fact that sonar data obtained from a sonar inspection of port infrastructure can be the basis for planning repairs of quays, docks, and breakwaters. One application of scanning sonar use is to monitor and inspect the technical condition of river and lake bridge supports. In such cases, sonar data can be used to assess the current condition of scouring of bridge supports and to take appropriate maintenance or protection measures [50]. Scanning sonars can record very detailed acoustic images of the bottom and of underwater objects which, in the case of poor underwater visibility, strong currents, or other hazards, is a significant advantage of this measuring technique [51]. Therefore, given these features and the high frequency of the acoustic signal, scanning sonars are increasingly used to search for and detect bodies of drowned persons. Research on the possibility of using scanning sonars to search for human bodies is presented, among others, in [52].
Scanning sonars are used primarily for their designed purpose and in the manner described and recommended by the manufacturers. Based on the literature analysis, it is concluded that scanning sonars have not been used in the aluminum handle that is mounted to the diving platform of a rescue ship, and released to the bottom of the sea from the ship to search and support divers.
1.3. Study Objectives
The sonar systems available on the market today do not need to be towed or mounted on mobile platforms. They can operate in stationary positions and, thanks to their rotary heads, they are able to perform imaging of the bottom by scanning its surface within a 360-degree range. Such sonars are designed for searching for objects on the bottom, monitoring the scouring of bridge supports in rivers, searching for bodies of drowned persons, and inspecting the underwater parts of hydrotechnical structures. The use of such sonars consists in freely lowering the sonar head on a loaded rope, mounting the sonar on a tripod and lowering it to the bottom, or installing the sonar on an underwater ROV and performing sonar tests.
The aim of this study is to test the effectiveness of a new technique for use of a scanning sonar in four different cases and to assess the suitability of the new technique to search for objects and support dive operations. The paper presents the technique for use of a scanning sonar mounted on a special diving platform, which is a part of a diving bell on a rescue ship. This ship performs both search and rescue operations, and diving operations. The proposed sonar use technique helps divers to perform inspections and is a reliable way of detecting and pulling out small objects, often from great depths. The rest of the paper is organized as follows. Section 2 describes the study areas, data acquisition, survey equipment, and methodology of conducted research. Section 3 presents the results and a discussion concerning four different tests conducted from the deck of the Polish Navy Search and Rescue Ship. The summary and conclusions are included in Section 4.
2. Materials and Methods
2.1. Study Areas
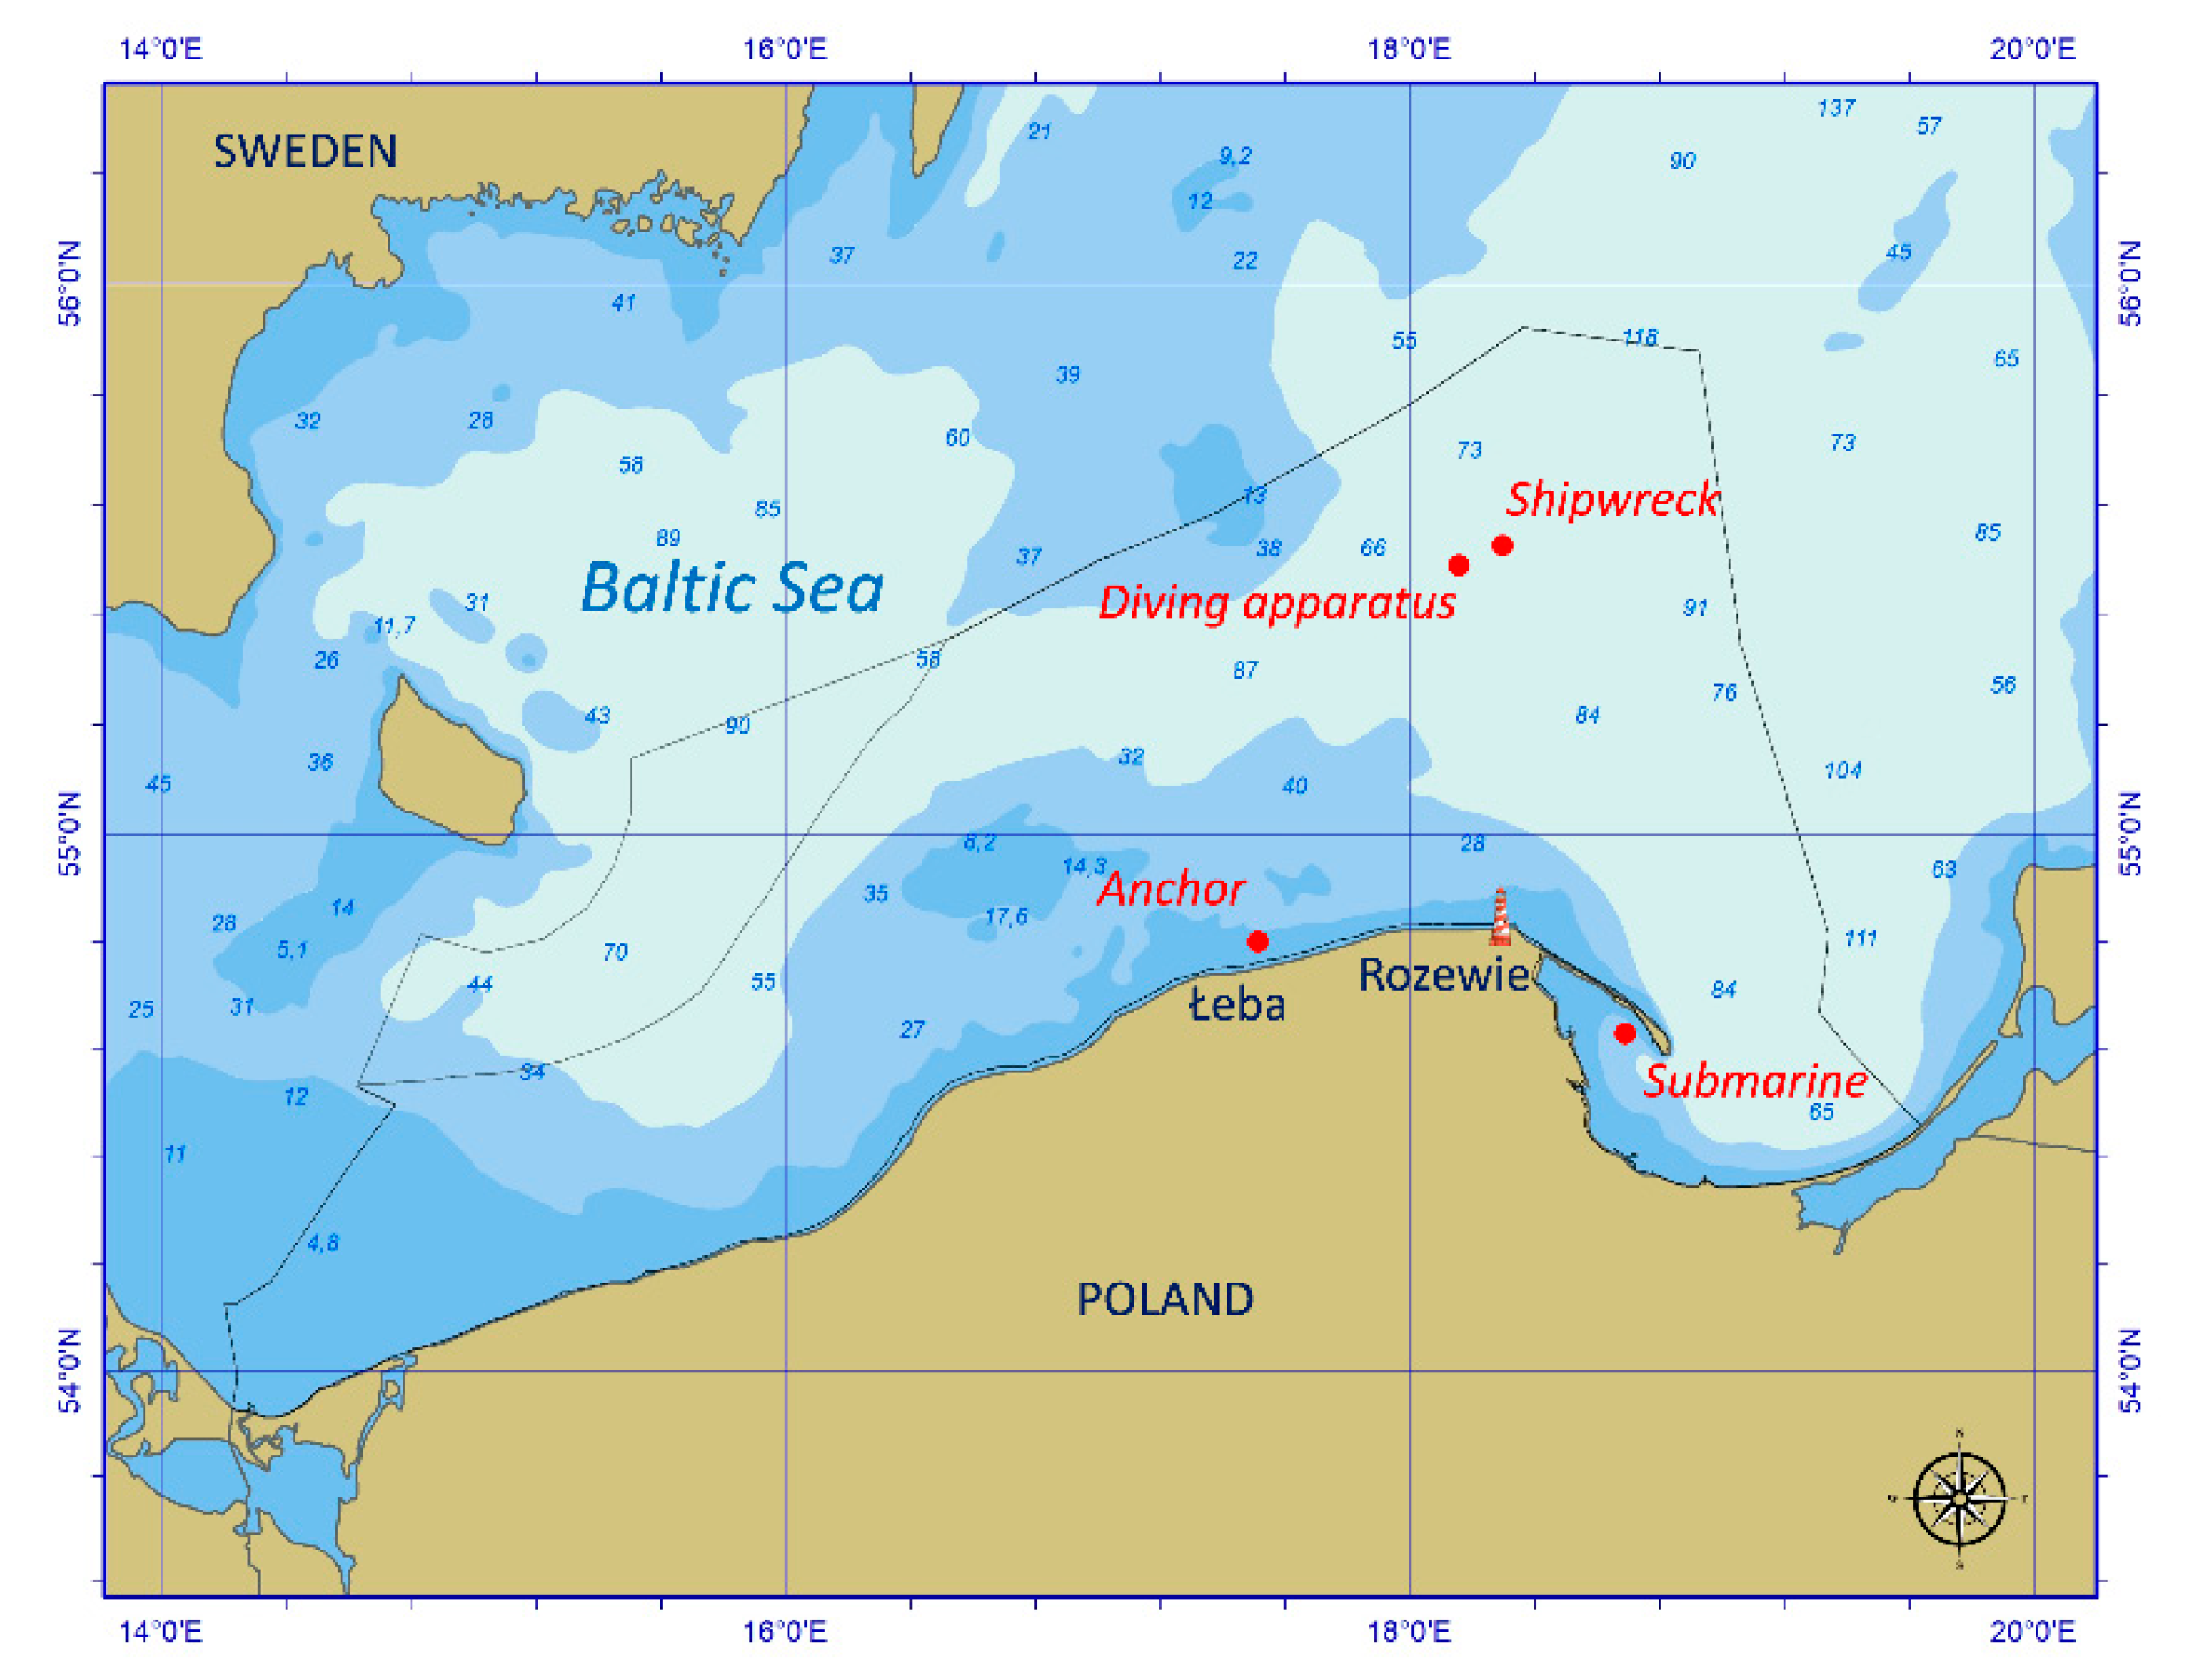
The study presented in the paper was conducted in different periods from 2012 to 2019. The first study was carried out in the area of the wreckage of the Graf Zeppelin aircraft carrier. The object rests at the depth of 87 meters, about 42 nautical miles north of the Rozewie lighthouse. The wreckage is 257 meters long and was discovered in 2006 by the St. Barbara research vessel, which conducted geophysical surveys in this area. In the second case, the survey work consisted in finding and pulling out a small underwater object (diving apparatus) resting at the depth of 82 meters. The location of the lost apparatus was not exactly known. The search operations were carried out at a distance of several dozen meters from the PG-1 unmanned platform located 39 nautical miles north of the Rozewie lighthouse. Further studies with the participation of a rescue ship were carried out in the waters of the Gulf of Gdańsk. The ship took part in a tactical exercise, which was an opportunity to test both the new way of use of a scanning sonar and its detection capabilities. The most recent experiments with the sonar were conducted during the operation of search for and extraction of a Hall-type anchor, which broke off the chain while another ship was at anchor, near the town of Łeba. Figure 2 shows the locations where the search and inspection work was carried out.
2.2. Sonar Equipment and Data Acquisition
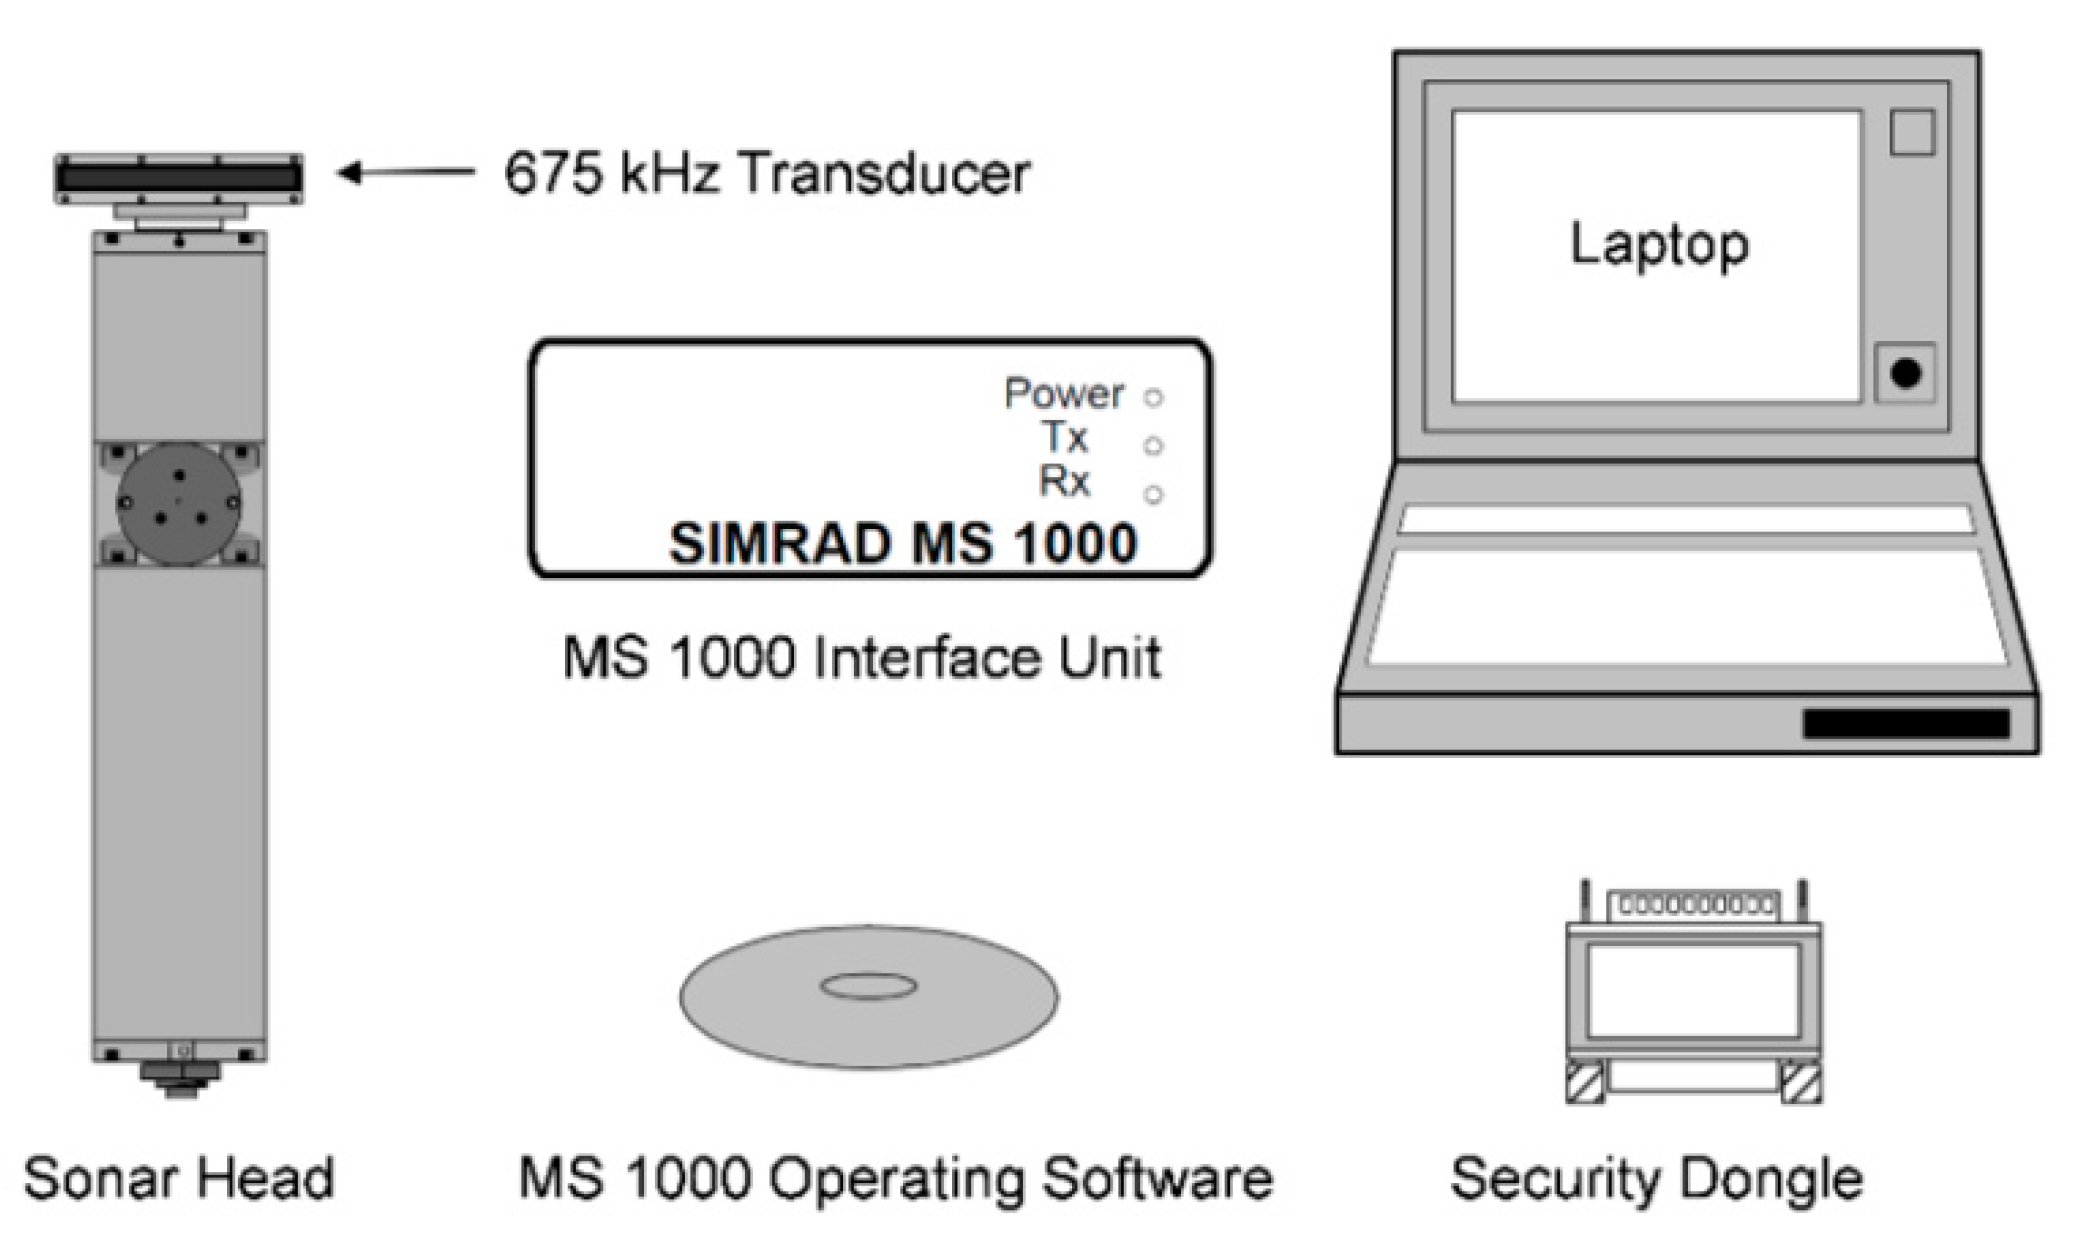
For search and reconnaissance of the area, a mobile sonar system was used, which comprises a Kongsberg Simrad Mesotech sonar head, version 1071, a 150 m-long cable, a power module, and a control computer with MS 1000 software for data recording and processing (Figure 3). The main advantage of the sonar used is high resolution resulting mainly from the high frequency of the acoustic signal equal to 675 kHz. The basic technical characteristics of the sonar are given in Table 1.
The Kongsberg Mesotech sonar head of the 1071 series is characterized by its low weight and size. The device is only 49 cm long and weighs only 2.7 kg in water. To take full advantage of the advanced capabilities of the device, the operation, control, and monitoring of the sonar should be carried out from the MS 1000 software. The search angle is 360° and the minimum increment of the transducer angle is 0.225°. The maximum working range is 100 m, but smaller ranges are recommended for detailed inspection and verification of seabed. The sonar can be used to check the clearance of the seabed, check the condition of underwater structures, and search for objects resting on the seabed [53].
The sonar uses a single transducer that emits an acoustic pulse perpendicular to the transducer face. After receiving the echoes, the stepper motor of the head rotates the transducer by a small angle, setting a new direction of acoustic wave propagation. The signal transmission and receipt process is repeated. To achieve good quality sonar imaging, the sonar head must be held stationary. The more stable the sonar position, the clearer and easier to interpret the recorded image. The system has the ability to scan the bottom surface faster with a larger angle increment. However, increasing the speed of the transducer causes a decrease in the resolution of the sonar imaging. Sonar data with the smb extension were recorded using the MS 1000 software installed on a laptop computer. The MS 1000 software also has the ability to record data from external sensors via serial or USB ports. Each time before a sonar survey, the speed of sound wave propagation in water was measured with a CTD (Conductivity, Temperature, Depth) Valeport probe.
2.3. Study Methodology
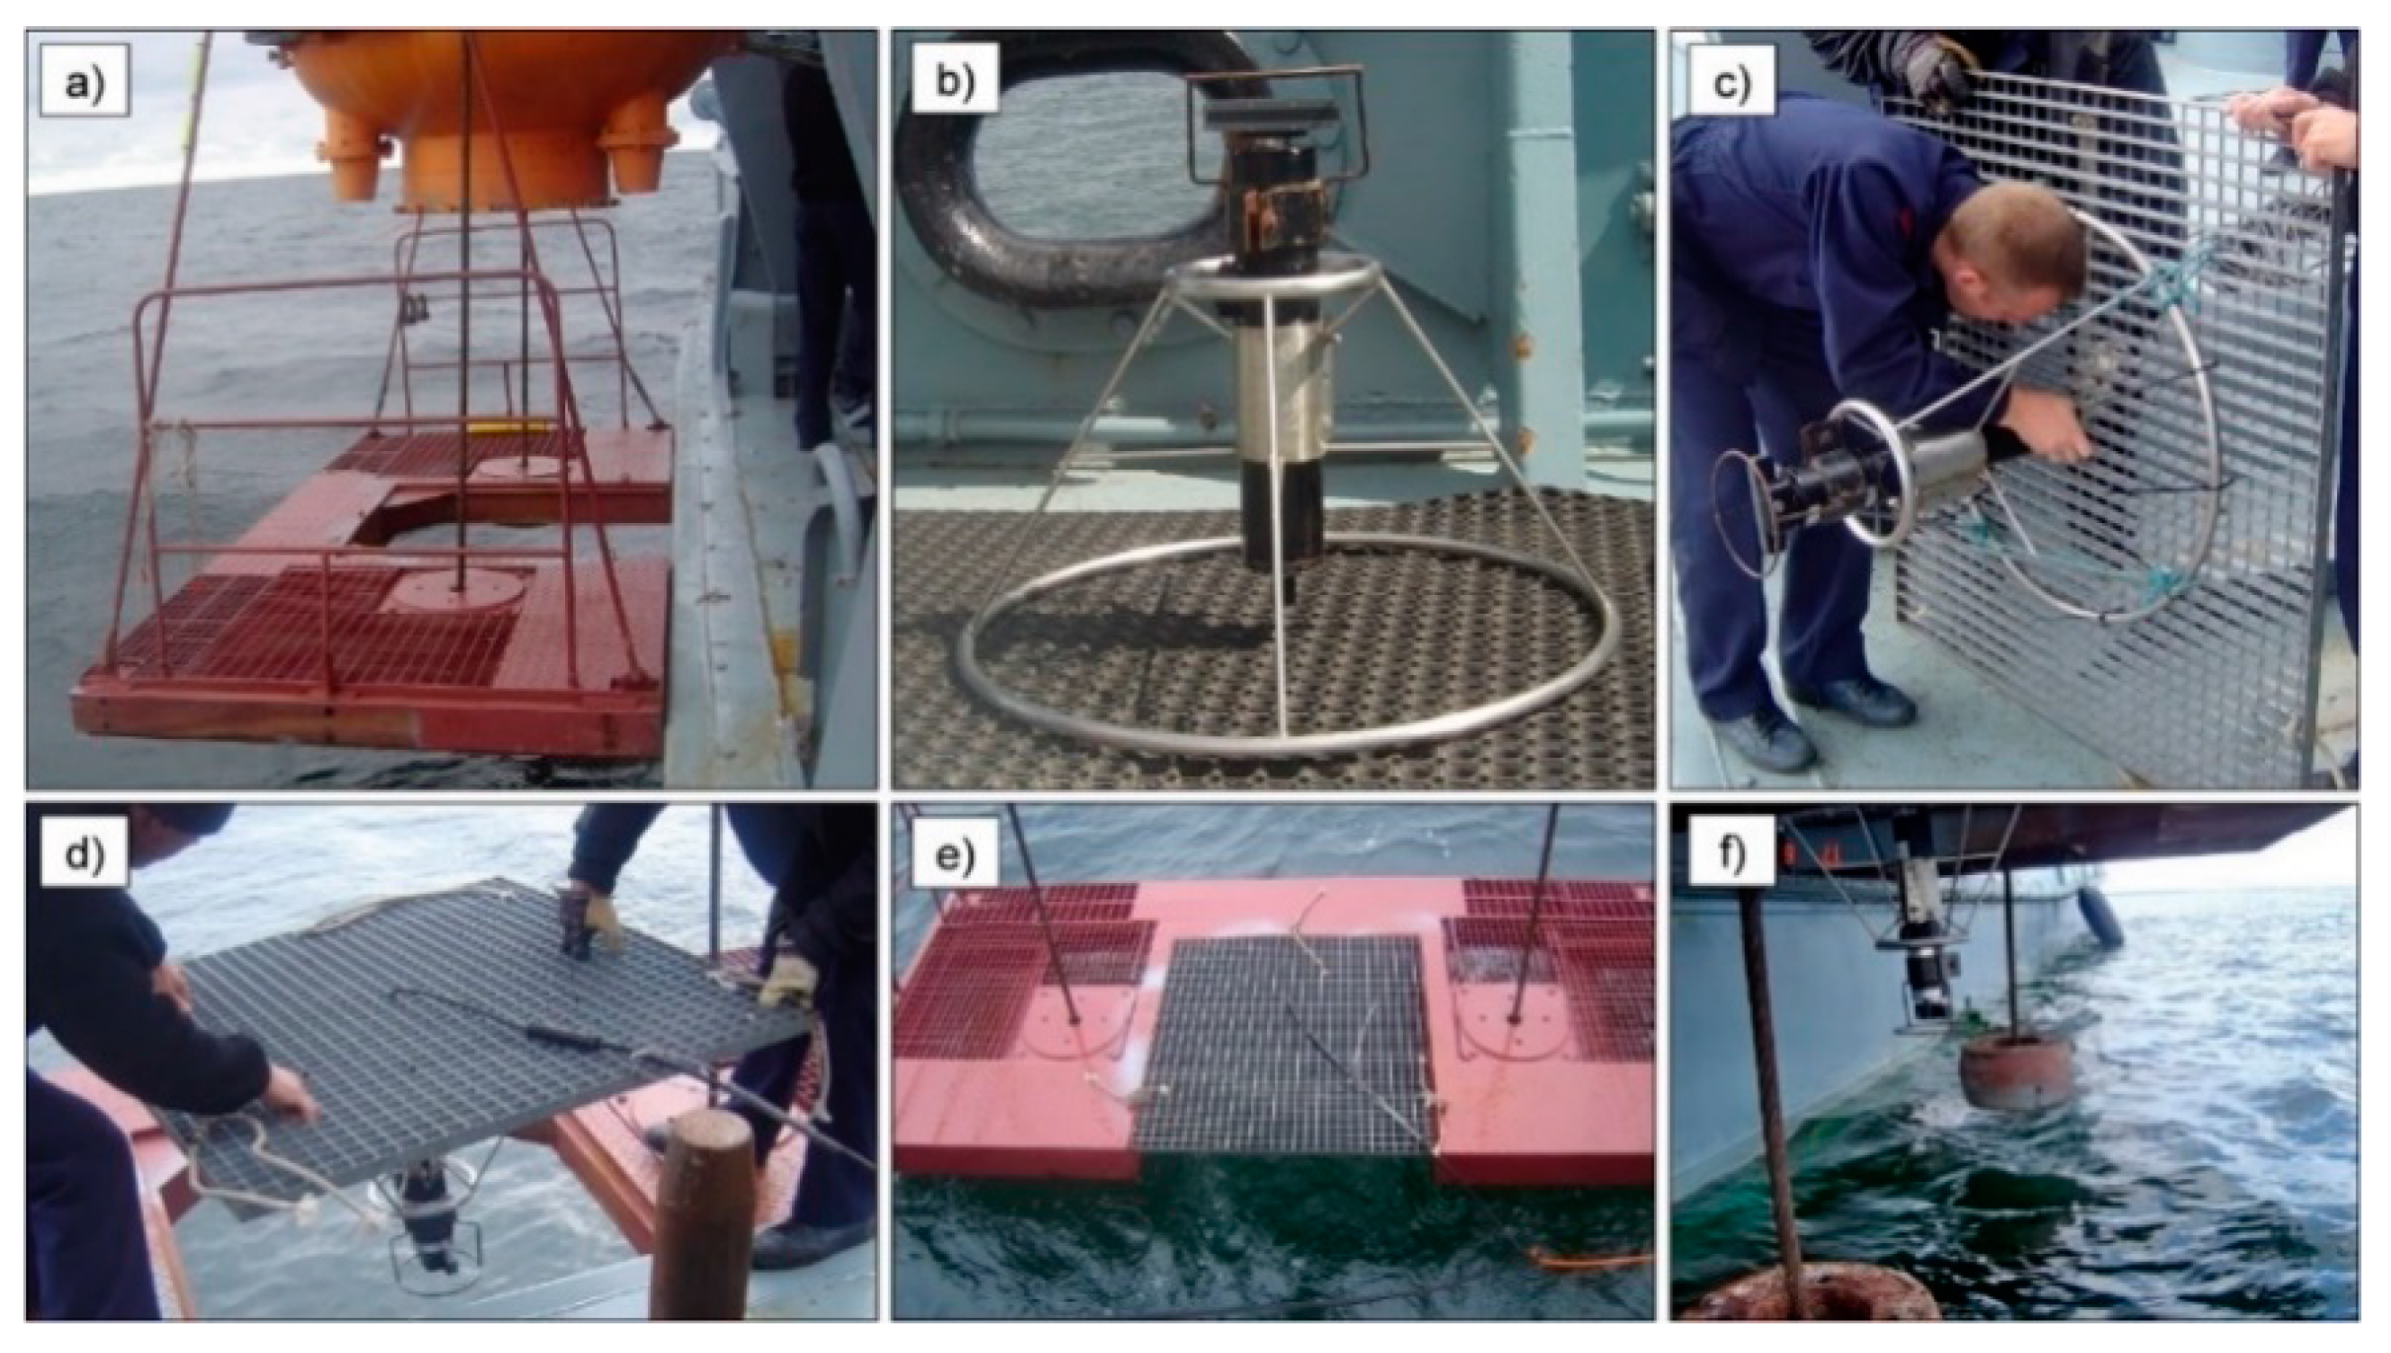
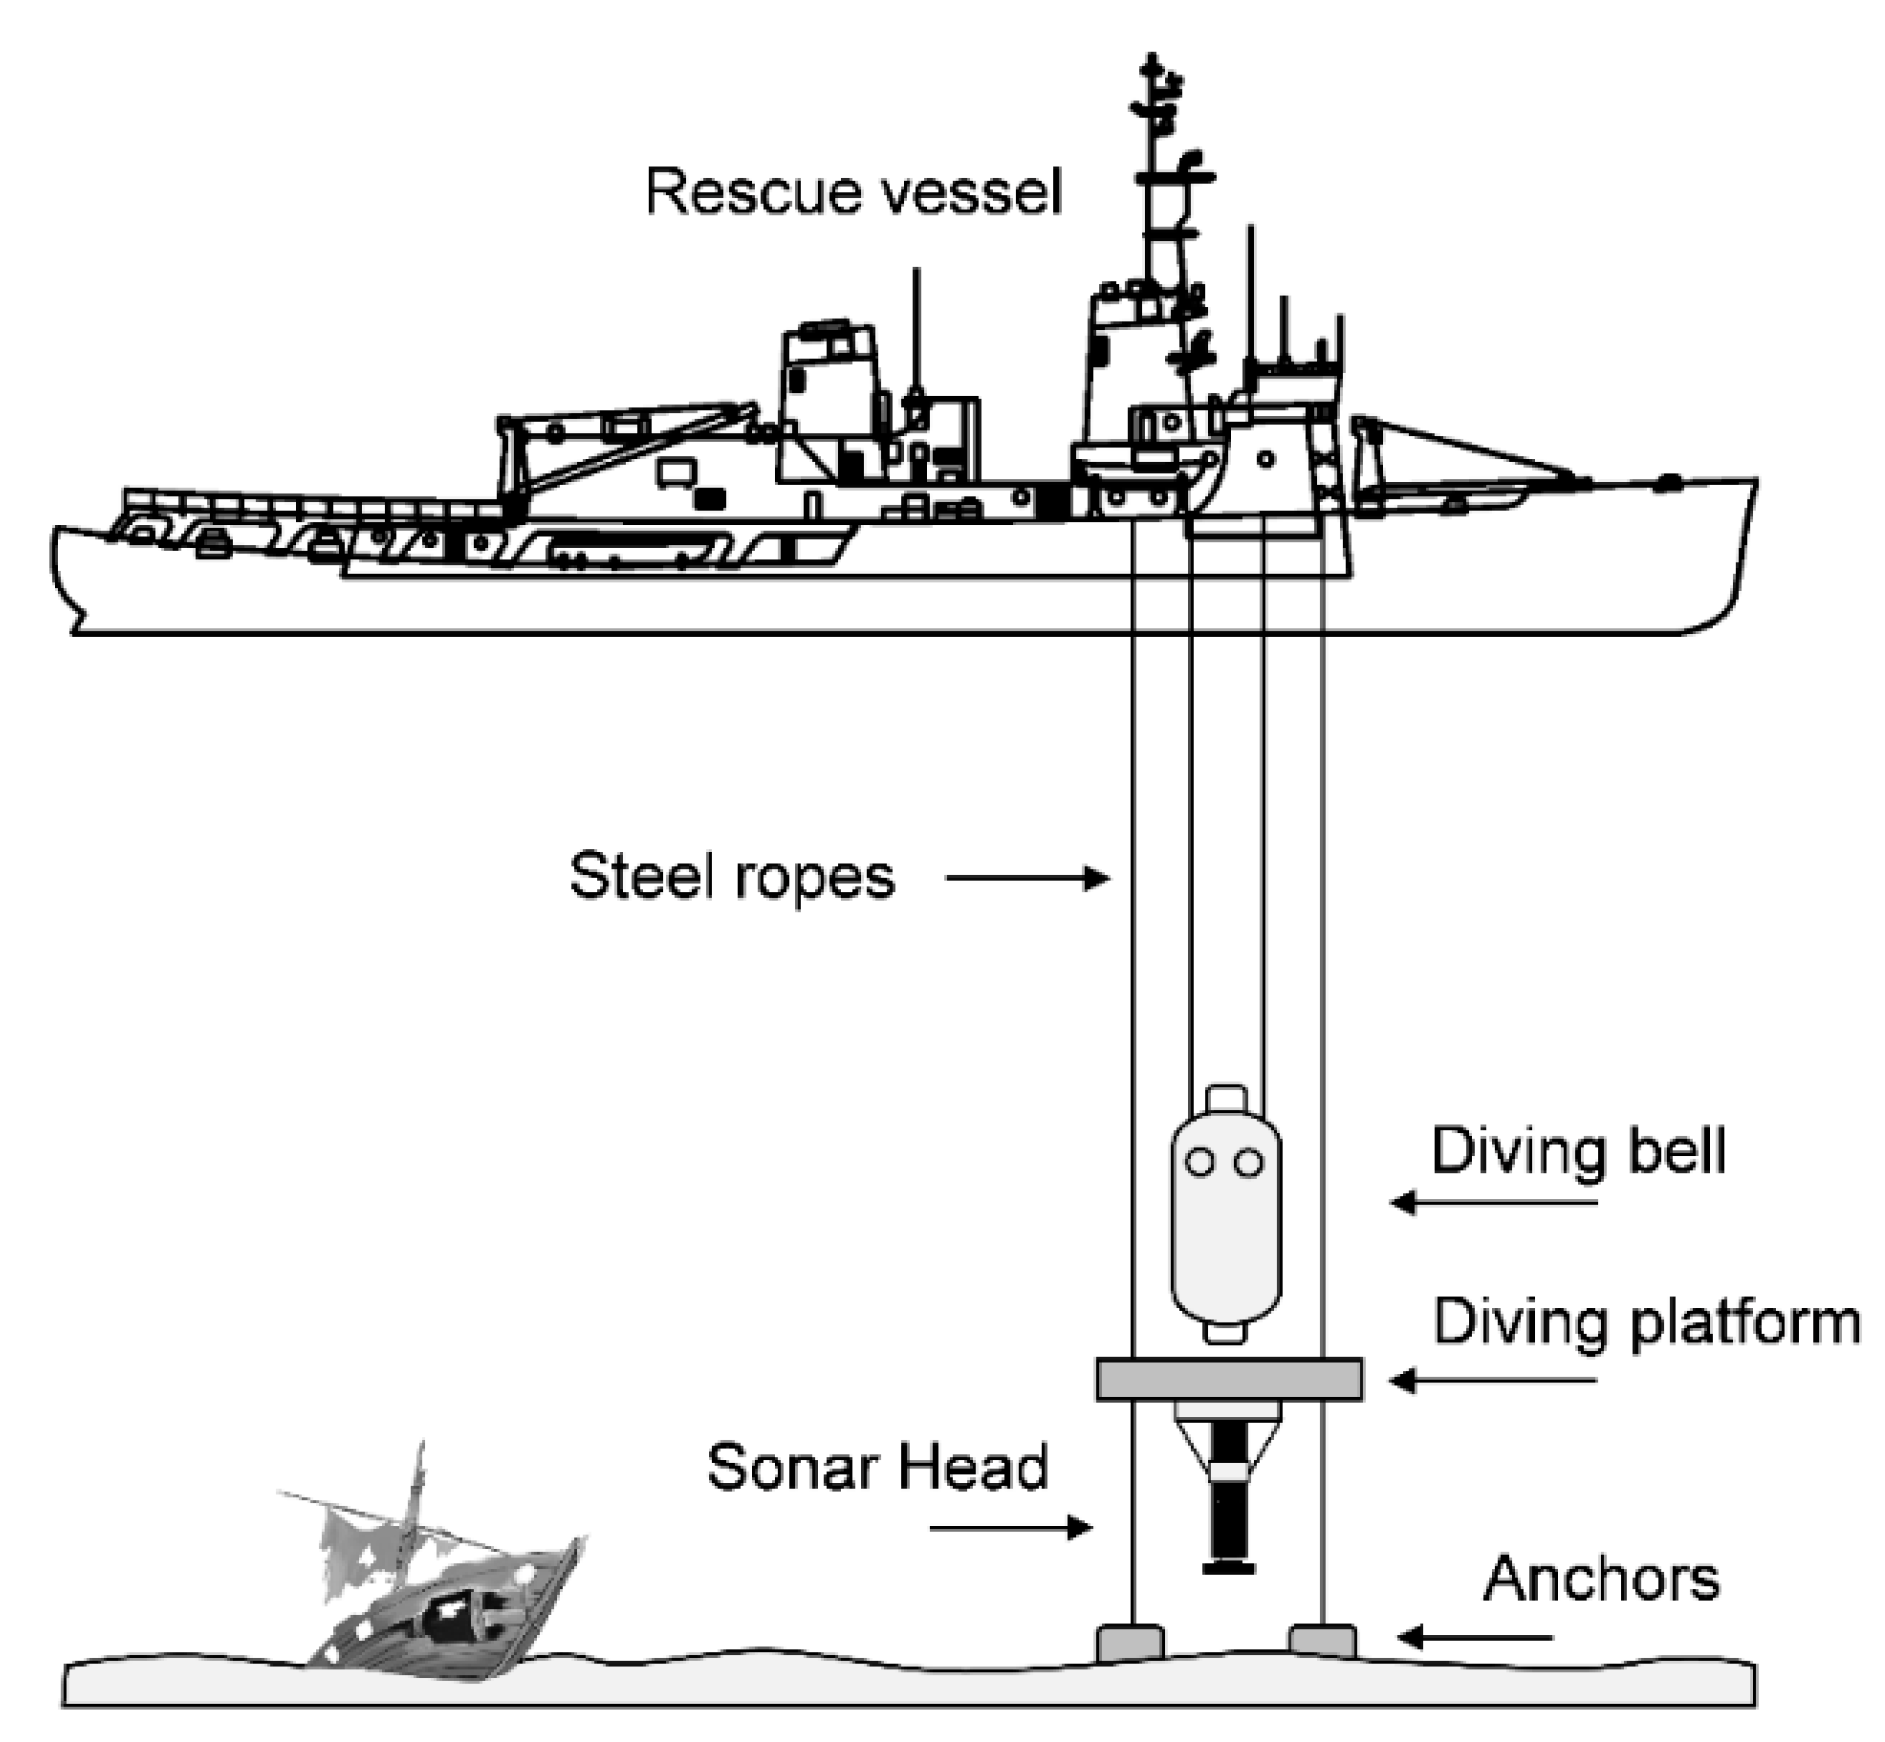
The study methodology in all four cases was almost identical. The platform from which the measurements were carried out was a rescue ship equipped, among others, with a special diving bell with a platform. First, the rescue ship stopped with four anchors directly above the wreckage—a submarine resting on the bottom—or the likely position of the missing underwater object. Anchor ropes, each 500 m long, made it possible to change the position of the ship according to the recommendations of the diving works manager or the sonar operator’s indications. While the anchors were being placed, the hydrographic reconnaissance team prepared the sonar system. The Kongsberg Simrad Mesotech scanning sonar was installed in a special aluminum rack (grip, stand), which was then combined with a diving platform grating (Figure 4). Before leaving the diving platform, the proper functioning of the sonar head was checked. First, the stabilizing anchors of the platform were lowered to the bottom, followed by the platform with the sonar attached (Figure 5). As the platform was lowered, the operator onboard the ship was releasing the cable connecting the sonar to the onboard computer controlling the operation of the sonar. When the diving platform with sonar was at the bottom, the recording of measurement data began. The first measurements were taken over the largest ranges (R = 100 m, R = 75 m) to provide a general and complete picture of the underwater situation. The operator then selected characteristic sonar echoes—potential objects of interest—while reducing the sonar range. In the case of large objects, such as an aircraft carrier wreckage or a submarine resting on the seabed, sectoral sonar operation was also performed.
3. Results and discussion
3.1. Case One—Wreckage of the Aircraft Carrier Graf Zeppelin
The first measurements using the new sonar scanning technique were performed during the inspection and verification of the wreckage of the German aircraft carrier Graf Zeppelin. The rescue ship of the Polish Navy "Lech" was designated to perform the task. During the underwater works, samples of bottom sediments from the area of the wreckage were taken, selected points of the object were checked with the help of divers, video material was recorded with the use of a ROV, and sonar data of selected parts of the wreckage were collected. The hydrographic reconnaissance group was responsible for the initial check of the bottom clearance in the diver drop locations, for detection and measurement of any underwater obstacles, for determination of the height of the diving platform above the seabed (wreckage), and for acquisition of sonar data concerning the object for the purpose of assessment of its condition and its identification. Pairs of divers descended on or around the wreckage in the six positions marked in Figure 6.
The inspection works were attended by the crew of the ORP "Lech" rescue ship, representatives of the Naval Academy, and specialists of the Hydrographic Support Squadron of the Polish Navy. First, two anchors were lowered to the bottom, followed by a platform with a sonar attached. At selected depths (50, 60, and 75 m) the platform was stopped in order to perform control measurements, check the height above the seabed, and acquire sonar data concerning the object. In the final phase of the sonar inspection, the platform was lowered to the height of 1–2 m above the seabed or the flight deck of the wreckage. At this stage, an underwater vehicle providing a constant visual image when reaching a critical depth was invaluable. The use of a ROV for monitoring improved the safety of the quite expensive measuring equipment.
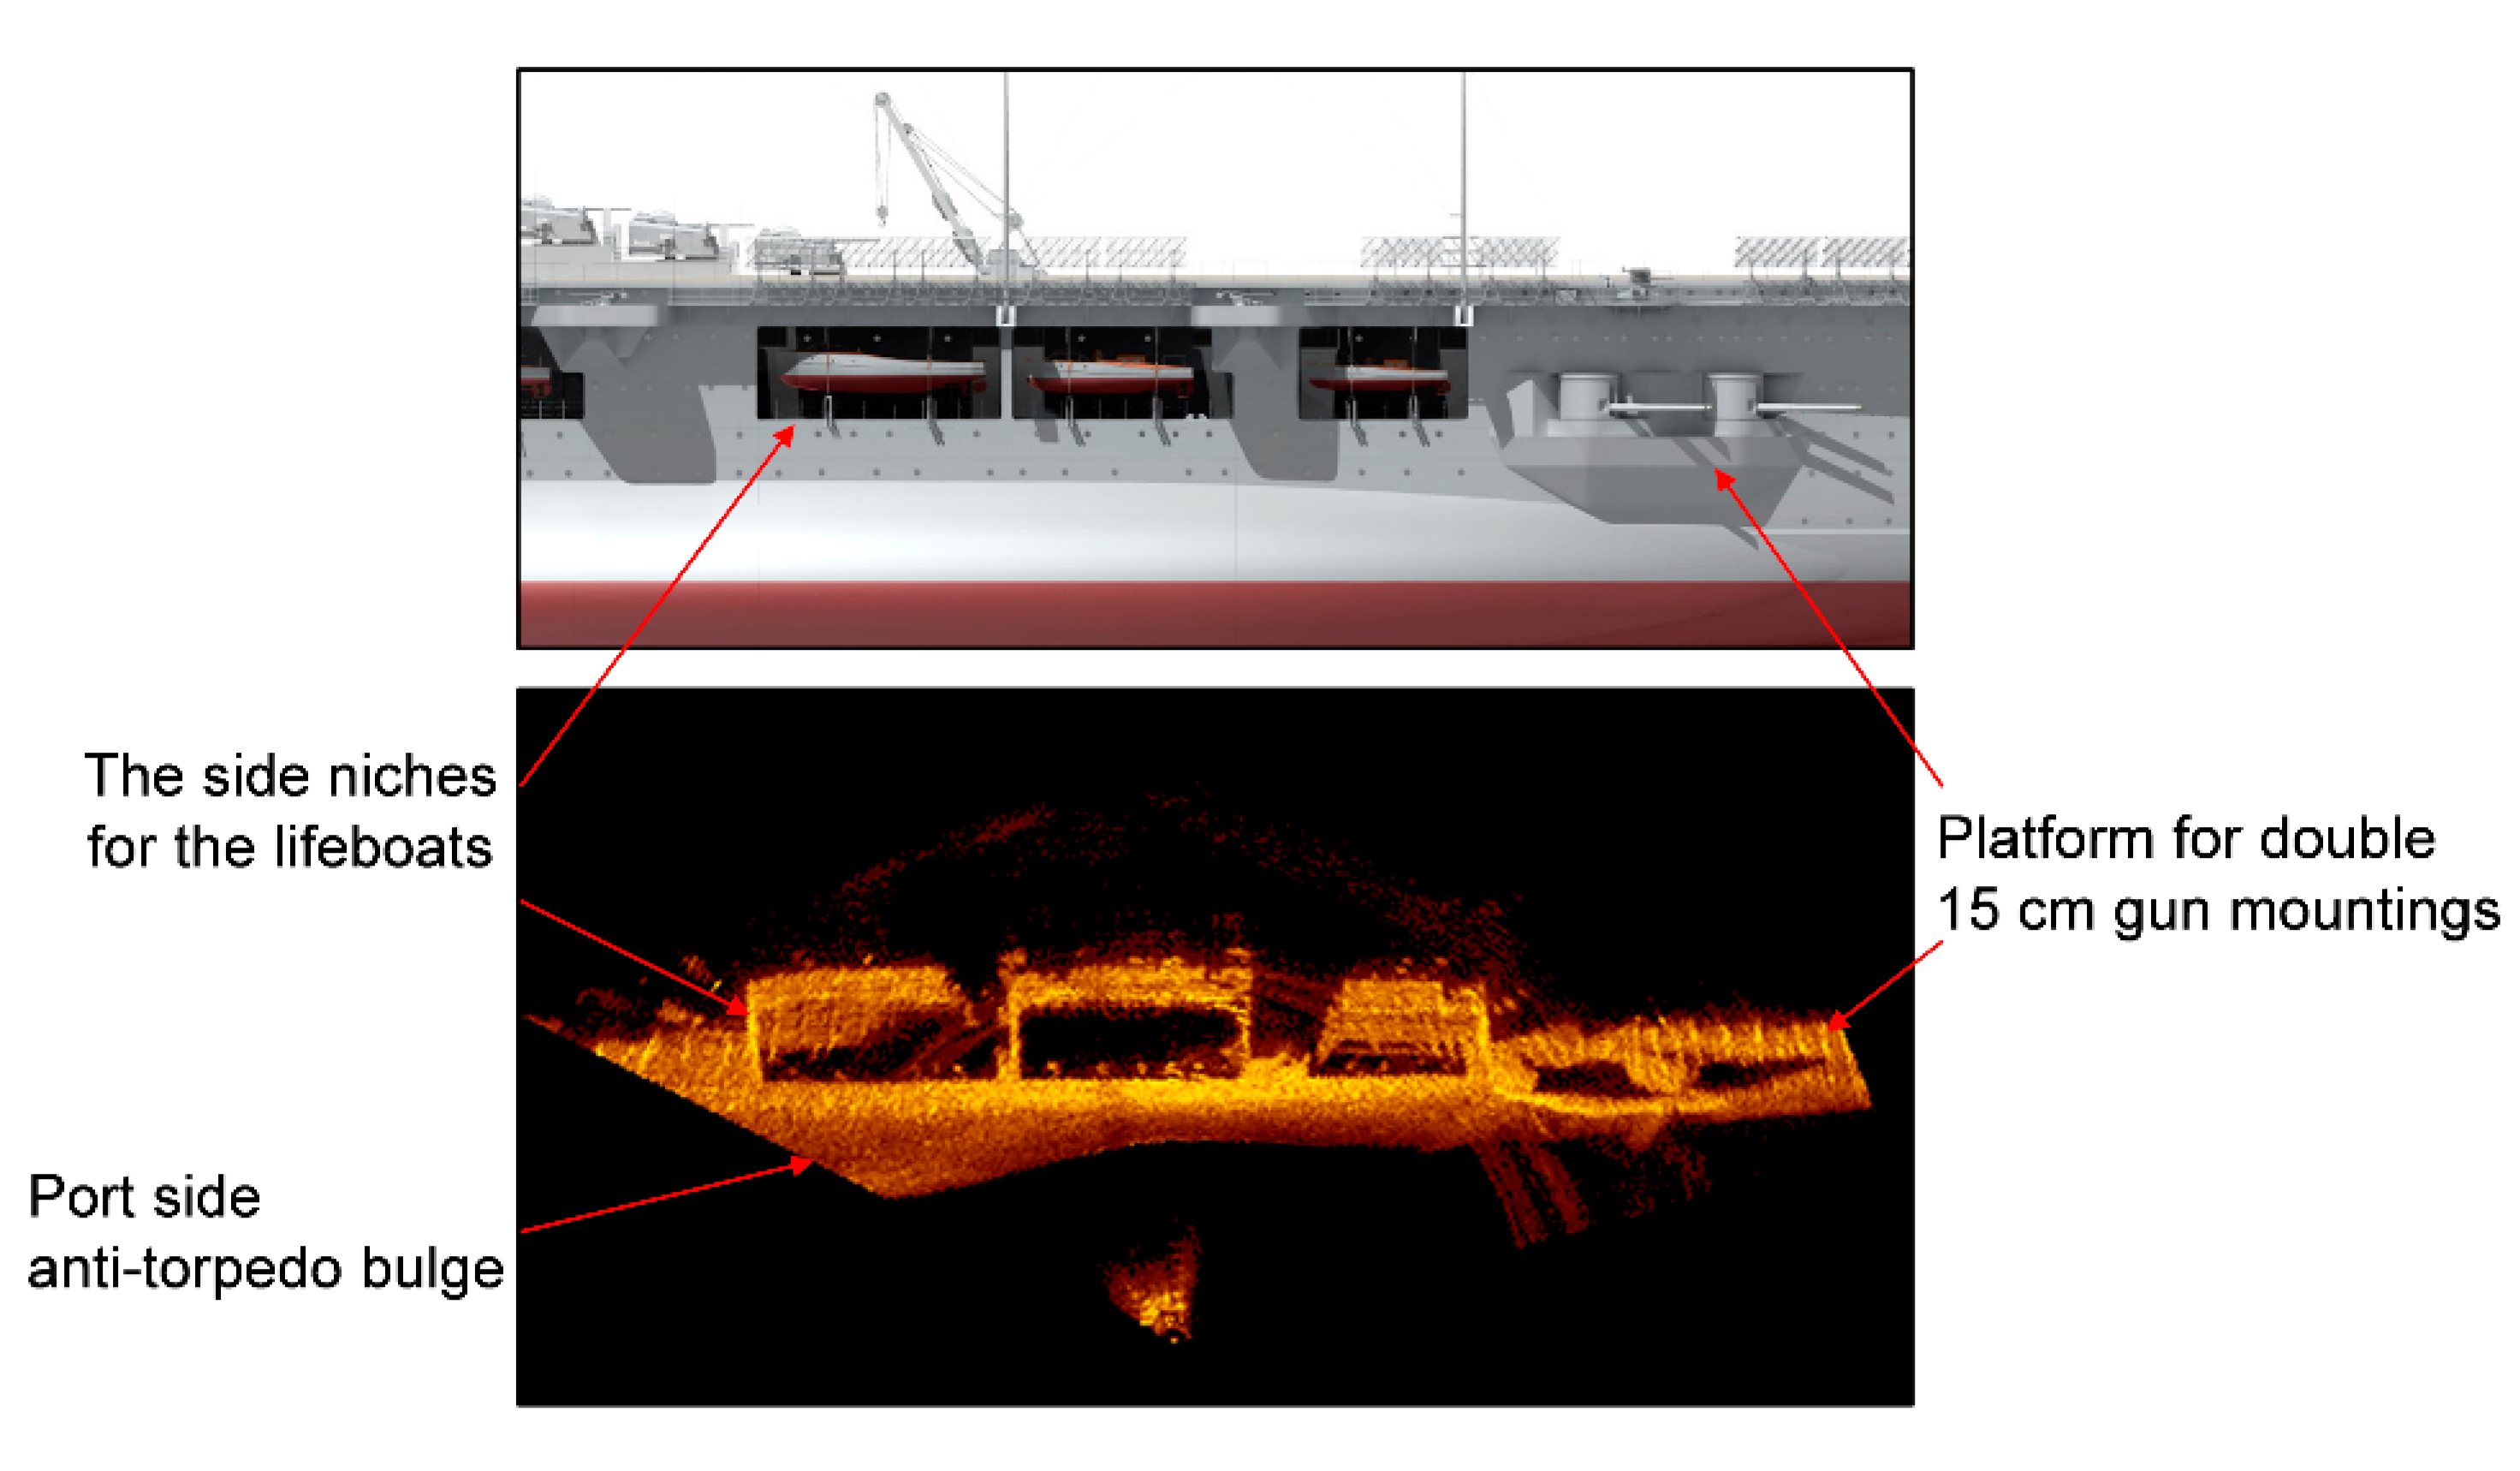
After the platform with the sonar was lowered to the seabed, the distance of the platform from the wreckage was first determined and then the clearance of the bottom around the sonar within the range of the hydroacoustic beam was checked. The objects detected and located were dimensioned, in particular those that obstructed the diver performing the underwater inspection (Figure 7). Selected sonar echoes were checked with the underwater ROV. In position 1, images were also recorded that showed a part of the left side of the wreckage (Figure 8). The sonar image shows 12 meter-long niches on the left side of the aircraft carrier. The lifeboats were to be placed in them. Additionally, there is a visible side structure designed for double trailers of the 15 cm main artillery guns.
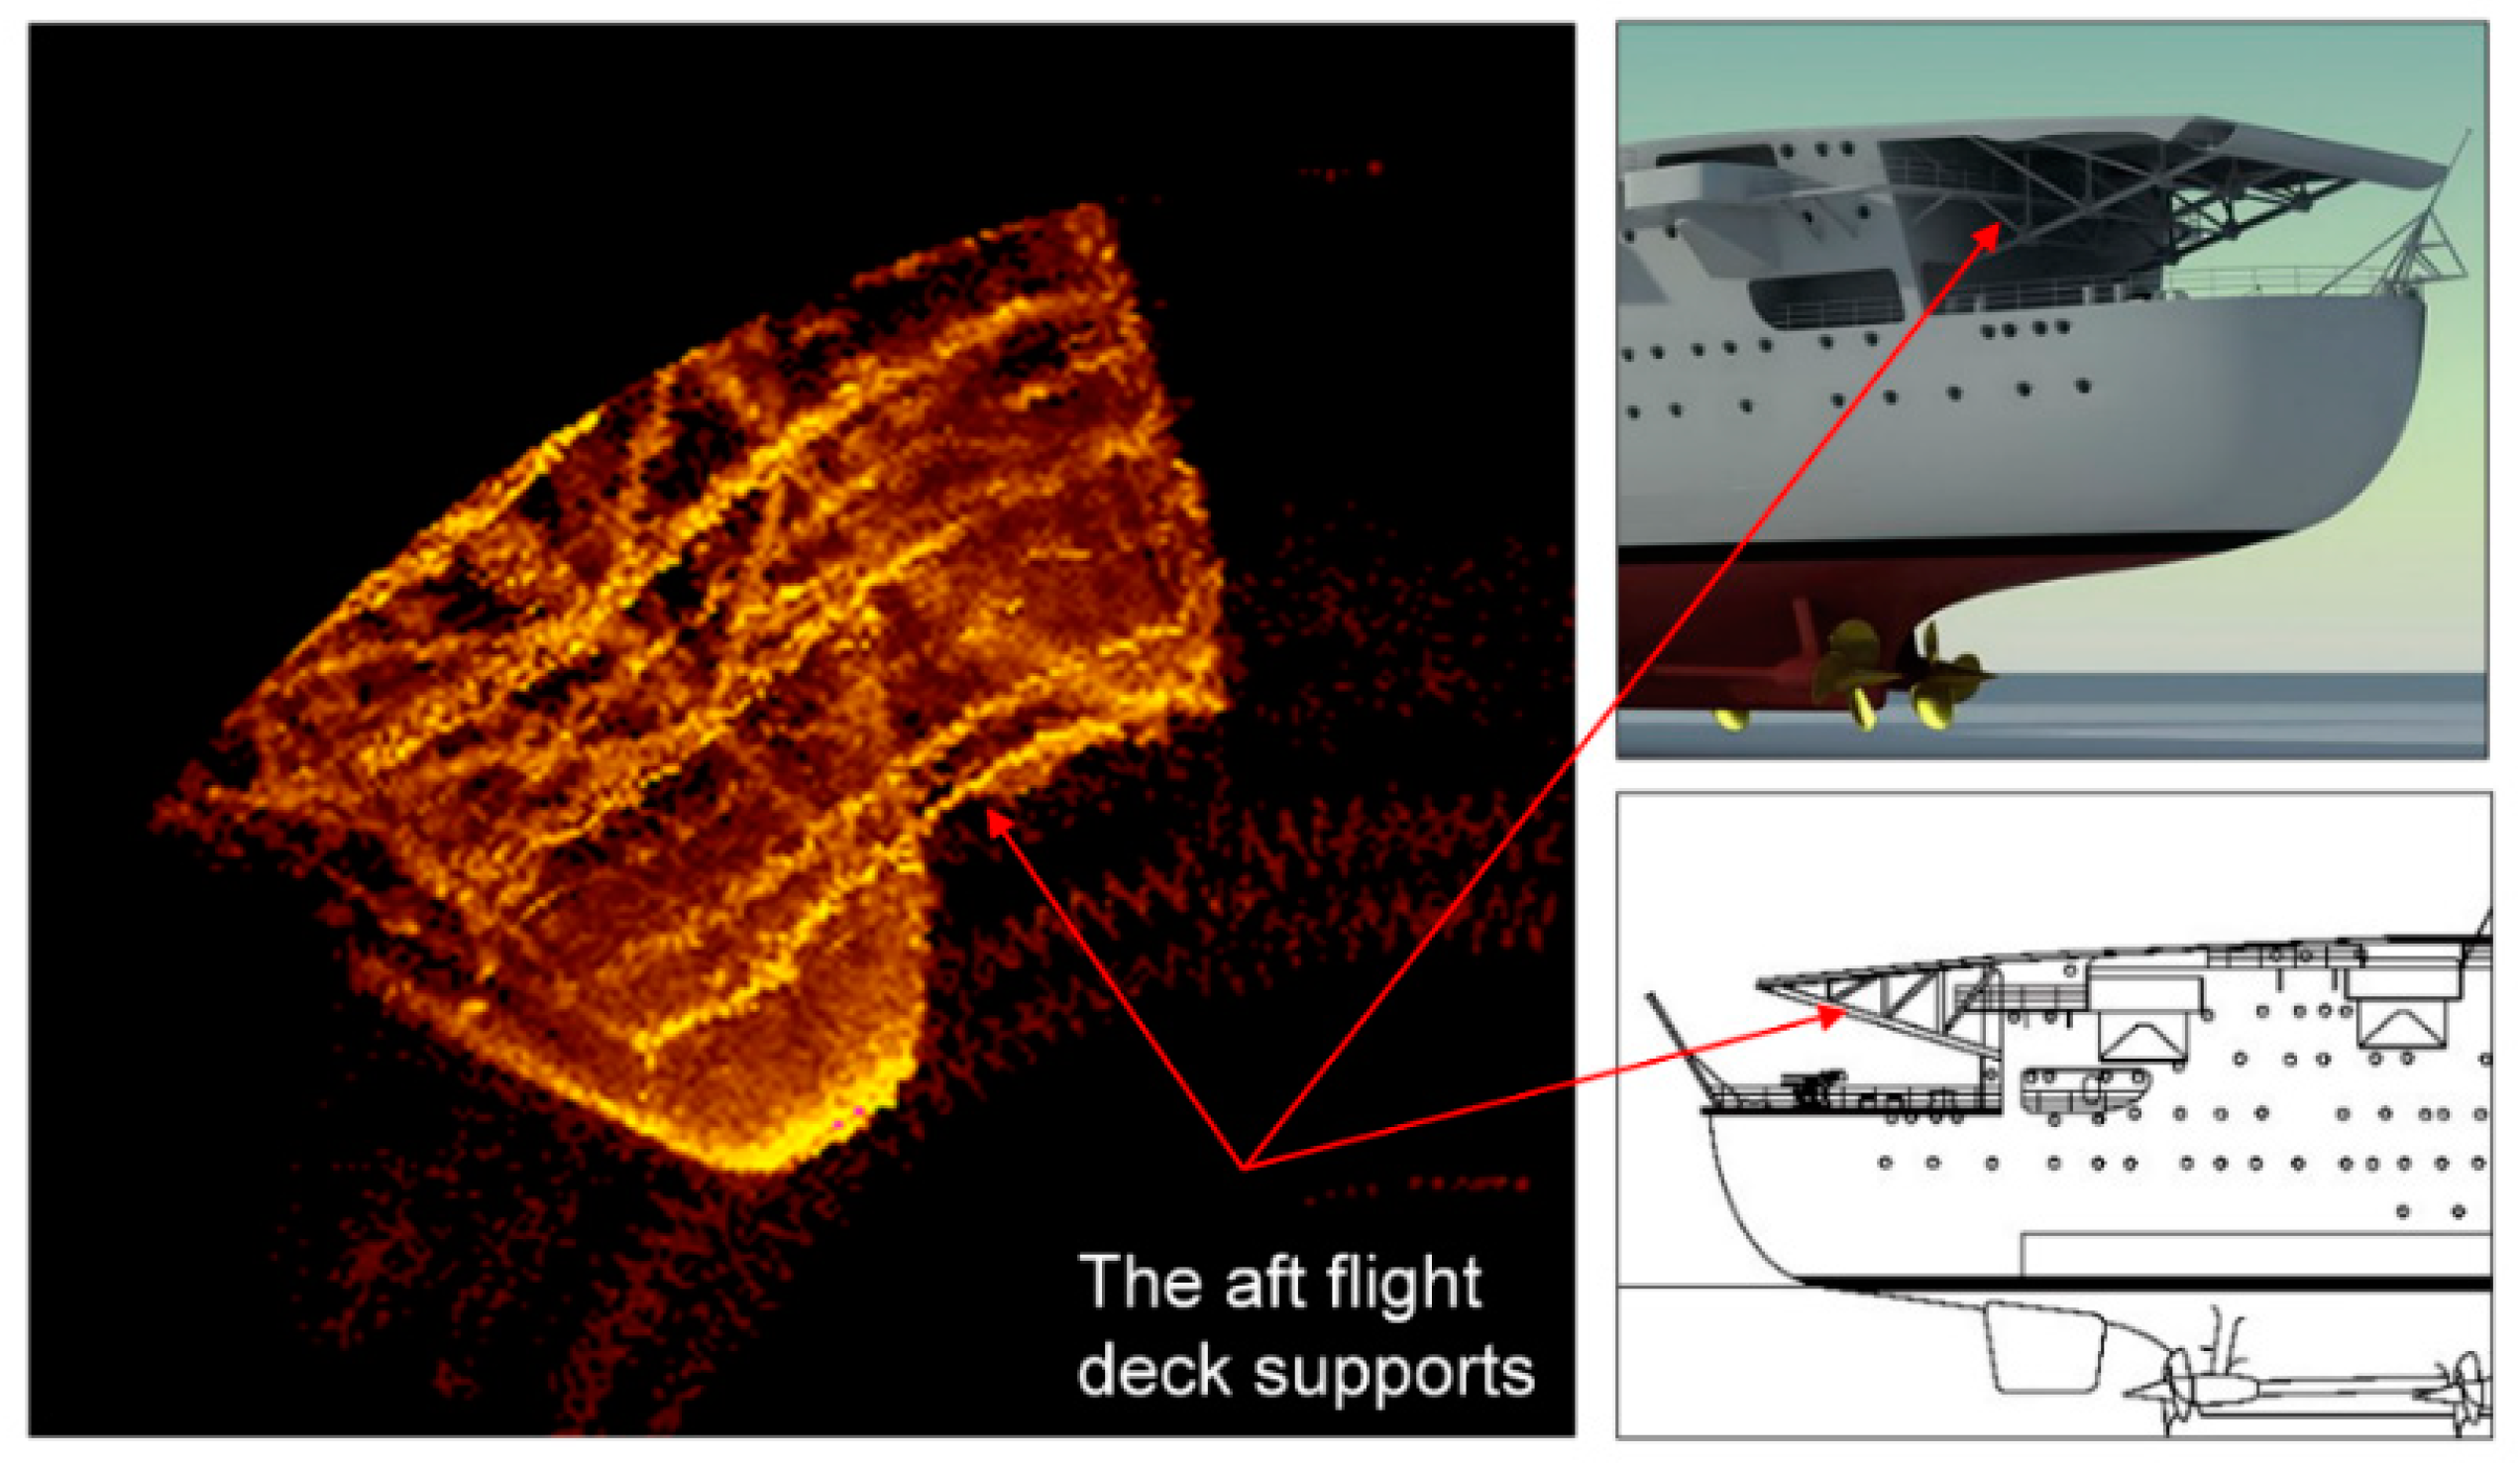
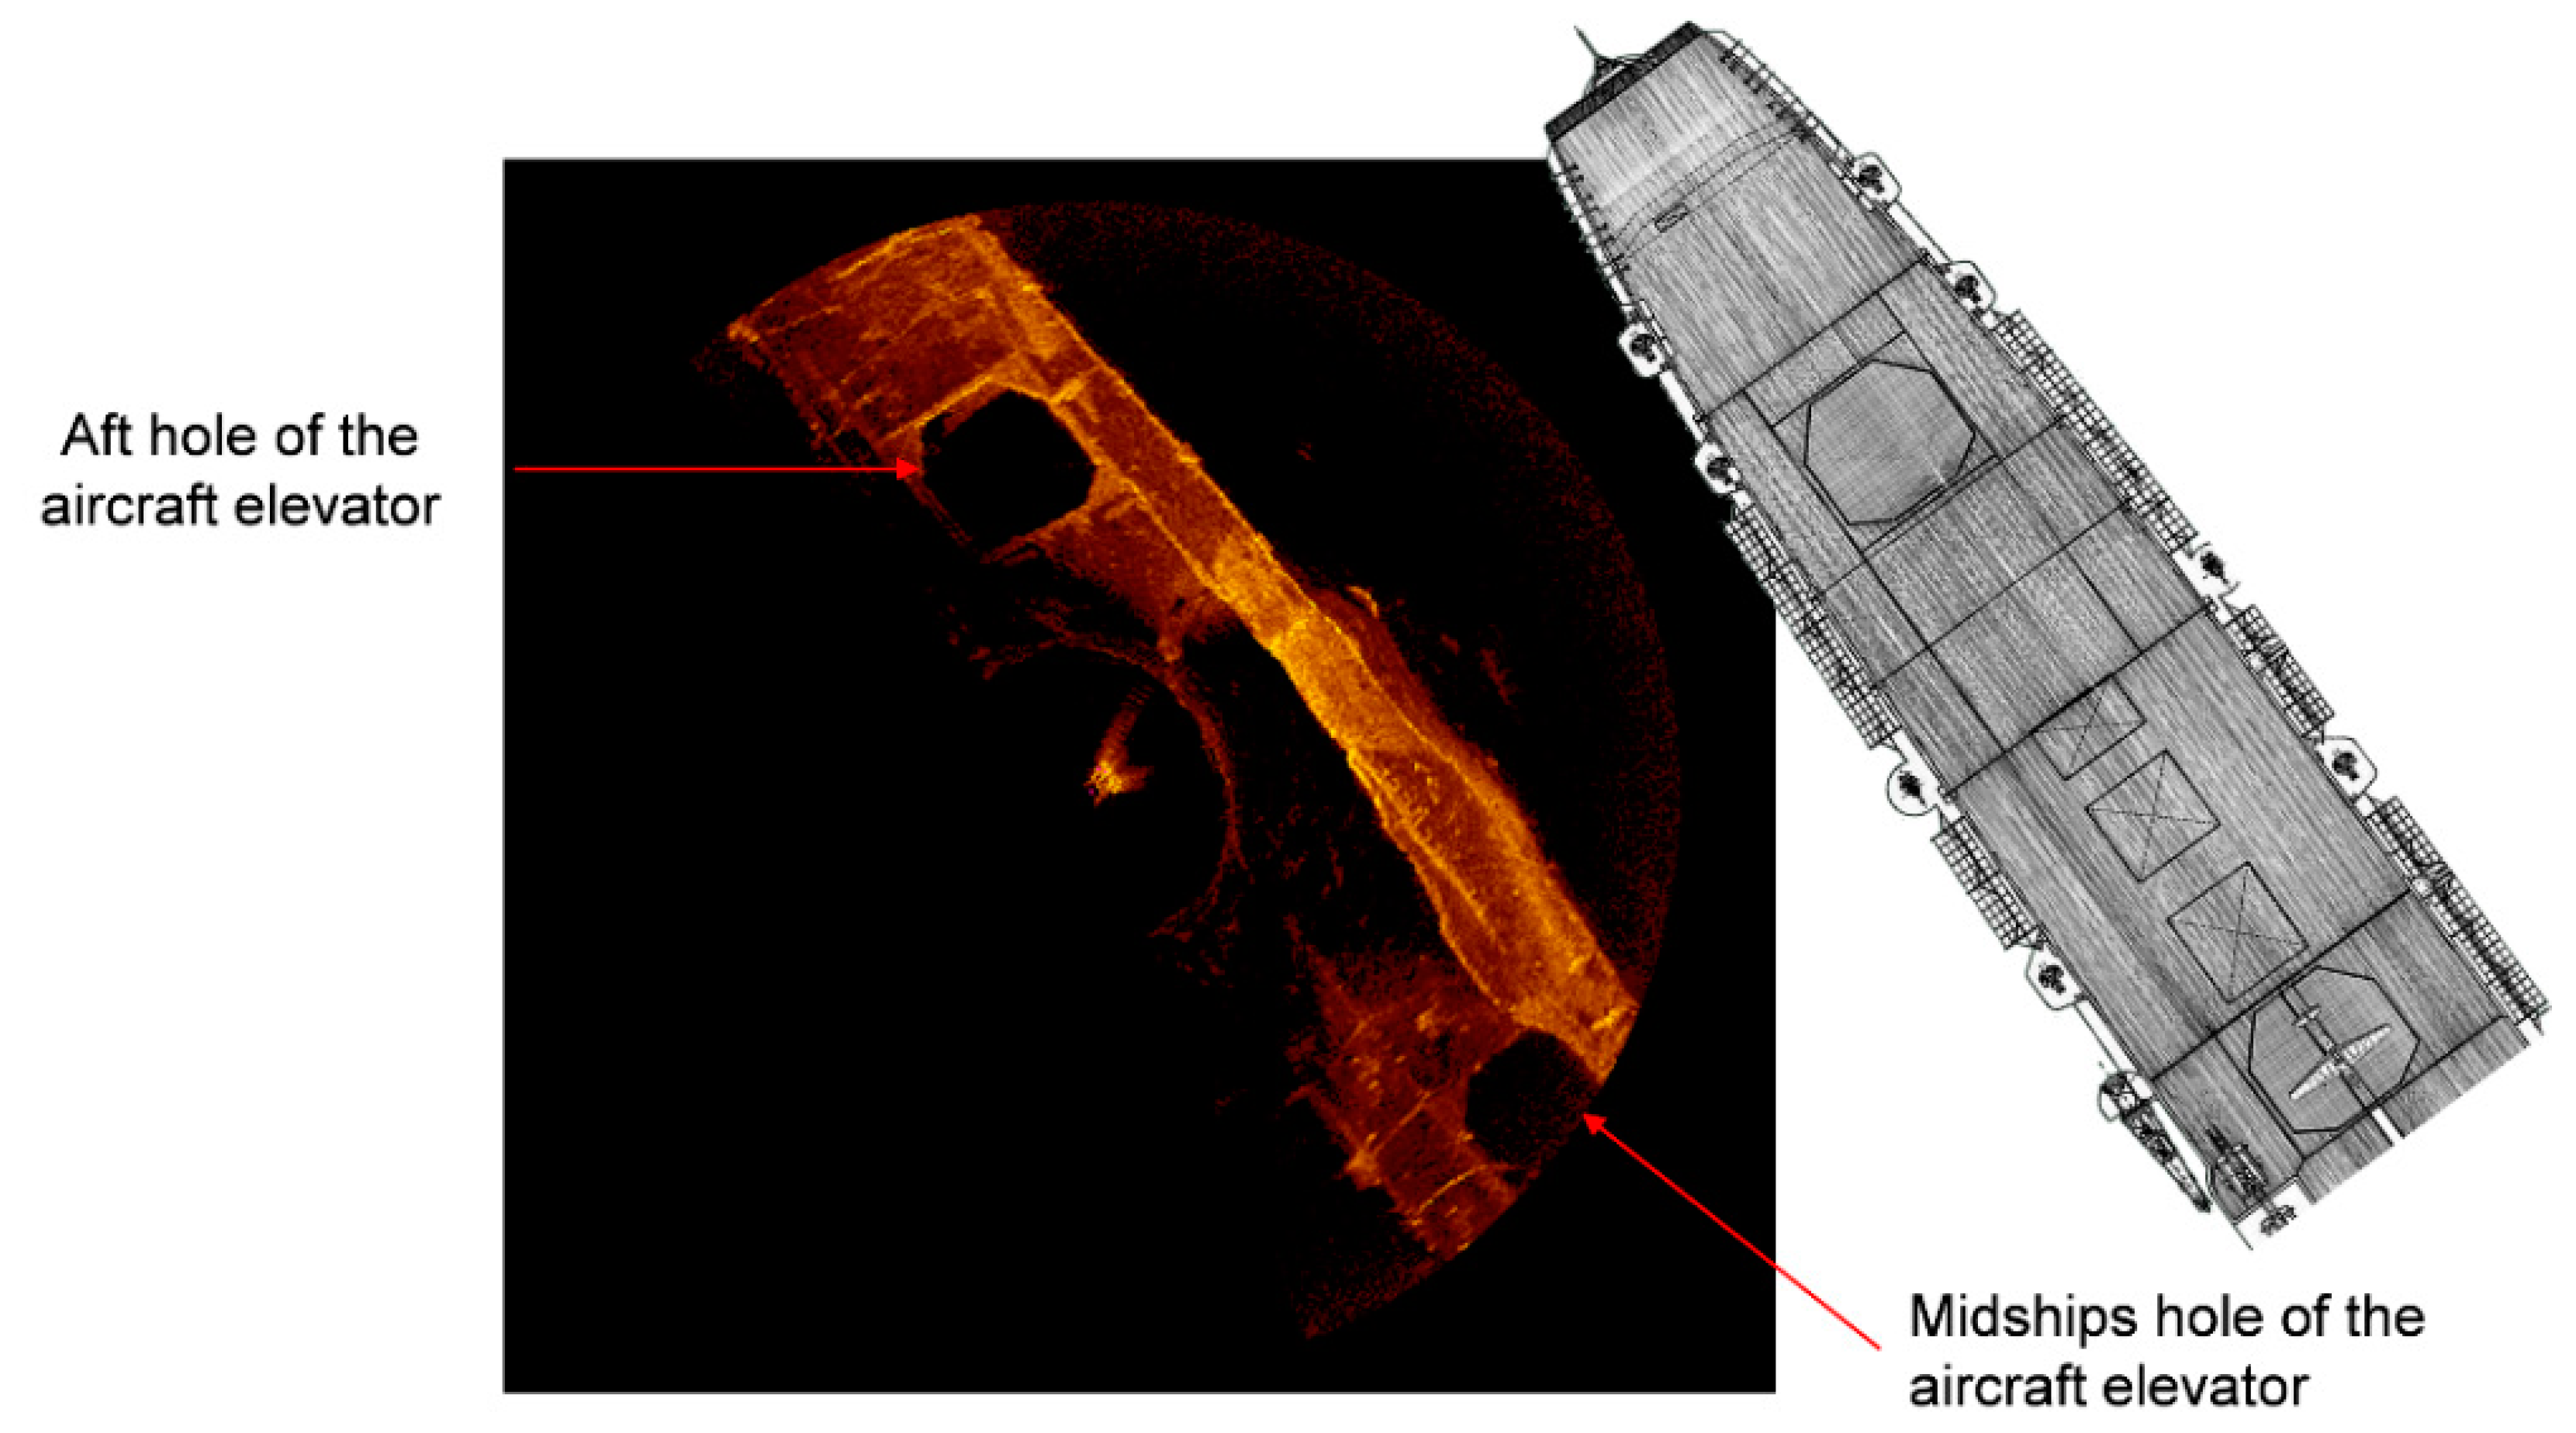
In positions 2, 3, and 4, several sonar images representing the stern part of the wreckage were recorded (Figure 9 and Figure 10). In position 4, the diving platform was located 19 meters from the stern of the carrier. Sonar captured a part of the stern with the overhanging flight deck at this point. Of note are the brackets supporting the take-off deck, visible in the sonogram (Figure 9). Thanks to the measurements in positions 2 and 3, interesting sonograms showing octagonal holes, where aircraft elevators were installed, were collected (Figure 10).
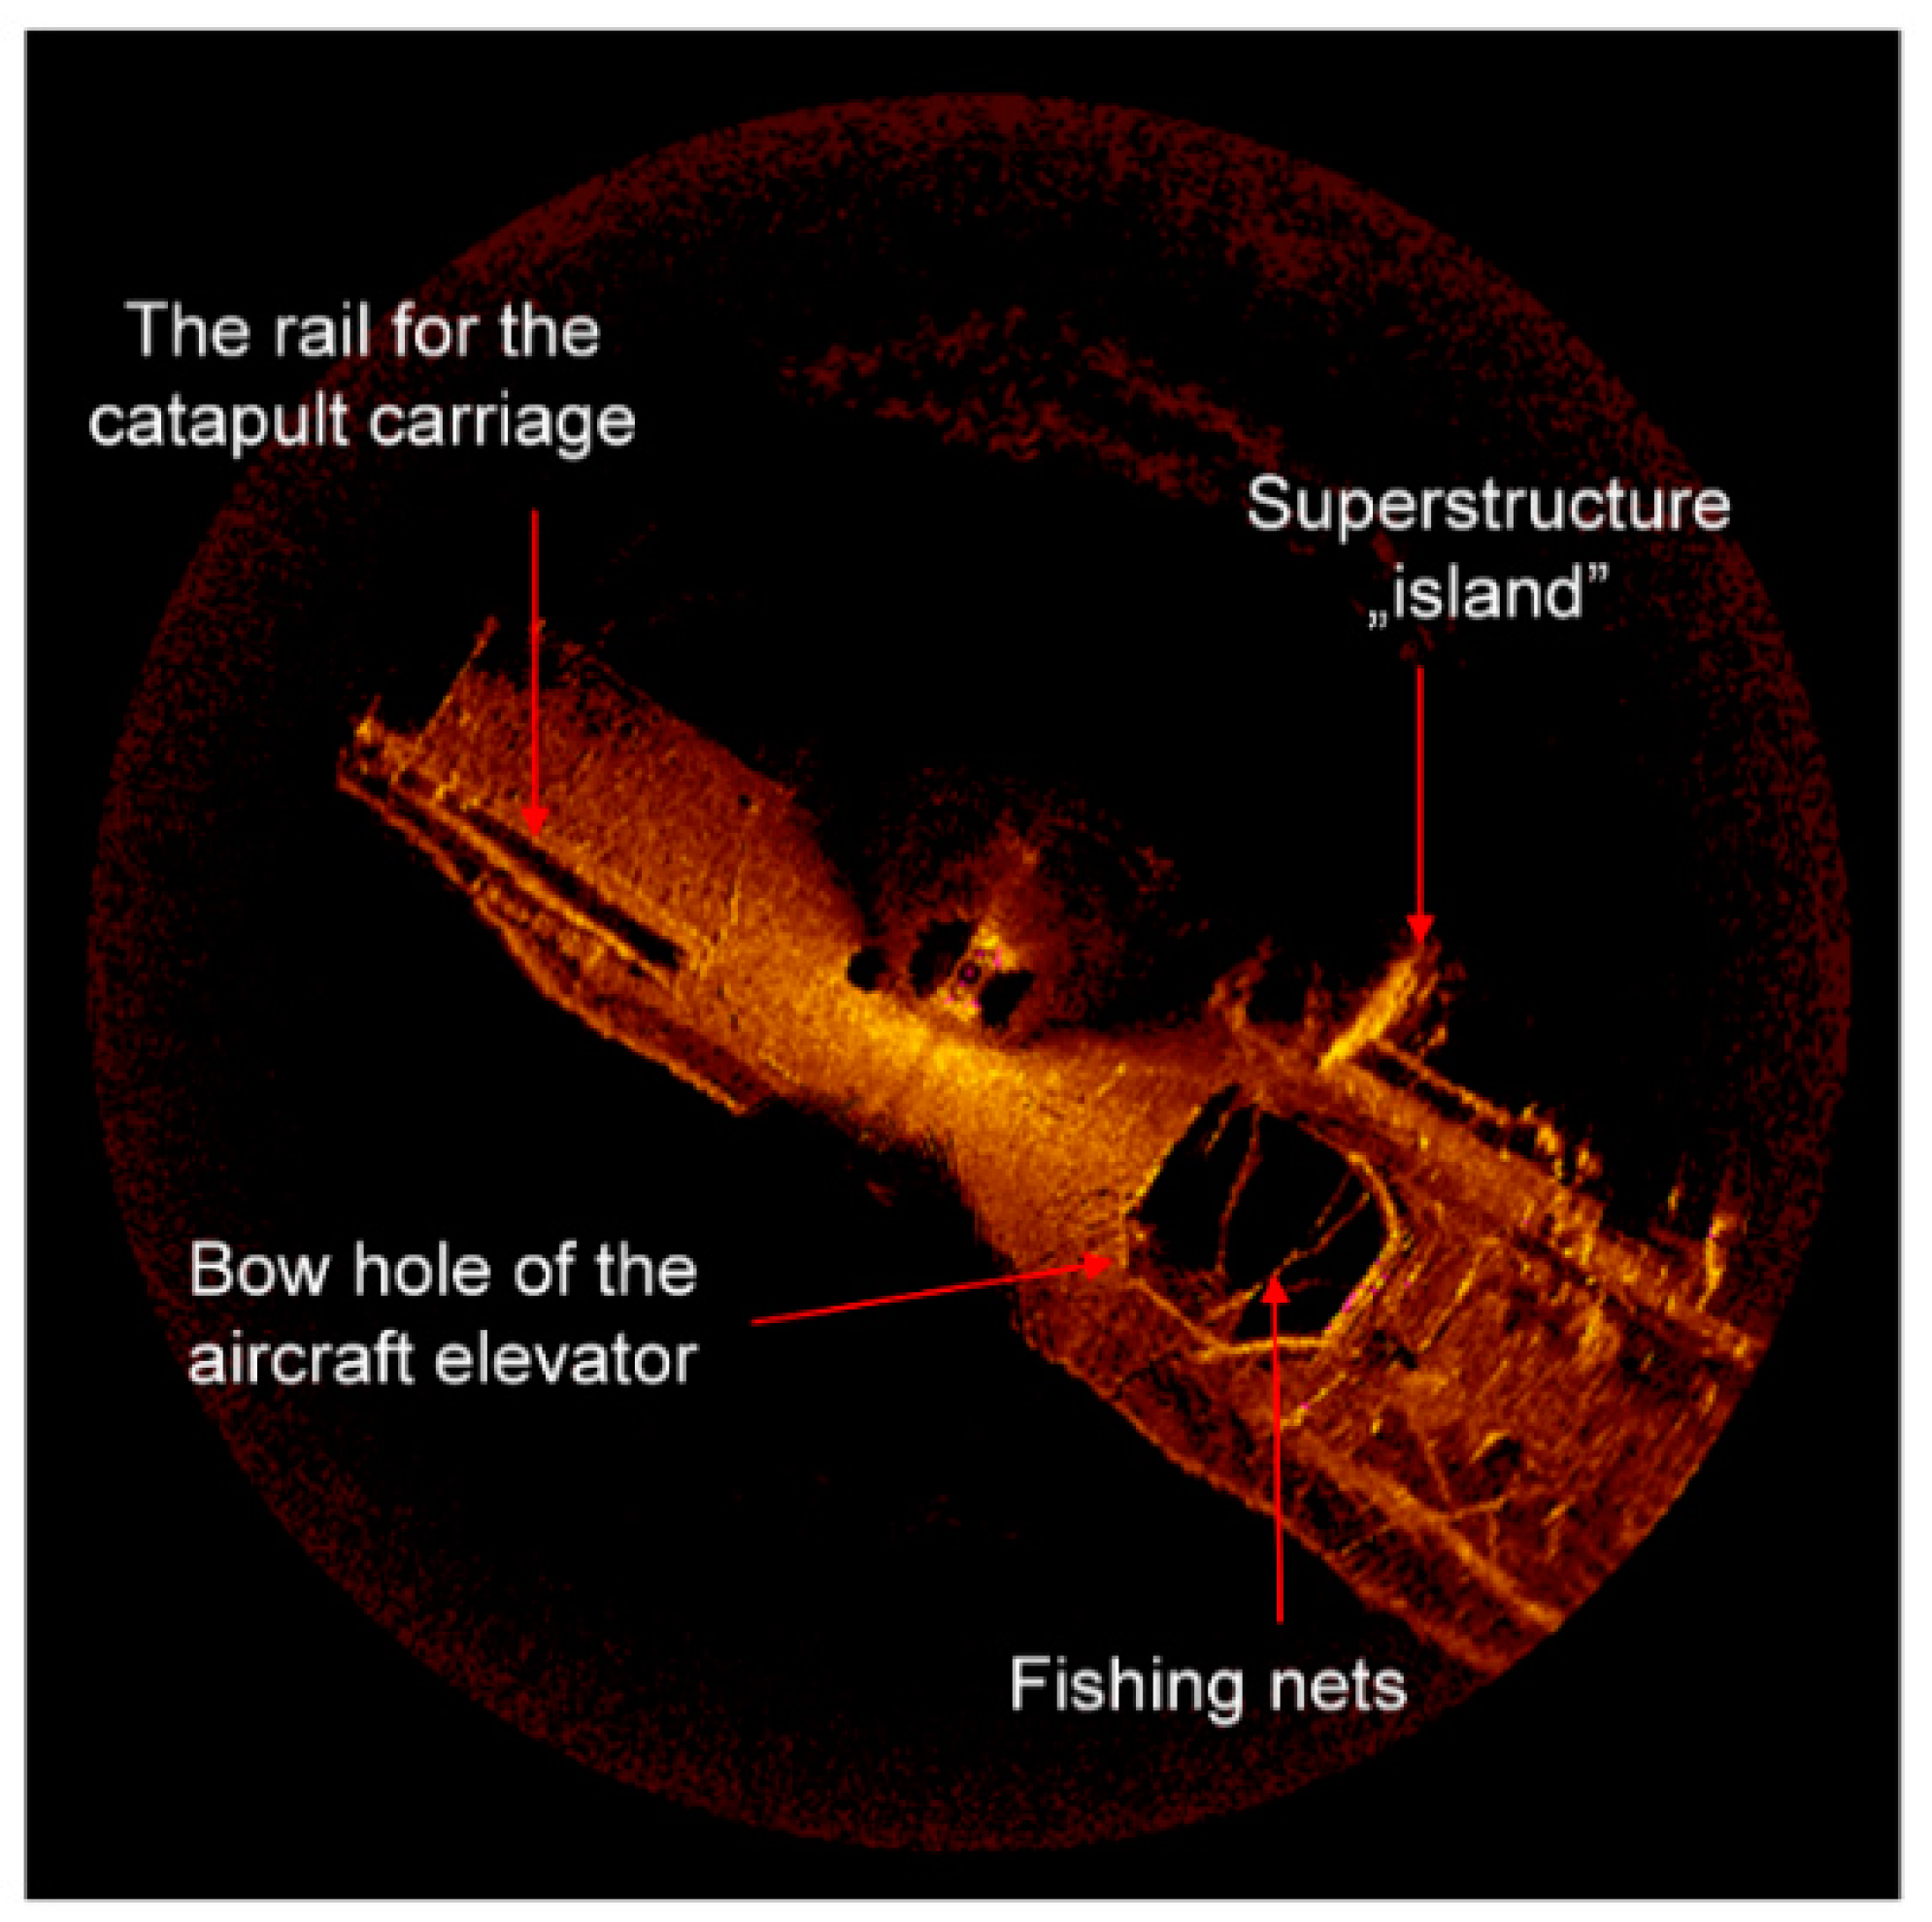
In positions 5 and 6, sonar measurements were taken on the bow of the Graf Zeppelin aircraft carrier. There is a third octagonal opening of the aircraft elevator with visible ropes and nets going inside (Figure 11). Next to it, on the starboard side, there is a superstructure that was damaged in a large part. The deck in this part is damaged, with holes with the diameter of 2 meters, probably caused by Russian weapons in 1947.
As a result of the survey work, a very rich collection of sonar images was obtained and digital models of the seabed were prepared, based on bathymetric data. The sonar images of the seabed surface and of the elements of the hull of the wreckage were digitally processed. The wreckage, resting at a depth of 87 meters, with a 34° tilt to starboard, was additionally filmed with a TV camera mounted on a Super Achille underwater vehicle. The hull of the vessel did not lose its integrity and is well preserved. No objects of military origin were found on the wreckage and in its immediate vicinity. On the other hand, numerous fishing nets were observed, especially in the stern and bow sections, in some cases including floats and fishing buoys. Numerous underwater obstacles were detected which may pose a risk to divers and to fishing gear used by fishermen.
3.2. Case Two—Search for a Diving Apparatus
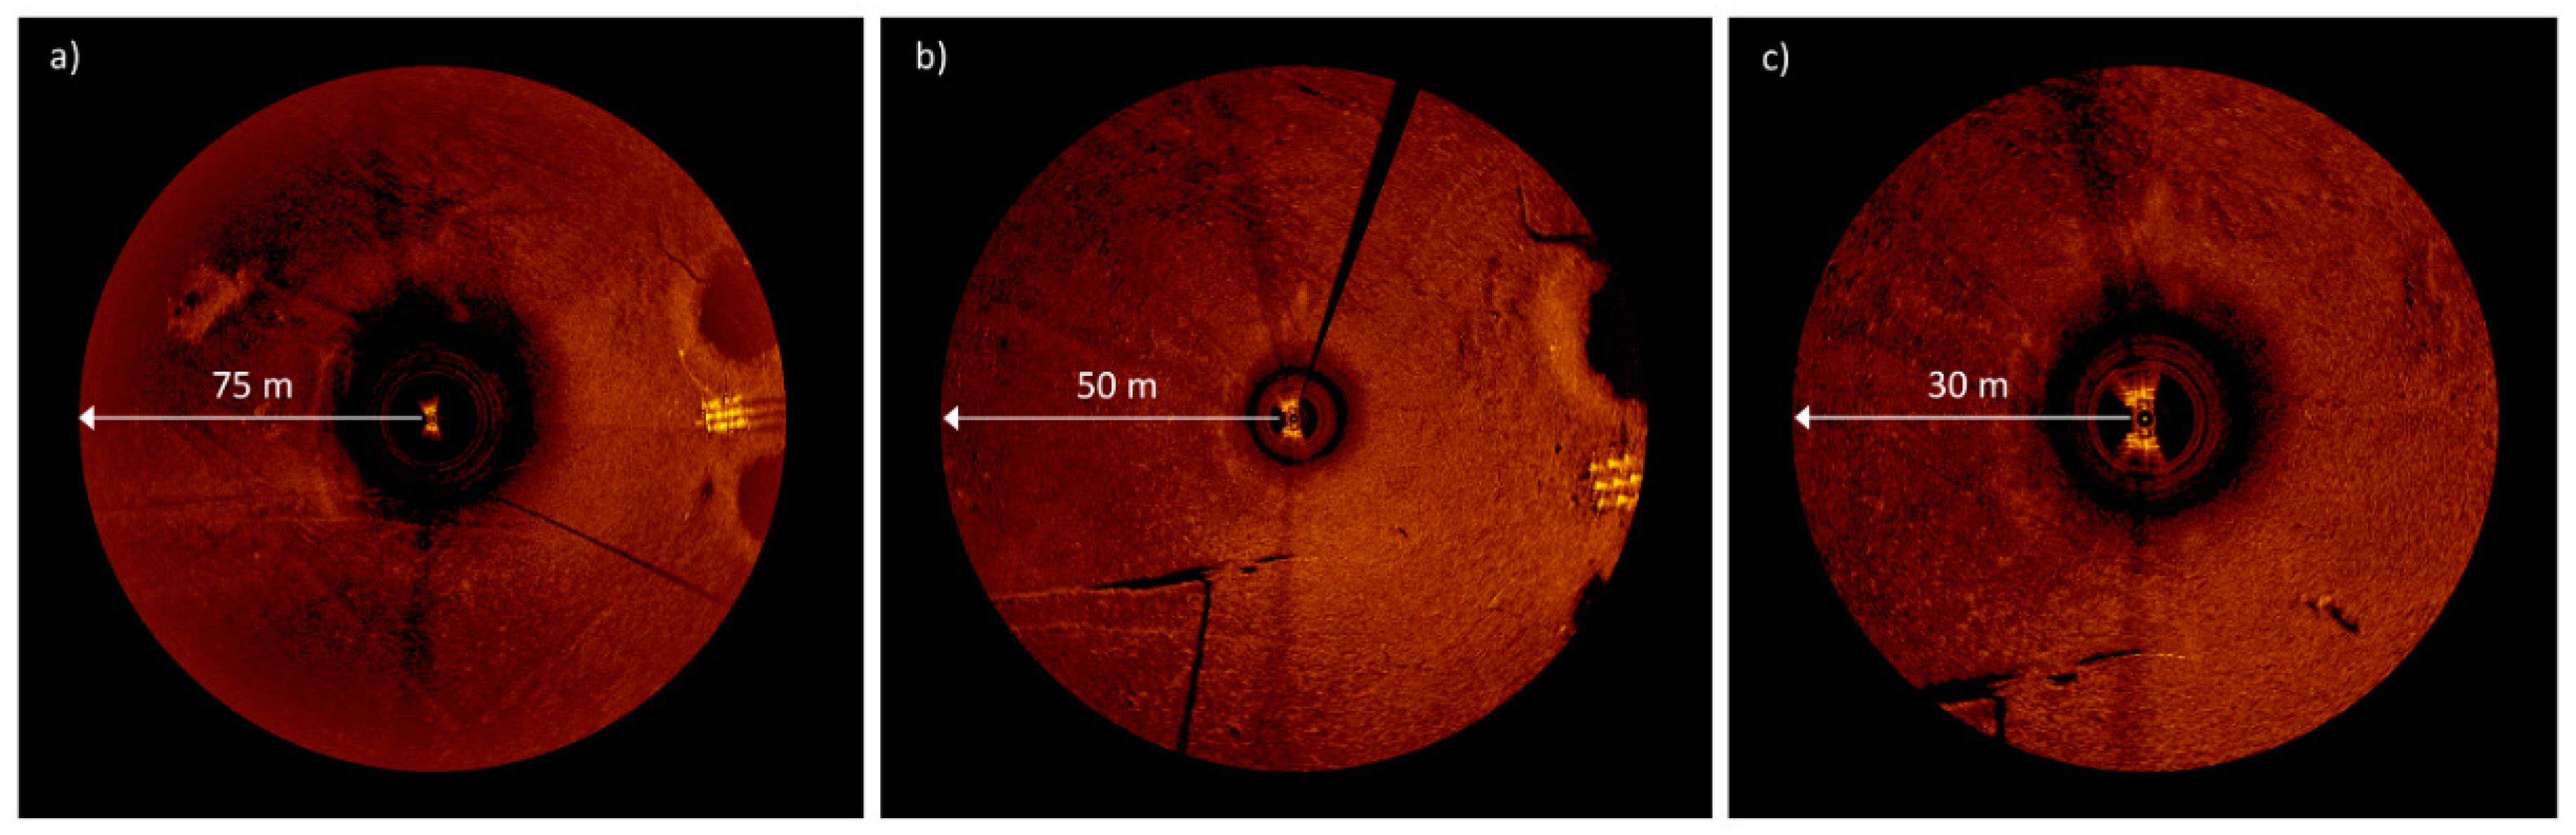
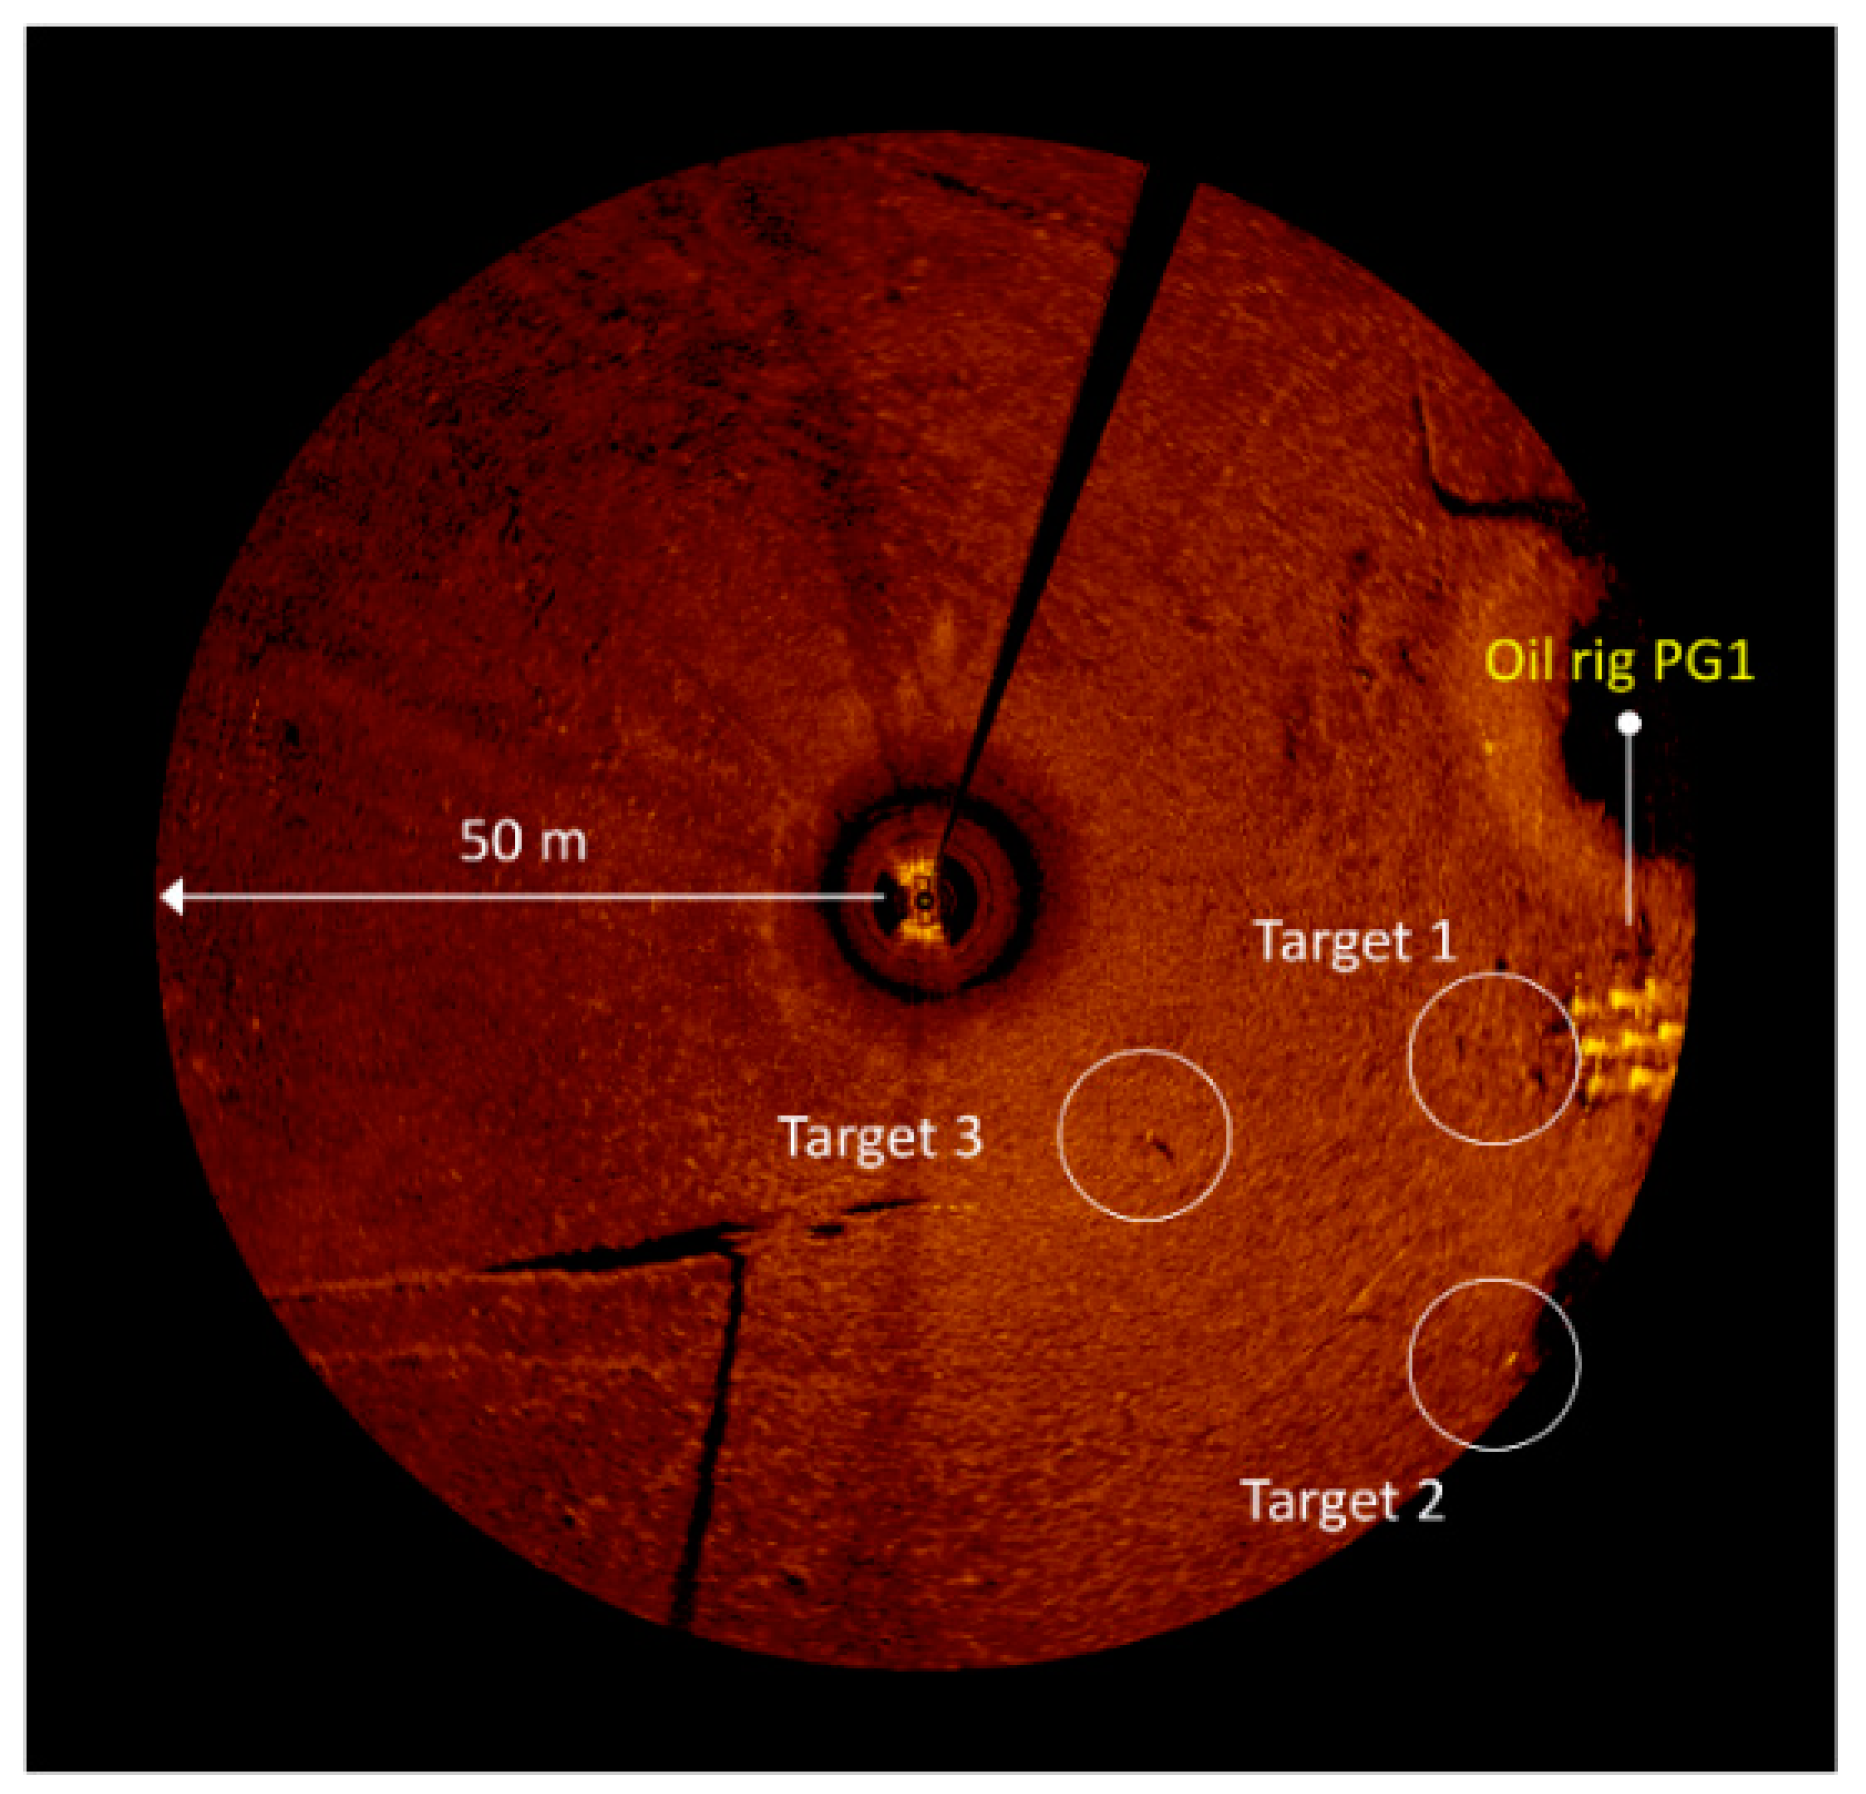
Another test for the new technique was the search for a small object (a diving apparatus), just 86 cm long, resting at the depth of 82 meters. The location where the object sank was only probable. Considering the size of the object and the depth, this was quite a challenge and a real test for the proposed technique. Preliminary scans were carried out at the range of 75 m, which allowed for an indicative survey of the seabed. A search was then carried out at the range of 50 and 30 m (Figure 12). Based on an analysis of the acoustic shadow, several sonar echoes were selected (Figure 13). Not all registered underwater objects were identified and only those that were the most similar in size to the object being searched for were selected. Visual identification was performed by means of a ROV underwater vehicle, which was guided to the designated positions by determining the distance and the location of the target. The first echo was a paint container, the second was an oval metal object, and the third was the diving apparatus that was searched for (Figure 14).
3.3. Case Three—Rescue of the Crew of a Submarine Lying on the Seabed
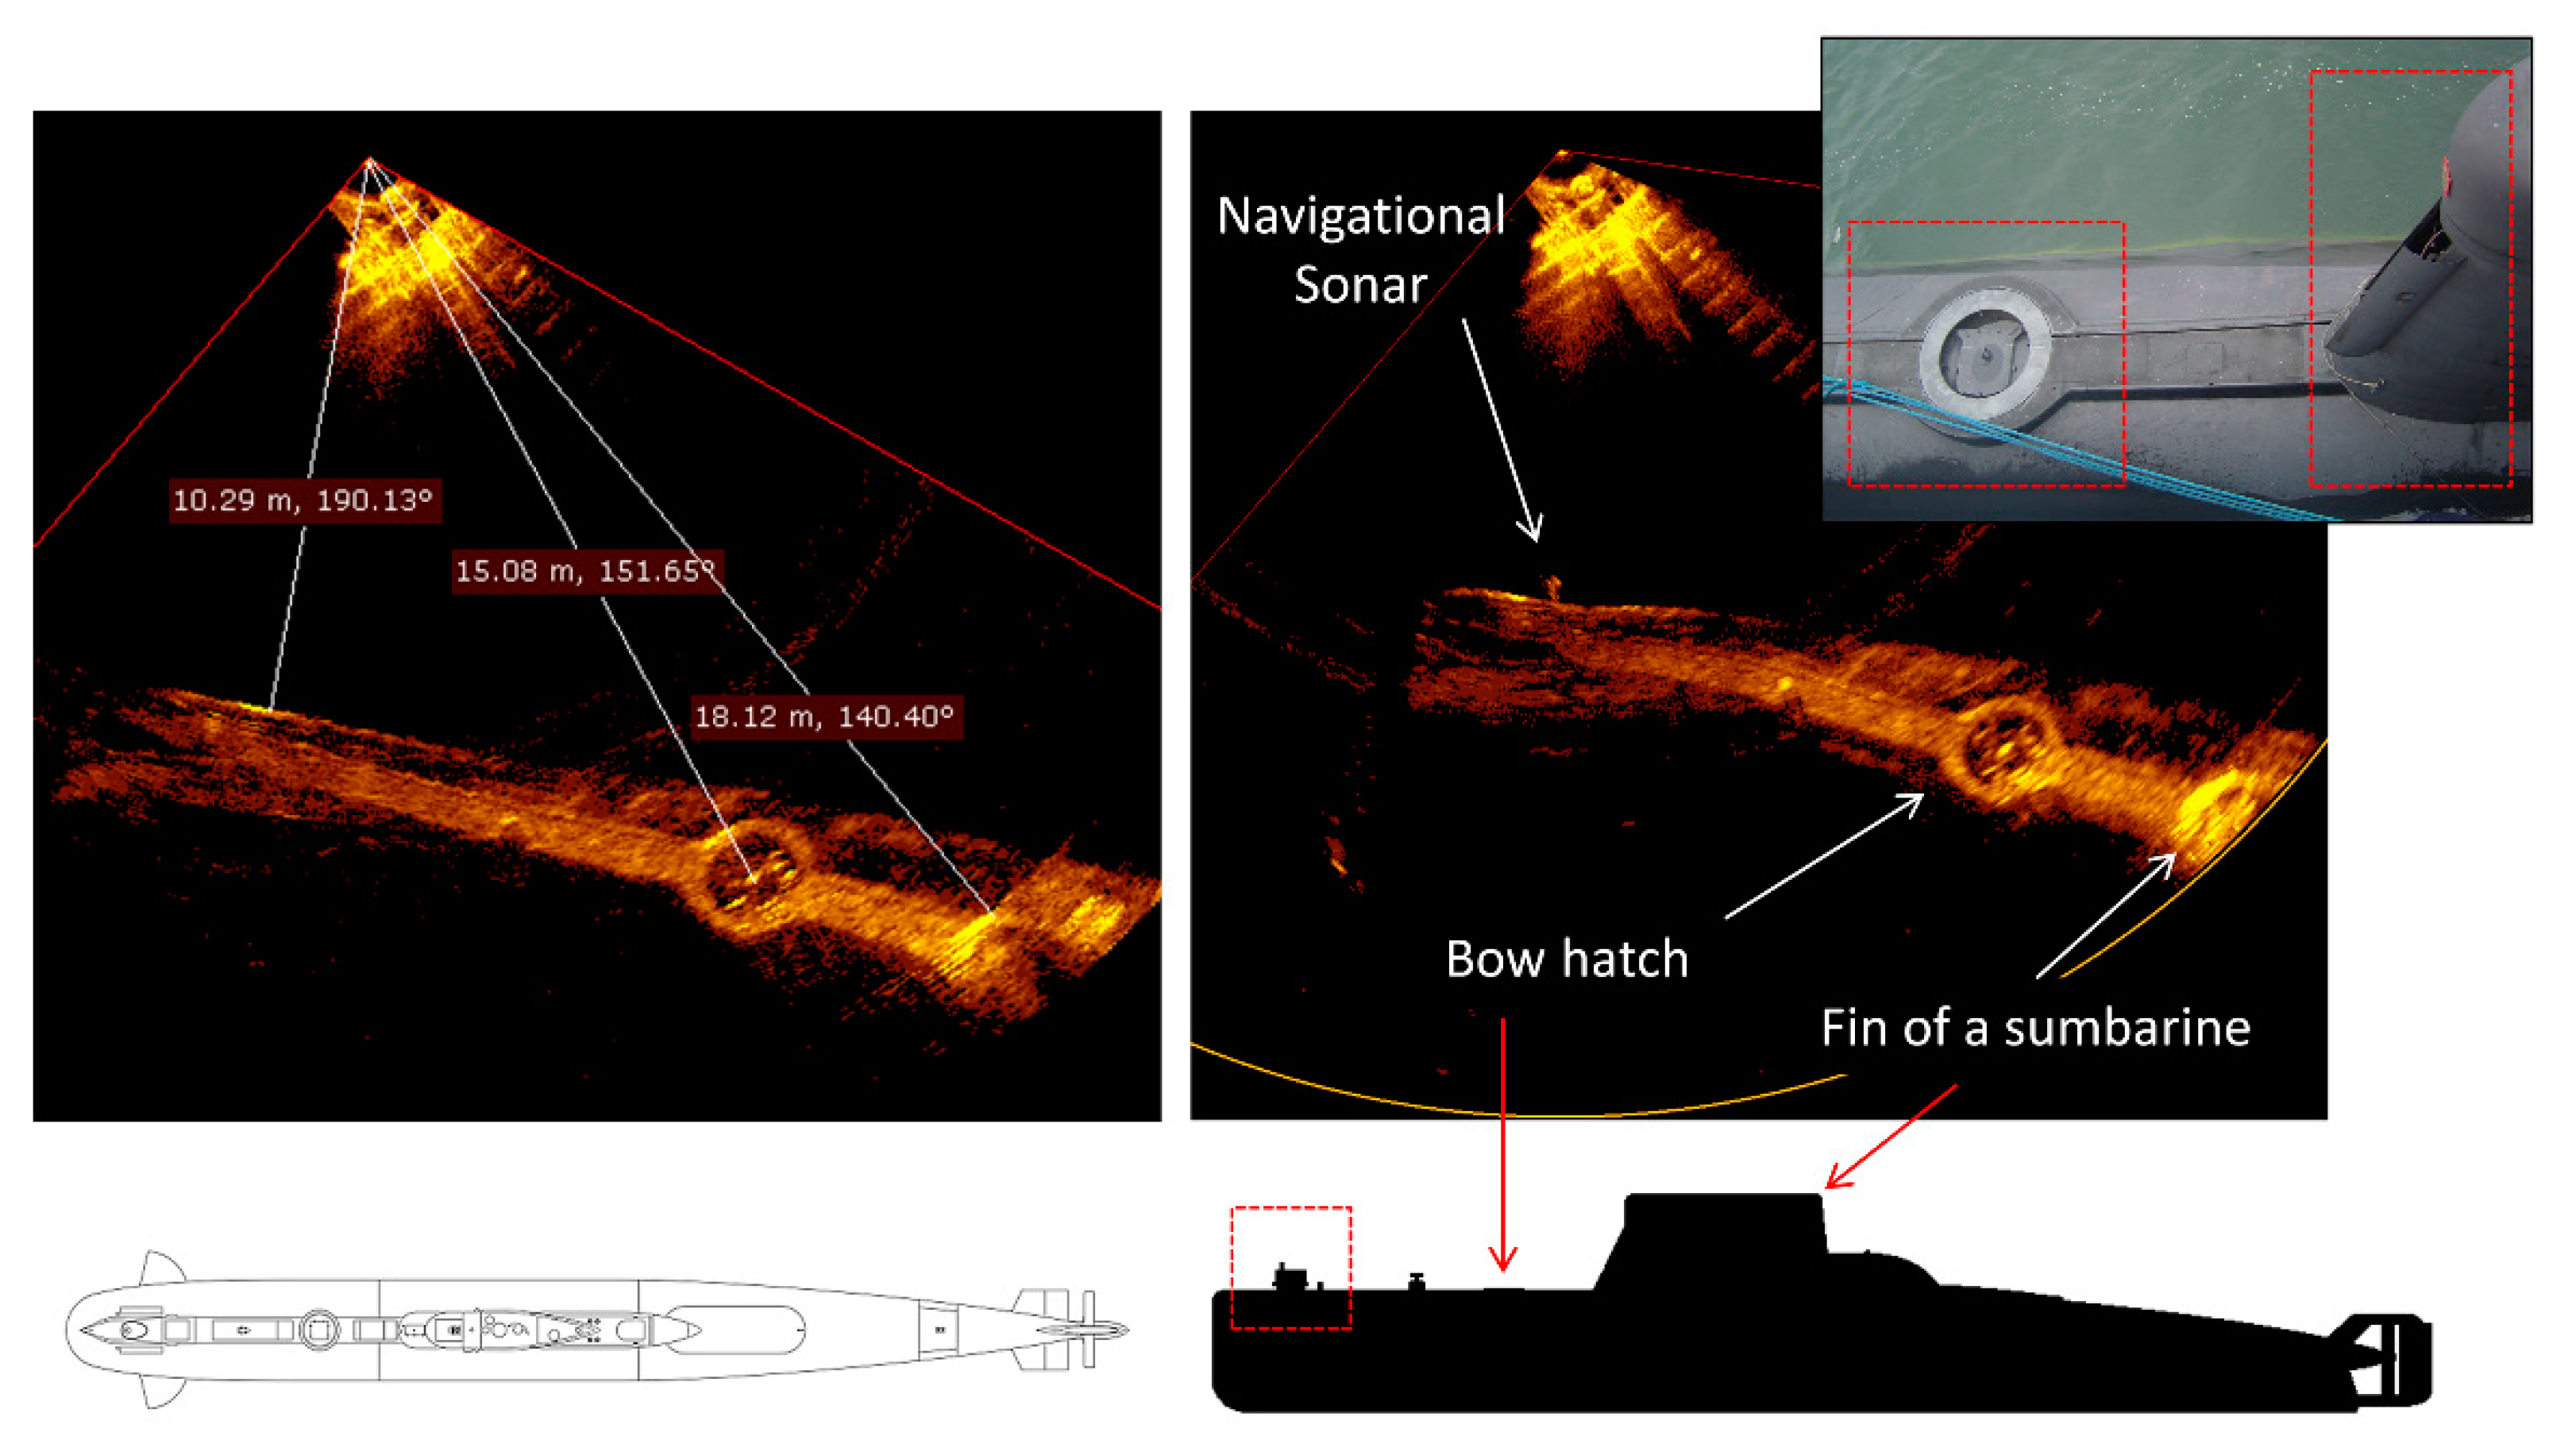
The new technique for use of the MS 1000 scanning sonar provides favorable conditions for support of search for a missing submarine and rescue of its crew. Such a scenario was tested during a national maritime exercise. A submarine with a defect rested on the seabed. The main objective of the exercise was to improve cooperation between ships, maritime aviation, on-duty services, specialists, medical centers, and civil agencies in the event of a failure of a submarine resting on the seabed. Once the defective submarine was found on the seabed, a rescue ship was sent to provide help. For this purpose, the rescue ship with four anchors was placed above the submarine. An underwater reconnaissance group composed of hydrographers using a portable scanning sonar took measurements to determine the position of the submarine in relation to the rescue ship. The submarine was located and then the distances to the bow, the manhole, the fin of a submarine, etc., were determined. After initial measurements, it turned out that the submarine was too far away from the diving platform. Using the anchor ropes, the position of rescue ship was slightly changed. The target was dimensioned, its orientation was determined, and several sonar images were recorded (Figure 15 and Figure 16).
3.4. Case Four—Search for a Hall-Type Anchor
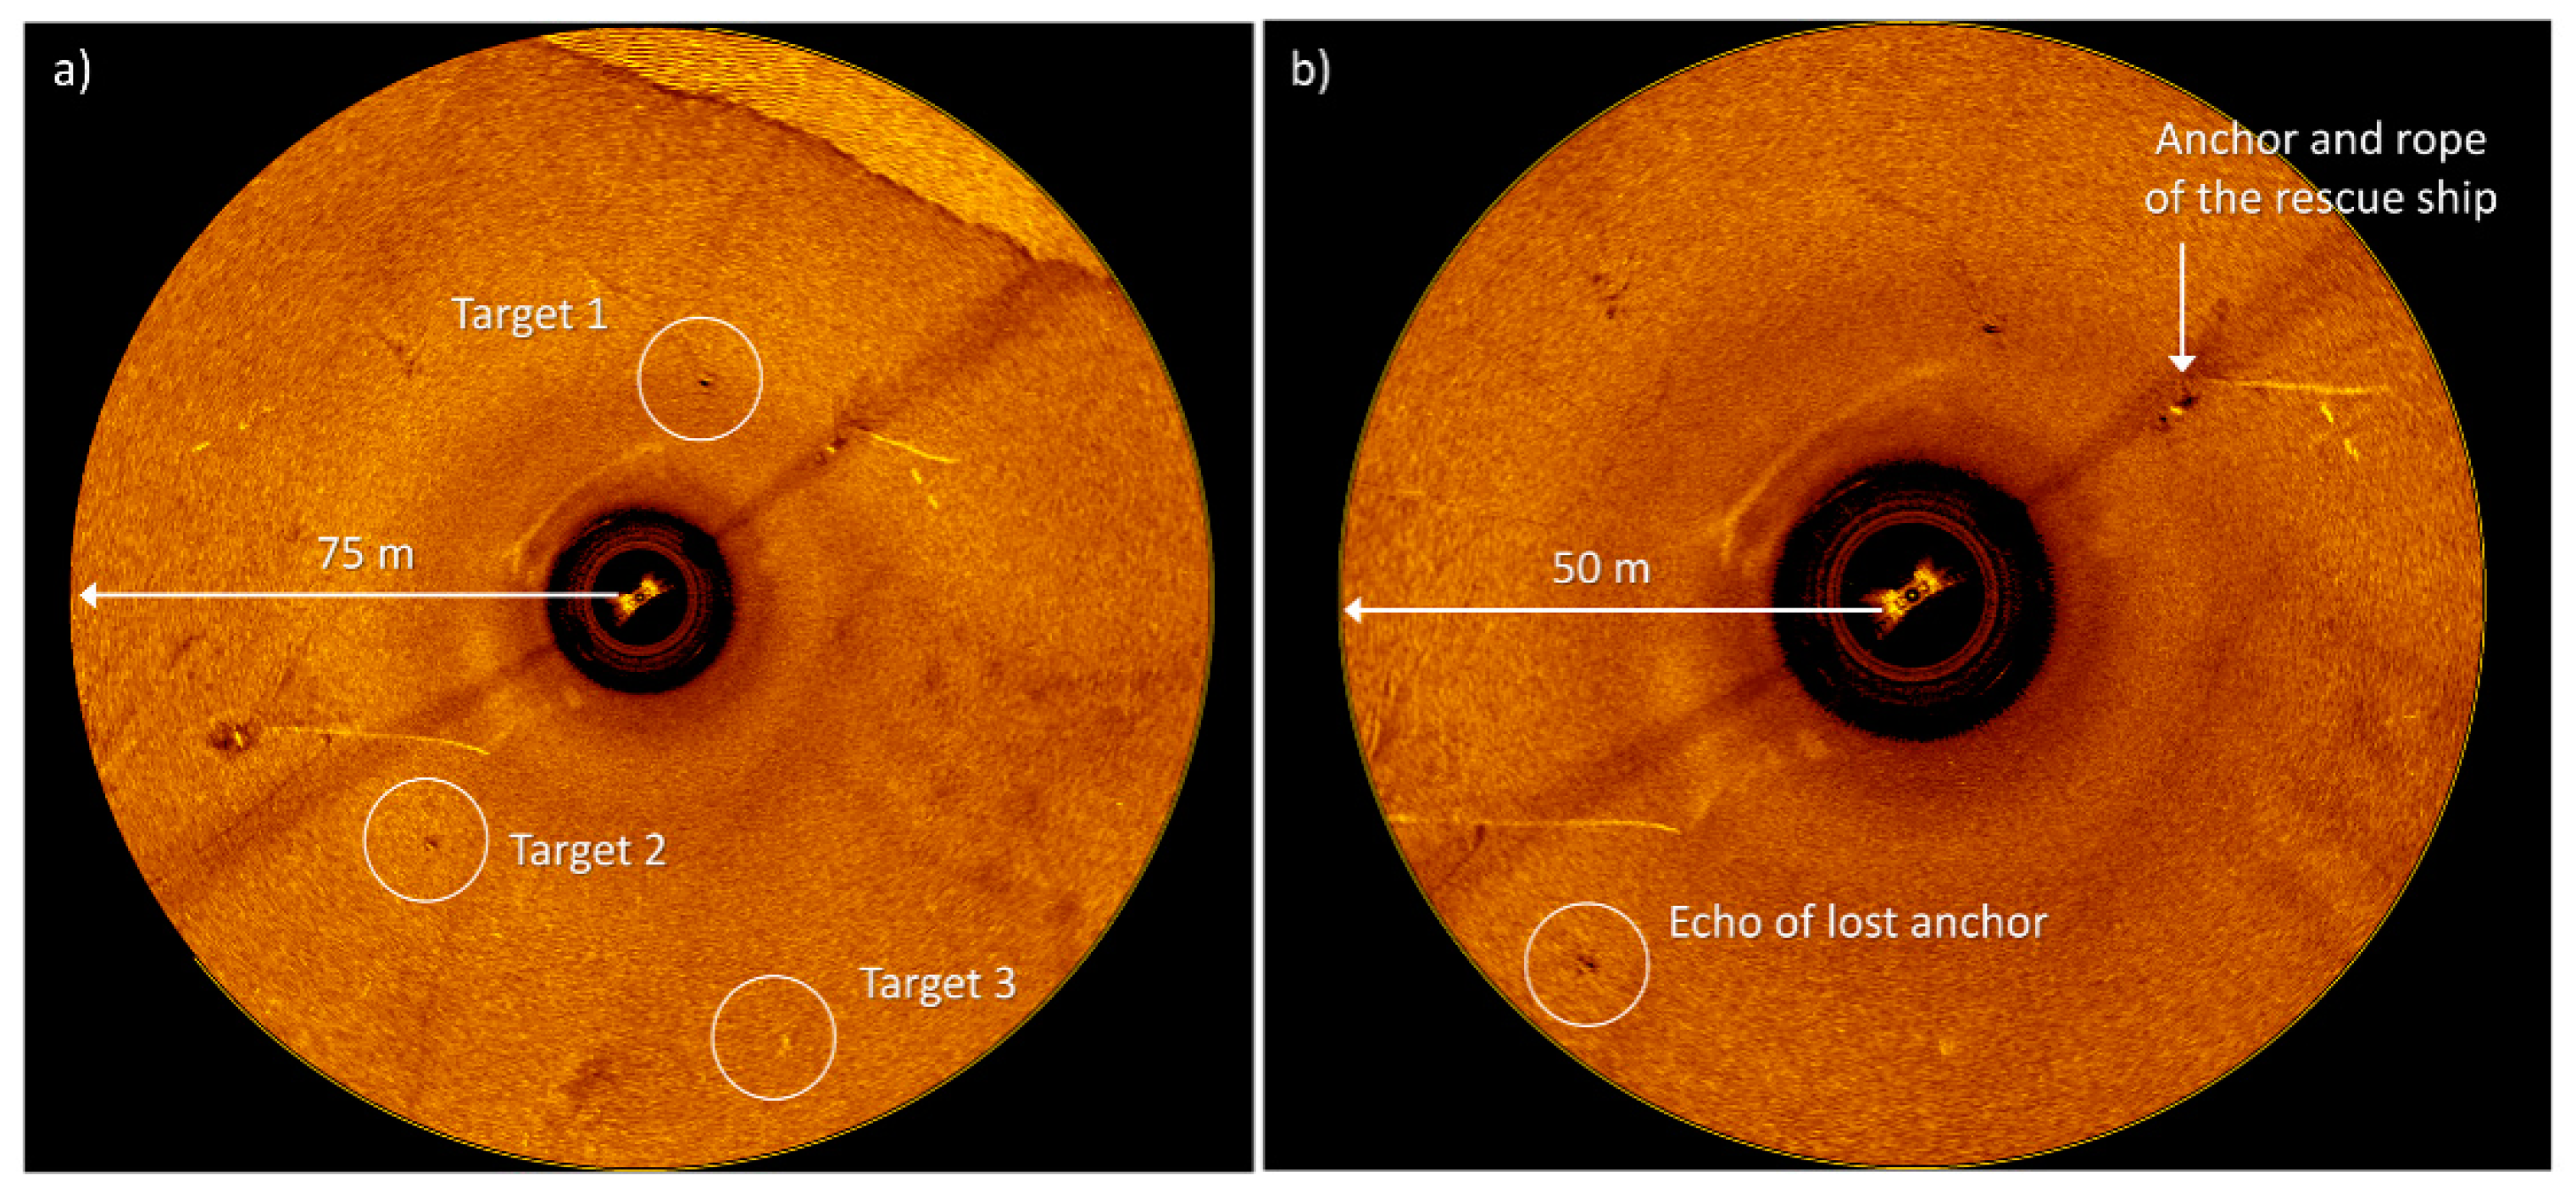
The last project where the effectiveness of the new scanning sonar technique was tested was the search for, detection, and extraction to the surface of a Hall-type anchor. The anchor broke off the chain while the ship was anchored near Łeba. The position of the anchor on the seabed was only probable. The task of finding and extracting the anchor was assigned to the rescue ship ORP “Lech” in cooperation with a team of hydrographers from the Hydrographic Support squadron of the Polish Navy. The rescue ship was anchored in the probable position where the anchor had broken off. The MS 1000 scanning sonar was mounted to the diving platform grating and lowered to the seabed. Sonar measurements started at the range of 75 meters and then reduced to 50 meters (Figure 17). At the range of 75 meters, sonar images were recorded, based on which three sonar echoes were selected. These echoes were indicated to the diver who carried out the visual identification. One of the echoes indicated was identified as the lost Hall-type anchor.
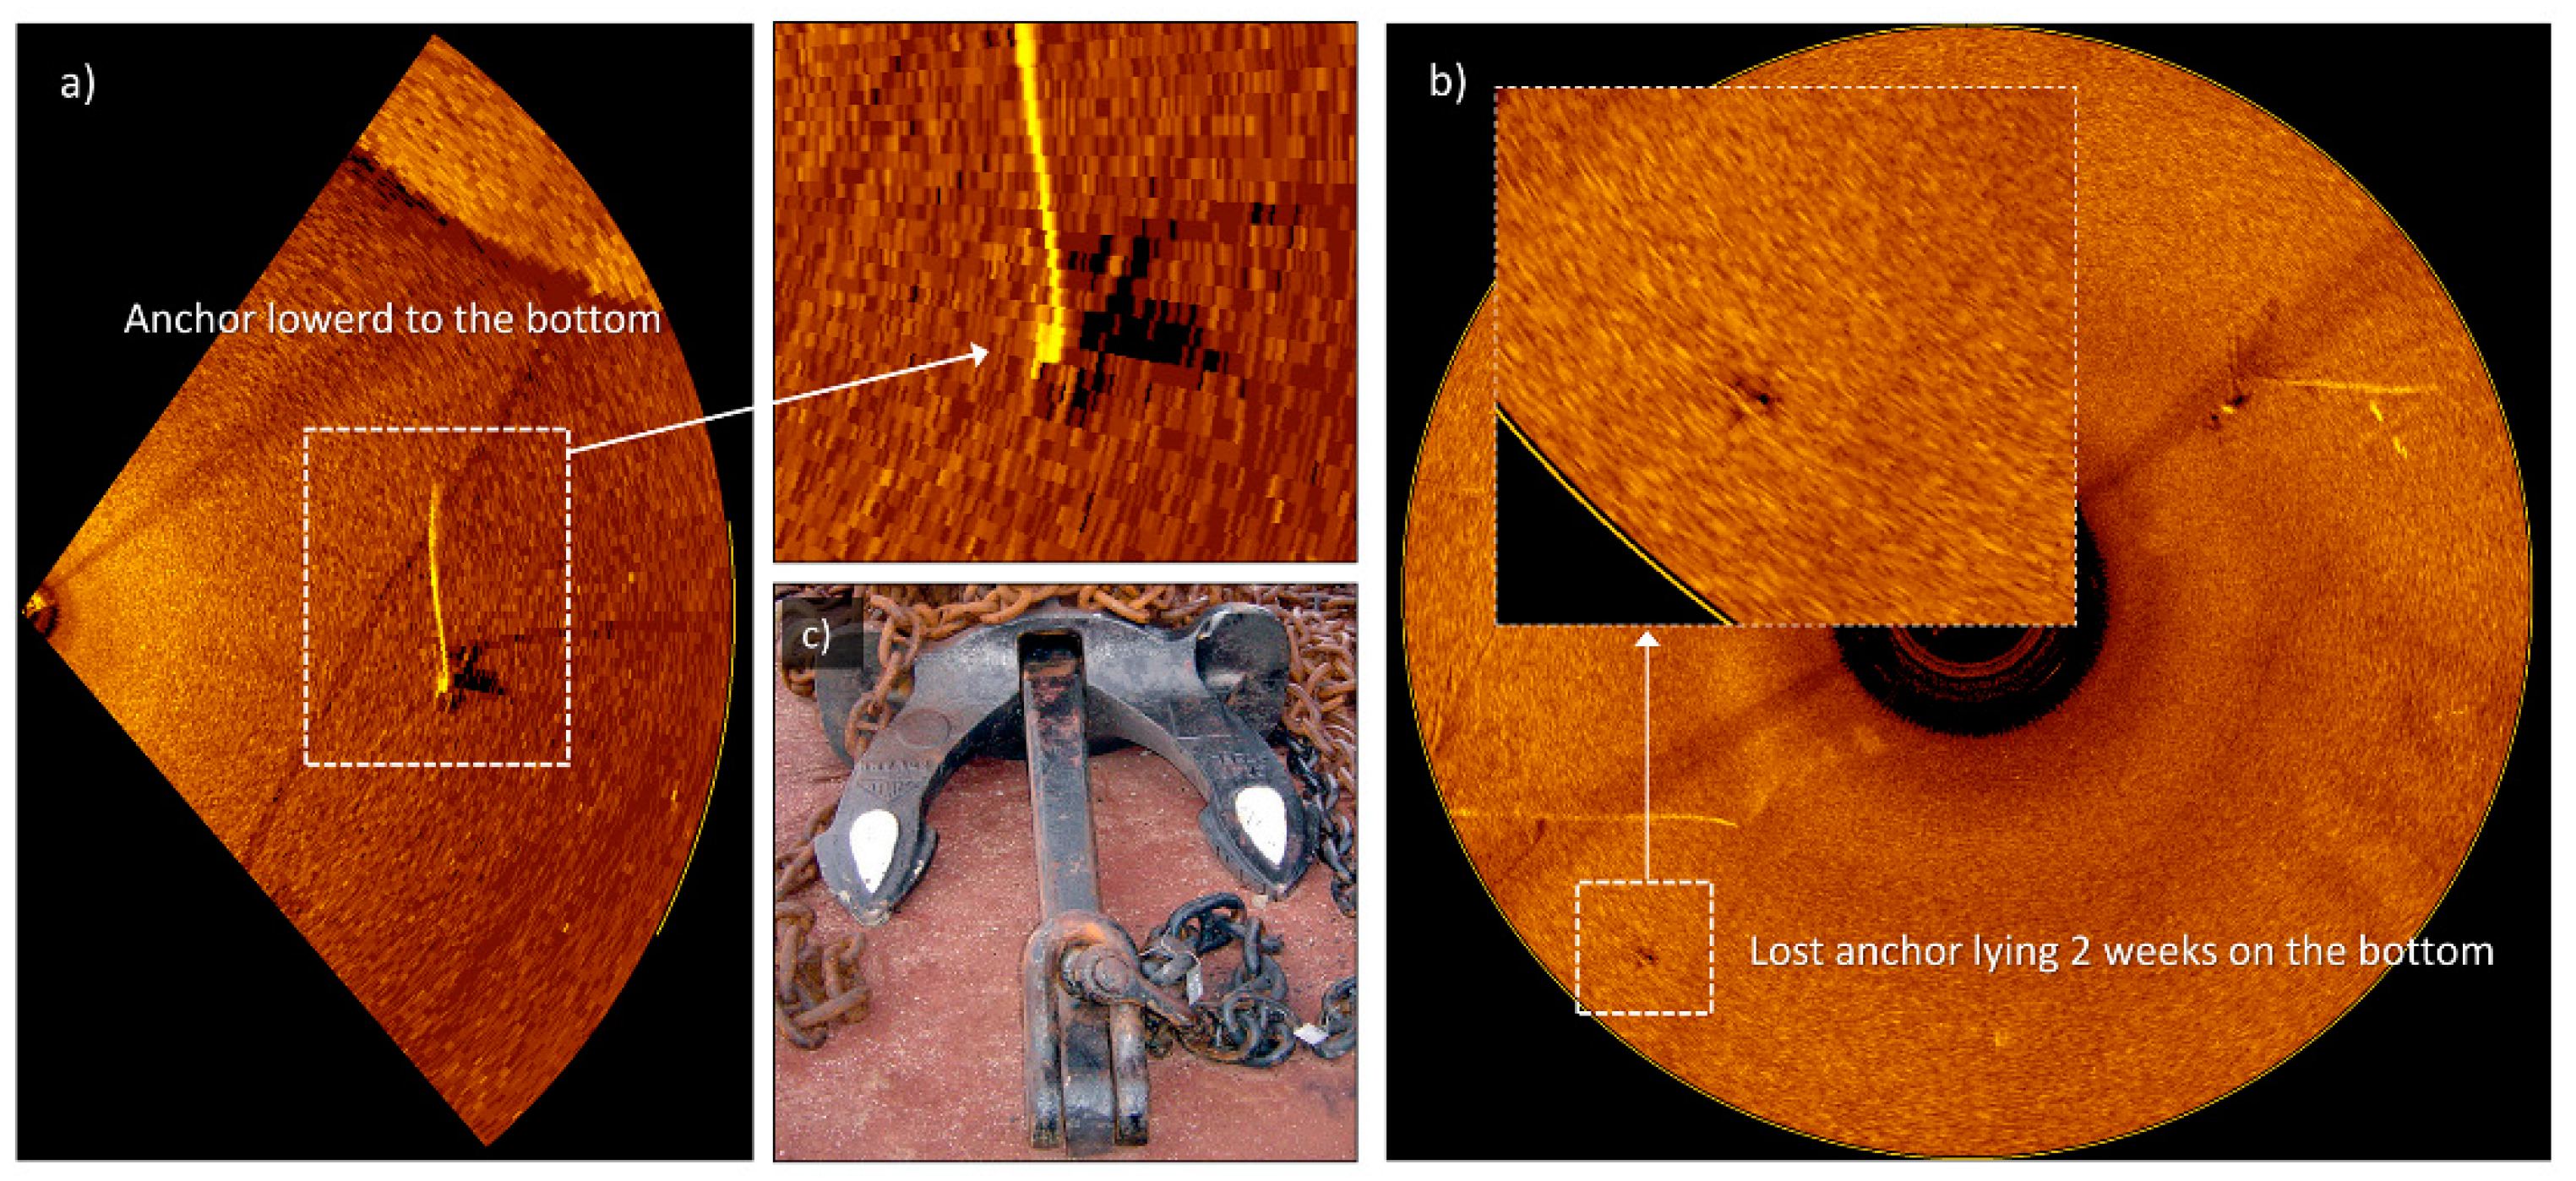
During the measurements, the hydrographer incorrectly indicated other sonar echoes, including the echoes from the anchor of the rescue ship dropped during the anchoring operation. Figure 18 shows the differences between the image of the echo of the anchor of the rescue ship (Figure 18a) and the image of the echo of the anchor being searched for, resting on the seabed for two weeks. In Figure 18a, one can even see the palms of the anchor in the sonar image. The sonar echo from the anchor that had rested for 14 days on the seabed is weak, fuzzy, and practically without any acoustic shade. The diver’s account shows that the anchor was almost completely covered with seabed sediment. The sonar images in Figure 18a,b show the role of time in image quality and detail.
4. Conclusions
This paper presents a new technique for use of a scanning sonar, which was tested on a rescue ship while performing tasks at sea. So far, the sonar head had been used by hydrographers mainly on tripods and in shallow waters. The sonar use method presented in this paper makes it possible to search for small objects at depths much greater than 80 meters. The results demonstrate that a scanning sonar mounted to a diving platform grating has the potential to provide detailed sonar images of the seabed and underwater objects before the divers descend. For a diver performing underwater inspection work, information about the presence of any objects (obstacles, nets, ropes), their size, and their position is a great help and support. The diver is familiar with the situation on the seabed, sees the wreckage and the objects, which certainly improves the safety of the entire operation. Scanning sonars are unlikely to fully replace the work of divers, but they can reduce the number and duration of dives. Elimination of uncertainties related to the presence of risks will increase the divers’ efficiency and safety.
The sonar use technique presented herein also proved its applicability in rescuing the crew of a submarine that had crashed and rested on the seabed (during a naval exercise). The MS 1000 sonar recorded images showing individual parts of the structure of the submarine on the seabed. Precise indication and imaging of the emergency hatch at the bow appeared to be crucial for the entire operation aimed at rescuing the trapped submarine crew.
The new technique was also highly effective in search for, detection, and extraction of small underwater objects. It should be noted that an underwater ROV can provide invaluable help and significant support in recognizing and identifying the detected targets. It is extremely difficult for a diver to find an underwater object with the size of less than one meter at visibility below 0.5 meter. Preliminary sonar measurements enable accurate acoustic imaging of the seabed and indication of echoes whose shape and size match the object being searched for. In this way, a diver or an ROV can be guided to a specific target to perform visual identification.
An essential requirement for obtaining high resolution sonar images is to create stable operating conditions for the sonar. When the transducer is in a fixed position, the recorded images are highly detailed and free from interferences caused by the movement of the sonar or the vessel. The proposed sonar use technique provides optimal operating conditions in terms of stability. First of all, the ORP "Lech" rescue ship floating above the wreckage, immobilized with four anchors, appeared to be standing in a dock or a slip, or to be simply moored to the wharf. Secondly, the sonar head was mounted in a special aluminum frame, which was then attached to a grating that was a part of the diving platform. The diving platform, with steel cables and anchors lowered to the seabed, formed quite a stable system for the sonar. The sonar head was almost stationary, which translated directly into the quality of the sonograms recorded. The recorded data were legible and easy to interpret.
The installation of the MS 1000 scanning sonar on the diving platform and its use to support the work of divers and the search for and extraction of underwater objects is an unconventional but effective technical solution, which was successfully tested in several operations at sea.
Funding
This work was supported by the Minister of National Defense of Poland as part of the program called Research Grant: “Backscattering of acoustic waves in the aquatic environmental”.
Conflicts of Interest
The author declares no conflict of interest.
References
- Misiuk, B.; Brown, C.J.; Robert, K.; Lacharité, M. Harmonizing Multi-Source Sonar Backscatter Datasets for Seabed Mapping Using Bulk Shift Approaches. Remote Sens. 2020, 12, 601. [Google Scholar] [CrossRef] [Green Version]
- Fakiris, E.; Blondel, P.; Papatheodorou, G.; Christodoulou, D.; Dimas, X.; Georgiou, N.; Kordella, S.; Dimitriadis, C.; Rzhanov, Y.; Geraga, M.; et al. Multi-Frequency, Multi-Sonar Mapping of Shallow Habitats—Efficacy and Management Implications in the National Marine Park of Zakynthos, Greece. Remote Sens. 2019, 11, 461. [Google Scholar] [CrossRef] [Green Version]
- Dinehart, R.L. Bedform movement recorded by sequential single-beam surveys in tidal rivers. J. Hydrol. 2002, 258, 25–39. [Google Scholar] [CrossRef] [Green Version]
- Federation Internationale des Geometres FIG. Guidelines for the Planning, Execution and Management of Hydrographic Surveys in Ports and Harbours; FIG Commission 4 FIG Publication No 56; International Federation of Surveyors: Denmark, Copenhagen, 2010. [Google Scholar]
- Kearns, T.A.; Breman, J. Bathymetry: The Art and Science of Seafloor Modeling for Modern Applications; Breman, J., Ed.; Ocean Globe, ESRI Press: Redlands, CA, USA, 2010; ISBN 978-1-58948-219-7.274. [Google Scholar]
- Blondel, P. The Handbook of Sidescan Sonar; Praxis Publishing Ltd.: Chichester, UK, 2009; pp. 7–9. [Google Scholar]
- Lurton, X.; Jackson, D. An Introduction to Underwater Acoustics, 2nd ed.; Springer-Praxis: New York, NY, USA, 2008; ISBN 3540429670. [Google Scholar]
- Williams, D.P. The Mondrian detection algorithm for sonar imagery. IEEE Trans. Geosci. Remote Sens. 2018, 56, 1091–1102. [Google Scholar] [CrossRef]
- LeHardy, P.K.; Larsen, L.J. Deepwater synthetic aperture sonar and the search for MH 370. In Proceedings of the 2015 MTS/IEEE Oceans Conference, Washington, DC, USA, 19–22 October 2015; pp. 1–4. [Google Scholar]
- Hansen, R.E. Introduction to Synthetic Aperture Sonar, Sonar Systems; Kolev, N., Ed.; InTech., 2011; ISBN 978-953-307-345-3. Available online: http://www.intechopen.com/books/sonarsystems/introduction-to-synthetic-aperture-sonar (accessed on 14 February 2020).
- Hagen, P.E.; Borhaug, E.; Midtgaard, O. Pipeline inspection with interferometric SAS. Sea Technol. 2010, 51, 37–40. [Google Scholar]
- Grządziel, A. Searching for underwater objects in port basin. Bellona 2012, 2, 108–118. (In Polish) [Google Scholar]
- Grządziel, A.; Wąż, M. Estimation of effective swath width for dual-head multibeam echosounder. Annu. Navig. 2016, 23, 173–183. [Google Scholar] [CrossRef]
- Waite, A.D. Sonar for Practising Engineers, 3rd ed.; John Wiley & Sons Ltd.: West Sussex, UK, 2002; pp. 221–231. [Google Scholar]
- Subsea, B. Oculus M-Series Single & Dual Frequency Sonars. Available online: https://www.blueprintsubsea.com/oculus/ (accessed on 12 February 2020).
- Humminbird. SOLIX Operations Manual, 532566–3EN_A. Available online: https://www.humminbird.com/ (accessed on 12 February 2020).
- Dong, Q.L.; Ouyang, Y.Z.; Chen, Y.Y.; Han, W.H.; Cao, J.B. Measuring Bottom of Sea target with Side Scan Sonar and Multibeam Sounding System. Hydrogr. Surv. Charting 2009, 29, 51–53. [Google Scholar]
- Wang, X.; Liu, S.; Liu, Z. Underwater sonar image detection: A combination of non-local spatial information and quantum-inspired shuffled frog leaping algorithm. PLoS ONE 2017, 12, e0177666. [Google Scholar] [CrossRef]
- Grządziel, A. Bathymetric survey in the past and today. Przegląd Mor. 2004, 4, 18–30. (In Polish) [Google Scholar]
- Calder, B.R.; Mayer, L.A. Automatic processing of high-rate; high-density multibeam echosounder data. Geochem. Geophys. Geosyst. 2003, 4, 1048. [Google Scholar] [CrossRef]
- Lucieer, V.; Huang, Z.; Siwabessy, J. Analysing Uncertainty in Multi-beam Bathymetric Data and the impact on derived seafloor attributes. Mar. Geod. 2016, 39, 32–52. [Google Scholar] [CrossRef]
- Stateczny, A.; Grodzicki, P.; Włodarczyk, M. Analysis of the impact of filtration parameters of geodata obtained by means of interferometric multibeam echo sounder GeoSwath+ on the result of sea bottom modelling. Rocz. Geomatyki 2010, 8, 121–130. (In Polish) [Google Scholar]
- De Moustier, C. State of the art in swath bathymetry survey systems. Int. Hydrogr. Rev. 1988, 65, 25–54. [Google Scholar]
- Laban, C. Seabed Mapping. Hydro Int. 1998, 2, 6–9. [Google Scholar]
- Parnum, I.M.; Siwabessy, P.J.W.; Gavrilov, A.N. Identification of Seafloor Habitats in Coastal Shelf Waters Using a Multibeam Echosounder. In Proceedings of the ACOUSTICS, Gold Coast, Australia, 3–5 November 2004; pp. 181–186. [Google Scholar]
- Wei, B.; Li, H.; Zhou, T.; Xing, S. Obtaining 3D High-Resolution Underwater Acoustic Images by Synthesizing Virtual Aperture on the 2D Transducer Array of Multibeam Echo Sounder. Remote Sens. 2019, 11, 2615. [Google Scholar] [CrossRef] [Green Version]
- Mohammadloo, T.H.; Snellen, M.; Renoud, W.; Beaudoin, J.; Simons, D.G. Correcting Multibeam Echosounder Bathymetric Measurements for Errors Induced by Inaccurate Water Column Sound Speeds. IEEE Access 2019, 7, 122052–122068. [Google Scholar] [CrossRef]
- Lurton, X.; Augustin, J.-M. A measurement quality factor for swath bathymetry sounders. IEEE J. Ocean. Eng. 2010, 35, 852–862. [Google Scholar] [CrossRef]
- Amiri-Simkooei, A.R.; Koop, L.; van der Reijden, K.J.; Snellen, M.; Simons, D.G. Seafloor Characterization Using Multibeam Echosounder Backscatter Data: Methodology and Results in the North Sea. Geosciences 2019, 9, 292. [Google Scholar] [CrossRef] [Green Version]
- Cruz, J.D.V.; Vicente, J.; Santos, L. Very Shallow Water Survey—A New Approach. Hydro Int. 2015, 19, 24–27. [Google Scholar]
- Ranade, G. Impact of Bathymetric System Advances on Hydrography. In Proceedings of the Impact of Thechnology in the Field of Hydrography and Maximizing Returns for Maritime Safety and Nation Building, National Institute of Oceanography, National Seminar, Goa, India, 21–22 June 2007; pp. 88–96. Available online: http://drs.nio.org/drs/bitstream/handle/2264/696/Impact_Technnol_Proc_21-22_Jun_2007_Goa.pdf?sequence=2&isAllowed=y (accessed on 18 January 2020).
- Siwabessy, P.J.W.; Gavrilov, A.N.; Duncan, A.J.; Parnum, I.M. Statistical analysis of high -frequency multibeam backscatter data in shallow water. In Acoustics: Noise of Progress, Christchurch, New Zealand, 20–22 November 2006; Minn, T.M., Ed.; Australian and New Zealand Societies: Christchurch, New Zealand; Available online: https://www.acoustics.asn.au/conference_proceedings/AASNZ2006/papers/p53.pdf (accessed on 11 January 2020).
- Stateczny, A.; Błaszczak-Bąk, W.; Sobieraj-Żłobińska, A.; Motyl, W.; Wiśniewska, M. Methodology for Processing of 3D Multibeam Sonar Big Data for Comparative Navigation. Remote Sens. 2019, 11, 2245. [Google Scholar] [CrossRef] [Green Version]
- Wlodarczyk-Sielicka, M.; Stateczny, A.; Lubczonek, J. The Reduction Method of Bathymetric Datasets that Preserves True Geodata. Remote Sens. 2019, 11, 1610. [Google Scholar] [CrossRef] [Green Version]
- Smith, C.J.; Rumohr, H. Imaging Techniques. In Methods for the Study of Marine Benthos, 4th ed.; Eleftheriou, A., Ed.; John Wiley & Sons, Ltd.: West Sussex, UK, 2013; Volume 3, pp. 97–122. [Google Scholar]
- Bates, C.R.; Lawrence, M.; Dean, M.; Robertson, P. Geophysical Methods for Wreck-Site Monitoring: The Rapid Archaeological Site Surveying and Evaluation (RASSE) programme. Int. J. Naut. Archaeol. 2011, 40, 404–416. [Google Scholar] [CrossRef]
- Salamon, R. Systemy Hydrolokacyjne; Gdańskie Towarzystwo Naukowe: Gdańsk, Poland, 2006; pp. 769–792. ISBN 83-87359-98-X. (In Polish) [Google Scholar]
- Lubis, M.J. Using Side Scan Sonar Instrument for Seabed Identification with Pattern Discrete Equi Spaced Unshaded Line Array (Pdesula) Model. J. Oceanogr. Mar. Res. 2017, 5, 163. [Google Scholar] [CrossRef]
- Atallah, L.; Shang, C.; Bates, R. Object detection at different resolution in archaeological side-scan sonar images. In Proceedings of the Europe Oceans 2005, Brest, France, 20–23 June 2015; Volume 1, pp. 287–292. [Google Scholar] [CrossRef] [Green Version]
- Sakellariou, D.; Georgiou, P.; Mallios, A.; Kapsimalis, V.; Kourkoumélis, D.; Micha, P.; Theodoulou, T.; Dellaporta, K. Searching for Ancient Shipwrecks in the Aegean Sea: The Discovery of Chios and Kythnos Hellenistic Wrecks with the Use of Marine Geological-Geophysical Methods. Int. J. Naut. Archaeol. 2007, 36, 365–381. [Google Scholar] [CrossRef]
- Parkinson, R. High Resolution Site Surveys; Taylor & Francis Ltd.: London, UK, 2011. [Google Scholar]
- Lurton, X. An Introduction to Underwater Acoustics: Principles and Applications, 2nd ed.; Springer Science & Businesss Media: Berlin, Germany, 2010. [Google Scholar]
- Hydrographic Surveying; Publication no. EM 1110-2-1003; U.S. Army Corps and of Engineers: Washington, DC, USA, 2004. Available online: https://www.publications.usace.army.mil/USACE-Publications/Engineer-Manuals/?udt_43544_param_page=4 (accessed on 3 January 2020).
- Sæbø, T.O. Seafloor Depth Estimation by means of Interferometric Synthetic Aperture Sonar. Ph.D. Thesis, Faculty of Science and Technology, University of Tromso, Lillestrøm, Norway, 2010. Available online: https://munin.uit.no/handle/10037/2793 (accessed on 14 December 2019).
- Hansen, R.E. Synthetic Aperture Sonar Technology Review. Mar. Technol. Soc. J. 2013, 47, 117–127. [Google Scholar] [CrossRef]
- Hayes, M.P.; Gough, P.T. Synthetic Aperture Sonar: A Review of Current Status. IEEE J. Ocean. Eng. 2009, 34, 207–224. [Google Scholar] [CrossRef]
- Lekkerkerk, H.-J.; Theijs, M.J. Handbook of Offshore Surveying. Acquisition Sensors, 2nd ed.; Skilltrade BV: Voorschoten, The Netherlands, 2012. [Google Scholar]
- Kongsberg Mesotech Ltd. MS 1000 High-Resolution Scanning Sonar & Software System for Underwater Inspection, Survey and Visualization. 2013. Available online: https://escort-technology.com/wp-content/uploads/ms1000_iusv_bro_6pages_lr.pdf (accessed on 13 January 2020).
- Wawrzyniak, N.; Zaniewicz, G. Visualization of quay walls by means of scanning sonar images for the needs of a geoinformation port security system. Rocz. Geomatyki 2011, 9, 133–137. (In Polish) [Google Scholar]
- Topczewski, Ł.; Cieśla, J.; Mikołajewski, P.; Adamski, P.; Markowski, Z. Monitoring of scour around bridge piers and abutments. Transp. Res. Procedia 2016, 14, 3963–3971. [Google Scholar] [CrossRef] [Green Version]
- Tracy, B.; Vermeyen, P.E. Scanning Sonar Technology Development—Dam Safety Technology Development Program, Report DSO-2014-06, U.S.; Department of the Interior Bureau of Reclamation Technical Service Center: Denver, CO, USA, 2014. Available online: https://www.usbr.gov/ssle/damsafety/TechDev/DSOTechDev/DSO-14-06.pdf (accessed on 4 January 2020).
- Franczak, M. Hydrographic survey equipment usage for searching drowning victims. In Forum Nawigacji 2017; Akademia Marynarki Wojennej: Gdynia, Poland; Available online: https://fornaw.pl/ (accessed on 4 January 2020). (In Polish)
- Kongsberg Mesotech Ltd. High Resolution Geared Sonar Head; P/N 974-23030000; Kongsberg Mesotech Ltd.: Port Coquitlam, BC, Canada, 2018. [Google Scholar]
Figure 1.
Examples of standard scanning sonar use techniques. (a) A gimbaled sonar head tripod; (b) Pole-mounted; (c) ROV-mounted.
Figure 1.
Examples of standard scanning sonar use techniques. (a) A gimbaled sonar head tripod; (b) Pole-mounted; (c) ROV-mounted.

Figure 2.
Locations of the search and inspection work conducted from the rescue vessel.

Figure 3.
Configuration of the mobile scanning sonar system.

Figure 4.
Stages of sonar system preparation for work: (a) The diving platform; (b) Fixing the sonar in the aluminum holder; (c) Mounting the sonar holder to the grating; (d,e) Placing the grating in the platform; (f) The sonar and the anchors in the working position.
Figure 4.
Stages of sonar system preparation for work: (a) The diving platform; (b) Fixing the sonar in the aluminum holder; (c) Mounting the sonar holder to the grating; (d,e) Placing the grating in the platform; (f) The sonar and the anchors in the working position.

Figure 5.
Seabed imaging technique using a scanning sonar lowered from a rescue ship.

Figure 6.
"Lech" anchorage positions above the wreckage.

Figure 7.
A scanning sonar image of the seabed in the vicinity of the wreckage, 87 m deep (position 1, port side).
Figure 7.
A scanning sonar image of the seabed in the vicinity of the wreckage, 87 m deep (position 1, port side).

Figure 8.
A scanning sonar image showing the port side of the wreckage (position 1).

Figure 9.
A sonogram showing the stern of Graf Zeppelin with characteristic flight deck brackets (position 4, sonar 19 m from the stern).
Figure 9.
A sonogram showing the stern of Graf Zeppelin with characteristic flight deck brackets (position 4, sonar 19 m from the stern).

Figure 10.
A sonogram of the stern section with a part of the engine room showing clearly visible aircraft elevator holes (position 3, octagonal aircraft elevator).
Figure 10.
A sonogram of the stern section with a part of the engine room showing clearly visible aircraft elevator holes (position 3, octagonal aircraft elevator).

Figure 11.
A sonogram of the bow section of the wreckage with an aircraft elevator opening and a superstructure (item 6).
Figure 11.
A sonogram of the bow section of the wreckage with an aircraft elevator opening and a superstructure (item 6).

Figure 12.
Sonar imaging of the bottom in the area of the search for the lost diving apparatus. (a) Measurements at the range of R = 75 m; (b) Measurements at the range of R = 50 m; (c) Measurements at the range of R = 30 m.
Figure 12.
Sonar imaging of the bottom in the area of the search for the lost diving apparatus. (a) Measurements at the range of R = 75 m; (b) Measurements at the range of R = 50 m; (c) Measurements at the range of R = 30 m.

Figure 13.
A sonar image showing the echo from Platform PG1 and the indication of three underwater objects to be identified.
Figure 13.
A sonar image showing the echo from Platform PG1 and the indication of three underwater objects to be identified.

Figure 14.
Visual identification of the detected underwater objects. (Images from an ROV underwater vehicle: Commander Adam Olejnik, Institute of Ship Construction and Operation, Department of Diving Technology and Underwater Activities, Polish Naval University).
Figure 14.
Visual identification of the detected underwater objects. (Images from an ROV underwater vehicle: Commander Adam Olejnik, Institute of Ship Construction and Operation, Department of Diving Technology and Underwater Activities, Polish Naval University).

Figure 15.
Scanning sonar images of the submarine resting on the seabed at the depth of 41 meters.

Figure 16.
Determination of the distance and identification of the structural components of the submarine, based on a sonar image.
Figure 16.
Determination of the distance and identification of the structural components of the submarine, based on a sonar image.

Figure 17.
Sonar images of the seabed in the anchor break off position.

Figure 18.
Sonar images recorded with a scanning sonar: (a) A part of a sonogram with an echo of the anchor of the rescue vessel; (b) A sonogram with the echo of the anchor being searched for; (c) The Hall-type anchor found and pulled out to the surface.
Figure 18.
Sonar images recorded with a scanning sonar: (a) A part of a sonogram with an echo of the anchor of the rescue vessel; (b) A sonogram with the echo of the anchor being searched for; (c) The Hall-type anchor found and pulled out to the surface.


Table 1.
Characteristics of the sonar head.
| Parameter | Value |
|---|---|
| Operating frequency | 675 kHz |
| Beam width | 0.9° × 30° fan |
| Range | 0.5–100 meters |
| Scan angle | 360° |
| Step size | 0.225° |
| Pulse lengths | 25–2500 μs |
| Dimensions | Diameter 89 mm, length 488 mm |
| Transducer width | 149 mm |
| Weight | 5.7 kg in air, 2.7 kg in water |
© 2020 by the author. Licensee MDPI, Basel, Switzerland. This article is an open access article distributed under the terms and conditions of the Creative Commons Attribution (CC BY) license (http://creativecommons.org/licenses/by/4.0/).
Share and Cite
MDPI and ACS Style
Grządziel, A. Results from Developments in the Use of a Scanning Sonar to Support Diving Operations from a Rescue Ship. Remote Sens. 2020, 12, 693. https://0-doi-org.brum.beds.ac.uk/10.3390/rs12040693
AMA Style
Grządziel A. Results from Developments in the Use of a Scanning Sonar to Support Diving Operations from a Rescue Ship. Remote Sensing. 2020; 12(4):693. https://0-doi-org.brum.beds.ac.uk/10.3390/rs12040693
Chicago/Turabian StyleGrządziel, Artur. 2020. "Results from Developments in the Use of a Scanning Sonar to Support Diving Operations from a Rescue Ship" Remote Sensing 12, no. 4: 693. https://0-doi-org.brum.beds.ac.uk/10.3390/rs12040693
Note that from the first issue of 2016, this journal uses article numbers instead of page numbers. See further details here.