Tunnel Monitoring and Measuring System Using Mobile Laser Scanning: Design and Deployment


1
Beijing Advanced Innovation Center for Imaging Theory and Technology, Key Laboratory of 3D Information Acquisition and Application, MOE, College of Resource Environment and Tourism, Academy for Multidisciplinary Studies, Capital Normal University, Beijing 100048, China
2
College of Surveying and Geo-informatics, Tongji University, Shanghai 200092, China
*
Author to whom correspondence should be addressed.
Remote Sens. 2020, 12(4), 730; https://0-doi-org.brum.beds.ac.uk/10.3390/rs12040730
Submission received: 16 January 2020
/
Revised: 19 February 2020
/
Accepted: 20 February 2020
/
Published: 22 February 2020
(This article belongs to the Special Issue Laser Scanning and Point Cloud Processing)
Abstract
:The common statistical methods for rail tunnel deformation and disease detection usually require a large amount of equipment and manpower to achieve full section detection, which are time consuming and inefficient. The development trend in the industry is to use laser scanning for full section detection. In this paper, a design scheme for a tunnel monitoring and measuring system with laser scanning as the main sensor for tunnel environmental disease and deformation analysis is proposed. The system provides functions such as tunnel point cloud collection, section deformation analysis, dislocation analysis, disease extraction, tunnel and track image generation, roaming video generation, etc. Field engineering indicated that the repeatability of the convergence diameter detection of the system can reach ±2 mm, dislocation repeatability can reach ±3 mm, the image resolution is about 0.5 mm/pixel in the ballast part, and the resolution of the inner wall of the tunnel is about 1.5 mm/pixel. The system can include human–computer interaction to extract and label diseases or appurtenances and support the generation of thematic disease maps. The developed system can provide important technical support for deformation and disease detection of rail transit tunnels.

1. Introduction
The amount of high-speed railway and urban rail transit infrastructure in China has been increasing at an unprecedented rate. Numerous high-speed railways with high tunnel line ratios have emerged, and subways constitute nearly 80% of urban rail transit. With the increasing number of tunnels, the monitoring, detection, maintenance, and renovation of these tunnels is becoming more important. Tunnel projects are typically huge investments, have a long route mileage, and involve strong concealment, which imposes high quality requirements on the construction and maintenance during operation [1]. During tunnel construction and operation, changes in the geotechnical load, lining support, construction deviation, and other factors lead to a certain degree of tunnel deformation. Therefore, the deformation and disease (including cracks, leakages, blocks falling, and so on) detection of tunnels has become an important task in tunnel construction, management, and operation. The safety of the tunnel geometry directly affects the tunnel performance, and a lack of safety wastes considerable amounts of money, prevents normal tunnel use, shortens the maintenance and service lives of the tunnel, and sometimes threatens the safety of traffic and pedestrians. During the operation and maintenance of urban rail transit, the skylight time is short, which also imposes higher detection efficiency requirements. The efficiency of tunnel detection, as well as the accuracy and effectiveness of detection data processing, affect normal train operations. Rapid, stable, comfortable, and safe train transportation quality can only be achieved by improving and maintaining the strength and stability of tunnel structures for a long time, and via timely inspection and maintenance of deformations. Thus, research on tunnel safety detection methods and data analysis and processing theories is significant.
At present, in practical engineering applications, tunnel deformation monitoring methods include the total station analytical method, close range photogrammetry method, and three-dimensional laser scanning method. The total station automatic deformation monitoring method [2] has a reliable accuracy and is still widely used in practical projects. The tunnel ring mark points can be measured by the total station using with or without prism reflection method.. Fully automatic measurement can be realized with a high monitoring accuracy but with a low efficiency and a high cost, and it is inconvenient to detect the deformations in an entire section. There are numerous methods and types of equipment used to detect tunnel structure deformations and diseases based on photogrammetric and computer vision (CV) techniques and image processing (IP). Leanne et al. [3] provided a collective review of the current top methods used for tunnel inspection based on photogrammetric techniques and IP. One or more cameras, laser displacement sensors, and structured light devices mounted on a large inspection vehicle, a trolley, an electric car, or a pipeline robot have been used for 3D tunnel clearance inspection [4,5,6]. A visually assisted tunnel deformation measurement system with a camera and laser displacement sensor fixed on a Pan-Tilt servo stage was proposed to automatically measure the relative deformations of the marked positions on the rocks surrounding a tunnel [5]. Some organizations have also developed commercial products, such as the Tunnel & Clearance products from MERMEC [7] and Pavemetrics TM [8]. 3D laser scanning and digital photogrammetry can complement each other to achieve high accuracy and fine texture. The methods of integration or comparison photogrammetry and 3D laser scanning are commonly used for 3D modeling and drawing of cultural properties [9,10,11]. However, the integrating system of 3D laser scanning and digital photogrammetry needs to address issues such as software and hardware synchronization, calibration, and long-term stability of the system. The integrating system needs to add an attitude measurement sensor (such as an inertial measurement unit (IMU)) and external lighting. Even so, it is very difficult to achieve a measurement accuracy and image resolution of less than 1 mm through the integration of photogrammetry and laser scanning. It is more practical to obtain high-precision point positions and image results only by means of laser scanning relative measurements in a tunnel environment according to the authors’ engineering practice experience.
The developmental trend in industry is to use laser scanning, including terrestrial and mobile laser scanning, for tunnel deformation detection. Domestic and foreign scholars, enterprises, and institutions have conducted several studies on tunnel structure deformation detection by using a 3D laser scanner. The majority of this research has been focused on point cloud data denoising, central axis extraction, cross-section interception, and fitting [12,13,14,15]. Kang and his research team [12,13,14] extracted the continuous central axis of a tunnel using a 2D point cloud projection and curve fitting using the random sample consensus (RANSAC) algorithm. Xie et al. [16,17] adopted a new algorithm combining a cylindrical fitting method with elliptical fitting. Furthermore, Cao et al. [18] proposed a slice-based method to obtain an initial central axis, which was further divided into linear and nonlinear circular segments using an enhanced RANSAC tunnel axis segmentation algorithm. Some organizations have performed integrated applications of s mobile laser tunnel detection system, as well as research on cross-section point cloud data processing methods. Gavilán et al. proposed a novel system for tunnel lining inspection that allows for high-resolution surveying at speeds of up to 30 km/h using several laser-camera units and 3D profiles [19]. Furthermore, Leica [20] developed the SiTrack: One mobile track scanning systemin which are integrated a Leica P40 laser scanner, a GNSS (Global Navigation Satellite System), an odometer, an IMU, and a profile measuring instrument. The system can realize full-coverage mobile scanning of tracks and their surroundings and can be used normally in the open air or in a tunnel. It also provides 3D point clouds with surveying- and mapping-level accuracy for the completion analysis. In the field-scanning process, joint measurement control points are required. Amberg [21] launched the GRP IMS5000 tunnel scanning system that also includes an IMU and a laser scanner, and can obtain the absolute coordinates of the tunnel and track. Cui et al. [22] developed a Railway Mobile Measurement System (RMMS) integrated with a GNSS IMU Z+F9012 laser scanner for tunnel profile detection and provided a method for tunnel ring segment seam detection to detect dislocations. The tunnel cross-section analysis involved Taubin’s ellipse-fitting method and least-squares circle fitting for cross-section fitting and diameter calculation, respectively. For many years, Capital Normal University has been engaged in 3D information acquisition and application research with the integration of multiple sensors, such as lasers and cameras. The university also developed a mobile laser tunnel detection system [23,24,25,26,27], including 3D scanning and 2D cross-section scanning, which can perform cross-section and clearance detection and generate orthophotos.
Compared with the methods of photogrammetry, IP, data acquisition, and deformation analysis, laser scanning has become the main means of obtaining tunnel deformation monitoring data owing to its high efficiency, fast speed, and high accuracy. At present, tunnel detection research is focused on mobile laser detection systems, dynamic and rapid access to tunnel detection data, and the use of laser scanning point cloud data for tunnel structure deformation and disease detection and analysis. With the rapid development of metro systems in China, shield tunneling, which is considered to be a safe, environmentally friendly, and rapid construction method, has been widely applied in metro tunnel construction, and it has gradually become a popular topic globally [28,29].
In the article, we propose a complete solution for deformation and disease detection of a circular shield tunnel based on mobile laser scanning. This scheme includes a hardware system, software system, and deformation analysis and disease solving algorithm. The hardware and software together are called the Tunnel Monitoring and Measurement System (TMMS). We present the design and development of the TMMS, thereby providing a set of mobile tunnel laser scanning solutions for monitoring measurement, including a mobile tunnel detection hardware system, data acquisition system, data processing, and results management system. The system supports several mainstream commercial laser scanners, such as Faro, Leica, and Z+F scanners. The system provides section deformation calculations (including full-section deformations and convergence diameter deformation), dislocation analysis, tunnel inner wall orthophoto image generation, disease information annotation and extraction, and tunnel roaming video generation functions, among others. This paper will introduce the design and deployment of the system, including the system composition, data processing algorithm, and engineering application in a shield tunnel, taking Z+F laser scanning as an example.
Section 2 introduces the hardware and software design of the TMMS. Section 3 describes the data processing method, including the tunnel section deformation analysis, tunnel image generation and tunnel segment seam recognition, dislocation analysis, disease extraction, and roaming video generation method. Section 4 presents the measurement accuracy of the system and an engineering case. Finally, Section 5 summarizes the major findings of this work and provides discussion.
2. Tunnel Monitoring and Measurement System
The basic principle of the TMMS involves acquiring the point cloud data of the tunnel section from a laser scanner and mobile trolley and detecting and analyzing the tunnel structure and diseases by combining the point cloud data of the section. It offers a diameter convergence solution, dislocation analysis, disease marking, orthophoto image laser intensity image generation, and panoramic roaming video rendering functions, among others. The system can generate measurement reports in Excel, section computer-aided design (CAD), disease reports, and other results to provide a complete solution for metro shield tunnel construction, operation, and maintenance detection. The system is mainly composed of three parts: a data acquisition hardware system, data processing software, and a result distribution system.
2.1. Hardware System Design
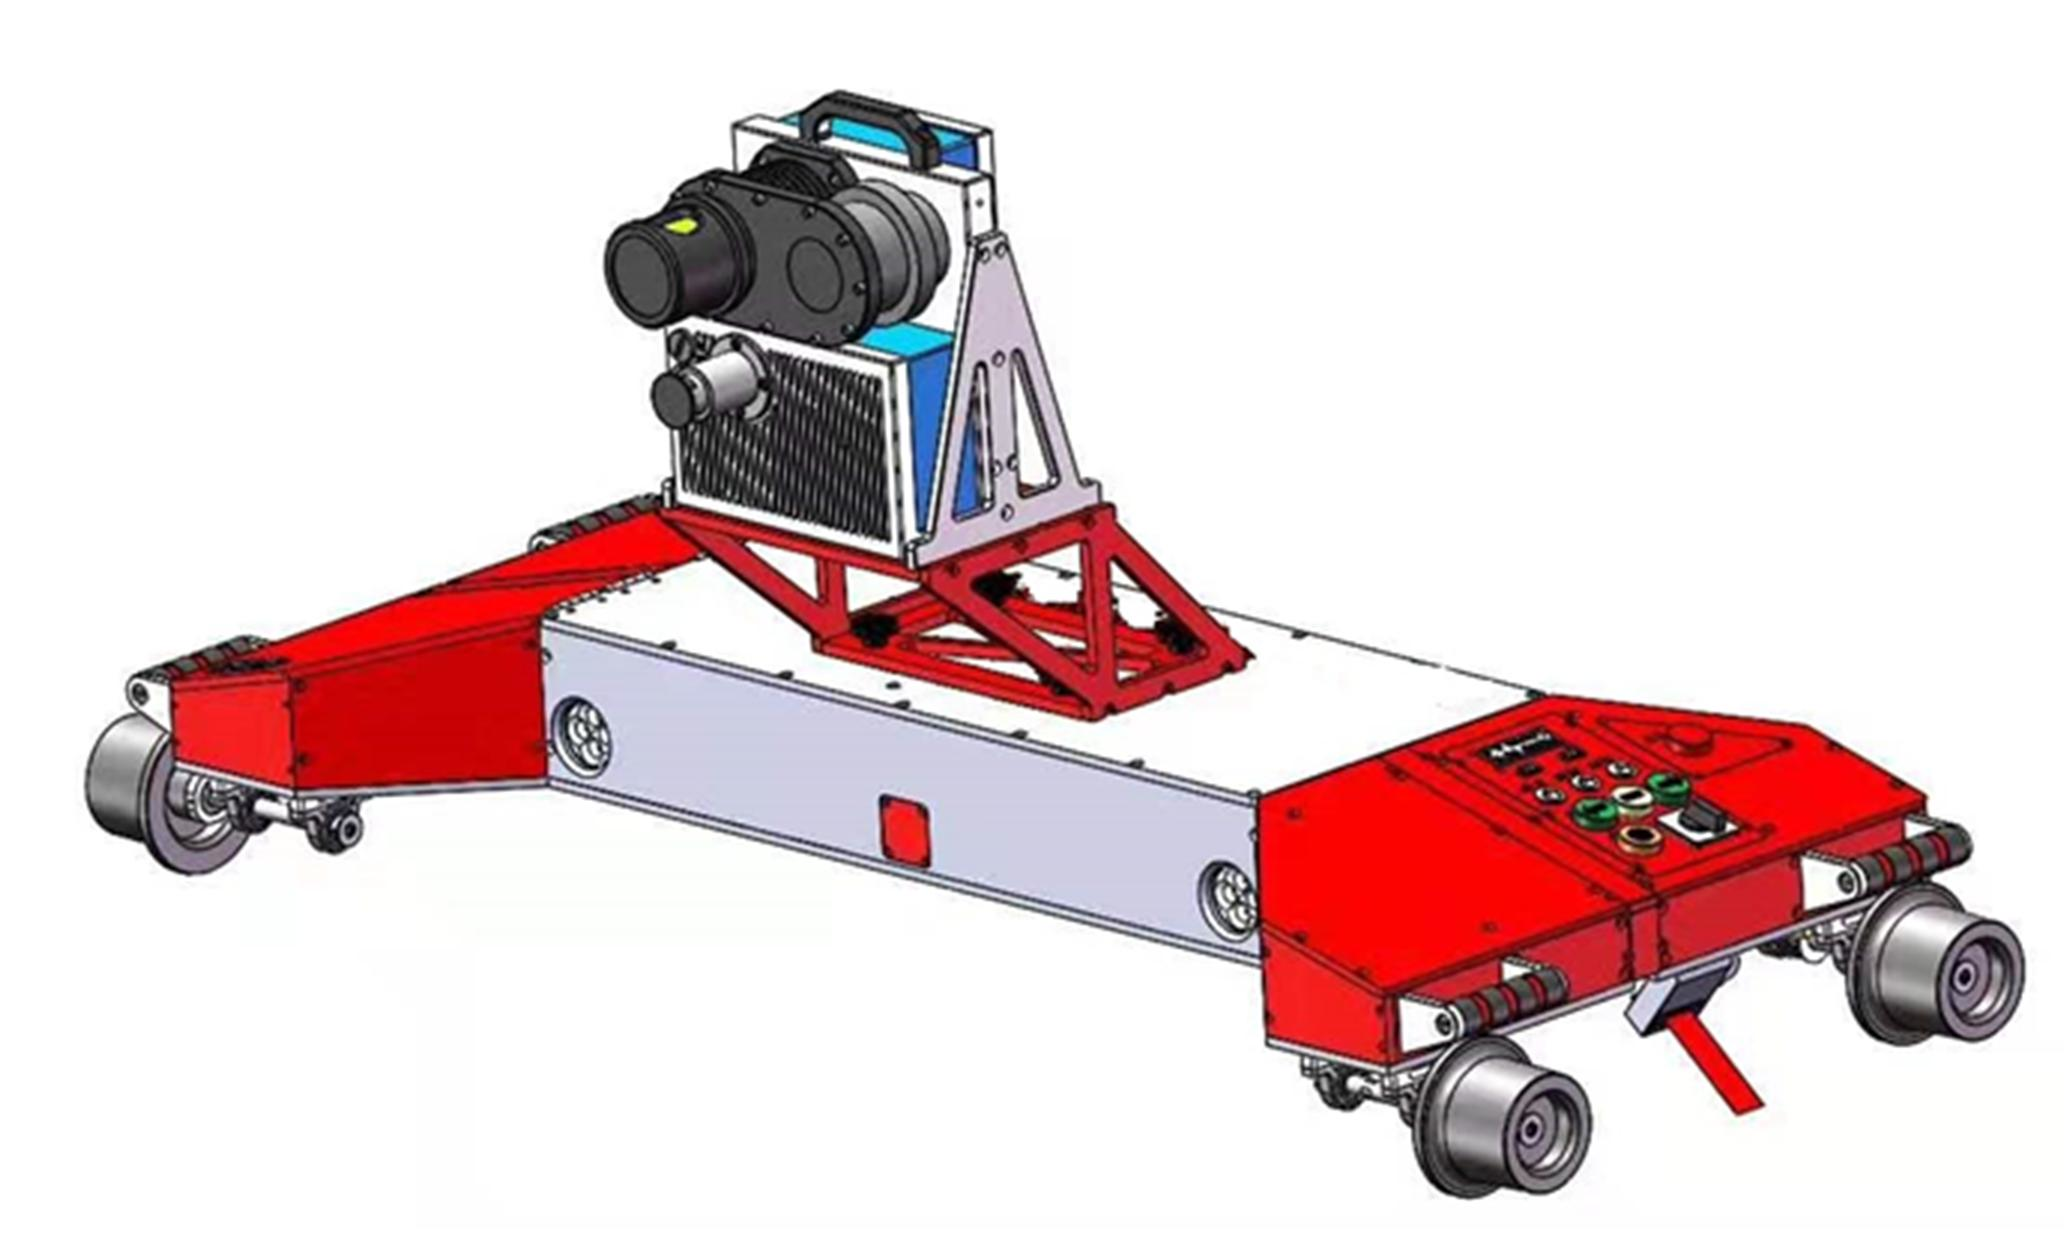
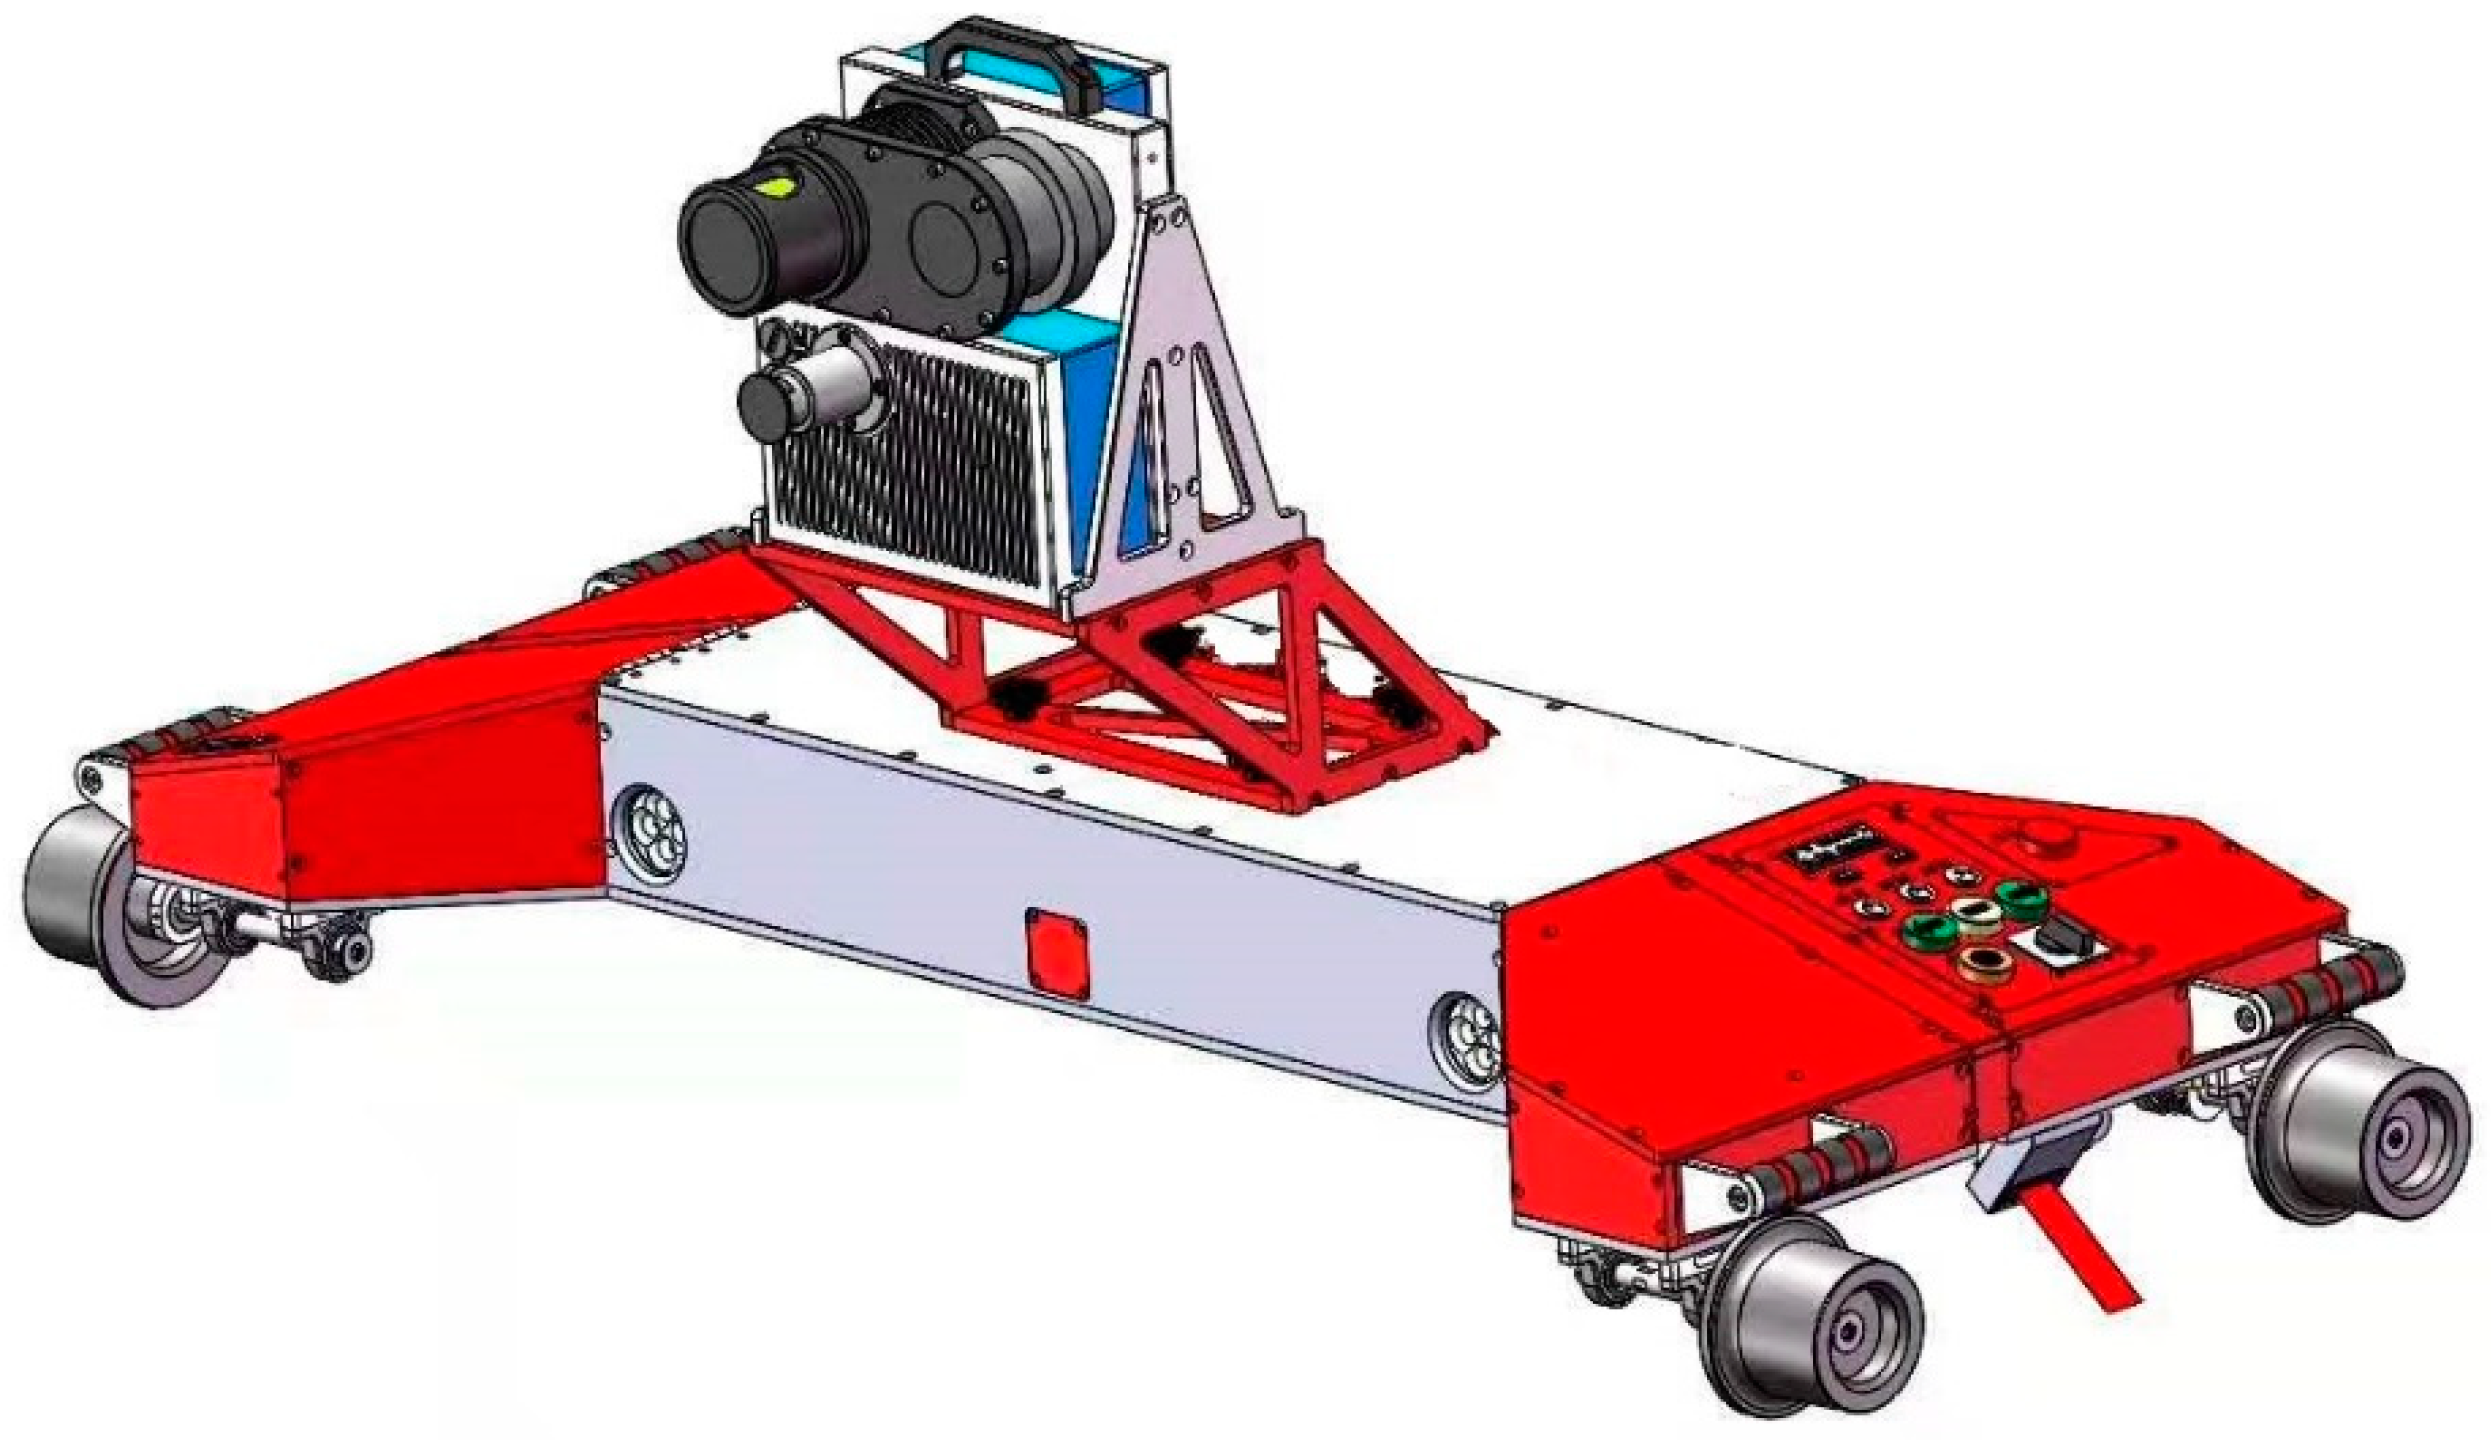
The design concept of the system is to take the laser scanner as the main sensor. The system supports adding subsidiary sensors, such as an odometer, displacement sensor, or IMU, which are not used in the tunnel deformation and disease detection process. The matching acquisition terminal utilizes a tablet computer. The carrier platform of the hardware system uses electric trolley to ensure system operation at a uniform speed and also supports a mobile trolley. The system supports Faro Focus3D series, Leica P series, and Z+F PROFILER 9012 laser scanners. The design diagram of the hardware system is depicted in Figure 1. The acquisition control software is deployed on a tablet computer, and the scanner is connected through a local area network (LAN). In this paper, PROFILER 9012 from Z+F company of Germany (Z+F9012) is taken as an example to introduce the system, and its technical parameters are summarized in Table 1. The Z+F9012 laser profiler has a ranging accuracy of 1 mm, a collection speed of 1,020,000 points/s, scanning angle of 360°, and synchronous collection of laser reflectivity information. The detection trolley is driven using electric power at a constant speed of 0.72–4.5 km/h, is adjustable through multiple gears, and has a constant speed error of less than 0.5%. It can be set to collect the track mileage and gauge synchronously, and to pass through turnout by itself. This laser scanning supported by the system has its own advantages, such as measurement accuracy, vertical field of view, rotation speed, cost, and weight. This paper recommends the use of Z+F9012. When the system runs at a speed of 3.6 km/h or slower (walking speed) in a metro tunnel with a radius of 2.7 m, the point spacing of the tunnel section can reach 2–5 mm and the section spacing is 5 mm according to the data acquisition rate and rotation speed of Z+F9012. The point density of 5 mm is enough for analyzing the deformations of the tunnel structure. The resolution of the tunnel image should be higher when detecting diseases, and the running speed should be slower.
2.2. Software Deployment
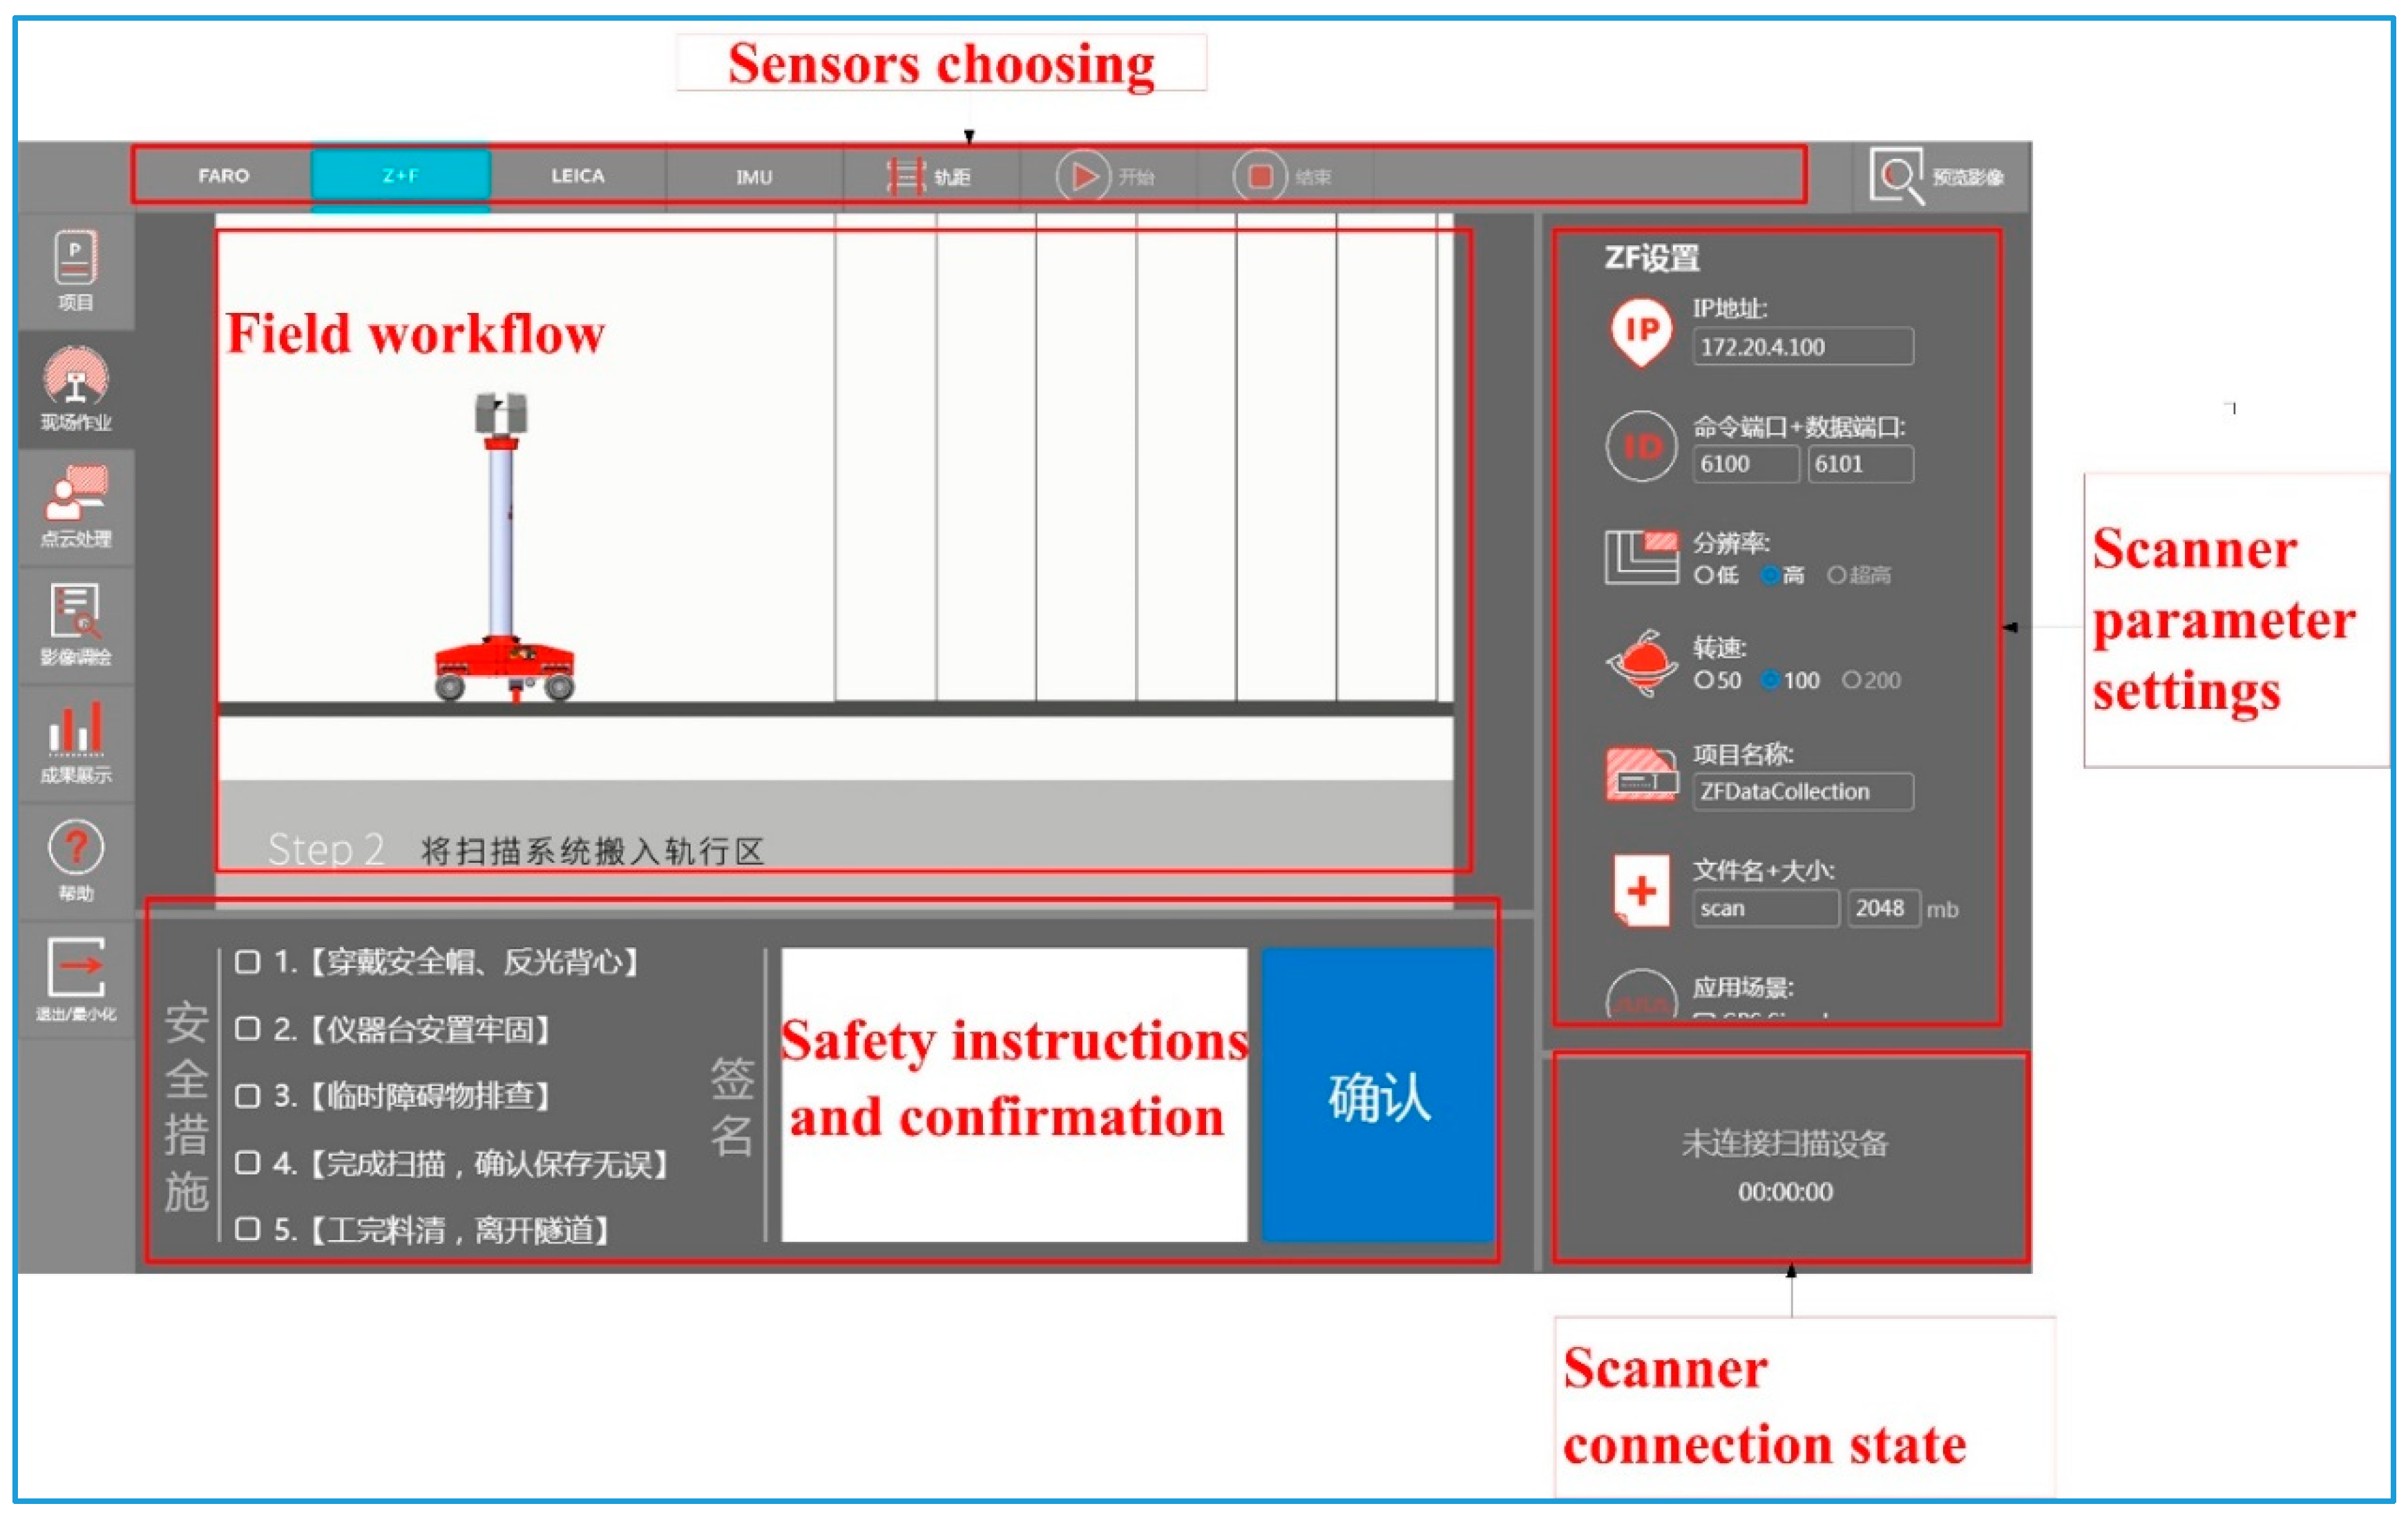
The design idea of the software of the TMMS was to integrate data acquisition and processing. The software supports the original scanning point cloud data and can also use the data processing part independently. This software is called the TLSD (Tunnel Laser Scan Dataset). The TLSD is the tunnel laser data acquisition and processing software of the TMMS and consists of three function modules, namely data acquisition, data processing, and management modules. It is also a dataset specifically designed for this system, is used to store the scanning point cloud and calculation results with the lining ring as the unit, and includes a scanning task description, original scanning, lining ring calculation parameter, tunnel inner wall image, and roaming video files. This dataset is designed to facilitate the storage, query, calculation, and visualization of the tunnel scan data. The functions of the data acquisition module are the scanning project creation, scanner and other sensor connection and control, and field work data collection and storage. The interface of the data acquisition module is shown in Figure 2.
The data processing module is the most important part of the TLSD. The main functions of this module include the point cloud calculation, thinning processing, ring number and mileage recognition, deformation solution, image projection correction, and video rendering output. The main advantage of the TLSD is that it has a lightweight design that can quickly process data on an ordinary computer (8 GB memory, integrated graphics card). The types of data include tunnel point cloud data, tunnel full section views, tunnel images (including tunnel inner wall and track images), image survey thematic maps, and roaming videos. The resulting tunnel dataset is synchronized with the cloud server through a representational state transfer application programming interface, and a unique segment globally unique identifier is established to facilitate the long-term recording and querying of the monitoring and measurement data of the entire segment processes. Tunnel TIFF image files are uploaded to a cloud server and published as web map services or other map (image) services supported by ArcGIS JavaScript. Structural deformations mainly include the convergence diameter and dislocation deformations. There are two methods of showing the diameter convergence: drawing the curve according to the route mileage or ring number sequence and using the diachronic change curve of a single ring piece. It is convenient to query and extract the point cloud data of the specified mileage section and to download the DWG or XLS full-section report through the TLSD. The dislocation analysis reveals the radial and circular dislocations, including the dislocation information and crevice position, among others.
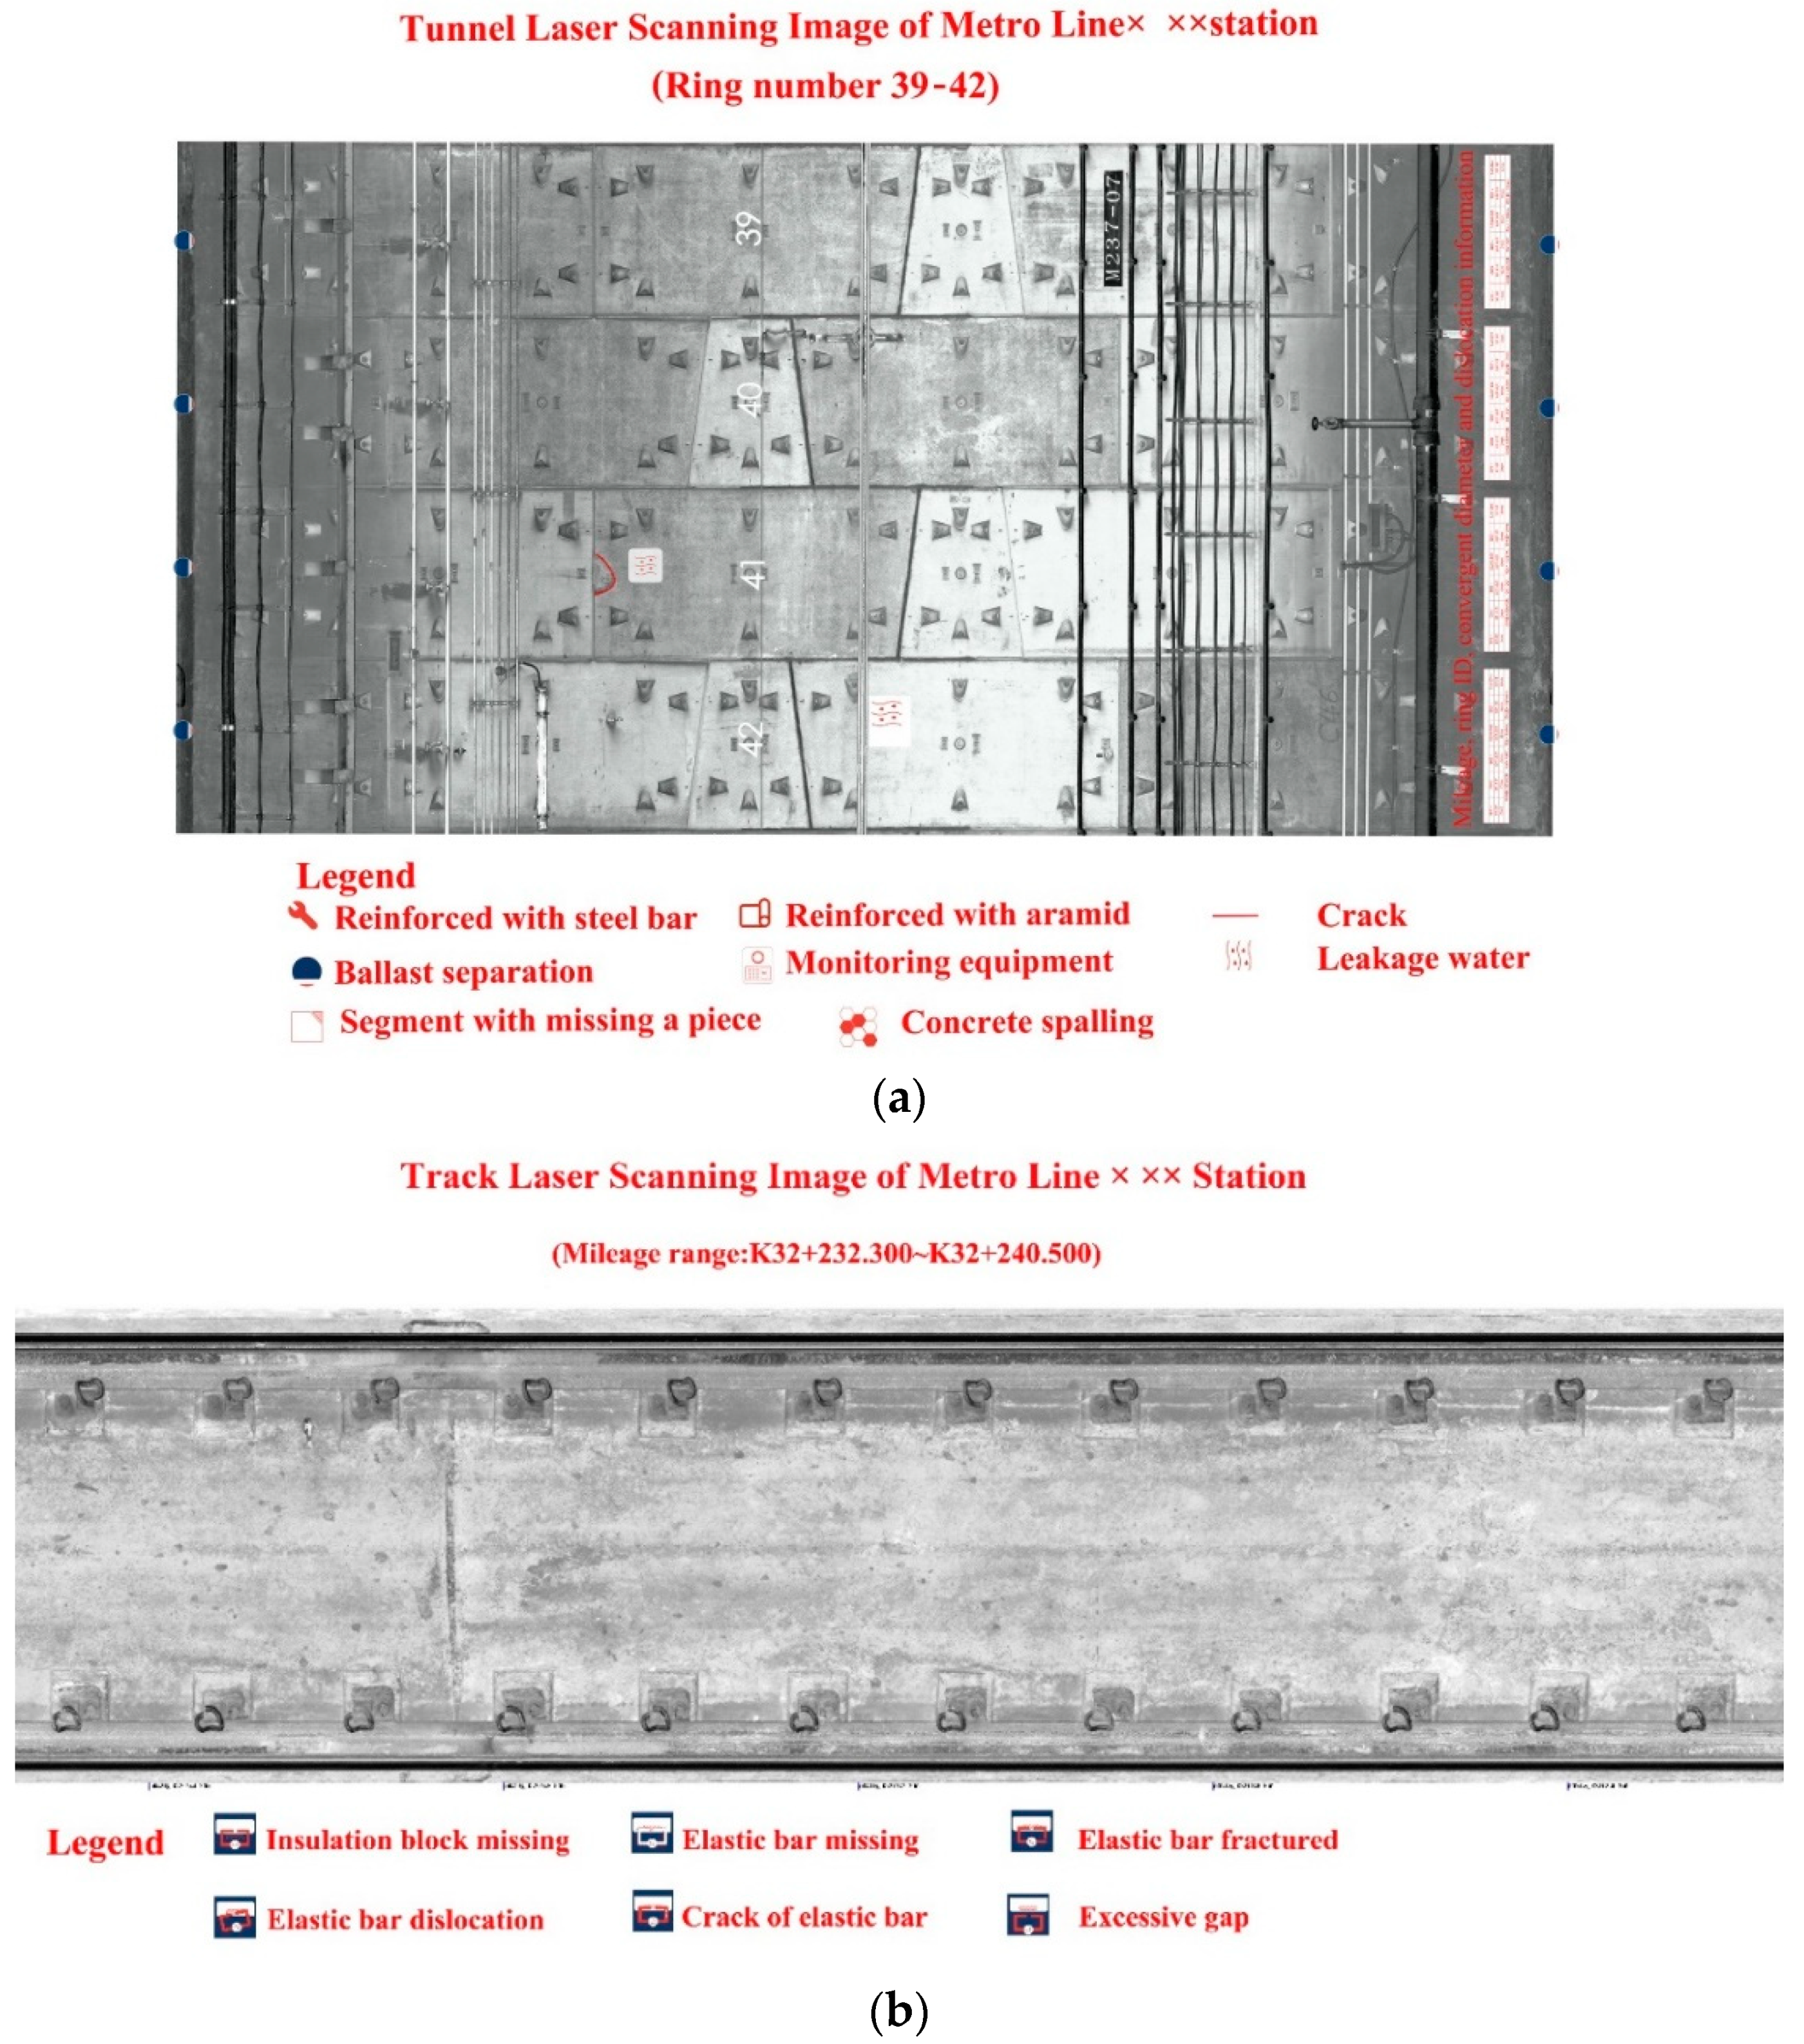
The TLSD provides image surveying and mapping reports to show the disease detection results. According to the acceptance requirements of the formed tunnel, the tunnel image is used to look for cracks, missing edges and corners, water leakage (mud), segment appearance quality, and so on, and to perform special mapping and save the results as archive data for the acceptance of the formed tunnel. In the general survey of the tunnel status, the actual installation location, connections, and other details of various tunnel facilities, such as the power supply, track, and signal that are used for business cooperation in multiple disciplines, are investigated and plotted based on the image of the inner wall of the tunnel. The field mapping results are displayed in the form of a thematic map, as shown in Figure 3.
An important aspect of this scheme is the provision of a variety of tunnel analysis results, with the characteristic of providing roaming video results. Roaming video generation is a specialty of TLSD. From a first-person perspective, a roaming video is generated in the tunnel, including front, zenith, left, and right views, to facilitate the monitoring center and to provide an intuitive understanding of the site status in the tunnel. Then, the deformation monitoring, construction conditions, and any other information from the tunnel are integrated into the video.
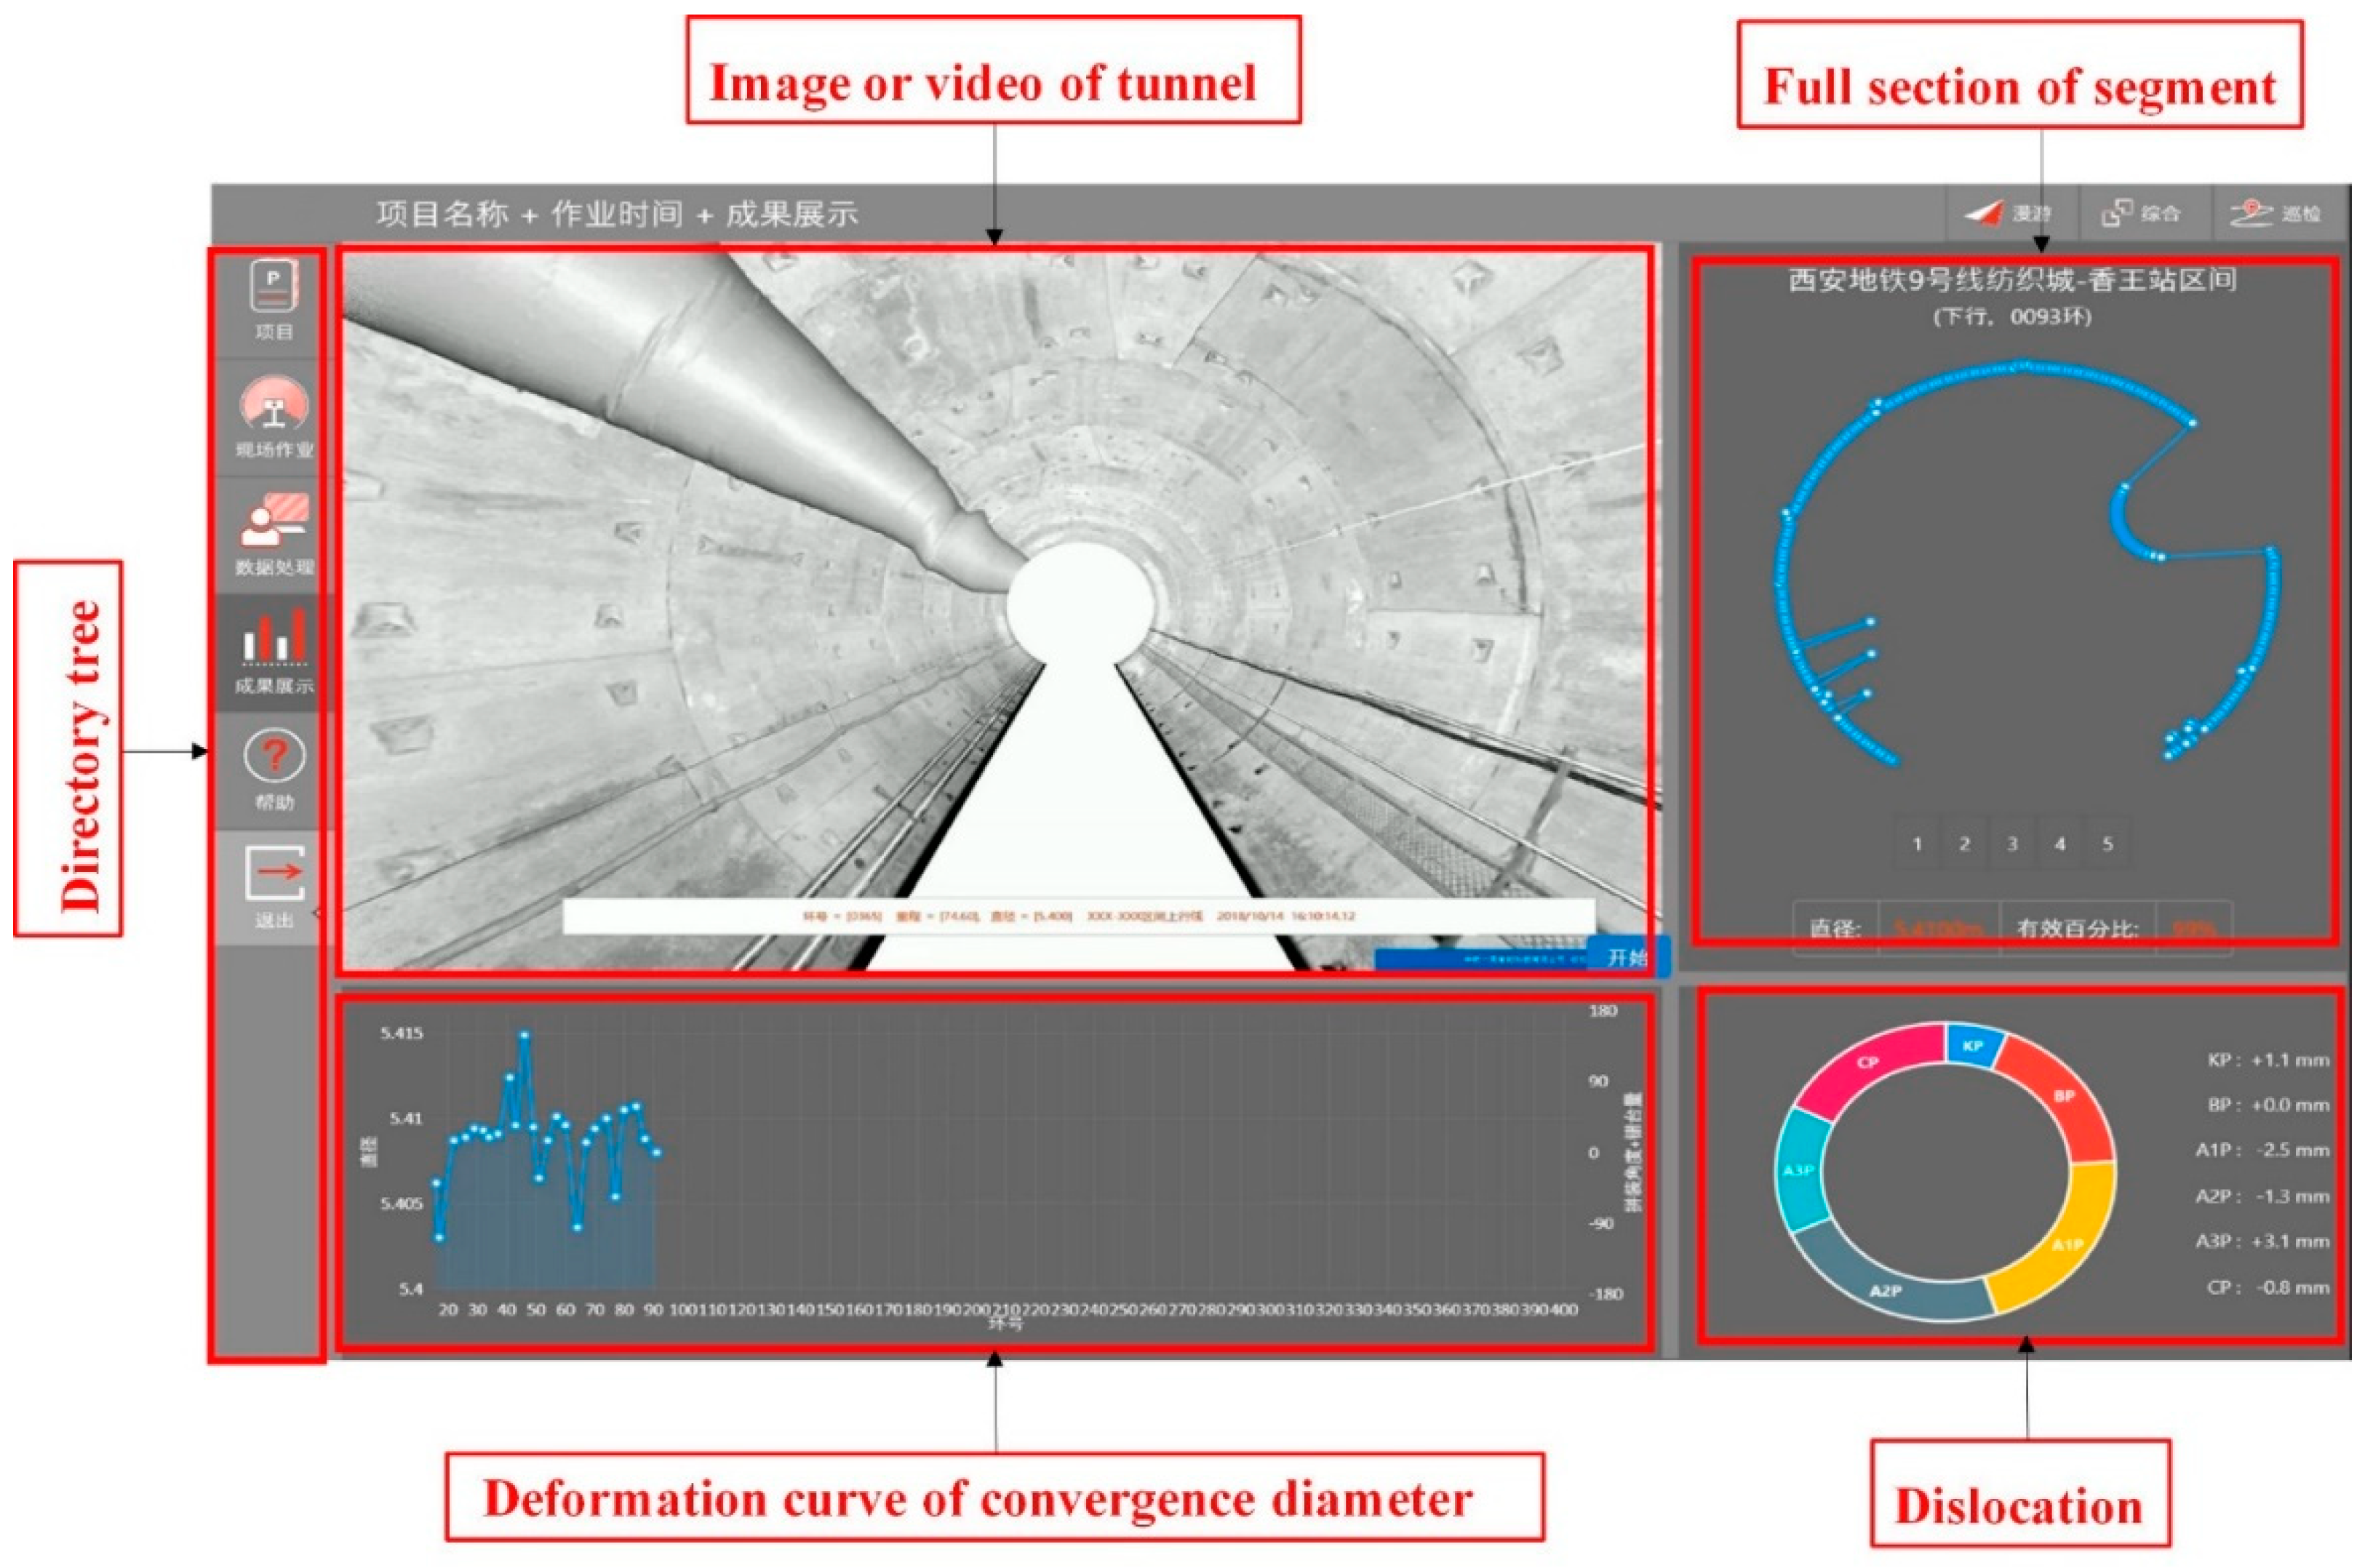
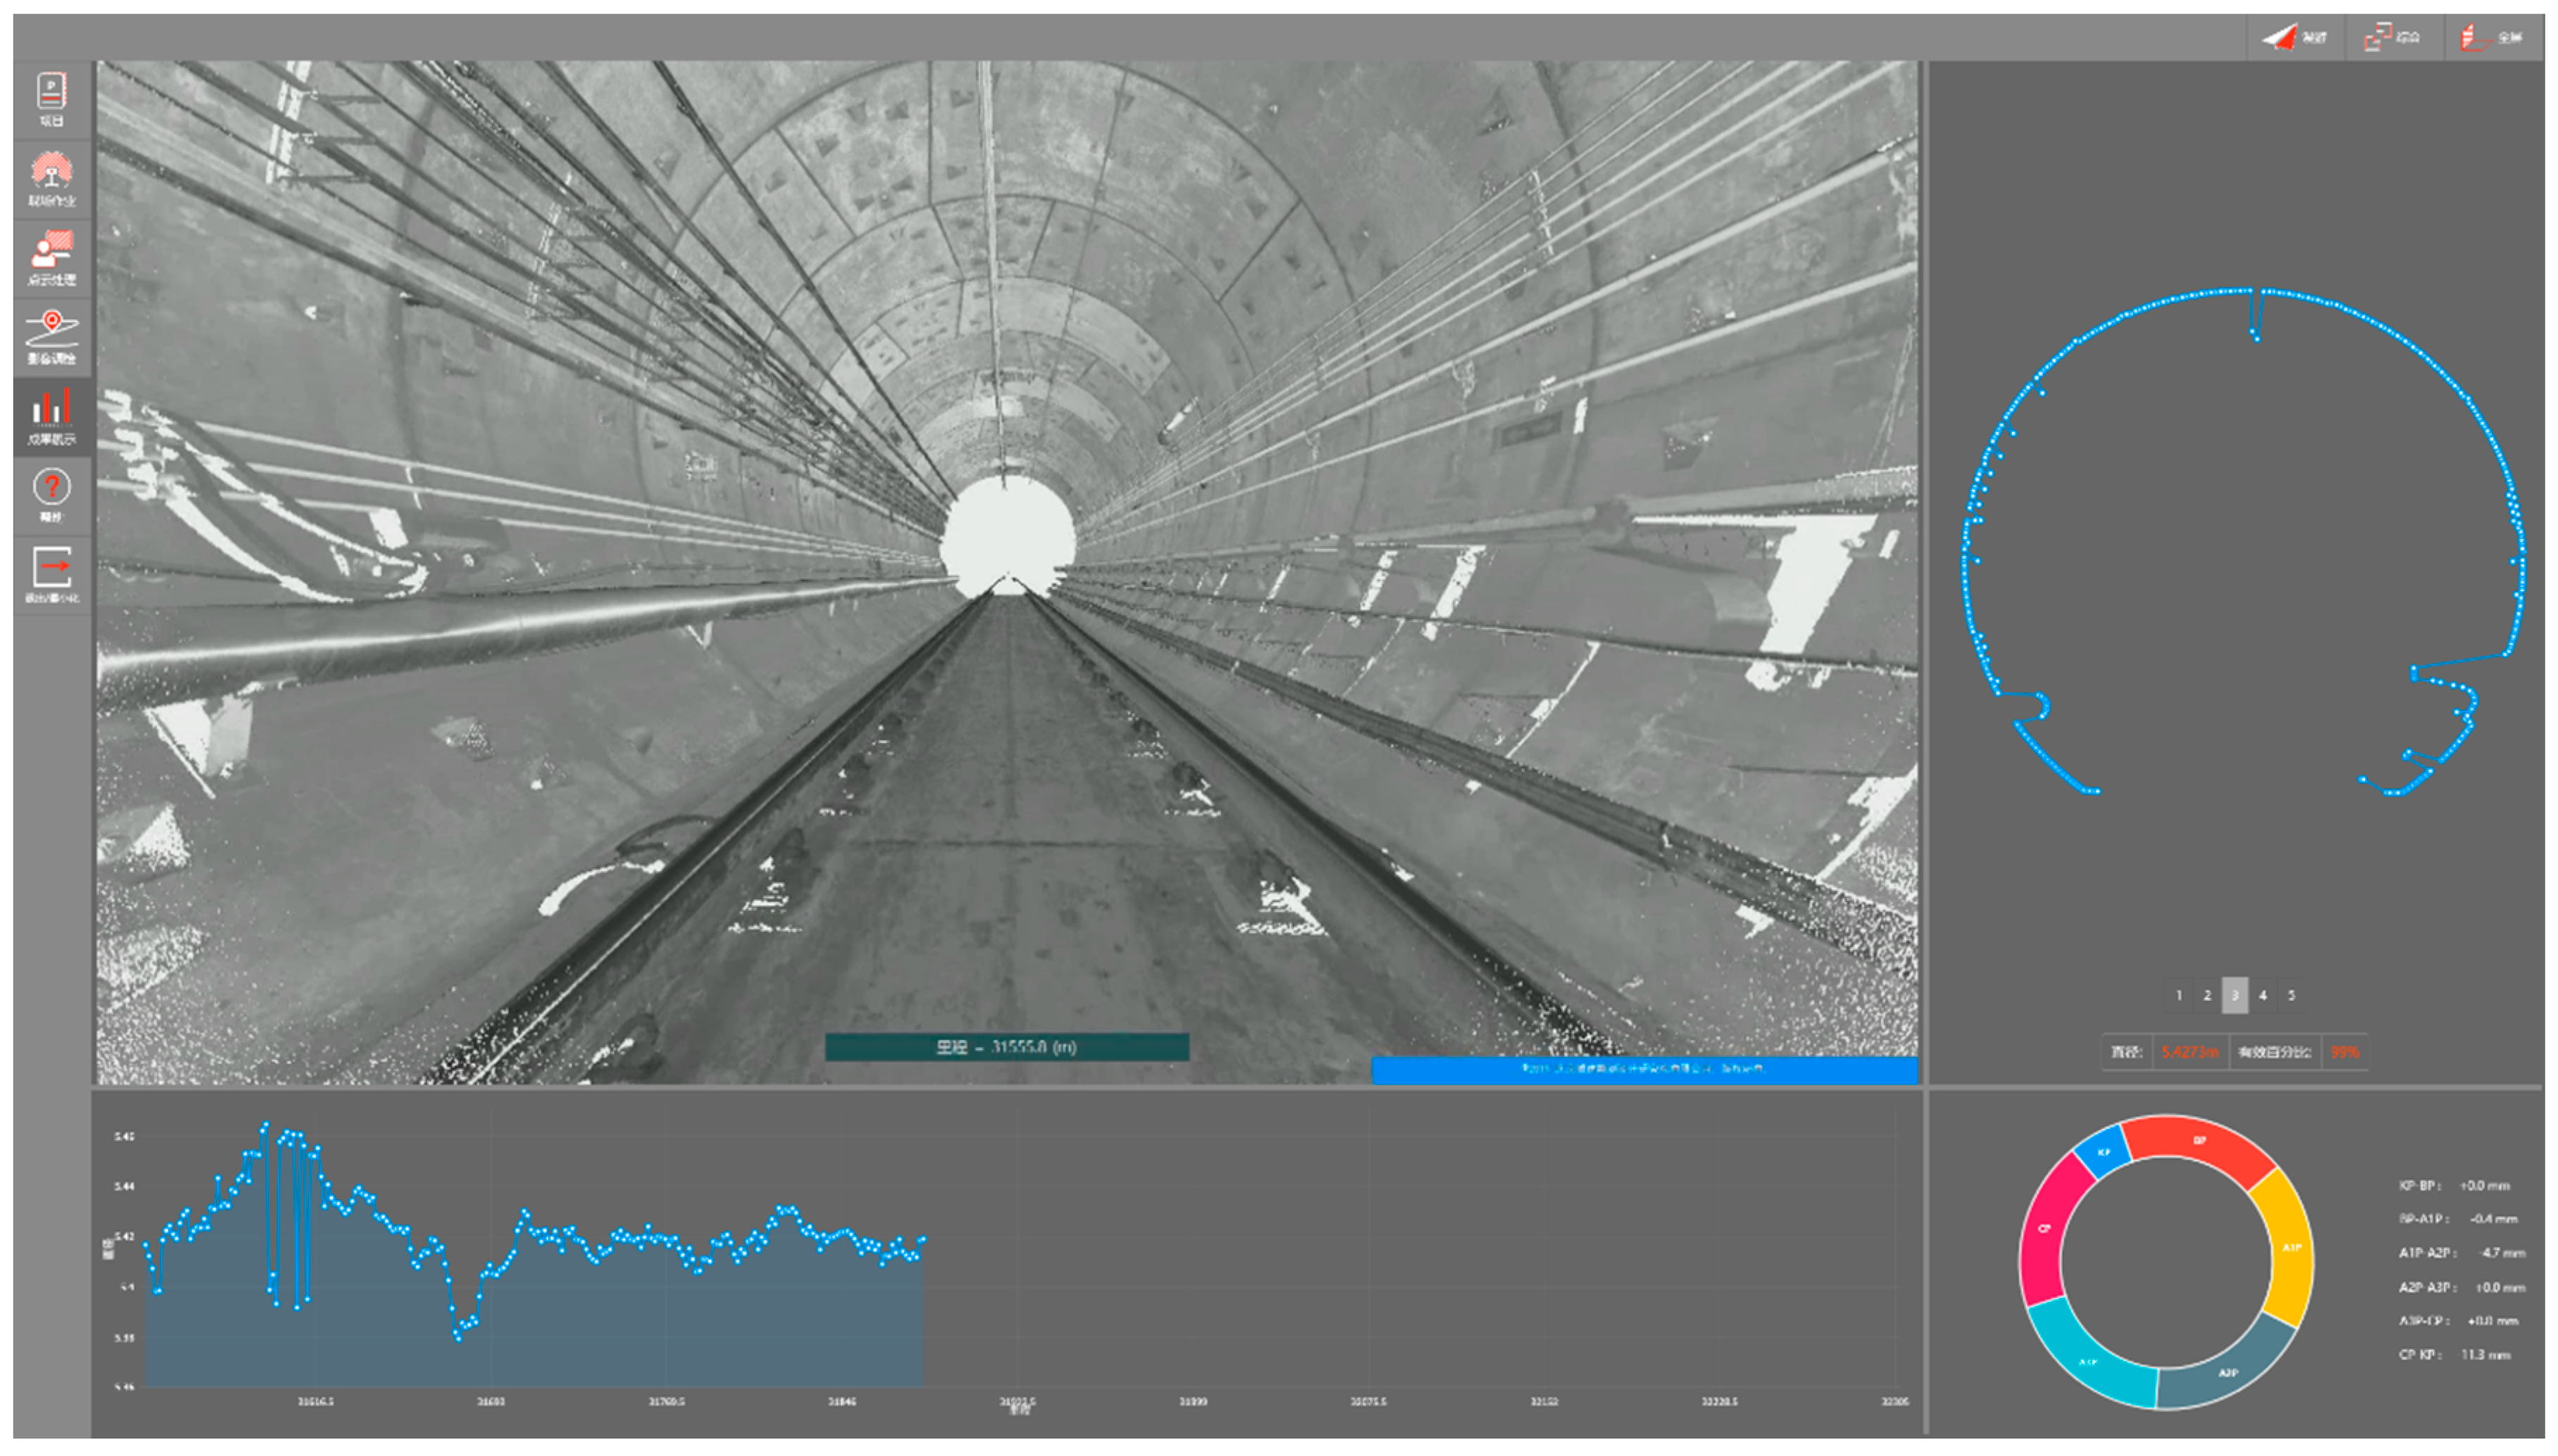
The system results display adopts the interface shown in Figure 4, which is called the “monitoring center interface.” This interface displays the video or image, full section data, convergence diameter deformation curve, wrong platform information, and so on.
The main achievements in the application scenarios of the tunnel laser scanning monitoring and measurement system include structural deformation monitoring of the formed tunnel, full-section completion acceptance measurements, tunnel status investigation and acceptance, safe and civilized construction monitoring, shield construction monitoring, and general surveying of the track bed and structure diseases.
3. Data Processing Method
The data processing function of the TMMS mainly involves section deformation calculations, dislocation analysis, disease marking, orthophoto image laser intensity image generation, and panoramic roaming video rendering. It can generate measurement reports, section CADs, disease reports, and other reports, and can upload the results to the designated system platform.
3.1. Section Deformation Analysis
The main purposes of the section deformation analysis of a circular shield tunnel are to fit the section line with an ellipse or circle, calculate the convergence diameter and section fitting deviation, and analyze the convergence diameter and full-section deformations. In this study, robust estimation least-squares ellipse fitting was used to finely denoise the cross-section and to directly fit the cross-section line for the acquired cross-section point cloud [1]. Based on the direct least-squares model [30], a weight function and new ellipse fitting criterion were introduced.
An ellipse is a plane conic, where the general equation of a plane conic is:
where , , is the algebraic distance between the point and the curve on the plane. The corresponding conic can be obtained by summing the least algebraic distance squares of all the points. The mathematical criterion for the observation data of N points is shown in Equation (2):
According to this criterion, if all the measured points are on the conic, the general equation of a conic curve should be satisfied for any point. For points that do not satisfy the equation, least-squares fitting is performed and the error equations of the points are as follows:
After the above coefficients are obtained, the coordinates of the center point, long half-axis, short half-axis, and rotation angle of the ellipse are calculated according to the analytical geometry clock.
For the conic model, it is necessary to add the restriction of to ensure that the fitting results are elliptic. Otherwise, the fitting result may be parabolic or hyperbolic. Assuming that the observation values of each point are independent, the weight function (P is a diagonal matrix) is introduced, and a new ellipse criterion is introduced:
The new criterion not only uses the "weight" in the adjustment theory as a more accurate expression of the extreme values, but also introduces the parameter limit condition of the conic as the graph limit condition. It uses the correction number after the last fitting to determine the weight. This process is utilized to reduce the influence of the gross error on the fitting accuracy to gradually improve the accuracy and ensure that the fitting results are elliptical.
Then, the parameters of the elliptic equation corresponding to each section are obtained, including the coefficients, central coordinates, long half-axis, short half-axis, and rotation angle of the equation. Afterward, the deformation deviations of the section are given. In the actual calculation process, the existence of various appurtenances on the inner wall of the tunnel causes part of the tunnel wall to be blocked during the data acquisition process. This feature makes the tunnel cross-section appear to have more point clouds missing in the horizontal direction after fine denoising, and there are no cross-section points. In this case, all the section points in a certain angle range near the horizontal are used for local conic fitting, and the intersection of the direction line of the angle and the fitted curve is calculated as the section point. The convergence diameter is also calculated accordingly.
3.2. Tunnel Image Generation and Tunnel Segment Seam Recognition
Image generation and tunnel segment joint recognition methods were utilized in previous research [23]. Because the original section point cloud data are all in the local coordinate system, the actual measurement of each 2D section expands along the track according to the mileage to form a 3D point cloud. There is no curve line in the tunnel, which is close to a regular cylinder. Therefore, the cylindrical projection method was used in this study to expand the tunnel point cloud into a plane and generate grayscale images. In the actual calculation process, the center of each cross-section is fitted with the standard equation of a circle and uses the least-squares method. Then, the center of each cross-section is taken as the origin, the vertical upward ray is in the direction of 0°, the right is positive along the tunnel direction, and the left is negative when calculating the angle between each cross-section point and the starting direction. The design radius of each segment is used to calculate the angle of each point. The arc length is recorded as the vertical coordinate of each point after the projection, and the horizontal coordinate of the point cloud after the projection of each section is directly recorded as the mileage of the corresponding section. After the point cloud is projected, according to the inverse distance weighted algorithm, the intensity information is used to generate the gray image of the inner wall of the tunnel with the required resolution. According to different data sources and working speeds, the resolution of the image of the inner wall of the tunnel is between 0.5 and 2 mm. This image is mainly used for quantitative measurement of the location, area, and distribution of water leakage in the tunnel. Compared with ordinary digital camera photographs, this image has full coverage, accurate measurement, and no lighting. High-frequency, high-resolution tunnel images are conducive to the timely detection of various potential safety hazards in the tunnel, reducing the shortcomings of manual inspection, such as missing inspection, uncertainty indexes, etc. As there is no curve type in the measured point cloud of the tunnel section, the joints between segments are basically vertical to the horizontal axis after the projection expansion. Furthermore, the gray value of the image at the segment joints are significantly different from the gray values in the left and right segments. Hence, the generated image is used to identify the segment joints along the rail direction of the tunnel. However, the intensity distribution of the measured point cloud differs due to the influence of the material, roughness, and illumination of the inner wall of the tunnel. This variation results in uneven gray levels of generated images; thus, in the actual seam extraction process, the seam position cannot be obtained using the traditional gradient calculation method.
Therefore, in this study, the segment seam was identified via calculating the gradient accumulation value in the vertical direction of the tunnel image with a certain width (such as the image generated by selecting any 30° range of point cloud along the circular direction of the tunnel). First, the gradient value of the gray image along the length direction of image was calculated. Then, the value was summed along the width direction of the image. Finally, the seam position was determined using the total gradient value in the vertical direction.
To improve the joint detection accuracy, it is necessary to detect the positive and negative peak points of each segment joint in the actual detection process (i.e., the peak value of the left and right edges of each joint), and then to set the distance threshold between the positive and negative joints at the same location to ensure the accuracy of the joint extraction. In some cases, owing to the influence of the appurtenances and factors on the inner wall of the tunnel, such as cracks and diseases, there may be errors in the test results, requiring a second test. Therefore, after the final joint position is determined, it needs to be checked in combination with the actual tunnel ring width.
3.3. Dislocation Analysis
Segment lining is generally used as the permanent support structure in a shield tunnel. The segment of a shield tunnel is generally composed of one capping block, two adjacent blocks, and several standard blocks. The number of segments differs according to the tunnel diameter (corresponding to the perimeter of the segment ring). The dislocation of the shield tunnel refers to the deviation at the joint of adjacent segments. Two types of dislocations exist, namely radial and circular dislocations [31].
The circular dislocation is based on the tunnel segment joint, extracted by a intensity gradient of tunnel image statistical method [26]., and the segment can be divided into rings. This type of the circular dislocation is based on the radial deviation calculation of the fitting of two adjacent ring sections after the ring division. In the calculations, the point cloud slices at a certain distance on both sides of the joint location and the amount of dislocation between the ring joints are determined. The circle-fitting method is adopted based on robust estimation.
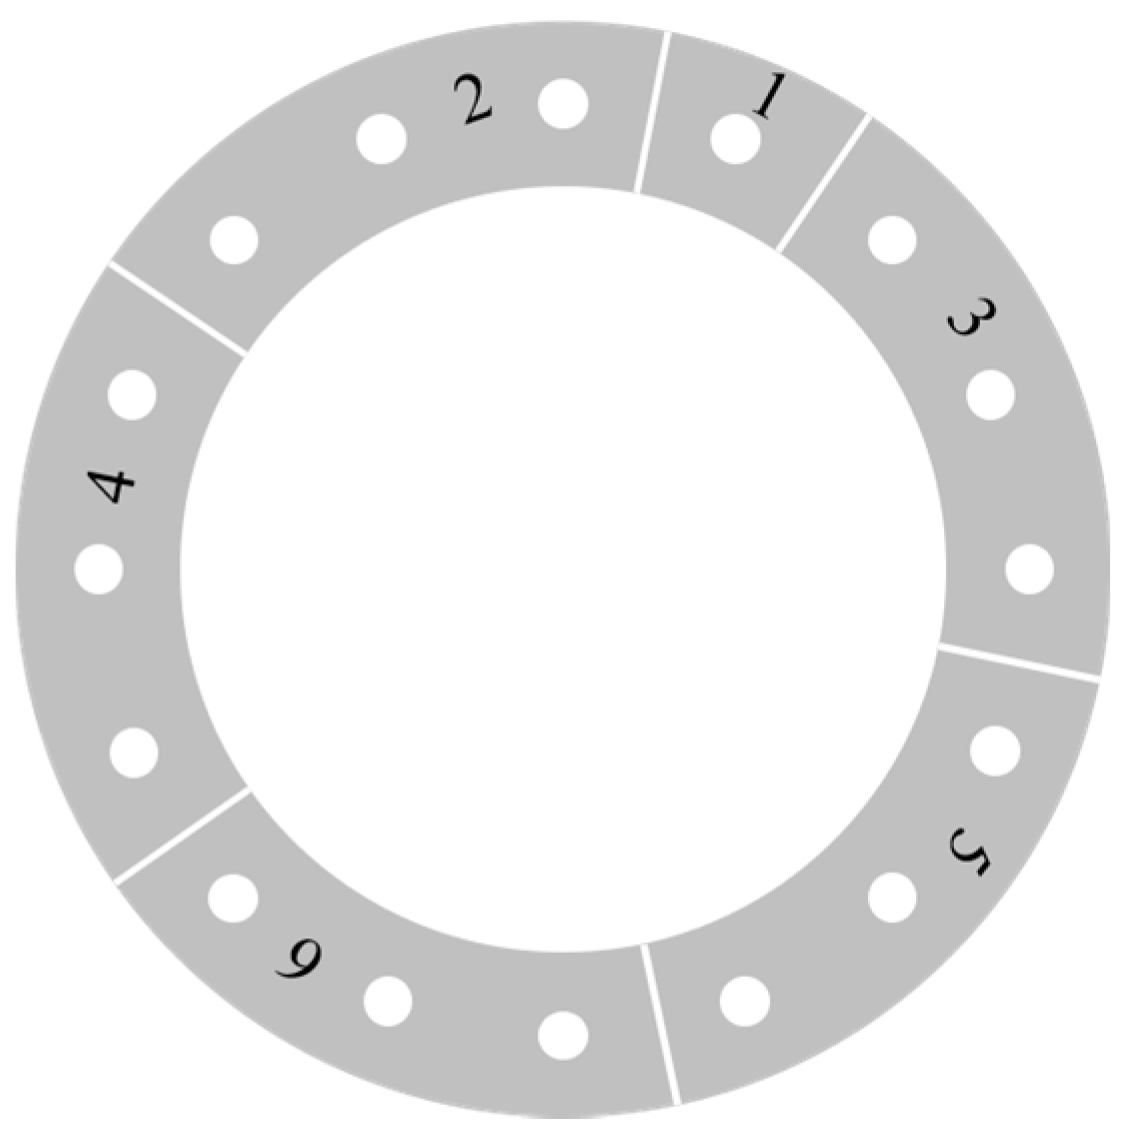
The radial dislocation in the ring needs to be solved in combination with segment segmentation. The tunnel discussed in this paper is a shield tunnel with segment joints, which consists of two standard blocks, two adjacent blocks, and one capping block. Generally, each ring includes a capping block and two adjacent blocks, which are always close to both sides of the capping block. The capping blocks alternately appear on the same azimuth of the tunnel. Figure 5 shows a schematic of a segment ring of a tunnel, where 1 is the capping block, 2 and 3 are adjacent blocks, and 4, 5, and 6 are standard blocks.
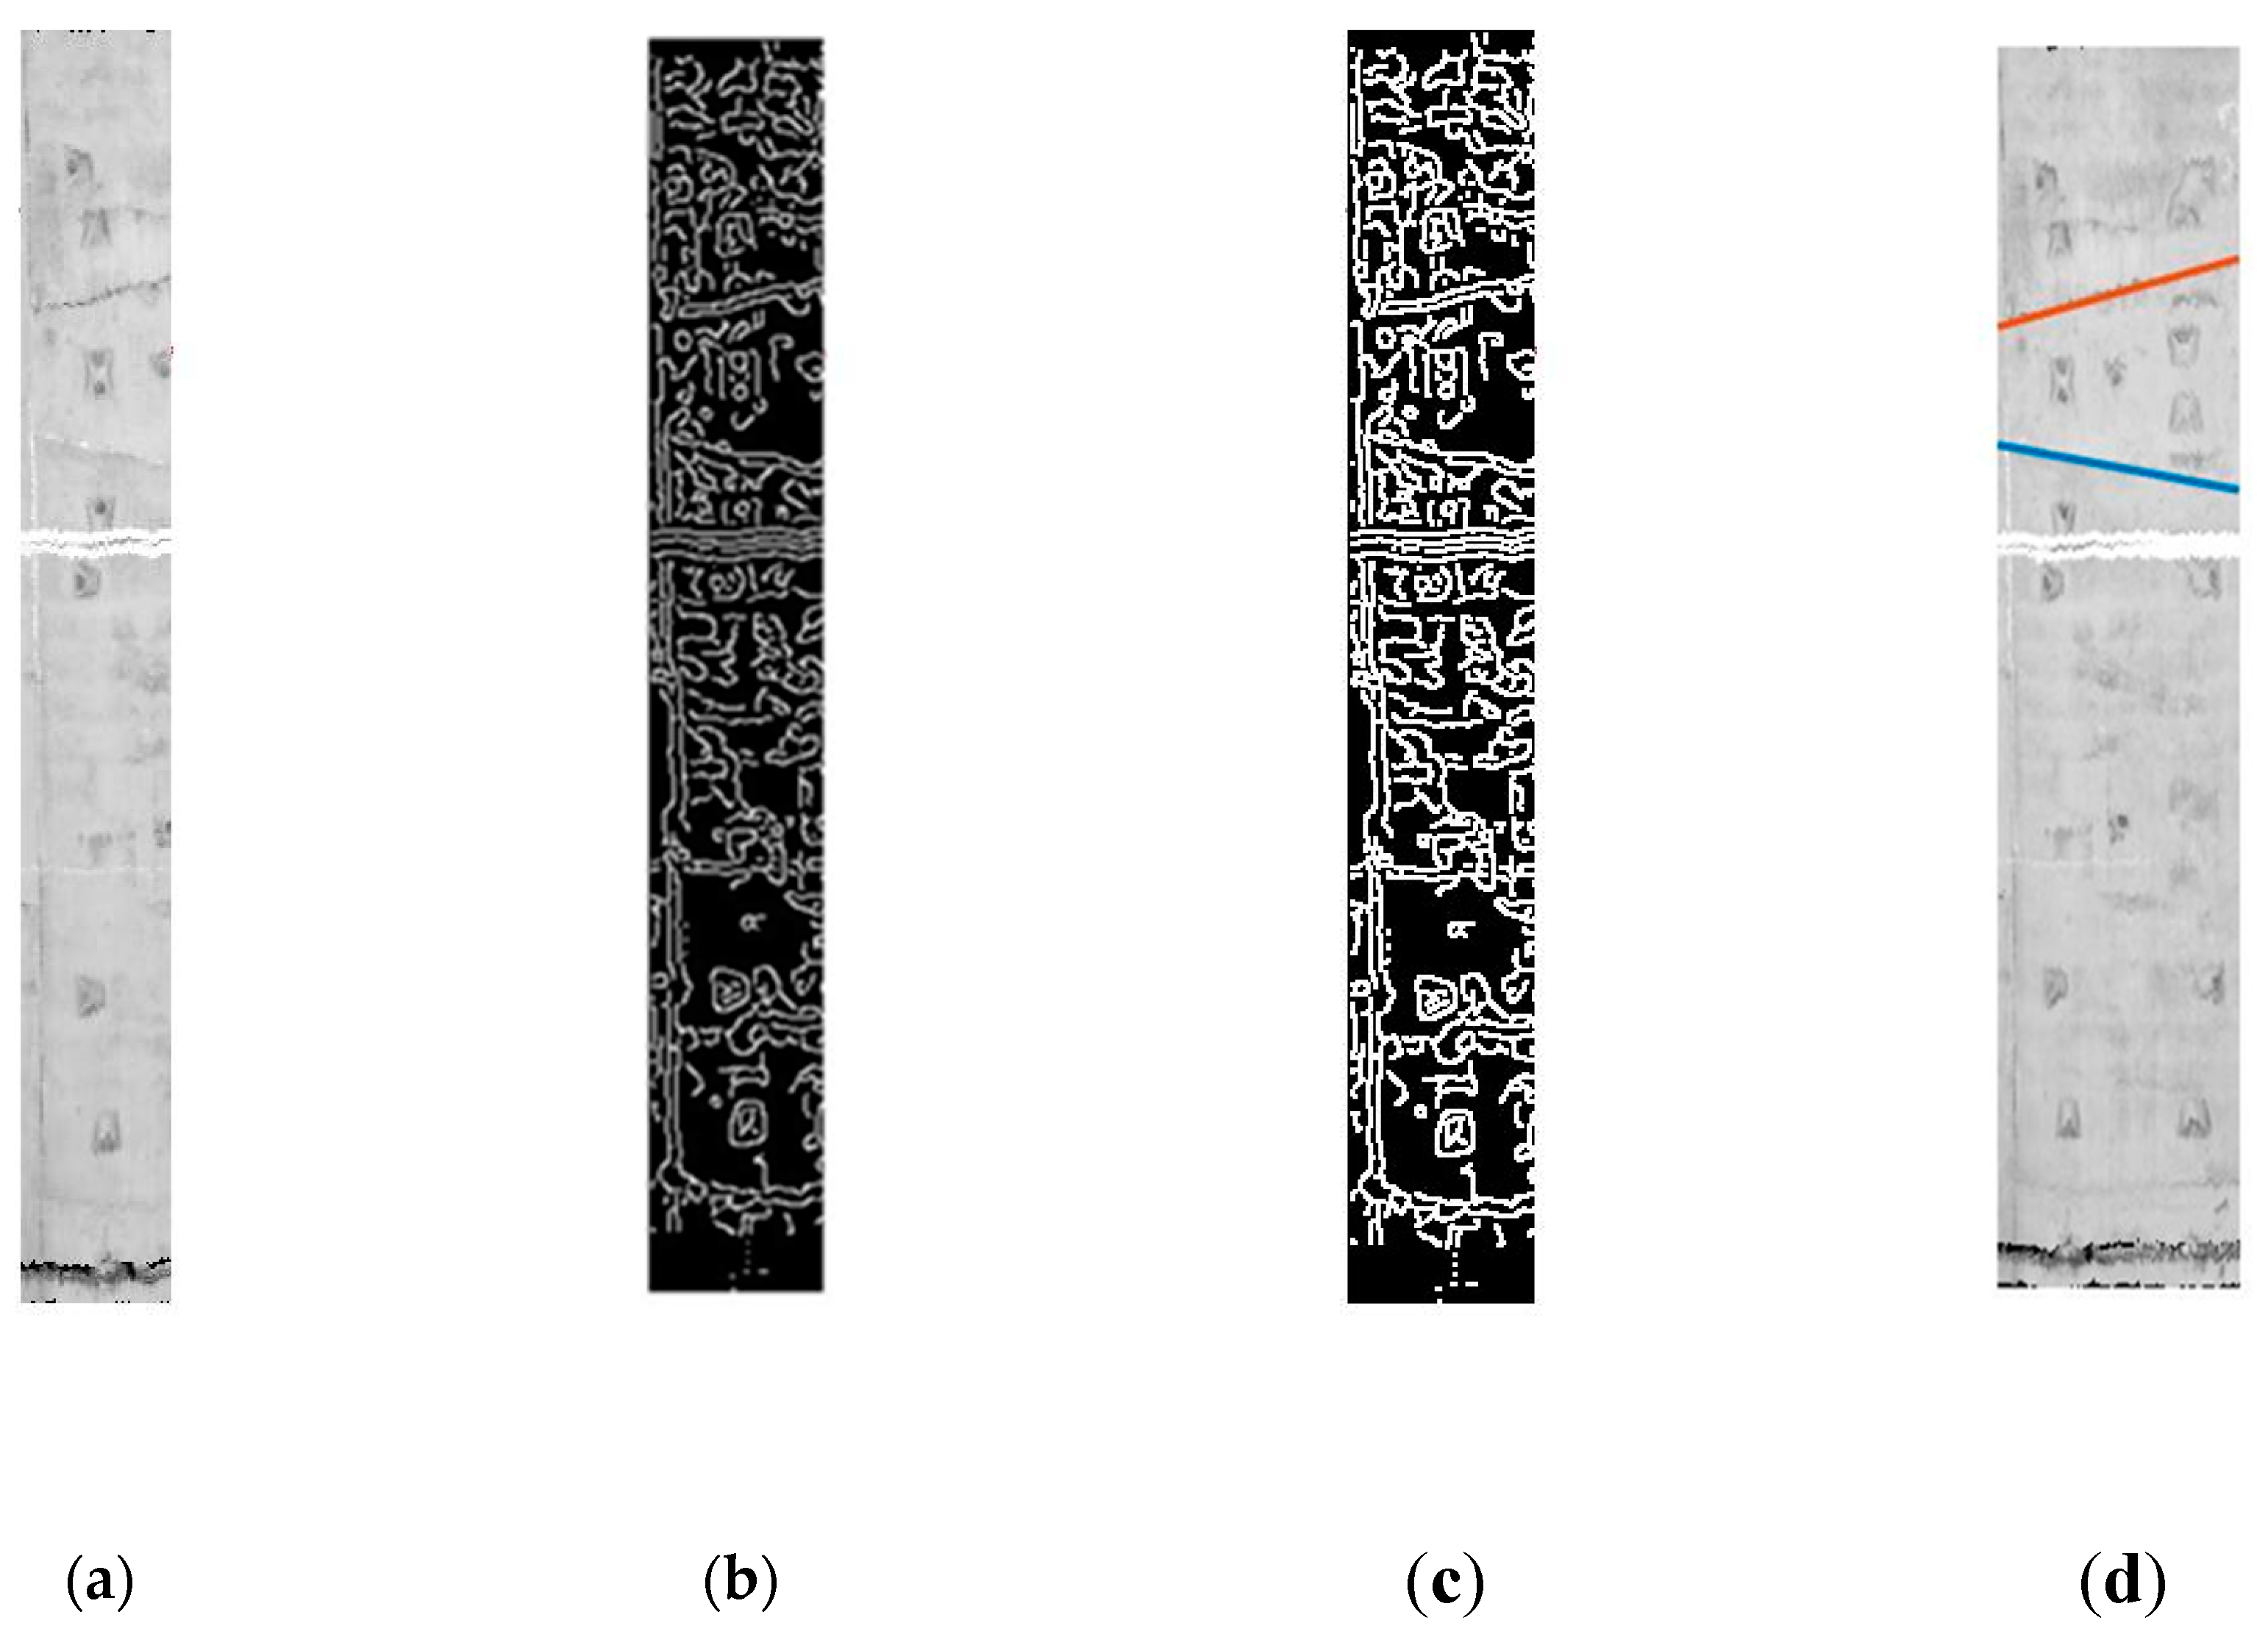
First, segmentation must be performed for the dislocation calculation. The position of the capping block at the initial scanning position is given through human-computer interaction. According to the appearance of the capping block at the top of the tunnel, an approximate azimuth is estimated to generate an orthophoto image of this angle range (the capping block is within this angle range), as shown in Figure 6a. Edge detection based on the Canny operator and line detection based on the Hough transform are applied to the orthophoto image, and the detected line is extended to identify the capping block. Figure 6b presents the results of Canny operator detection, and Figure 6c depicts the results of expanding the edge detected in Figure 6b. Based on Figure 6c, Hough line detection is performed, and the detected line is extended, as shown in Figure 6d. After the identification of the capping block location, combined with the design data of the crapping block edge line and the segment angle in the segment, the adjacent block and the standard block are divided. According to the results, each block is fitted with a robust estimation circle, and according to the fitting arc, the radial distance deviation of the adjacent arcs is calculated (that is, the amount of dislocation in the ring).
3.4. Disease Extraction
In this research scheme, a 2-mm resolution orthophoto plus photographs of the hidden area are used as the basic data sources, and the comprehensive method of automatic identification plus manual review and confirmation plus field survey and verification is used for the disease identification. The disease detection results are sorted into special reports, and the location and area of the disease occurrences are calculated according to the tunnel interval and disease type. Water leakage is the main tunnel disease. In this study, water leakage was used as an example to introduce the method of disease extraction. In this system, disease extraction is realized using human-computer interaction. The automatic extraction algorithm mainly relies on the connected domain analysis algorithm in IP. Based on the image generation of the inner wall of the tunnel, the image is de-noised and binary segmentation is performed. After the segmentation, there may be discrete noises (such as bolt holes), which can be removed by median filtering. After the water leakage information is segmented, the connectivity domain analysis algorithm is used; that is, black pixels (water leakage) are marked in the binary image, where each individual water leakage region forms an independent connectivity domain, along with the number, area, location, and other parameters of the water leakage region. Owing to the complexity of the structures and diseases in actual tunnels, the IP method sometimes receives some interference, such as cement falling. Thus, the data processing software developed in this study also provides a manual annotation function, which can be used to determine the disease edge line through the disease boundary point, and can calculate the disease’s area and other information according to the human annotation results.
3.5. Roaming Video
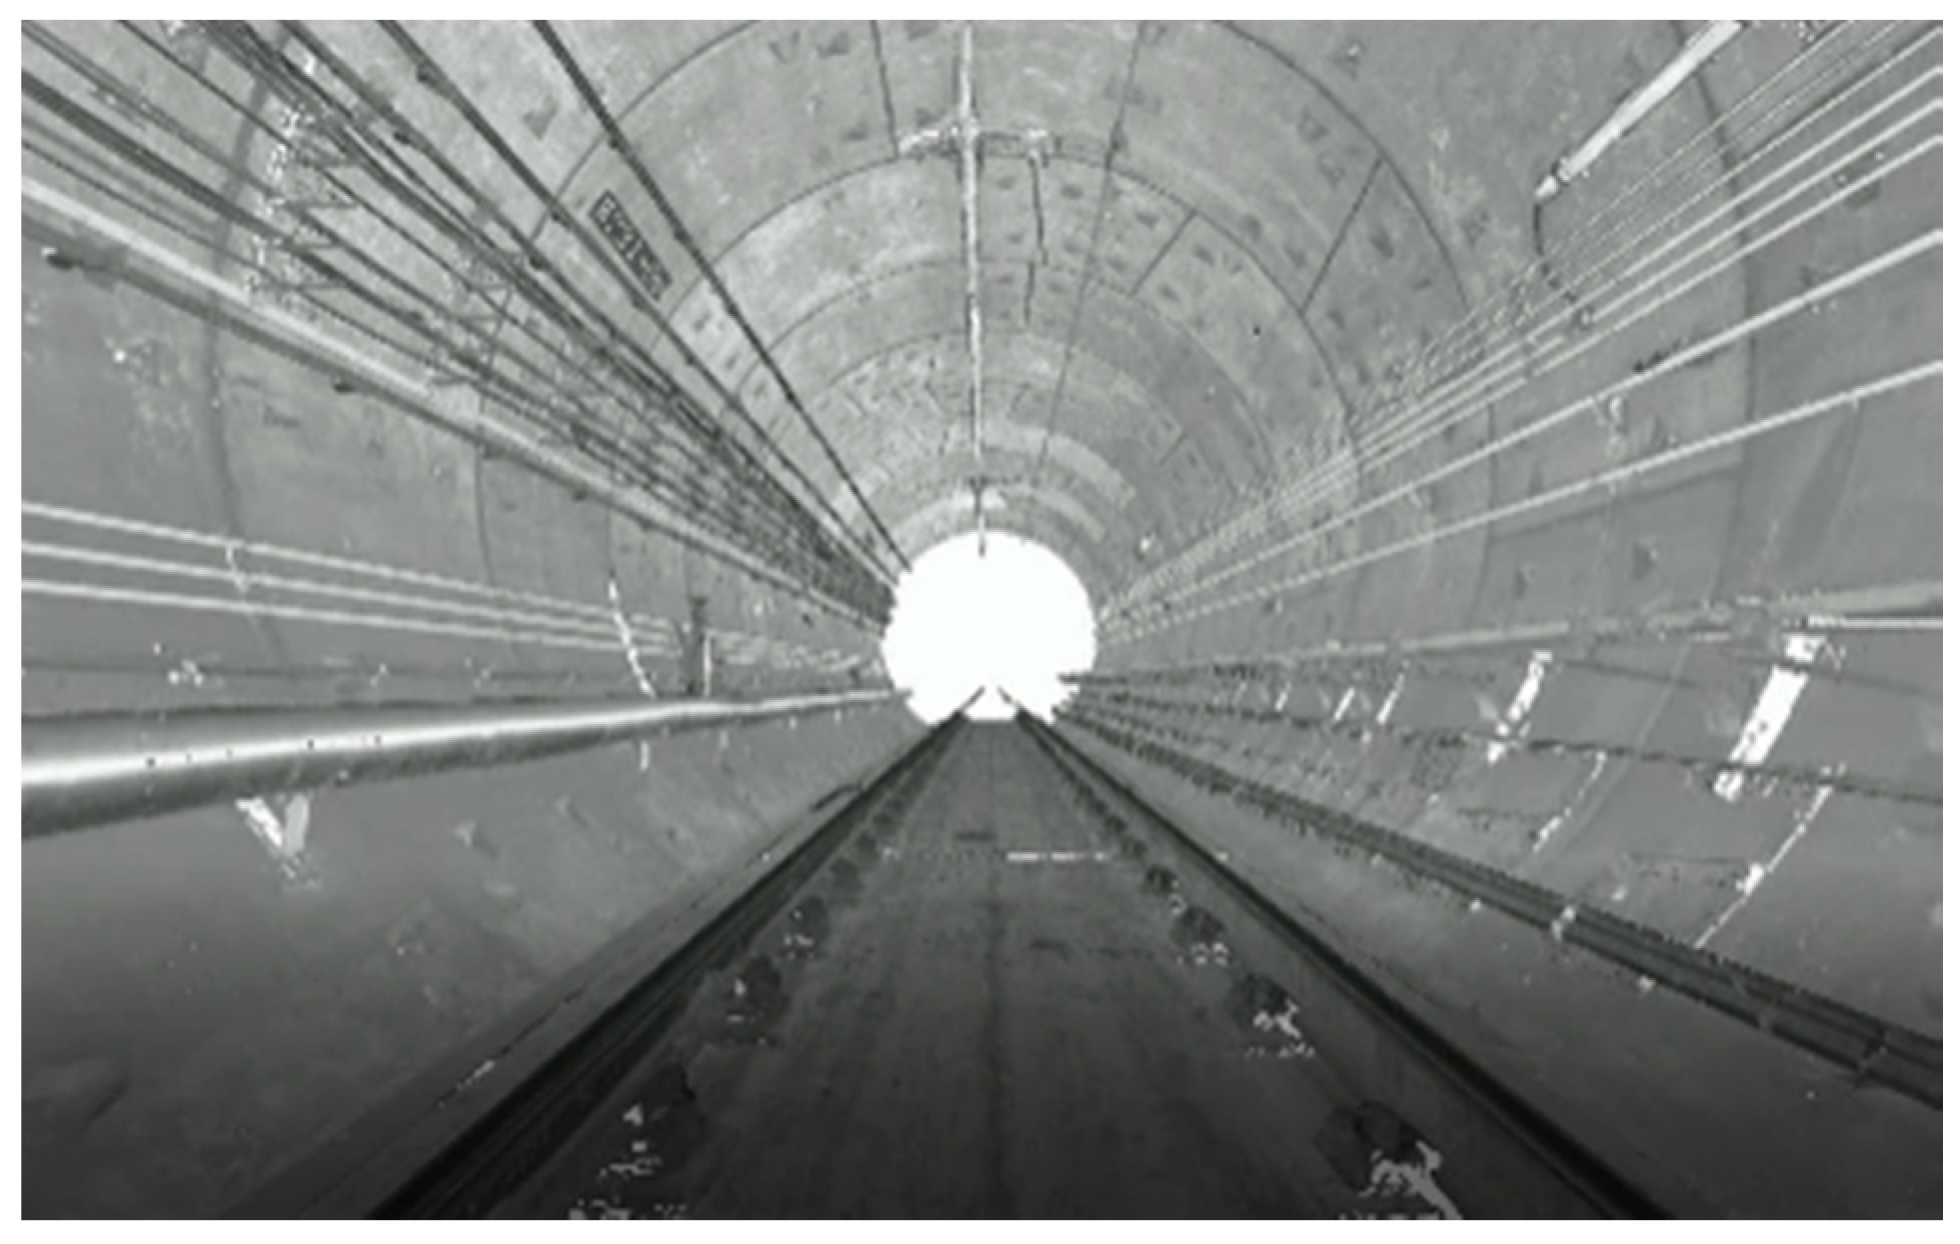
To solve the visualization problem of tunnel scanning point cloud data and the settlement results, and to avoid the large amount of manpower needed for artificial modeling, the XY coordinate, mileage and reflectivity information of the scanning point cloud were used in this study to generate video directly. Furthermore, the first-person perspective was used to generate roaming video from different angles, such as a front view (Figure 7), top view, left view, and right view, to integrate the real texture and ring number mileage. Diameter deformation, wrong platform, auxiliary facilities, etc. may be integrated into the video to provide relevant leaders and monitoring personnel with an intuitive, efficient, and general local style for viewing the monitoring and measurement results. The basic steps of the video generation include the following: organizing scan data in the memory or in-display memory; generating a memory image of the current frame using perspective projection, by selecting a standard cylinder, or the solid object stereo method; generating continuous multi-frame images according to the motion speed; synthesizing video using multi-frame images; and adding other information to the video simultaneously. The objective of this study was to generate roaming video directly from a laser scanning point cloud, which greatly reduces the manpower investment of the segment modeling plus block mapping used in traditional modeling methods, and can more intuitively reflect the current tunnel situation.
4. Experimental Results
4.1. System Accuracy Analysis
At the beginning of the system integration, to investigate a first-generation hand push detection system (integrating Faro laser scanner), a system accuracy test was conducted at the completion of the Chengdu metro tunnel. The accuracy of the system was compared with that of the existing mainstream measurement method, namely the total station method, and the accuracy of the external system was verified through a mobile system back measurement. Furthermore, the deformation detection system was combined with an artificial foam board. The accuracy deviation between the convergence diameter measured by this system and that measured by the total station method was ±3 mm (1.6 mm), which conforms to the long-term tunnel monitoring and measurement requirements established in the code for the monitoring and measurement of urban rail transit structures [32]. The convergence measurement accuracy is required to be better than ±3 mm, which indicates that this system can be utilized for tunnel deformation detection. The average deviation of the convergence diameter when measured back and forth was within ±1.5 mm, and the artificial deformation detection error was ±1.1 mm [25].
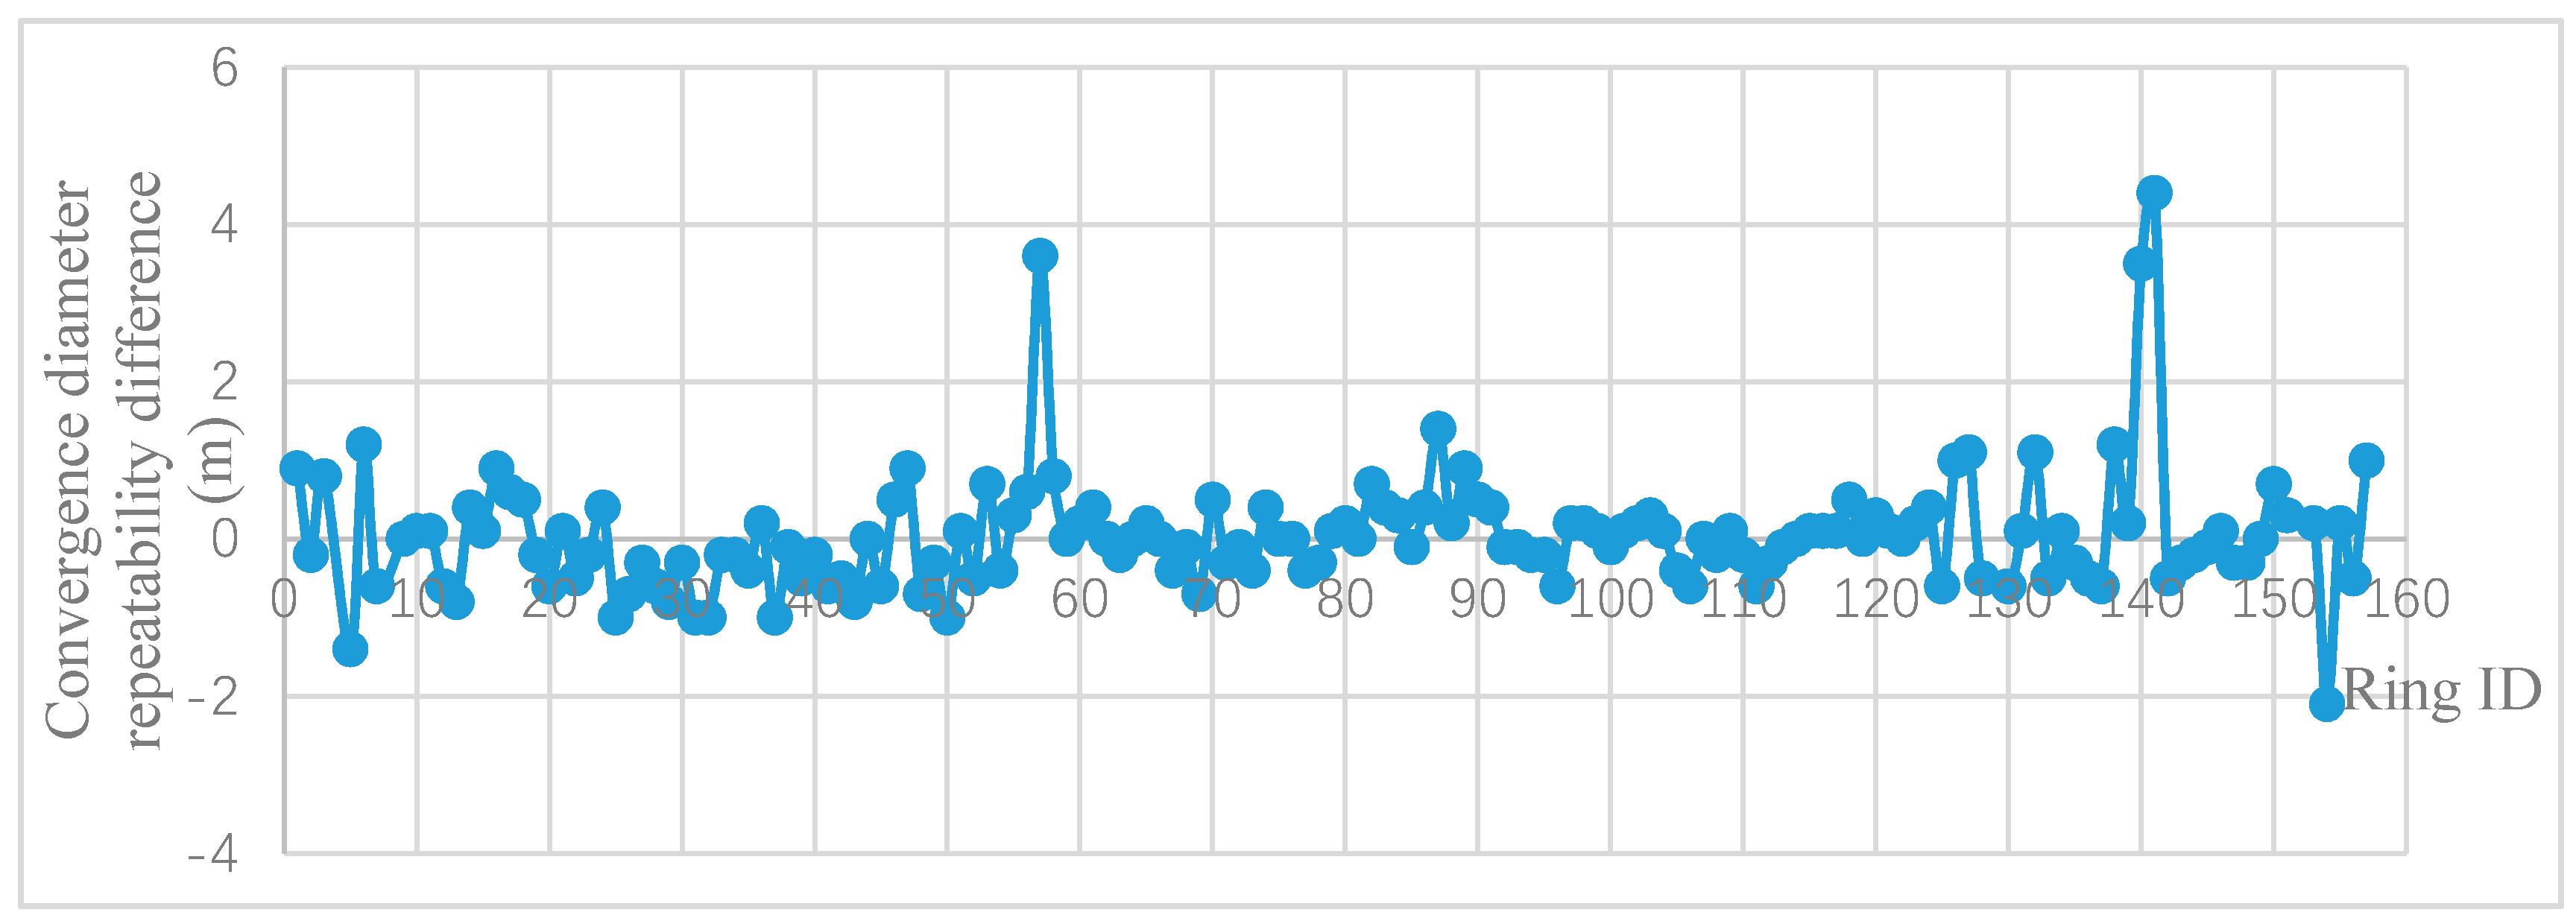
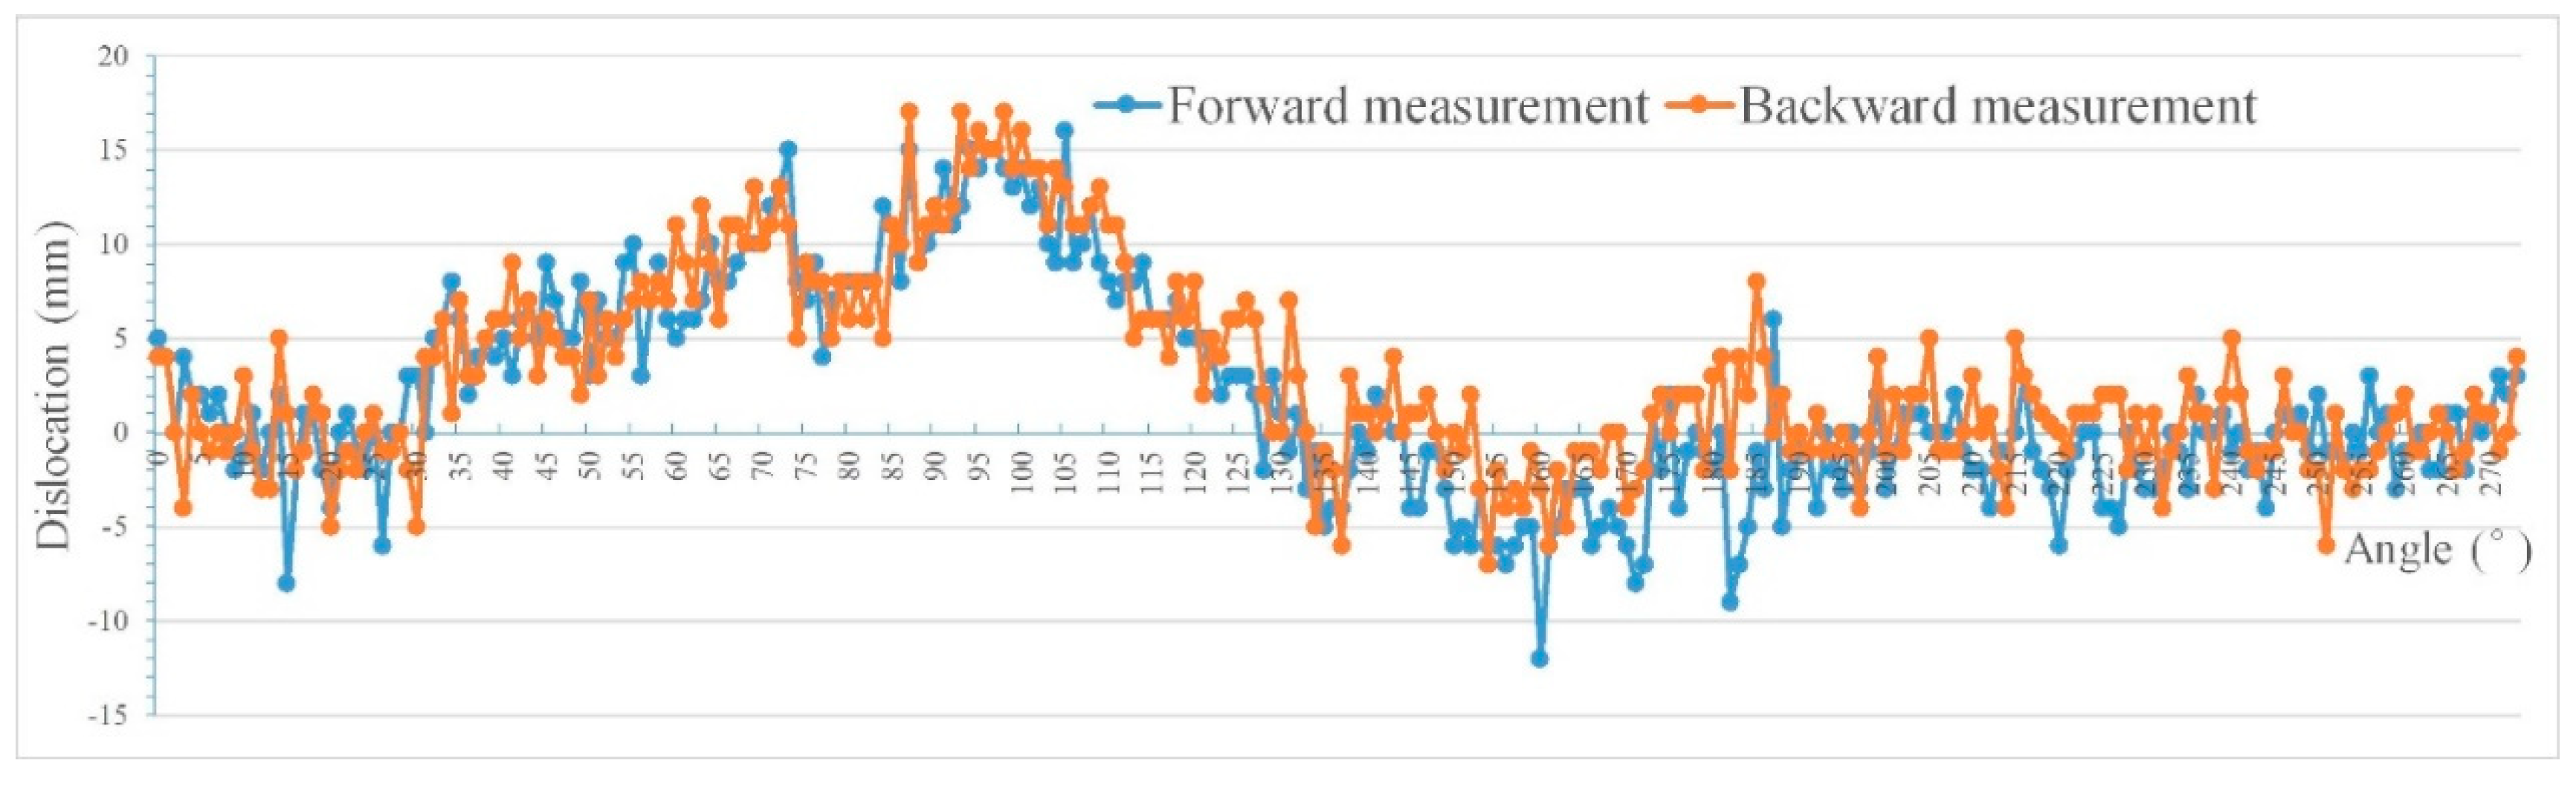
To verify the accuracy of the second generation of the electric detection system, a section of Tianjin Metro was scanned. Specifically, 157 rings were scanned in the section during the round-trip scanning, excluding interfering factors, such as the axle counter, side channel, occlusion, and gross error of the two rings. Further, 153 groups of data of the convergence diameter of each ring were successfully obtained. The average mean squared error of the data was 0.5 mm. Figure 8 shows the specific convergence diameter data, and Table 2 presents the statistical analysis results. A total of 94% of the repeated measurement deviations were within 1 mm. The mean of the dislocation deviation in the forward and backward measurements was about 3.0 mm and Figure 9 shows the dislocation on the whole ring (about 273° without the track) in the forward and backward measurement, and the mean deviation was 2.5 mm.
4.2. Engineering Application
Using the research system employed in this study, a tunnel detection engineering application was performed in a certain section of the Zhengzhou metro. The electric constant speed detection trolley and Z+F9012 laser section meter were used for a 2.5-h round-trip measurement, and 1.5 km (approximately 17.6 GB) of original point cloud data were obtained. The data collection site is shown in Figure 10. The results of the deformation detection, such as tunnel diseases, track bed diseases, horizontal diameter, and ring dislocation detection, as well as a panoramic roaming video, were obtained, and the detailed disease investigation was focused on an area with steel ring reinforcement and a diameter convergence >6 cm.
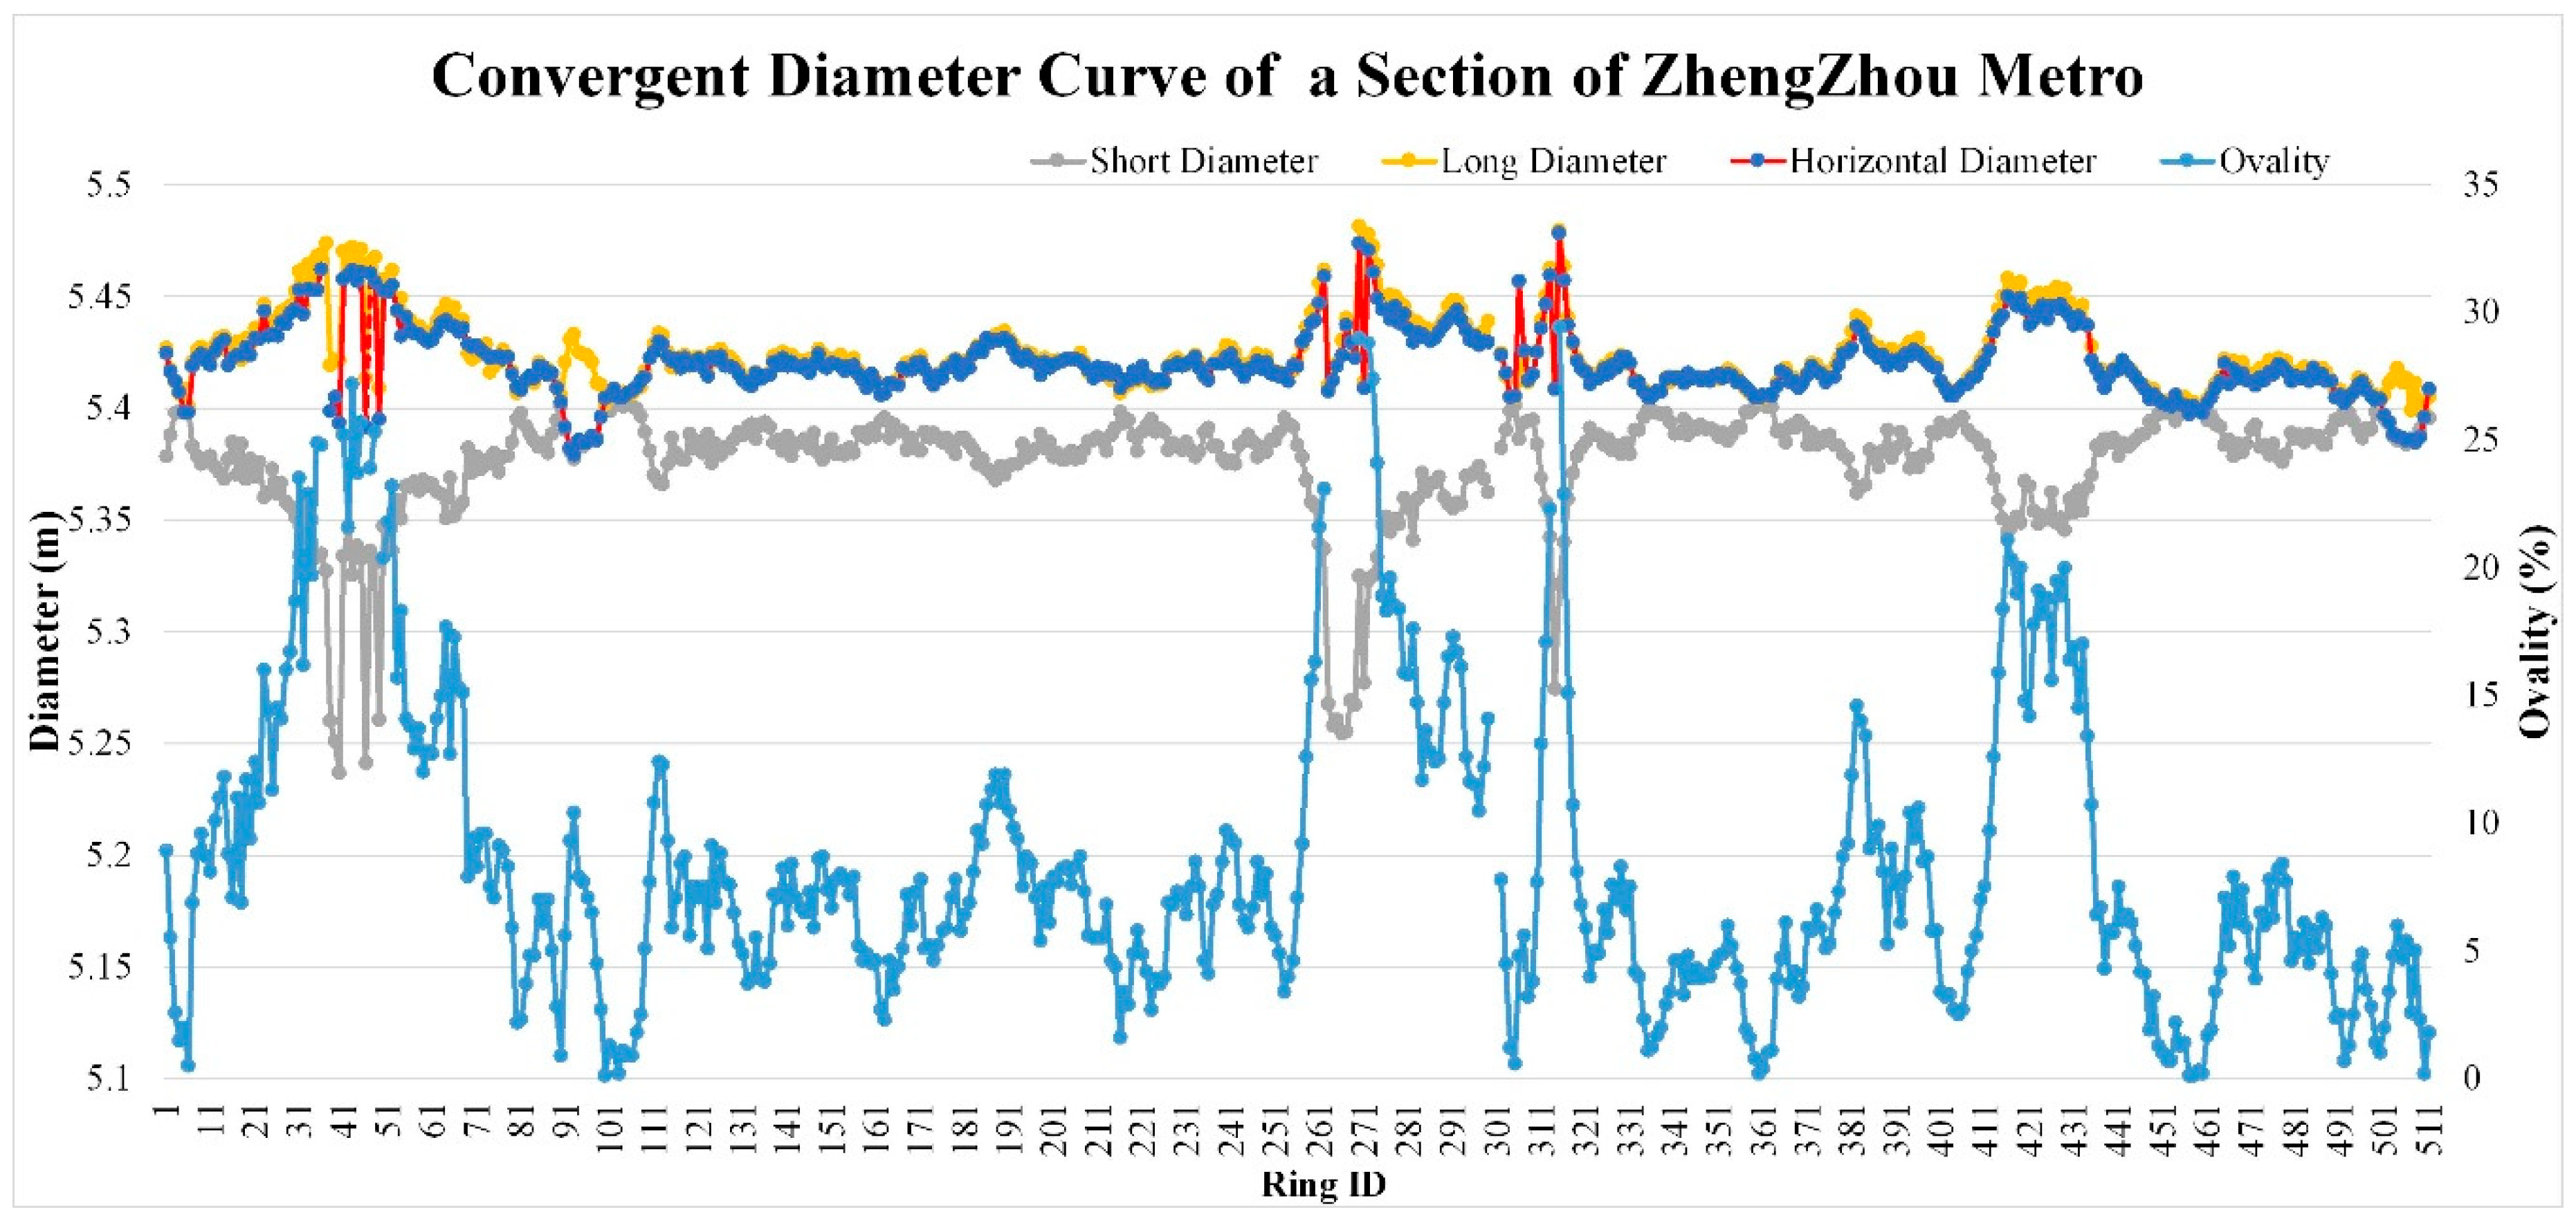
In the scan, 511 rings in this section were measured. Except for the interfering factors, such as the axle counter, side channels, and shelters, 495 groups of data were successfully obtained. The design inner diameter of the detection section was D = 5.400 m, the maximum horizontal diameter deviation was 7.8 cm (ring 197), the maximum ovality deviation was 29.4‰ (ring 197), and the diameter deviation of 92 rings (excluding steel ring reinforcements and uncovered measurements) exceeded 6‰ of D (diameter), accounting for 18.0%. There were 289 rings with ovality >6‰ of D, accounting for 56.5%, and there were 9 rings (ring 197, 239, 240, 242, 465, 467, 469, 475, 476) with horizontal diameters deviating from the design inner diameter by more than 6 cm. The statistical information is shown in Table 3, and the diameter and ovality convergency curves are shown in Figure 11.
The Zhengzhou Metro data that were obtained revealed that the standard deviation of the repeated measurement of convergence in the round-trip measurement in this section was 0.9 mm. A convergence deformation monitoring accuracy of ±2 mm was guaranteed according to the estimation of two times the mean square error.
There were 289 rings with ovality exceeding the specification (6‰ of D), accounting for 56.5% of the total number of rings in the section, whereas 42 rings (8.2%) had an ovality of more than 18‰ of D. These were mainly distributed in the areas adjacent to the steel ring reinforcements, and the horizontal diameter deviations were >4.5 cm. The statistical information is shown in Table 4.
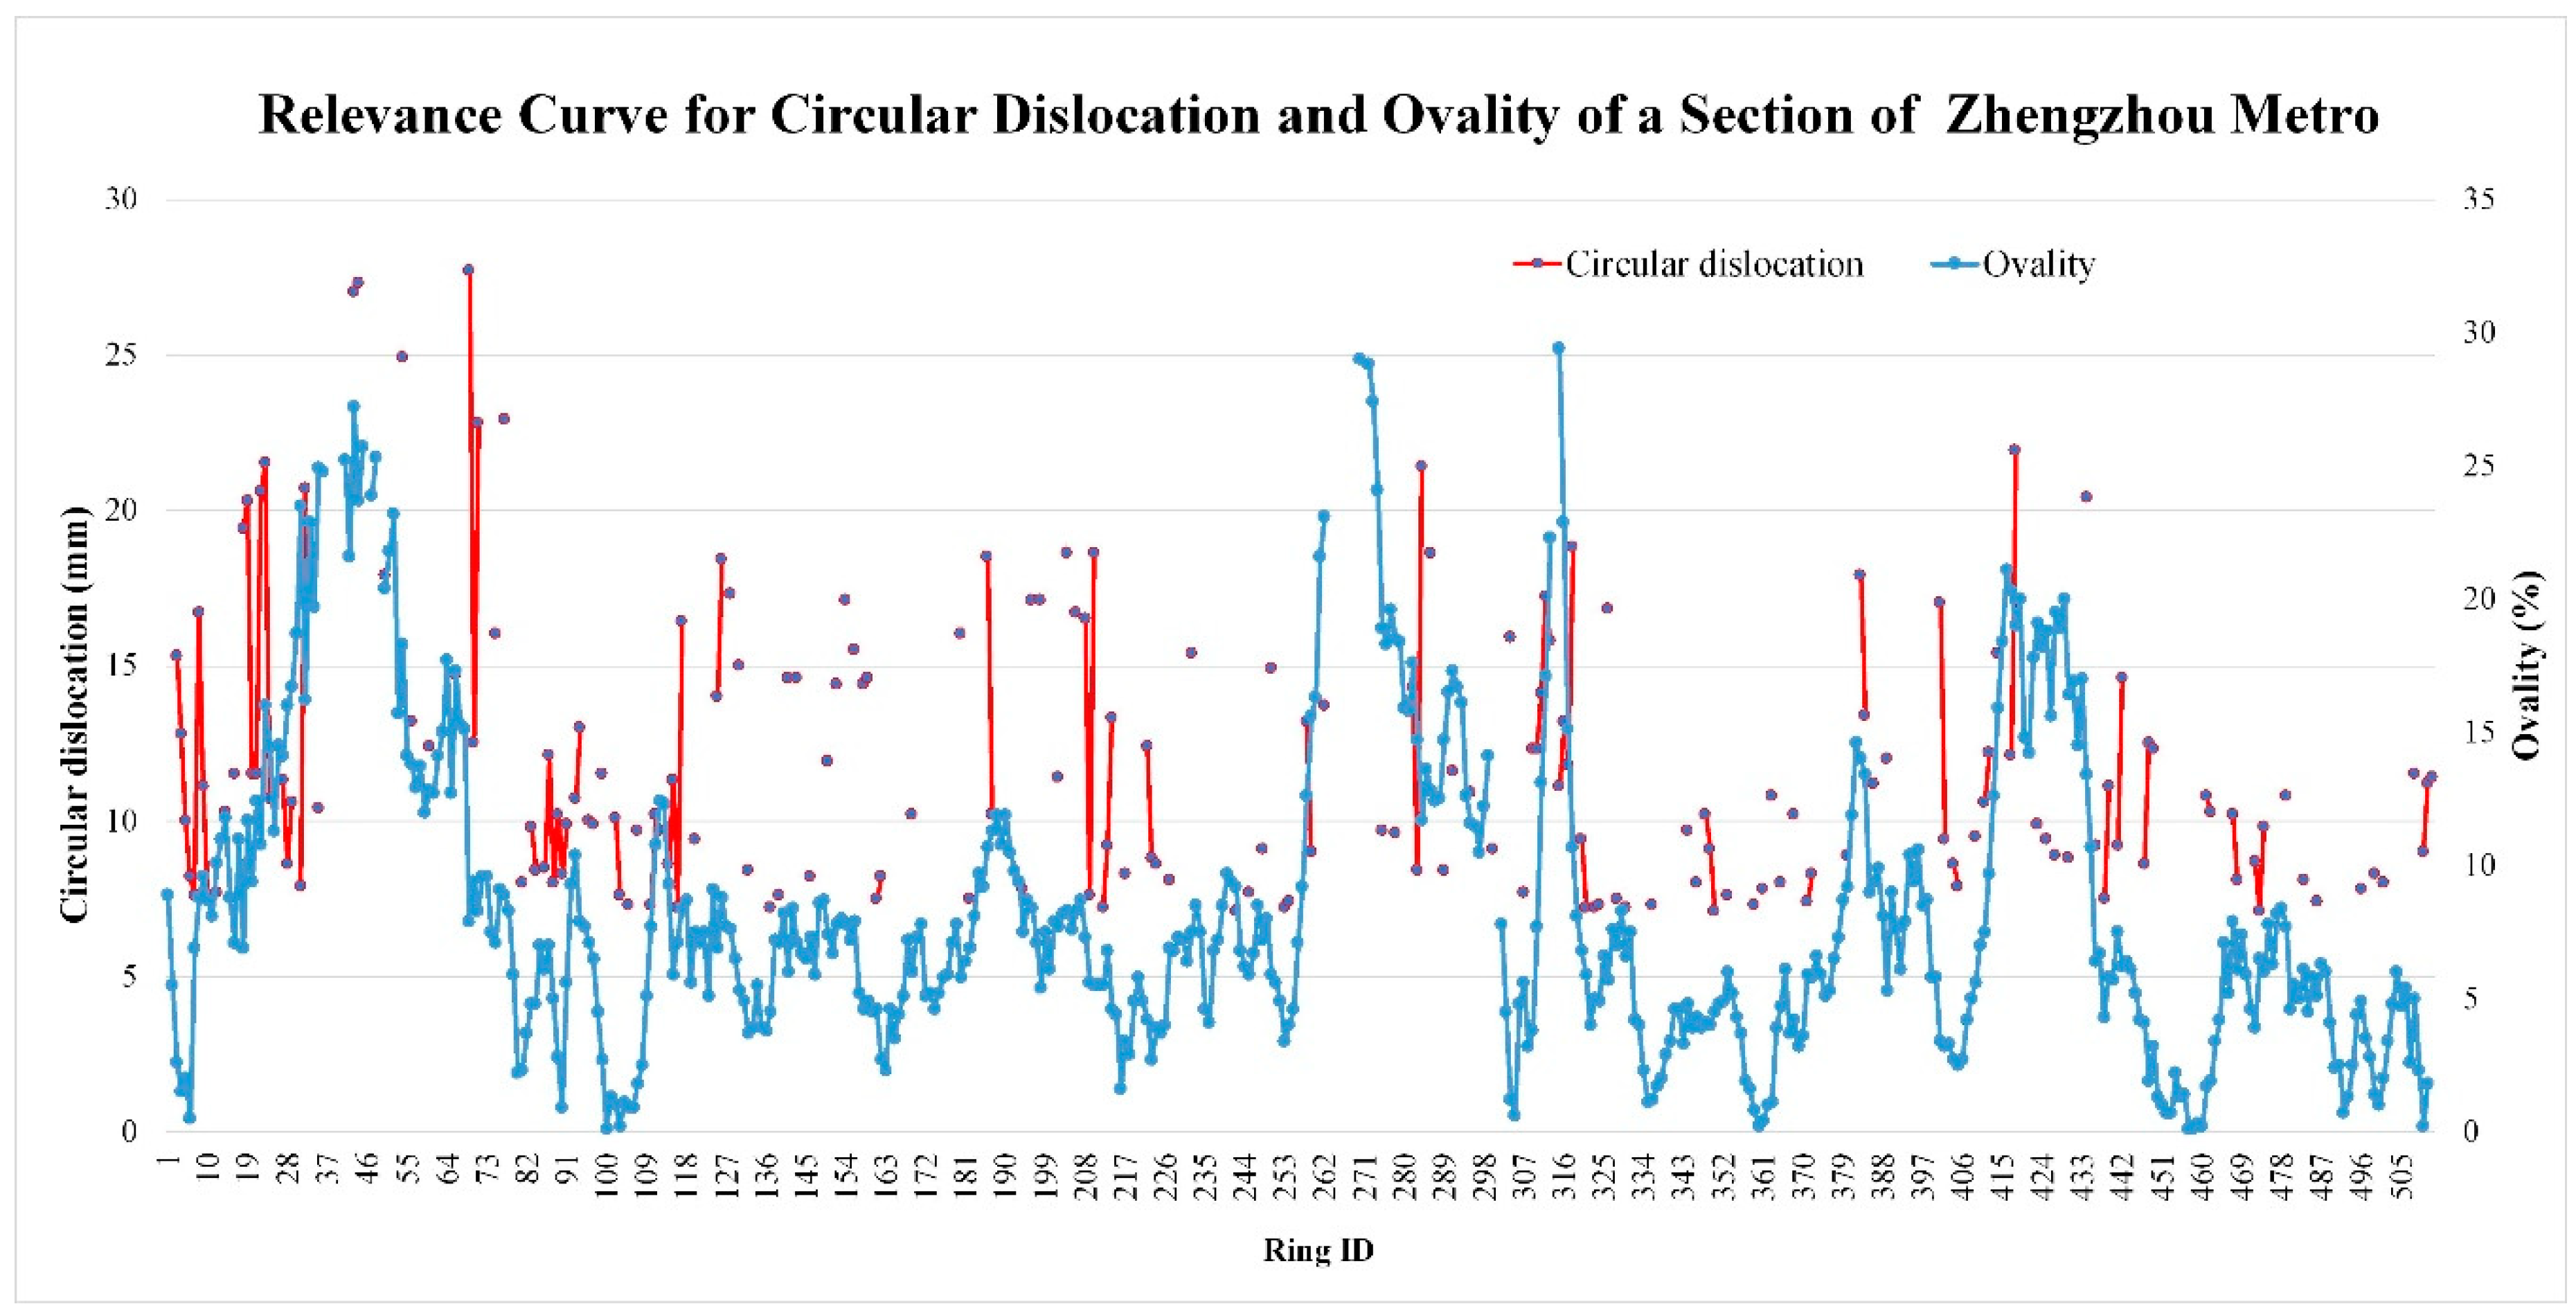
Forty-three rings were found with circular dislocations exceeding the limit of 15 mm in this section. The maximum circular dislocation was located in ring 444–443, where the stagger angle was 318°–274° (upper left), the arc length of continuous stagger was 2.121 m, and the average stagger was 27.7 mm. The stagger between rings was affected by the tunnel curve, splicing quality, and structural deformation, but was mainly distributed in the area with ovality deviations of more than 6‰ of D. The circular dislocation measurement accuracy reached ±3 mm. The relevance curve for circular dislocation and ovality of a section of Zhengzhou Metro is shown in Figure 12. There is a significant correlation between circular dislocation and ovality.
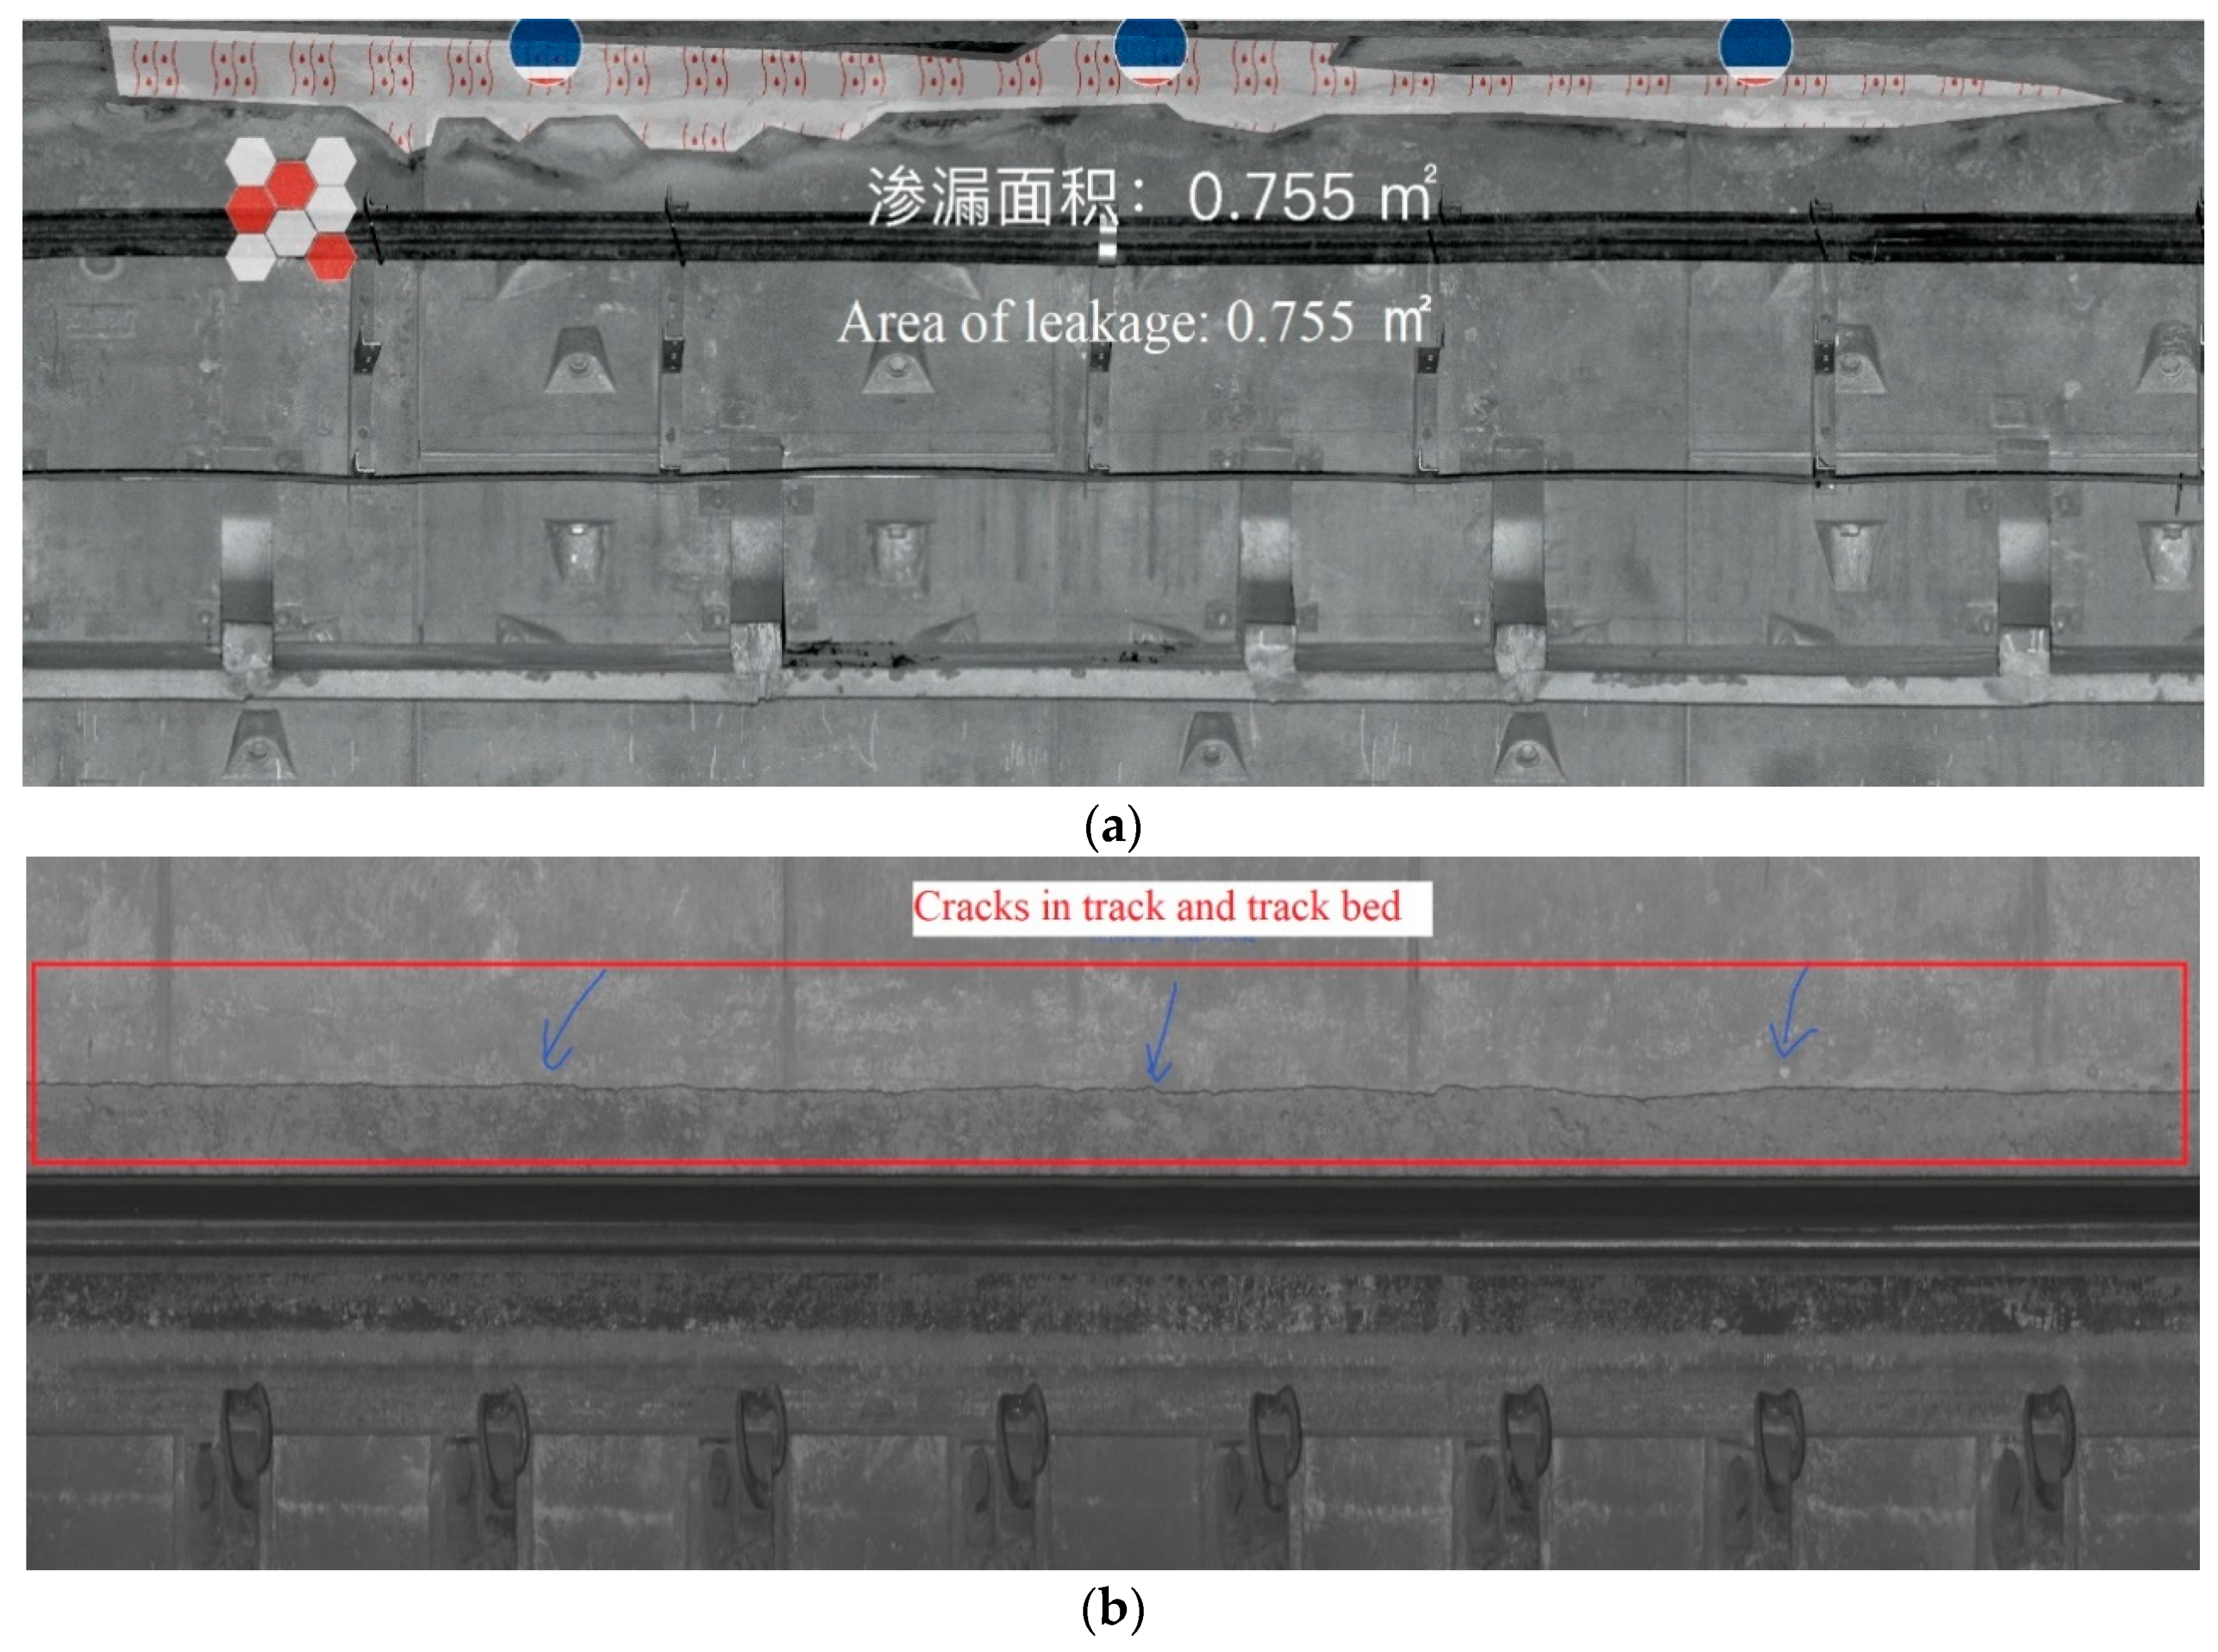
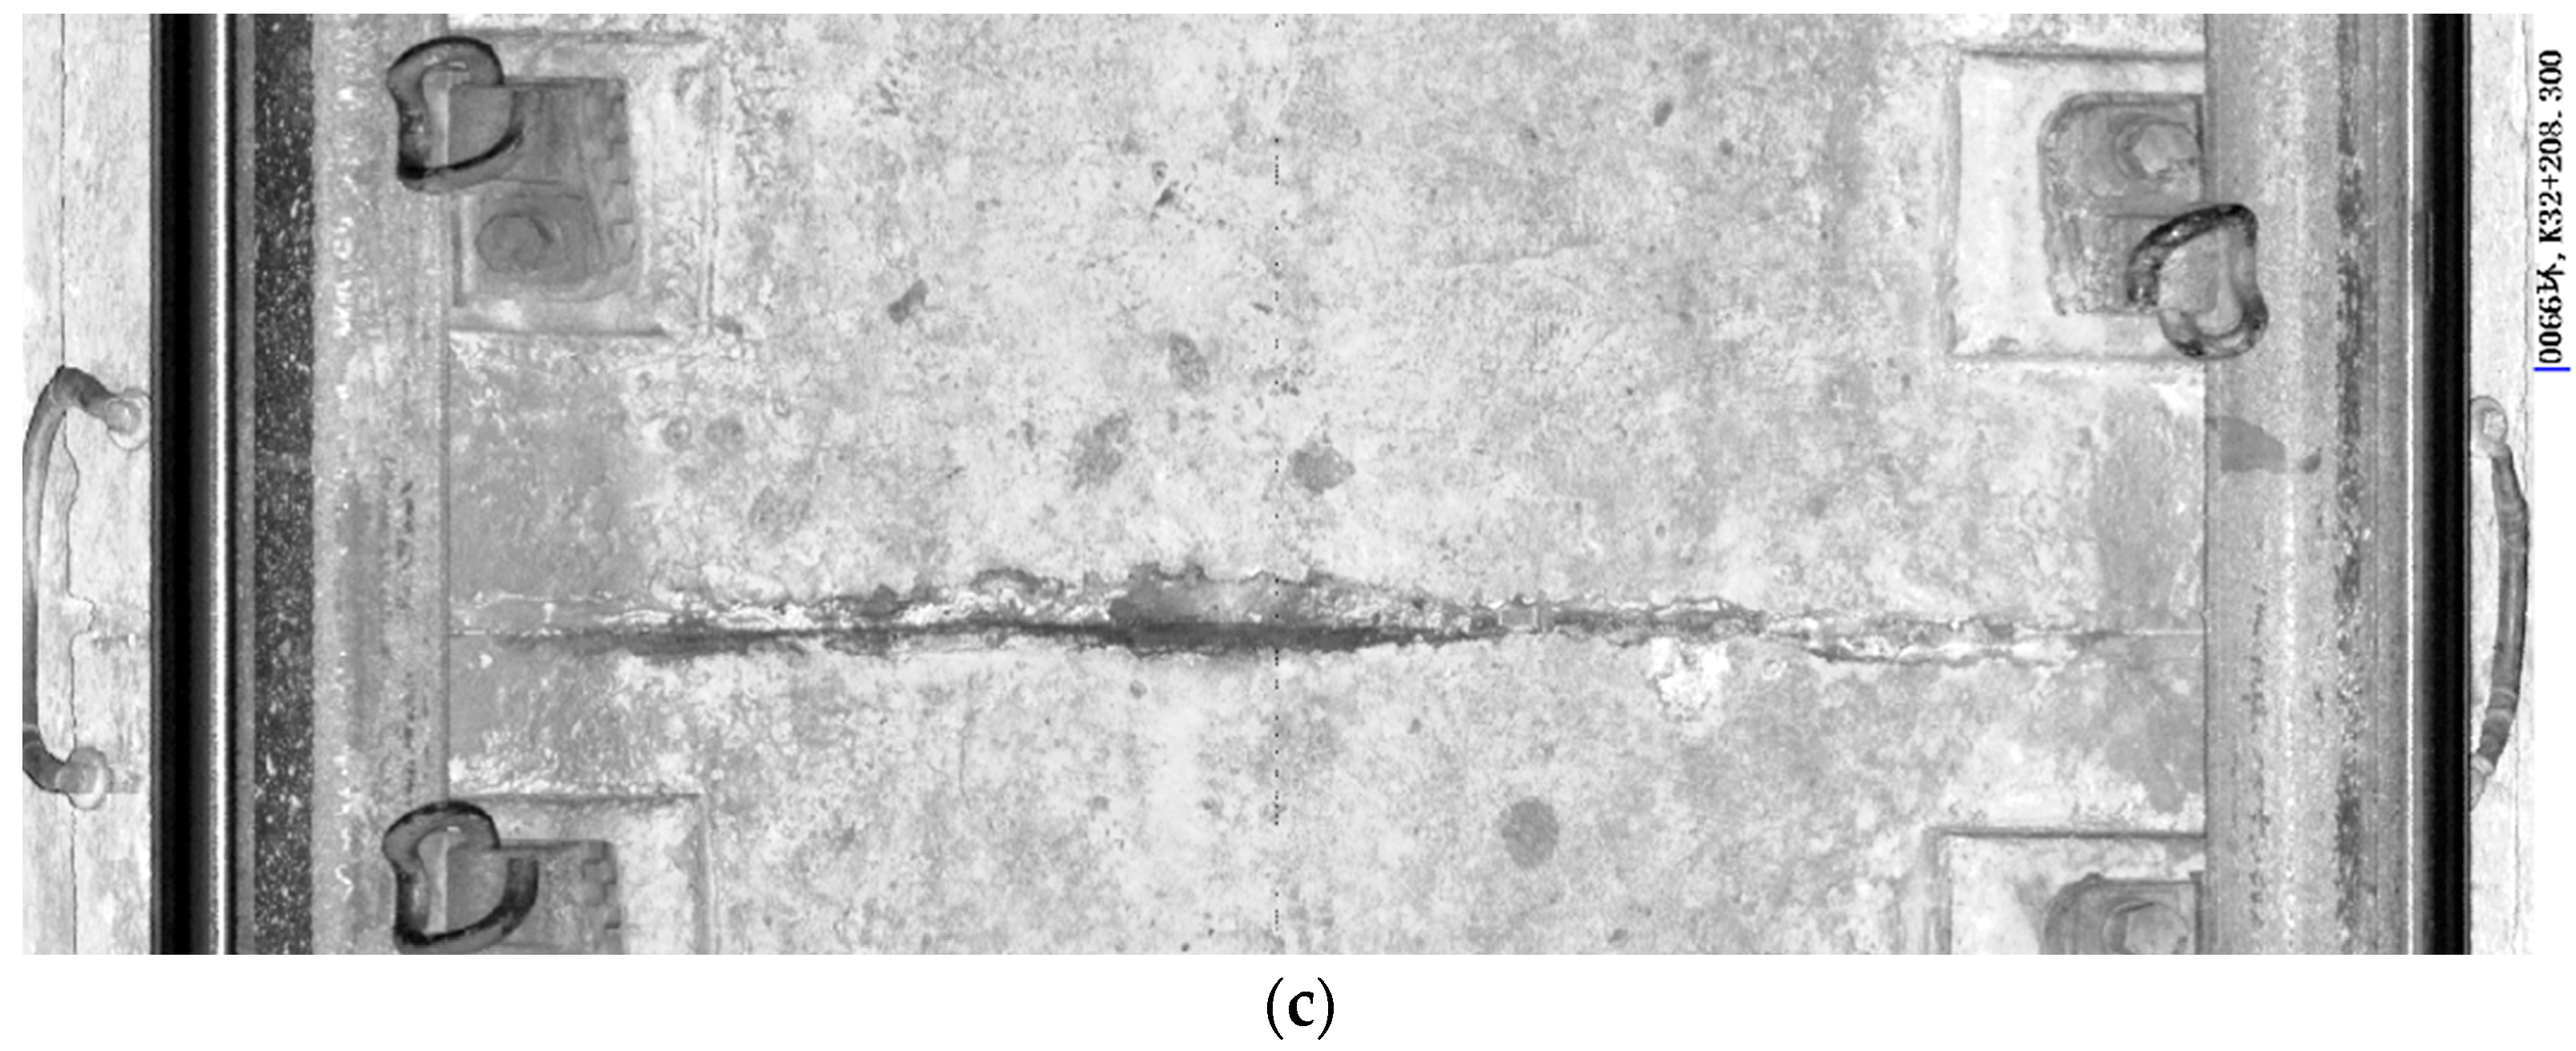
Some water leakages (Figure 13a), cracks (Figure 13b), dislocation and damage of a ballast settlement joint (Figure 13c), concrete peeling, and other diseases were found in the tunnel section, and some of the circular dislocations were more than 2 cm. In the laser scanning image, a large, continuous crack was evident between the drainage ditch of the track bed on the left and right sides of the tunnel and segment (Figure 13b). The image resolution of the track bed was about 0.5 mm/pixel, and that of the inner wall of the tunnel was about 1.5 mm/pixel. Some settlement joints of the adjacent track beds were staggered at about 5–10 mm. According to engineering experience, the crack width and the ballast bed stagger in this section were larger than those in a normal section tunnel; thus, it is suggested to continue the monitoring and detection.
For the scanning section, first-person roaming video was generated to integrate key information, such as the tunnel status, ring number mileage, diameter deformation, wrong platform, and auxiliary facilities, into the video. The purpose of reporting this type of information with the system is to provide relevant leaders, various professionals, and monitoring personnel with intuitive, efficient, and general means of viewing the monitoring and measurement results. Figure 14 shows the results display interface.
According to the user requirements, the structural deformation detection report and disease detection topic can be customized. The report can be exported to Microsoft Word or Excel, and the thematic map can be presented in an image or Word format. The tunnel image supports an independent output of the tunnel wall and track image, the tunnel wall image supports output of a specified number of rings, and the report format can be customized according to requirements.
5. Discussion and Conclusions
This paper reports on the study of a mobile laser scanning system for tunnel monitoring and measurement. The system includes a tunnel detection hardware system, data acquisition module, and data processing and results management modules. It also supports several mainstream commercial laser scanners, such as Faro, Leica, and Z+F scanners. It is equipped with a hand push or an electric detection trolley and can further be equipped with an odometer or a gauge sensor. The system software can conduct structural deformation calculations of tunnel full sections, convergence diameters, dislocation, etc. It can also provide extraction and annotation of water seepage and other diseases, generate point cloud maps and convergence analysis of full tunnel sections, and form a no-control tunnel structure and disease detection system. The communication, control, and data analysis of the instrument were verified. Likewise, the correctness and execution efficiency of the algorithm of deformation measurements, image results, and video results were confirmed. The user interface was deployed to the target tablet computer for verification, and the system accuracy and function stability were verified via tests in Chengdu, Guangzhou, Tianjin, Zhengzhou, and other locations. The current software technology route can fully meet the needs of practical engineering applications.
The Zhengzhou metro section data in this project showed that the mean absolute error (MAE) of the convergence repeated measurement in this section was 0.9 mm. Using twice the MAE as the limit error, the convergence deformation monitoring accuracy could be ±2 mm. The dislocation measurement accuracy was ±3 mm. According to an operation speed of 1.8 km/h (optional maximum of 4.5 km/h), the operation efficiency can allow the scanner obtain more point cloud data within a unit distance, reduce the vibration distortion and dispersion caused by track irregularities and other factors, and facilitate the timely handling of abnormal occlusions and other situations on site. Based on the current 3 h operation time of each operation order, it is estimated that 5–6 km of tunnel laser scanning data acquisition can be completed in a single operation order. The image resolution was about 0.5 mm/pixel in the ballast section and about 1.5 mm/pixel in the inner wall of the tunnel. The overall images have relatively good quality, clarity, and measurement accuracy. The locations and areas of water leakage could be measured accurately, and roaming video could be generated synchronously. The image results can be generated in the form of 1 ring/frame, 10 rings/frame, 50 rings/frame, or a whole-tunnel roaming video. The mobile laser scanning measurement results can help relevant professionals understand deformations, disease statuses, and treatment effects, and perform long-term tunnel structure tracking while providing references for follow-up structural monitoring, disease investigation, reinforcement, and maintenance of key sections. The proposed system provides a high efficiency, low cost, full coverage, appropriate accuracy, and rich information.
This study was mainly focused on a circular shield tunnel. Regarding the non-circular tunnels used in mine tunneling, the authors have performed some research that preliminarily verified the method and theory of mine chord surveying. However, the stability of the data accuracy needs to be improved, and the corresponding software function is in the test stage. The convergence analysis of a non-shield subway tunnel in Harbin was performed by using a mobile measurement system, such as a scanner. The chord length of the tunnel wall 0.85 m, 2 m, and 3.2 m from the rail surface was calculated for the convergence analysis, and the chord length deviation was analyzed using repeated measurements. The repeated deviation was within ±3 mm. In this study, a horseshoe tunnel in a section of Chongqing Metro was tested, and its convergence was analyzed using chord measurements. Eight sections were measured, and the repeated deviation was within ±4 mm. The next step is to optimize the algorithm to adapt to convergence detection for any tunnel shape. The chord lines of power pipe galleries have also been tested. For non-circular shield tunnels, the accuracy and stability of the chord measurements require improvement, and a new generation of convergence analysis software for arbitrarily shaped tunnel sections is highly anticipated. Additionally, the authors have conducted system integrations and application expansions. The development system has also been expanded to include inertial or integrated navigation systems in combination with subway, high-speed railway line, or control points to correct the absolute coordinates, which can be used for the completion acceptance of tunnel construction. The group has been engaged in the data acquisition and application of laser scanners using different mobile laser scanning techniques for many years, which could provide important technical support for holographic data acquisition, structural deformation detection and monitoring, disease extraction, data management, etc. in the rail transit industry. The group will continue to focus on the application prospects of laser scanning and corresponding integrated systems.
Author Contributions
Conceptualization, H.S. and Z.X.; methodology, H.S., Z.X. and L.Y.; software, Z.X.; validation, H.S., L.D. and H.W.; formal analysis, H.S. and L.D.; investigation, H.S. and L.D.; resources, H.S.; data curation, H.S., L.D. and H.W.; writing—original draft preparation, H.S.; writing—review and editing, H.S.; visualization, Z.X.; supervision, L.Y. and R.Z.; project administration, H.S.; funding acquisition, L.Y., R.Z., and H.W. All authors have read and agree to the published version of the manuscript.
Funding
This research was supported by the National Key R&D Program of China (2016YFB1200602-02), National Science Foundation of China (No. 41771482 and No. 41671451).
Conflicts of Interest
The authors declare no conflict of interest.
References
- Xu, Z. Data Processing of Tunnel Deformation Monitoring; Tongji University: Shanghai, China, 2009. [Google Scholar]
- Yang, S.-L.; Liu, W.-N.; Wang, M.-S.; Huang, F.; Cui, N.-Z. Study on the auto-totalstation system for monitoring analyzing and forecasting tunnel country rock deformation. J. China Railw. Soc. 2004, 26, 93–97. [Google Scholar]
- Leanne, A.; James, D.C.; Gianluca, V.; Castro, M.D. Tunnel inspection using photogrammetric techniques and image processing: A review. Isprs J. Photogramm. Remote Sens. 2018, 144, 180–188. [Google Scholar]
- Qing, A.; Yong, Y.; Bi, X. Acquiring sectional profile of metro tunnels using charge-coupled device cameras: Structure and Infrastructure Engineering. Struct. Infrastruct. Eng. 2015, 12, 9. [Google Scholar]
- Gan, C.; Lei, Y. Tunnel deformation monitoring based on laser distance measuring and vision assistant. In Proceedings of the 2016 12th IEEE/ASME International Conference on Mechatronic and Embedded Systems and Applications (MESA), Auckland, New Zealand, 29–31 August 2016. [Google Scholar]
- Shen, B.; Zhang, W.Y.; Qi, D.P.; Wu, X.-Y. Wireless Multimedia Sensor Network Based Subway Tunnel Crack Detection Method. Int. J. Distrib. Sens. Netw. 2015, 2015, 1. [Google Scholar] [CrossRef]
- MERMEC. T-sight 5000. 2014. Available online: http://www.mermecgroup.com/northamerica/pageview2.php?i=1028&sl=1 (accessed on 26 December 2019).
- PavemetricsTM. Laser Tunnel Scanning System (LTSS). Available online: http://www.pavemetrics.com/wp-content/uploads/2016/03/LTSS_Flyer.pdf (accessed on 9 December 2019).
- Han, S.H. Digital Photogrammetry and Laser Measurement for Preservation and Restoration of Cultural Properties in Korea. In Green and Smart Technology with Sensor Applications; Springer: Berlin, Germany, 2012. [Google Scholar]
- Al-Kheder, S.; Al-Shawabkeh, Y.; Haala, N. Developing a documentation system for desert palaces in Jordan using 3D laser scanning and digital photogrammetry. J. Archaeol. Sci. 2009, 36, 537–546. [Google Scholar] [CrossRef]
- Charbonnier, P.; Chavant, P.; Foucher, P.; Muzet, V.; Prybyla, D.; Perrin, T.; Grussenmeyer, P.; Guillemin, S. Accuracy Assessment of a Canal-Tunnel 3d Model by Comparing Photogrammetry and Laser scanning Recording Techniques. Isprs—Int. Arch. Photogramm. Remote Sens. Spat. Inf. Sci. 2013, XL-5/W2, 171–176. [Google Scholar] [CrossRef] [Green Version]
- Kang, Z.; Tuo, L.; Zlatanova, S. Continuously deformation monitoring of subway tunnel based on terrestrial point clouds. ISPRS—Int. Arch. Photogramm. Remote Sens. Spat. Inf. Sci. 2012, XXXIX-B5, 199–203. [Google Scholar]
- Tuo, L.; Kang, Z.Z.; Xie, Z.Y.; Wang, B. Continuously Vertical Section Abstraction for Deformation Monitoring of Subway Tunnel Based on Terrestrial Point Clouds. Geomat. Inf. Sci. Wuhan Univ. 2013, 49, 53–63. [Google Scholar]
- Kang, Z.Z.; Zhang, L.Q.; Tuo, L.; Wang, B.; Chen, J. Continuous Extraction of Subway Tunnel Cross Sections Based on Terrestrial Point Clouds. Remote Sens. 2014, 6, 857–879. [Google Scholar] [CrossRef] [Green Version]
- Li, C.; Lu, X.P.; Zhu, N.N.; Lu, Y.; Wu, Y.; Li, G. Continuously extracting section and deformation analysis for subway tunnel based on LIDAR points. Acta Geod. Et Cartogr. Sin. 2015, 44, 1056–1062. [Google Scholar]
- Xie, X.; Lu, X.; Tian, H.; Ji, Q.; Li, P. Development of a modeling method for monitoring tunnel deformation based on terrestrial 3D laser scanning. Chin. J. Rock Mech. Eng. 2013, 59–69. [Google Scholar]
- Xie, X.Y.; Lu, X.Z. Development of a 3D Modeling Algorithm for Tunnel Deformation Monitoring Based on Terrestrial Laser Scanning. Undergr. Space 2017, 120, S2467967417300120. [Google Scholar] [CrossRef]
- Cao, Z.; Chen, D.; Shi, Y.; Zhang, Z.; Jin, F.; Yun, T.; Xu, S.; Kang, Z.; Zhang, L. A Flexible Architecture for Extracting Metro Tunnel Cross Sections from Terrestrial Laser Scanning Point Clouds. Remote Sens. 2019, 11, 297. [Google Scholar] [CrossRef] [Green Version]
- Gavilán, M.; Sánchez, F.; Ramos, J.A.; Marcos, O. Mobile inspection system for high-resolution assessment of tunnels. Paper presented at the 6th International Conference on Structural Health Monitoring of Intelligent Infrastructure, Hong Kong, China, 9–11 December 2013. [Google Scholar]
- Leica SiTrack: OneTrack Maintenance and Renovation Solution. Available online: http://www.leica-geosystems.com.cn/leica_geosystems/newsdetailnoright.aspx?tnid=83&bigcolid=2&id=1099 (accessed on 9 December 2019).
- GRP IMS5000 Tunnel Scanning System. Available online: http://www.brailtec.com/index/products.html?id=27 (accessed on 9 December 2019).
- Cui, H.; Ren, X.C.; Mao, Q.Z.; Hu, Q.; Wang, W. Shield subway tunnel deformation detection based on mobile laser scanning. Autom. Constr. 2019, 106, 102889. [Google Scholar] [CrossRef]
- Du, L.M.; Zhong, R.F.; Sun, H.L.; Wu, Q. Automatic monitoring of tunnel deformation based on high density point clouds data. ISPRS—International Archives of the Photogrammetry. Remote Sens. Spat. Inf. Sci. 2017, XLII-2/W7, 353–360. [Google Scholar] [CrossRef] [Green Version]
- Du, L.M.; Zhong, R.F.; Sun, H.L.; Zhu, Q.; Zhang, Z.l. Tunnel cross section extraction and deformation analysis based on mobile laser scanning technology. Bull. Surv. Mapp. 2018, 495, 64–70. [Google Scholar]
- Du, L.M.; Zhong, R.F.; Sun, H.L.; Zhu, Q.; Zhang, Z. Study of the integration of the CNU-TS-1 mobile tunnel monitoring system. Sensors 2018, 18, 420. [Google Scholar] [CrossRef] [Green Version]
- Du, L.M.; Zhong, R.F.; Sun, H.L.; Liu, Y.; Wu, Q. Cross-section positioning based on a dynamic MLS tunnel monitoring system. Photogramm. Rec. 2019, 34, 244–265. [Google Scholar] [CrossRef]
- Sun, H.; Liu, S.; Zhong, R.; Du, L. Cross-Sectiondeformation analysis and visualization of shield tunnel based on mobile tunnel monitoring system. Sensors 2020, 20, 1006. [Google Scholar] [CrossRef] [Green Version]
- Zhu, W.; Cheng, R.J. Present situation and prospect of shield tunnel construction technology (Lesson 1)—basic principles of shield tunnel and its application in China. Geotech. Eng. World 2001, 19–21. [Google Scholar] [CrossRef]
- He, C.; Feng, K.; Fang, Y. Review and Prospects on constructing technologies of metro tunnels using shield tunneling method. J. Southwest Jiaotong Univ. 2015, 50, 97–109. [Google Scholar] [CrossRef]
- Andrew, F.; Maurizio, P.; Robert, B. Direct least square fitting of ellipse. Tern Anal. Mach. Intell. 1999, 21, 476–480. [Google Scholar]
- GB 50446-2017. Code for Construction and Acceptance of Shield Tunneling Method; China Architecture& Building Press: Beijing, China, 2017. [Google Scholar]
- DG/TJ08-2170-2015. Code for Maintenance Monitoring Measurement of Urban. Rail Transit; Tongji University Press: Shanghai, China, 2015. [Google Scholar]
Figure 1.
Data acquisition hardware system diagram.

Figure 2.
Interface design of the data acquisition module.

Figure 3.
Tunnel and track thematic map: (a) tunnel thematic map and (b) track thematic map.

Figure 4.
Monitoring center interface.

Figure 5.
Schematic of a tube ring.

Figure 6.
Seam recognition: (a) Segment orthophoto image, (b) Canny operator processed image, (c) Image after expansion processing, and (d) capping block test results.
Figure 6.
Seam recognition: (a) Segment orthophoto image, (b) Canny operator processed image, (c) Image after expansion processing, and (d) capping block test results.

Figure 7.
Roaming video screenshot.

Figure 8.
Convergence diameter repeatability difference.

Figure 9.
Dislocation of the forward and backward measurements.

Figure 10.
Tunnel scanning site.

Figure 11.
Diameter and ovality convergence curves.

Figure 12.
Relevance curve for circular dislocation and ovality.

Figure 13.
Typical diseases in this scanning section: (a) water leakage, (b) crack between the segment and monolithic track bed, and (c) dislocation and damage of a ballast settlement joint (example).
Figure 13.
Typical diseases in this scanning section: (a) water leakage, (b) crack between the segment and monolithic track bed, and (c) dislocation and damage of a ballast settlement joint (example).


Figure 14.
Results display interface.


Table 1.
Technical specifications of the Z+F PROFILERⓇ 9012M.
| Laser System | |
| Beam divergence | <0.5 mrad |
| Ambiguity distance | 119 m (above, range reading restarts at zeros) |
| Minimum distance | 0.3 m |
| Range resolution | 0.1 mm |
| Data acquisition rate | Max. 1.016 million pixel/s |
| Deflection Unit | |
| Deflection system | Completely encapsulated, rotating mirror |
| Vertical field of view | 360° unobstructed |
| Angular resolution | 0.0088° |
| Angular accuracy | 0.02° rms² |
| Rotation speed | 50 Hz, up to 200 Hz (max. 12,000 rpm) |
Table 2.
Statistical table of the twice-repeated measurement accuracy.
| Convergence Diameter Repeatability Difference (mm) | Ratio |
|---|---|
| ≤1 | 94.2% |
| >1 | 5.8% |
Table 3.
Statistical table of horizontal diameter differences.
| Diameter Difference | ≤6‰ of D | 6‰D (≈6 cm) | ≥6 cm | Steel Ring Reinforcement | Shelter Unmeasured |
|---|---|---|---|---|---|
| Number of Rings | 403 | 83 | 9 | 14 | 2 |
| Ratio | 78.9% | 16.2% | 1.8% | 2.7% | 0.4% |
Table 4.
Statistical table of ovality.
| Ovality Difference | ≤6‰ of D | 6‰–18‰ of D | ≥18‰ of D | Steel Ring Reinforcement | Shelter Unmeasured |
|---|---|---|---|---|---|
| Number of Rings | 206 | 247 | 42 | 14 | 2 |
| Ratio | 40.4% | 48.3% | 8.2% | 2.7% | 0.4% |
© 2020 by the authors. Licensee MDPI, Basel, Switzerland. This article is an open access article distributed under the terms and conditions of the Creative Commons Attribution (CC BY) license (http://creativecommons.org/licenses/by/4.0/).
Share and Cite
MDPI and ACS Style
Sun, H.; Xu, Z.; Yao, L.; Zhong, R.; Du, L.; Wu, H. Tunnel Monitoring and Measuring System Using Mobile Laser Scanning: Design and Deployment. Remote Sens. 2020, 12, 730. https://0-doi-org.brum.beds.ac.uk/10.3390/rs12040730
AMA Style
Sun H, Xu Z, Yao L, Zhong R, Du L, Wu H. Tunnel Monitoring and Measuring System Using Mobile Laser Scanning: Design and Deployment. Remote Sensing. 2020; 12(4):730. https://0-doi-org.brum.beds.ac.uk/10.3390/rs12040730
Chicago/Turabian StyleSun, Haili, Zhengwen Xu, Lianbi Yao, Ruofei Zhong, Liming Du, and Hangbin Wu. 2020. "Tunnel Monitoring and Measuring System Using Mobile Laser Scanning: Design and Deployment" Remote Sensing 12, no. 4: 730. https://0-doi-org.brum.beds.ac.uk/10.3390/rs12040730
Note that from the first issue of 2016, this journal uses article numbers instead of page numbers. See further details here.