Traveling Ionospheric Disturbances Characteristics during the 2018 Typhoon Maria from GPS Observations


1
School of Remote Sensing and Geomatics Engineering, Nanjing University of Information Science and Technology, Nanjing 210044, China
2
Jiangsu Engineering Center for Collaborative Navigation/Positioning and Smart Applications, Nanjing 210044, China
3
Shanghai Astronomical Observatory, Chinese Academy of Science, Shanghai 200030, China
*
Author to whom correspondence should be addressed.
Remote Sens. 2020, 12(4), 746; https://0-doi-org.brum.beds.ac.uk/10.3390/rs12040746
Submission received: 22 January 2020
/
Revised: 20 February 2020
/
Accepted: 22 February 2020
/
Published: 24 February 2020
(This article belongs to the Special Issue Remote Sensing of Ionosphere Observation and Investigation)
Abstract
:Typhoons often occur and may cause huge loss of life and damage of infrastructures, but they are still difficult to precisely monitor and predict by traditional in-situ measurements. Nowadays, ionospheric disturbances at a large-scale following typhoons can be monitored using ground-based dual-frequency Global Positioning System (GPS) observations. In this paper the responses of ionospheric total electron content (TEC) to Typhoon Maria on 10 July 2018 are studied by using about 150 stations of the GPS network in Taiwan. The results show that two significant ionospheric disturbances on the southwest side of the typhoon eye were found between 10:00 and 12:00 UTC. This was the stage of severe typhoon and the ionospheric disturbances propagated at speeds of 118.09 and 186.17 m/s, respectively. Both traveling ionospheric disturbances reached up to 0.2 TECU and the amplitudes were slightly different. The change in the filtered TEC time series during the typhoon was further analyzed with the azimuth. It can be seen that the TEC disturbance anomalies were primarily concentrated in a range of between −0.2 and 0.2 TECU and mainly located at 135–300° in the azimuth, namely the southwest side of the typhoon eye. The corresponding frequency spectrum of the two TEC time series was about 1.6 mHz, which is consistent with the frequency of gravity waves. Therefore, the upward propagating gravity wave was the main cause of the traveling ionospheric disturbance during Typhoon Maria.

1. Introduction
Solar and geomagnetic activities together with geohazards (e.g., earthquakes and typhoons) may cause the oscillations of electron densities in the ionosphere. Numerous studies have shown a close relationship between intense solid-Earth activities (such as volcanos, earthquakes, tsunamis, or typhoons) and ionospheric disturbances [1,2,3,4]. As typical and complex strong weather systems in the lower atmosphere, typhoons can excite gravity waves and propagate to the upper layers of the ionosphere, causing several disturbances [3]. As early as 1958, Bauer [5] studied the response of the ionosphere during hurricane transit and found that the ionospheric F2-layer critical frequency (foF2) increased during hurricane transit, and the frequency reached the maximum value when it was closest to the observation station. Huang et al. [6] used a high-frequency (HF) Doppler detector to observe 15 typhoons on Taiwan Island from 1982 to 1983. As a result, ionospheric disturbances excited by acoustic-gravity waves triggered by two strong typhoons were detected. Sato [7] observed the small-scale wind disturbance produced by Typhoon Kelly through middle and upper atmosphere (MU) radar for 60 h. Rice et al. [8] used four ionospheric detectors to observe ionospheric disturbances caused by Typhoon Mellor from 9–11 October 2009. Tao et al. [9] used the ionospheric frequency map data of the Xiamen Ionospheric Monitoring Station to study the change of the ionosphere during three typhoons that landed near Xiamen in 2007 and found that the ionospheric foF2 was disturbed by the three typhoons, but the disturbance was the opposite to the declined foF2 caused by the typhoon landing [10]. Therefore, more analysis and studies are needed. Furthermore, the disturbance propagation direction, period, and speed do not clearly follow the typhoon [11].
Nowadays, denser Global Positioning System (GPS) observations provide important data for the study of ionospheric variations, allowing the continuous monitoring of large-scale ionospheric disturbances caused by typhoons [11,12,13,14] and earthquakes [15,16,17]. The characteristics of traveling ionospheric disturbances (TIDs) are consistent with the theory of gravity waves. Song et al. [11] used Chinese GPS station data to study two ionospheric disturbances caused by Typhoon Chan-hom and found the periods and speeds of two medium-scale traveling ionospheric disturbances (MSTIDs) to be 56 min, 268 m/s and 45 min, 143 m/s, respectively, which may have been caused by the acoustic-gravity wave excited by the super typhoon propagating upward in the ionosphere. Due to the complexity of the typhoon mechanism, it is still difficult to know the mode and pattern of ionospheric disturbances triggered by different typhoons. More cases studies are needed to investigate ionospheric disturbance characteristics and understand the coupling process between typhoons and the ionosphere.
The Category-5 Super Typhoon Maria occurred in 2018 and caused serious loss of life and economic loss, but traditional observations were not sufficient to predict or help understand this typhoon. In this paper, the traveling ionospheric disturbance following the 2018 Typhoon Maria passing through Taiwan is investigated and analyzed using the dense GPS network data in Taiwan. Furthermore, the disturbance mode and characteristics (e.g., disturbance period, velocity and direction, etc.) are studied and discussed. In Section 2 data and methods are described, Section 3 presents the results and discussion, and finally conclusions are given in Section 4.
2. Date and Method
2.1. Typhoon Information
On 25 June 2018, an atmospheric disturbance formed in the Marshall Islands sea area. On 4 July, the United Typhoon Warning Center upgraded it to a tropical storm, naming it “Maria”. On the afternoon of 5 July, the United Typhoon Warning Center upgraded it to the typhoon. Finally, it was upgraded to a super typhoon on the morning of 6 July, with a maximum wind speed of 60 m/s and a minimum air pressure of 925 hPa in the center. After 8 July, Maria’s convection weakened gradually, and its intensity gradually decreased. On 9–10 July, Maria landed in the eastern sea area of Taipei with a maximum wind speed of 50 m/s and a minimum air pressure of 935 hPa in the center. The Central Meteorological Bureau issued an offshore and land-based typhoon warning. Maria formed strong convective weather in Taiwan and on the morning of 11 July, Maria reached Lianjiang county, Fujian Province.
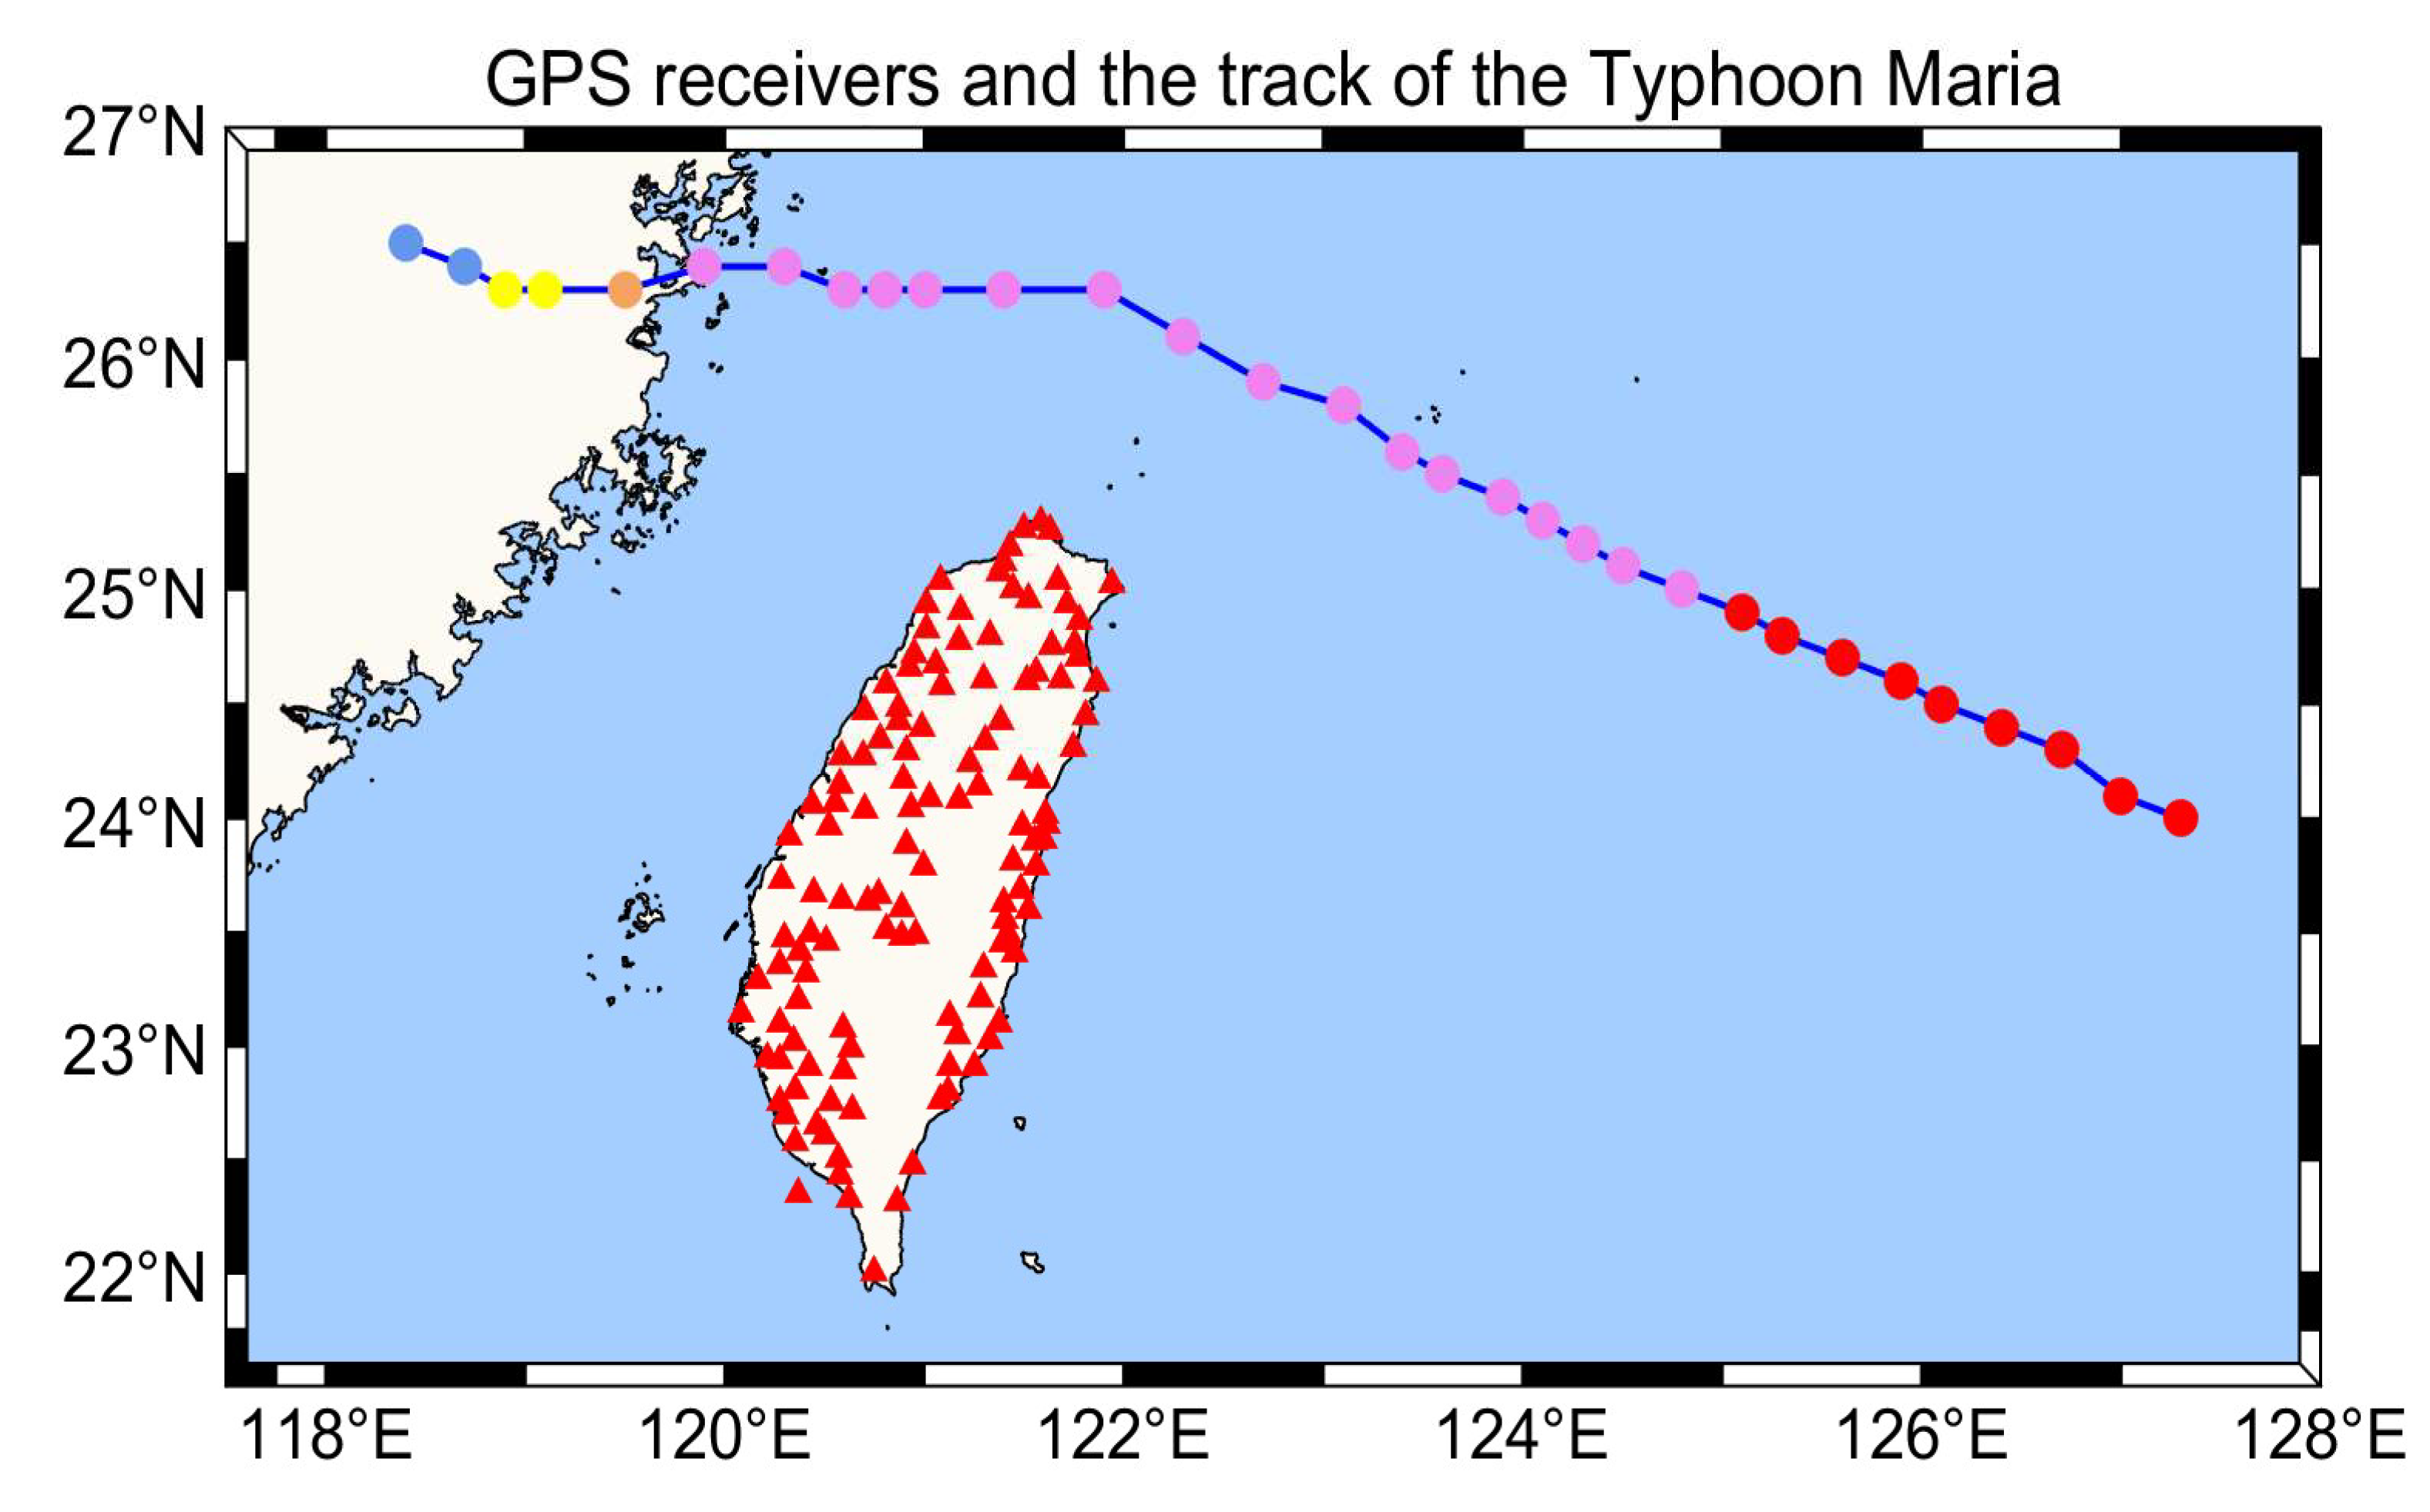
The tracks of the typhoon are shown in Figure 1 from 0:00 UTC (10 July) to 6:00 UTC (11 July) with the colorful circles. The blue, yellow, orange, purple, and red circles represent the tropical storm, severe tropical storm, typhoon, severe typhoon, and super typhoon, respectively. When Typhoon Maria landed on the eastern sea area of Taiwan, the super typhoon was changed to severe typhoon until reaching the Fujian ocean coast, which lasted from 9:00–24:00 UTC on 10 July 2018 and then got weaker and weaker.
2.2. GPS Observations
The island of Taiwan is located at the subduction zone between the Philippine Sea Plate, Pacific Plate, and Eurasian Plate, which has the fastest convergence in the world and is often subject to various hazards, e.g., earthquakes and typhoons. In order to monitor and predict hazards, a dense continuous GPS network in Taiwan was constructed. In this study, the data from about 150 GPS stations were obtained from the Central Meteorological Bureau (CWB) with a sampling rate of 30s, which were used to calculate the TEC time series. In Figure 1, the red triangles represent the GPS stations in Taiwan used in this study. In this way, the traveling ionospheric disturbance following Typhoon Maria passing over the eastern sea area of Taiwan was investigated from dense GPS observations in Taiwan.
2.3. Methods
When the ionosphere is affected by severe atmospheric activities such as typhoons, the total electron content (TEC) will be disturbed. The ionospheric TEC can be derived from GPS dual-frequency observation ( and ). Vertical TEC (VTEC) is usually calculated based on an ionosphere single-layer model with the assumption that all electrons are concentrated in the thin shell at a fixed height. To get VTEC, it is necessary to use a mapping function to project the slant TEC (STEC) into the vertical. Normally, the ionosphere shell height is set as 250 km for converting STEC to VTEC as follows [14,18,19]
where L is the carrier phase observation, λ is the signal wavelength, N is the ambiguity, b is the instrument biases for carrier phase, ε is other residual error, H is the height of the ionosphere shell, R is the Earth radius, and z is the elevation angle of the satellite.
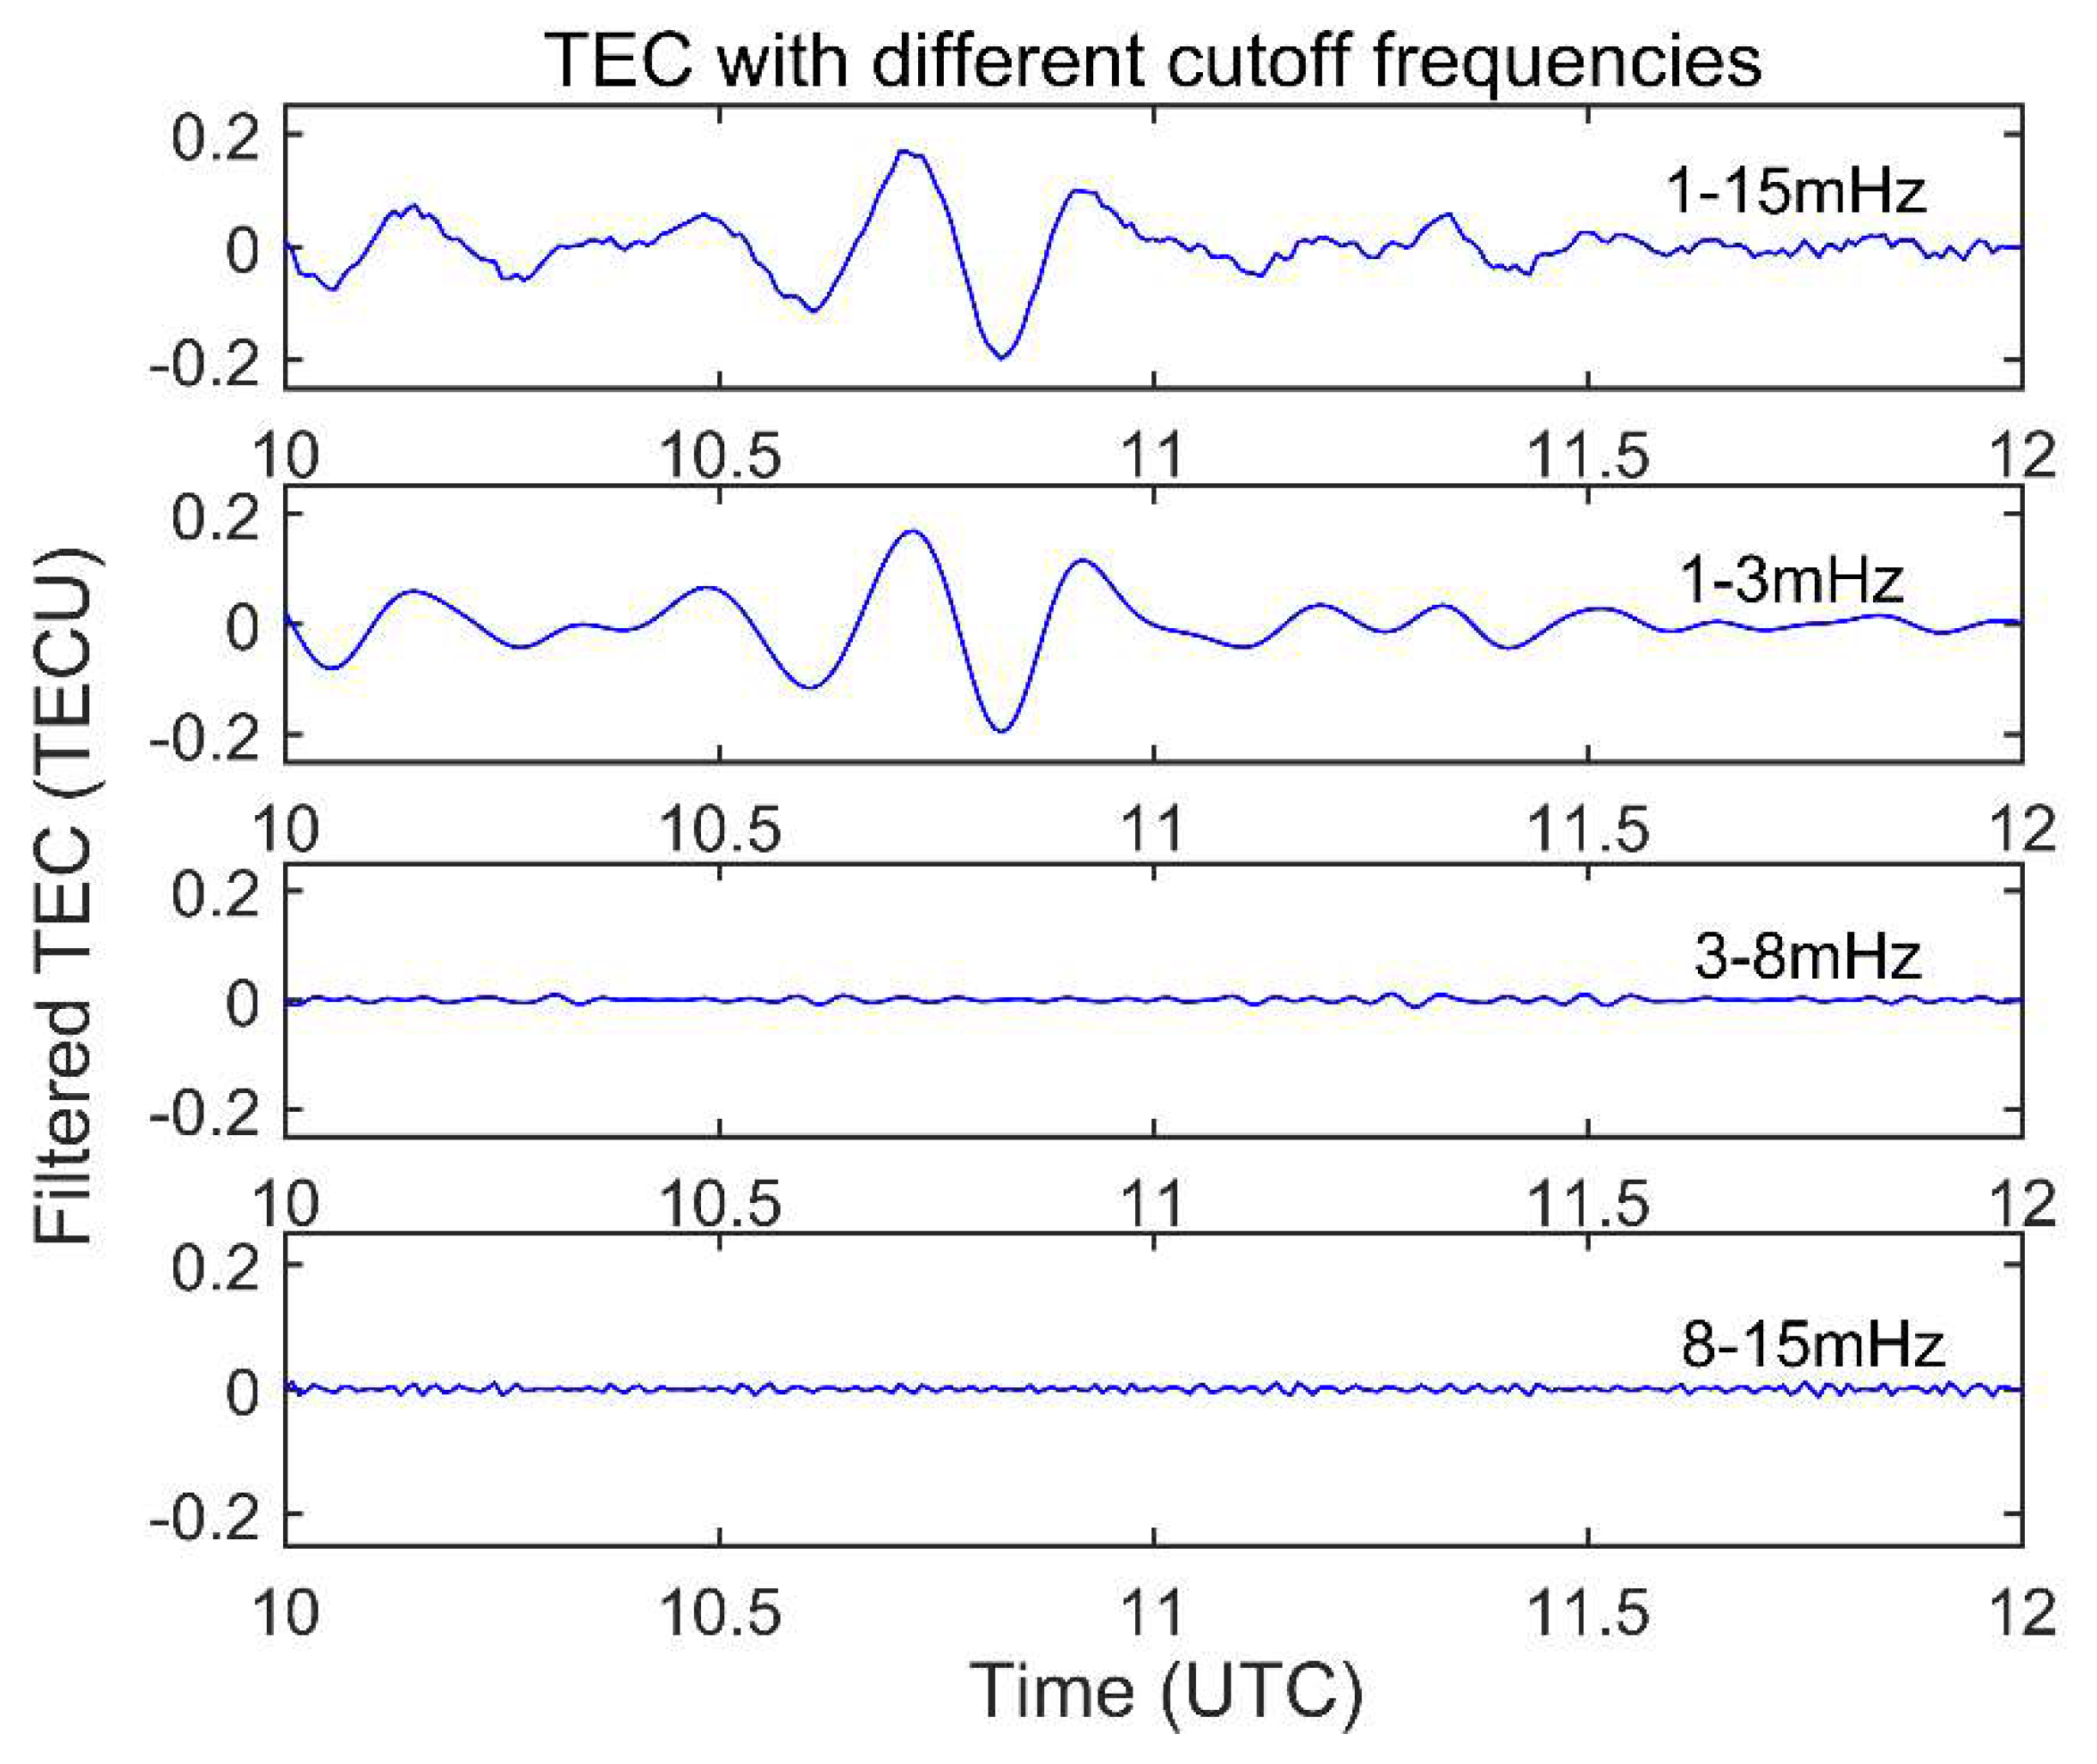
The characterization of ionospheric disturbances mainly reflects the relative TEC change value, not the absolute TEC, so the relative TEC value is calculated by GPS carrier phase measurement. Cycle slip is an important error in obtaining high-precision TEC from GPS measurements. Therefore, before calculating the STEC, in this study a second-order time-difference phase ionosphere residual (STRIP) algorithm was used to take into account the cycle slip [20]. After obtaining the VTEC time series, the trend term in the TEC series must be removed to extract the ionospheric disturbance, which is mainly caused by the ionospheric background change and sub-ionospheric point (SIP) movement. The Butterworth filter defines the maximally flat filter in the passband that rolls off towards zero in the stopband [21], which is used to filter the trend term of the TEC series. Figure 2 shows examples of TEC disturbances detected by station DAJN and satellite PRN06 filtered by Butterworth filters at different cutoff frequencies. The cutoff frequency range of GPS data with 30s interval samples was 1–15 mHz. As shown in Figure 2, the TEC disturbance amplitude was largest when the passband frequency was 1–3 mHz, so the fourth-order zero-phase Butterworth band-pass filter with cut-off frequencies of 1 and 3 mHz was used to extract the most obvious ionospheric disturbance.
3. Results and Discussions
3.1. Ionospheric Disturbance Characteristics
About 150 GPS continuous stations’ data in Taiwan were collected, which were used to investigate ionospheric disturbances during the 2018 Typhoon Maria. It was found that not all stations and satellites observations showed significant traveling ionospheric disturbances. The ionospheric disturbances were mainly detected with a distance of less than about 400 km between the SIPs and the typhoon eye and by GPS satellites with higher elevations angles. Most interestingly, two significant ionospheric disturbances were found during the period of 10–12 UTC, which was the stage of severe typhoon with a wind speed of about 50 m/s. There was no significant anomaly the rest of the time. No disturbance was found in the ionosphere when the typhoon moved away.
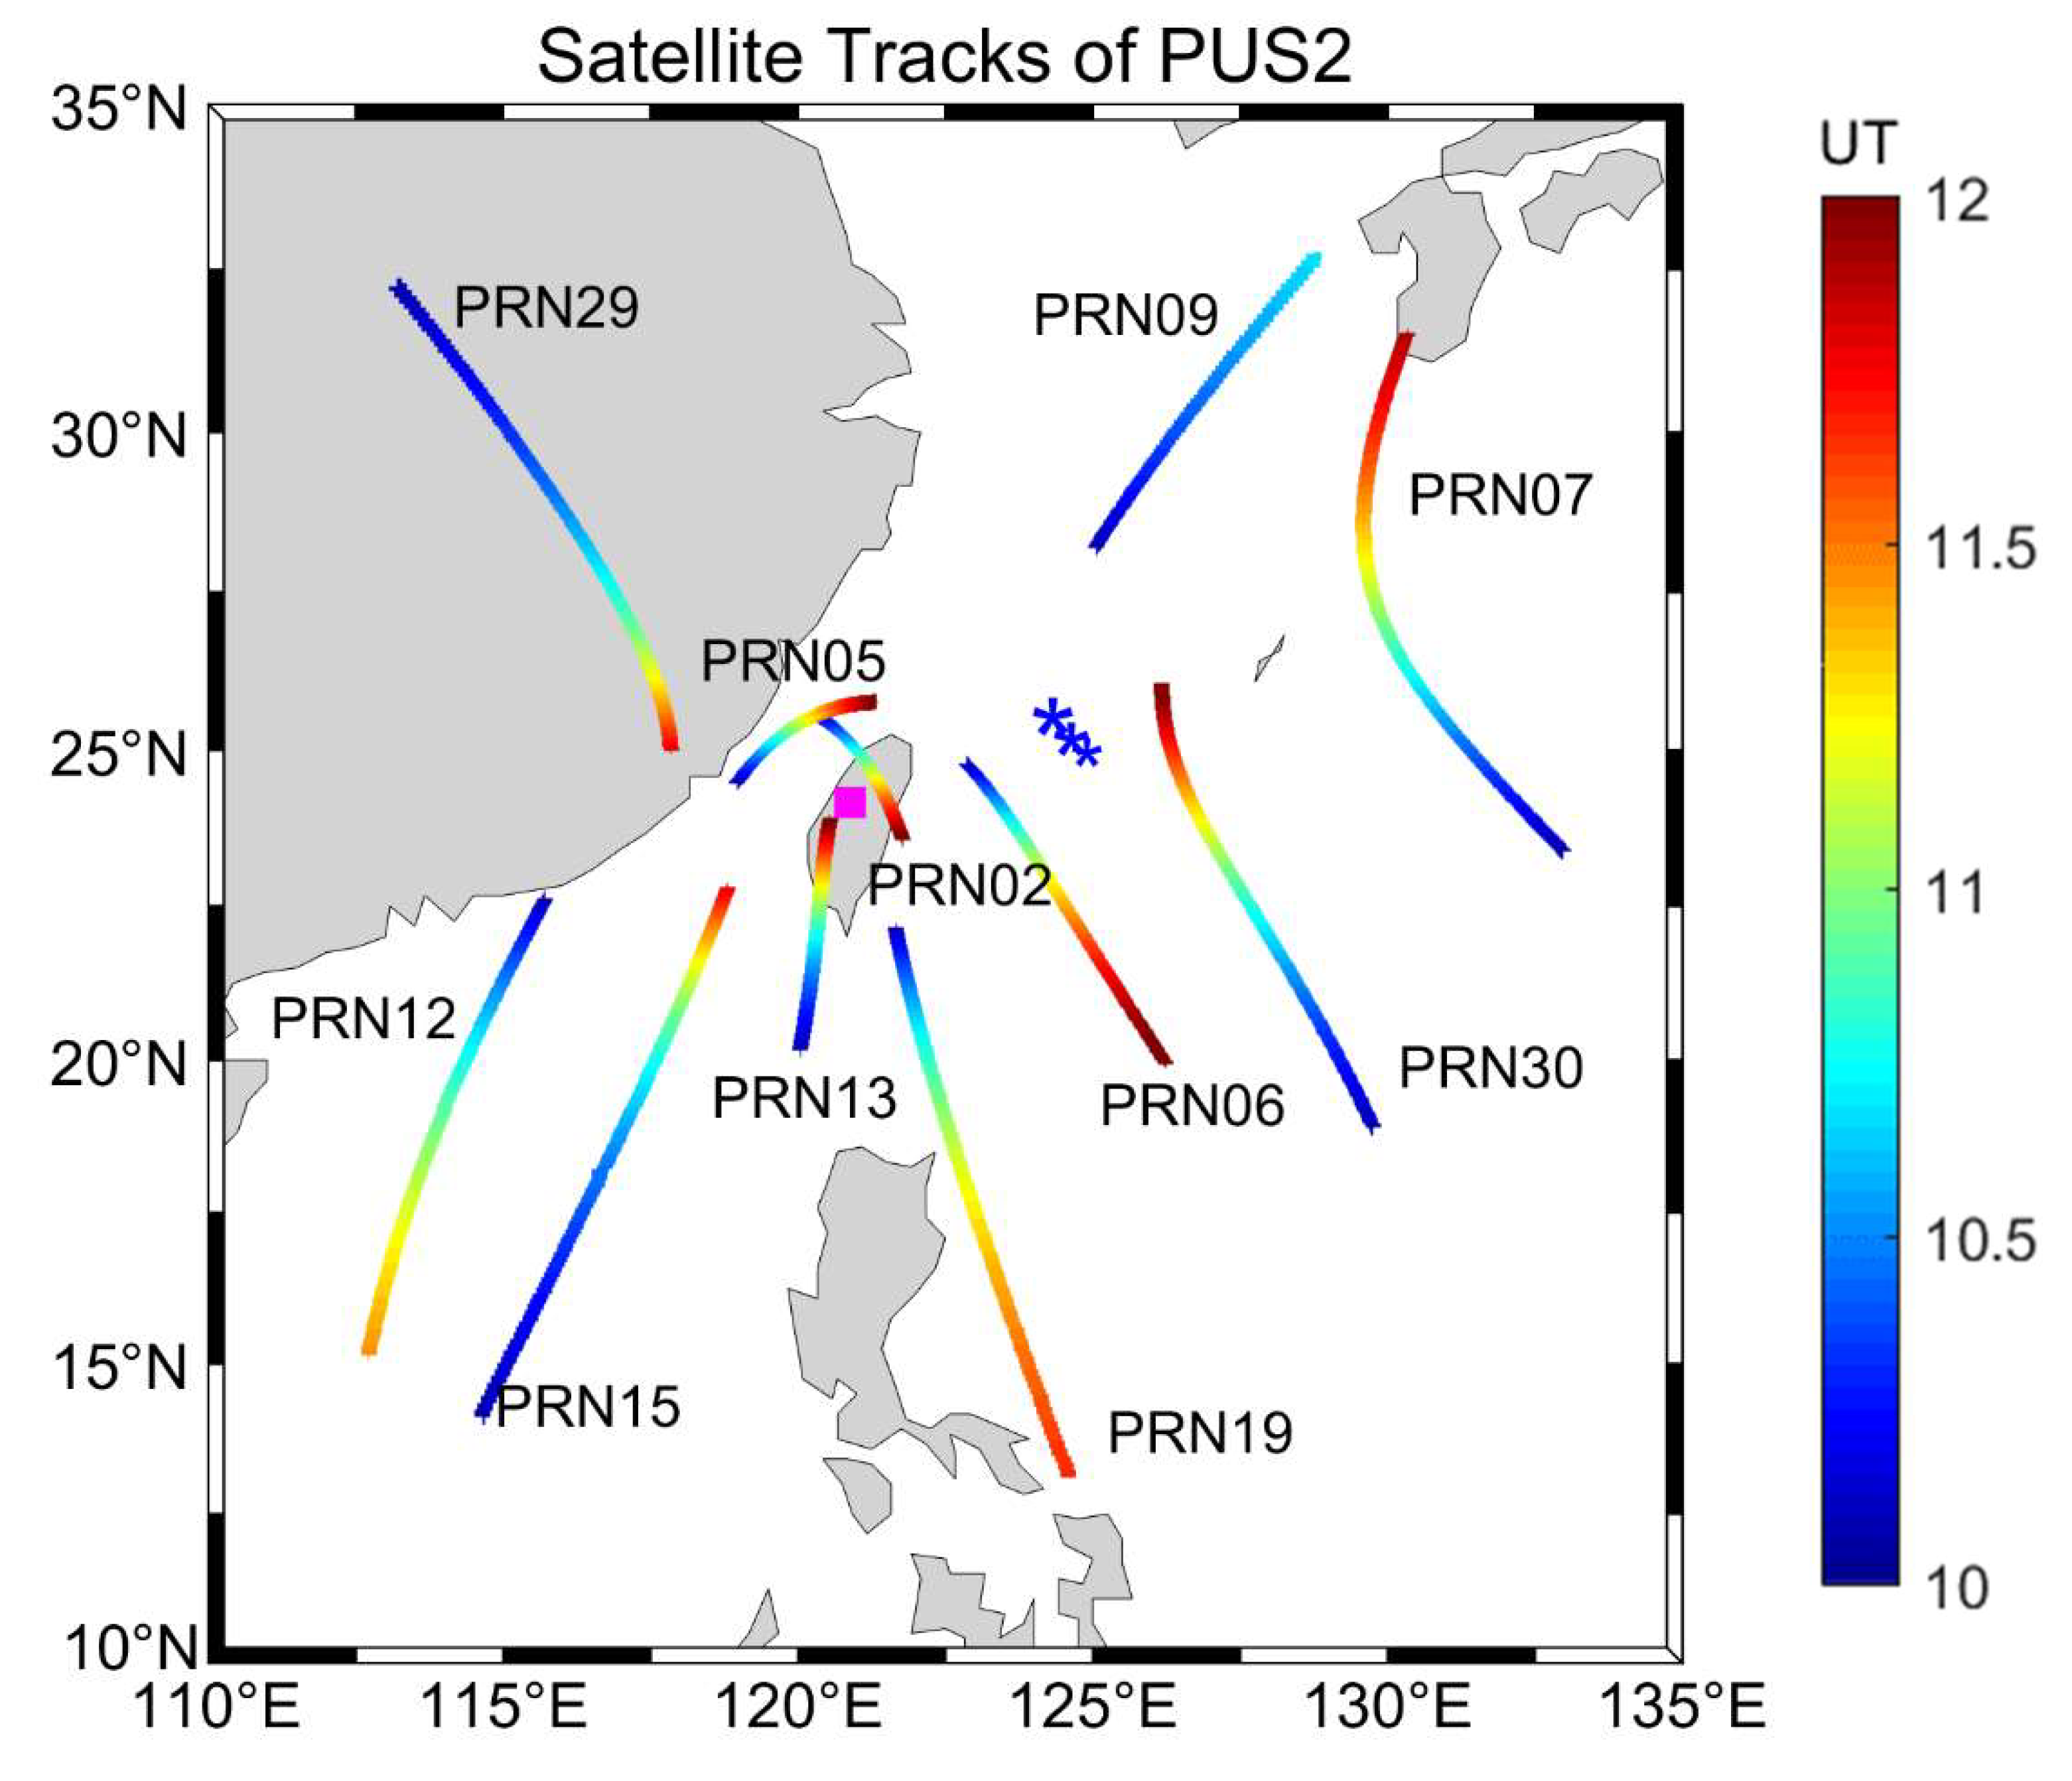
Figure 3 shows each sub-ionospheric point (SIP) trajectory obtained by observing each GPS satellite passing over station PUS2 at the eastern seas area of Taiwan during the period of 10–12 UTC, 10 July 2018. The blue asterisk indicates the typhoon eye, which is constantly moving, the magenta square is the location of station PUS2, and the color bar shows the time of the typhoon change. From Figure 3 it can be seen that during the period of 10–12 UTC—the stage of severe typhoon—there are many visible satellites, and the SIPs of PRN02 andPRN06, etc. are located near the typhoon eye. During its passage through the severe typhoon stage, the significant ionospheric disturbances are found at SIPs closer to the typhoon eye.
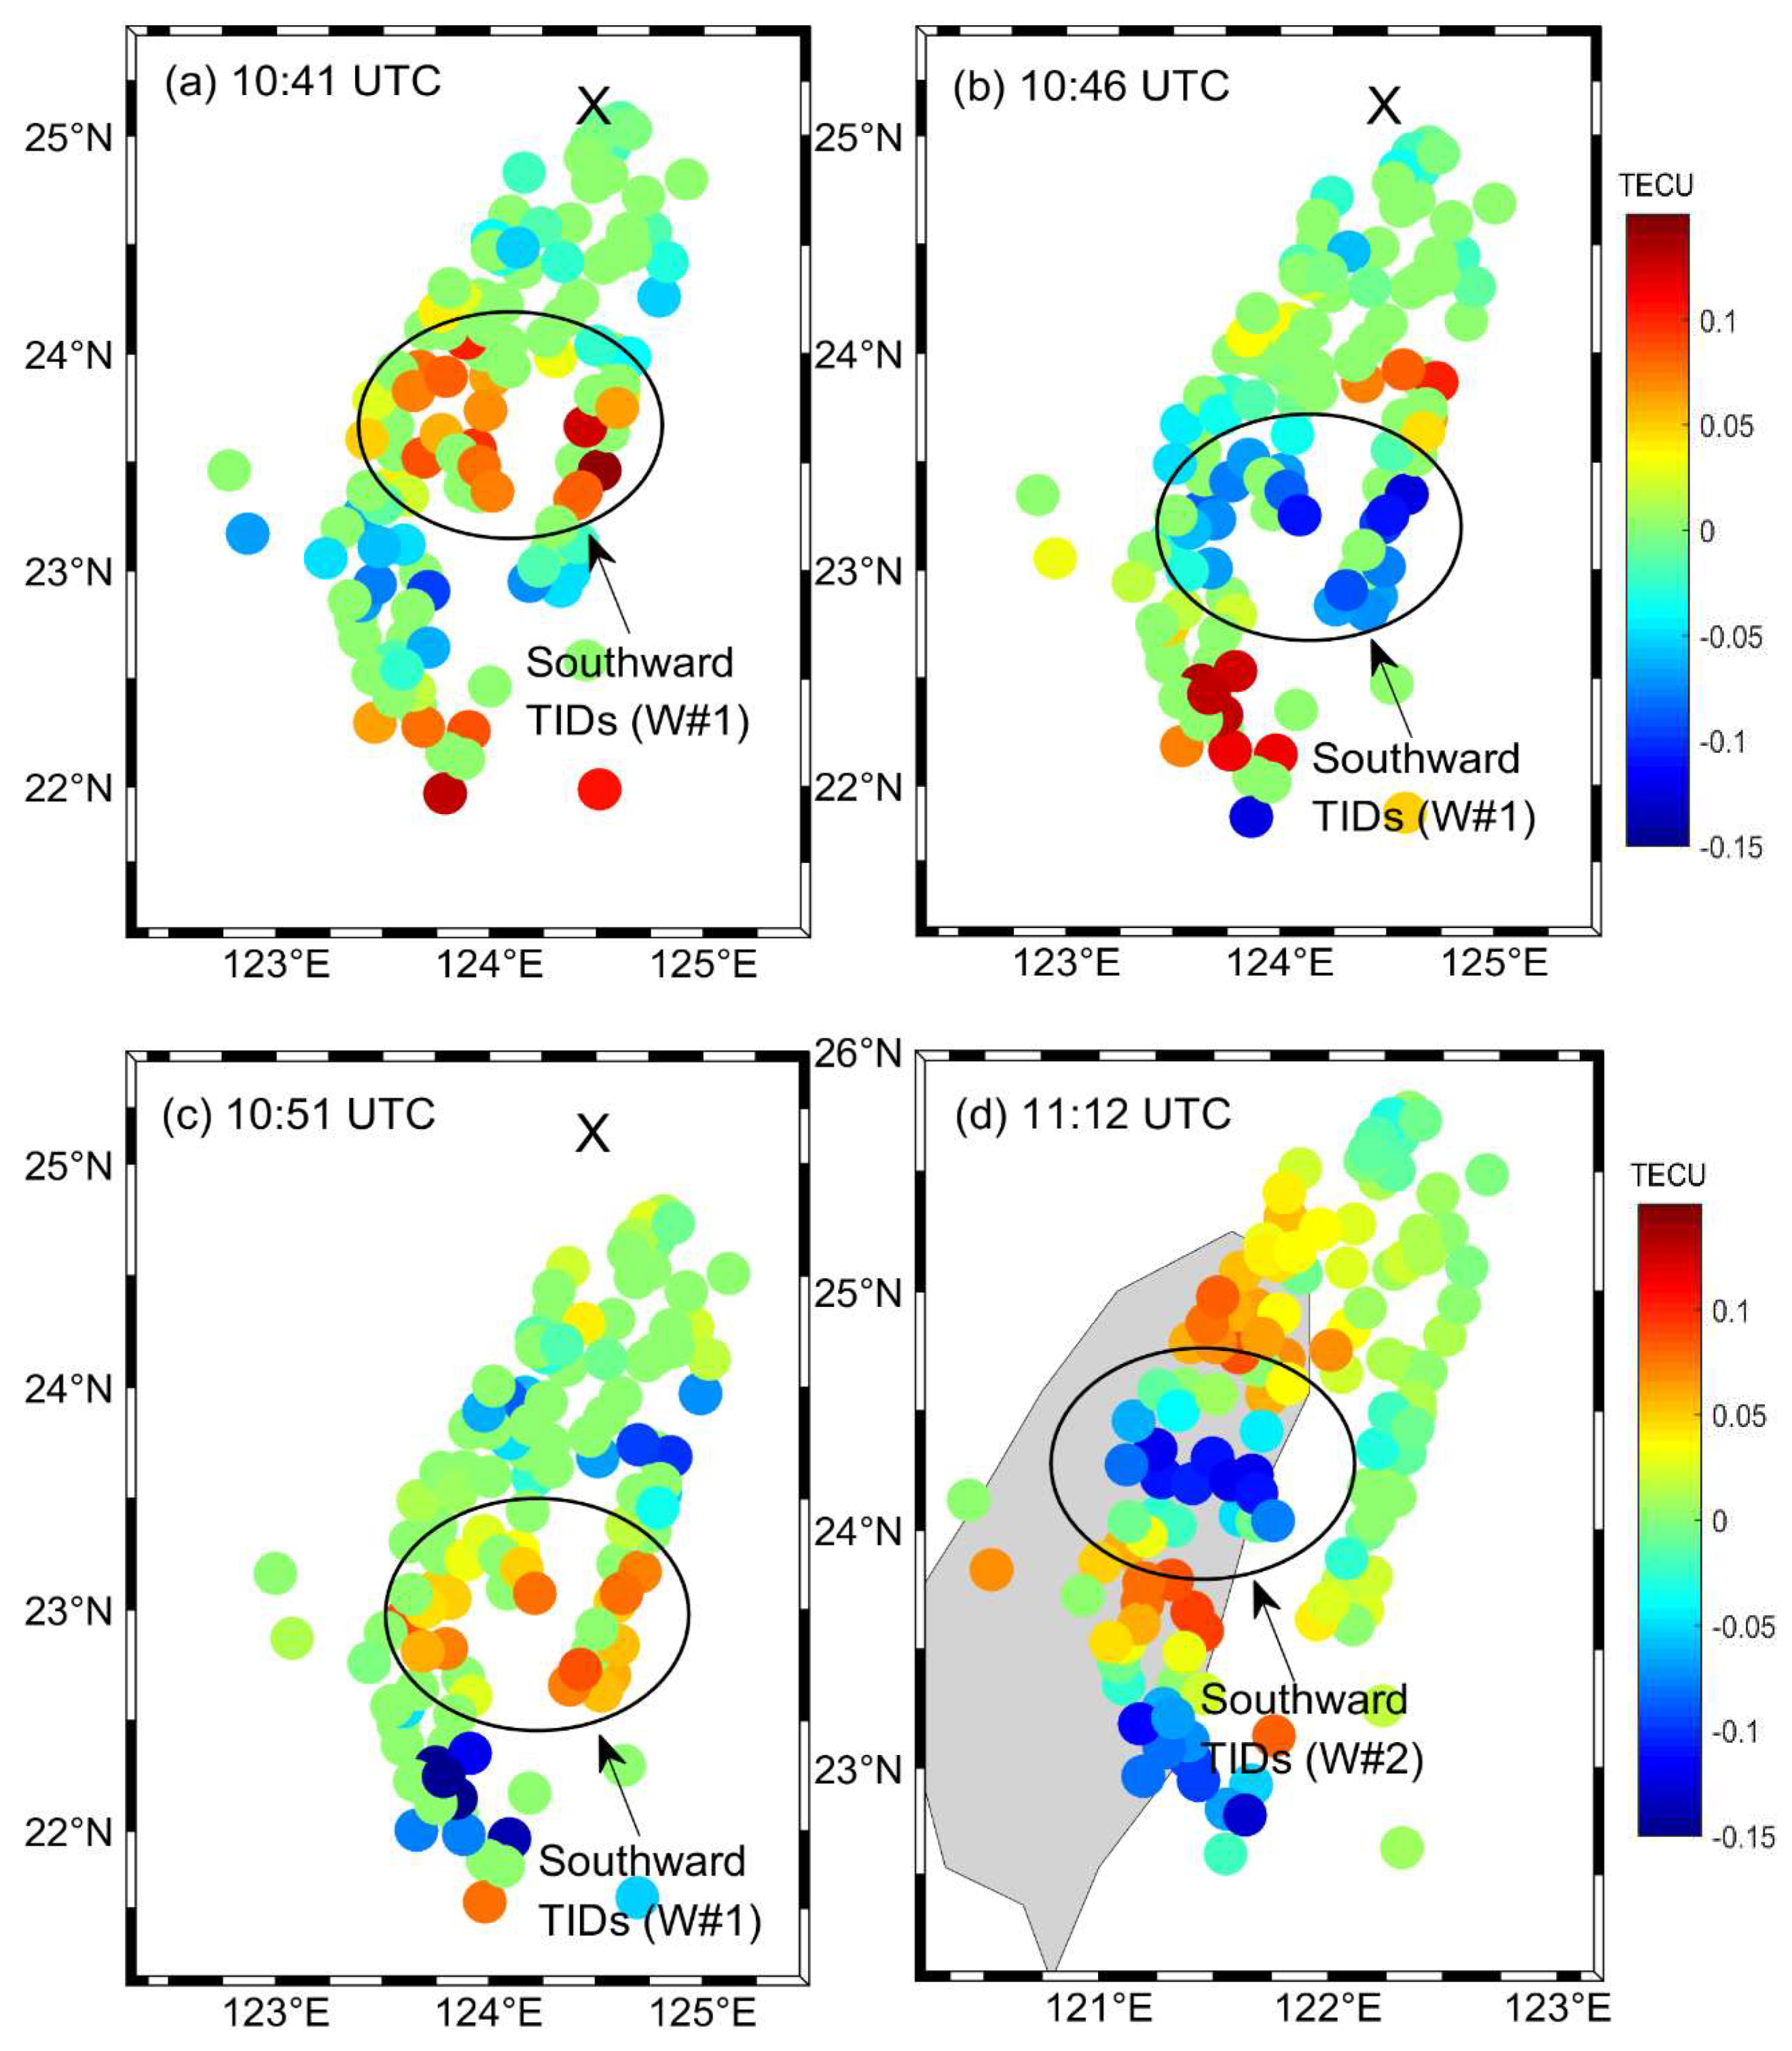
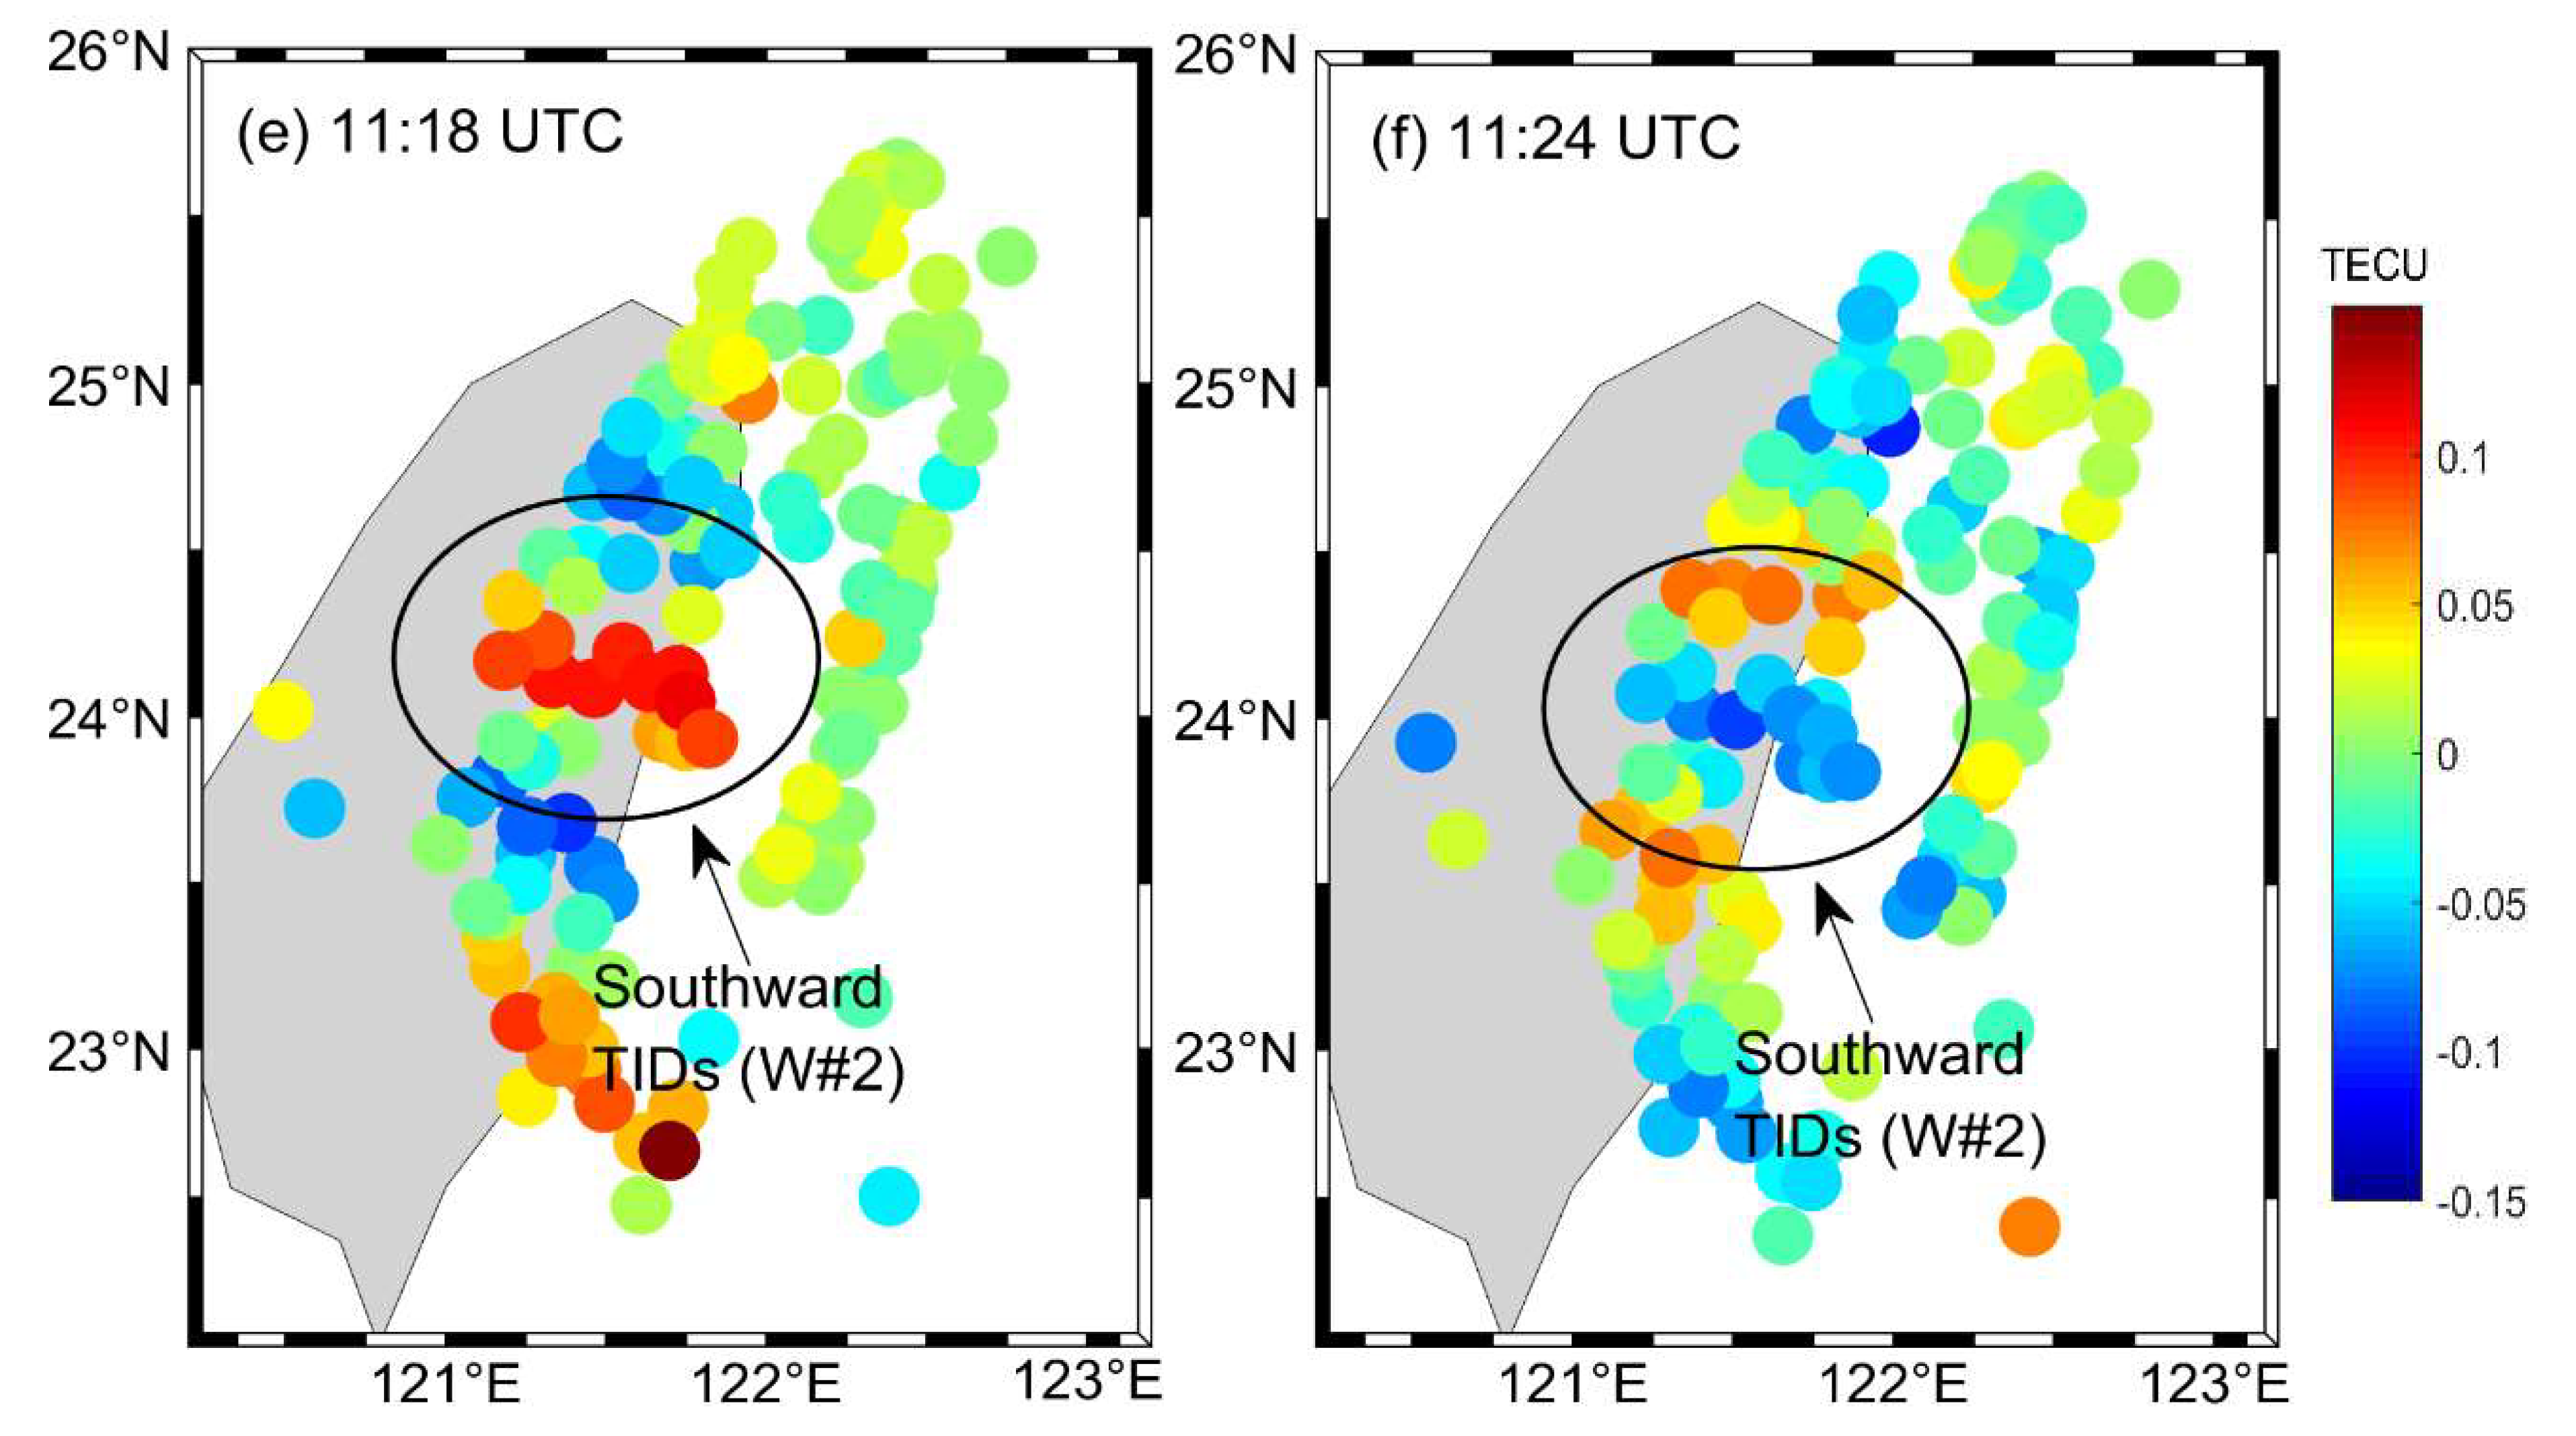
Each GPS station in the area has a similar geometry, because all stations are located in a limited region, so satellites tracked by PUS2 can also be tracked by more than 100 stations simultaneously. The TEC residuals after using the Butterworth filter to eliminate the SIP motion trend and ionospheric background showed significant disturbances during Typhoon Maria. Figure 4 shows the filtered TEC map from 10:41 to 11:24 UTC. The cross marker in Figure 4 indicates the typhoon eye, the color bar indicates the range of TEC change, and the colored solid points show the position of the SIP at a certain time. According to Figure 4, two significant ionospheric disturbances caused by Typhoon Maria were clearly observed. At 10:41 UTC, the ionospheric anomaly was detected for the first time (W # 1), the TEC range was between −0.15 and 0.15 TECU, and the disturbance period was about 10 min (Figure 4a–c). At 11:12 UTC, the anomaly was detected for the second time (W # 2), and the disturbance period was about 12 min (Figure 4d–f). Positive and negative disturbances were located in the southwest of the typhoon eye, spreading southeast.
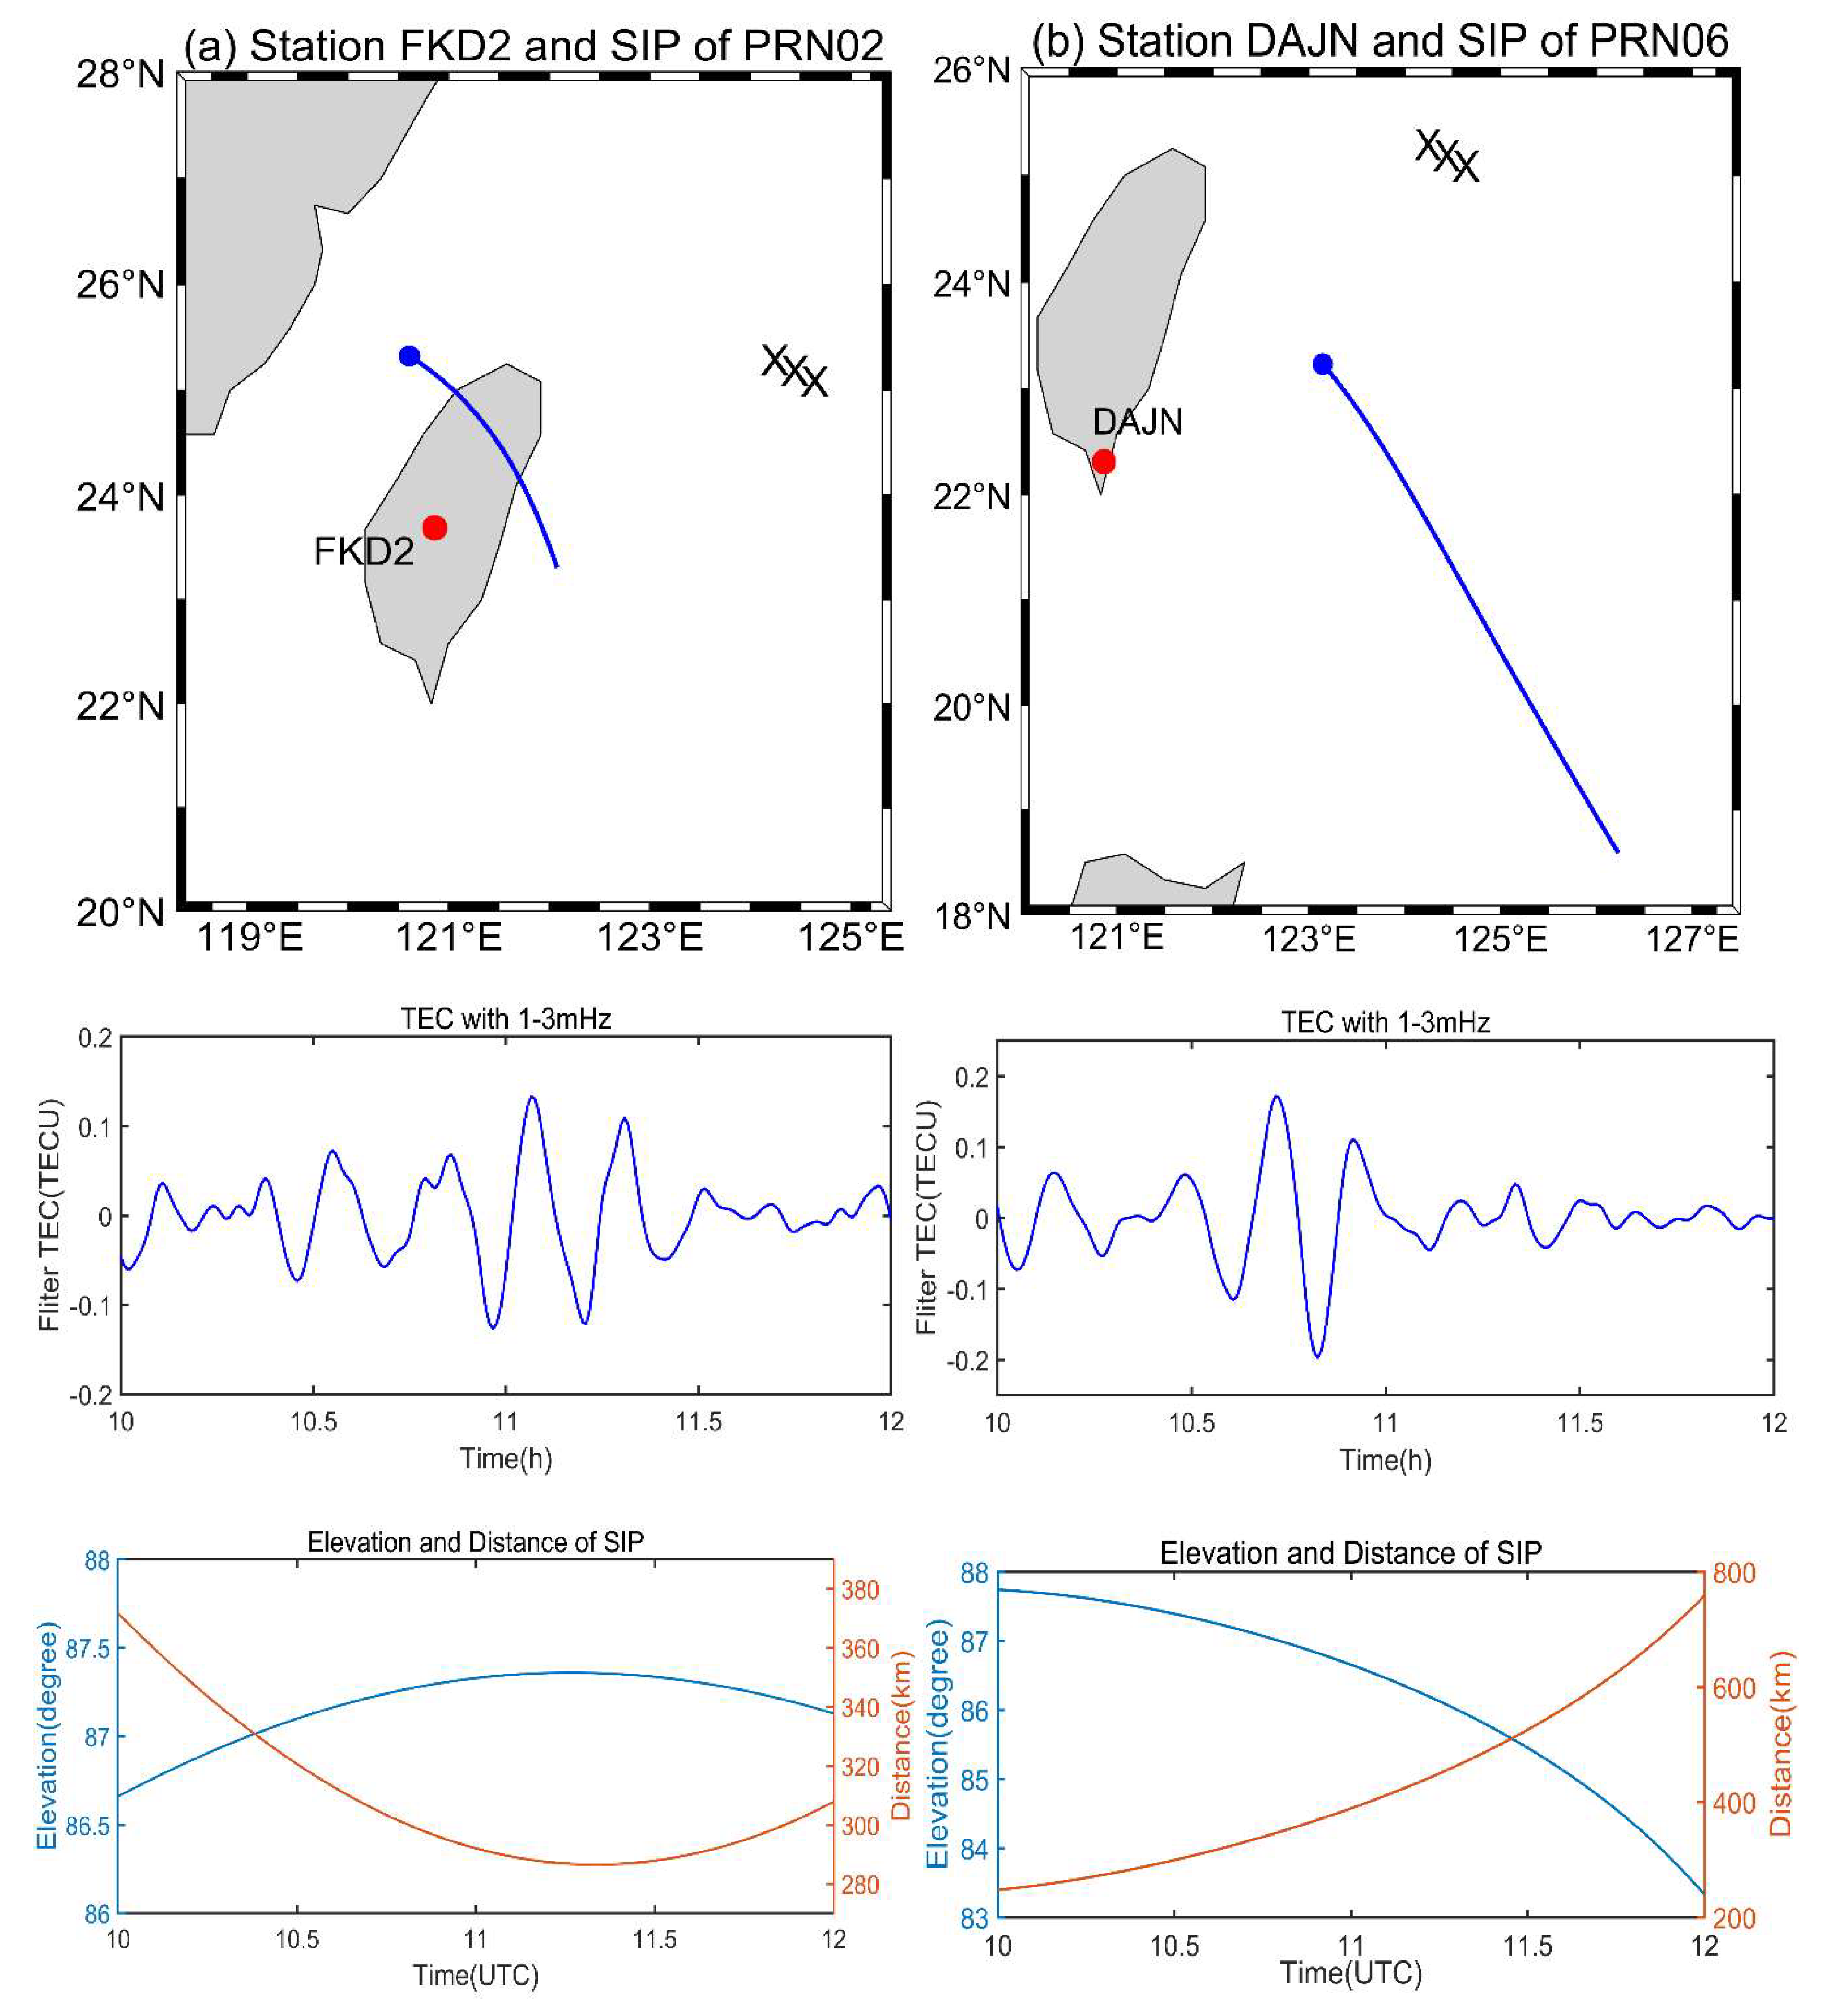
Figure 5 shows the tracks of the sub-ionospheric point (SIP) observed by satellite PRN02 at station FKD2 and satellite PRN06 at station DAJN from 10:00 to 12:00 UTC, the filtered TEC time series diagram of the two stations, the change of elevation angle and distance between the typhoon eyes and the SIP. The top two graphs show the SIP track of two stations from 10:00–12:00 UTC. The black cross indicates the typhoon eye, the red dots show the positions of the two aforementioned stations, and the blue line represents the SIP track. Both tracks were located in the southwest of the typhoon eye and moved from southeast to northeast. From the middle two panels, two periodic wave forms of ionospheric disturbances were observed at 10:40 and 11:06 UTC, respectively, instead of the typical N-shaped waves. The amplitude of the disturbance observed by satellite PRN02 at station FKD2 was slightly smaller than that from satellite PRN06 at station DAJN. The bottom panel shows that the elevation range of satellite PRN02 observed by station FKD2 was 86.7–87.1°, while the elevation range of satellite PRN06 observed by station DAJN was 83.5–87.8°. Therefore, the ionospheric disturbances were mainly detected by GPS with higher elevations angles and with a distance of less than about 400 km between the SIP and the typhoon eye. In addition, the background TEC may have affected the magnitude of the ionospheric disturbance caused by the typhoon.
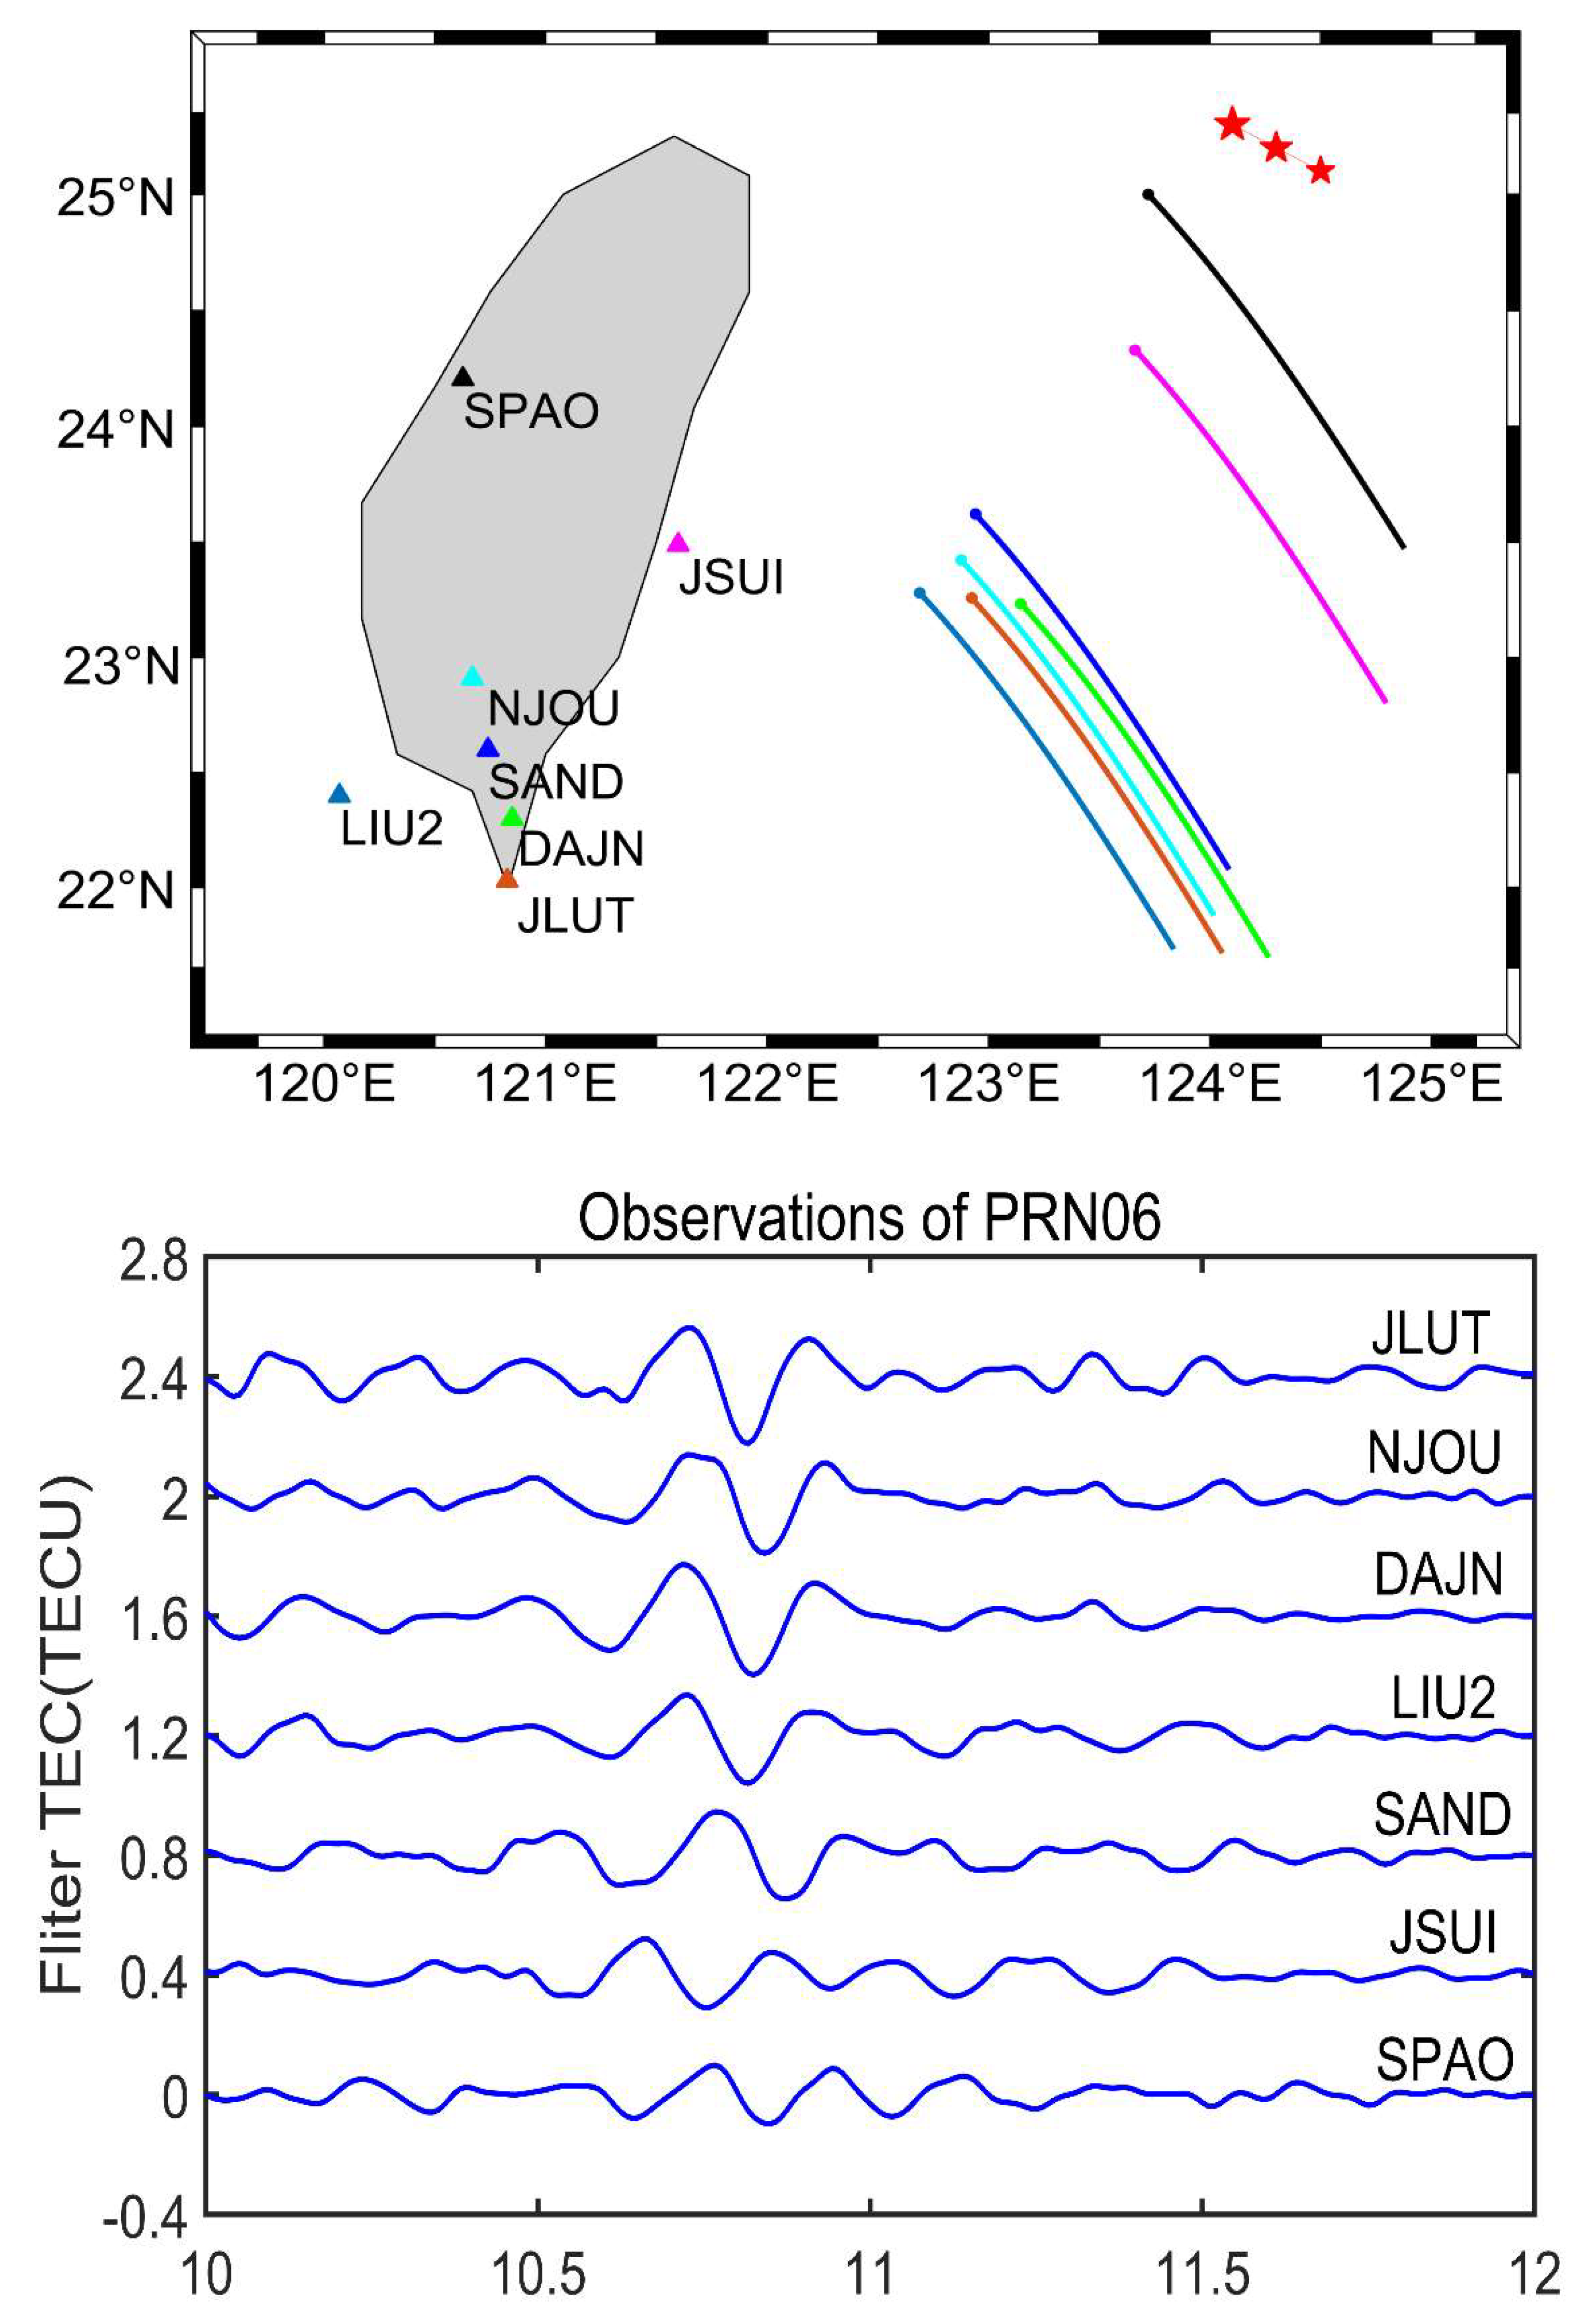
Seven differently distributed stations were selected to clearly show the TEC disturbances. The characteristics of the SIP tracks, the occurrence time of the perturbation sequence, and the amplitude of the disturbance observed by the satellite PRN06 were all analyzed. As shown in Figure 6, the upper panel shows the SIP tracks map of the satellite PRN06 at seven different stations (different colors). The red pentagon represents the position of the typhoon eyes in time. The bottom panel presents the filtered TEC disturbance sequences of the seven stations as a function of time. It clearly shows significant TEC disturbances at seven stations when the typhoon passed through the eastern sea area of Taiwan on 10 July 2018. In addition, it is interesting to see that the disturbance amplitude at the SPAO station closer to the typhoon eye was smaller, while the JLUT station that is farther from the typhoon eye had a larger TEC disturbance.
3.2. Disturbance Propagation Velocity
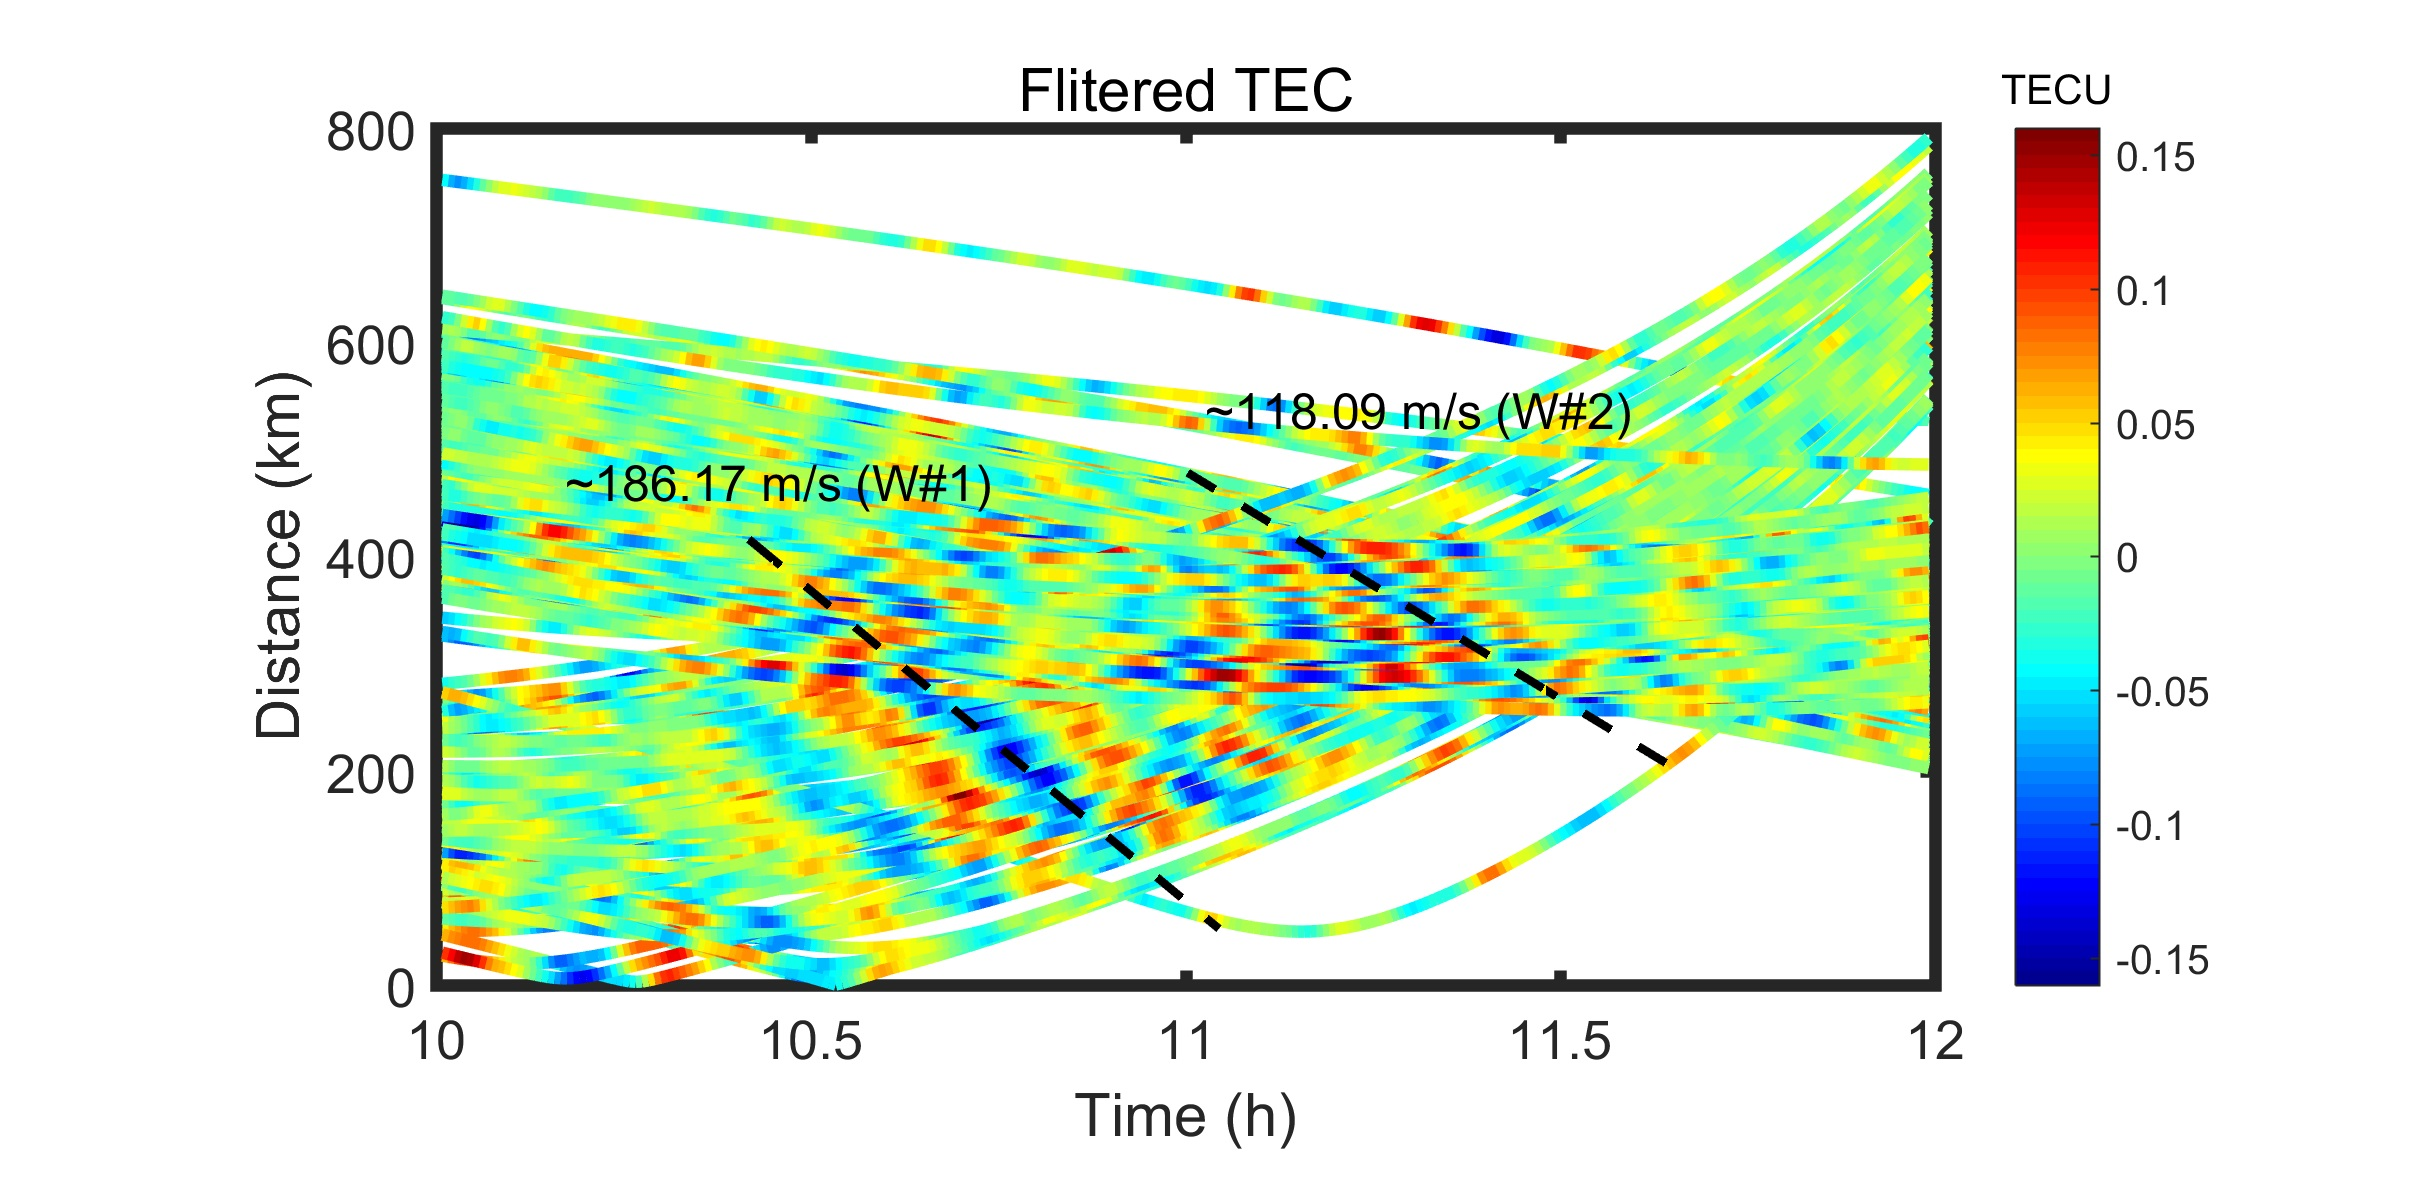
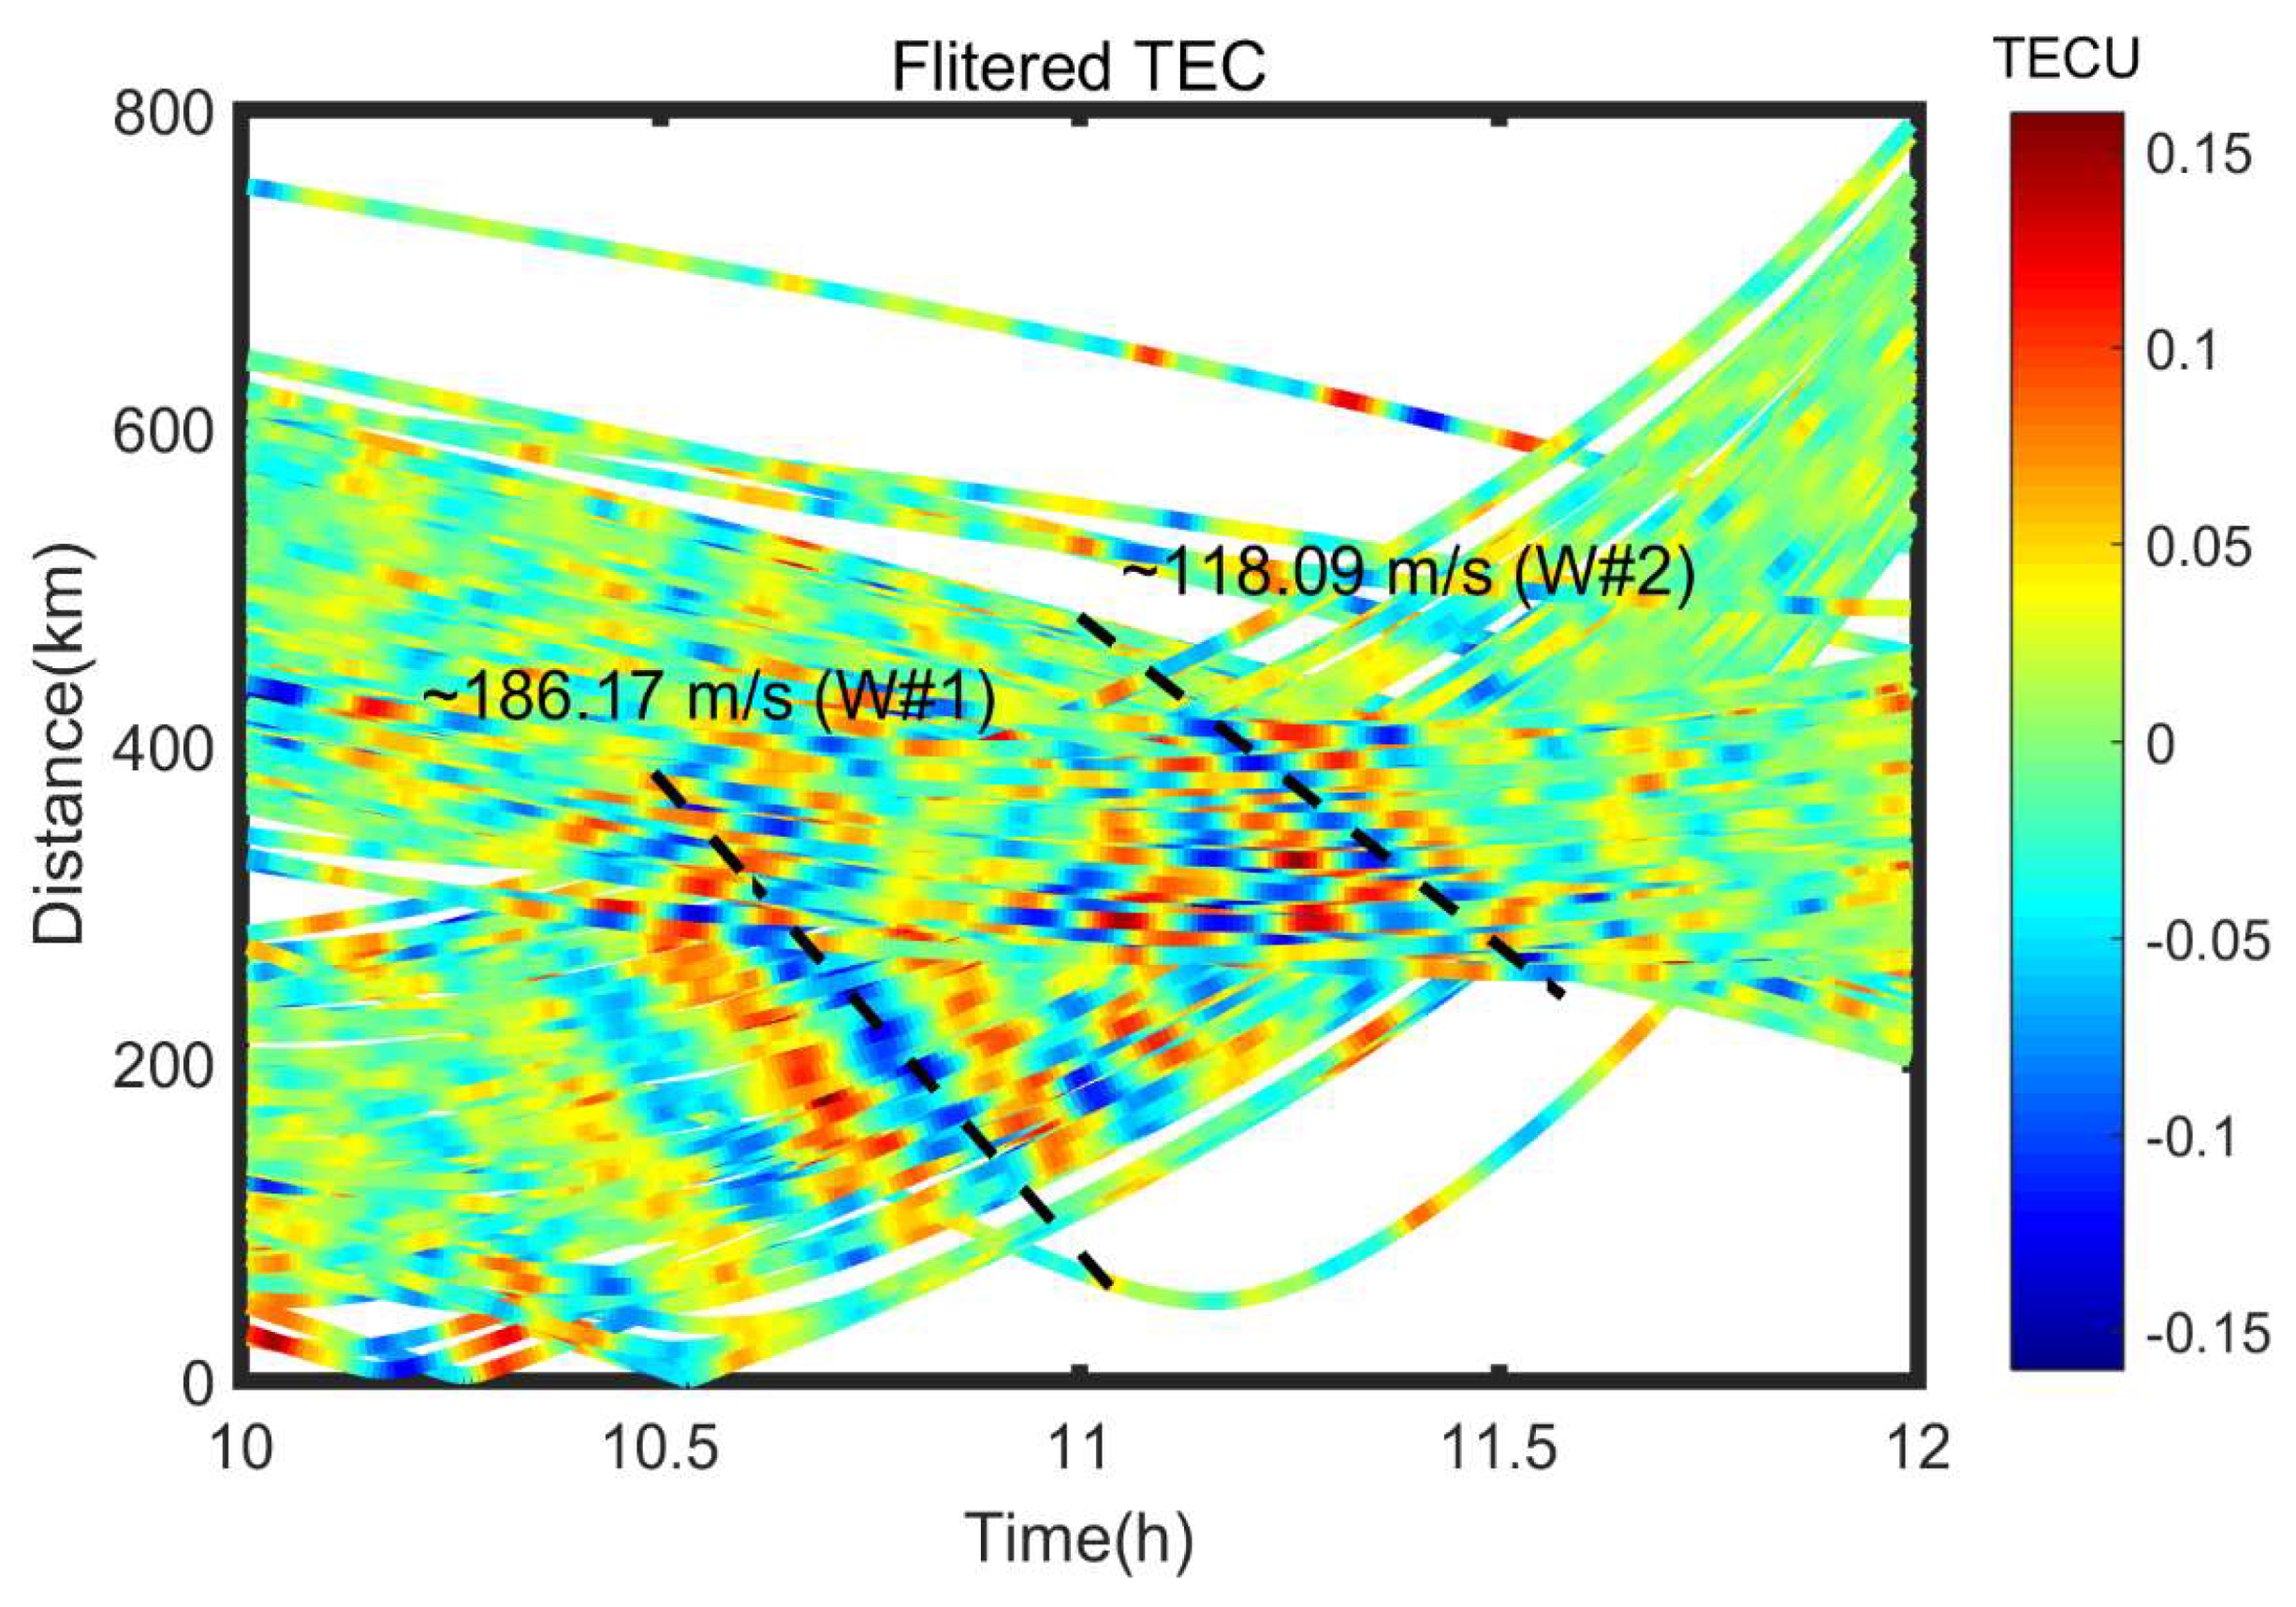
In order to further know the propagation velocity of the traveling ionospheric disturbance caused by Typhoon Maria, a linear fitting was performed according to the position of where the TEC disturbance was at its maximum during the 10:00–12:00 UTC period on 10 July 2018, and the propagation speeds of the two disturbances were estimated. Figure 7 shows the time series of the filtered TEC by PRN02 and PRN06 at all stations from 10:00–12:00 UTC, which clearly illustrates the linear relationship between the disturbance propagation time and the distance between the typhoon eyes and the SIP changes. The velocity of ionospheric disturbance was about 118.09 m/s from PRN02 and about 186.17 m/s from PRN06. The velocities of both disturbances were in the range of the gravity-wave propagation speed, so the two traveling ionospheric disturbances were mainly caused by the gravity waves being excited by Typhoon Maria.
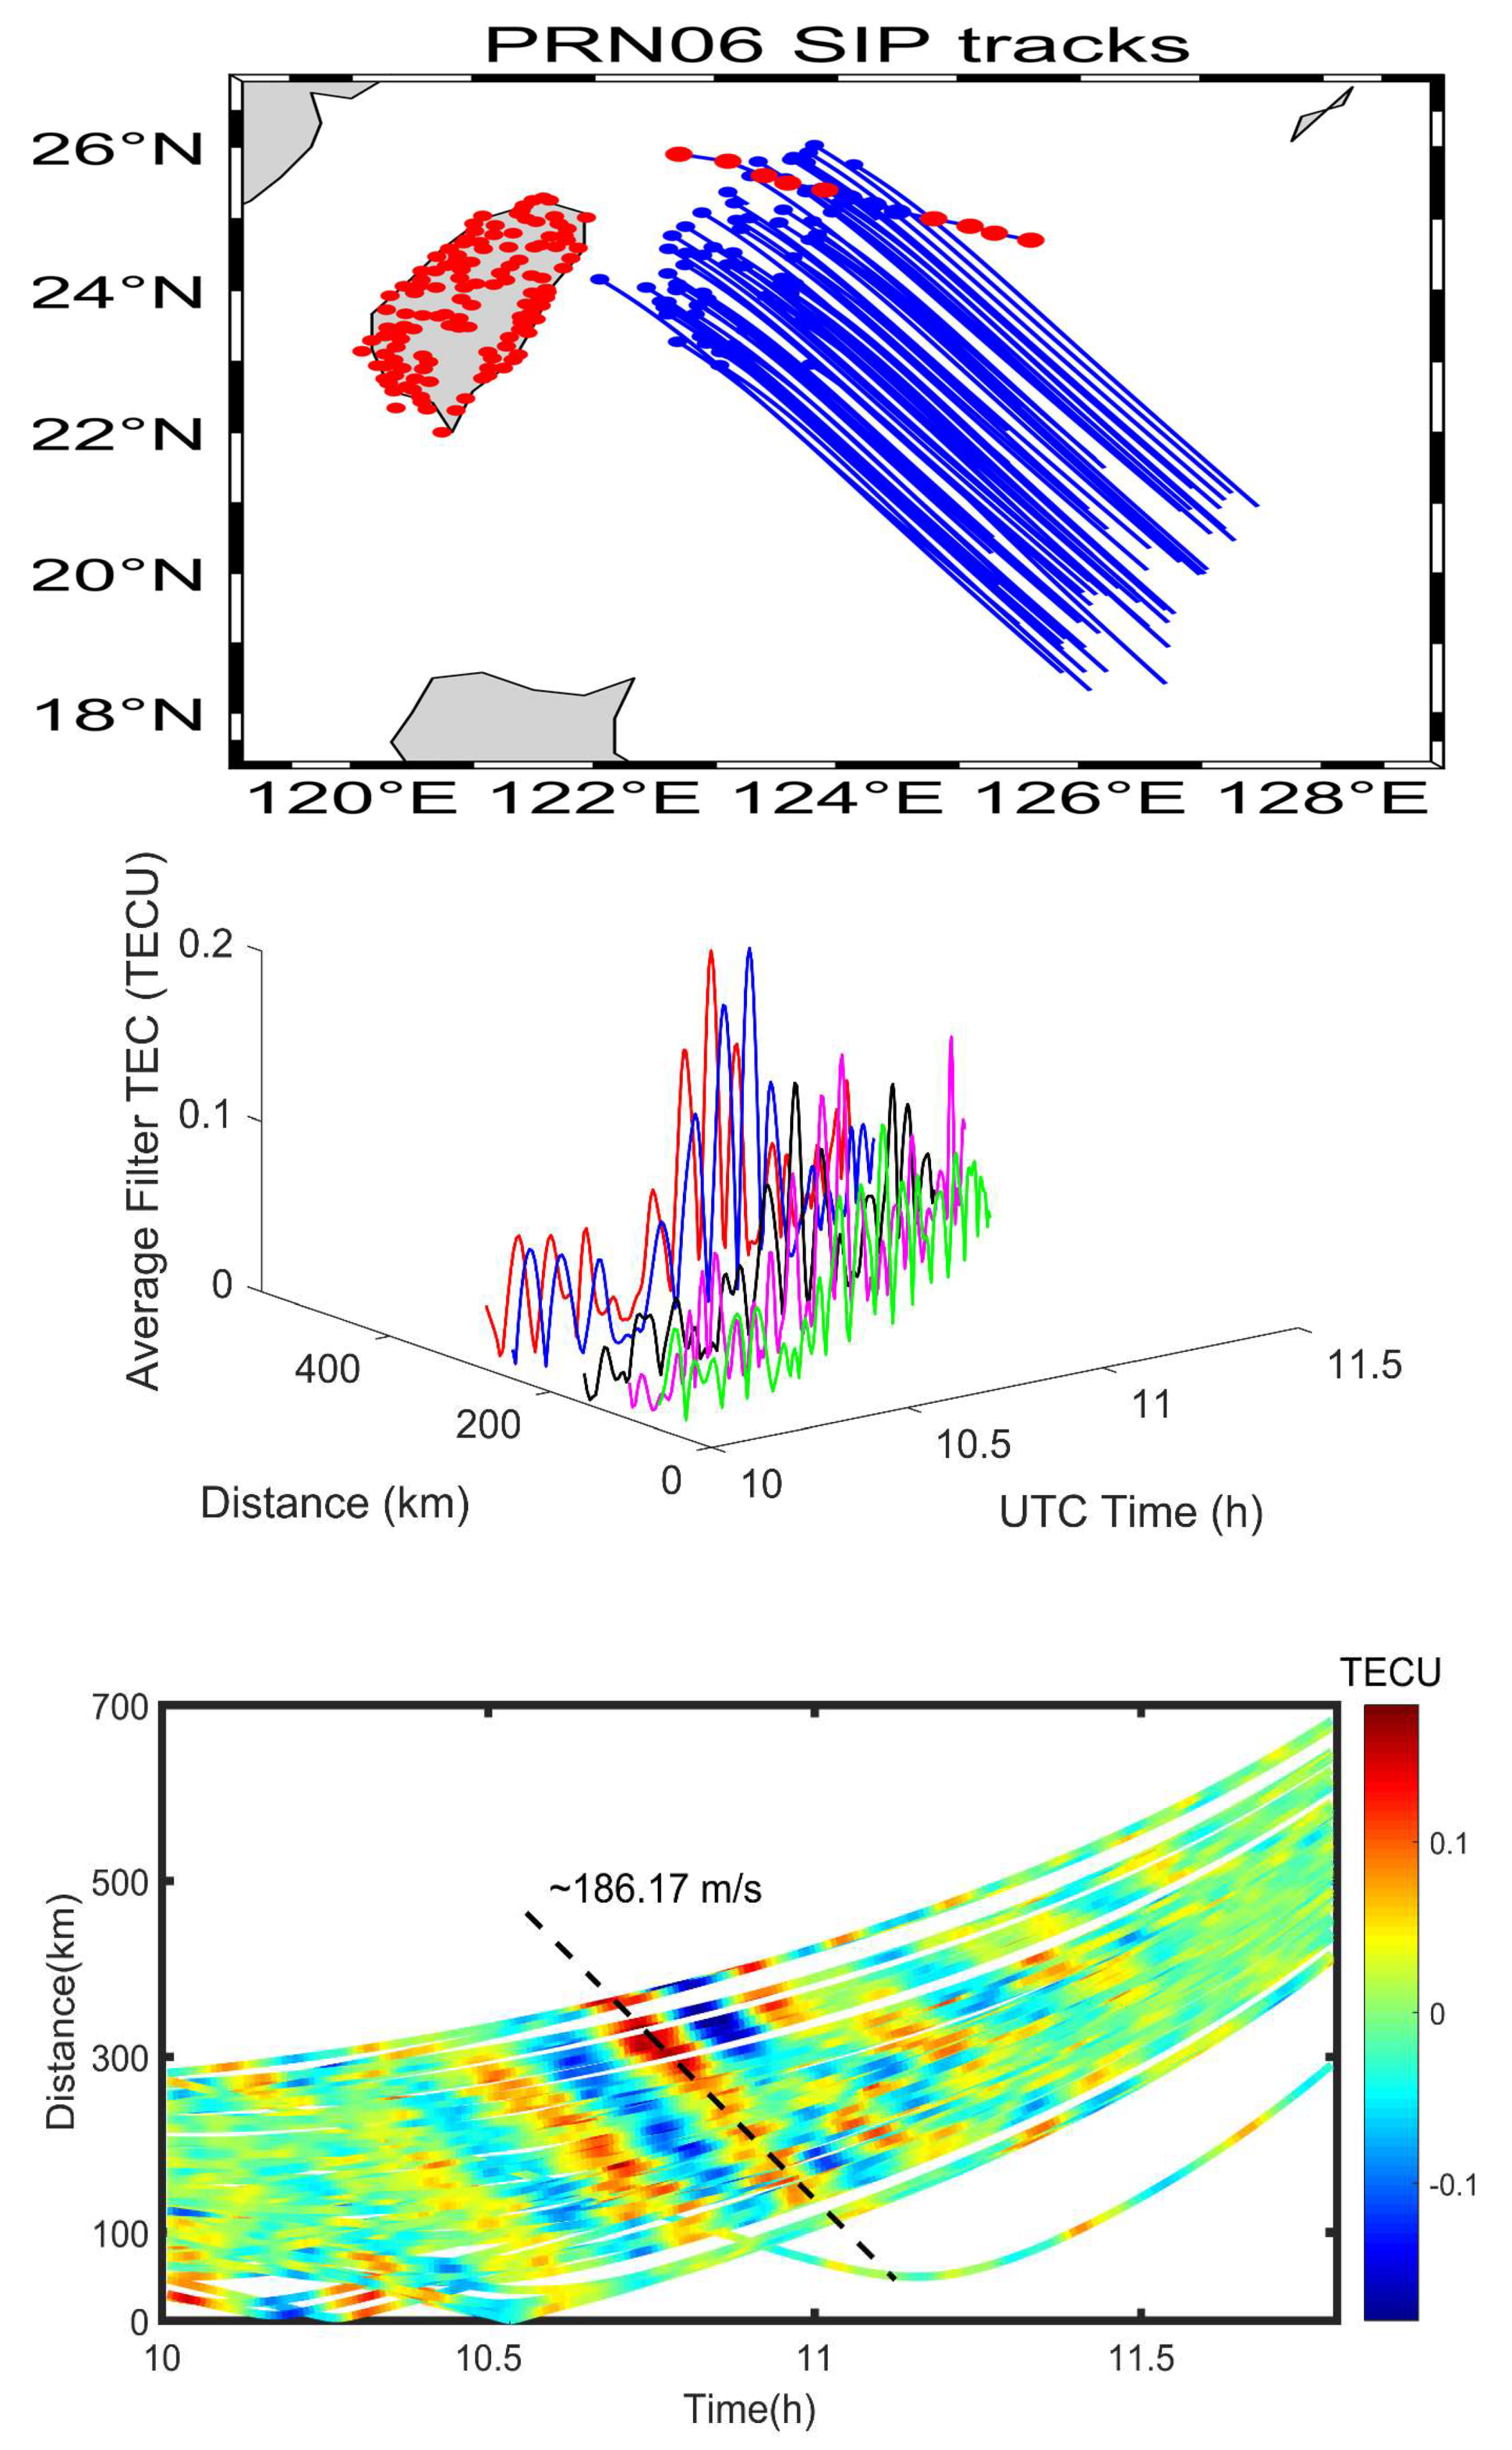
Figure 8 shows the detailed characteristics of the TEC anomalies detected by PRN06. The top panel shows the SIP tracks of all stations from 10:00–12:00 UTC. The blue and red dots indicate the position of the typhoon eye during the typhoon movement, and the solid blue line indicates the SIP tracks. Most SIP tracks TEC were distributed at the south of the typhoon eye and moved southeast. The middle panel shows the relationship between the average filtered TEC and the distance between the typhoon eyes and the SIP from 10:00–12:00 UTC. It can be concluded that the maximum value of average filtered TEC appeared near to 10:45 UTC. Finally, the bottom panel shows the travel time‒distance diagram of PRN06 with a fitting speed of about 186.17 m/s.
3.3. Disturbance Azimuth Variation
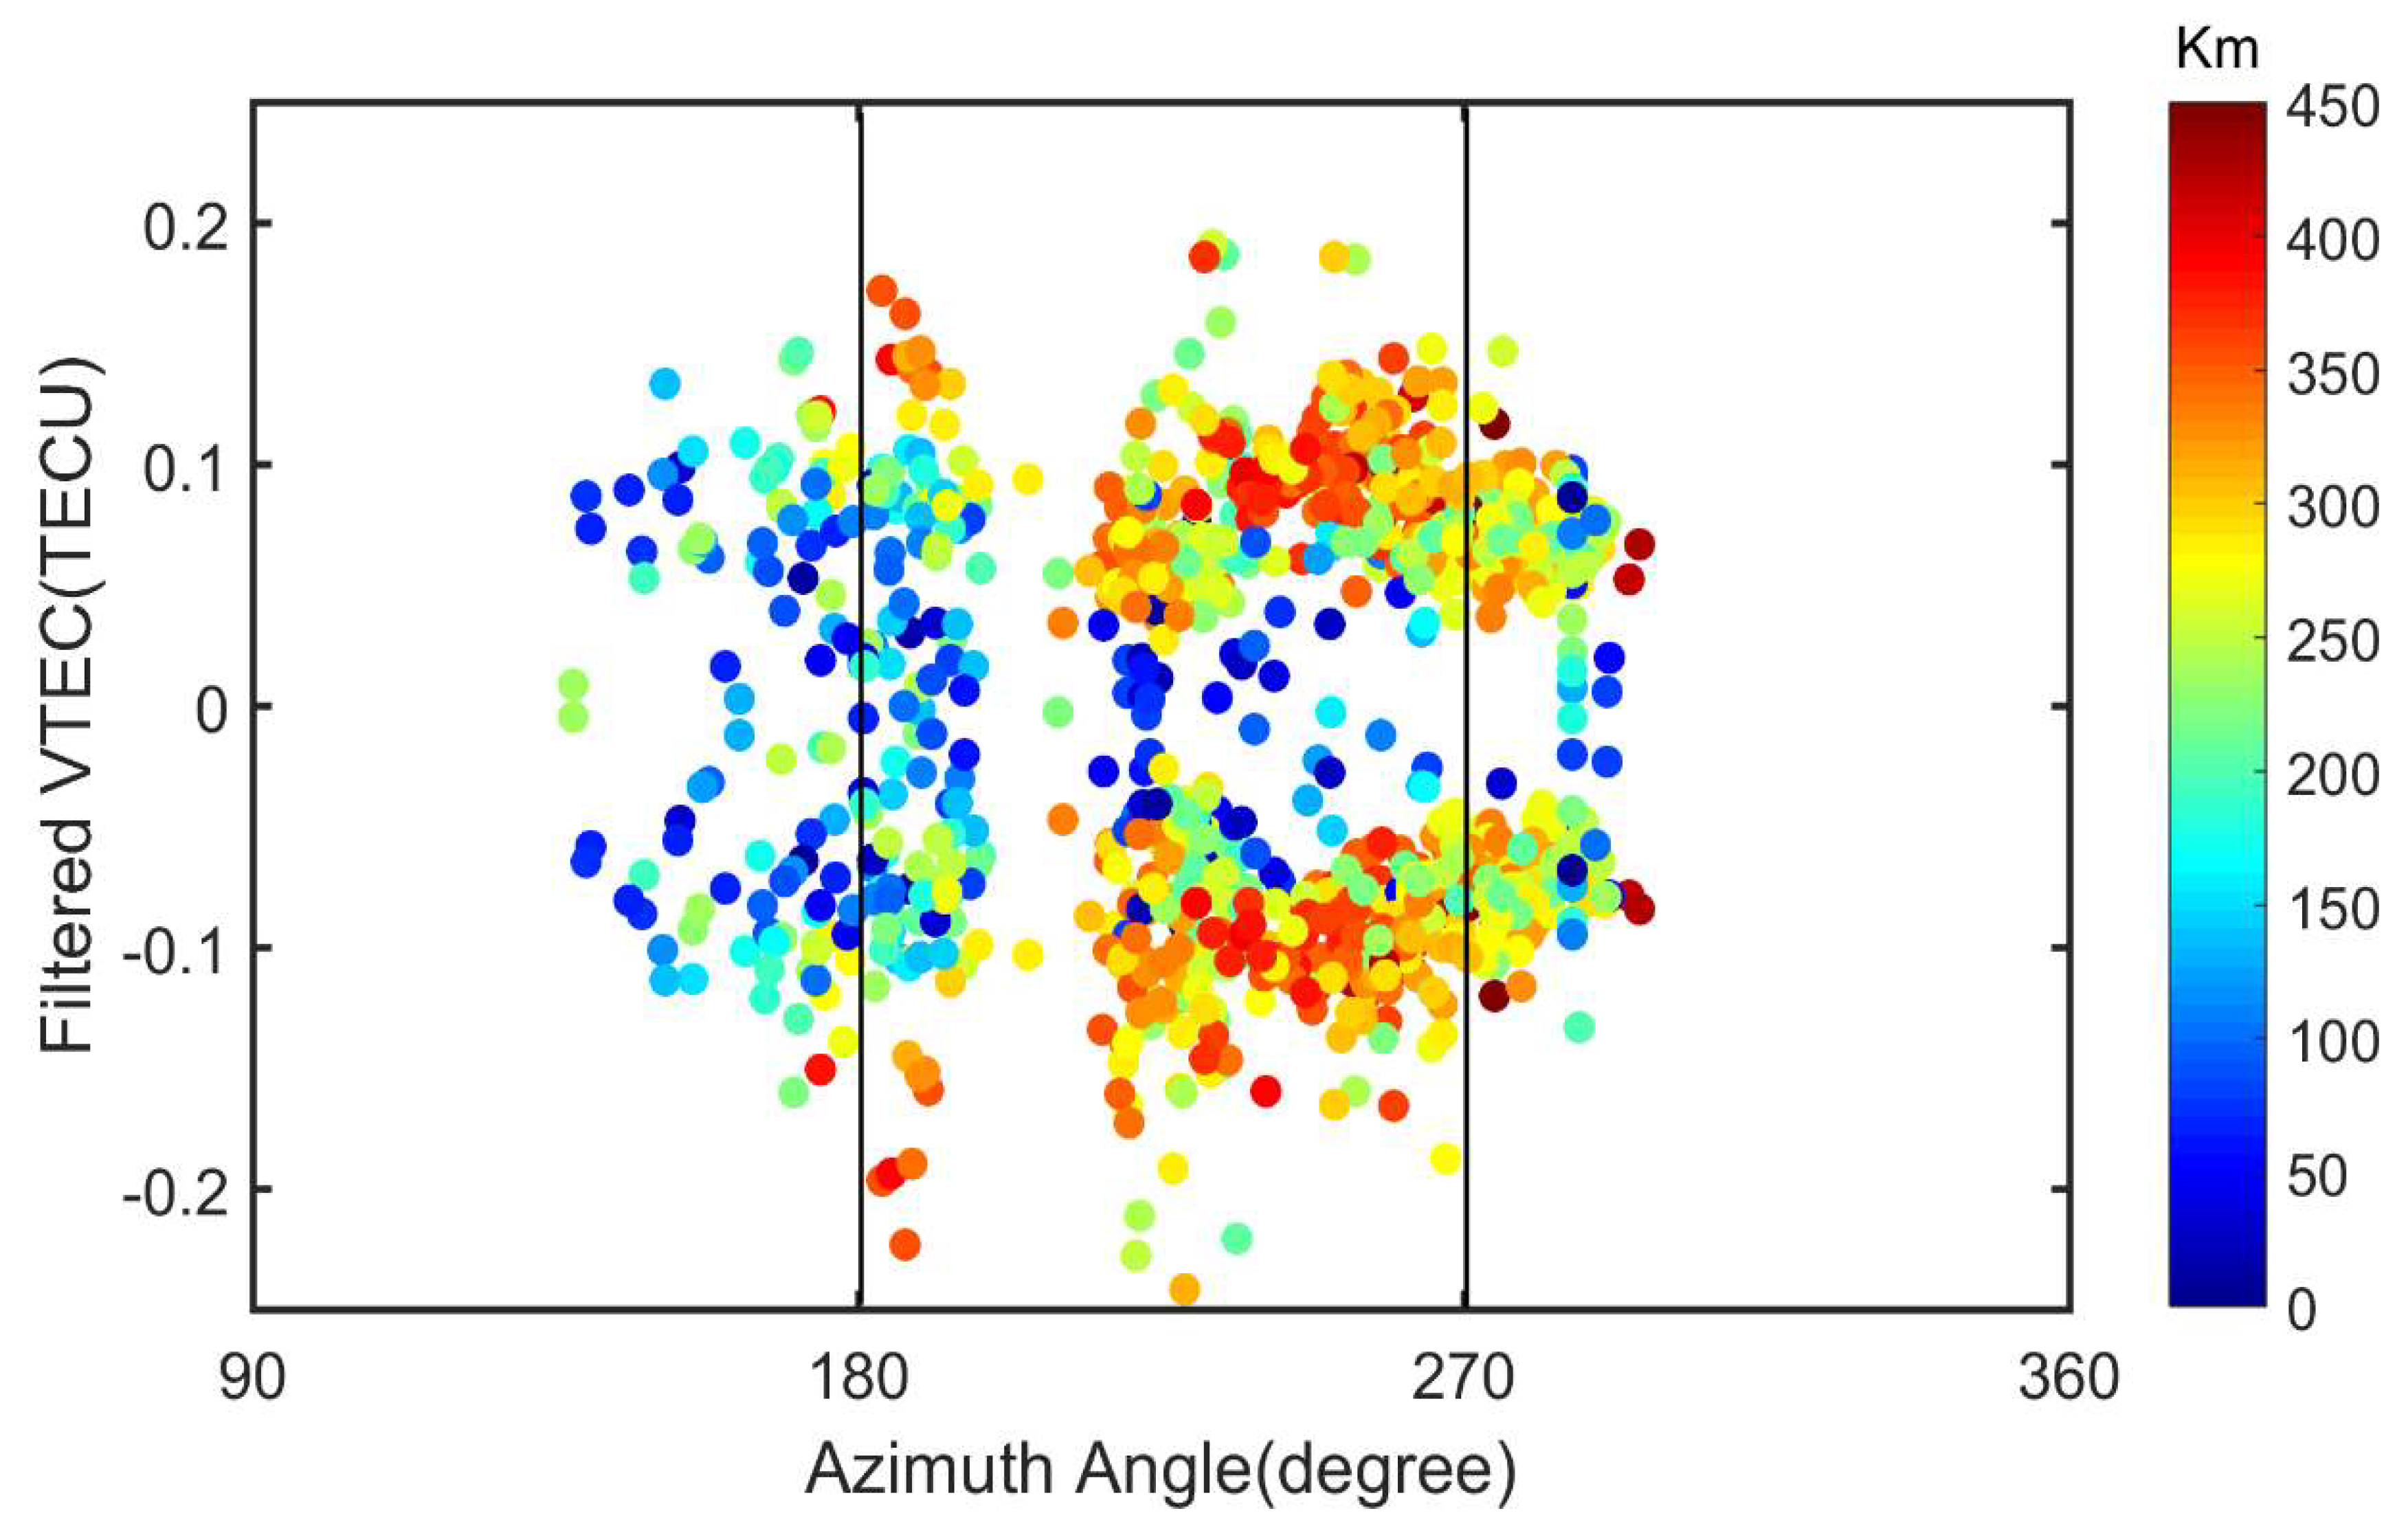
Figure 9 shows the change of the filtered TEC with the azimuth, while the color represents different distances between the typhoon eye and the SIP. It can be seen that the disturbance anomalies were mainly concentrated from −0.2–0.2 TECU and mainly located at 135–300° in the azimuth, namely the southwest direction of the typhoon eye, which is consistent with the conclusion drawn in Figure 4. Additionally, it is interesting to know that the farther the station was from the typhoon eye, the larger the ionospheric disturbance was, although more observations are needed to test and understand the processing in the future.
3.4. Disturbance Spectrum Characteristics
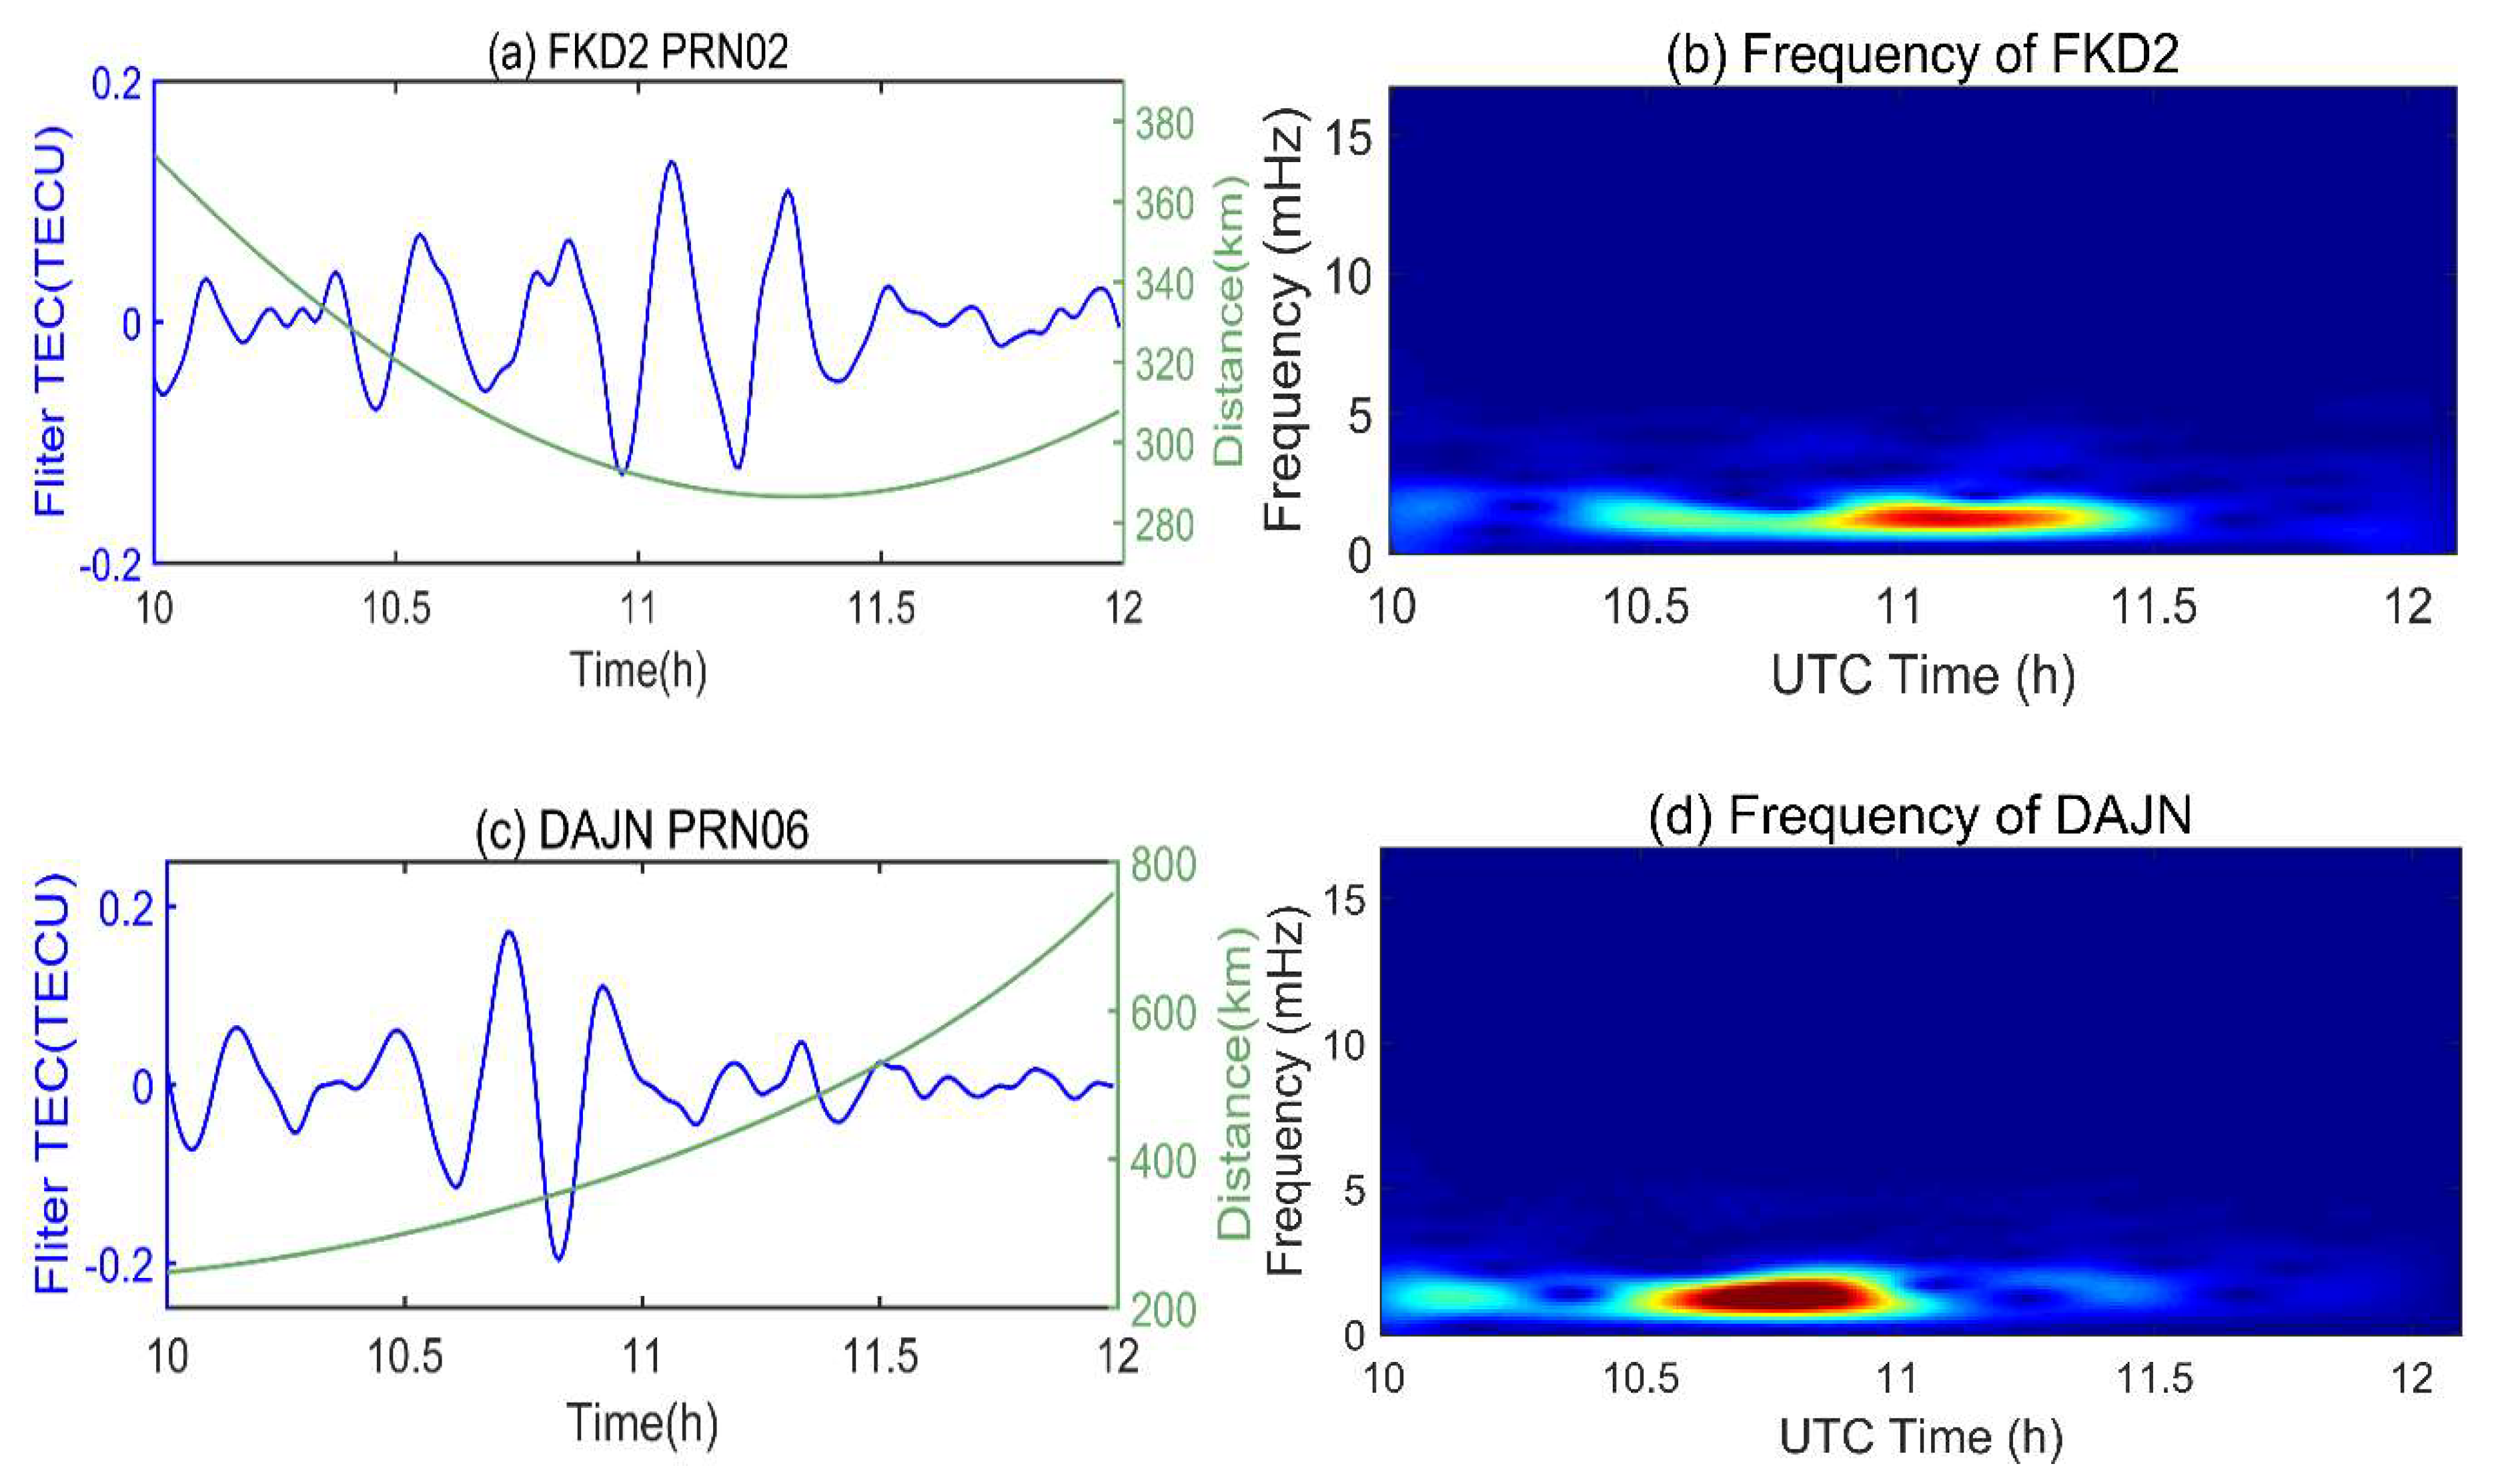
The filtered TEC time series were used further to analyze the amplitude, period, and velocity of the traveling ionospheric disturbance caused by the gravity wave that was excited by the 2018 Typhoon Maria in the time domain, but it mainly reflected the amplitude changes of the TEC series. For this reason, short-time Fourier transform was used to convert disturbance signal from the time domain to the frequency domain. The spectrum diagram of the disturbance series of PRN02 for station FKD2 and PRN06 for station DAJN are shown in Figure 10. The filtered VTEC time series and the change in distance between the typhoon eye and the SIP are shown in the left panel (blue and green), and the spectrograms of the two station disturbance sequences are shown in the right panel. The attenuation of the fourth-order band-pass Butterworth filter in the passband of 1–3 mHz was small, and two obvious ionospheric disturbances were extracted. It can be clearly observed from Figure 10 that at the time when an abnormal value occurred in the time series, the frequency peak of the corresponding time on the spectrum diagram increased significantly, and the corresponding spectrum of the two VTEC disturbance time series was about 1.6 mHz. Generally, when the atmospheric wave was coupled with the ionosphere in the gravity-wave mode, its signal frequency was 0.1–2.9 mHz, and the center frequency of the two disturbances in Figure 10 was within the frequency range of gravity waves [14,16]. Therefore, it can be concluded that the gravity waves excited by the typhoon Maria were the main cause of the traveling ionospheric disturbances.
3.5. Discussion
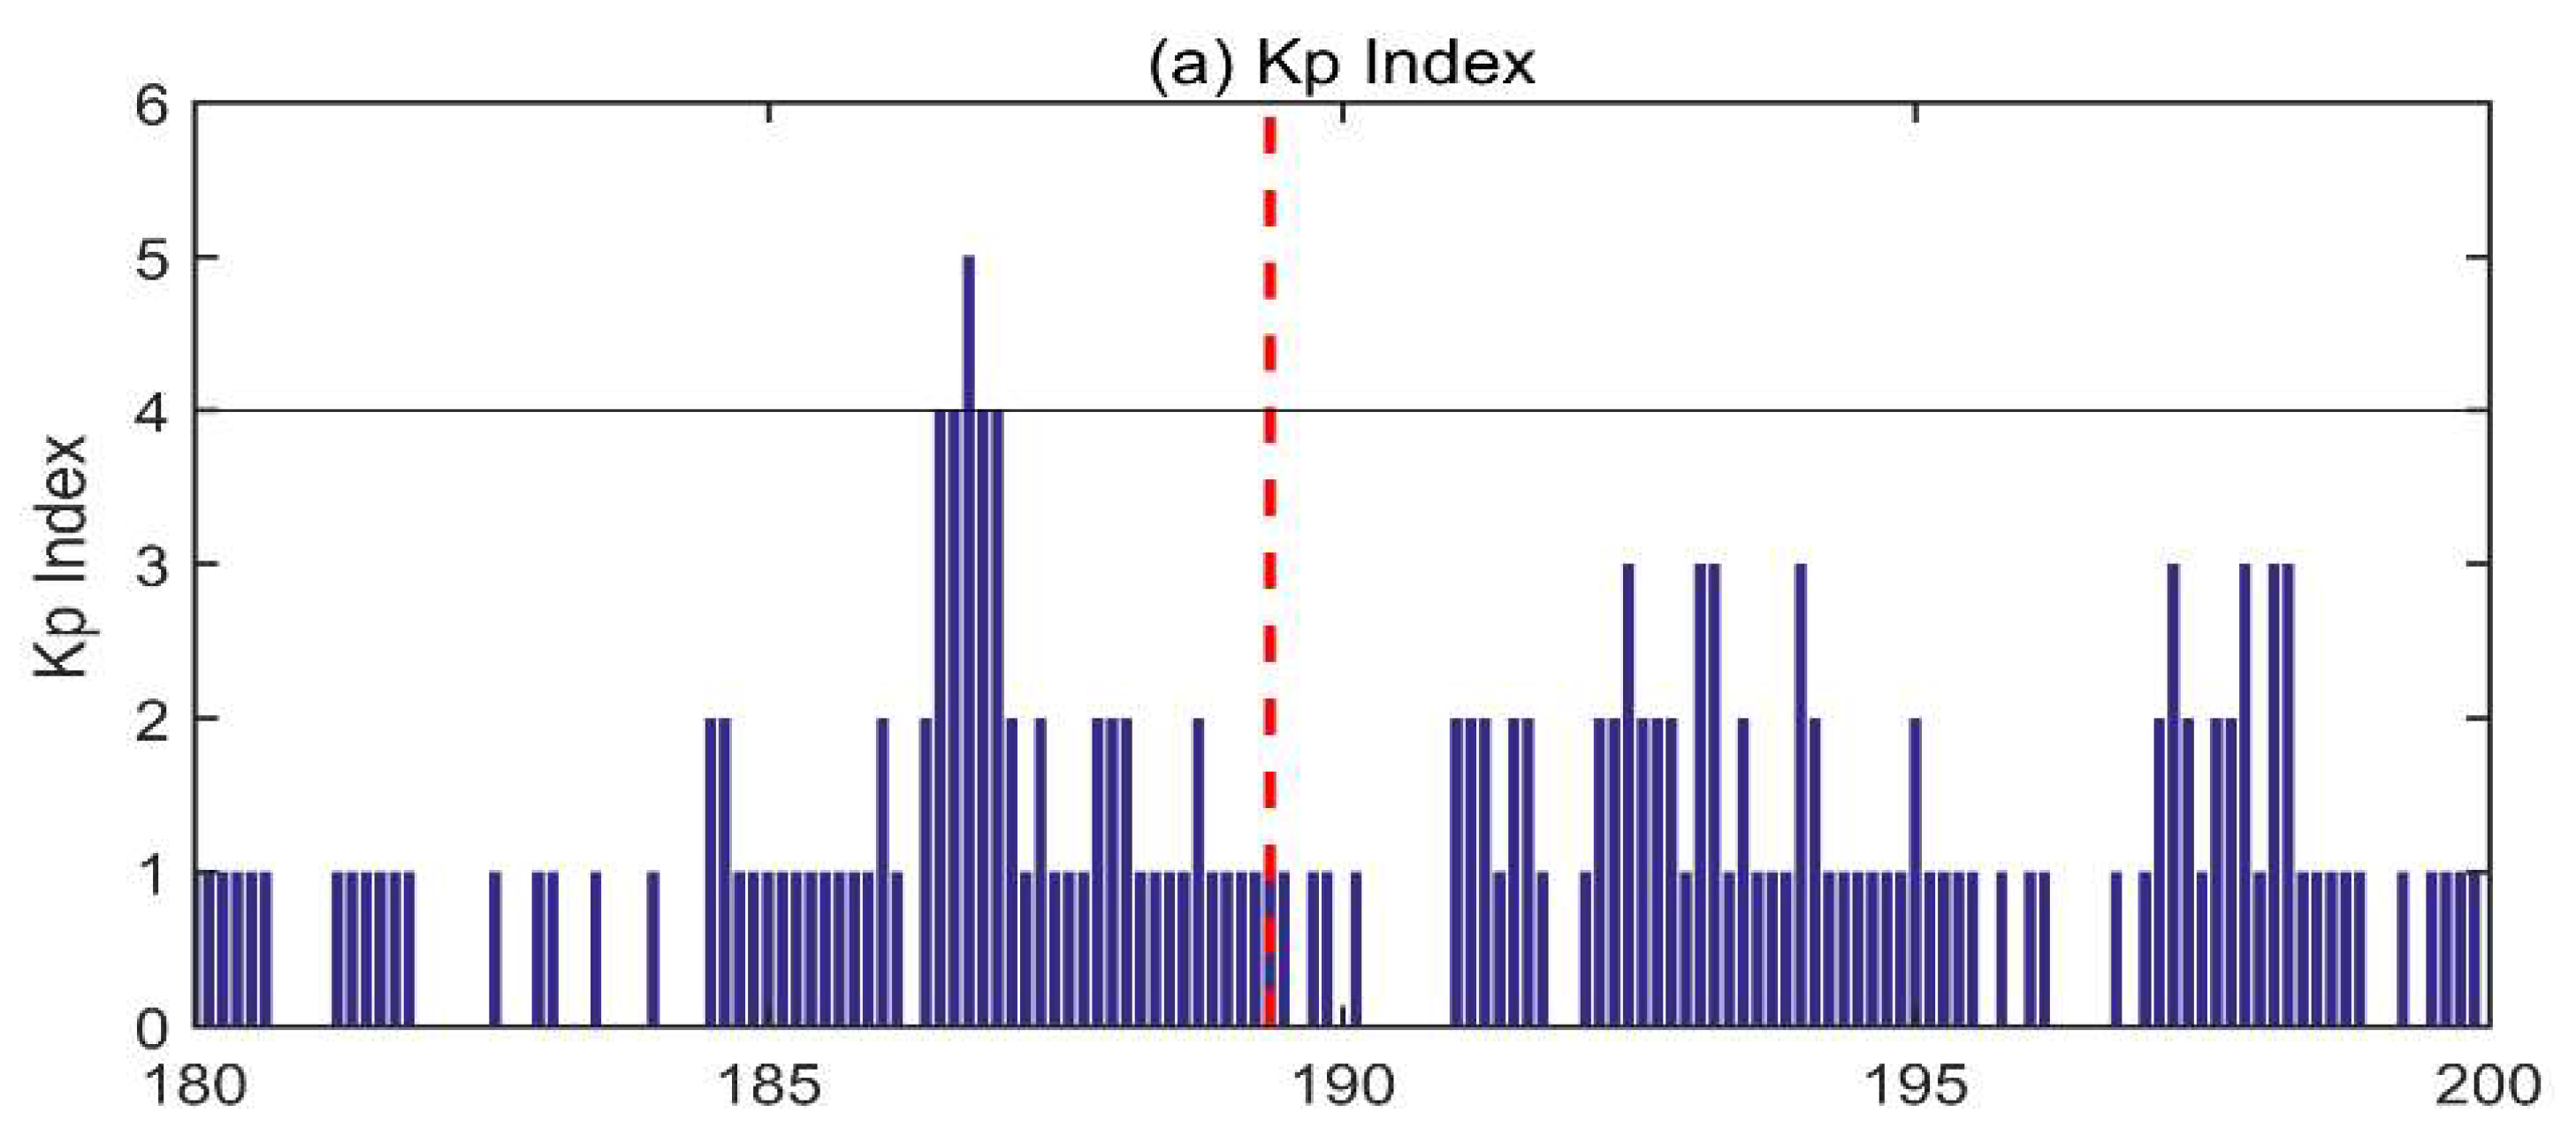
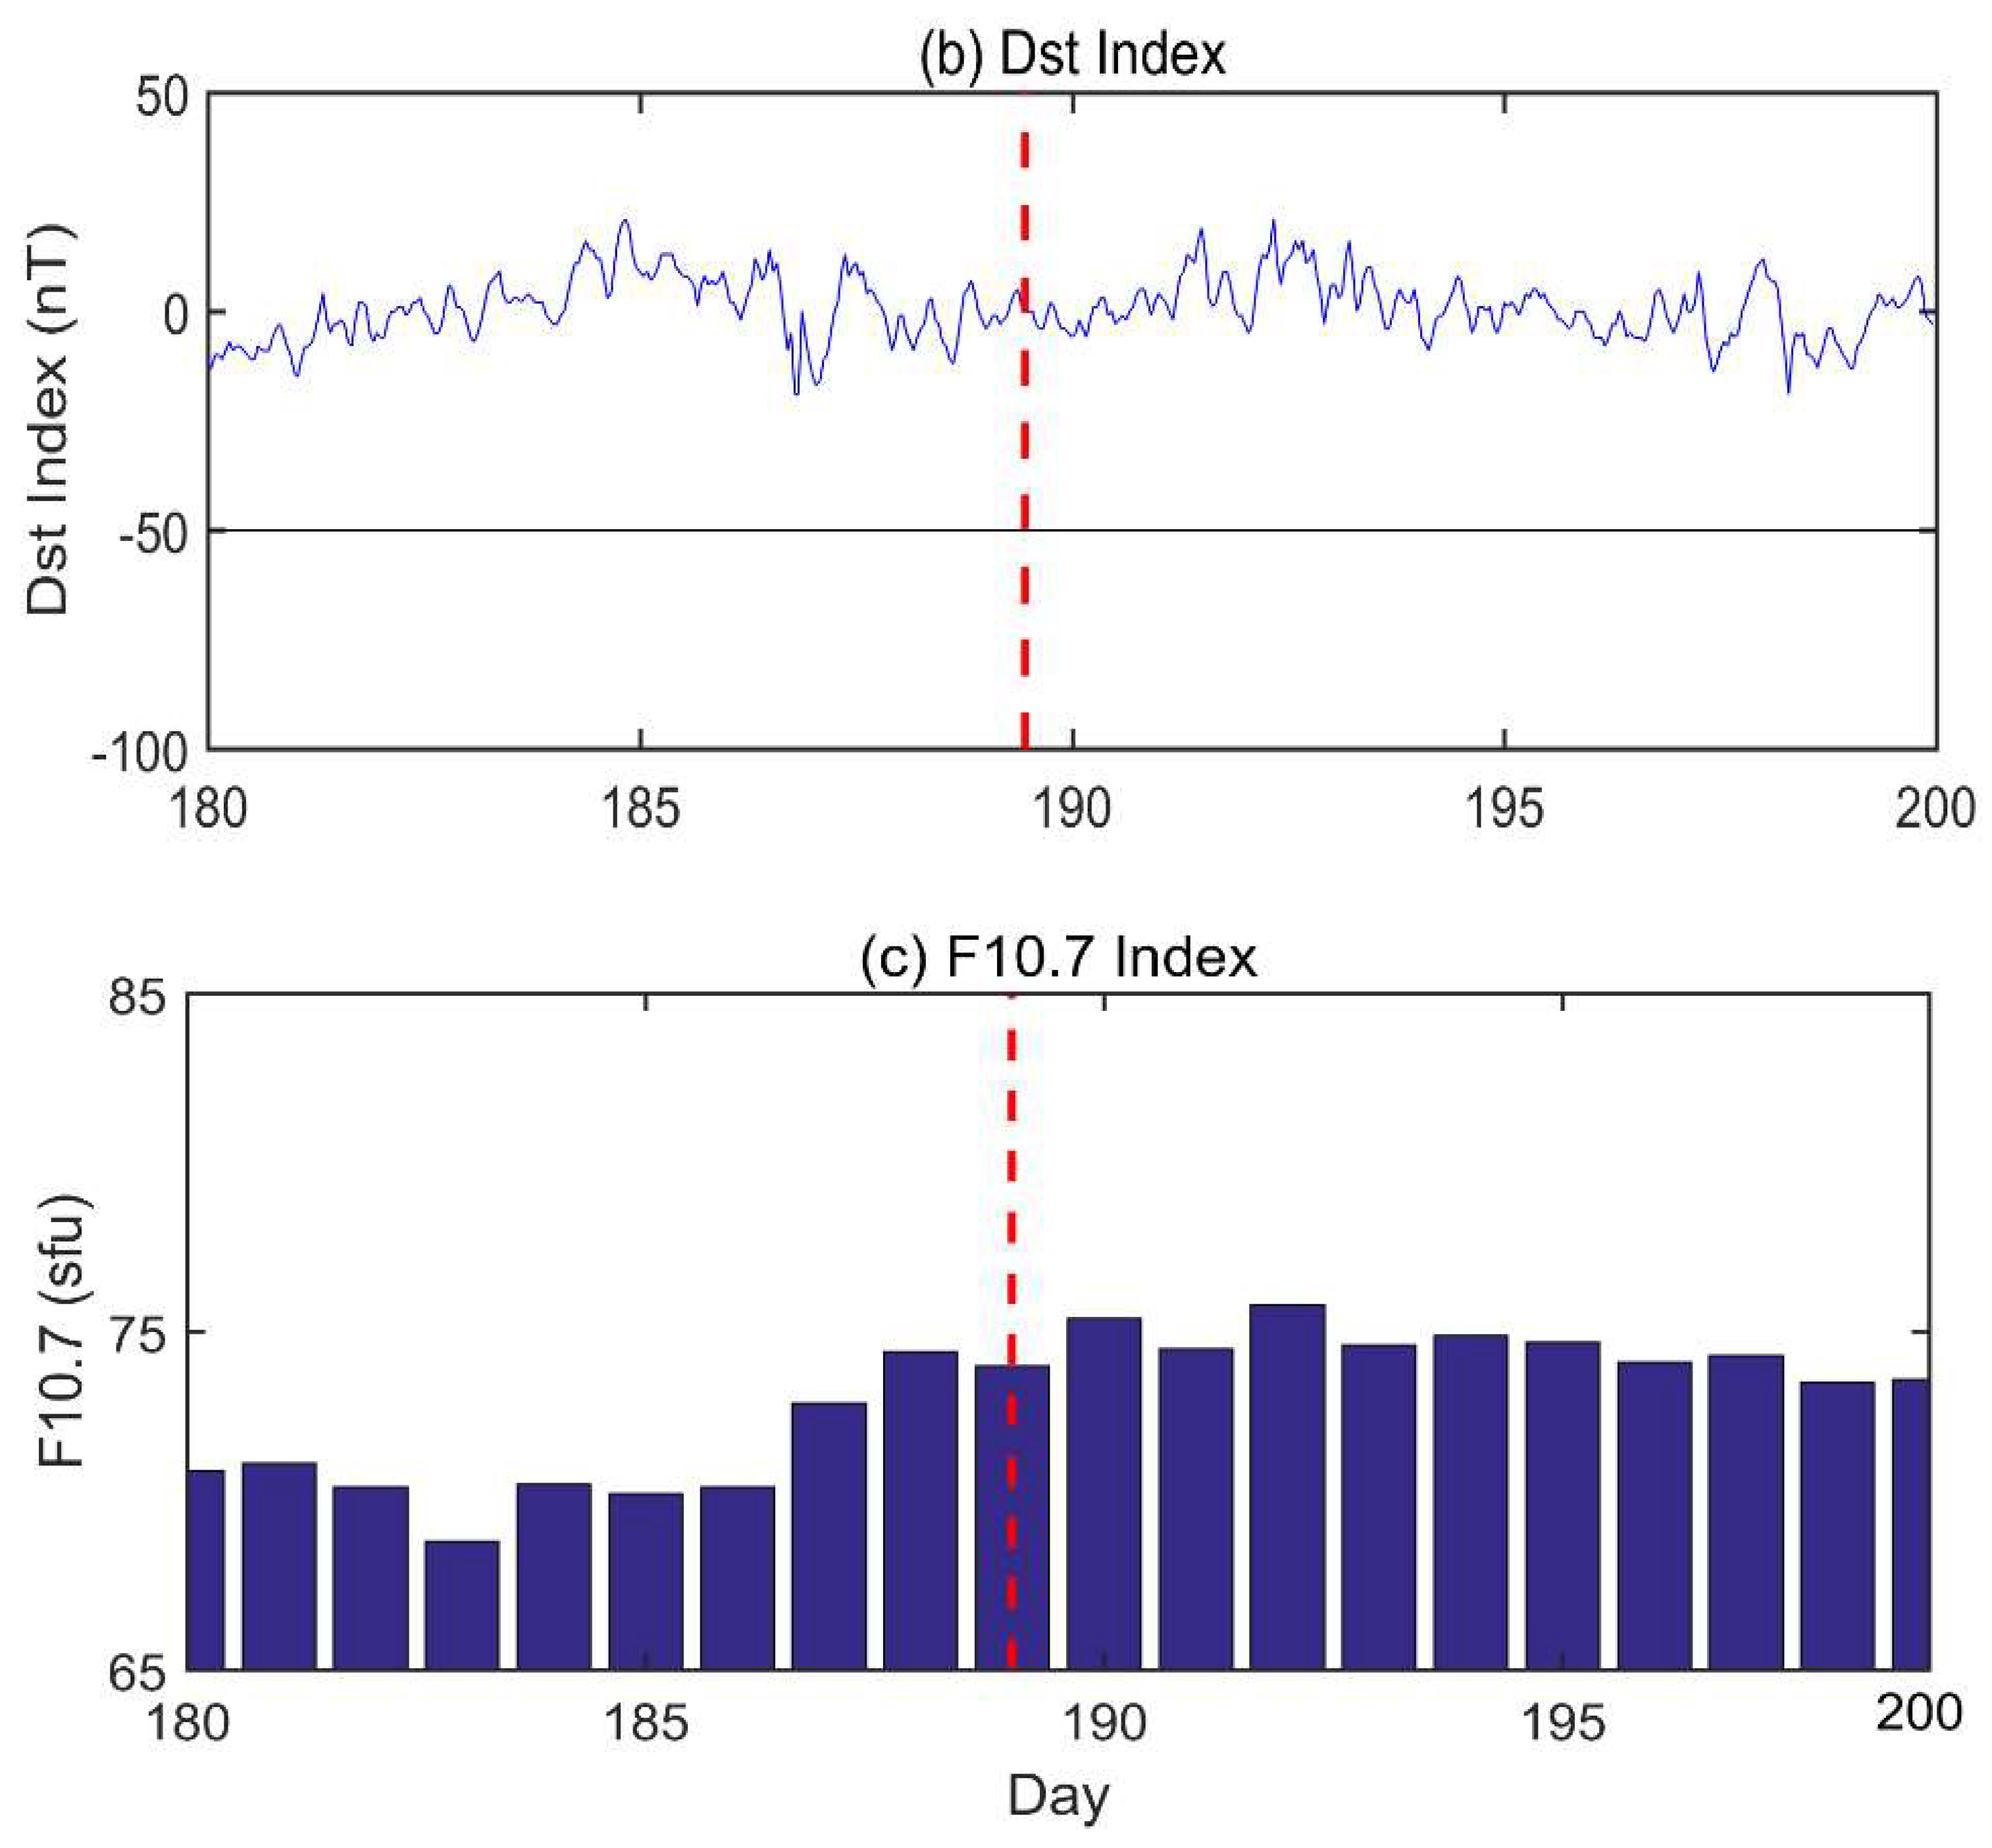
Solar and geomagnetic activity are the primary factors affecting ionospheric changes [22]. The Kp index and Dst index are used to describe the level of geomagnetic activity. The Kp index represents the global geomagnetic disturbance index, with a time resolution of 3 h. Generally, when the Kp index is less than four, the geomagnetic activity is considered as a quiet period. The Dst index indicates the degree of disturbance of the Earth’s surface magnetic field near the equator. The time resolution is 1 h, and it is generally believed that when the Dst index is higher than -50, geomagnetic activity is calm. The F10.7 cm solar irradiance is another indicator of solar activity. It is generally considered that when the F10.7 index is less than 100, the level of solar activity is low. The Kp index and Dst index were downloaded from http://isgi.unistra.fr/ and F10.7 index was downloaded from http://data.cma.cn/data/. Figure 11 shows the Kp index, Dst index, and F10.7 index for a total of 20 days before and after Typhoon Maria’s maximum wind speed. It can be seen that solar and geomagnetic activity during the typhoon activity were in a calm period, so these ionospheric disturbances were mainly caused by the typhoon.
4. Conclusions
In this paper, the traveling ionospheric disturbance following Severe Typhoon Maria passing through the eastern sea area of Taiwan are studied and analyzed using dense GPS observations in Taiwan. The spatial‒temporal ionospheric disturbance characteristics, propagation speed, azimuth changes, and spectrum analysis were investigated. The results show that under the conditions of calm solar and geomagnetic activity, two ionospheric disturbances were clearly observed during 10:00–12:00 UTC on 10 July 2018, in the southwest sector of the typhoon eye, propagating to the southeast with the periods of 10 and 12 min, respectively. The amplitude of the first ionospheric disturbance was slightly smaller than that of the second disturbance. Furthermore, the linear fitting of the time‒distance diagram shows that the two disturbances propagate at speeds of 118.09 and 186.17 m/s, respectively, which are in the range of the gravity-wave propagation speed. The analysis of the azimuth change of the disturbance confirms the directivity of the ionospheric disturbance propagation. The TEC disturbance anomalies were mainly located at 135–300° in the azimuth, namely the southwest side of the typhoon eye. The corresponding frequency spectrum of the two TEC disturbance time series was about 1.6mHz, which is consistent with the frequency of gravity waves and further confirms that these two traveling ionospheric disturbances were mainly caused by the gravity waves excited by the 2018 Typhoon Maria. In the future, more cases will be investigated to better understand the physical process and mechanism of ionospheric anomalies during typhoons.
Author Contributions
S.J. and Y.W. conceived and designed the experiments and Y.W. performed the experiments and analyzed the data. S.J. and Y.W. contributed to the writing of the paper. All authors have read and agreed to the published version of the manuscript.
Funding
This work was supported by the National Natural Science Foundation of China‒German Science Foundation (NSFC‒DFG) Project (Grant No. 41761134092) and the Jiangsu Province Distinguished Professor Project (Grant No. R2018T20).
Acknowledgments
The authors would like to thank the Central Meteorological Bureau (CWB), Taiwan, China for providing GPS data.
Conflicts of Interest
The authors declare no conflicts of interest.
References
- Kazimirovsky, E.; Herraiz, M.; Morena, B.A.D.L. Effects on the Ionosphere Due to Phenomena Occurring Below it. Surv. Geophys. 2003, 24, 139–184. [Google Scholar] [CrossRef]
- Rishbeth, H. F-region links with the lower atmosphere? J. Atmos. Solar Terr. Phys. 2006, 68, 469–478. [Google Scholar] [CrossRef]
- Afraimovich, E.L.; Voeykov, S.V.; Ishin, A.B.; Perevalova, N.P.; Ruzhin, Y.Y. Variations in the total electron content during the powerful typhoon of August 5–11, 2006, near the southeastern coast of China. Geomagn. Aeron. 2008, 48, 674–679. [Google Scholar] [CrossRef]
- Zakharov, V.I.; Kunitsyn, V.E. Regional features of atmospheric manifestations of tropical cyclones according to ground-based GPS network data. Geomagn. Aeron. 2012, 52, 533–545. [Google Scholar] [CrossRef]
- Bauer, S.J. An apparent ionospheric response to the passage of hurricanes. J. Geophys. Res. 1958, 63, 265–269. [Google Scholar] [CrossRef]
- Huang, Y.; Cheng, K.; Chen, S. On the detection of acoustic-gravity waves generated by typhoon by use of real time HF Doppler frequency shift sounding system. Radio Sci. 1985, 20, 897–906. [Google Scholar] [CrossRef]
- Sato, K.K. Small-Scale Wind Disturbances Observed by the MU Radar during the Passage of Typhoon Kelly. J. Atmos. Sci. 1993, 50, 518–537. [Google Scholar] [CrossRef] [Green Version]
- Rice, D.; Sojka, J.; Eccles, J.V.; Schunk, R.W. Typhoon Melor and ionospheric weather in the Asian sector: A case study. Radio Sci. 2012, 47, RS0L05. [Google Scholar] [CrossRef]
- Tao, Y.; Yungang, W.; Tian, M.; Jisheng, W. A case study of the variation of ionospheric parameter during typhoons at Xiamen. Acta Meteorol. Sin. 2010, 68, 569–576. [Google Scholar]
- Wang, J.S. Chronic or Permanent Coupling (CoP Coupling) between the lower and upper Martian atmospheres. Geophys. Res. Abs. 2005, 7, 05855. [Google Scholar]
- Song, Q.; Ding, F.; Zhang, X.; Liu, H.T.; Mao, T.; Zhao, X.K.; Wang, Y.G. Medium-scale traveling ionospheric disturbances induced by typhoon Chan-hom over China. J. Geophys. Res. Space Phys. 2019, 124, 2223–2237. [Google Scholar] [CrossRef]
- Song, Q.; Ding, F.; Zhang, X.; Mao, T. GPS detection of the ionospheric disturbances over China due to impacts of typhoon Rammasum and Matmo. J. Geophys. Res. 2016, 122, 1055–1063. [Google Scholar] [CrossRef]
- Kong, J.; Yao, Y.; Xu, Y.; Kuo, C.; Zhang, L.; Liu, L.; Zhai, C. A clear link connecting the troposphere and ionosphere: Ionospheric reponses to the 2015 Typhoon Dujuan. J. Geodesy 2017, 91, 1087–1097. [Google Scholar] [CrossRef]
- Chou, M.Y.; Lin, C.H.; Yue, J.; Tsai, H.; Sun, Y.; Liu, J.; Chen, C. Concentric traveling ionosphere disturbances triggered by Super Typhoon Meranti (2016). Geophys. Res. Lett. 2017, 44, 1219–1226. [Google Scholar] [CrossRef]
- Jin, S.G. Two-mode ionospheric disturbances following the 2005 Northern California offshore earthquake from GPS measurements. J. Geophys. Res.Space Phys. 2018, 123, 8587–8598. [Google Scholar] [CrossRef]
- Liu, Y.H.; Jin, S. Ionospheric Rayleigh wave disturbances following the 2018 Alaska earthquake from GPS observations. Remote Sens. 2019, 11, 901. [Google Scholar] [CrossRef] [Green Version]
- Yang, H.; Monte Moreno, E.; Hernández-Pajares, M. ADDTID: An alternative tool for studying earthquake / tsunami signatures in the ionosphere. Case of the 2011 Tohoku earthquake. Remote Sens. 2019, 11, 1894. [Google Scholar] [CrossRef] [Green Version]
- Jin, S.G.; Jin, R.; Li, J.H. Pattern and evolution of seismo-ionospheric disturbances following the 2011 Tohoku earthquakes from GPS observations. J. Geophys. Res. Space Phys. 2015, 119, 7914–7927. [Google Scholar] [CrossRef] [Green Version]
- Jin, S.G.; Jin, R.; Li, D. GPS detection of ionospheric Rayleigh wave and its source following the 2012 Haida Gwaii earthquake. J. Geophys. Res. 2017, 122, 1360–1372. [Google Scholar] [CrossRef]
- Cai, C.; Liu, Z.; Xia, P.; Dai, W. Cycle slip detection and repair for undifferenced GPS observations under high ionospheric activity. GPS Solut. 2013, 17, 247–260. [Google Scholar] [CrossRef]
- Cahyadi, M.N.; Heki, K. Coseismic ionospheric disturbance of the large strike-slip earthquakes in North Sumatra in 2012: Mw dependence of the disturbance amplitudes. Geophys. J. Int. 2015, 200, 116–129. [Google Scholar] [CrossRef] [Green Version]
- Jin, S.G.; Occhipinti, G.; Jin, R. GNSS ionospheric seismology: Recent observation evidences and characteristics. Earth Sci. Rev. 2015, 147, 54–64. [Google Scholar] [CrossRef]
Figure 1.
GPS receivers(triangles) and the track of Typhoon Maria(colorful circles).

Figure 2.
Total electron content (TEC) time series filtered by different cutoff frequencies observed by station DAJN and satellite PRN06 on 10 July 2018.
Figure 2.
Total electron content (TEC) time series filtered by different cutoff frequencies observed by station DAJN and satellite PRN06 on 10 July 2018.

Figure 3.
Sub-ionospheric point (SIP) trajectory observed over station PUS2 during the period of 10–12 UTC, 10 July 2018. The blue asterisk indicates the typhoon eye, the magenta square is the location of station PUS2, and the color bar shows the time of the typhoon change.
Figure 3.
Sub-ionospheric point (SIP) trajectory observed over station PUS2 during the period of 10–12 UTC, 10 July 2018. The blue asterisk indicates the typhoon eye, the magenta square is the location of station PUS2, and the color bar shows the time of the typhoon change.

Figure 4.
The change of the filtered TEC at 10:41 UTC (a), 10:46 UTC (b), 10:51 UTC (c), 11:12 UTC (d), 11:18 UTC (e) and 11:24 UTC (f). The W#1 and W#2 are shown in (a–c) and (d–f), respectively. The cross marker shows the typhoon eye, the color bar represents the amplitude of TEC changes, and the colored solid circle points show the position of SIP.


Figure 5.
The tracks of the SIP observed by satellite PRN02 at station FKD2 (a) and satellite PRN06 at station DAJN (b) during the period 10:00–12:00 UTC, the filtered TEC time series at stations FKD2 for PRN02 (c) and station DAJN for PRN06 (d), and the change of elevation angle and distance between the typhoon eyes and the SIP at FKD2 (e) and DAJN (f).

Figure 6.
The tracks of SIP at seven selected stations in the up panel and filtered TEC time series changes at selected stations in the bottom panel when the typhoon passed through the eastern sea area of Taiwan on 10 July 2018.
Figure 6.
The tracks of SIP at seven selected stations in the up panel and filtered TEC time series changes at selected stations in the bottom panel when the typhoon passed through the eastern sea area of Taiwan on 10 July 2018.

Figure 7.
A graph of filtered TEC with the time. The dashed black line indicates the fitted perturbation propagation speed, and the colored bars indicates the magnitude of the VTEC disturbance.
Figure 7.
A graph of filtered TEC with the time. The dashed black line indicates the fitted perturbation propagation speed, and the colored bars indicates the magnitude of the VTEC disturbance.

Figure 8.
Detailed features of the ionospheric disturbances detected by PRN06 when Typhoon Maria passed the eastern sea area of Taiwan on 10 July 2018. The top panel shows the SIP tracks of all stations from 10:00–12:00 UTC. The middle panel shows a graph of the average filtered TEC and distance, and the bottom panel shows a graph of the filtered TEC time series with the time.

Figure 9.
Change of filtered TEC with the azimuth and the distance between the typhoon eye and the SIP.
Figure 9.
Change of filtered TEC with the azimuth and the distance between the typhoon eye and the SIP.

Figure 10.
TEC disturbance time series in blue and the distance between SIPs and Typhoon eye in green for station FKD2 and PRN02 satellite (a) and for station DAJN and PRN06 satellite (c), and Spectrum diagrams of TEC disturbance time series for station FKD2 and PRN02 satellite (b) and for station DAJN (d) and PRN06 satellite (d).

Figure 11.
The Kp index (a), Dst index (b) and F10.7 index (c) from June 29 to July 18 (DOY 180-200), 2018.
Figure 11.
The Kp index (a), Dst index (b) and F10.7 index (c) from June 29 to July 18 (DOY 180-200), 2018.


© 2020 by the authors. Licensee MDPI, Basel, Switzerland. This article is an open access article distributed under the terms and conditions of the Creative Commons Attribution (CC BY) license (http://creativecommons.org/licenses/by/4.0/).
Share and Cite
MDPI and ACS Style
Wen, Y.; Jin, S. Traveling Ionospheric Disturbances Characteristics during the 2018 Typhoon Maria from GPS Observations. Remote Sens. 2020, 12, 746. https://0-doi-org.brum.beds.ac.uk/10.3390/rs12040746
AMA Style
Wen Y, Jin S. Traveling Ionospheric Disturbances Characteristics during the 2018 Typhoon Maria from GPS Observations. Remote Sensing. 2020; 12(4):746. https://0-doi-org.brum.beds.ac.uk/10.3390/rs12040746
Chicago/Turabian StyleWen, Yiduo, and Shuanggen Jin. 2020. "Traveling Ionospheric Disturbances Characteristics during the 2018 Typhoon Maria from GPS Observations" Remote Sensing 12, no. 4: 746. https://0-doi-org.brum.beds.ac.uk/10.3390/rs12040746
Note that from the first issue of 2016, this journal uses article numbers instead of page numbers. See further details here.