Review

Raman Spectroscopy from Laboratory and Proximal to Remote Sensing: A Tool for the Volcanological Sciences

by
Daniele Giordano
1,2,3,*,
James K. Russell
4,
Diego González-García
1,
Danilo Bersani
5,
Donald B. Dingwell
3 and
Ciro Del Negro
6
1
Dipartimento di Scienze della Terra, Università degli Studi di Torino, Via Valperga Caluso 35, 10125 Turin, Italy
2
Instituto di Geoscienze e Georisorse, (IGG), Centro Nazionale delle Ricerche (CNR), Area della Ricerca di Pisa San Cataldo, 56124 Pisa, Italy
3
Department für Geo- und Umweltwischenchaften, Ludwig-Maximiliams Universtät München, Theresienstrasse 41, 80333 Munich, Germany
4
Department of Earth, Ocean and Atmospheric Sciences, University of British Columbia, Vancouver, BC V6T 1Z4, Canada
5
Dipartimento di Scienze Matematiche, Fisiche e Informatiche, Università di Parma, Parco Area delle Scienze 7/A, 43124 Parma, Italy
6
Istituto Nazionale di Geofisica e Vulcanologia, Osservatorio Etneo, 95125 Catania, Italy
*
Author to whom correspondence should be addressed.
Submission received: 14 February 2020 / Accepted: 26 February 2020 / Published: 2 March 2020

Abstract

:
Here we explore and review some of the latest ideas and applications of Raman spectroscopy to the volcanological sciences. Firstly, we provide a brief overview of how Raman spectral analysis works and how spectra from silicate glasses are interpreted. We then look at specific applications of Raman spectral analysis to the volcanological sciences based on measurements on and studies of natural materials in the laboratory. We conclude by examining the potential for Raman spectral analysis to be used as a field based aid to volcano monitoring via in situ studies of proximal deposits and; perhaps; in remote sensing campaigns

1. Introduction

One of the central goals of modern volcanology is to understand the physics and chemistry of processes that operate during transport, storage and eruption of magmas. These endeavors include both forensic reconstructions of pre-historic volcanic eruptions and real-time analysis of active volcanic systems. From the microscopic to the macroscopic scale, magmatic and volcanic processes are primarily governed by the physical and chemical properties of the melt. These properties of the melt are, themselves, highly transient because of cooling, differentiation, assimilation, mixing, and volatile exsolution that commonly attend transport and eruption.
Volcanic glasses are particularly informative in that they represent the quenched melt fractions of magmas at the time of eruption. These natural glasses can be investigated in the laboratory to track the transient evolution of volcanic systems. Lab-based tools and techniques, for example, can be used to estimate the compositions and thermochemical properties of volcanic glasses and, thus, can inform on pre- and syn-eruptive magma conditions. Such data can contribute to long and short-term hazard planning at active volcanic centers.
Raman spectroscopy is a lab-based tool that is ideal for laboratory and field analysis of natural volcanic glasses. In volcanology, Raman spectroscopic analysis of natural glasses is emerging as a powerful and critical tool for recovering the physical and chemical properties of the melts during volcanic eruptions or in ancient preserved deposits. Specifically, Raman spectra collected from silicate glasses are sensitive recorders of melt structure and inform on mechanisms of polymerization. However, these same spectra can be used to estimate the chemical composition of the melt and to constrain the melt physical properties, including viscosity, melt fragility, and the heat capacity near the glass transition (Tg) as well as to monitor the “time - Temperature (t - T)” windows for processes such as the onset of crystallization or volatile-exsolution. Mapping these t-T windows for different melt compositions is critical for understanding and predicting lava flow behaviour and, in particular, the stoppage of lava advances [1,2,3,4].
The relative ease and micrometer-scale spatial resolution of Raman spectroscopic analysis allow for both in-situ and ex-situ lab and proximal field-based measurements and even, potentially, remote analysis. These attributes suggest many diverse applications in the earth, planetary and material sciences [5,6].

2. Raman Basics

There are a number of excellent reviews and research papers that discuss the general use of vibrational spectroscopy on silicate glasses and melts and the reader is referred to these for a more complete description of the physico-chemical principles behind these spectroscopic techniques as applied to those systems [7,8,9,10,11,12]. Briefly, atoms bonded in molecular systems vibrate at frequencies between 1012 and 1014 Hz. The interatomic forces between bonded atoms control the exact frequency of the vibrations, in much the same way as a spring connecting two vibrating masses. Atoms, molecules or more complex structures (e.g., rings of tetrahedra or polymers) commonly vibrate through pure stretching and bending modes or composition of them. Figure A1 (Appendix) represents, schematically, a summary of the main types of vibrational modes. Pairs of atoms or molecular groupings will have a number of fundamental vibrational frequencies.
Raman scattering relies on inelastic scattering of photons, in which incident photons loose (Stokes) or gain (Anti-Stokes) energy in the scattering process. In Raman spectroscopy, a sample is illuminated with monochromatic light, and given that Raman scattering is a weak effect, this requires an intense source like a laser. Part of the incident beam is absorbed by transitions equivalent to the incident frequency, but most of the light (107 events over 1) is transmitted or scattered by the Rayleigh effect, i.e., without loss of energy. A small fraction of the incident light during the scattering process interacts with vibrational modes turning on or off one of them (Raman effect). The Raman scattered light may lose (Stokes effect) or gain (anti-Stokes effect) a small amount of energy corresponding to the energy of the vibrational modes. The Stokes effect is the most probable and it is the one commonly analysed. The Raman scattered light is collected and analyzed by a spectrometer and the spectrum is plotted as intensity vs the energy shift (cm−1). The position of the Raman peaks is then proportional to the vibrational frequencies of the analyzed material.

3. Raman Spectral Analysis of Natural Glasses

The versatile, non-destructive character of Raman spectroscopy allows for effective and rapid (from a few seconds to few minutes) characterization of a wide variety of geologic materials, including organic materials, minerals, silicate melts and glasses [13,14,15,16]. Raman spectroscopy can be performed on samples with little to no preparation, and small volumes of material. Confocal Raman spectroscopy imaging can work with a horizontal resolution down to 1–2 µm2 which allows for detailed (micro-scale) mapping of compositional or structural variations in glassy samples [10,17,18]. Relative to infrared (IR) spectroscopy, Raman spectroscopy allows for a better selection of peaks that are narrower thereby allowing discrimination of different species within a single spectrum (i.e., less or no overlapping bands). Raman can also detect IR-inactive vibrational modes as well as FTIR can detect Raman-inactive vibrations. Compared with electron microscopy (EM) and X-ray diffraction (XRD), sample preparation and measuring environment do not need particular care and do not need vacuum, heating/cooling/relative humidity controlled stages. A Raman workbench is much more compact than those of XRD or EM techniques. Compared to EM, Raman allows to measure multi-layer materials and compared to XRD, Raman permits the measurement of both crystalline and amorphous materials.
For anhydrous glasses and melts, Raman spectra are correlated to their structural properties, themselves a reflection of chemical composition (Figure 1). Differences in the Raman spectra collected in the range of 180–1300 cm−1 on silicate glasses depend on both structural and compositional aspects of the glasses. These differences reflect the variable contribution of network forming cations and network modifying cations, which eventually determine the arrangement of bridging oxygens (BO) and non-bridging oxygens (NBO) of the silicate network. Above the so-called boson region (10–250 cm−1) [11], iron-bearing alumino-silicate glasses typically exhibit two main broad and asymmetric bands (referred to as Low-Wavenumber (LW) and High-Wavenumber (HW), respectively), the first between 200 and 700 cm−1, centered at about 490 cm−1, and the second between 800 and 1300 cm−1 with center at about 960 cm−1. The LW band is correlated mainly to bending vibrations of Si-O-Si bonds, and in consequence, to the tetrahedral chains, while the HW bands depends on the stretching vibrations of Si-O units. A third, weaker band is observed, at intermediate wavenumbers (650–850 cm−1; here following reported as medium wavenumber [MW]), with a center, that, as a function of composition varies from ca 680 to about 810 cm−1 (Figure 1 [2], where the lowest peak wavenumber values are associated to the most depolymerized melts. Several others secondary peaks are observed as a function of the investigated glass compositions and the presence of mineral phases. A short summary of the main characteristics of the LW, MW and HW vibrational bands, their position and the relationships with the main kinds of vibration modes associated to them for silicate melts is presented in the Appendix A.2 (Table A1).
Importantly to the Earth Sciences, Raman spectroscopic analysis can also be used to estimate the species and abundances of volatile components dissolved and preserved in natural and experimental glasses or in exsolved fluids preserved as fluid inclusions within glasses and crystals. Raman detection limits for volatile components are in the order of a few ppm allowing for very low volatile contents to be measured even in in nominally anhydrous minerals. For volatile bearing glasses and melts, stretching (translational) vibrations are observed at higher frequencies such as 2331 for N2 [19]; 4125 for H2 [20], 990 cm−1 for SO42− [21,22]), 1062–1092 cm−1 for CO2 and CO32− [23,24]). Stretching vibrations of water in both the molecular and hydroxyl form can be observed between 3000 and 4000 cm−1 approximately centered at 3550 cm−1 for hydrous glasses [8,14,16,25,26,27,28,29].

4. Volcanological Applications

Over the last decade, Raman spectroscopy has had a rapidly expanding number of applications in the Earth Sciences [30,31]. The ability of Raman spectroscopy to differentiate phases (e.g., glass or liquid versus crystalline material), to estimate compositions of silicate glasses and to characterize structural properties of glasses has tremendous import for the volcanological sciences.
Here, we introduce three state-of-the-art applications of Raman spectroscopic analysis to the volcanological sciences. These include: (a) estimation of melt composition, including the Fe-redox state, directly from Raman spectra of glasses, (b) estimation of volatile contents in experimental and natural (e.g., volcanic products; glass inclusions) silicate glasses, and (c) prediction of chemical proxies of melt structure (e.g., Non-Bridging Oxygens over Tetrahedra, NBO/T; and Structural Modifiers parameter, SM) from Raman spectra as a means to connect to melt transport properties (e.g., viscosity). Raman spectroscopy is also an excellent tool for detection of crystalline phases at the nano-scale, which are invisible with standard techniques (EPMA, SEM, XRD). Below we explain each of these applications and explore their implications and consequences for volcanological research.

4.1. Estimating Composition and Redox State of Silicate Glasses and Melts

Raman spectra of glasses show few characteristic large bands whose shape depends on several contributors. Separating the effects of each factor can be a complicated process requiring the use of different models (e.g., baseline corrections) and techniques. This is in sharp contrast to crystalline materials, whose spectra show many distinctive peaks making for a relatively straight interpretation. Raman spectra for glasses, on the other hand, are generally devoid of well-defined and well-separated spectral bands, except in the case of those glass compositions with dissolved volatiles (e.g., CO2, SO2, H2O).
Methods for estimating qualitatively or quantitatively the composition of silicate glasses and melt commonly rely on calibration strategies based on: (a) the estimation of the intensity of the heights of peaks and bands; (b) the integrated area of specific band envelopes or (c) the position of peaks bands or their normalized counterparts [2,14,15,32,33,34]. The various models adopt different protocols for spectral correction (e.g., [35]), baseline subtraction, or analysis of vibrational features. These models provide a rapid and inexpensive means of reliably estimating the elemental or oxide composition of natural glasses in the laboratory, in the field, and, potentially on other terrestrial planets and moons.
Previous authors [16,29,33,36,37,38], investigating the effect of iron on the vibrational response of glasses, demonstrated that both iron content and its redox state strongly influence the Raman spectra. These authors showed that the ratio Fe3+/Fetot could be calculated by using different treatments of the spectra involving baseline fitting and/or deconvolution in Gaussian components associated to Qn-species (Qn distinguishes silicon atoms according to the number n of coordinated bridging oxygens (BO), i.e., Q4 stands for silicon coordinated by four BO, Q3 corresponds to three BO and one nonbridging oxygen (NBO), etc.) [9].
Di Muro and coauthors [33] demonstrated that several calibrations can be obtained for the determination of the Fe3+/Fetot ratio in glasses by exploiting the sensitivity of the HW envelope (at ca 1000 cm−1) to iron redox state. The spectral analysis of Di Muro and coauthors [33] was performed on glasses of peralkaline rhyolite (i.e., SiO2-rich, iron-rich rhyolite) and basaltic (SiO2-poor, iron-rich) compositions. Their analyses were performed by measuring the ratios of the band heights; the integrated areas of specific lines as well as the position of HW bands (e.g., band IV for rhyolites and band III for basalts, Figure A2) obtained on fully characterized reference glasses. They observed that the Fe3+/Fetot ratio is highly dependent on composition and composition has shown to control the direction of redox change [39]. Peralkaline glasses are excellent systems to accurately characterize the redox state of iron, as consequence of the high sensitivity of Raman spectra to network former cations (Si, Al and Fe3+). The sensitivity decreases significantly for basaltic compositions, such as Stromboli and Etna trachybasalts but continued work may overcome this challenge.
More recently, Di Genova and coauthors [39,40] carried out similar investigations on peralkaline rhyolites from Pantelleria Island (i.e., Pantellerites) and synthetic basaltic glasses having compositions resembling some Martian rocks. They provided a refined quantitative method for estimating Fe3+/Fetot ratios based on the main peaks composing the HW band (at 970–1040 cm−1 for pantellerites; 950–970 cm−1 for Martian basalts). The method uses an empirical formula [40] to parametrize the spectra as function of a Raman parameter (Rp). A Raman spectrum of a glass of any unknown composition can be approximated by combining spectra from two end-members, one for the most oxidized (IOX) material and the other, the most reduced (IRED) sample, according to the equation:
I N = I O X * R p + I R E D * ( 1 R p )
Their model allows calculation of Fe3+/Fetot ratios from Raman spectra based on the following equation:
Fe 3 + Fe tot = a + c R p 1 + b R p
where a, b and c are fit parameters that are particular to each family of glass compositions (e.g., basalt, rhyolite) [39].
The same method proposed by [39] can be used to approximate, on a weight percent basis (wt%), the composition (y) of each oxide concentration in wt. %. After calculation of Rp for a given spectrum by combination of two known endmembers (i.e., using an ideal mixing equation), oxide concentrations can be calculated through a simple 2nd or 4th order polynomial equations such as:
y = a R p 2 + b R p + c
y = a R p 4 + b R p 3 + c R p 2 + d R p + e
where a, b and c are adjustable parameters.
The broad shape of the main bands of the Raman spectra of glasses presents a challenge for using Raman spectroscopy to estimate the composition of multicomponent glasses. These broad bands are more or less sensitive to chemical variability and, thus, it is a complicated process to attribute individual vibrational modes to specific cations or molecules within the silicate glass/melt network. At present, there are no models for predicting the glass composition of natural multi-components silicates from the corresponding Raman spectra more accurately than those proposed by Di Genova et al. [34,35]. Furthermore, their approach was optimized to predict compositions falling between two end-members which, themselves were aligned along a linear mixing trend. Recent work by González-García and co-authors [41], however, represents a new approach to constructing a general model for retrieval of bulk chemical composition of glasses from their Raman spectra.

4.2. Predicting Dissolved Volatile Contents in Silicate Glasses and Melts

Volatile contents in natural melts and glasses can reach levels of several wt.%. Establishing the concentration of the main dissolved and exsolved volatile phases in a magmatic system and in the erupted volcanic products is of critical importance to define the pre-eruptive conditions and the eruption dynamics and validate existing models used to simulate eruptive events. Raman, commonly used in association with FTIR (Fourier Transform Infrared), is an ideal tool for measuring residual water contents in glassy volcanic materials, including crystal-hosted melt and fluid inclusions. The Raman spectra of hydrous glasses contain two spectral regions of interest between 200 and 1700 cm−1 corresponding to Si-O stretching vibration and H-O-H bending vibrations. The peak between 2800 and 3800 cm−1, centered near 3500–3650 cm−1, correspond to OH vibrations [42] (Table A1). The band 2800–3800 cm−1 is complex to interpret due to the individual contribution of different H2O vibrational modes.
Previous authors have used Raman to quantify the H2O in silicate glasses of wide compositional ranges [13,14,15,16,26,27,28,29,43,44,45], and CO2 [24,46,47]. Two main strategies are commonly employed to retrieve the H2O contents of glasses: (1) the internal normalization of the H2OT band (i.e., the H2O-OH stretching band) whereby the integrated intensity of the 2800–3800 cm−1 region is ratioed with the 490 cm−1 (the T-O-T stretching band, [13,25,42]) or the 850 and 1250 cm−1 (T-O stretching band, [26,27,45]) regions in spectra of silicate glasses [14,15] and (2) the external calibration procedure which directly consider the water bands and compare with well characterized glass standards [13,43]. In this second case H2O concentrations are calculated on the basis that the integral of the H2O-OH stretching band between 2800 and 3800 cm−1 which shows a linear dependence on the total dissolved water and is independent on glass composition [11,44].
The recent models of Mercier et al. [14,15], Le Losq et al. [44]) and Schiavi et al. [29] are amongst the most promising methods for predicting the H2O content dissolved in glasses. The model of Di Genova et al. [16] is adequate but is based only on a small dataset of hydrous glass compositions. Nonetheless, defining which model is more promising is complex as, so far, there is still a lack of a standardization in the procedures which would allow to compare the results obtained by different studies. In most cases, in fact, comparison with other studies may not be possible, however, as the protocols to estimate H2O content are substantially different and commonly the data are not easily available. Given the considerable amount of new data so far available, we believe that standardization procedures could be easily attainable by the construction of database sharing facilities together with the establishment of the best specific protocols and the comparison of the results obtained. In addition, samples produced by different laboratories should be shared in order to optimize interlaboratory calibration as done by Giordano et al. [2] and create networks of laboratories devoted to face and solve specific scientific issues.

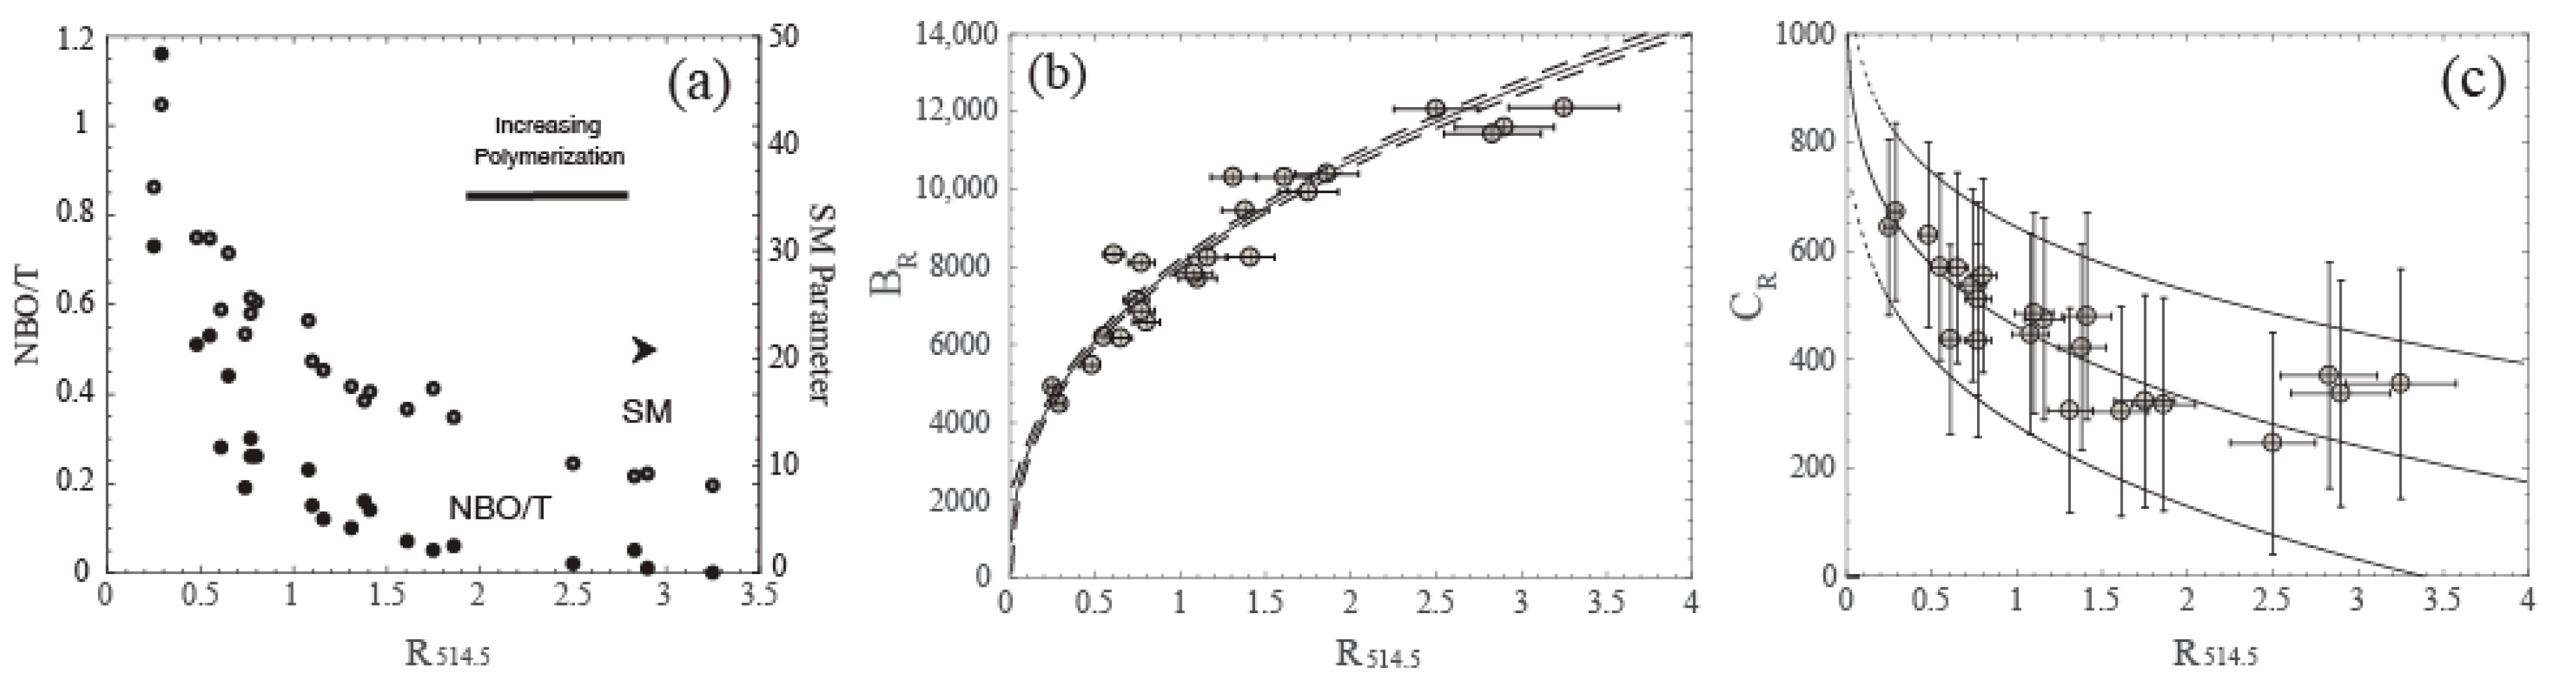
4.3. Toward a Structural Viscosity Model for Silicate Melts

More recently, Le Losq and Neuville [48], Giordano and Russell [34]) and Giordano et al. [2] showed that the viscosity of simple and multicomponent anhydrous silicate melts over a temperature interval of ~700 to 1600 °C, can be predicted from the Raman spectra obtained from the corresponding glasses (i.e., fast quenched melts) in the range between 100 and 1500 cm−1. These methods proved to be very promising for in situ rheological investigations and may find substantial application in planetary sciences studies [34,48]. In particular, Le Losq and Neuville [48] developed a model to predict viscosity of the simple SiO2-Na2O-K2O system through the comparison of viscosity data and the Qn-species abundance retrieved from analysis of Raman spectra of the glasses. Giordano and Russell [34] and Giordano et al. [2], following the intuition of Mercier et al. [14,15]), presented a first order model predicting the viscosity of multicomponent natural melts on the basis of the dependence of the characteristic viscosity descriptive parameters (BVFT, CVFT) on the Raman spectral data collected from the corresponding glasses (Figure 2).
The authors defined a Raman ratio (R) as the ratio between the low frequency band (LW) and the high frequency band (HW) which they normalized (Rn) to the Raman ratio obtained on a reference glass, one amongst those with high R values. They showed that strong relationships exist between constitutive parameters used to describe the viscosity and the normalized Raman ratios which allows the viscosity of anhydrous multicomponent natural melts to be predicted with a great accuracy. Although the model requires expansion to use of the structural information of volatile-bearing melts, it allows accurate description of the viscosity of anhydrous melts by the employment of a simple equation with 6 adjustable parameters and the measured R (details in [2,34]). Also, the SM and NBO/T parameters, calculated from compositions, are shown to be strongly correlated with R.

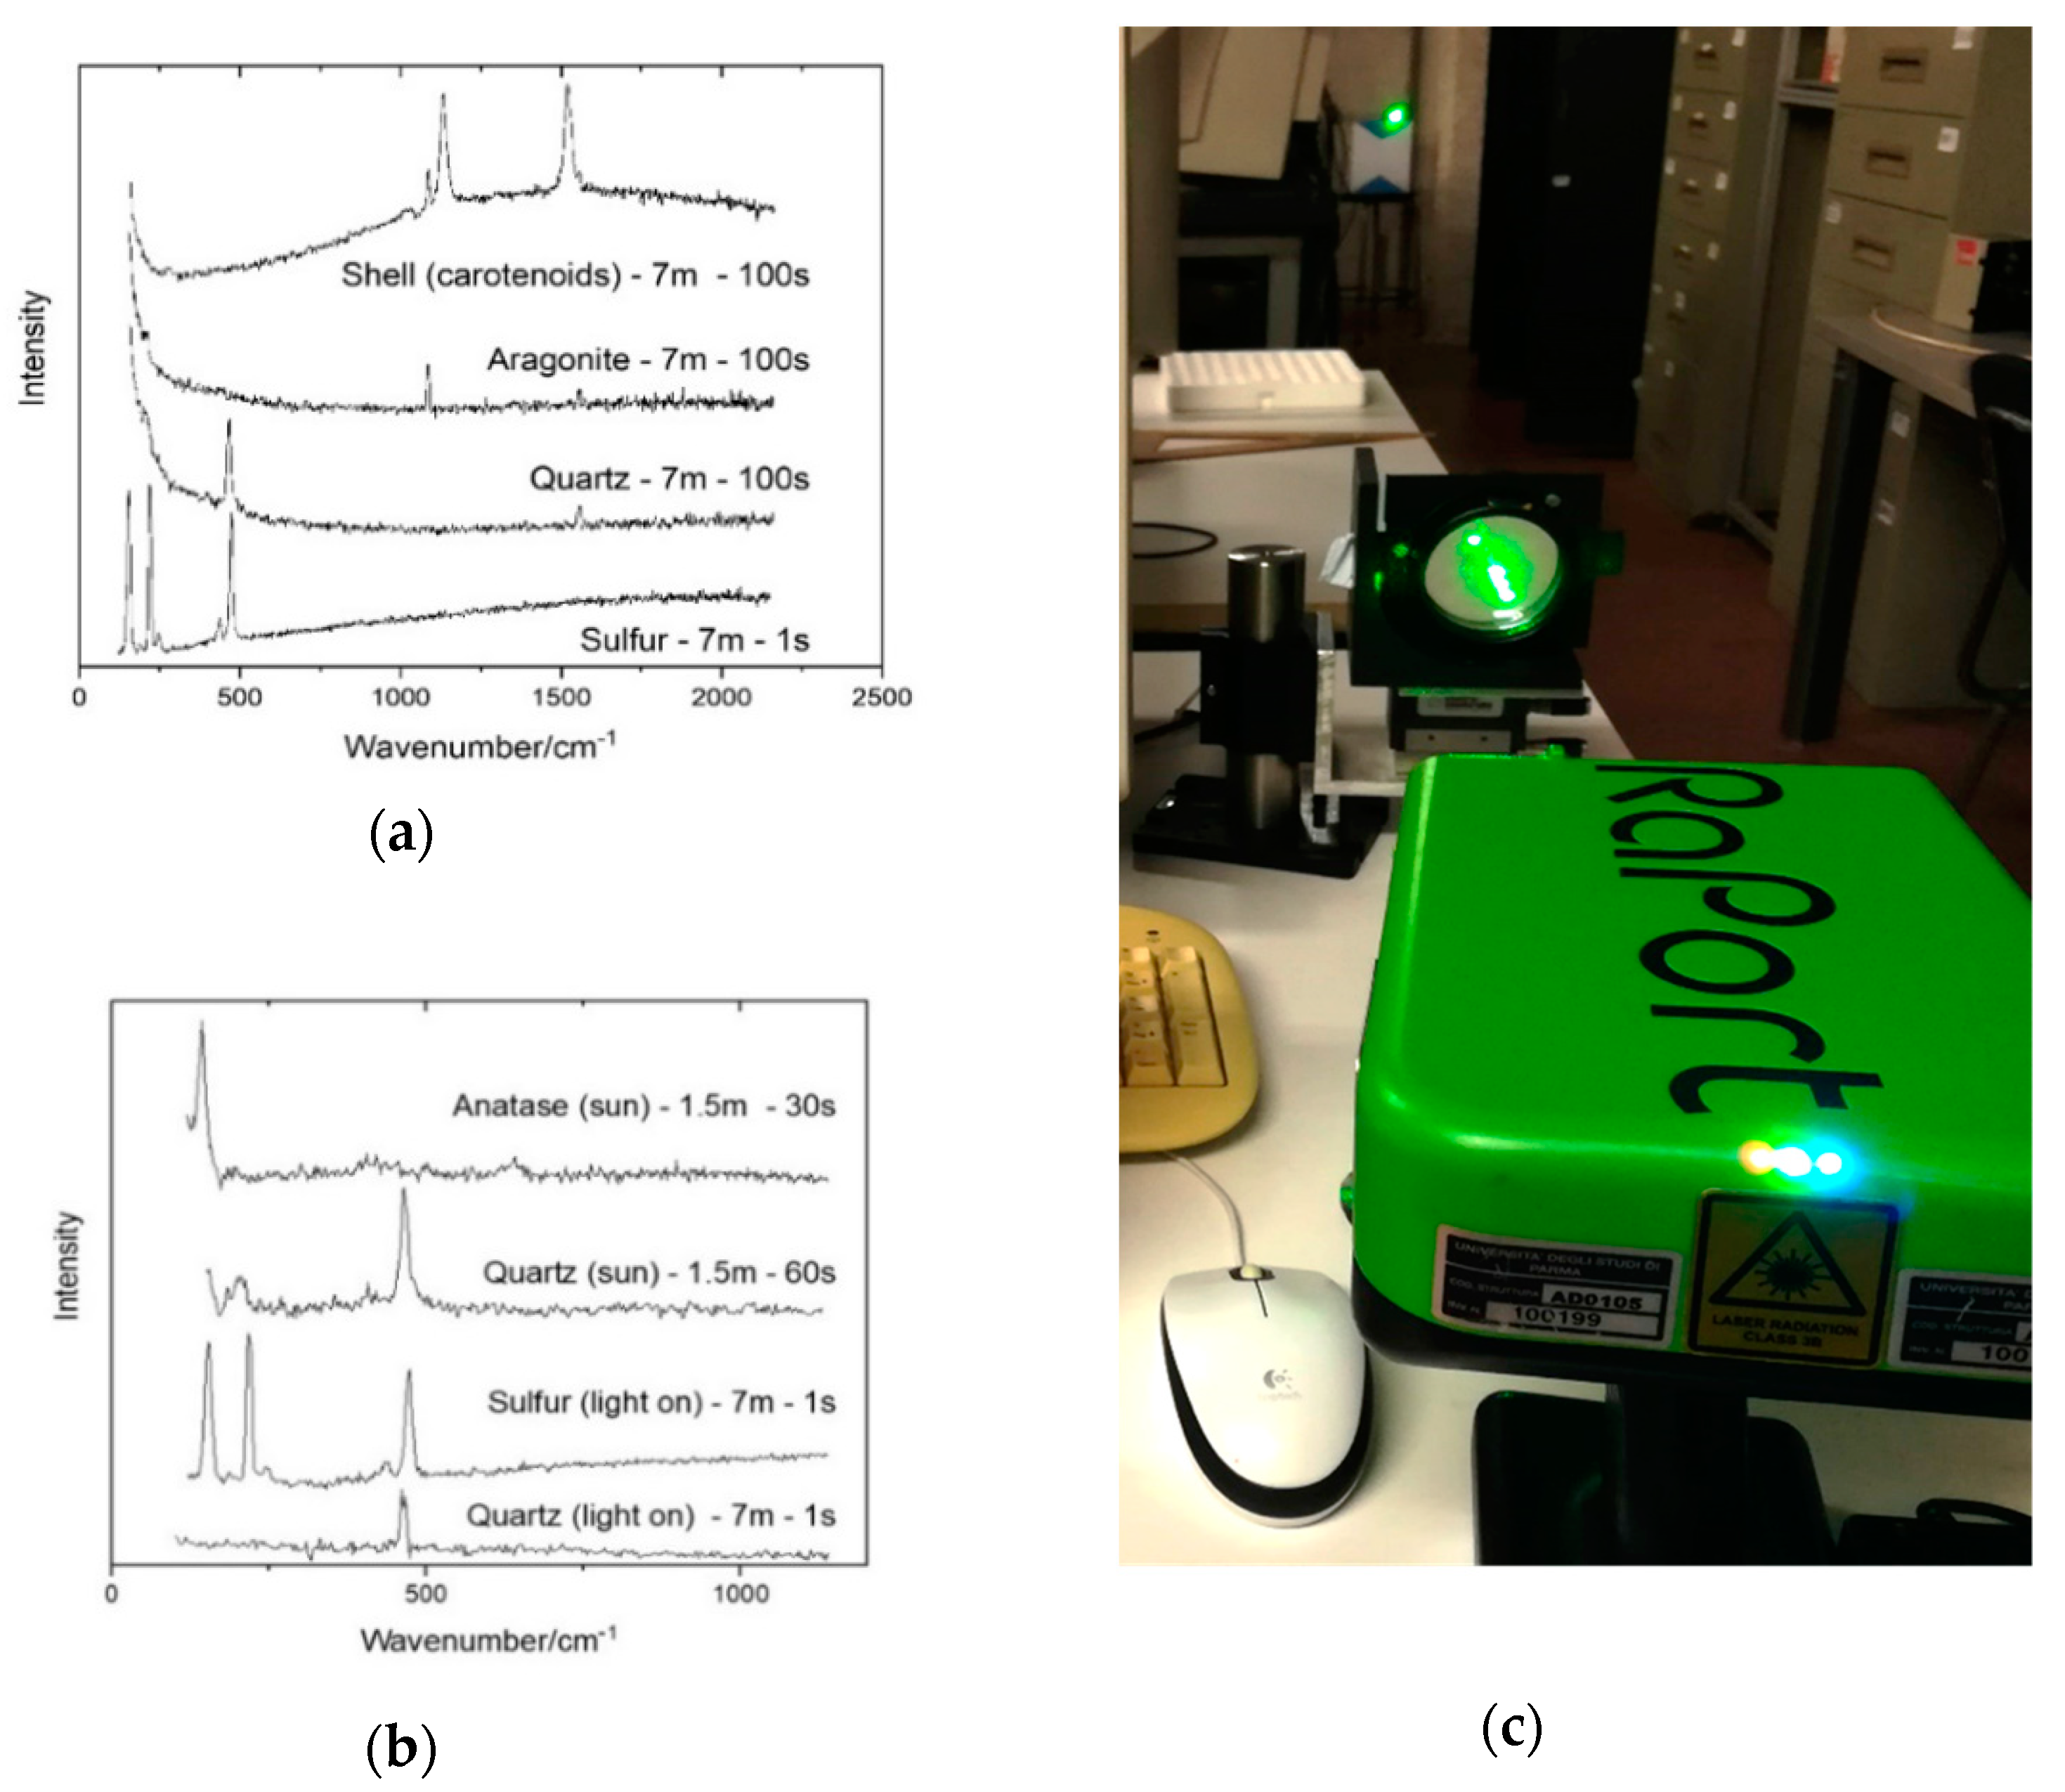
4.4. Raman in the Field: Proximal and Remote Sensing Campaigns

At present most laboratories can acquire spectra from a wide interval of locations within its close environment, but the possibility to perform Raman spectroscopy measurements at certain distances will enable to collect data of great relevance in the field and for planetary explorations. For terrestrial applications stand-off Raman instruments are commonly used in field geology and field mineralogy and recently several efforts have been adopted to adapt and miniaturize the instrumentation for the more ambitious task of planetary exploration [49,50,51,52,53,54,55].
The use of an optimized optical system made it possible to acquire Raman spectra over larger target distances. More than 20 years ago, Angel et al. [8] were able to identify organic and inorganic compounds on targets up to 20 m away. The coupling of the Raman system with a telescope in Cassegrain configuration is at present the most sensible configuration to reach big distances, up to hundreds of meters [56]. The coupling can be made by means of fiber optics or directly. In the case of direct coupling, the excitation laser can be focused using an external path (oblique configuration) or in a coaxial configuration. A coaxial configuration is preferred as it provides greater stability, but with a cost of lesser brightness.
The main improvement has been the use of a pulsed laser as the excitation source, coupled to a time-gated charge coupled device (CCD) or, better, intensified CCD (iCCD), as detector [56]. The time resolution allows to acquire the signals only during the short time where the excitation is concentrated, reducing the interference of environmental light (allowing measurements in full daylight). A second, very important, advantage is the removal of the fluorescence due its slower answer respect to the Raman scattering. The combination of the high power peaks during the laser pulses, the enhanced signal to noise ratio due to time gating, and the use of telescopic systems allowed to obtain spectra at very large distances: the group operating at the University of Hawai’i realized different compact and large systems operating between 1.5 m and 430 m ([57] and references therein) including a scanning system able to realize Raman maps with 2 mm of space resolution at a distance of 100 m [58]; Wu et al. [59] realized a mobile standoff UV Raman system able to obtain measurements up to 500 m and Johansson et al. [60] tested their standoff visible Raman in rainy conditions obtaining spectra from 50 m of distance.

5. The Future for Field-Based Raman Spectroscopy in Volcanological Science

There are two main frontiers and challenges to expanding the use of Raman spectroscopy in the Earth Sciences. These are to collect and analyze data from complex dynamic systems in real time and to collect data remotely. Volcanic materials are complex to analyze in a real-time sense because they are highly transient. The volcanic products evolve during cooling, degassing and flow (i.e., deformation) as they control the onset, sequence, and amount of crystallization. It is here that Raman spectroscopy will require the development of new protocols capable of accounting for the real-time variation of the mineralogical assemblage. This will require extensive new information and experiments to provide a template for interpreting Raman spectroscopy in terms of mineral phases and glasses pertinent to magmatic and volcanic materials. Currently such data are compiled and being continuously updated in at least a few well-known open access downloadable databases including these web-based examples:
However, these future field-based applications lead to the second great challenge, namely, the ability to collect data remotely. Clearly, Collecting Raman spectra at distances larger than the typical working distance of a microscope objective is in principle relatively simple. The only fundamental requirement is to focus the laser beam at the desired distance and to collect the light from the same point with a suitable optical system. In order to collect enough Raman signal, the most important parameter is the solid angle at which the focused spot is seen by the optical entrance of our system. That means that a large lens or mirror should be used as objective to maximize the signal at large distances. For example, it would be possible to setup a crude but functional instrument for collecting Raman spectra at a distance of few meters in the field using a handled Raman spectrometer and a focussing lens. The most important parameter is the width of the lens, because it determines the solid angle of collection of the scattered light
Here, we performed our measurements using an inexpensive EnSpectr RaPort portable Raman, equipped with a 532 nm green laser coupled with a lens with 6 cm diameter (and 25 cm focal distance) (see Figure 3). Using that lens it was possible to collect Raman spectra from a set of target minerals, including quarts, sulfur, aragonite and a piece of shell (pink coloured) at a distance of 7 m. The pink shell is included because the strong resonant Raman signal of carotenoids is one of the motivations of the use of Raman instruments in the search for life on Mars. Figure 3b shows the spectra of some minerals obtained at different distances in full environmental light: in front of a sunny windows or in presence of fluorescent bulbs using the standard background removal procedure of the instrument. The analyzed spot is in the order of a millimeter of diameter; the spectra of a sub-millimetric crystal of anatase on gneiss matrix is included in Figure 3b.
A functional Scanning Standoff Raman Spectrometers (SSTRS) system has already been developed for mapping the spatial distribution of some minerals (e.g., feldspar, quartz, gypsum) and glasses at long distances [6]. The pan-tilt scanner and laser beam pointing onto the distant samples are computer controlled, and spectra are obtained in an x-y grid on the area of interest. Then, spectra are gathered at each point in the grid and processed to determine the distribution of minerals from their respective Raman fingerprints. The new SSTRS system has been successfully tested, offering the capability to produce spatial distribution maps of mineral species from their remote Raman fingerprints. Remote Raman spectral analysis will contribute greatly to planetary exploration programs [55]. Remote data collection would have immediate applications to volcano monitoring activities. As smaller, more robust Raman spectrometers that collect data from greater distances are developed further, their use in volcanology will intensify. Miniaturized Raman spectrometers used in combination with drones are a means to collect new types of real-time data on volcanoes before, during and after eruptions without putting scientists at risk. For example, the volcanological sciences could benefit immensely by using Raman to monitor lava flows wherein Raman spectra can be analysed for temperature, melt composition, and mineralogy. Raman spectra could be collected with time at the vent to track the evolution of the erupting magma or could be collected from lava as it moves downstream from the vent to its distal edge marking the rheological death of the lava [43,61]. In a similar manner, Raman-based monitoring could be applied to the products of explosive eruptions (i.e., tephra). Technically, the employment in the field under sun light exposure as well as the exposure to toxic gases and the high temperature of lava flows, for instance, would also require to consider the temperature-frequency dependence of the relative Raman scattering efficiencies due to the temperature-dependent population density of the vibrational energy levels [6,49]. The black-body radiation generated by high temperature bodies provide an increased noise-signal background which have to be reduced. Such complication can be reduced through the employment of high energy lasers and the employment of fast-gated pulsed spectroscopy and CCD (Charge-Coupled Device) detection [49,62].

Author Contributions

Conceptualization of the work has been developed by D.G. and later implemented by all coauthors (D.G., J.K.R., D.B., D.G.-G., D.B.D. and C.D.N.). Bibliographic research and writing of the original draft preparation: D.G.; writing—review and editing, J.K.R., D.B. and D.G.-G. D.B. developed the instrumental apparatus and all the measurements that are presented in Figure 3. All authors have read and agreed to the published version of the manuscript.

Funding

Local research funds of the University of Turin.

Acknowledgments

The micro-Raman equipment at UniTO belongs the Interdepartmental Center “G. Scansetti” for Studies on Asbestos and Other Toxic Particulates and was acquired with support from the Compagnia di San Paolo, Torino. D. Giordano is grateful to the Center for Advanced Studies (CAS) at the Ludwig-Maximilians-Universität (LMU) München (https://www.en.cas.uni-muenchen.de/index.html) for the support of this research through the LMU CAS Research Group “Magma to tephra: ash in the earth system” (DBD).

Conflicts of Interest

The authors declare no conflict of interest.

Appendix A

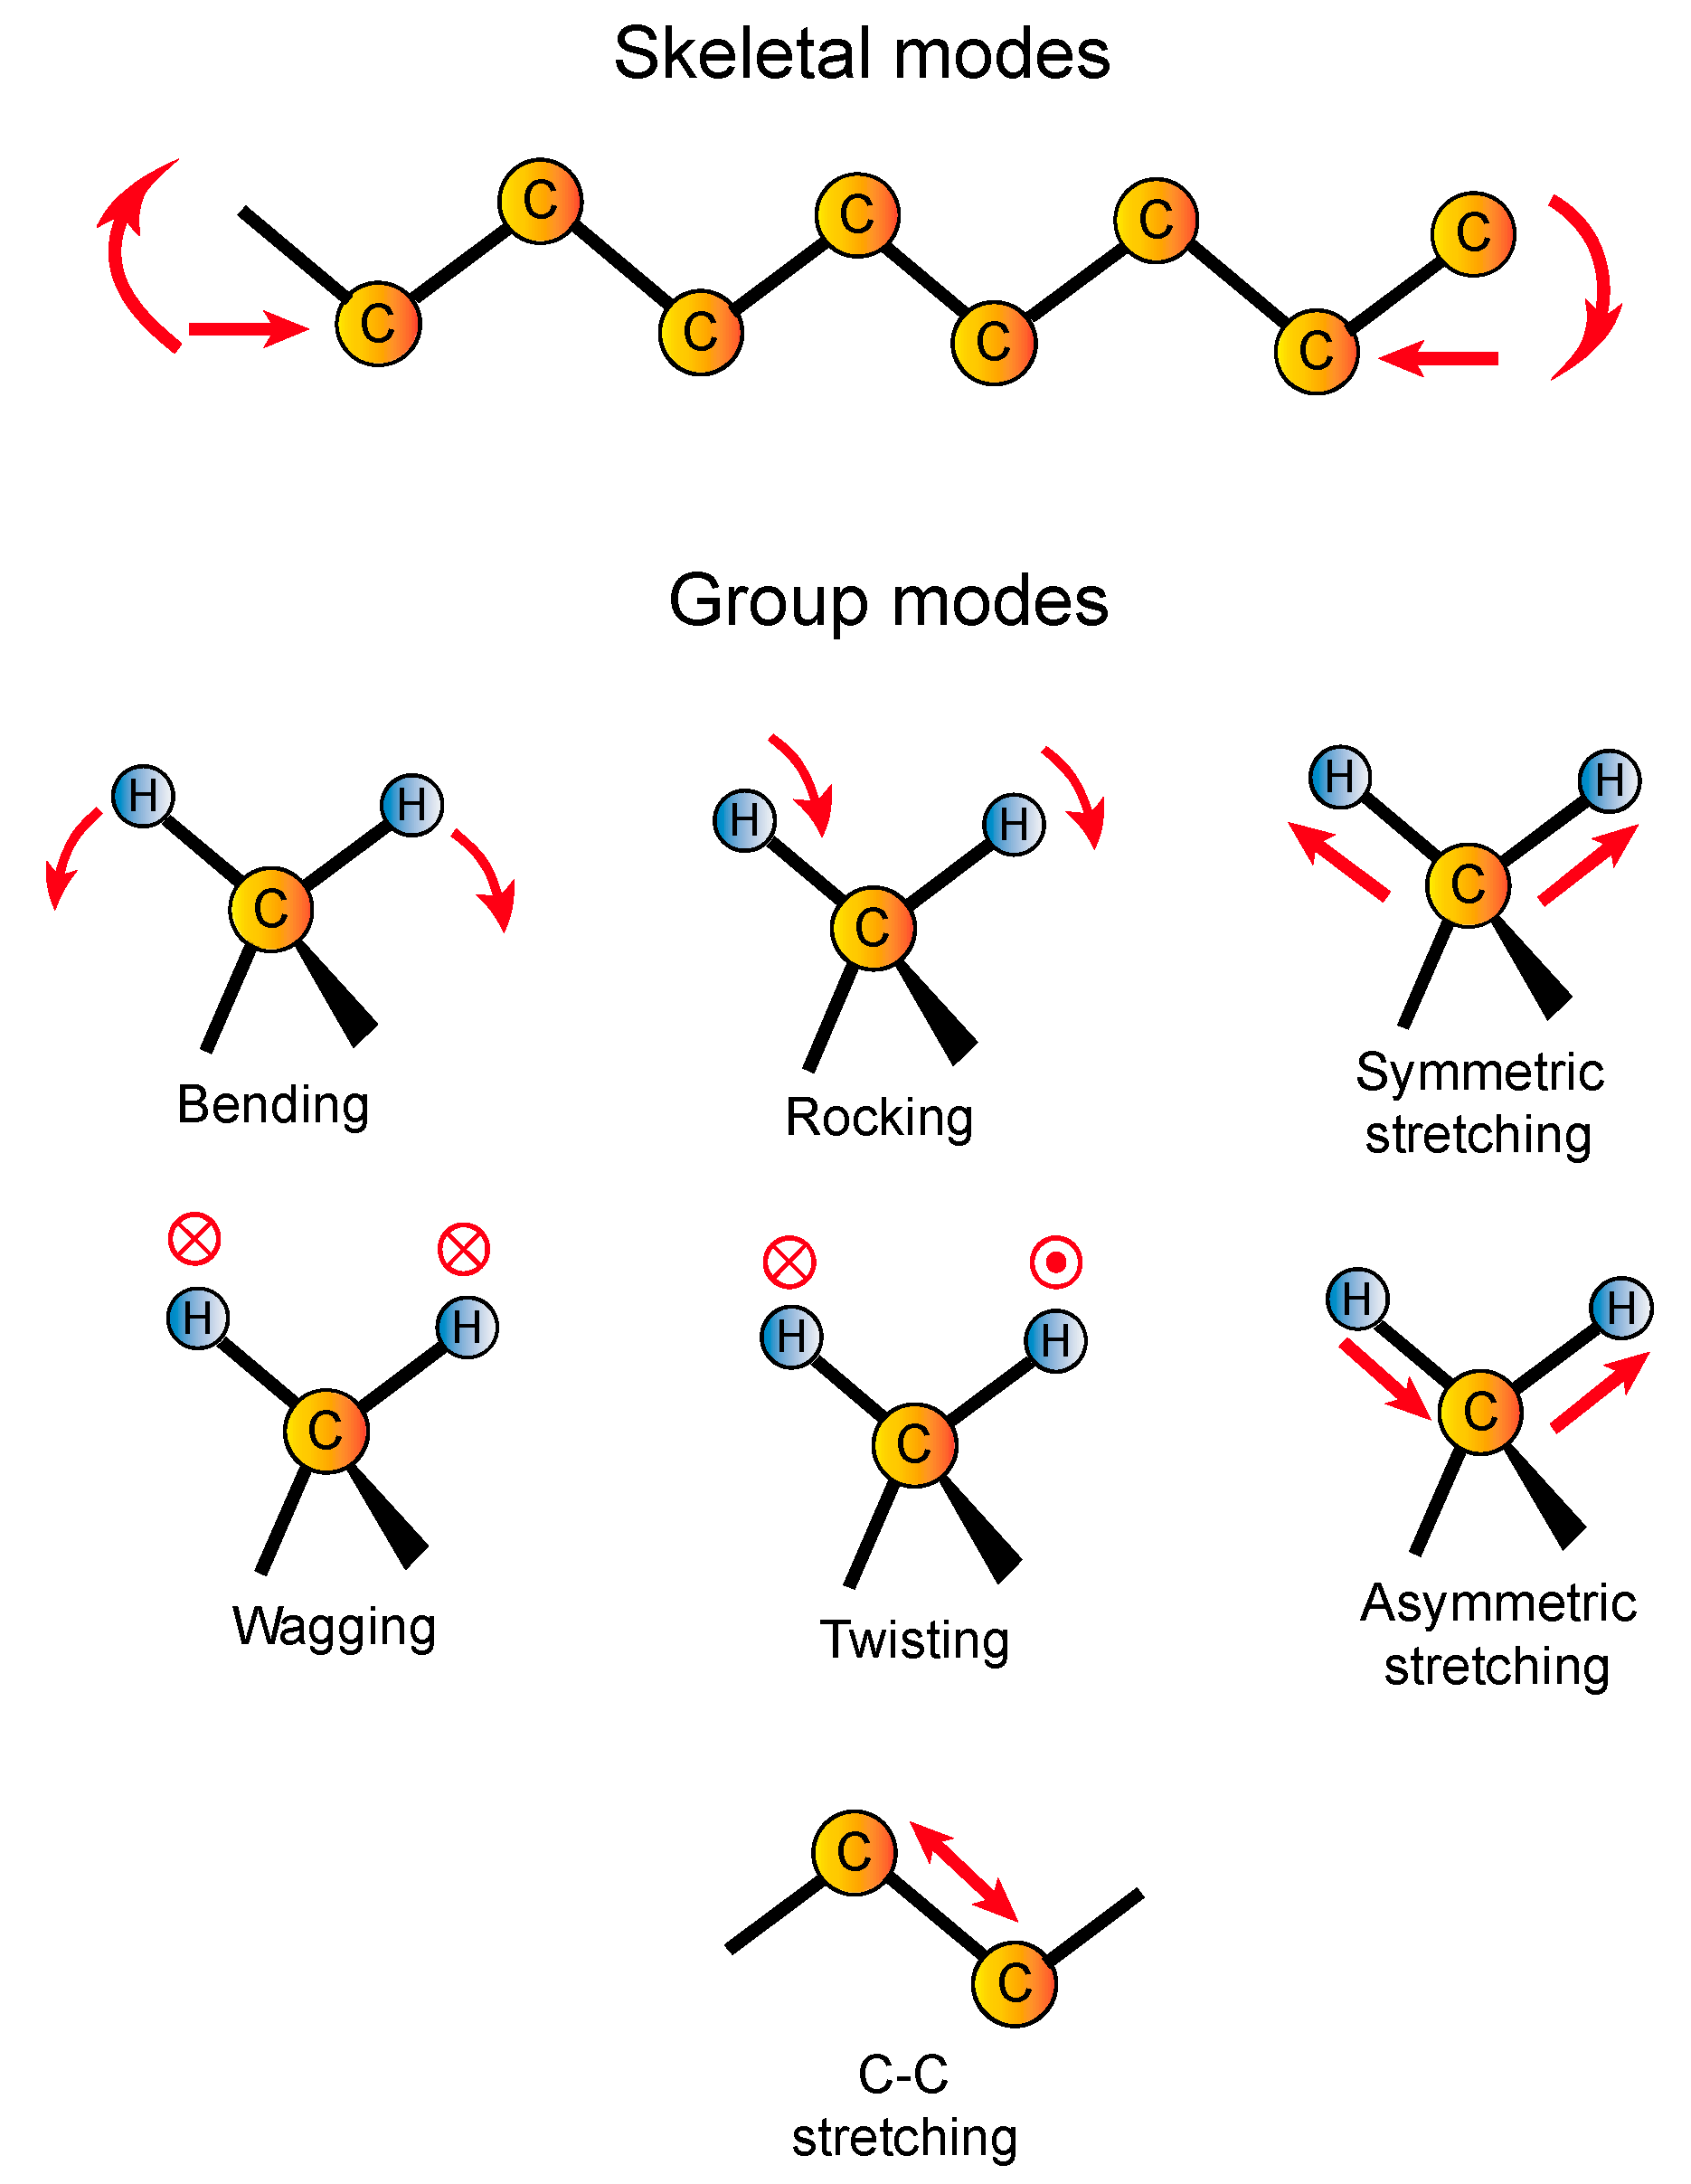
Appendix A.1. Main Vibrational Modes

The interatomic forces between bonded atoms control the exact frequency of the vibrations, in much the same way as a spring connecting two vibrating masses. Atoms, molecules or more complex structures (e.g., rings of tetrahedral or polymers) commonly vibrate through pure stretching (translational) and bending (rotational) modes or composition of them (roto-translational) (Figure A1).
For silicate melts, above the LW region the vibrations are mostly of stretching type. Bending modes are instead the main feature of LW region. More details are provided in the following paragraph.
Figure A1. Main vibrational modes of atoms in molecules or in complex structures (e.g., rings of tetrahedra or polymers - skeletal type of vibrations), shown here for polyethylene. Figure modified after [63].
Remotesensing 12 00805 g0a1

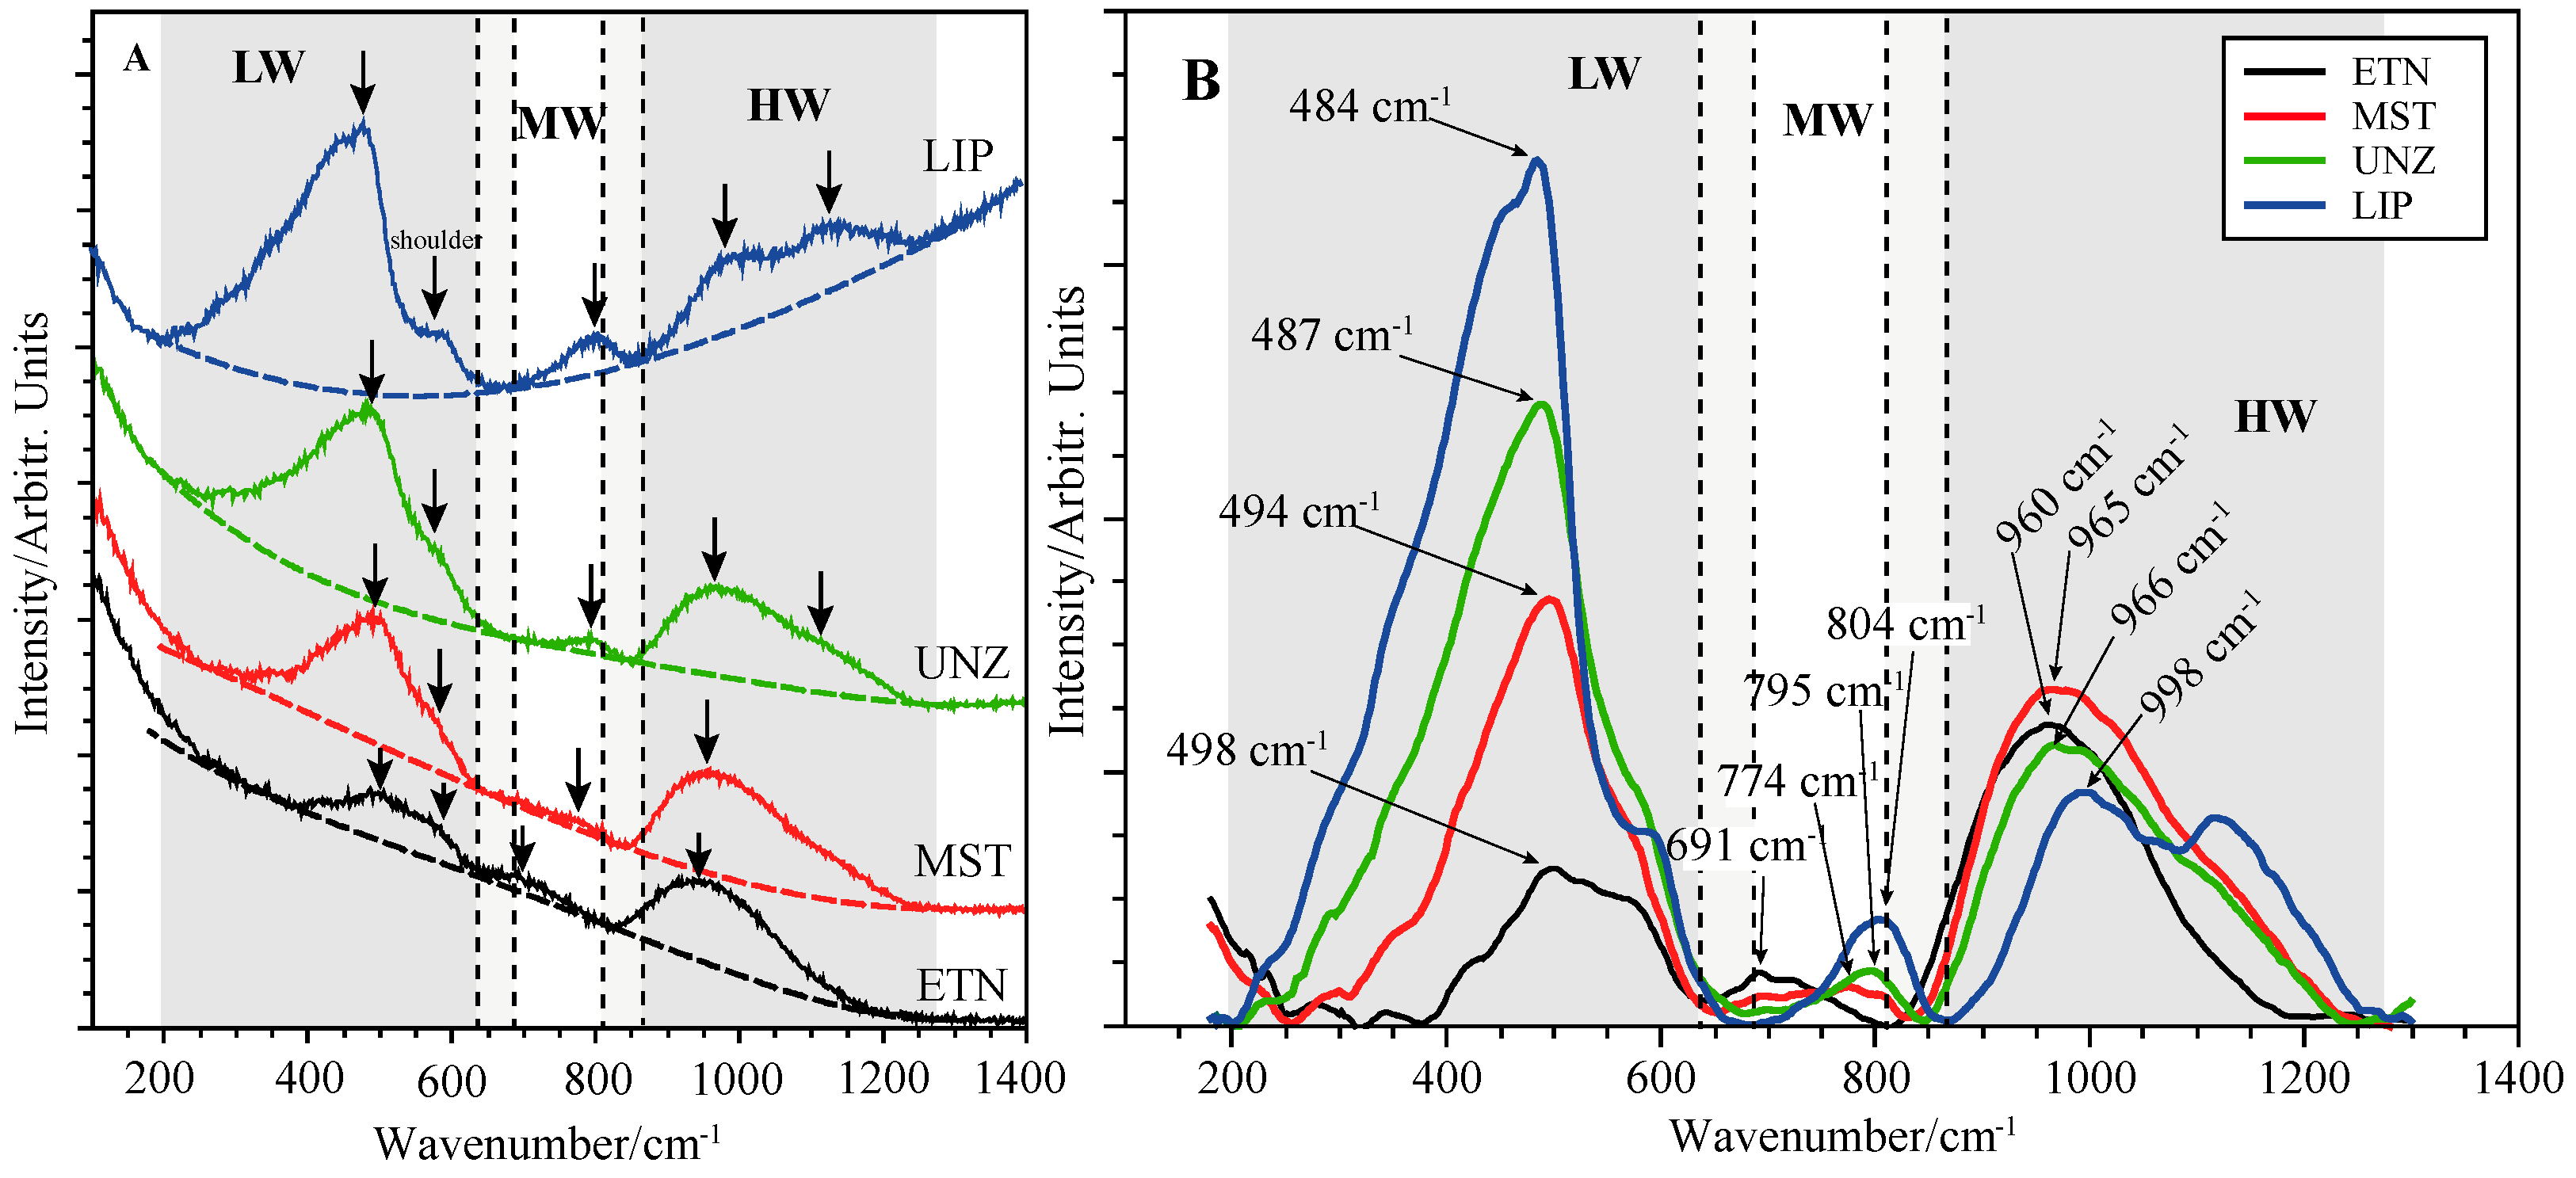
Appendix A.2. LW, MW and HW Bands in Silicate Melts and Glasses

According to previous authors [2,14,15,64,65,66,67], the LW domain are dominated by a broad band resulting from bending vibrations of T–O–T units and, to some extent, deformation vibrations of T–O–T bridges (Figure 1). The LW envelope is usually interpreted as the combination of delocalized vibrational modes mainly related to symmetric stretching vibrations of BO in TO4 rings; rocking motion in fully polymerized units; vibration of T against its tetrahedral frame accompanied by slight displacement of the oxygen; T-O-T bending of NBO bonds and the so-called “defect bands”, likely related to breathing modes of 3-4-membered rings of TO4 tetrahedra. In this region, the characteristics generally allocated to vibrations of 3- to 6-membered rings of tetrahedra in the aluminosilicate network [68,69]. In particular, a strong band near 500 cm−1 (D1) and sometimes a shoulder near 600 cm−1 (D2) are present in this domain, and can be respectively assigned to breathing vibrations of 4- and 3-membered rings of tetrahedra; while the long tail at the LW region develops from stretching (translational movements) of Si–O units in 5-, 6- or higher-membered rings [68,69] forming the aluminosilicate framework of the glass [14,15,70]. The presence of alkalis or alkaline Earths these bands develop a peak centered at 580 cm−1 and a shoulder at 600 cm−1. The peak centered at 580 cm−1 has been assigned to the rocking motion in Si-O0 units in fully polymerized SiO2 (Q4) units, while the maximum at 600 cm−1 corresponds to Si-O-Si bending motions in depolymerized units (e.g., [12] and references therein). In general, the shape and positions of bands will evolve with varying glass composition and structure.
Above the LW region the vibrations are mostly of stretching type. The weak band in the MW domain (600–850 cm−1) (e.g., [2,33]) is commonly ascribed to Si–O stretching (translational) mode [71] involving oxygen motions in the Si-O-Si plane [64,72] with intensity correlated to silica content [73] or to the motion of the Si atom in its oxygen cage [74]. The main characteristic in the envelope centred at ~800 cm−1 arises from two bands resulting from deformation oscillations of T-O-T bonds within precise domains, with a structure resembling crystalline SiO2 [67,75]. This band is more prominent in more polymerized melts and glasses (i.e., rhyolitic).
Bands in the HW region of the spectra (~800–1300 cm−1) contains information related to the Si-O, Al3+-O and Fe3+-O stretching (translations) in the glass structure. These are caused by oscillations of terminal covalently bonded units in TO4 tetrahedra with a variable number of bridging oxygens (BO), commonly referred to as Qn-units or Qn-species*. Here Q represents a TO4 tetrahedron and n is the number of bridging oxygens (BO), varying between 0 and 4. The HW envelope is the most sensitive to changes of redox conditions and is commonly deconvoluted in order to quantify the effect of iron oxidation state [16,33]. The investigation of vibration in the HW region has also the advantage of avoiding the contributions potentially provided by the presence of nanolites of oxide crystals (e.g., 16, 77) and for the same reason is frequently used for studies devoted to characterize the effect of oxidation state of iron in basaltic to pantelleritic compositions [14,16,33,38,76,77]. Table A1 reports a summary of the main kind of vibration frequencies for some of the most well-known alumino-silicate and iron-bearing alumino-silicate melts.
Table A1. Summary of characteristic bands and their interpretation in Raman spectra of silicate glasses.
Wavenumber (cm−1)FeaturesReferences
LW Region (200–700 cm−1)
400–650Bending vibration of BO bonds of SiO2[9]
440–495Oxygen breathing in SiO4 units in Q4[9]
550–590Si-O-Si bending in Q3[14]
565–595Si-O-Si bending in Q2[9]
605Oxygen breathing in SiO4 in Q4[9]
450, 500, 600Motions of BO in T-O-T linkages
580Si-O0 rocking motions in fully polymerized SiO2 (Q4) units
600Si-O-Si bending vibration in depolymerized structural units
HW region (650–850 cm−1)
700Si-O-Si bending in Q0/Q1[9]
779Si-O-Si network, AlO4 units with three BOs and 1 NBO
790Si-O-Si symmetric stretching
807Si-O-Si bending
810–820Si-O stretching involving oxygen motions in Si-O-Si plane or the motion of of the Si
850Antisymmetric stretch Si-O- (NBO) in Q0/Q1[9]
HW region
850–1300 cm−1
890
900Antisymmetric Si-O- stretch (NBO) in Q1[9]
935
950–960Antisymmetric stretching vibration of Si-O tetrahedral with two corners shared with aluminium-oxygen or calcium-oxygen polyhedra (Q2 units)
965–980Fe3+ band related to the Fe3+ abundance likely related to the stretching of F3+ possibly in four-fold coordination[36,37]
980
1035
1050Antisymmetric Si-O- stretch (NBO) in Q2
1060−1200 (1060, 1120, 1150, 1170, 1190−1200)Antisymmetric Si-O stretching vibrations of SiO4 tetrahedra (Q4 units)[9]
1070C-O symmetric stretch in CO3 groups[9]
1083SiO4 asymmetric stretching vibration[9]
1100Antisymmetric Si-O- (NBO) in Q3[9]
Volatile bearing compositions
900−970Si-OH stretching mode[7,9]
1280Molecular CO2[9]
1600−1650H-O-H bending of molecular H2O[9]
2350Si-OH groups involved in intratetrahedral hydrogen bonding across an edge of the SiO4 tetrahedron
2800−4000O-H+H2O stretch (wide band)[9]
According to previous investigations seven to eight bands were used to fit the HW domain [10,33,78] (Figure A2) due to the entry of several types of T cations in a given Qn unit. [33], for instance, have subdivided the band in Band I (770–800 cm−1); II (~890 cm−1); III (~935 cm−1); IV (~980 cm−1); V (~1035 cm−1); VI (~1090 cm−1); VII (1150 cm−1), VIII (1000 cm−1).
Figure A2. Curve-fitted HF envelope of Raman spectra (Long-corrected), figure from [33]. Band IV (dark colored curve) results from stretching of coupled Si–Fe tetrahedra with iron in alkali-balanced Q3 units. The abundance of Qn species is controlled mainly by the following disproportionation reactions (A1)–(A3):
Remotesensing 12 00805 g0a2
2Qn = Qn+1+Qn−1 (n = 3, 2, 1)
2Q0 = 2Q1 + O2−
where O2− is a free oxygen ion not included in the tetrahedron. The equilibrium constants of reaction (1) are:
Kn = [Qn+1][Qn−1]/[Qn]2
where Qn is the abundance of a particular unit.
According to the same authors bands II –VII result from to vibrations of Qn unit with the number of bridging oxygen (n) increasing from 0 to 4 ([33] for more details). These authors have shown that both peak intensities and areas and their ratios for the HW bands are significantly affected, other than by composition, also by both the Fe3+/Fetot ratio [14,16,33] and by the presence of water [14,33] (Figure 2).
For volatile bearing glasses and melts, stretching (translational) vibrations are observed at higher frequencies such as 2331 for N2 [19]; 4125 for H2 [20], SO42− (e.g., [21]), CO2 and CO32− [23,24]. Stretching vibrations of water in both the molecular and hydroxyl form can be observed between 3000 and 4000 cm−1 approximately centered at 3550 cm−1 for hydrous glasses (e.g., [13,14,15,16,25,26,27,28,29]).
Figure A3. Example of Raman spectra of hydrous of different water contents of (a) Etna basalt, (b) Vulcanello shoshonite, and (c) Vulcano rhyolite. Baseline subtraction following the procedure of [44]. Water contents were determined by Fourier transform infrared spectroscopy (FTIR) and Karl-Fischer titration (KFT); data from [79,80].
Remotesensing 12 00805 g0a3

References

  1. Giordano, D.; Polacci, M.; Longo, A.; Papale, P.; Digwell, D.B.; Boschi, E.; Kasereka, M. Thermo-rheological magma control on the impact of highly fluid lava flows at Mt. Nyiragongo. Geophys. Res. Lett. 2007, 34, L06301. [Google Scholar] [CrossRef]
  2. Giordano, D.; González-García, D.; Russell, J.K.; Raneri, S.; Bersani, D.; Fornasini, L.; Di Genova, D.; Ferrando, S.; Kaliwoda, M.; Lottici, P.P.; et al. A calibrated database of Raman spectra for natural silicate glasses: Implications for modelling melt physical properties. J. Raman Spectrosc. 2019, 1–17. [Google Scholar] [CrossRef]
  3. Kolzenburg, S.; Giordano, D.; Hess, K.U.; Dingwell, D.B. Shear Rate−Dependent Disequilibrium Rheology and Dynamics of Basalt Solidification. Geophys. Res. Lett. 2018, 45, 6466–6475. [Google Scholar] [CrossRef] [Green Version]
  4. Kolzenburg, S.; Giordano, D.; Di Muro, A.; Dingwell, D.B. Equilibrium viscosity and disequilibrium rheology of a high magnesium basalt from Piton de la Fournaise volcano, La Reunion, Indian Ocean, France. Ann. Gephys. 2019, 62, VO218. [Google Scholar] [CrossRef]
  5. Sharma, S.K.; Misra, A.K.; Clegg, S.M.; Barefield, J.E.; Wiens, R.C.; Acosta, T.E.; Bates, D.E. Remote-Raman spectroscopic study of minerals under supercritical CO2 relevant to Venus exploration. Spectr. Acta Part A 2011, 80, 75–81. [Google Scholar] [CrossRef]
  6. Sharma, S.K.; Porter, J.N.; Misra, A.K.; Helsley, C.E.; Bates, D.E. Scanning time-resolved standoff Raman instrument for large-area mineral detection on planetary surfaces. Eur. J. Mineral. 2013, 25, 715–720. [Google Scholar] [CrossRef]
  7. McMillan, P.F.; Poe, B.T.; Stanton, T.R.; Remmele, R.L. A Raman spectroscopic study of H/D isotopically substituted hydrous aluminosilicate glasses. Phys. Chem. Miner. 1993, 19, 454–459. [Google Scholar] [CrossRef]
  8. Angel, S.M.; Gomer, N.R.; Sharma, S.K.; McKay, C. Remote Raman Spectroscopy for Planetary Exploration: A Review. Appl. Spectrosc. 2012, 66, 137–150. [Google Scholar] [CrossRef] [Green Version]
  9. Rossano, S.; Mysen, B. Raman spectroscopy of silicate glasses and melts in geological systems. EMU Notes Mineral. 2012, 12, 319–364. [Google Scholar] [CrossRef]
  10. Malfait, W. Vibrational Properties of Glasses and Melts. In Magmas Under Pressure. Advances in High-Pressure Experiments on Structure and Properties of Melts; Kono, Y., Sanloup, C., Eds.; Elsevier: Amsterdam, The Netherlands, 2018; pp. 211–236. [Google Scholar]
  11. Hurai, V.; Huraiová, M.; Slobodnik, M.; Thomas, R. Raman and Infrared Spectroscopic Analysis. In Geofluids. Developments in Microthermometry, Spectroscopy, Thermodynamics, and Stable Isotopes; Elsevier: Amsterdam, The Netherlands, 2015; pp. 231–280. [Google Scholar] [CrossRef]
  12. Neuville, D.R.; de Ligny, D.; Henderson, G.S. Advances in Raman Spectrosscopy Applied to Earth and Material Sciences. Rev. Mineral. Geochem. 2014, 78, 509–541. [Google Scholar] [CrossRef]
  13. Thomas, R. Determination of water contents of granite melt inclusions by confocal laser Raman microprobe spectroscopy. Am. Mineral. 2000, 85, 868–872. [Google Scholar] [CrossRef]
  14. Mercier, M.; Di Muro, A.; Giordano, D.; Métrich, N.; Lesne, P.; Pichavant, M.; Scaillet, B.; Clocchiatti, R.; Montagnac, G. Influence of glass po¬lymerisation and oxidation on micro-Raman water analysis in alumino-silicate glasses. Geochim. Cosmochim. Acta 2009, 73, 197–217. [Google Scholar] [CrossRef] [Green Version]
  15. Mercier, M.; Muro, A.D.; Métrich, N.; Giordano, D.; Belhadj, O.; Mandeville, C.W. Spectroscopic analysis (FTIR, Raman) of water in mafic and intermediate glasses and glass inclusions. Geochim. Cosmochim. Acta 2010, 74, 5641–5656. [Google Scholar] [CrossRef]
  16. Di Genova, D.; Sicola, S.; Romano, C.; Vona, A.; Fanara, S.; Spina, L. Effect of iron and nanolites on Raman spectra of volcanic glasses: A reassessment of existing strategies to estimate the water content. Chem. Geol. 2017, 475, 76–86. [Google Scholar] [CrossRef]
  17. Bernard, S.; Beyssac, O.; Benzerara, K. Raman Mapping Using Advanced Line-Scanning Systems: Geological Applications. Appl. Spectrosc. 2008, 62, 1180–1188. [Google Scholar] [CrossRef]
  18. Yesiltas, M.; Jaret, S.; Young, J.; Wright, S.P.; Glotch, T.D. Three dimensional Raman tomographic microspectroscopy: A novel imaging technique. Earth Space Sci. 2018, 5, 380–392. [Google Scholar] [CrossRef]
  19. Roskosz, M.; Toplis, M.J.; Neuville, D.R.; Mysen, B.O. Quantification of the kinetics of iron oxidation in silicate melts using Raman spectroscopy and assessment of the role of oxygen diffusion. Am. Mineral. 2008, 93, 1749–1759. [Google Scholar] [CrossRef]
  20. Luth, R.W.; Mysen, B.O.; Virgo, D. Raman spectroscopic study of the solubility behavior of H2 in the system Na2O-Al2O3-SiO2-H2. Am. Mineral. 1987, 72, 481–486. [Google Scholar]
  21. Manara, D.; Gradjean, A.; Pinet, O.; Dussossoy, J.L.; Neuville, D.R. Sulfur behavior in silicate glasses and melts: Implications for sulfate incorporation in nuclear waste glasses as a function of alkali cation and V2O5 content. J. Non-Cryst. Solids 2007, 353, 12–23. [Google Scholar] [CrossRef]
  22. Klimm, K.; Botcharnikov, R.E. The determination of sulfate and sulfide species in hydrous silicate glasses using Raman spectroscopy. Am. Mineral. 2010, 95, 1574–1579. [Google Scholar] [CrossRef]
  23. Amalberti, J.; Neuville, D.R.; Sarda, P.; Sator, N.; Guillot, B. Quantification of CO2 dissolved in silicate glasses and melts using Raman spectroscopy: Implications for geodynamics. Mineral. Mag. 2012, 76, 430. [Google Scholar]
  24. Morizet, Y.; Brooker, R.A.; Iacono-Marziano, G.; Kjarsgaard, B.A. Quantification of dissolved CO2 in silicate glasses using micro-Raman spectroscopy. Am. Mineral. 2013, 98, 1788–1802. [Google Scholar] [CrossRef]
  25. Chabiron, A.; Pironon, J.; Massare, D. Characterization of water in synthetic rhyolitic glasses and natural melt inclusions by Raman spectroscopy. Contrib. Mineral. Petr. 2004, 146, 485–492. [Google Scholar] [CrossRef]
  26. Zajacz, Z.; Halter, W.; Malfait, W.J.; Bachmann, O.; Bodnar, R.J.; Hirschmann, M.M.; Mandeville, C.W.; Morizet, Y.; Müntener, O.; Ulmer, P.; et al. A composition-independent quantitative determination of the water content in silicate glasses and silicate melt inclusions by confocal Raman spectroscopy. Contrib. Mineral. Petr. 2005, 150, 631–642. [Google Scholar] [CrossRef] [Green Version]
  27. Behrens, H.; Roux, J.; Neuville, D.; Siemann, M. Quantification of dissolved H2O in silicate glasses using confocal microRaman spectroscopy. Chem. Geol. 2006, 229, 96–112. [Google Scholar] [CrossRef]
  28. Thomas, R.; Metrich, N.; Scaillet, B.; Kamenetsky, V.S.; Davidson, P. Determination of water in Fe-rich basalt glasses with confocal micro-Raman spectroscopy. Z. Geol. Wissenschaft. 2008, 36, 31–37. [Google Scholar]
  29. Schiavi, F.; Bolfan-Casanova, N.; Withers, A.C.; Médard, E.; Laumonier, M.; Laporte, D.; Flaherty, T.; Gómez-Ulla, A. Water quantification in silicate glasses by Raman spectroscopy: Correcting for the effects of confocality, density and ferric iron. Chem. Geol. 2018, 483, 312–331. [Google Scholar] [CrossRef]
  30. Dubessy, J.; Caumon, M.-C.; Rull, F. Raman Spectroscopy Applied to Earth Sciences and Cultural Heritage; EMU Notes Mineralogy: London, UK, 2012. [Google Scholar]
  31. Chou, I.-M.; Wang, A. Application of laser Raman micro-analyses to Earth and planetary materials. J. Asian Earth Sci. 2017, 145, 309–333. [Google Scholar] [CrossRef]
  32. Mysen, B.O.; Richet, P. Silicate Glasses and Melts—Properties and Structure; Elsevier: Amsterdam, The Netherlands, 2005; Volume 10. [Google Scholar]
  33. Di Muro, A.; Métrich, N.; Mercier, M.; Giordano, D.; Massare, D.; Montagnac, G. Micro-Raman determination of iron redox state in dry natural glasses: Application to peralkaline rhyolites and basalts. Chem. Geol. 2009, 259, 78–88. [Google Scholar] [CrossRef]
  34. Giordano, D.; Russell, J.K. Toward a Structural Model for the Viscosity of Geological Melts. Earth Planet. Sci. Lett. 2018, 501, 202–212. [Google Scholar] [CrossRef]
  35. Long, D.A. Raman Spectroscopy; McGraw-Hill: New York, NY, USA, 1977; p. 275. [Google Scholar]
  36. Magnien, V.; Neuville, D.R.; Cormier, I.; Roux, J.; Pinet, O.; Richet, P. Kinetics of iron redox reactions: A high temperature XANES and Raman spectroscopy study. J. Nucl. Mater. 2006, 352, 190–195. [Google Scholar] [CrossRef]
  37. Cochain, B.; Neuville, D.R.; Henderson, G.S.; McCammon, C.; Pinet, O.; Richet, P. Iron content, redox state and structure of sodium borosilicate glasses: A Raman, Mössbauer and boron K-edge XANES spectroscopy study. J. Am. Soc. 2012, 94, 1–12. [Google Scholar] [CrossRef]
  38. Di Genova, D.; Kolzenburg, S.; Vona, A.; Chevrel, M.O.; Hess, K.-U.; Neuville, D.R.; Ertel-Ingrisch, W.; Romano, C.; Dingwell, D.B. Raman spectra of Martian glass analogues: A tool to approximate their chemical composition. J. Geophys. Res. Planets 2016, 121, 740–752. [Google Scholar] [CrossRef] [PubMed] [Green Version]
  39. Di Genova, D.; Hess, K.-U.; Chevrel, M.O.; Dingwell, D.B. Models for the estimation of Fe3+/Fetot ratio in terrestrial and extraterrestrial alkali- and iron-rich silicate glasses using Raman spectroscopy. Am. Mineral. 2016, 101, 943–952. [Google Scholar] [CrossRef] [Green Version]
  40. Di Genova, D.; Morgavi, D.; Hess, K.-U.; Neuville, D.R.; Borovkov, N.; Perugini, D.; Dingwell, D.B. Approximate chemical analysis of volcanic glasses using Raman spectroscopy. J. Raman Spectrosc. 2015, 46, 1235–1244. [Google Scholar] [CrossRef]
  41. González-García, D.; Giordano, D.; Russell, J.K.; Dingwell, D.B. A Raman spectroscopic tool to estimate chemical composition of natural volcanic glasses. 2020; Submitted. [Google Scholar]
  42. Mysen, B.O.; Virgo, D. Structure and properties of fluorine-bearing aluminosilicate melts: The system Na2O-Al2O3-SiO2-F at 1 atm. Contrib. Mineral. Petrol. 1985, 91, 205–220. [Google Scholar] [CrossRef]
  43. Di Muro, A.; Villemant, B.; Montagnac, G.; Scaillet, B.; Reynard, B. Quantification of water content and speciation in natural silicic glasses (phonolite, dacite, rhyolite) by confocal microRaman spectrometry. Geochim Cosmochim. Acta 2006, 70, 2868–2884. [Google Scholar] [CrossRef] [Green Version]
  44. Le Losq, C.; Neuville, D.R.; Moretti, R.; Roux, J. Determination of water content in silicate glasses using Raman spectrometry: Implications for the study of explosive volcanism. Am. Mineral. 2012, 97, 779–790. [Google Scholar] [CrossRef]
  45. Severs, M.J.; Azbej, T.; Thomas, J.B.; Mandeville, C.W.; Bodnar, R.J. Experimental determination of H2O loss from melt inclusions during laboratory heating: Evidence from Raman spectroscopy. Chem. Geol. 2007, 237, 358–371. [Google Scholar] [CrossRef]
  46. Morizet, Y.; Paris, M.; Gaillard, F.; Scaillet, B. Raman quantification factor calibration for CO–CO2 gas mixture in synthetic fluid inclusions: Application to oxygen fugacity calculation in magmatic systems. Chem. Geol. 2009, 264, 58–70. [Google Scholar] [CrossRef] [Green Version]
  47. Morizet, Y.; Paris, M.; Sifre, D.; Di Carlo, I.; Ory, S.; Gaillard, F. Towards the reconciliation of viscosity change and CO2-induced polymerization in silicate melts. Chem. Geol. 2017, 458, 38–47. [Google Scholar] [CrossRef]
  48. Le Losq, C.; Neuville, D.R. Molecular structure, configurational entropy and viscosity of silicate melts: Link through the Adam and Gibbs theory of viscous flow. J. Non-Cryst. Solids 2017, 463, 175–188. [Google Scholar] [CrossRef]
  49. Sharma, S.K.; Lucey, P.G.; Gosh, M.; Hubble, H.W.; Horton, K.A. Stand-off Raman spectroscopic detection of minerals on planetary surfaces. Spectrochim. Acta A 2003, 59, 2391–2407. [Google Scholar] [CrossRef] [Green Version]
  50. Clegg, S.M.; Wiens, R.; Misra, A.K.; Sharma, S.K.; Lambert, J.; Bender, S.; Newell, R.; Nowak-Lovato, K.; Smrekar, S.; Dyar, M.D.; et al. Planetary geochemical investigations using Raman and laser-induced breakdown spectroscopy. Appl. Spectrosc. 2014, 68, 925–936. [Google Scholar] [CrossRef] [PubMed]
  51. Wiens, R.C.; Sharma, S.K.; Thompson, J.; Misra, A.; Lucey, P.G. Joint analyses by laser-induced breakdown spectroscopy (LIBS) and Raman spectroscopy at stand-off distances. Spectrochim. Acta A 2005, 61, 2324–2334. [Google Scholar] [CrossRef]
  52. Sharma, S.K.; Misra, A.K.; Lucey, P.G.; Wiens, R.G.; Clegg, S.M. Combined remote LIBS and Raman spectroscopy at 8.6 m of sulfur-containing minerals, and minerals coated with hematite or covered with basaltic dust. Spectrochim. Acta A 2007, 68, 1036–1045. [Google Scholar] [CrossRef]
  53. Guimbretière, G.; Canizarès, A.; Finzola, A.; Delcher, E.; Raimboux, N.; Di Muro, A.; Simon, P.; Devouard, B.; Bertil, A. Raman spectroscopy as suitable tool for the field study of recent volcanic environments. J. Raman Spectrosc. 2016, 47, 740–742. [Google Scholar] [CrossRef]
  54. Hutchinson, I.; McHugh, M.; Lerman, H.; Ingley, R.; Edwards, H.; Moral, A.; Ramos, G.; Perez, C.; Malherbe, C.; Wang, A. Spectrometer Development for Planetary and Terrestrial Exploration. In Proceedings of the XIII International Conference GeoRaman, Catania, Italy, 10–14 June 2018. [Google Scholar]
  55. Rees, J.M.; Bonafous, M.; Lapauw, L.; Humeau, O.; Fouchet, T.; Bernardi, P.; Cais, P.; Deleuze, M.; Forni, O.; Maurice, S.; et al. The SuperCam infrared instrument on the NASA MARS2020 mission: Performance and qualification results. Int. Conf. Space Opt. 2018, 11180. [Google Scholar] [CrossRef]
  56. Acosta-Maeda, T.E.; Misra, A.K.; Muzangwa, L.G.; Berlanga, G.; Muchow, D.; Poerter, J.; Sharma, S.K. Remote Raman measurements of minerals, organics, and inorganics at 430 m range. Appl. Opt. 2016, 55, 10283–10289. [Google Scholar] [CrossRef]
  57. Berlanga, G.; Acosta-Maeda, T.E.; Sharma, S.K.; Porter, J.N.; Dera, P.; Shelton, H.; Taylor, G.J.; Misra, A. Remote Raman spectroscopy of natural rocks. Appl. Opt. 2019, 58, 8971–8980. [Google Scholar] [CrossRef]
  58. Porter, J.N.; Helsley, C.E.; Sharma, S.K.; Misra, A.K.; Bates, D.E.; Lienart, B.R. Two-dimensional standoff Raman measurements of distant samples. J. Raman Spectrosc. 2012, 43, 165–167. [Google Scholar] [CrossRef]
  59. Wu, M.; Ray, M.K.; Fung, H.; Ruckman, M.W.; Harder, D.; Sedllacek, A.J. Stand-off Detection of Chemicals by UV Raman Spectroscopy. Appl. Spectrsosc. 2000, 54, 800–806. [Google Scholar] [CrossRef]
  60. Pettersson, A.; Johansson, I.; Wallin, S.; Nordberg, M.; Ostmark, H. Near Real-Time Standoff Detection of Explosives in a Realistic Outdoor Environment at 55 m Distance. Propellants Explos. Protech. 2009, 34, 297. [Google Scholar] [CrossRef]
  61. Giordano, D. Advances in the rheology of natural multiphase silicate melts and implications for magma transport and lava flow emplacement. Ann. Geophys. 2019. [Google Scholar] [CrossRef]
  62. Simon, P.; Moulin, B.; Buixaderas, E.; Raimboux, N.; Herault, E.; Chazallon, B.; Cattey, H.; Magneron, N.; Oswalt, J.; Hocrelle, D. High temperatures and Raman scattering through pulsed spectroscopy and CCD detection. J. Raman Spectrosc. 2003, 34, 497–504. [Google Scholar] [CrossRef]
  63. Wunderlich, B. The ATHAS database on heat capacities of polymers. Pure Appl. Chem. 1995, 87, 1019–1026. [Google Scholar] [CrossRef]
  64. McMillan, P. Structural studies of silicate glasses and melts-applications and limitations of Raman spectroscopy. Am. Mineral. 1984, 69, 622–644. [Google Scholar]
  65. Colomban, P. Polymerization degree and Raman identification of ancient glasses used for jewelrym, ceramic enamels and mosaics. J. Non-Cryst. Solids 2003, 323, 180–187. [Google Scholar] [CrossRef]
  66. Colomban, P. On-site Raman identification and dating of ancient glasses: A review of procedures and tools. J. Cult. Herit. 2008, 9, e55–e60. [Google Scholar] [CrossRef]
  67. Bykov, V.N.; Koroleva, O.N.; Osipov, A.A. Structure of silicate melts: Raman spectroscopic data and thermodynamic simulation results. Geochem. Inter. 2009, 47, 1067. [Google Scholar] [CrossRef]
  68. Galeneer, F.L. Planar rings in glasses. Solid State Commun. 1982, 44, 1037–1040. [Google Scholar] [CrossRef]
  69. Neuville, D.; Mysen, B. Role of aluminium in the silicate network: In situ, high-temperature study of glasses and melts on the join SiO2-NaAlO2 Geochim. Cosmochim. Acta 1996, 60, 1727–1737. [Google Scholar] [CrossRef]
  70. Sharma, S.K.; Mammone, J.F.; Nicol, M.F. Raman investigation of ring configurations in vitreous silica. Nature 1981, 292, 140–141. [Google Scholar] [CrossRef]
  71. Matson, D.W.; Sharma, S.K.; Philpotts, J.A. The structure of high-silica alkali-silicate glasses. A Raman spectroscopic investigation. J. Non Cryst. Solids 1983, 56, 323–352. [Google Scholar] [CrossRef]
  72. Kalampounias, A.G.; Yannopoulos, S.N.; Papatheodorou, G.N. A high-temperature Raman spectroscopic investigation of the potassium tetrasilicate in glassy, supercooled, and liquid states. J. Chem. Phys. 2006, 125, 164502. [Google Scholar] [CrossRef] [PubMed]
  73. Seifert, F.; Mysen, B.O.; Virgo, D. Three-dimensional network structure of quenched melts (glass) in the systems SiO2–NaAlO2, SiO2–CaAl2O4 and SiO2–MgAl2O4. Am. Mineral. 1982, 67, 696–717. [Google Scholar]
  74. Mysen, B.O.; Finger, L.W.; Virgo, D.; Seifert, F.A. Curve-fitting of Raman spectra of silicate glasses. Am. Mineral. 1982, 67, 686–695. [Google Scholar]
  75. Ardia, P.; Di Muro, A.; Giordano, D.; Massare, D.; Sanchez-Valle, C.; Schmidt, M.W. Densification mechanisms of haplogranite glasses as a function of water content and pressure based on density and Raman data. Geochim. Cosmochim. Acta 2014, 138, 158–180. [Google Scholar] [CrossRef] [Green Version]
  76. Le Losq, C.; Berry, A.J.; Kendrick, M.A.; Neuville, F.R.; O’Neill, H.C. Determination of the oxidation state of iron in Mid-Ocean Ridge basalt glasses by Raman spectroscopy. Am. Mineral. 2019, 104, 1032–1042. [Google Scholar] [CrossRef]
  77. Di Genova, D.; Caracciolo, A.; Kolzenburg, S. Measuring the degree of “nanotilization” of volcanic glasses: Understanding syn-eruptive processes recorded in melt inclusions. Lithos 2018, 318–319, 209–218. [Google Scholar] [CrossRef]
  78. Furukawa, T.; Fox, K.E.; White, W.B. Raman spectroscopic investigation of the structure of silicate glasses. III. Raman intensities and structural units in sodium silicate glasses. J. Chem. Phys. 1981, 75, 3226–3237. [Google Scholar] [CrossRef]
  79. Giordano, D.; Dingwell, D.B. Viscosity of hydrous Etna basalt: Implications for Plinian-style basaltic eruptions. Bull. Volcanol. 2003, 65, 8–14. [Google Scholar] [CrossRef]
  80. González-García, D.; Behrens, H.; Petrelli, M.; Vetere, F.; Morgavi, D.; Zhang, C.; Perugini, D. Water-enhacned interdiffusion of major elements between natural shoshonite and high-K rhyolite melts. Chem. Geol. 2017, 466, 86–101. [Google Scholar] [CrossRef] [Green Version]
Figure 1. Raman spectra of four natural multicomponent glasses representative of volcanic rock compositions in the Earth: a basalt from Etna (ETN), a andesite from Mounserrat (MST), a dacite from Unzen (UNZ) and a rhyolite from Lipari Island (LIP). (A) Raw spectra with their main characteristic bands (low wavenumber, LW; medium wavenumber, MW and high wavenumber, HW). Dashed lines are cubic baselines, as commonly used in spectra processing. (B) Baselined and smoothed spectra highlighting how the LW, MW and HW bands change in shape and peak position with evolving glass composition from basalt to rhyolite. Figure modified from [2].
Remotesensing 12 00805 g001
Figure 2. Relationships between the compositional pseudo structural parameters (SM, NBO/T) (a) and VFT constitutive parameters (BVFT, CVFT) as a function of the Raman ratio (R) (b,c) (R514.5 in the figure). Model VFT parameters BVFT (R) and CVFT (R) as defined by [34] and relationships between pseudo-structural parameters According to [34]: BVFT (R) = b1Rb2 and CVFT (R) = c1Rc2+c3 where b1, b2, c1, c2, c3 are adjustable parameters.
Remotesensing 12 00805 g002
Figure 3. Raman spectra taken at different distances (from 1.5 to 7 m) using an handheld Raman spectrometer and a 25 cm focal lens, in a dark room (a) or in presence of external illumination (b). The setup during measurements at 7 m is shown in (c)
Remotesensing 12 00805 g003

