Responses of Seasonal Indicators to Extreme Droughts in Southwest China
by
 , , , , and
Peiyu Lai
1,2,3,†, 
Miao Zhang
4,†,
Zhongxi Ge
1,2,3,
Binfei Hao
1,2,3,
Zengjing Song
1,2,3,
Jing Huang
1,2,3,
Mingguo Ma
1,2,3,
Hong Yang
1,5 and
Xujun Han
1,2,3,* 1
Chongqing Engineering Research Center for Remote Sensing Big Data Application, School of Geographical Sciences, Southwest University, Chongqing 400715, China
2
Southwest University, School of Geographical Sciences, Chongqing Jinfo Mountain Field Scientific Observation and Research Station for Karst Ecosystem, Ministry of Education, Chongqing 400715, China
3
State Cultivation Base of Eco-Agriculture for Southwest Mountainous Land, Southwest University, Chongqing 400715, China
4
Northwest Land and Resources Research Center, Shaanxi Normal University, Xi’an 710119, China
5
Department of Geography and Environmental Science, University of Reading, Whiteknights, Reading RG6 6AB, UK
*
Author to whom correspondence should be addressed.
†
These authors contributed equally to this work and should be considered co-first authors.
Remote Sens. 2020, 12(5), 818; https://0-doi-org.brum.beds.ac.uk/10.3390/rs12050818
Submission received: 9 February 2020
/
Revised: 28 February 2020
/
Accepted: 1 March 2020
/
Published: 3 March 2020
(This article belongs to the Collection Google Earth Engine Applications)
Abstract
:Significant impact of extreme droughts on human society and ecosystem has occurred in many places of the world, for example, Southwest China (SWC). Considerable research concentrated on analyzing causes and effects of droughts in SWC, but few studies have examined seasonal indicators, such as variations of surface water and vegetation phenology. With the ongoing satellite missions, more and more earth observation data become available to environmental studies. Exploring the responses of seasonal indicators from satellite data to drought is helpful for the future drought forecast and management. This study analyzed the seasonal responses of surface water and vegetation phenology to drought in SWC using the multi-source data including Seasonal Water Area (SWA), Permanent Water Area (PWA), Start of Season (SOS), End of Season (EOS), Length of Season (LOS), precipitation, temperature, solar radiation, evapotranspiration, the Palmer Drought Severity Index (PDSI), the Normalized Difference Vegetation Index (NDVI), the Enhanced Vegetation Index (EVI), Gross Primary Productivity (GPP) and data from water conservancy construction. The results showed that SWA and LOS effectively revealed the development and recovery of droughts. There were two obvious drought periods from 2000 to 2017. In the first period (from August 2003 to June 2007), SWA decreased by 11.81% and LOS shortened by 5 days. They reduced by 21.04% and 9 days respectively in the second period (from September 2009 to June 2014), which indicated that there are more severe droughts in the second period. The SOS during two drought periods delayed by 3~6 days in spring, while the EOS advanced 1~3 days in autumn. All of PDSI, SWA and LOS could reflect the period of droughts in SWC, but the LOS and PDSI were very sensitive to the meteorological events, such as precipitation and temperature, while the SWA performed a more stable reaction to drought and could be a good indicator for the drought periodicity. This made it possible for using SWA in drought forecast because of the strong correlation between SWA and drought. Our results improved the understanding of seasonal responses to extreme droughts in SWC, which will be helpful to the drought monitoring and mitigation for different seasons in this ecologically fragile region.
1. Introduction
Extreme weather events, for example, droughts and floods, have occurred more frequently in the world over the past decades, with serious impacts on human society and ecosystem [1]. In particular, several heavy drought events have hit Southwest China (SWC) in the summer of 2006, from the autumn of 2009 to the spring of 2010 and the late summer of 2011, being a record-breaking drought event during the last 50 years [2,3]. Frequent droughts have caused serious damage to water resources [4], ecosystems [5], agriculture [6,7] and the whole society [8] in SWC and beyond. Especially, droughts can greatly dry up rivers and ponds, reduce drinking water and affect vegetation, with the consequence of reducing vegetation productivity, increasing tree mortality and causing a massive agricultural reduction and even famine [4,9,10,11,12]. The above three droughts cumulatively impacted the drinking water for more than 46 million people and the total economic losses exceeded 40 billion RMB [13,14,15].
High-frequency drought events and catastrophic damage have increasingly attracted the attention from the government and academia. Considerable researchers explored the characteristics as well as the physical causes and significant influence of droughts in SWC [8,16]. Characteristics of drought are commonly measured in terms of duration, intensity, severity and spatial extent [17,18]. Drought indices play an important role in identifying and quantifying drought and are recognized as the best approach for obtaining a measure of relative wetness or dryness [19,20,21]. The commonly used drought indices include the Palmer Drought Severity Index (PDSI), the Standardized Precipitation Evapotranspiration Index (SPEI), the Standardized Precipitation Index (SPI), the Vegetation Health Index (VHI) and the Temperature Vegetation Drought Index (TDVI) [11,21,22,23,24,25]. With the advantage of taking account of the cumulative effect of moisture supply and demand, PDSI has been widely used in drought studies all over the world [26]. In SWC, drought indices including PDSI, SPI, SPEI and others have been successfully applied in drought studies [27,28]. Extreme droughts are often caused by serious rainfall deficit and sustained high temperature, which were related to the anomaly of Western Pacific Subtropical High (WPSH) in SWC [28,29,30,31]. Lack of moisture and warmer temperature in troposphere made air hard to be saturated and form rain [31,32]. Additionally, a positive correlation between the Arctic Oscillation (AO) index and precipitation in SWC indicates that a negative phase of the AO may bring drought to the region [13,31]. Regarding the influence of drought, response of vegetation to drought is one of hot topics. Some studies have documented the influence or recovery of drought to different types of vegetation, different periods of growth time, different stages of drought and different places [33,34,35,36]. For example, savannas, croplands and mixed forests were more vulnerable to drought than deciduous forests and grasslands, while evergreen forests were more resistant to droughts and even were not influenced in the early period of drought [10,36]. When it comes to recovery of drought, studies in the United States found that drought recovery duration indicates a positive correlation with drought severity and duration, but a negative relationship with gross primary productivity (GPP) [37,38]. Moreover, vegetation greenness is more susceptible to drought than productivity, and more than 65% of vegetation can be restored within three months in SWC [12]. In terms of the response of surface water to drought, ecosystem water-use efficiency (WUE) was found different trends in response to severe drought episodes with a pattern of a decrease in the Northern Hemisphere and an increase in the Southern Hemisphere [37]. Another study found that terrestrial water storage in drought years deficit up to hundreds of gig tons in SWC [4]. Very few studies paid attention to changes of surface water during drought.
In addition, seasonal indicators are important, because any change of seasonality made by drought could have large impact on ecosystems [39]. Research on seasonal indicators and drought periodicity will provide theoretical basis for formulating drought mitigation plans and improving disaster reduction practice, particularly with the exacerbating extreme weather in the coming decades [40,41]. However, until now, the responses of seasonal indicators including vegetation phenology and seasonal variations of surface water to drought are still unknown. Vegetation phenology represents the key trait of an ecosystem, and its resistance to drought can estimate the stability of an ecosystem and reflect the feature of droughts [42]. Furthermore, droughts can influence the area and volume of surface water and the biological processes in aquatic ecosystems [9,43]. Seasonal surface water plays an important part in drought process. Moreover, the surface water of SWC plays an important role in people’s life for living and agriculture, etc. Thus, the changes of surface water could be strongly correlated to the drought. The new data of surface water area from long-time series of satellite images have been released due to the development of big data and cloud computing. The new data give us the new opportunity to fill the knowledge gap of seasonal indicators of droughts in SWC. This study made the effort to apply seasonal surface water and vegetation phenology as seasonal indicators to analyze the responses of vegetation and surface water to different droughts in SWC. Meteorological data, social statistical data and PDSI were also used to analyze the droughts in SWC from 2000 to 2017. The main aims of this study are to: (1) Analyze the responses of seasonal indicators to droughts in SWC; (2) Compare the difference of responses between seasonal indicators.
2. Materials and Methods
2.1. Study Area
SWC is a typically subtropical and karst-intensive region, influenced by the Asian monsoon climate. Karst landforms are susceptible to environmental change and human activity, leading to serious soil erosion and ecological degradation. Especially, rocky desertification has been a big problem in SWC [44]. In this paper, the study area includes part of Yunnan Province, Guizhou Province and Chongqing Municipality, as well as northwestern Guangxi Province and southeastern Sichuan Province (inside the red polygon in Figure 1). Several studies have already identified the spatial distribution of the three droughts based on drought indices [12,28,29,45,46,47]. Different from early studies, this study selected the major region affected by all three droughts (in summer 2006, 2009/2010 and 2011/2012) as our study area. The total area is 477121.85 km2 and nearly half (47.77%) is Karst with the average annual temperature of 14.62~15.73℃ and the average annual precipitation of 888.33~1619.88 mm.
2.2. Data Collection and Processing
Multi-source data including rainfall, temperature, evapotranspiration, solar radiation, PDSI, water facilities, variables of vegetation phenology and surface water from meteorological observation, remote sensing observation, statistics and simulated assimilation were employed in this study. Table 1 summarized all the data used throughout this study and their characteristics. Due to data limitation and the frequent droughts happened after 2000 [48], this study focused on the recent period of 2000~2017. Some datasets were pre-processed on the Google Earth Engine (GEE) cloud-based platform, which provides a consolidated environment including a large amount of data catalogue and superior computing ability [49,50,51].
2.2.1. Surface Water Data
High-resolution data of global surface water dataset finished by the Joint Research Centre and shared on GEE (https://developers.google.com/earthengine/datasets/catalog/JRC_GSW1_1_GlobalSurfaceWater) was used in this study. The dataset was generated using the images from Landsat 5, 7 and 8 and each pixel was individually classified into seasonal water, permanent water and no-water by an expert system. The seasonal water and permanent water were identified by the occurrence value detected throughout one year. For example, if water in a lake was present throughout the year, the lake was defined as permanent surface water. If the area of the lake shrank in a certain period of the year, the pixels along the lake borders did not represent water in some days of the year, and those pixels were considered as seasonal surface water [9]. With a spatial resolution of 30 meters, the surface water dataset was used to calculate the Seasonal Water Area (SWA) and Permanent Water Area (PWA).
2.2.2. Vegetation Data
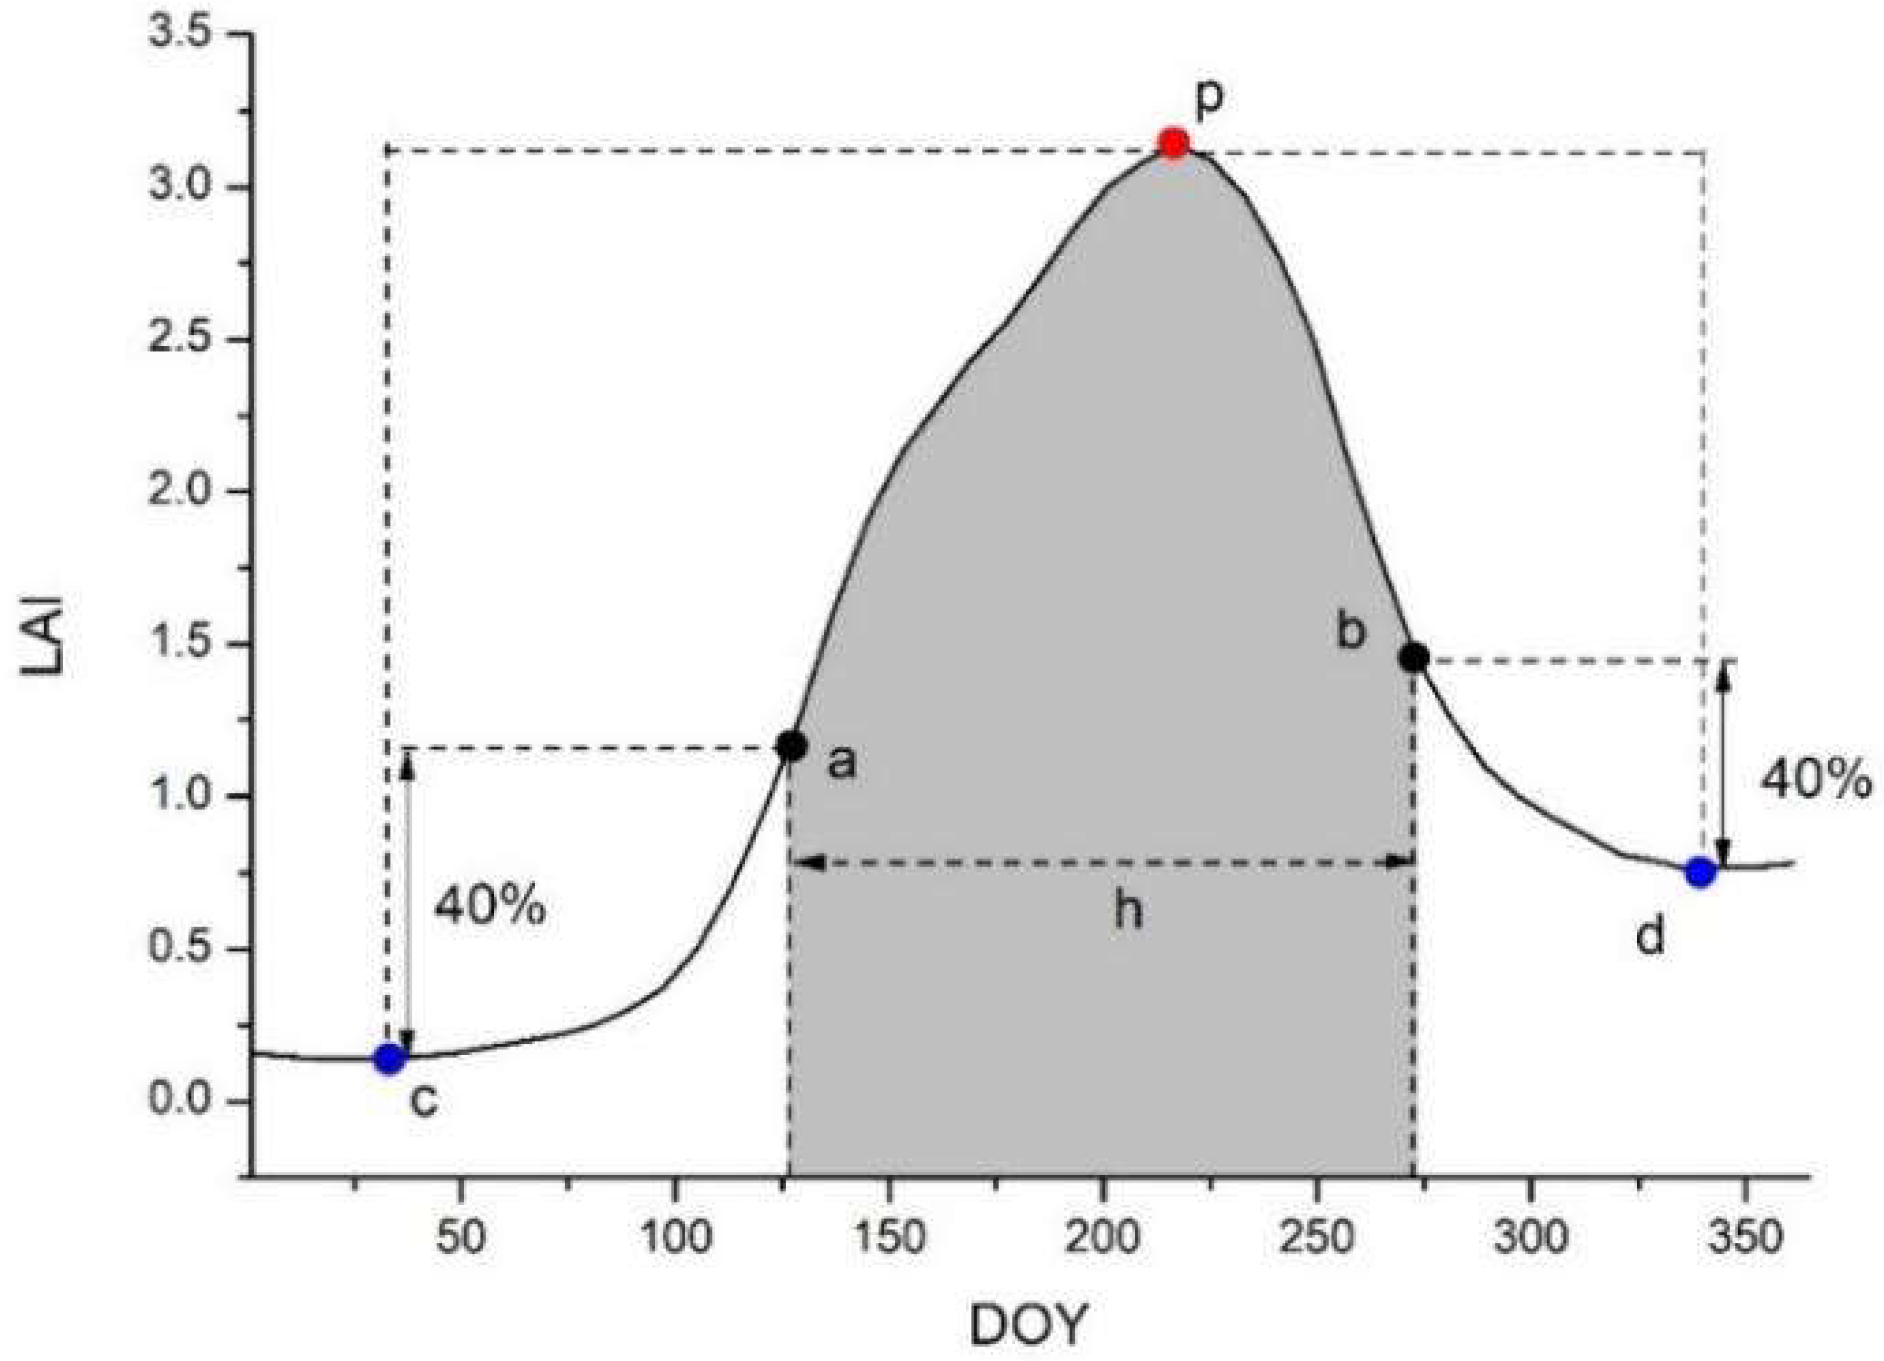
A total of six parameters were used to analyze the vegetation phenology derived from the Leaf Area index (LAI) (Figure 2). The parameters of the growing season were extracted from LAI image series in TIMESAT 3.3 software by the Dynamic Threshold method, which is suitable for studying phenology by eliminating the influence of background and vegetation types [52,53]. The Dynamic Threshold method defines the growth nodes by the ratio of the seasonal variations in LAI. In Figure 2, the curve represents the LAI series from the product of Global LAnd Surface Satellite (GLASS). A period between a minimum value (marked by “c” in Figure 2) and the next minimum value (marked by “d”) is defined as a growth season. Peak (marked by “p”) means the maximum value in a growth season. The Start of a Season (SOS) (marked by “a”) is defined from the curve at the time when the LAI has increased by 35% of the difference between (c) and (p). The parameter of 35% was selected referring to previous research [53,54,55]. The End of the Season (EOS) (marked by “b”) is defined in a similar way. Length of Season (LOS) (marked by “h”) means time between SOS and EOS [52].
LAI used in this study is the product of GLASS, a long-term and high-precision (0.05°) global surface remote sensing product based on multi-source remote sensing data and ground measured data [56,57]. It was obtained from National Earth System Science Data Sharing Infrastructure (http://www.geodata.cn/). This study excluded multiple growth seasons, such as multiple cropping, because crops only contributed 15.8% to the all vegetation in the study area. All vegetation types were regarded as one growth season every year. SOS, EOS and LOS were extracted for each pixel annually using TIMESAT software.
The Normalized Difference Vegetation Index (NDVI), the Enhanced Vegetation Index (EVI) and GPP were used to analyze the changes in vegetation due to droughts. NDVI and EVI were used to examine the vegetation greenness and GPP for productivity. Both NDVI and EVI data are from MOD13Q1 V6 product of Moderate-resolution Imaging Spectroradiometer (MODIS) with a spatial resolution of 250 meters and a temporal resolution of 16 days [58]. The MOD17A2H V6 GPP product used in this study is a cumulative 8-day composite with 500 meters resolution [59].
2.2.3. Meteorological data
Precipitation, air temperature, solar radiation, evapotranspiration (ET) and PDSI were considered as meteorological data in the current study. Precipitation, air temperature and solar radiation products from the Global Land Data Assimilation System (GLDAS) were integrated multiple satellite monitoring and model simulation results with a temporal resolution of 3 h and a spatial resolution of 0.25° [60]. ET data came from MODIS Global Terrestrial Evapotranspiration product (MOD16A2.V105), which is based on composites of 8 days (pixel value of the ET data is the sum of 8 days), 1 kilometer ET data [61]. The ET value is the sum of evaporation and plant transpiration from the earth’s surface to the atmosphere.
PDSI derived from temperature, precipitation and soil moisture was used in this study to compare with dry or wet conditions performed by seasonal indicators [25,62]. The gridded PDSI dataset comes from Terra Climate (Monthly Climate and Climatic Water Balance for Global Terrestrial Surfaces) dataset, which is at 0.04° spatial resolution and monthly time step (https://developers.google.com/earthengine/datasets/catalog/IDAHO_EPSCOR_TERRACLIMATE) [63]. Comprehensive consideration of soil moisture and the total water balance makes PDSI a very robust parameter for analyzing drought [26,64]. However, the disadvantage of PDSI affected by the selected calibration period may cause problems in the studies of long-term drought and periodicity [65]. As a standardized measure of surface moisture conditions, PDSI ranges from -10 (dry) to +10 (wet), that allows comparison between different regions at the spatiotemporal scale [66].
Referring to the published classification of moisture conditions [23,62], PDSI < -2 was defined as the start of a drought period. Drought developed with the continuous decrease in PDSI and the minimum of PDSI refers to most severe drought in the period, also the start of recovery. After that, PDSI rebounded. When PDSI > -2 again, the point was defined as the end of a drought period.
2.2.4. Human Activities
Data of water infrastructures were used to analyze the variations due to human activities, which influences the natural geographic process and ecosystem environment significantly. The number of reservoirs could reflect the strength of impact caused by hydraulic engineering. The data were from the China Statistical Yearbook with a scale of provincial administrative region [67].
2.2.5. Rate of SWA Reduction/Recovery
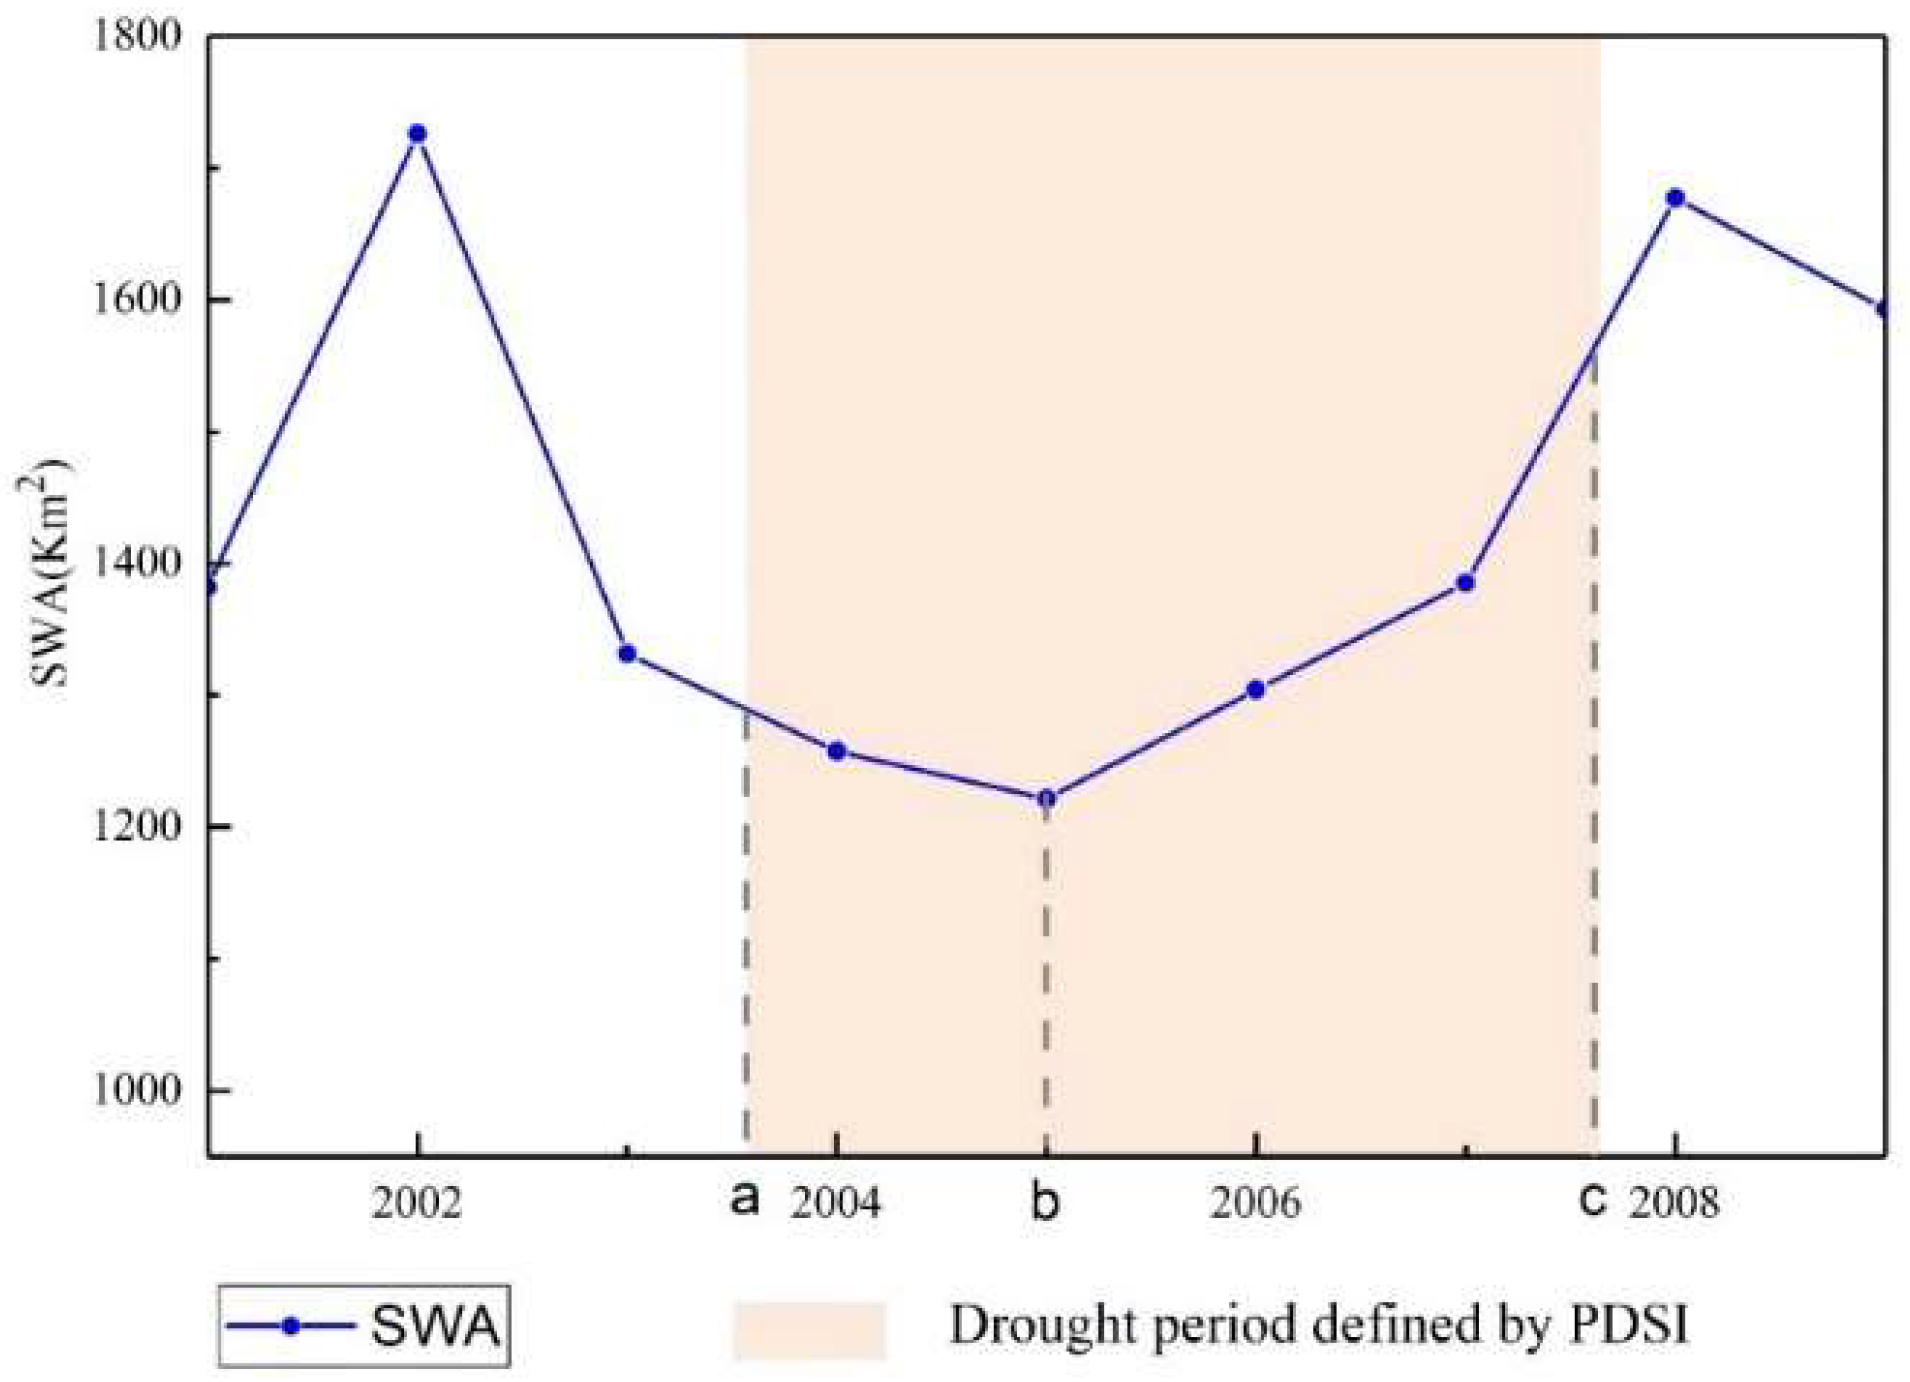
To accurately compare the drought periods, this study defined rate of SWA reduction (or recovery) as the ratio of the difference between the left (or right) maximum SWA value and the minimum SWA value in the drought period and the time of reduction (or recovery). The rates were calculated as following:
Key points are illustrated in Figure 3. Kreduce means the rate of SWA reduction in a drought period, SWAmax1 (marked as “a” in Figure 3) means the maximum SWA at the beginning of drought, SWAmin (marked as “b” in Figure 3) is the minimum SWA and Treduce (a~b) is time of reduction in a drought period. Similarly, Krecovery is the rate of recovery, SWAmax2 (marked as “c” in Figure 3) means another max SWA at the end of the drought period and Trecovery (b~c) is time of recovery in the period.
3. Results
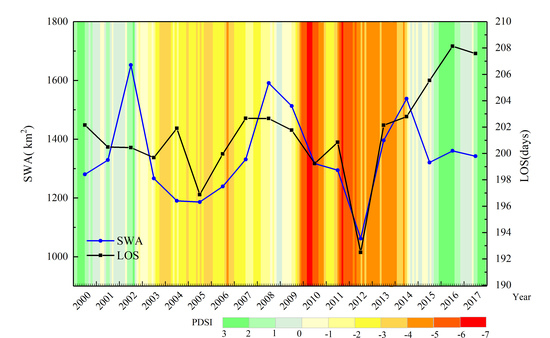
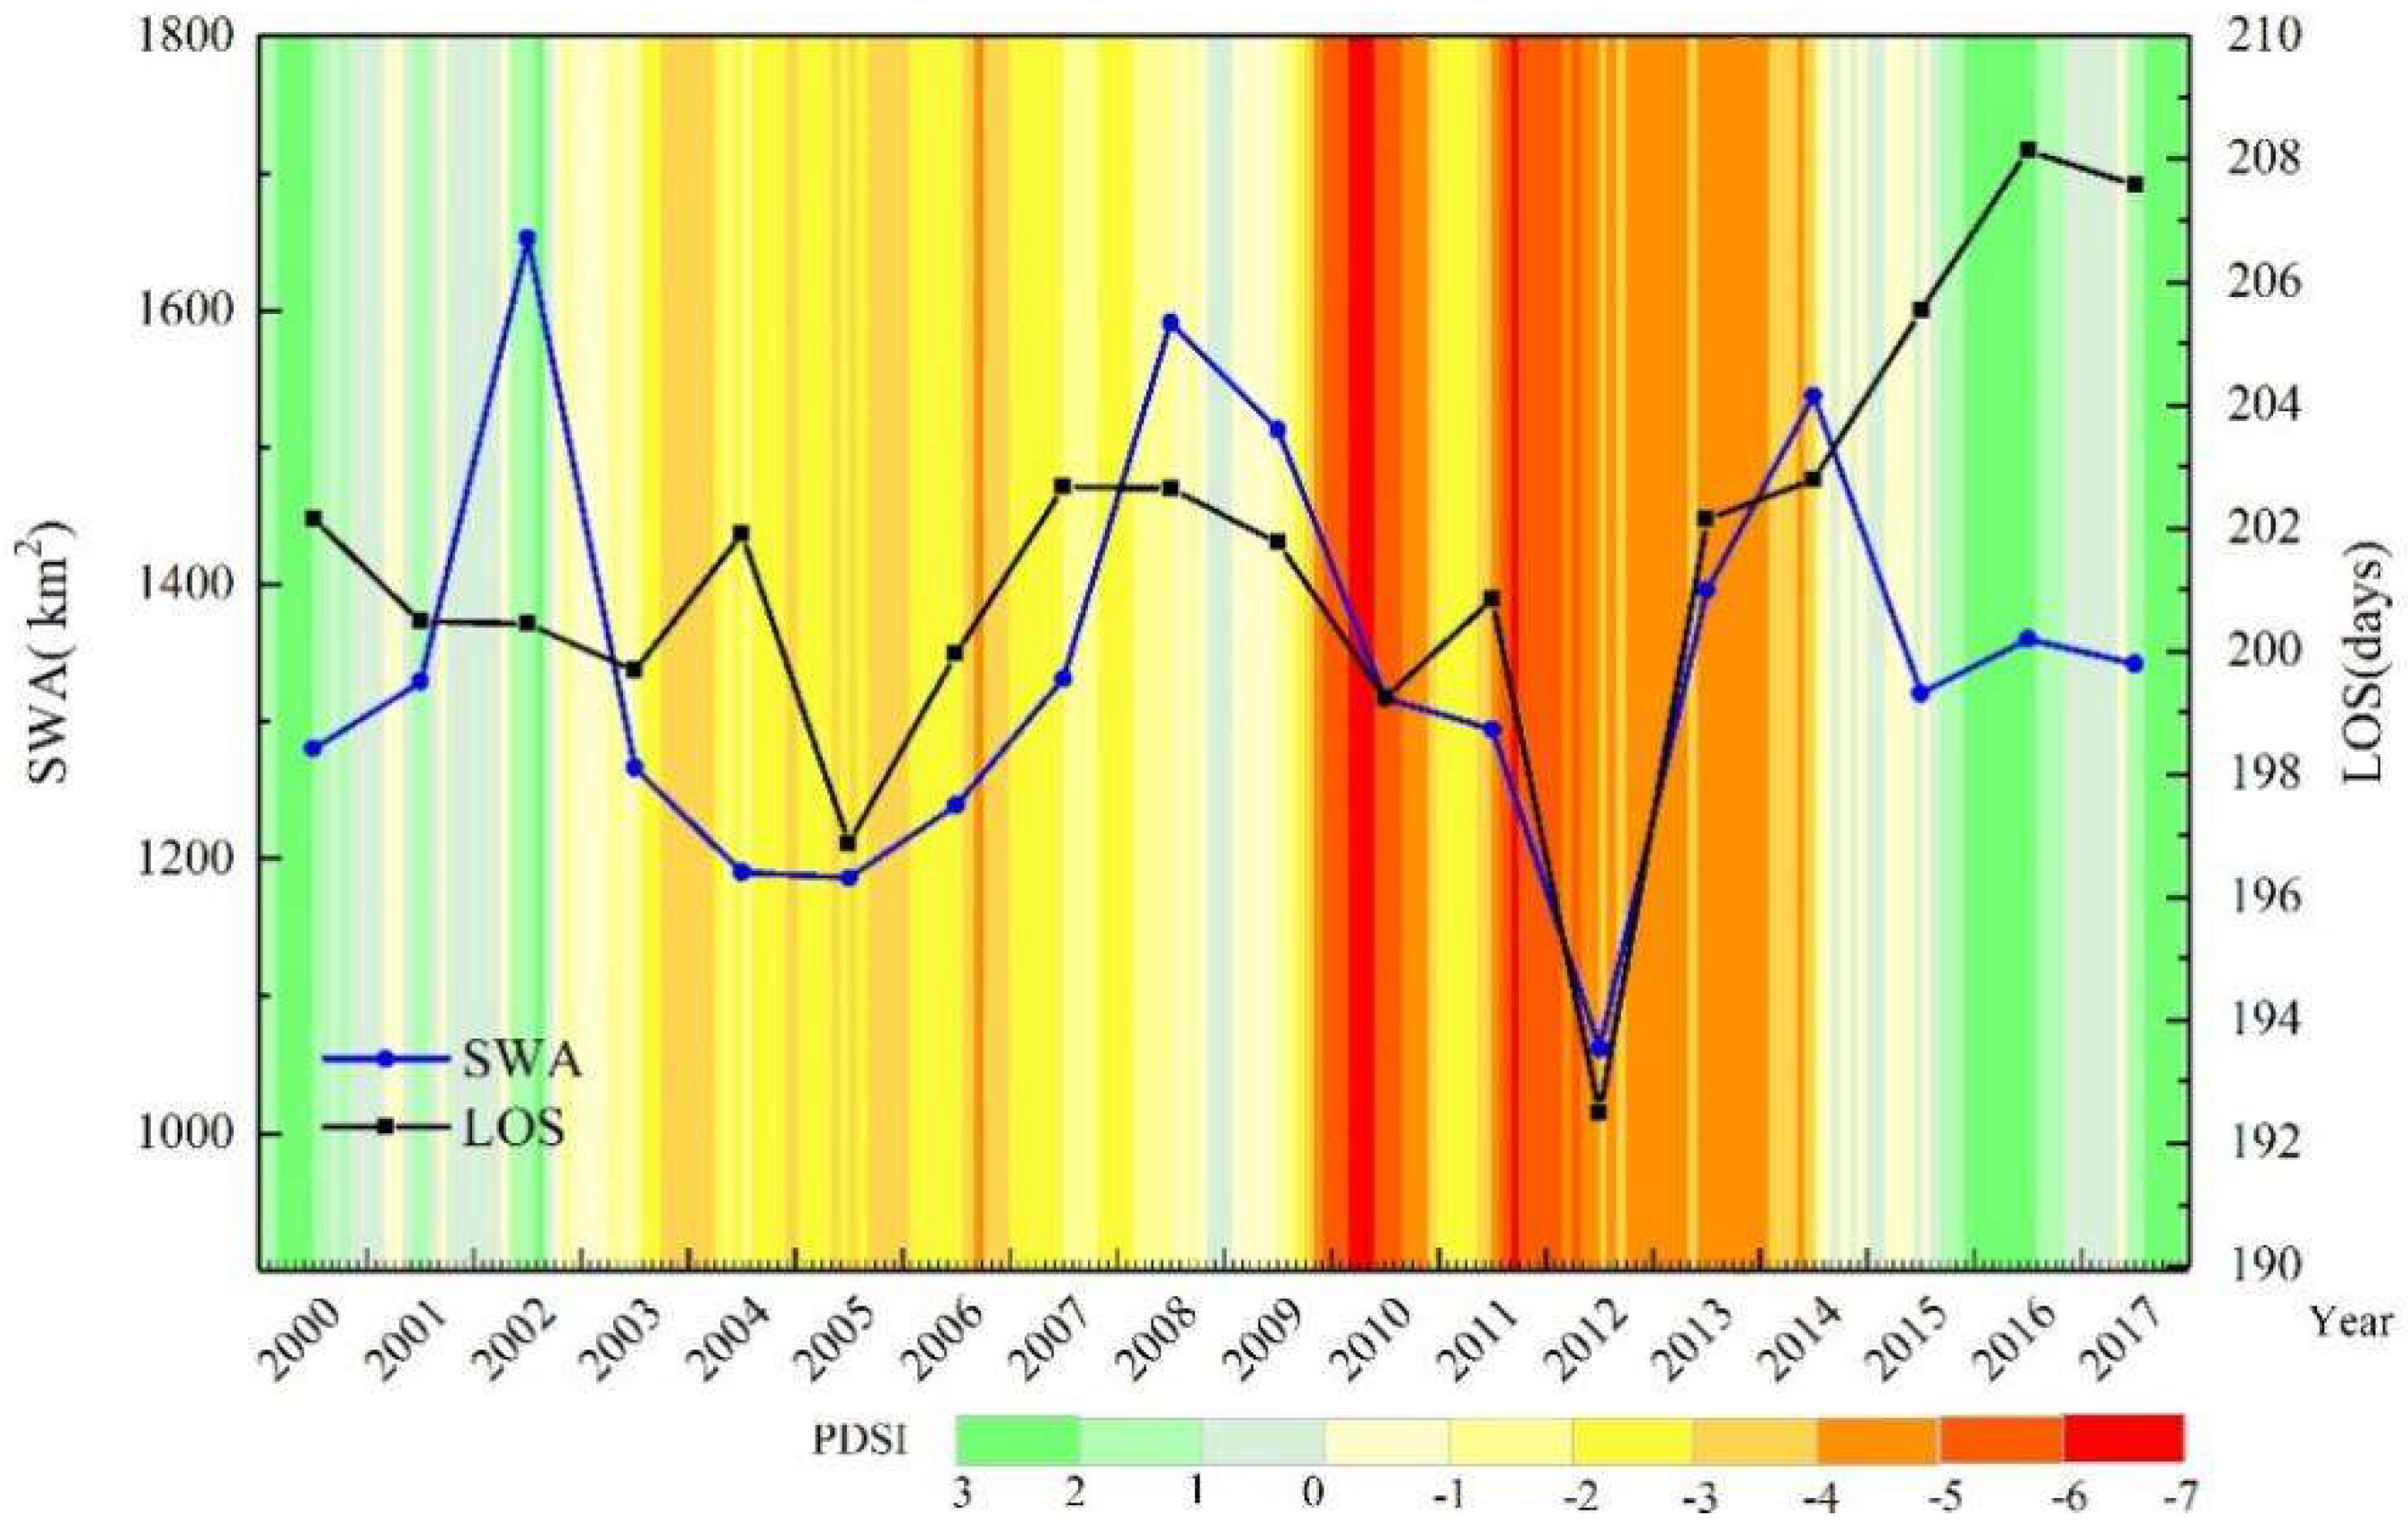
Two drought periods were drawn from PDSI in 2000~2017 (Figure 8). One was from August 2003 to June 2007, and the other was from September 2009 to June 2014. In first period, drought event in the summer of 2006 was captured. While, there were two drought events occurred in 2009~2010 and 2011~2012, respectively, in the second period. In each drought period, the month with minimum of PDSI was recognized as the most severe drought point in time, also the time when drought started to recover. They were September in 2006 and March in 2010.
3.1. Variations in Surface Water
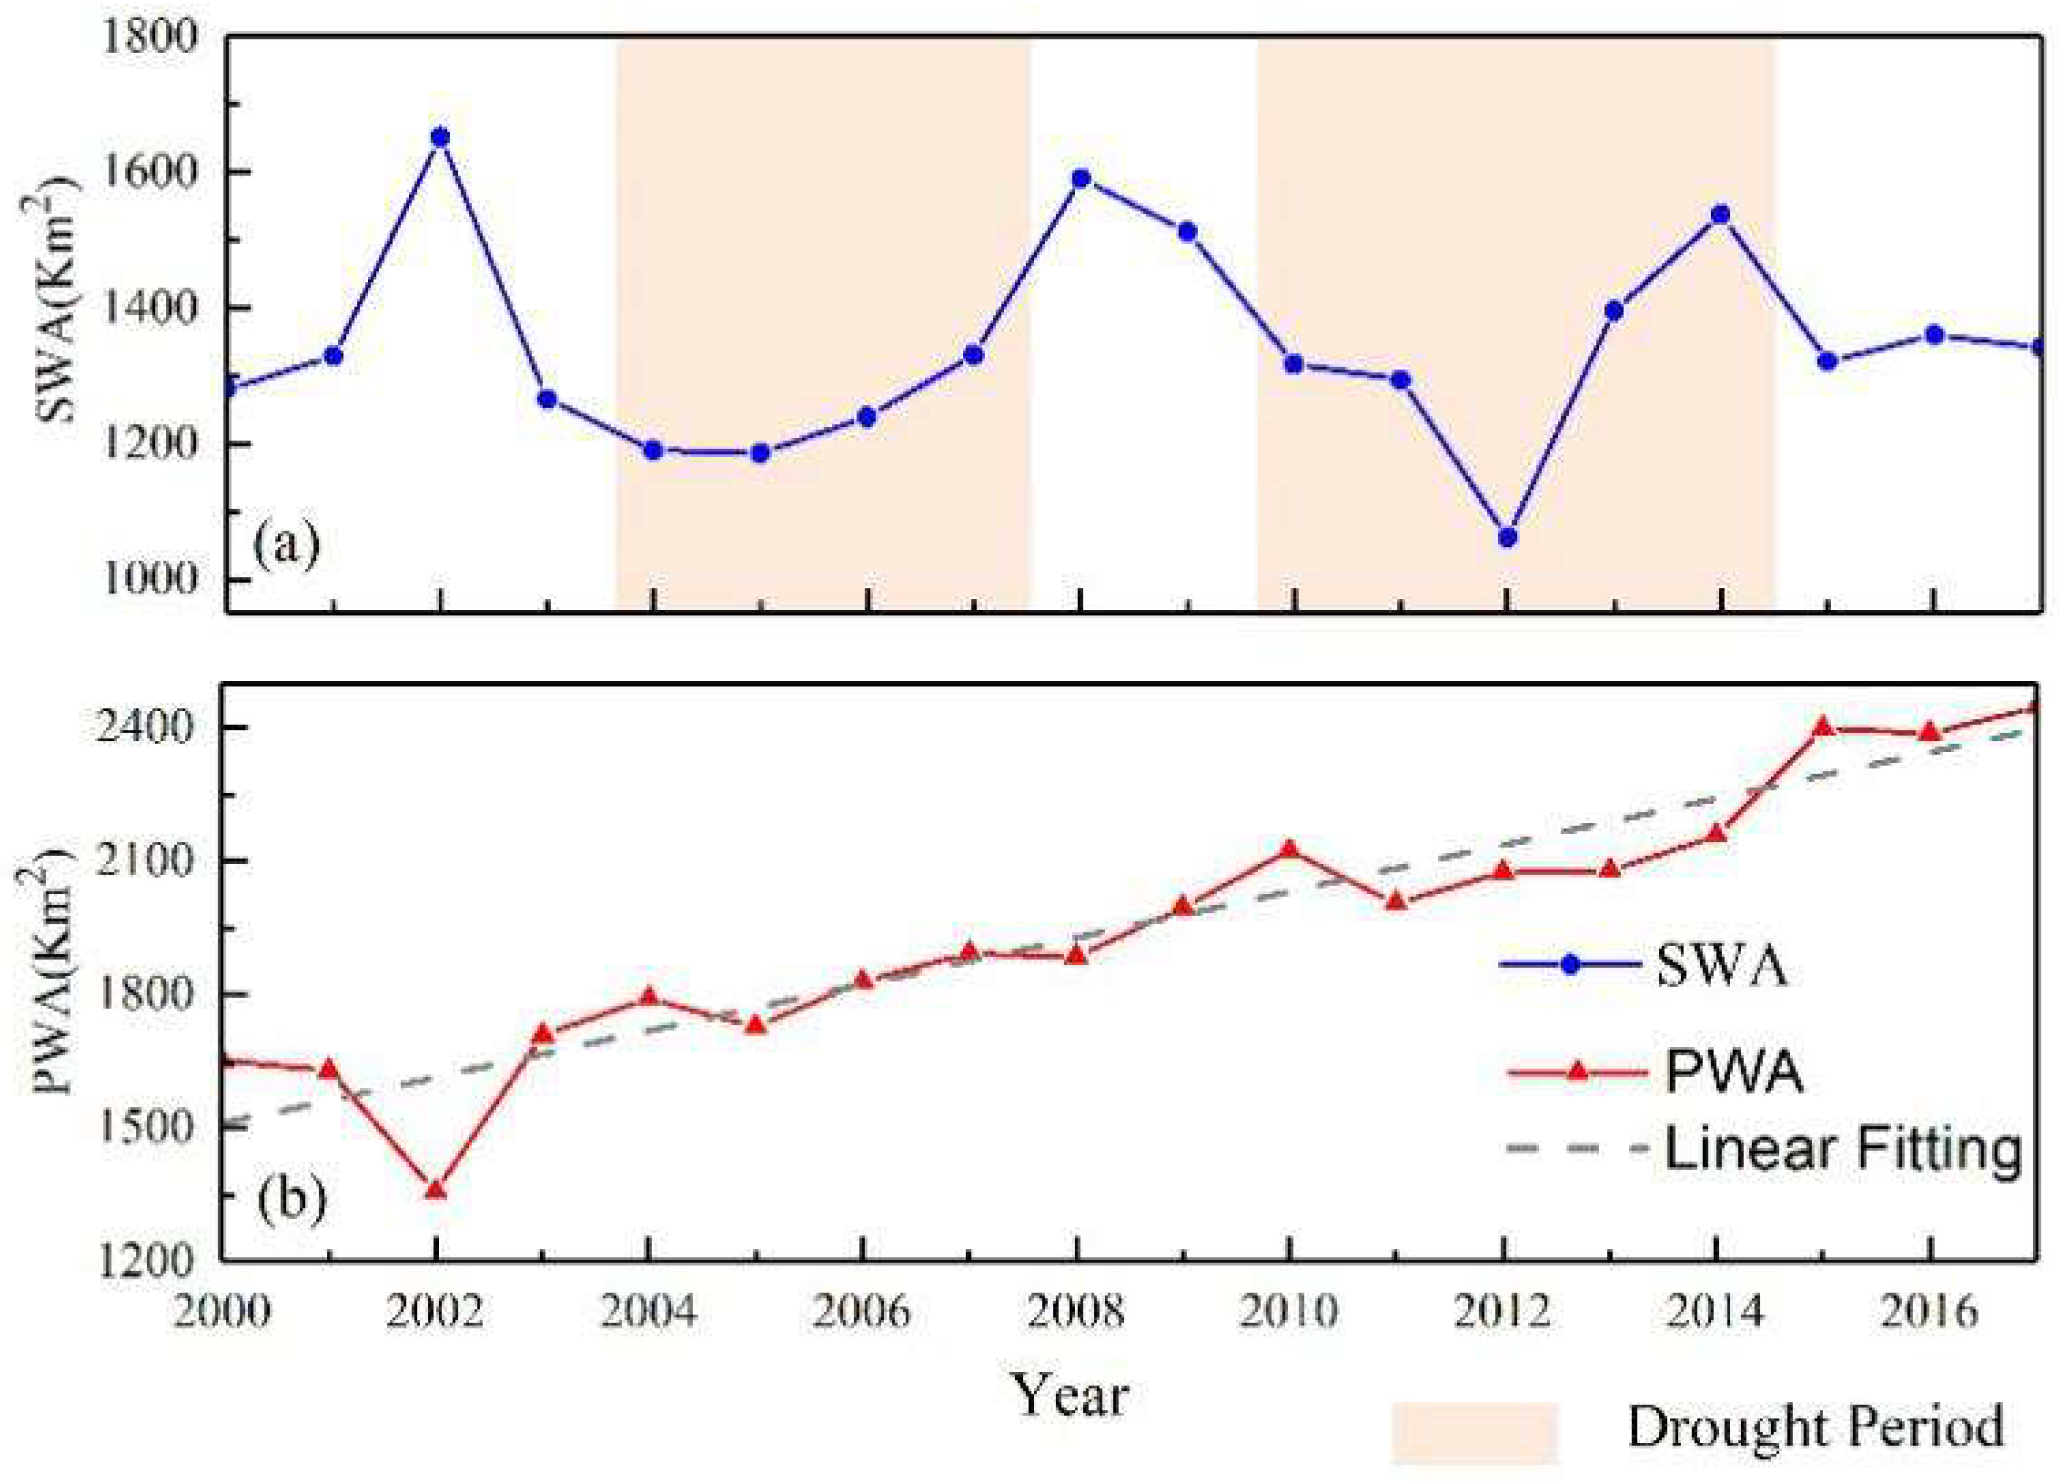
SWA and PWA in SWC from 2000 to 2017 were presented in Figure 4. Average SWA during the period of 2000~2017 was 1344.92 km2, with the maximum of 1652.27 km2 in 2002 and the minimum of 1061.92 km2 in 2012, which was 21.04% smaller than the average of SWA. Two periods also showed in the variations of SWA and SWA had significant fluctuations between normal years and drought years. Despite slight fluctuations of PWA in 2002, 2005 and 2011 affected by droughts, PWA continuously increased during the whole study period and totally increased 793.58 km2, which is the 48.03% of PWA at the beginning of year 2000.
Variations of SWA in two drought periods were shown in Table 2. During time of reduction, both the amplitude and speed of SWA reduction in the second period were much larger than those of the first period, indicating much serious droughts during the second period. In terms of recovery, both the magnitude and speed of SWA recovery in the latter period were also larger than those of the first one (Table 2).
3.2. Variations in Vegetation
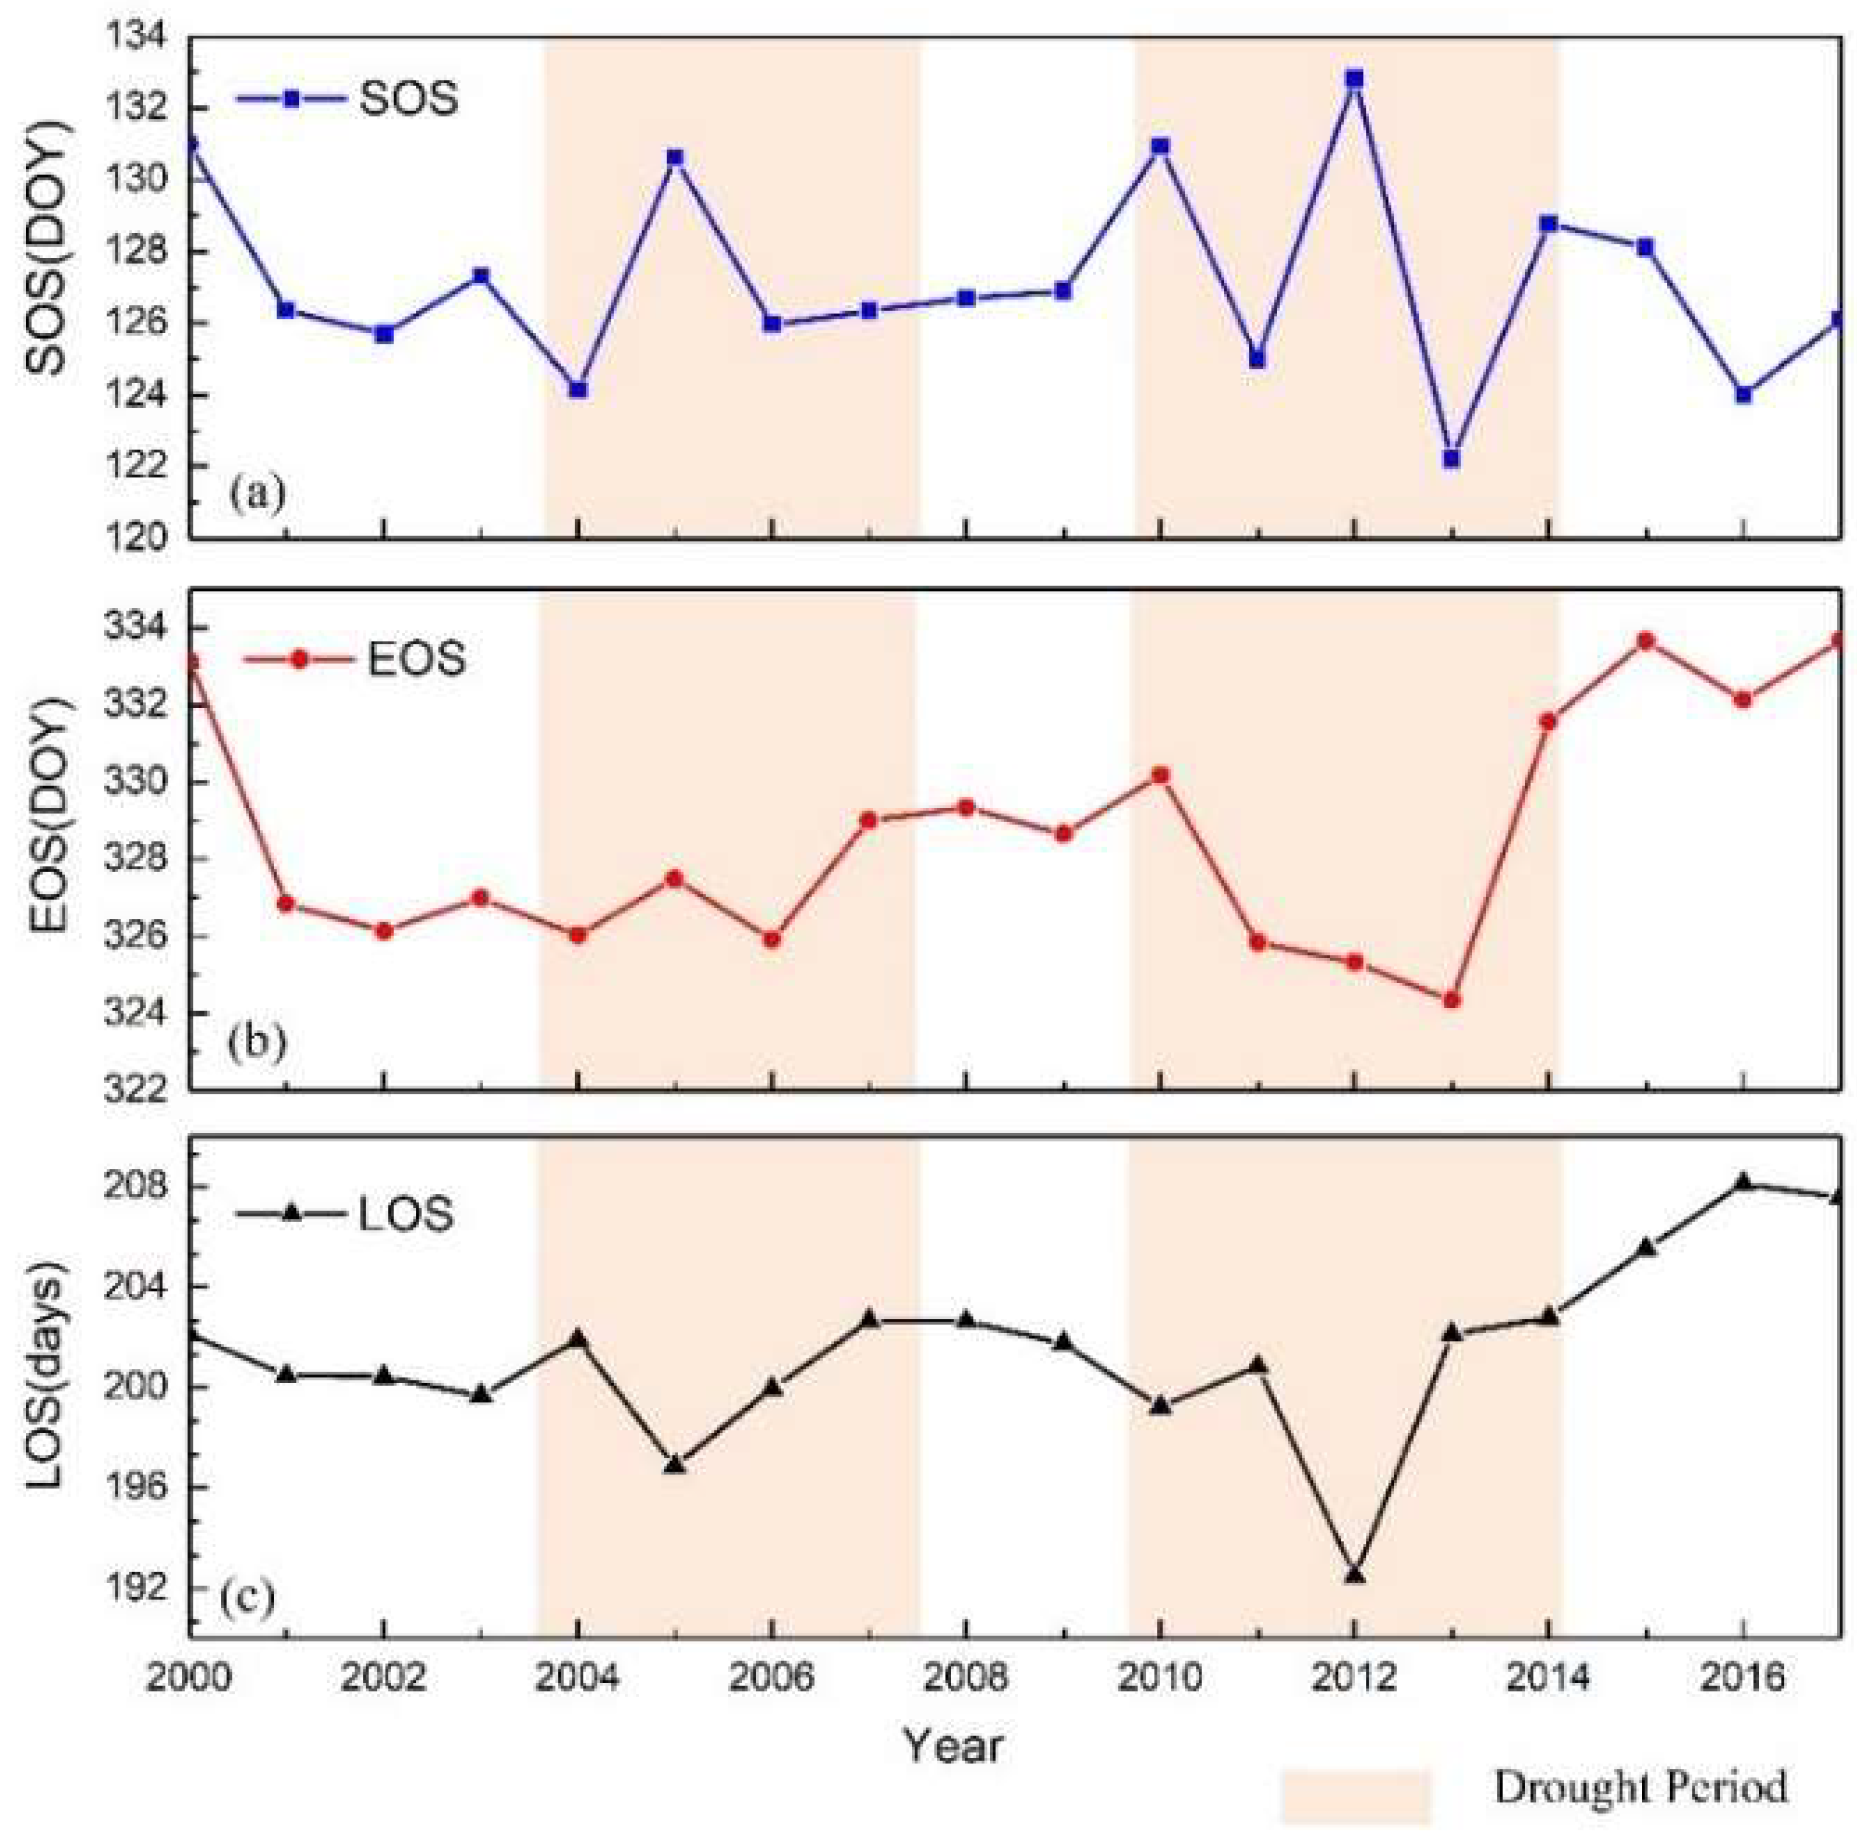
Variations of spatially averaged SOS, EOS and LOS are illustrated in Figure 5. All the parameters indicated obvious response of vegetation to the drought periods. The SOS generally fell in day of year (DOY) of 122~131 and they were sensitive to drought events with a delay of 3, 4, and 6 days in year 2005, 2010 and 2012, respectively. The EOS fell in DOY of 324~334, but they were in advanced for 4 days in 2011~2013. The average of LOS in the whole study period was 202 days. Two periods influenced by droughts also showed in the variations of LOS, and the LOS shortened by 5 and 9 days in 2005 and 2012, respectively, but with a slight increase in 2004 and 2011.
All the advance of EOS, delay of SOS and shorten of LOS suggested that droughts had a significant impact on vegetation phenology. It needs to be mentioned that the response of SOS and EOS to drought were not fully synchronized. The drought in spring generally delayed SOS, but the drought in autumn usually advanced EOS. For example, the drought in 2009 spanned from the autumn of 2009 to the spring of 2010, which made a slight advance of EOS in 2009 and a significant delay (4 days compared to average) in SOS of 2010. In another extreme drought period, which began in the summer of 2011 and lasted until the spring of next year, the EOS was shifted to an early date in 2011~2013 with the influence in two years, also postponed SOS for 6 days in 2012. All the three parameters sensitively and rapidly responded to droughts in SWC.
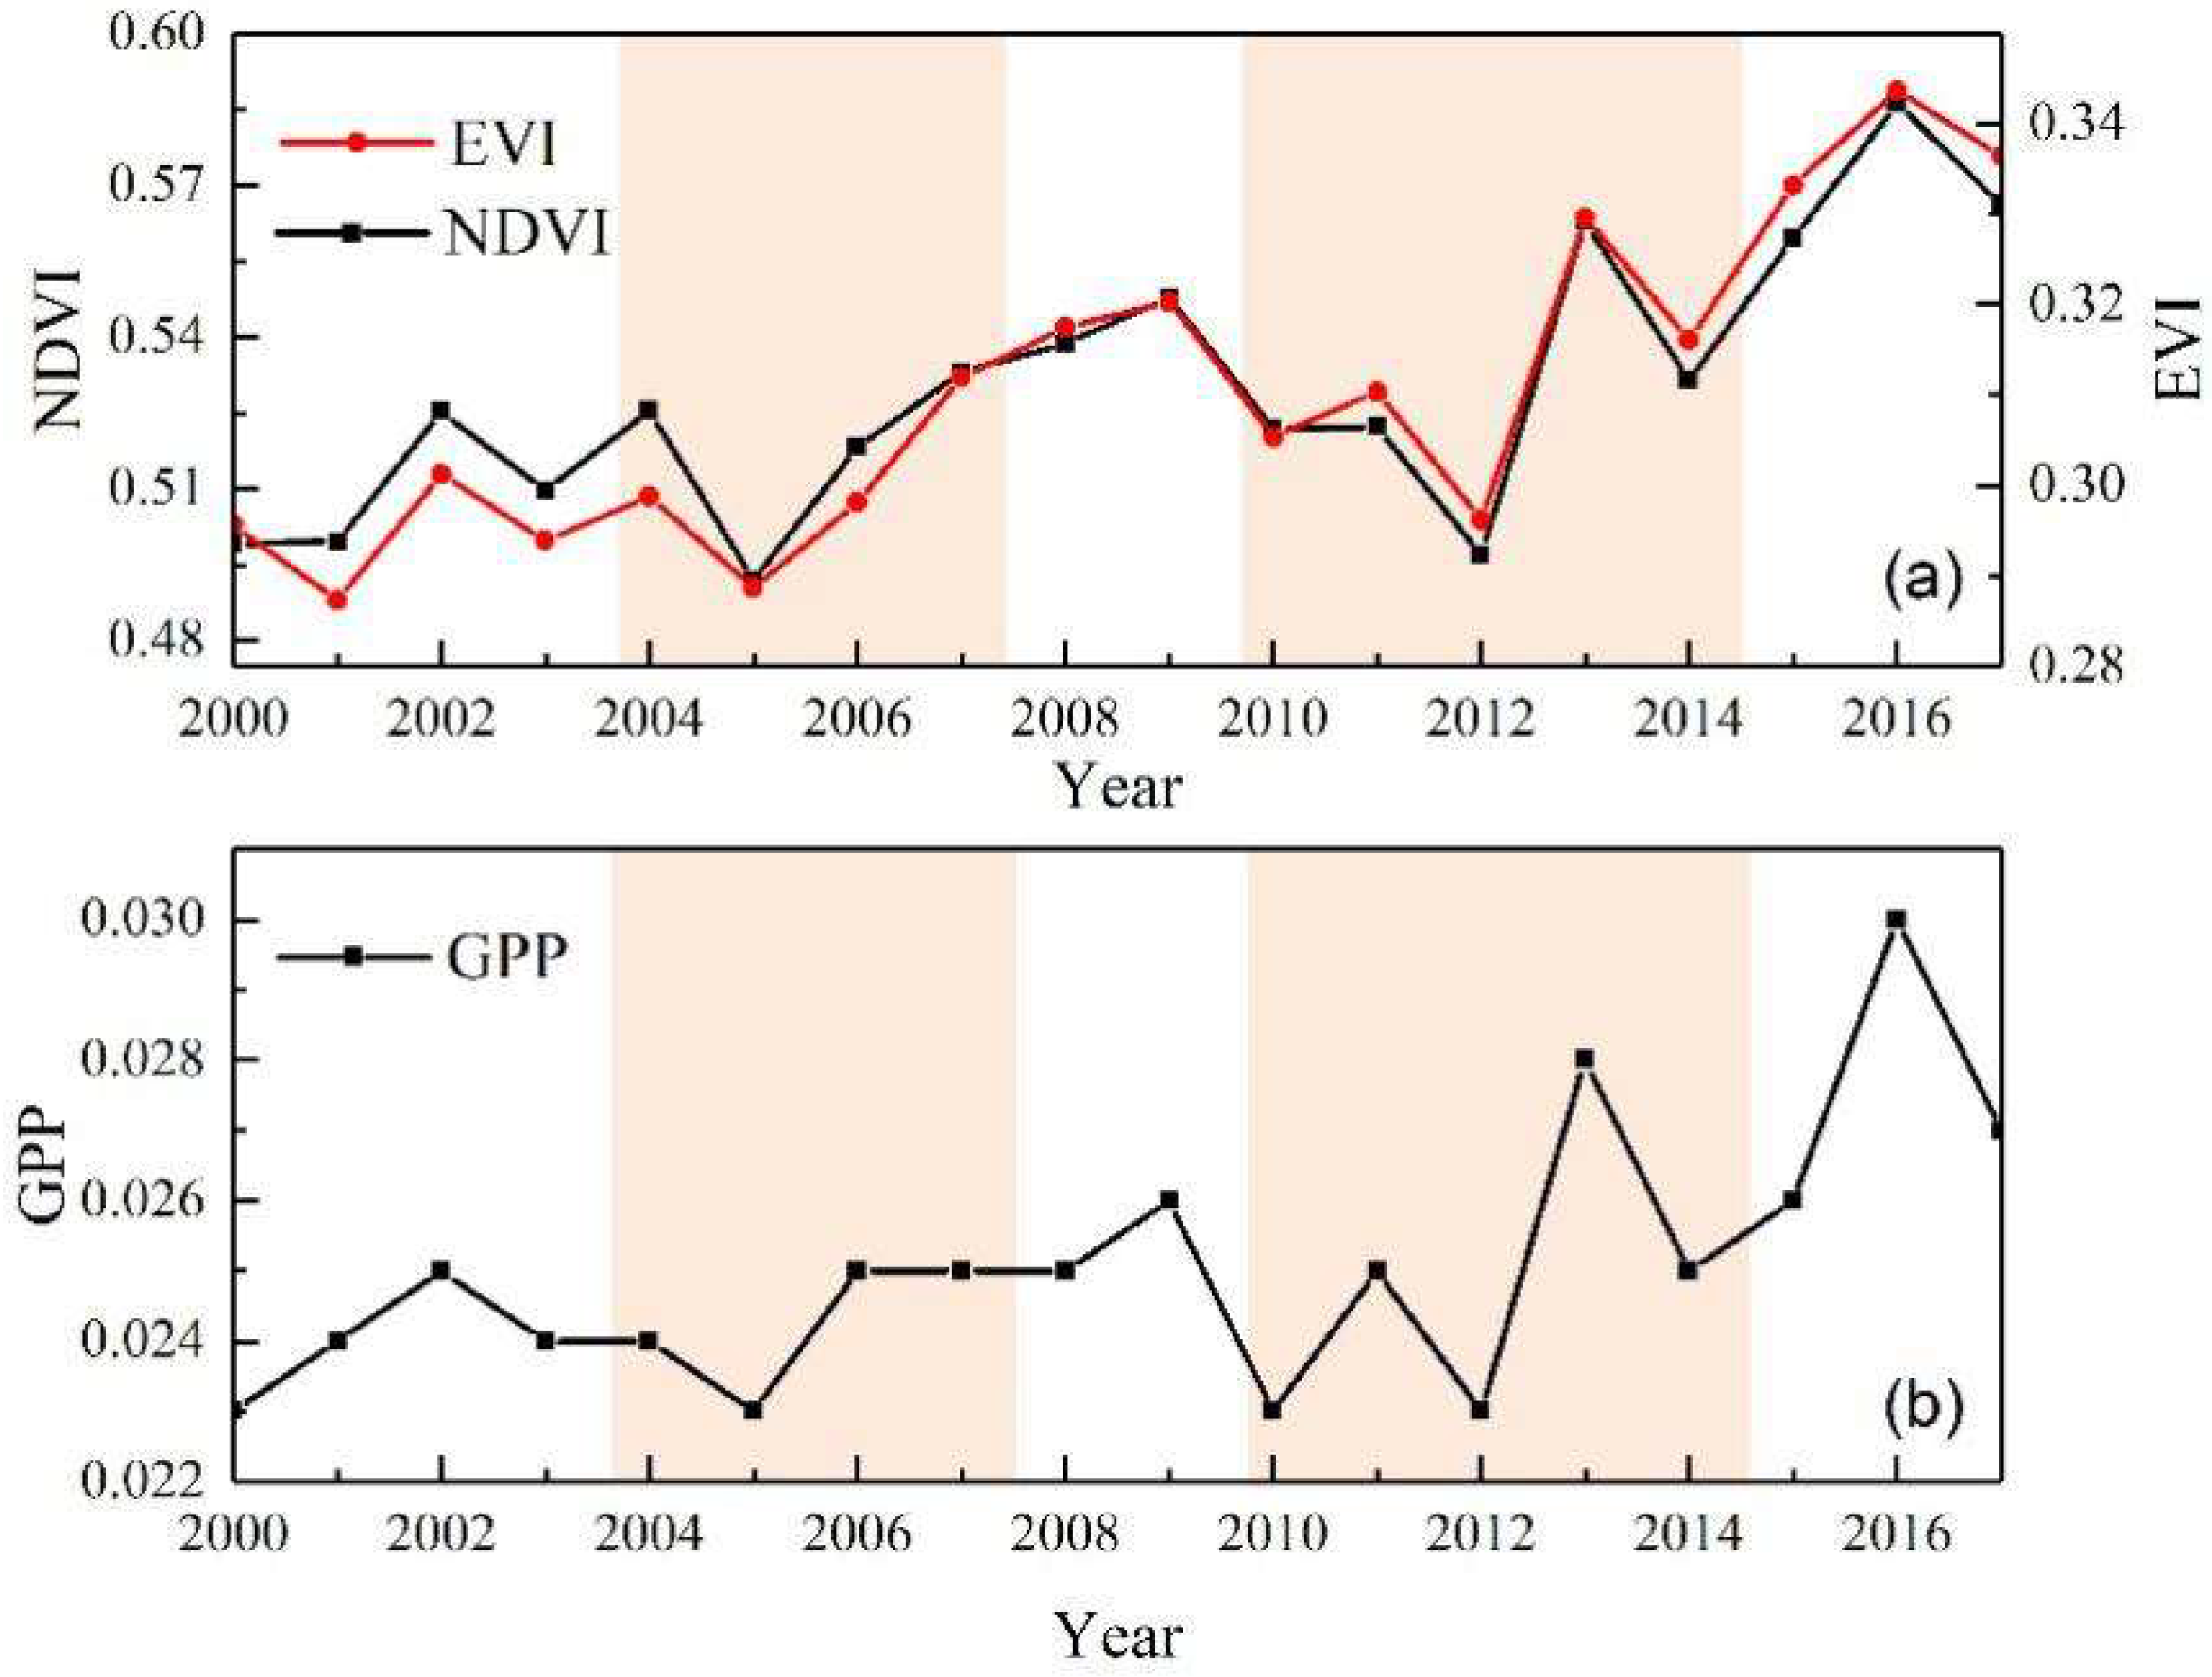
Vegetation indices and indicator of carbon cycle also reflected the influence of droughts to plants (Figure 6). Although all NDVI, EVI and GPP show the increasing trend in 2000~2017, they did sharply decline during drought years, such as 2005 and 2012. NDVI and EVI performed highly consistent with each other and GPP showed the same trend as NDVI and EVI, but different amplitude. Influences from droughts are different between greenness and productivity of vegetation, also different in the situations of recovery. An obvious difference is that the drought in 2012 made more reduction in greenness (NDVI and EVI) than that of 2010. While a decrease in productivity (GPP) by drought in 2010 was even as serious as impact made by drought in 2012.
3.3. Variations in Climate
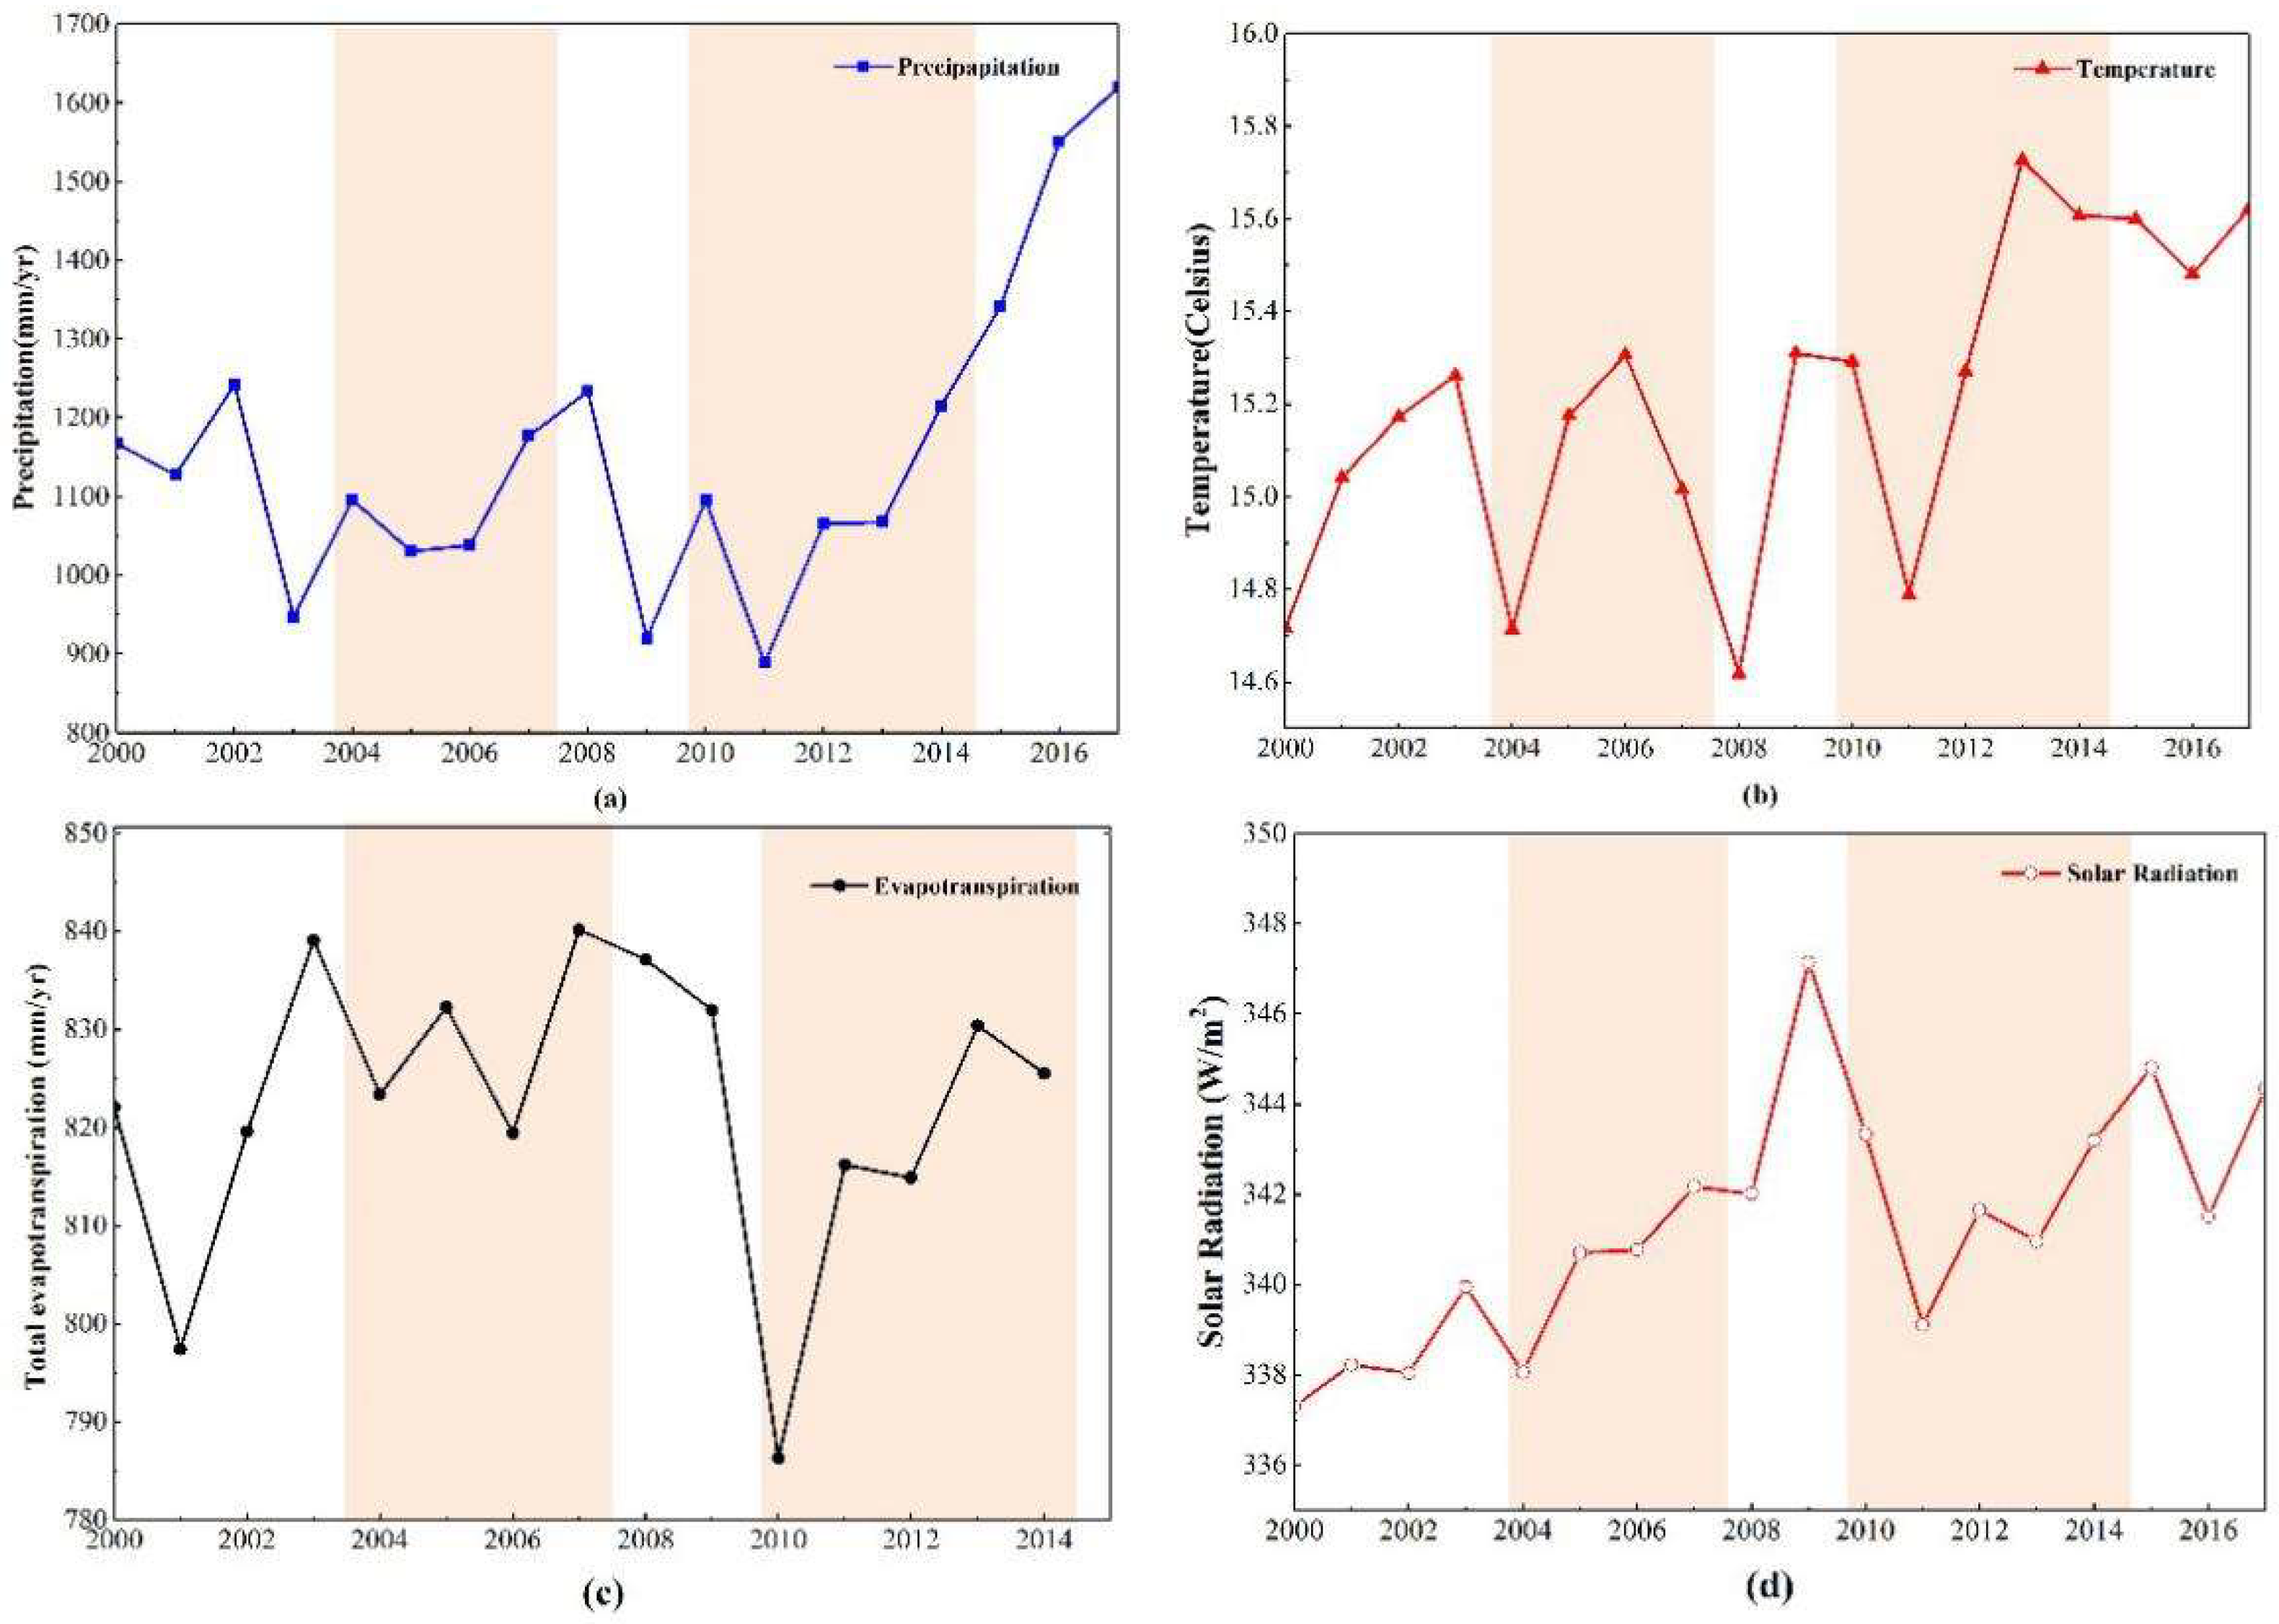
The spatial averaged variables of meteorology including precipitation, air temperature, evapotranspiration and solar radiation are given in Figure 7. An obvious reduction in precipitation and increase in evapotranspiration were found in drought years (2009 and 2011), while high air temperature and large evapotranspiration were found in another drought year (2006). The sharp drop of precipitation in 2009 was the consistent with the decrease in SWA. Despite the slight increase in precipitation in 2010, the effects of long-term water scarcity on vegetation and surface water were sustained (Figure 4 and Figure 5).
In 2009, with the dramatic decrease in precipitation, abnormally high solar radiation, high temperature and large evapotranspiration exacerbated the drought and pushed it to an extreme state. In 2010, the slight increase in precipitation and the significant decline in evapotranspiration and solar radiation alleviated the drought. However, rainfall declined again to a recorded low value and evapotranspiration dramatically increased in 2011, which caused a new drought event, despite the fact that air temperature and solar radiation dropped to a certain degree. Compared to vegetation and surface water which show cyclical response to droughts, meteorological variables could quickly change drought trends in a short time. PDSI derived from the meteorological variables, showed two drought periods from 2000 to 2017 (Figure 8). The comparison of the periods extracted from SWA, LOS and PDSI indicated the generally similar pattern, but with a minor difference. PDSI and LOS showed a slight relief in 2004 and 2011, while SWA has no observable signals.
4. Discussion
4.1. Responses of Seasonal Indicators to Droughts
In spite of many studies on the droughts in SWC, this study made the effort to explore the responses of seasonal factors to droughts in SWC. Our results indicate that there were two major drought periods during 2000~2017. In the first period, most months were severely or moderately dry while almost all months were extremely dry in the second period (Figure 8). Considering both drought severity and the speed of occurrence or recovery, the second drought period was more serious, also had much more impact on the surface water and the vegetation (Table 2). This is consistent with the conclusion obtained from the study using gravity satellites to analyze the water reserves in SWC [4]. Cyclical fluctuations of SWA indicated that seasonal water bodies shrank or disappeared during the dry period, confirming that the obvious effect of drought on surface water. Moreover, signs of drought captured by LOS were highly consistent with that of SWA (Figure 8). Advance of EOS and delay of SOS in drought years shortened the LOS significantly, indicating that drought has a significant impact on vegetation phenology. The conclusion is in agreement with papers studied in western North America and semi-arid regions of northern China [35,68,69]. In addition, our study distinguished spring-drought and autumn-drought presented evidence, in which spring drought delayed SOS and autumn drought advanced EOS in SWC (Figure 4). A similar pattern was observed in Northern China, Canadian Praires and Chile [35,69,70,71]. Same as variations of vegetation phenology, vegetation greenness and productivity also showed a significant decline in several years (Figure 6). Growth of plants was directly controlled by water and carbon processes and these changes could be explained by drought [72,73]. Serious water scarcity made insufficient available soil water for carbon synthesis during the photosynthesis process, resulting in insufficient supply for normal growth of plant [74,75]. This made decline of greenness and productivity, therefore slowed the growth of vegetation and delay of SOS. While, lack of water and high temperature in autumn drought prompted leaves to close the stoma, which decreased the transpiration and photosynthesis rates, but respiration still kept high rate to accelerate carbon degradation [75,76]. As a result of deficient supply and EOS advanced in autumn [35].
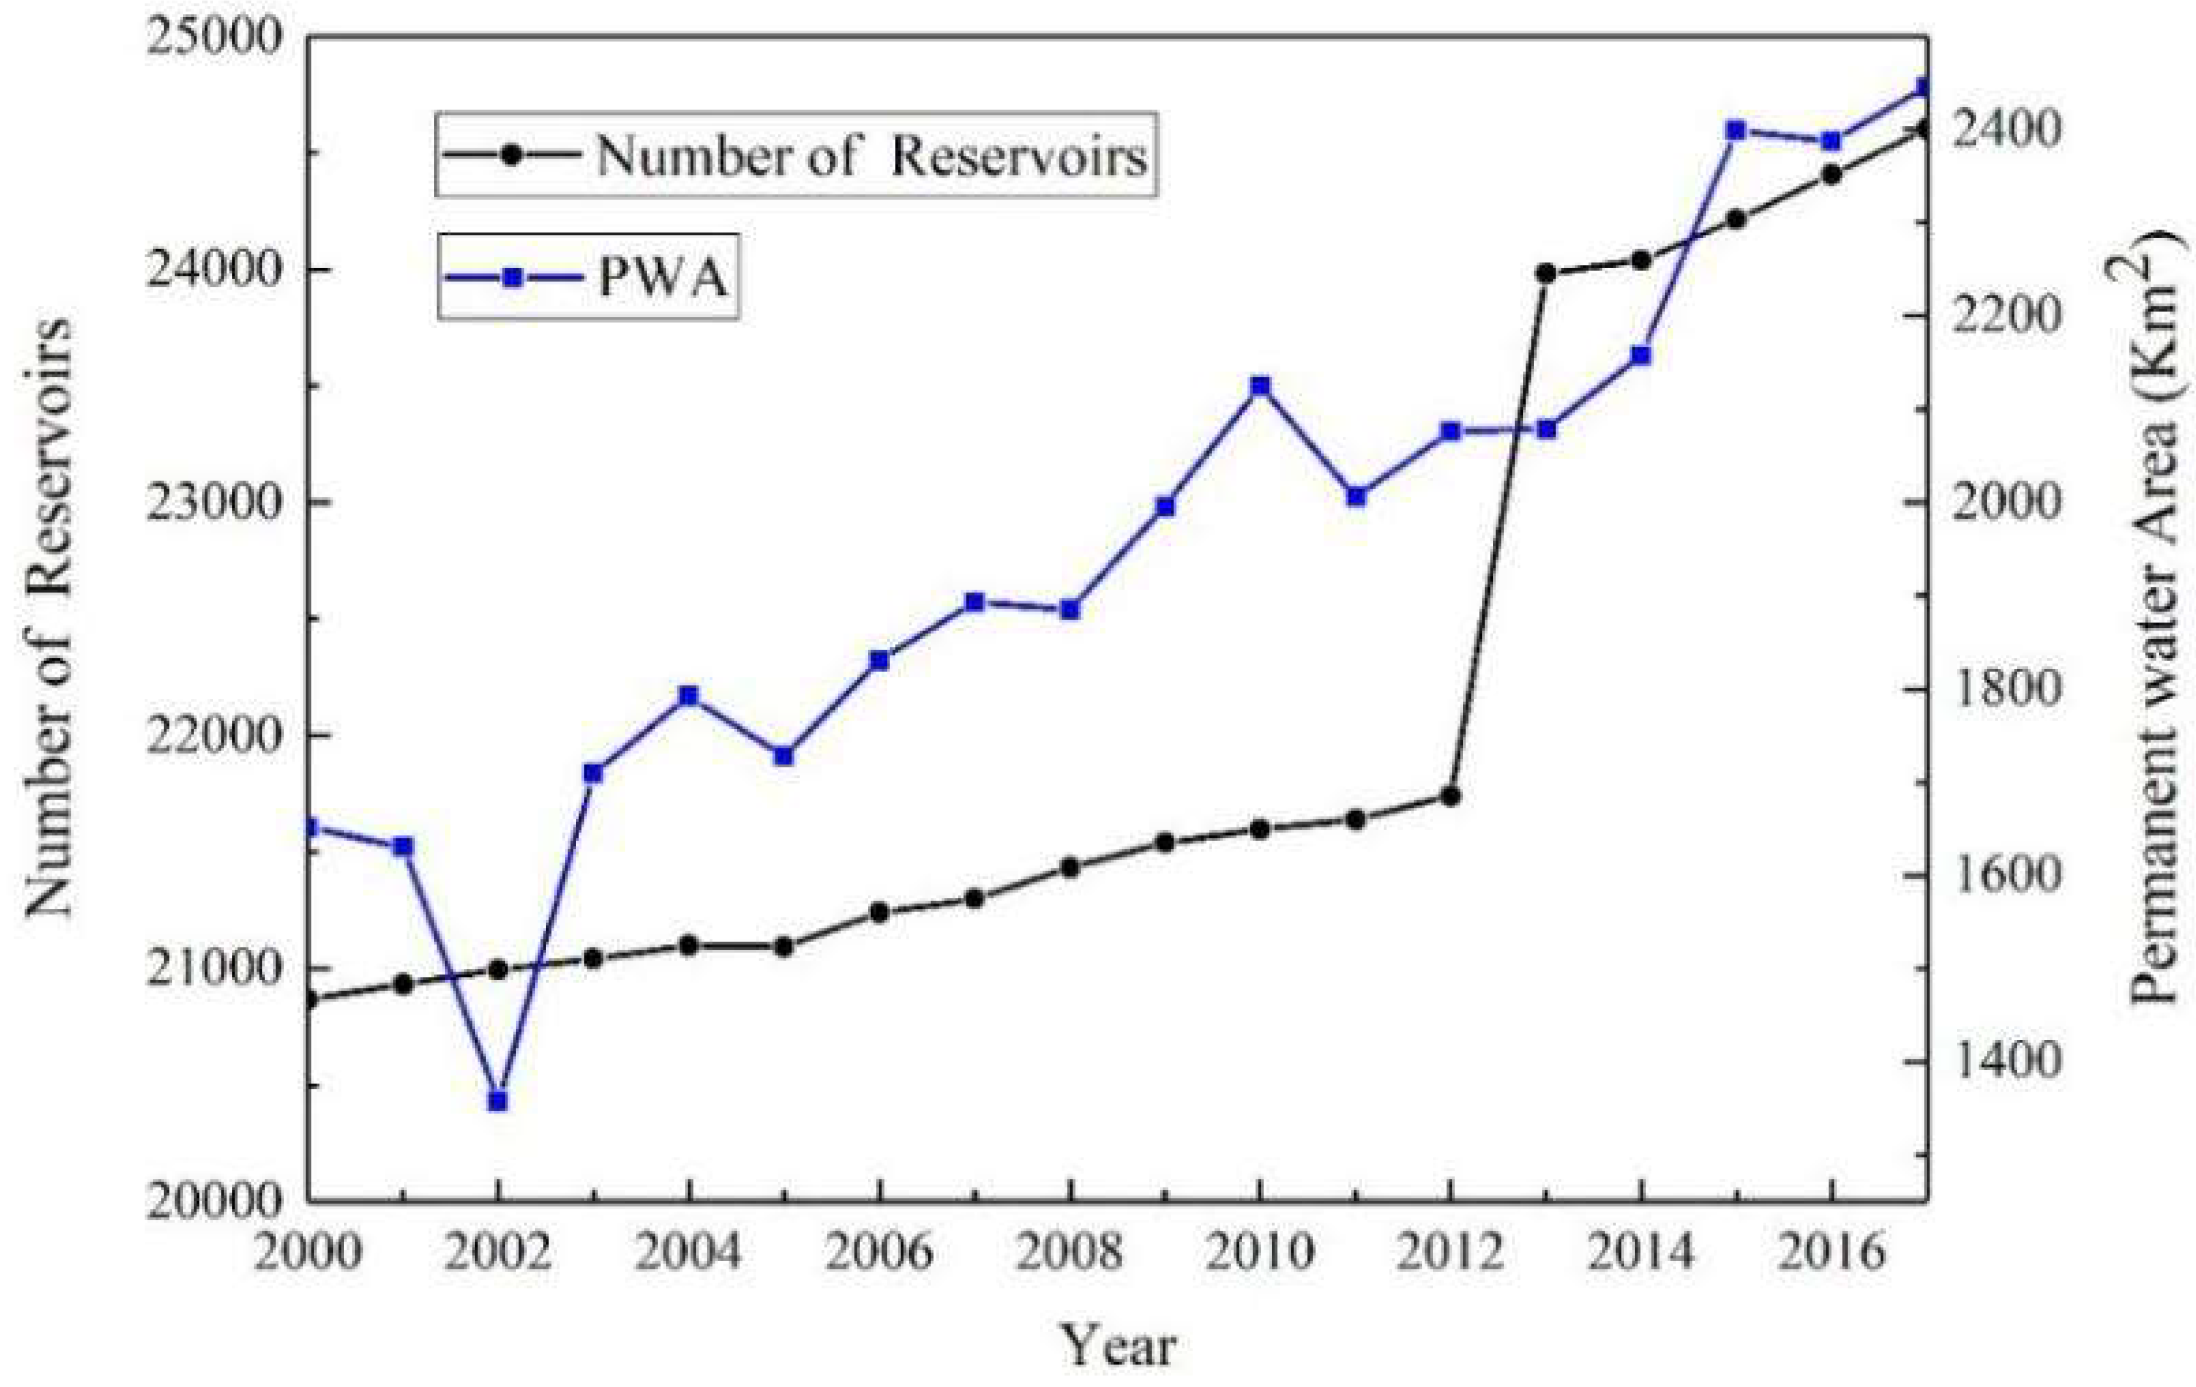
A continuous growth of PWA was observed in the SWC during the period of 2000~2017, which demonstrates a growing trend of the surface water reserves in this region. This increase might be closely linked to global climate warming and human activities. Large water infrastructures changed the location and lasting of water, which influences the conversion among seasonal water, permanent water and no water pixels. Most countries’ reservoir construction contributed to the increase of PWA in the world according to Pekel’s analysis [9]. In this region, more than half of increased PWA (58.5%) came from no water pixels, and this change matched to the water infrastructure project well. We found that the number of reservoirs in SWC increased quickly and kept a close relationship with PWA with correlation coefficient of 0.85 (Figure 9). Building reservoirs and long-term storage of water made no water pixels converted into water pixels, resulting an increase of PWA. The other part of increased PWA came from SWA, which is related to many reasons, such as the fluctuated rainfall, temperature due to climate change and other aspects [77,78]. Moreover, similar to the PWA increased during 2000~2017, our study found that the greenness and carbon cycle also increased in this region, this is identical to the recent studies, in which the SWC is greening and carbon stocks is raising [79,80].
It is notable that PDSI and LOS showed a drought relief in 2011 during the latter drought period, while SWA has no obvious signals to this influence, but correlated well with the drought trend. What is more, not only phenology (LOS), but also greenness and productivity indicate a recovery trend after declined in 2010 although the rainfall in 2011 was less than adjacent years (2010 and 2011). The possible reason is that the increased rainfall in the first half-year and decline in temperature of 2011 helped to relieve vegetation and produced more surface water (Figure 7 and Figure 8). After that, another drought began in summer. Drought events occurred in summer usually cause less influence on vegetation compared to that in spring because the mature plants have stronger resistance to drought. While drought in 2010 and 2012 also involved springs, that is why there was better growth of vegetation in 2011.
It is the same situation in 2004 as 2011. This suggested that SWA maybe indicate the periodicity of drought more stably, but PDSI and LOS are more sensitive to the meteorological changes, such as increase in rainfall and decrease in air temperature. The probable reason for PDSI’s response is that PDSI was calculated based on meteorological variables including rainfall and temperature. In terms of LOS, precipitation falling to the ground is intercepted by plants and absorbed by soil firstly. When the precipitation exceeds the amount of infiltration, the surface begins to appear water flow (run off) [81]. The former process provides water supply for vegetation and the latter one increases surface water. However, rainfall in 2011 and 2004 just met the first process and satisfied water supply for vegetation temporarily, but there is no sufficient water to form surface water, such as ponds and lakes.
4.2. Drought Monitoring and Adaptation in Southwest China
Our results highlight the serious droughts and the seasonal effect on water and vegetation. The fragile Karst environment and increasing water demand with growing population and rapid development of agriculture and industry can easily exacerbate droughts in the next decades [15,27]. Therefore, effective monitoring and forecast of drought and proper water resources management are urgently needed for mitigating drought and improving water safety in SWC [82].
Variations of SWA can forecast drought in SWC. The continuous decrease in SWA indicates the onset of drought. If the SWA and LOS decrease stably and synchronously, a new drought period may start. Clearly, development of new technology to early detection and forecast of droughts is always needed. In addition, increased PWA showed the response to water engineering, which will be helpful to governmental decision for alleviating drought and planning hydraulic engineering.
Characters of Karst made most of water from precipitation rapidly infiltrated into underground through limestone fissures and fractures, resulting in abundant rainfall but arid land surface [83]. Effective collecting and storing of rainwater are important for using it later in dry seasons and drought periods, with the extra benefit of reducing soil erosion in the wet season [84]. Our results of different impacts on vegetation phenology in spring and fall droughts suggest the importance for tailored water management policies between seasons, considering the different agriculture activities and irrigation needs in two seasons.
4.3. Limitation and Future Research
Similar to many studies, there are some limitations in this study. Firstly, we only analyzed the droughts during 2000~2017 due to the data limitation. Therefore, there are only two drought periods in our research, and future studies with more data can provide a better understanding of the relationship between seasonal indicators and drought periodicity in longer period. Secondly, insufficient effects of human activities on surface water and phenology were examined in this study, but agricultural activities such as irrigation and multiple growth seasons were excluded, especially in drought periods [85,86]. For example, the dryer the condition, the more water is pumped from rivers and lakes for irrigation, which reduces SWA from observation. Similarly, droughts in spring also influence postponing planting time and replanting, that also made fluctuations in seasonal parameters. Thirdly, the spatial average of variables, for example, averaged length of season, were used in the analysis and the spatial heterogeneity was excluded in this study, which may affect the result, especially in mountain area, for example, in Chongqing and Yunnan (Figure 1) [11]. Further research considering the spatial heterogeneity with available data will improve our understanding of drought in this area.
5. Conclusions
With the ongoing satellite missions, more and more earth observation data become available to the environmental studies. In this study, multi-source data including variables in surface water, vegetation, meteorology, the Palmer Drought Severity Index (PDSI) and reservoirs data were used to analyze the responses of seasonal indicators to extreme droughts in Southwest China from 2000 to 2017. Compared to the traditional drought indicators (e.g., PDSI), the variations of seasonal water area (SWA) and vegetation phenology could sensitively and rapidly response to the development and recovery of extreme droughts, while permanent water area (PWA) kept a rising pattern in these two periods. The variations of these indicators showed that there were two obvious drought periods during 2000~2017. In the first period, SWA decreased by 11.81% and length of season (LOS) shortened by 5 days; in the second period, they reduced by 21.04% and 9 days, respectively. Start of season (SOS) usually delayed by 3~6 days in spring of drought years, while end of season (EOS) advanced 1~3 days in autumn of drought periods. Moreover, both seasonal indicators and meteorological factors showed that the second drought period was more serious than the first one. All of PDSI, SWA and LOS could reflect the periods of droughts in Southwest China. The LOS and PDSI were sensitive to the meteorological events, for example, precipitation and temperature, while SWA performed more stable to drought periodicity. Short events of precipitation during drought periods could increase the LOS and PDSI, but the SWA was not influenced by the short-term rainfall and showed the continuous drought trend. This made it possible for using SWA in drought forecast because of the strong correlation between SWA and drought. These results are helpful for monitoring droughts in the ecologically fragile southwest China.
Author Contributions
Conceptualization, X.H.; data curation, P.L. and B.H.; formal analysis, P.L. and J.H.; funding acquisition, M.M. and X.H.; investigation, M.M.; methodology, Z.G., H.Y. and X.H.; project administration, M.M.; resources, P.L. and M.M.; software, P.L. and Z.S.; supervision, M.M. and X.H.; validation, M.Z., P.L. and Z.G.; visualization, P.L. and H.Y.; writing—original draft, P.L.; writing—review and editing, H.Y., M.Z. and X.H. All authors have read and agreed to the published version of the manuscript.
Funding
This research was funded by the National Natural Science Foundation of China, grant number: 41830648, 41801095, 41771361; the Fundamental Research Funds for the Central Universities, grant number: GK201903117 and the Southwest University research funding, grant number: SWU117035. The APC was funded by the National Natural Science Foundation of China, grant number: 41771361.
Acknowledgments
In this study, multi-source data are download from different data centers. These data include LAI data from Global LAnd Surface Satellite (GLASS), rainfall, air temperature and solar radiation data from the Global Land Data Assimilation System, evapotranspiration data, high-resolution surface water dataset data from Google Earth Engine and several products from MODIS. We sincerely appreciate the anonymous reviewers’ helpful comments and the editor’s efforts in improving this manuscript.
Conflicts of Interest
The authors declare no conflict of interest.
References
- Hu, M.C.; Zhang, X.Q.; Siu, Y.L.; Li, Y.; Tanaka, K.; Yang, H.; Xu, Y.P. Flood Mitigation by Permeable Pavements in Chinese Sponge City Construction. Water 2018, 10, 172. [Google Scholar] [CrossRef] [Green Version]
- Wang, L.; Chen, W.; Zhou, W. Assessment of Future Drought in Southwest China Based on CMIP5 Multimodel Projections. Adv. Atmos. Sci. 2014, 31, 1035–1050. [Google Scholar] [CrossRef]
- Jane, Q. China drought highlights future climate threats. Nature 2010, 465, 142–143. [Google Scholar] [CrossRef] [Green Version]
- Tang, J.; Cheng, H.; Liu, L. Assessing the recent droughts in Southwestern China using satellite gravimetry. Water Resour. Res. 2014, 50, 3030–3038. [Google Scholar] [CrossRef]
- Zhang, L.; Xiao, J.; Li, J.; Wang, K.; Lei, L.; Guo, H. The 2010 spring drought reduced primary productivity in southwestern China. Environ. Res. Lett. 2012, 7, 045706. [Google Scholar] [CrossRef] [Green Version]
- Han, L.Y.; Zhang, Q.; Ma, P.L.; Jia, J.Y.; Wang, J.S. The spatial distribution characteristics of a comprehensive drought risk index in southwestern China and underlying causes. Theor. Appl. Climatol. 2016, 124, 517–528. [Google Scholar] [CrossRef]
- Sun, L.; Ren, M.; Wang, Z.; Liu, Y.; Liu, J.; Wang, P.; Wang, D. Analysis of Climate Anomaly and Causation in August 2011. Meteorology 2012, 38, 615–622. [Google Scholar] [CrossRef]
- Ye, T.; Shi, P.; Wang, J.A.; Liu, L.; Fan, Y.; Hu, J. China’s Drought Disaster Risk Management: Perspective of Severe Droughts in 2009-2010. Int. J. Disaster Risk Sci. 2012, 3, 84–97. [Google Scholar] [CrossRef] [Green Version]
- Pekel, J.F.; Cottam, A.; Gorelick, N.; Belward, A.S.J.N. High-resolution mapping of global surface water and its long-term changes. Nature 2016, 540, 418–422. [Google Scholar] [CrossRef]
- Zhang, X.; Yamaguchi, Y.; Li, F.; He, B.; Chen, Y. Assessing the Impacts of the 2009/2010 Drought on Vegetation Indices, Normalized Difference Water Index, and Land Surface Temperature in Southwestern China. Adv. Meteorol. 2017, 2017, 6837493. [Google Scholar] [CrossRef]
- Zhao, W.; Li, A. A Review on Land Surface Processes Modelling over Complex Terrain. Adv. Meteorol. 2015, 2015, 607181. [Google Scholar] [CrossRef] [Green Version]
- Li, X.; Li, Y.; Chen, A.; Gao, M.; Slette, I.; Piao, S. The impact of the 2009/2010 drought on vegetation growth and terrestrial carbon balance in Southwest China. Agric. For. Meteorol. 2019, 269, 239–248. [Google Scholar] [CrossRef]
- Lin, W.; Wen, C.; Wen, Z.; Gang, H. Drought in Southwest China: A Review. Atmos. Ocean. Sci. Lett. 2015, 8, 339–344. [Google Scholar] [CrossRef]
- Yan, G.; Wu, Z.; Li, D. Comprehensive Analysis of the Persistent Drought Events in Southwest China. Dis. Adv. 2013, 6, 306–315. [Google Scholar]
- Yang, H.; Flower, R.J.; Thompson, J.R. Shale-Gas Plans Threaten China’s Water Resources. Science 2018, 340, 1288. [Google Scholar] [CrossRef]
- Wang, L.; Chen, W.; Zhou, W.; Huang, G. Understanding and detecting super-extreme droughts in Southwest China through an integrated approach and index. Q. J. R. Meteorol. Soc. 2016, 142, 529–535. [Google Scholar] [CrossRef]
- Hao, Z.; Singh, V.P. Drought characterization from a multivariate perspective: A review. J. Hydrol. 2015, 527, 668–678. [Google Scholar] [CrossRef]
- Tallaksen, L.M.; Hisdal, H.; Lanen, H.A.J.V. Space–time modelling of catchment scale drought characteristics. J. Hydrol. 2009, 375, 363–372. [Google Scholar] [CrossRef]
- Huang, Y.H.; Xu, C.; Yang, H.J.; Wang, J.H.; Jiang, D.; Zhao, C.P. Temporal and Spatial Variability of Droughts in Southwest China from 1961 to 2012. Sustainability 2015, 7, 13597–13609. [Google Scholar] [CrossRef] [Green Version]
- Vicente-Serrano, S.M.; Begueria, S.; Lopez-Moreno, J.I.; Angulo, M.; El Kenawy, A. A New Global 0.5 degrees Gridded Dataset (1901-2006) of a Multiscalar Drought Index: Comparison with Current Drought Index Datasets Based on the Palmer Drought Severity Index. J. Hydrometeorol. 2010, 11, 1033–1043. [Google Scholar] [CrossRef] [Green Version]
- Heim, R.R. A Review of Twentieth-Century Drought Indices Used in the United States. Bull. Am. Meteorol. Soc. 2002, 83, 1149–1166. [Google Scholar] [CrossRef] [Green Version]
- Vicente-Serrano, S.; Beguería, S.; López-Moreno, J.I. A Multiscalar Drought Index Sensitive to Global Warming: The Standardized Precipitation Evapotranspiration Index. J. Clim. 2010, 23, 1696–1718. [Google Scholar] [CrossRef] [Green Version]
- Zhai, J.; Buda, S.U.; Krysanova, V.; Vetter, T.; Gao, C.; Jiang, T. Spatial Variation and Trends in PDSI and SPI Indices and Their Relation to Streamflow in 10 Large Regions of China. J. Clim. 2010, 23, 649–663. [Google Scholar] [CrossRef]
- Zhao, S.; Cong, D.; He, K.; Yang, H.; Qin, Z. Spatial-Temporal Variation of Drought in China from 1982 to 2010 Based on a modified Temperature Vegetation Drought Index (mTVDI). Sci. Rep. 2017, 7, 17473. [Google Scholar] [CrossRef] [PubMed]
- Alley, W.M. The Palmer Drought Severity Index: Limitations and Assumptions. J. Appl. Meteorol. 1984, 23, 1100–1109. [Google Scholar] [CrossRef] [Green Version]
- Dai, A. Characteristics and trends in various forms of the Palmer Drought Severity Index during 1900–2008. J. Geophys. Res. Atmos. 2011, 116, D12115. [Google Scholar] [CrossRef] [Green Version]
- Wang, L.; Chen, W. Characteristics of Multi-timescale Variabilities of the Drought over Last 100 Years in Southwest China. Adv. Meteorol Sci. Technol. 2012, 2, 21–26. [Google Scholar] [CrossRef]
- Wang, H.; Lin, H.; Liu, D. Remotely sensed drought index and its responses to meteorological drought in Southwest China. Remote Sens. Lett. 2014, 5, 413–422. [Google Scholar] [CrossRef]
- Li, Y.; Xu, H.; Liu, D. Features of the extremely severe drought in the east of Southwest China and anomalies of atmospheric circulation in summer 2006. Acta Meteorol. Sin. 2011, 25, 176–187. [Google Scholar] [CrossRef]
- Liu, Y.; Xu, H.; Lei, Z. Possible Causes for Drought in Sichuan-Chongqing Region in Summer 2006. Trans. Atmos. Sci. 2009, 32, 686–694. [Google Scholar] [CrossRef]
- Yang, J.; Wang, W.; Hu, M.; Mao, R. Extreme drought event of 2009/2010 over southwestern China. Meteorol. Atmos. Phys. 2012, 115, 173–184. [Google Scholar] [CrossRef]
- Lu, E.; Luo, Y.; Zhang, R.; Wu, Q.; Liu, L. Regional atmospheric anomalies responsible for the 2009–2010 severe drought in China. J. Geophys. Res. Atmos. 2011, 116. [Google Scholar] [CrossRef]
- Fernández, M.E.; Gyenge, J.E.; Varela, S.; de Urquiza, M. Effects of the time of drought occurrence within the growing season on growth and survival of Pinus ponderosa seedlings. Trees 2014, 28, 745–756. [Google Scholar] [CrossRef]
- Mundo, I.A.; El Mujtar, V.A.; Perdomo, M.H.; Gallo, L.A.; Villalba, R.; Barrera, M.D. Austrocedrus chilensis growth decline in relation to drought events in northern Patagonia, Argentina. Trees 2010, 24, 561–570. [Google Scholar] [CrossRef]
- Kang, W.; Tao, W.; Liu, S.J.R.S. The Response of Vegetation Phenology and Productivity to Drought in Semi-Arid Regions of Northern China. Remote Sens. 2018, 10, 727. [Google Scholar] [CrossRef] [Green Version]
- Zhao, X.; Wei, H.; Liang, S.; Zhou, T.; He, B.; Tang, B.; Wu, D. Responses of Natural Vegetation to Different Stages of Extreme Drought during 2009–2010 in Southwestern China. Remote Sens. 2015, 7, 14039–14054. [Google Scholar] [CrossRef] [Green Version]
- Yu, Z.; Wang, J.; Liu, S.; Rentch, J.S.; Sun, P.; Lu, C. Global gross primary productivity and water use efficiency changes under drought stress. Environ. Res. Lett. 2017, 12, 014016. [Google Scholar] [CrossRef] [Green Version]
- Ahmadi, B.; Ahmadalipour, A.; Tootle, G.; Moradkhani, H. Remote Sensing of Water Use Efficiency and Terrestrial Drought Recovery across the Contiguous United States. Remote Sens. 2019, 11, 731. [Google Scholar] [CrossRef] [Green Version]
- Van Loon, A.F.; Tijdeman, E.; Wanders, N.; Van Lanen, H.A.J.; Teuling, A.J.; Uijlenhoet, R. How climate seasonality modifies drought duration and deficit. J. Geophys. Res. Atmos. 2014, 119, 4640–4656. [Google Scholar] [CrossRef]
- Huang, W.H.; Sui, Y.; Yang, X.G.; Dai, S.W.; Li, M.S. Characteristics and adaptation of seasonal drought in southern China under the background of climate change. V. Seasonal drought characteristics division and assessment in southern China. Chin. J. Appl. Ecol. 2013, 24, 2917–2925. [Google Scholar]
- Hayhoe, K.; Wake, C.P.; Huntington, T.G.; Luo, L.; Schwartz, M.D.; Sheffield, J.; Wood, E.; Anderson, B.; Bradbury, J.; De Gaetano, A.; et al. Past and future changes in climate and hydrological indicators in the US Northeast. Clim. Dyn. 2007, 28, 381–407. [Google Scholar] [CrossRef]
- Benjamin, P.; David, F.; Philippe, C.; Myneni, R.B.; Niels, A.; Jian, B.; Gregoire, B.; Canadell, J.G.; Frederic, C.; Yi, Y. Contribution of semi-arid ecosystems to interannual variability of the global carbon cycle. Nature 2014, 509, 600–603. [Google Scholar] [CrossRef] [Green Version]
- Tejnecký, V.; Drábek, O.; Borůvka, L.; Nikodem, A.; Kopáč, J.; Vokurková, P.; Šebek, O. Seasonal variation of water extractable aluminium forms in acidified forest organic soils under different vegetation cover. Biogeochemistry 2010, 101, 151–163. [Google Scholar] [CrossRef]
- Wang, W.; Wang, W.-J.; Li, J.-S.; Wu, H.; Xu, C.; Liu, T. The Impact of Sustained Drought on Vegetation Ecosystem in Southwest China Based on Remote Sensing. Procedia Env. Sci. 2010, 2, 1679–1691. [Google Scholar] [CrossRef] [Green Version]
- Li, Y.; Wang, J.; Li, Y.; Li, Y.; Wang, J.; Li, Y. Characteristics of a Regional Meteorological Drought Event in Southwestern China During 2009–2010. J. Arid Meteorol. 2015, 33, 537–545. [Google Scholar]
- Sun, S.; Li, Q.; Li, J.; Wang, G.; Zhou, S.; Chai, R.; Hua, W.; Deng, P.; Wang, J.; Lou, W. Revisiting the evolution of the 2009–2011 meteorological drought over Southwest China. J. Hydrol. 2019, 568, 385–402. [Google Scholar] [CrossRef]
- Zhang, J.; Jiang, L.; Feng, Z.; Li, P. Detecting Effects of the Recent Drought on Vegetation in Southwestern China. J. Resour. Ecol. 2012, 3, 43–49. [Google Scholar] [CrossRef]
- Zhang, M.; He, J.; Wang, B.; Wang, S.; Li, S.; Liu, W.; Ma, X. Extreme drought changes in Southwest China from 1960 to 2009. J. Geogr. Sci. 2013, 23, 3–16. [Google Scholar] [CrossRef]
- Hao, B.; Ma, M.; Li, S.; Li, Q.; Hao, D.; Huang, J.; Ge, Z.; Yang, H.; Han, X. Land Use Change and Climate Variation in the Three Gorges Reservoir Catchment from 2000 to 2015 Based on the Google Earth Engine. Sensors 2019, 19, 2118. [Google Scholar] [CrossRef] [Green Version]
- Gorelick, N.; Hancher, M.; Dixon, M.; Ilyushchenko, S.; Thau, D.; Moore, R. Google Earth Engine: Planetary-scale geospatial analysis for everyone. Remote Sens. Environ. 2017, 202, 18–27. [Google Scholar] [CrossRef]
- Xiong, J.; Thenkabail, P.S.; Gumma, M.K.; Teluguntla, P.; Poehnelt, J.; Congalton, R.G.; Yadav, K.; Thau, D. Automated cropland mapping of continental Africa using Google Earth Engine cloud computing. ISPRS J. Photogramm. Remote Sens. 2017, 126, 225–244. [Google Scholar] [CrossRef] [Green Version]
- Jönsson, P.; Eklundh, L. TIMESAT—A program for analyzing time-series of satellite sensor data. Comput. Geos. 2004, 30, 833–845. [Google Scholar] [CrossRef] [Green Version]
- Jonsson, P.; Eklundh, L. Seasonality extraction by function fitting to time-series of satellite sensor data. IEEE Trans. Geosci. Remote Sens. 2002, 40, 1824–1832. [Google Scholar] [CrossRef]
- Beck, P.S.A.; Atzberger, C.; Høgda, K.A.; Johansen, B.; Skidmore, A.K. Improved monitoring of vegetation dynamics at very high latitudes: A new method using MODIS NDVI. Remote Sens. Environ. 2006, 99, 321–334. [Google Scholar] [CrossRef]
- Wu, W.; Yang, P.; Tang, J.; Zhou, Q.; Ryosuke, S.; Zhang, L.; Tang, P. Spatial-temporal variations in the starting dates of growing season in China’s cropland over the past 20 years. Acta Ecol. Sin. 2009, 29, 1777–1786. [Google Scholar]
- Xiang, Y.; Xiao, Z.Q.; Liang, S.; Wang, J.D.; Song, J.L. Validation of Global LAnd Surface Satellite (GLASS) leaf area index product. J. Remote Sens. 2014, 18, 573–596. [Google Scholar] [CrossRef]
- Xiao, Z.; Liang, S.; Jindi, W.; Chen, P.; Yin, X.; Zhang, L.; Song, J. Use of general regression neural networks for generating the GLASS Leaf Area Index Product from Time Series MODIS Surface Reflectance. IEEE Trans. Geosci. Remote Sens. 2014, 52, 209–223. [Google Scholar] [CrossRef]
- Didan, K. MOD13Q1 MODIS/Terra Vegetation Indices 16-Day L3 Global 250m SIN Grid V006 [Data set]. NASA EOSDIS Land Processes DAAC. 2015. Available online: https://developers.google.com/earth-engine/datasets/catalog/MODIS_006_MOD13Q1 (accessed on 15 January 2020).
- Running, S.; Mu, Q.; Zhao, M. MOD17A2H MODIS/Terra Gross Primary Productivity 8-Day L4 Global 500m SIN Grid V006 [Data set]. NASA EOSDIS Land Processes DAAC. 2015. Available online: https://developers.google.com/earth-engine/datasets/catalog/MODIS_006_MOD17A2H (accessed on 15 January 2020).
- Chen, Y.; Yang, K.; He, J.; Qin, J.; Shi, J.; Du, J.; He, Q. Improving land surface temperature modeling for dry land of China. J. Geophys. Res.: Atmos. 2011, 116. [Google Scholar] [CrossRef]
- Mu, Q.; Zhao, M.W.S.; Group, R.A.N.T.S. MODIS Global Terrestrial Evapotranspiration (ET) Product MOD16A2 Collection 5 [Data set]. Available online: https://developers.google.com/earth-engine/datasets/catalog/MODIS_NTSG_MOD16A2_105 (accessed on 15 January 2020).
- Palmer, W.C.; Meteorological drought U.S. US Department of Commerce Weather Bureau. In Research Paper 45; Office of Climatology U.S. Weather Bureau: Washington, DC, USA, 1965; p. 58. [Google Scholar]
- Abatzoglou, J.T.; Dobrowski, S.Z.; Parks, S.A.; Hegewisch, K.C. Terraclimate, a high-resolution global dataset of monthly climate and climatic water balance from 1958–2015. Sci. Data 2018, 5, 170191. [Google Scholar] [CrossRef] [Green Version]
- Svoboda, M.; Fuchs, B.; IDMP. Handbook of Drought Indicators and Indices. Available online: https://www.drought.gov/drought/node/1353 (accessed on 15 January 2020).
- Vicente-Serrano, S.M.; Beguería, S.; López-Moreno, J.I. Comment on “Characteristics and trends in various forms of the Palmer Drought Severity Index (PDSI) during 1900–2008” by Aiguo Dai. J. Geophys. Res. Atmos. 2011, 116, D19112. [Google Scholar] [CrossRef] [Green Version]
- Dai, A.; Trenberth, K.E.; Qian, T. A Global Dataset of Palmer Drought Severity Index for 1870–2002: Relationship with Soil Moisture and Effects of Surface Warming. J. Hydrometeorol. 2004, 5, 1117–1130. [Google Scholar] [CrossRef]
- National Bureau of Statistics. China Statistical Yearbook; National Bureau of Statistics: Beijing, China, 2019.
- McKenzie, D.; Hessl, A.E.; Peterson, D.L. Recent growth of conifer species of western North America: Assessing spatial patterns of radial growth trends. Can. J. For. Res. 2001, 31, 526–538. [Google Scholar] [CrossRef]
- Yu, L.; Liu, T.; Bu, K.; Yan, F.; Yang, J.; Chang, L.; Zhang, S. Monitoring the long term vegetation phenology change in Northeast China from 1982 to 2015. Sci. Rep. 2017, 7, 14770. [Google Scholar] [CrossRef] [PubMed] [Green Version]
- Cui, T.; Martz, L.; Guo, X.J.R.S. Grassland Phenology Response to Drought in the Canadian Prairies. Remote Sens. 2017, 9, 1258. [Google Scholar] [CrossRef] [Green Version]
- Glade, F.E.; Miranda, M.D.; Meza, F.J.; van Leeuwen, W.J.D. Productivity and phenological responses of natural vegetation to present and future inter-annual climate variability across semi-arid river basins in Chile. Environ. Monit. Assess. 2016, 188, 676. [Google Scholar] [CrossRef]
- Hu, Z.; Yu, G.; Fan, J.; Wen, X. Effects of Drought on Ecosystem Carbon and Water Processes: A Review at Differ ent Scales. Adv. Earth Sci. 2006, 25, 12–20. [Google Scholar] [CrossRef]
- Molen, M.K.V.D.; Dolman, A.J.; Ciais, P.; Eglin, T.; Gobron, N.; Law, B.E.; Meir, P.; Peters, W.; Phillips, O.L.; Reichstein, M.J.A.; et al. Drought and ecosystem carbon cycling. Agric. For. Meteorol. 2011, 151, 765–773. [Google Scholar] [CrossRef]
- Hinckley, T.M.; Dougherty, P.M.; Lassoie, J.P.; Roberts, J.E.; Teskey, R.O. A Severe Drought: Impact on Tree Growth, Phenology, Net Photosynthetic Rate and Water Relations. Am. Midl. Nat. 1979, 102, 307–316. [Google Scholar] [CrossRef]
- Chapin, F.S.; Maston, P.; Mooney, H.A. Principles of Terrestrial Ecosystem; Springer-Verlag: New York, NY, USA, 2005. [Google Scholar]
- Xu, Z.; Zhou, G.; Shimizu, H. Plant responses to drought and rewatering. Plant. Signal. Behav. 2010, 5, 649–654. [Google Scholar] [CrossRef] [Green Version]
- Hu, M.; Sayama, T.; Zhang, X.; Tanaka, K.; Takara, K.; Yang, H. Evaluation of low impact development approach for mitigating flood inundation at a watershed scale in China. J. Environ. Manag. 2017, 193, 430–438. [Google Scholar] [CrossRef]
- Lin, L.; Shen, H.; Sheng, D.; Li, H.; Xiao, J. Response of water resources to climate change and its future trend in the source region of the Yangtze River. J. Geogr. Sci. 2013, 23, 208–218. [Google Scholar] [CrossRef]
- Tong, X.; Brandt, M.; Yue, Y.; Ciais, P.; Rudbeck Jepsen, M.; Penuelas, J.; Wigneron, J.-P.; Xiao, X.; Song, X.-P.; Horion, S.; et al. Forest management in southern China generates short term extensive carbon sequestration. Nat. Commun. 2020, 11, 129. [Google Scholar] [CrossRef] [PubMed]
- Zhu, Z.; Piao, S.; Myneni, R.B.; Huang, M.; Zeng, Z.; Canadell, J.G.; Ciais, P.; Sitch, S.; Friedlingstein, P.; Arneth, A.; et al. Greening of the Earth and its drivers. Nat. Clim. Chang. 2016, 6, 791–795. [Google Scholar] [CrossRef]
- Love, D.; Uhlenbrook, S.; Corzo, G.; Twomlow, S.; van der Zaag, P. Rainfall-interception-evaporation-runoff relationships in a semi-arid catchment, northern Limpopo basin, Zimbabwe. Hydrol. Sci. J. 2010, 55, 687–703. [Google Scholar] [CrossRef] [Green Version]
- Yang, H.; Wright, J.A.; Gundry, S.W. Boost water safety in rural China. Nature 2012, 484, 318. [Google Scholar] [CrossRef]
- Peng, T. Multi-scale research on the hydrology processes and soil loss on the karst peak-cluster depression in southwest of China. In Proceedings of the Egu General Assembly Conference, Vienna, Austria, 22–27 April 2012; p. 1042. [Google Scholar]
- Zhang, X.; Hu, M.; Guo, X.; Yang, H.; Zhang, Z.; Zhang, K. Effects of topographic factors on runoff and soil loss in Southwest China. Catena 2018, 160, 394–402. [Google Scholar] [CrossRef]
- Tan, C.; Guo, B.; Kuang, H.; Yang, H.; Ma, M. Lake Area Changes and Their Influence on Factors in Arid and Semi-Arid Regions along the Silk Road. Remote Sens. 2018, 10, 595. [Google Scholar] [CrossRef] [Green Version]
- Yang, H.; Huang, X.; Yang, Q.; Tu, J.; Li, S.; Yang, D.; Xia, H.; Flower, R.J.; Thompson, J.R. Water Requirements for Shale Gas Fracking in Fuling, Chongqing, Southwest China. Energy Procedia 2015, 76, 106–112. [Google Scholar] [CrossRef] [Green Version]
Figure 1.
Location of study area (circled with the red polygon).

Figure 2.
Seasonal parameters: (a) start of season, (b) end of season, (c) minimum Leaf Area index (LAI) value in the left, (d) minimum LAI value in the right, (h) length of season, (p) peak. (DOY means day of year).
Figure 2.
Seasonal parameters: (a) start of season, (b) end of season, (c) minimum Leaf Area index (LAI) value in the left, (d) minimum LAI value in the right, (h) length of season, (p) peak. (DOY means day of year).

Figure 3.
Schematic diagram of Treduce and Trecovery.

Figure 4.
Variations of surface water area, (a) seasonal water area (SWA) and (b) permanent water area (PWA).
Figure 4.
Variations of surface water area, (a) seasonal water area (SWA) and (b) permanent water area (PWA).

Figure 5.
Variations of vegetation growth: (a) start of season (SOS), (b) end of season (EOS) and (c) length of season (LOS), (DOY means day of year).
Figure 5.
Variations of vegetation growth: (a) start of season (SOS), (b) end of season (EOS) and (c) length of season (LOS), (DOY means day of year).

Figure 6.
Variations of vegetation indices and indicator of carbon cycle: (a) Normalized Difference Vegetation Index (NDVI) and Enhanced Vegetation Index (EVI), (b) Gross Primary Productivity (GPP).
Figure 6.
Variations of vegetation indices and indicator of carbon cycle: (a) Normalized Difference Vegetation Index (NDVI) and Enhanced Vegetation Index (EVI), (b) Gross Primary Productivity (GPP).

Figure 7.
Variations of (a) precipitation, (b) temperature, (c) evapotranspiration and (d) solar radiation.
Figure 7.
Variations of (a) precipitation, (b) temperature, (c) evapotranspiration and (d) solar radiation.

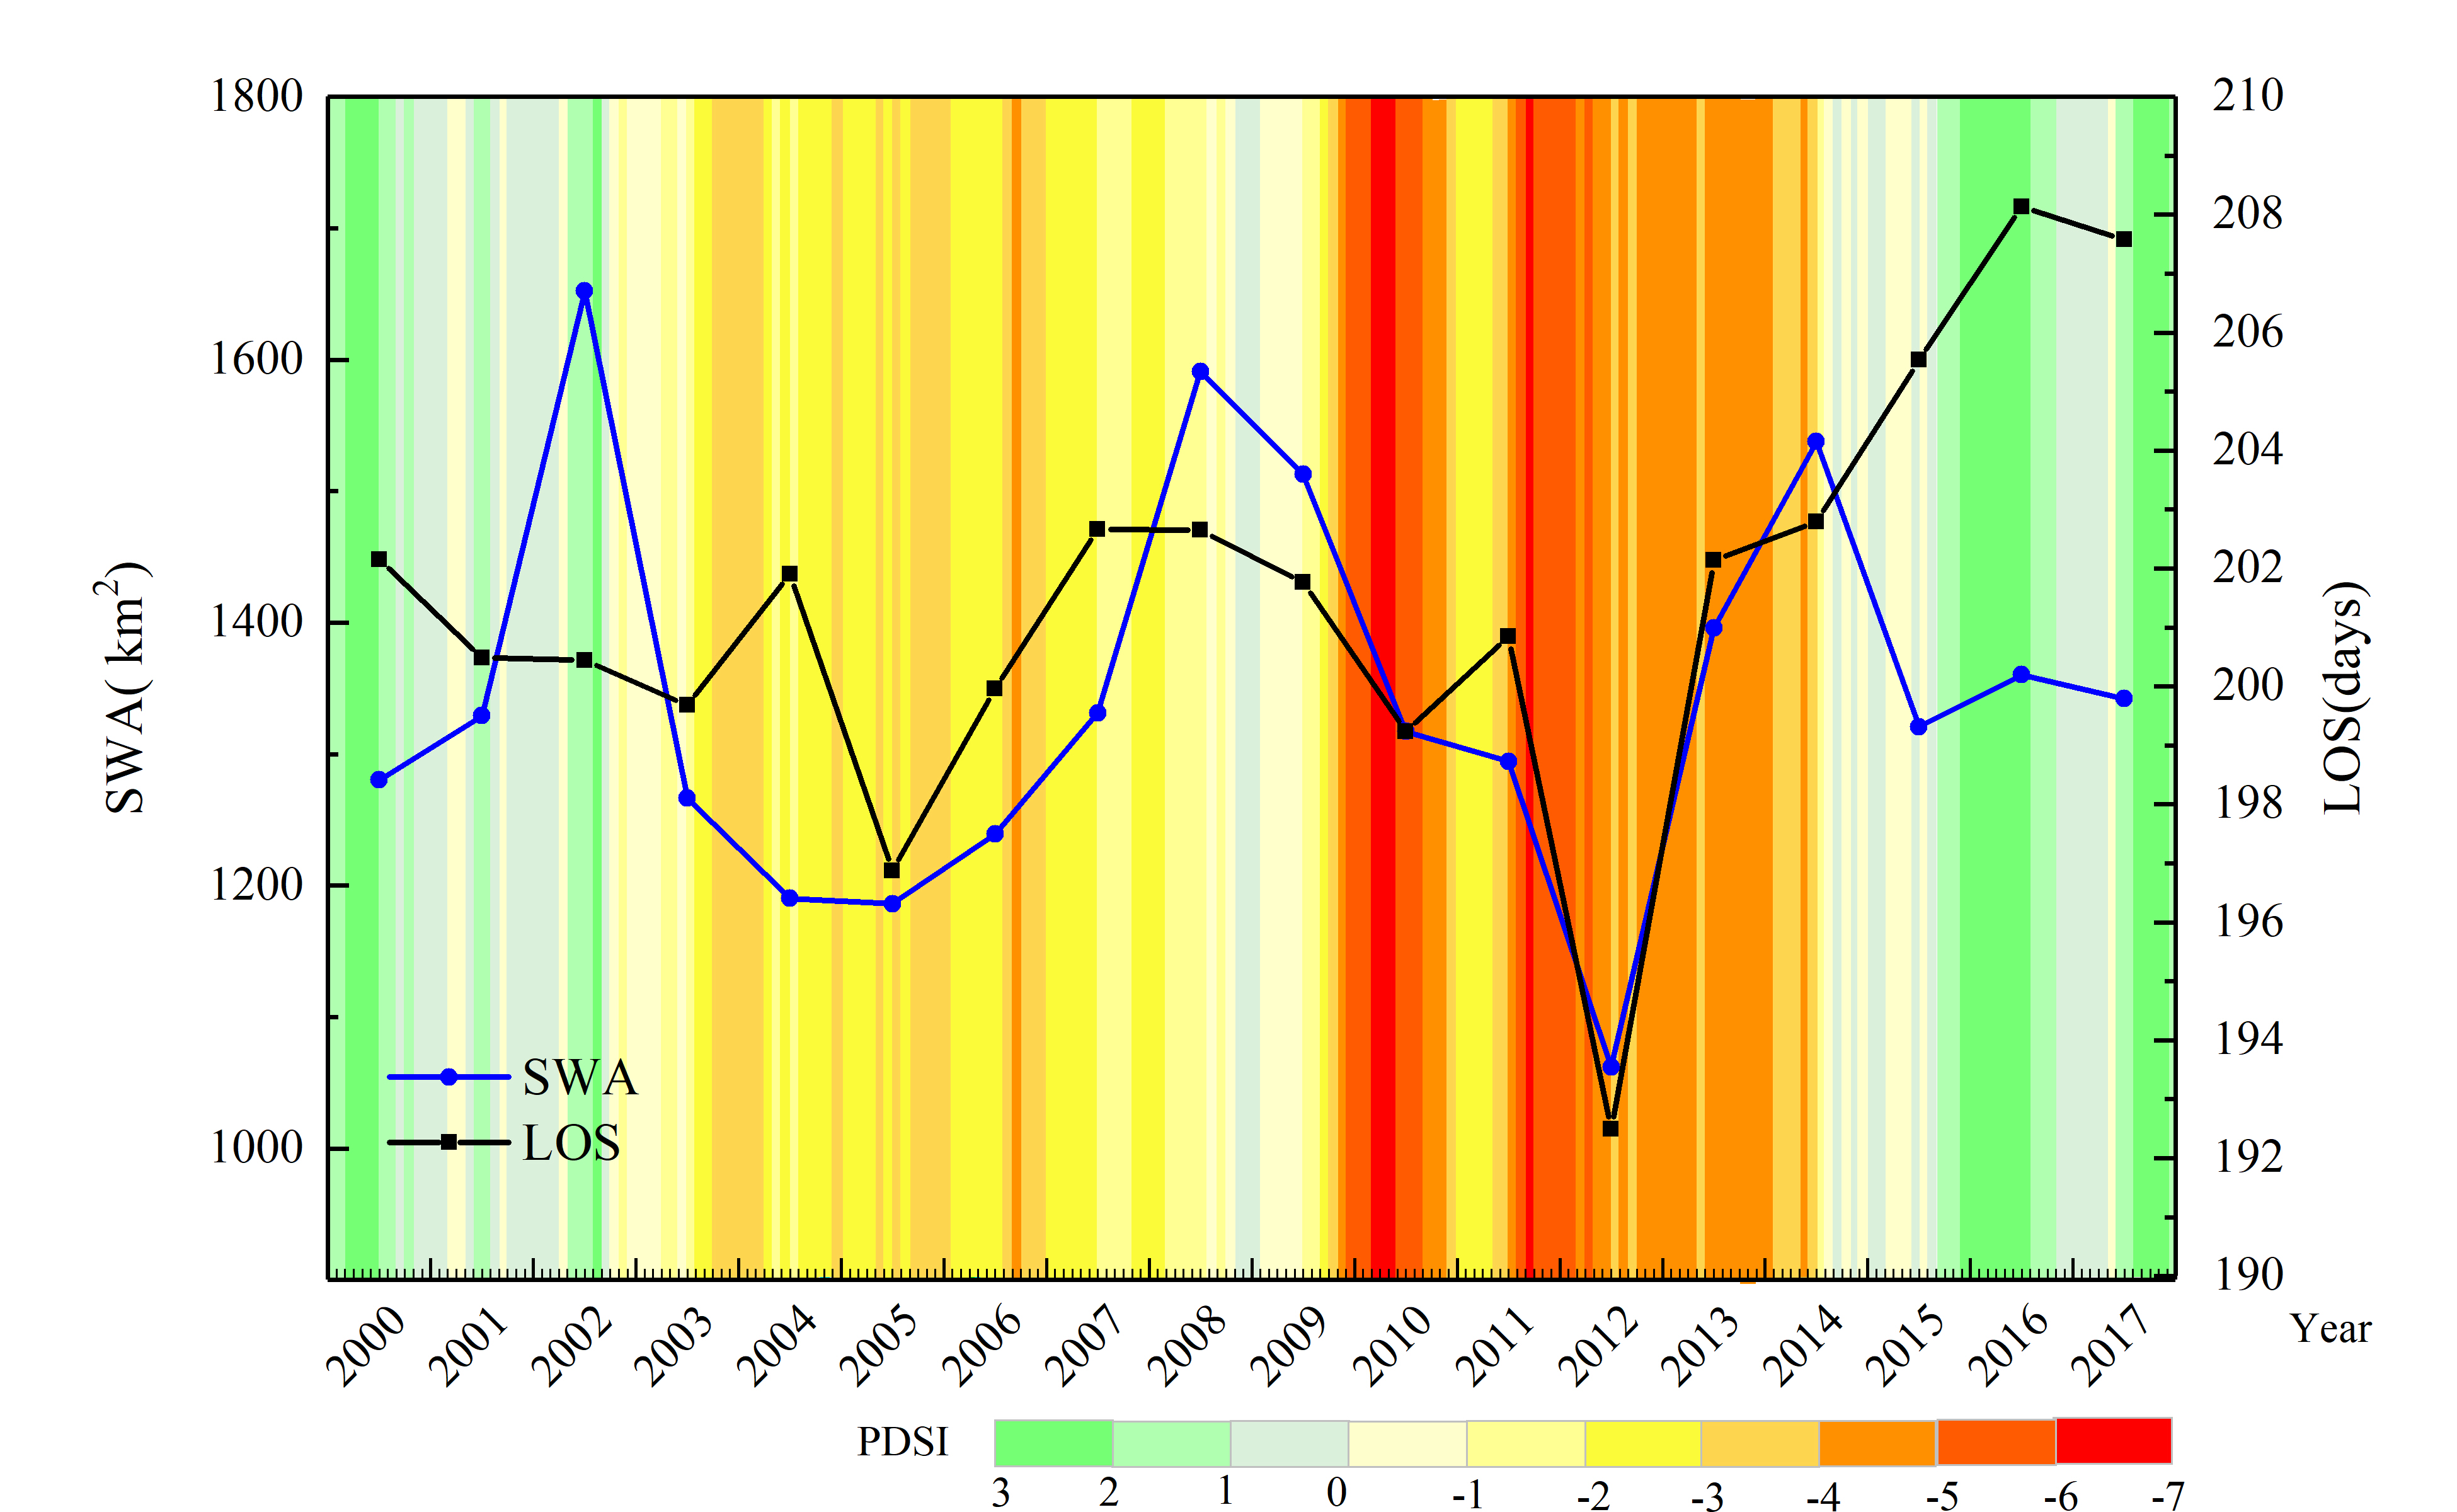
Figure 8.
Variations of seasonal surface water (SWA), length of season (LOS) and PDSI in the study area.
Figure 8.
Variations of seasonal surface water (SWA), length of season (LOS) and PDSI in the study area.

Figure 9.
Variations of reservoirs count in SWC.


Table 1.
Summary of data used in this study and their characteristics.
| Indicators | Variables | Source | Type | Spatial Resolution | Temporal Resolution | Processed Platform |
|---|---|---|---|---|---|---|
| Surface water | SWA | High-resolution data of global surface water dataset | remote sensing | 30 m | yearly | GEE |
| PWA | ||||||
| Vegetation phenology | SOS | GLASS | remote sensing | 0.05° | 8 days | TIMESAT 3.3 |
| EOS | ||||||
| LOS | ||||||
| NDVI | MOD13Q1 V6 | remote sensing | 250 m | 16 days | GEE | |
| EVI | ||||||
| GPP | MOD17A2H V6 | remote sensing | 500 m | 8 days | GEE | |
| Meteorological factors | precipitation | GLDAS 2.1 | site-observed, remote sensing and simulated | 0.25° | 3 h | GEE |
| air temperature | ||||||
| solar radiation | ||||||
| ET | MOD16A2.V105 | remote sensing | 1 km | 8 days | GEE | |
| Drought index | PDSI | GLDAS 2.1 | site-observed, remote sensing and simulated | 0.04° | monthly | GEE |
| Human activities | number of reservoirs | China Statistical Yearbook | statistics | provincial | yearly | Office EXCEL |
Table 2.
Variations of seasonal water area (SWA) in two drought periods.
| SWA | First Period (08-2003~06-2007) | Second Period (09-2009~06-2014) |
|---|---|---|
| Time of reduction (months) | 16 (08-2003~12-2004) | 27 (09-2009~12-2011) |
| Amplitude of reduction (km2) | 29.65 | 304.169 |
| Speed of reduction (km2/month) | 1.85 | 11.27 |
| Time of recovery (months) | 29 (01-2005~06-2007) | 29 (01-2012~06-2014) |
| Amplitude of recovery (km2) | 275.24 | 376.27 |
| Speed of recovery (km2/month) | 9.49 | 12.66 |
© 2020 by the authors. Licensee MDPI, Basel, Switzerland. This article is an open access article distributed under the terms and conditions of the Creative Commons Attribution (CC BY) license (http://creativecommons.org/licenses/by/4.0/).
Share and Cite
MDPI and ACS Style
Lai, P.; Zhang, M.; Ge, Z.; Hao, B.; Song, Z.; Huang, J.; Ma, M.; Yang, H.; Han, X. Responses of Seasonal Indicators to Extreme Droughts in Southwest China. Remote Sens. 2020, 12, 818. https://0-doi-org.brum.beds.ac.uk/10.3390/rs12050818
AMA Style
Lai P, Zhang M, Ge Z, Hao B, Song Z, Huang J, Ma M, Yang H, Han X. Responses of Seasonal Indicators to Extreme Droughts in Southwest China. Remote Sensing. 2020; 12(5):818. https://0-doi-org.brum.beds.ac.uk/10.3390/rs12050818
Chicago/Turabian StyleLai, Peiyu, Miao Zhang, Zhongxi Ge, Binfei Hao, Zengjing Song, Jing Huang, Mingguo Ma, Hong Yang, and Xujun Han. 2020. "Responses of Seasonal Indicators to Extreme Droughts in Southwest China" Remote Sensing 12, no. 5: 818. https://0-doi-org.brum.beds.ac.uk/10.3390/rs12050818
Note that from the first issue of 2016, this journal uses article numbers instead of page numbers. See further details here.