Article

Ground Deformation of the Chongming East Shoal Reclamation Area in Shanghai Based on SBAS-InSAR and Laboratory Tests

1
College of Construction Engineering, Jilin University, Changchun 130026, China
2
Department, Shanghai Institute of Geological Survey, Shanghai 200072, China
3
College of Geo-exploration Science and Technology, Jilin University, Changchun 130026, China
*
Author to whom correspondence should be addressed.
Submission received: 17 February 2020 / Revised: 18 March 2020 / Accepted: 20 March 2020 / Published: 22 March 2020
(This article belongs to the Special Issue Remote Sensing in Engineering Geology)

Abstract

:
With the development of the economy, land reclamation, as a result of dredged soil, has become an effective measure to alleviate land scarcity in many coastal cities around the world. Chongming East Shoal (CES), a typical reclamation area in Shanghai that is formed by multi-phase reclamation projects, was selected as the study area. The small baseline subset–interferometry synthetic aperture radar (SBAS-InSAR) method was applied to derive the map of velocity distribution and accumulated deformation with 70 Sentinel-1 synthetic aperture radar (SAR) images collected from 22 March 2015 to 2 December 2019. In addition, 25 undisturbed soil samples, including dredger fill and underlying soil layers, were collected from five boreholes (maximum depth 55 m) through a field investigation. Laboratory tests were then performed on all soil samples in order to facilitate an understanding of geological features, including the measurement of basic physical properties, cation exchange capacity, compressibility, microscale structure, and pores. The present results show that the whole CES was undergoing differential ground deformation, with a velocity ranging from −47.5 to 34.6 mm/y. Fast (−3.4 mm/y) to slow (−0.3 mm/y) mean subsidence velocities were detected in multi-phase reclamation areas from inland areas to the coastline, and were controlled by building load and geological features of soil layers. Urbanization is the main factor that triggers accelerated subsidence and should receive special attention for reclamation areas that have been finished for a long time (over 20 years in this study). The geological features indicated that poor drainage conditions in offshore soil layers resulted in slow subsidence. The field investigation and laboratory test can be powerful explanatory tools to monitor the results from a mechanical perspective.

Graphical Abstract

1. Introduction

In recent decades, large-scale land reclamation by dredged soils has expanded land resources and living spaces in many coastal countries [1,2], and hydraulic reclamation has gradually become the main method, thus forming a large number of building foundations that are composed of dredger fill [3,4]. In particular, China reclaimed about 1600 km2 of “new land” from 2002 to 2011 [5], contributing significantly to economic growth and the urbanization process. Shanghai is located at the estuary of the Yangtze River, surrounded by deep-water channels, and produces a large amount of dredged soil, which compensates for the increasing demand for land resources [6]. Shanghai has successively carried out many reclamation projects in Chongming East Shoal, Pudong Side Shoal, and Hengsha East Shoal (Figure 1a).
However, dredger fill is characterized by high porosity, high compressibility, high water content, low permeability, and a low bearing capacity [7]. After dredged soils are deposited, consolidation can occur not only in dredger fill but also in underlying soil layers. Therefore, land subsidence is an unavoidable problem in reclamation areas. Land subsidence is usually considered to be a series of hazards causing great economic losses [8]. It may cause substantial damage, such as ground fissures, loss of ground surface elevation, and ground collapse. Furthermore, land subsidence can cause damage to farmlands, local constructions, and underground infrastructures [9,10,11]. Therefore, it is necessary to detect, and continuously monitor, land subsidence in reclamation areas in order to clarify the evolutionary processes so that appropriate measures can be taken to safeguard life and to ensure the safety of property.
Traditional deformation monitoring methods, such as spirit leveling and the use of the Global Positioning System (GPS), are reliable and have a millimeter-level accuracy [12]. Nevertheless, it is difficult to facilitate an understanding of large areas through sparse point subsidence information. Within this framework, a well-established remote-sensing technique, known as the differential interferometric synthetic aperture radar (DInSAR) has proven to be a powerful geodetic tool for investigating land subsidence on a large spatial scale [13,14]. DInSAR can detect highly reliable information of ground deformation with the outstanding technical advantages of wide spatial coverage, high spatial resolution, and day-and-night and all-weather working capability [15,16,17,18,19]. However, for long time series deformations, conventional DInSAR suffers from the key limitation of temporal and geometrical decorrelations, as well as atmospheric artifacts, so it is difficult to obtain reliable monitoring results [20,21]. Therefore, advanced DInSAR methodologies have emerged. At present, the two most widely used DInSAR techniques are the permanent scatterers (PS) method and the small baseline subset (SBAS) method [22,23,24,25]. The PS-InSAR method has proven to be more suitable for deformation monitoring in urban areas; it relies on stable radar reflectors that consist of single targets that are unaffected by temporal and spatial decorrelations. Unlike PS-InSAR, the SBAS-InSAR method, proposed in the early 20th century [26,27,28], has a high data utilization rate; it is widely used in large-scale and distributed targets [29,30,31]. Reclamation areas are usually large and continuous and have complex land-use types. Their urbanization is still underway, so SBAS-InSAR is more appropriate for these areas. Land subsidence is essentially caused by the consolidation and compression of loose soil layers, resulting in the slow reduction of ground elevation [32]. However, studies on the interpretation of InSAR-derived deformations in relation to field investigation and geological features in multi-phase reclamation areas are insufficient [33].
This paper aims (1) to monitor the ground deformation of a typical multi-phase reclamation area in Shanghai using the SBAS method, and to perform a zone division and corresponding time series analysis in order to illustrate the overall deformation characteristics; (2) to explore the relationship between SBAS-derived deformation and reclamation time and urbanization, for the purpose of a driving force analysis; (3) to investigate the geological features, including physical and chemical properties, compressibility, distribution of microscopic pores, and the microstructure characteristics of soil in different phases of reclamation areas and (4) to draw a correspondence between the SBAS-derived deformation and the soil properties in order to reasonably interpret the monitoring results. This study can offer guidance for future construction and provides a reference for the prevention and control of land subsidence.

2. Materials and Methods

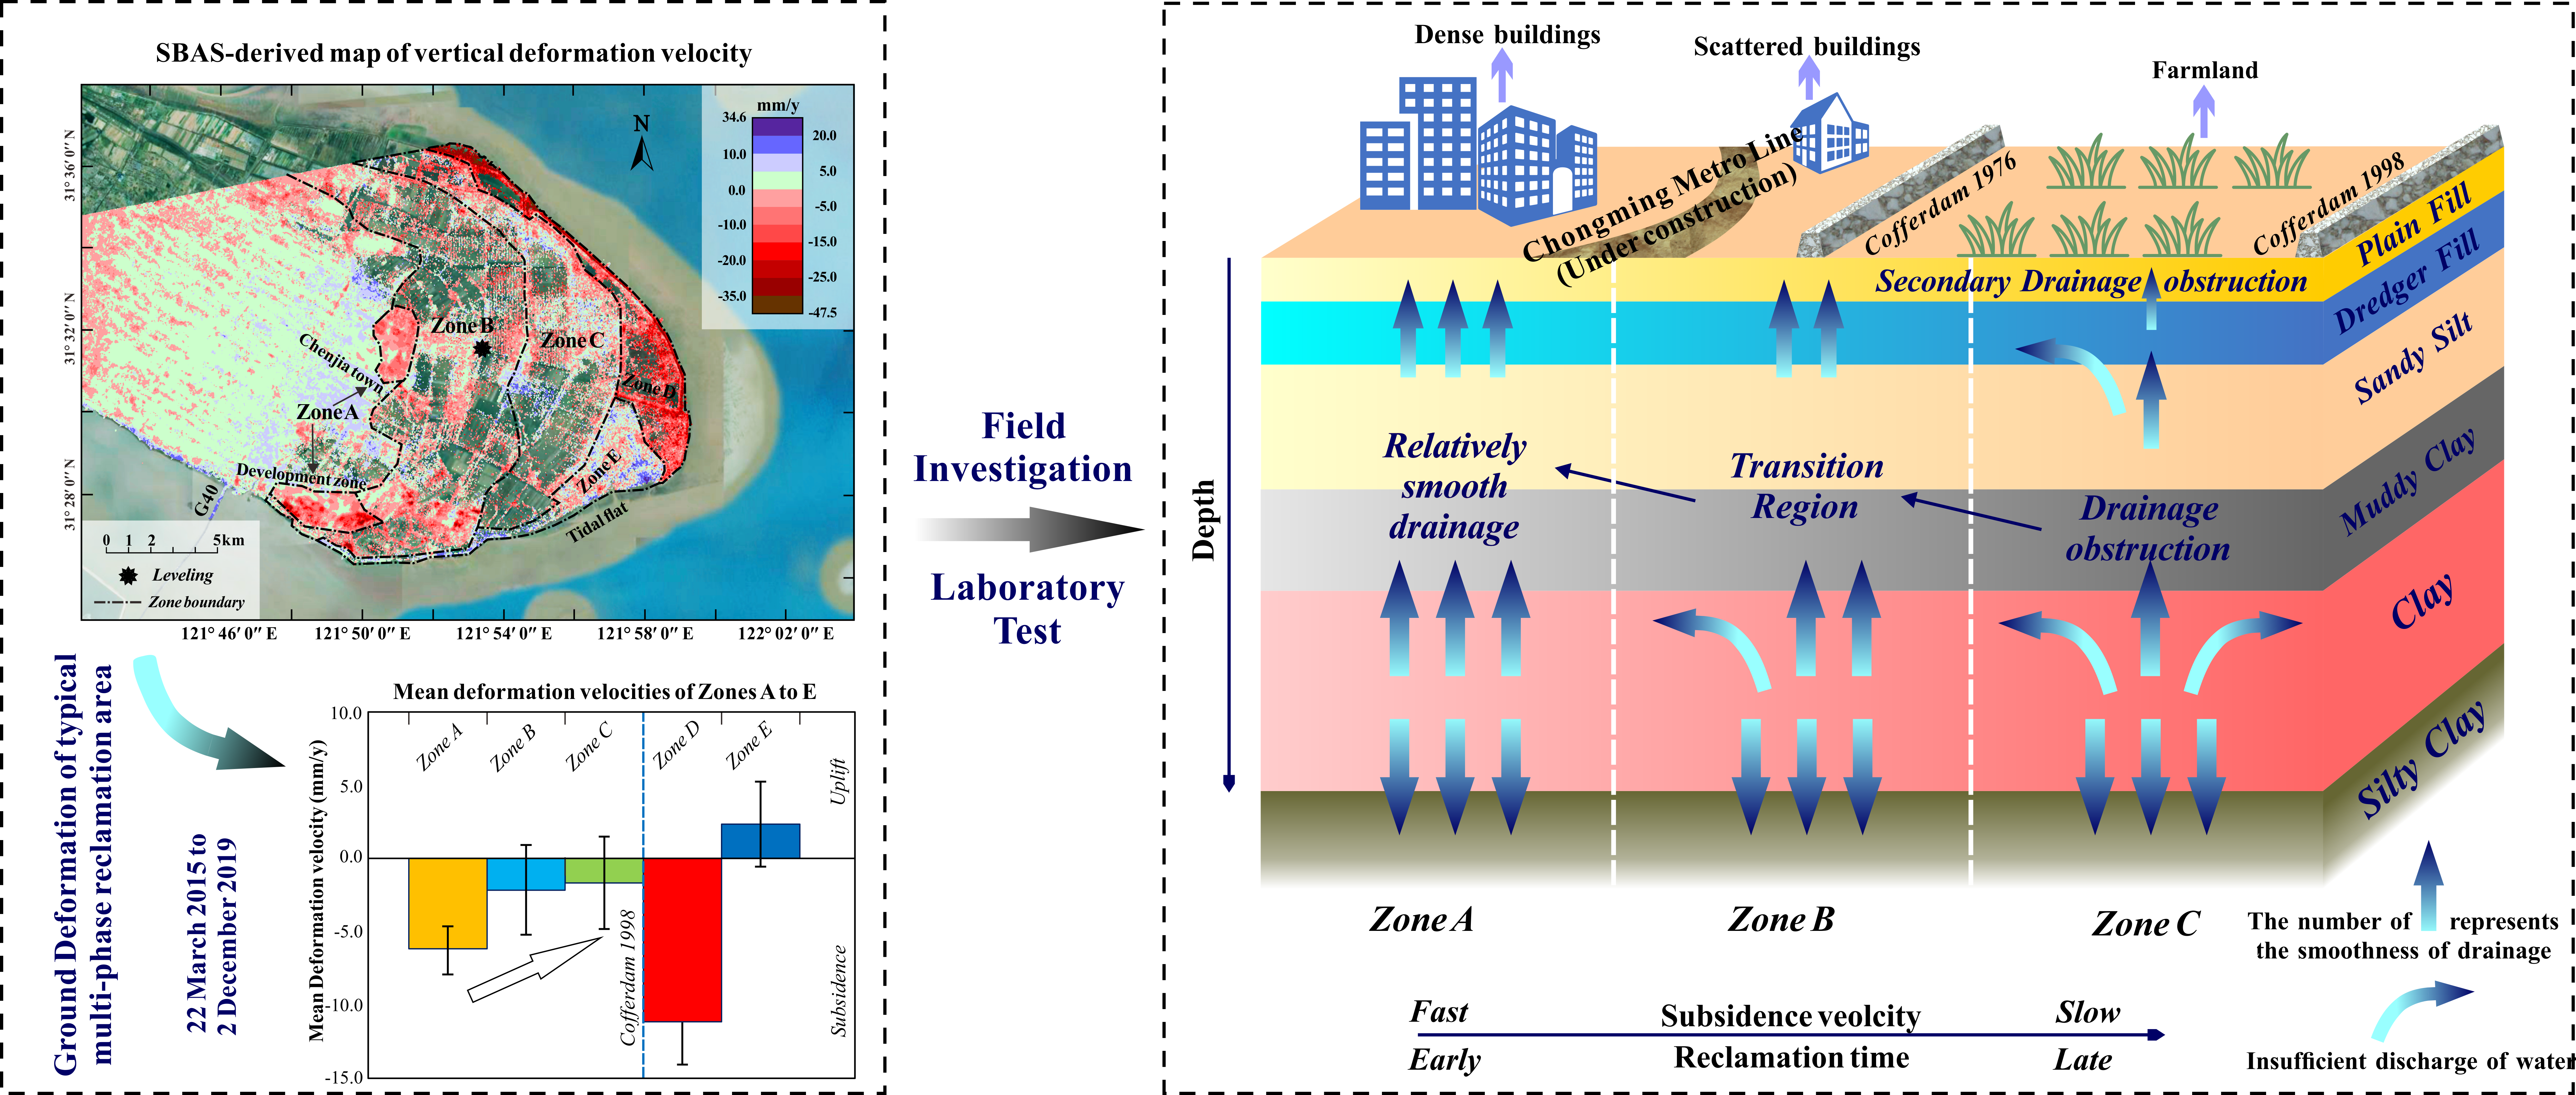
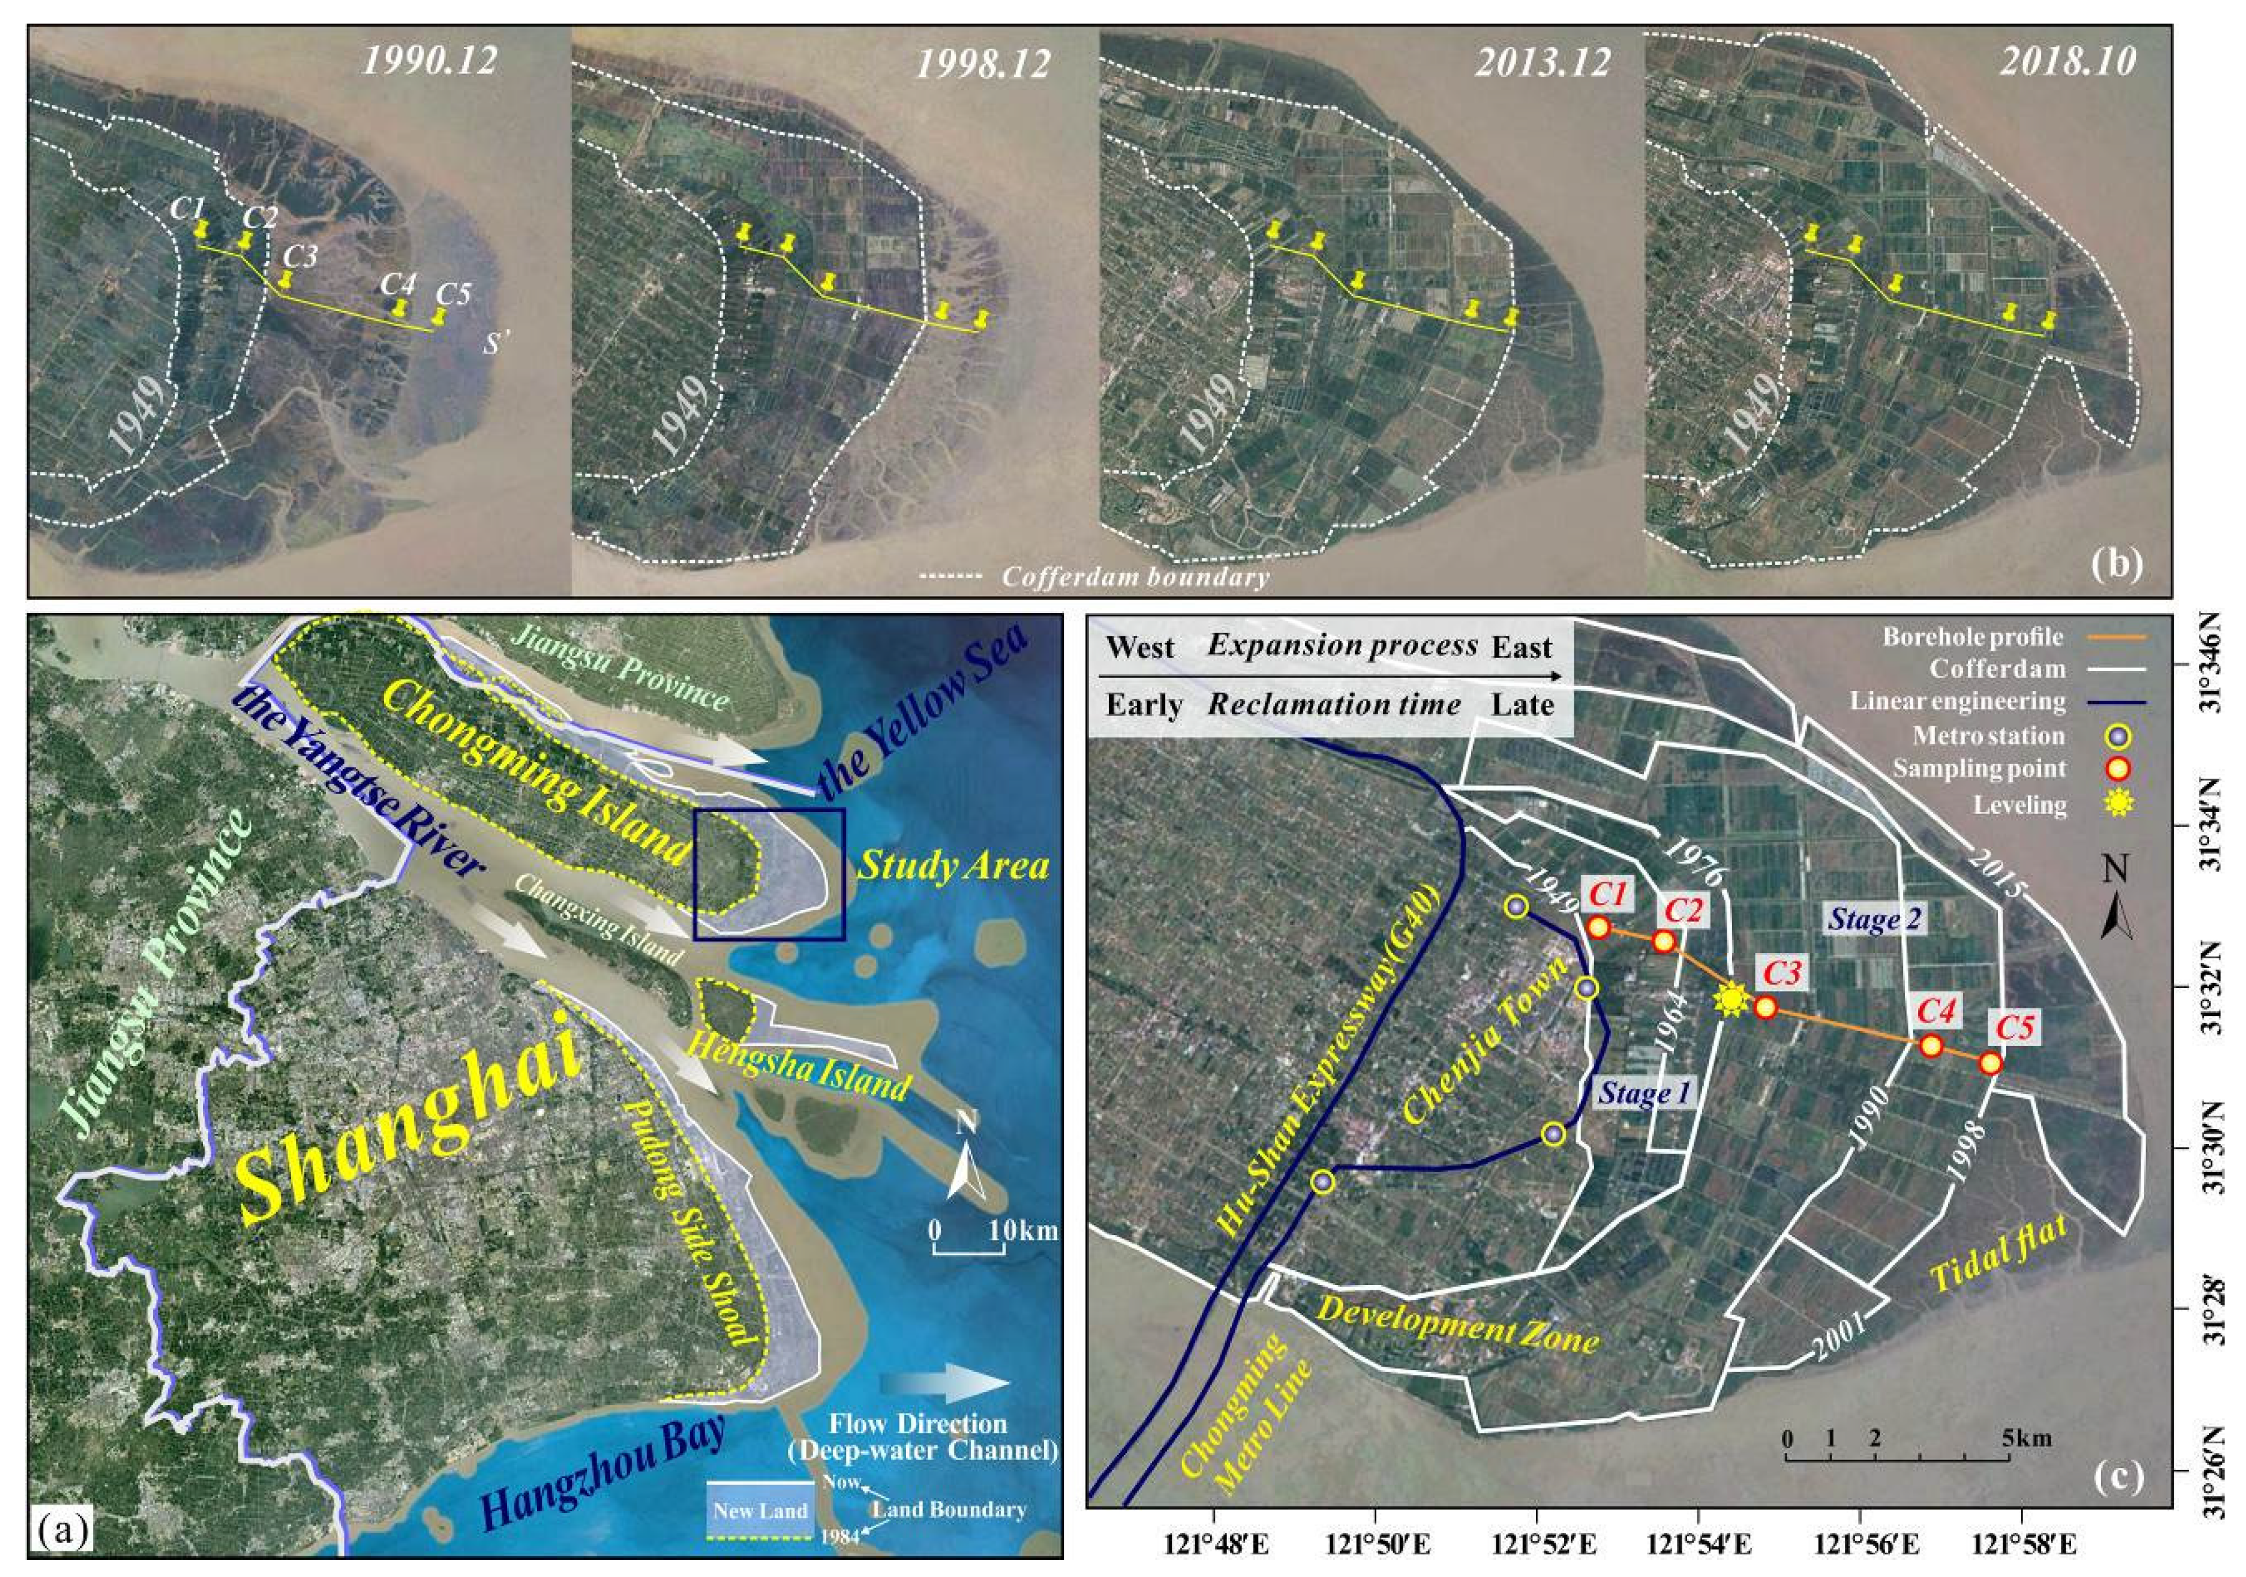
2.1. Field Investigation-based Stratigraphic Structure and Laboratory Test

Shanghai is geographically located in the southeast front of the Yangtze River Delta, and has a flat terrain and dense river ports. The average elevation of Shanghai is 4 m, based on the Wusong zero elevation point. The bedrock surface in Shanghai is covered by the Quaternary deposits (alluvial) with a thickness of approximately 250-300 m, except for the exposed sporadic volcanic residual hills in the southwest. On the whole, the faults within the bedrock show low activities [34]. Flocculation and sedimentation of fine sediments are among the main causes of sediment deposition in estuarine and coastal areas [35,36]. Sediment carried into the sea by the Yangtze River is deposited in Shanghai by the ocean tide. Its geological environment was such that Chongming Island, the largest alluvial sand island in China, began to emerge and gradually developed into the current pattern from 618–626 (Figure 1a). Chongming East Shoal (CES) is located at the easternmost end of Chongming Island, which is close to the intersection of the Yangtze River and the Yellow Sea (Figure 1a). As a typical multi reclamation area, CES expanded quickly from west to east (Figure 1b). The more eastward it is located, the later the reclamation time is along the long axis. As shown in Figure 1c, five cofferdams that were built in 1949, 1964, 1976, 1990, and 1998 bound the reclamation area. Furthermore, the reclamation area could be divided into stage 1 and stage 2 by the cofferdam built in 1976—representing two upsurges in reclamation activities.
At present, the land of CES is usually used for agriculture. However, in order to meet the development needs of Shanghai’s economic integration, a large area of construction land has been planned. Furthermore, the Chongming metro line (Figure 1c), linking Shanghai City, Changxing, and Chongming Island, is about to start construction and will further promote local development and construction. Previous studies focused on the Pudong Side Shoal, which has a rapid development and utilization speed [5,13,14], but there are few studies available for land subsidence analysis on CES. To fill this gap, CES was selected to explore the spatiotemporal patterns of the ground, and we paid more attention to the reclamation areas east of the G40 highway. At present, the deformation of soft layers shows an increasing effect on land subsidence, and the clayey soft layers, down to approximately 75 m deep, have gradually become the major parts where land subsidence happens in Shanghai [37]. Thus, a detailed analysis of the geological features of the shallow soft layers is needed. Five boreholes, C1 to C5, with a depth range of 55-70 m, were arranged (Figure 1c) to explore the geological features of soil under different reclamation projects. Here, field investigations were conducted in the reclamation area within the cofferdam built in 1998, as the reclamation area outside the cofferdam built in 1998 cannot be accessed. Figure 2a shows a geological section map. Note that the slight fluctuation of the surface is omitted here because the maximum elevation difference of the surface at each borehole is about 1 m. A total of 25 undisturbed soil samples were collected through field investigations, and each soil sample was marked in the form of an acronym of soil type-borehole number. For instance, the plain fill of borehole C1 was recorded as PC1 (Figure 2a).
It can be seen that the soil layers are similar, except for the soil layers around borehole C3 (with thin layers). Meanwhile, based on existing information [38,39], the main geological soil layers are shown in Table 1, according to their geological age and lithology. Moreover, the widespread soil layers, including the plain fill, dredger fill, sandy silt, silt clay, and clay, from top to bottom, are shown in Figure 2b.
Greyish yellow plain fill ①3-1 is a dense and hard soil layer that supports local agriculture and roads, and only makes a small contribution to ground deformation. Dark gray dredger fill ①3-2 is characterized by a high water content, large void ratio, and high compressibility in the initial sedimentary stage. However, the dredger fill in CES was consolidated for more than 20 years and its geological features may differ significantly from before. The gray sandy silt ②3 has similar geological features to those of dredger fill. They are both silty soils that prone to compression. During field investigations, dredger fill and sandy silt were distinguished by the black interlayer (Figure 2c) that was formed by floating plant debris. Typical strata in CES are characterized by a very thick Holocene deposition (represented by clayey and sandy silt layers). Muddy clay ④, clay ⑤1-1, and silty clay ⑤1-2 are typical soft soil layers in Shanghai with high compressibility. The above three clayey soil layers are easily deformed during construction. In particular, fingerprints can be easily left on the smooth and fine clay (Figure 2d). In reclamation areas, land subsidence is usually induced by primary consolidation, long-term secondary consolidation of alluvial clay deposits, and creep within the dredger fill [32,40,41]. Since the reclamation projects in CES have been completed over 20 years, the long-term secondary consolidation of clayey layers is considered to be the major mechanism causing land subsidence when the stress conditions of strata have not changed significantly.
The geotechnical parameters of soil layers in CES are far less than those in the urban area of Shanghai, because the study of land subsidence in CES is being in its infancy. In this study, laboratory tests were, therefore, performed on all soil samples in order to obtain the geotechnical parameters of the soil layers from macro- and micro-perspectives. The laboratory tests included measurements of basic physical properties (water content, wet and dry density), cation exchange capacity (CEC), and rapid consolidation. All tests were conducted under the guidance of the Standard for Soil Test Methods (GB/T 50123-1999) [42]. A KTG-GY auto-consolidation instrument, which can automatically pressurize, collect data, and calculate the compression index CC, was used in the rapid consolidation test, with a loading order of 0.0125, 0.025, 0.05, 0.1, 0.2, 0.4, 0.8, and 1.6 Mpa. Macroscopic ground deformation is, typically, characterized by the accumulation of the displacement and deformation of soil particles on the micro-scale [43,44,45,46]. Mercury intrusion porosimetry (MIP) and scanning electron microscopy (SEM) were conducted on representative soil samples to (a) test the porosity and distribution of microscopic pores by AUTO-PORE 9500 (Micromeritics Instrument Corp., Norcross, GA, USA) and (b) to observe the spatial structure of soil particles by Phenom ProX (Generation 5) on the micro-scale.

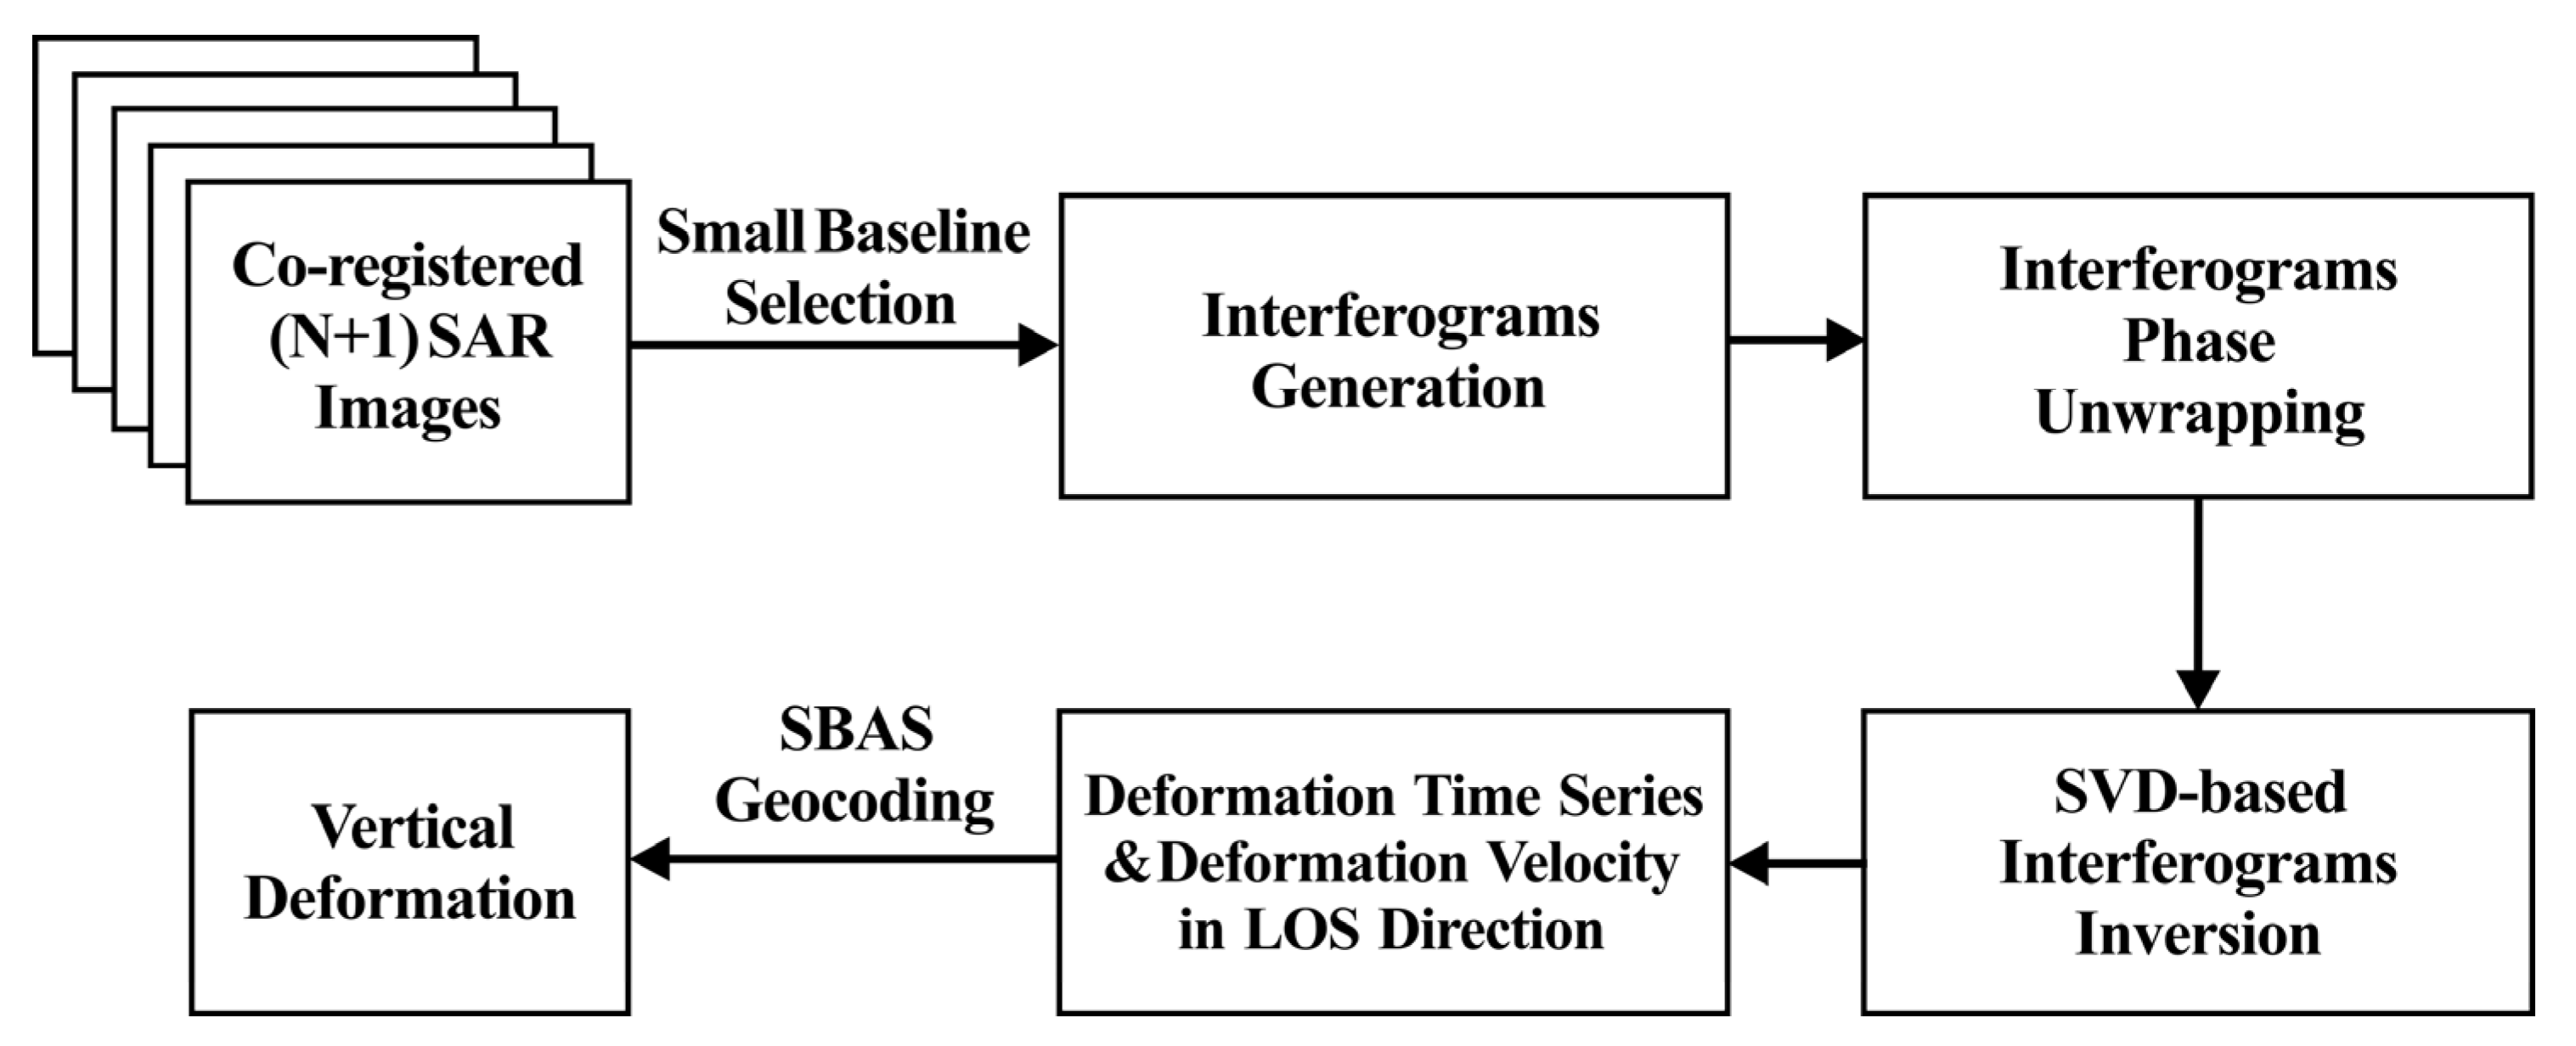
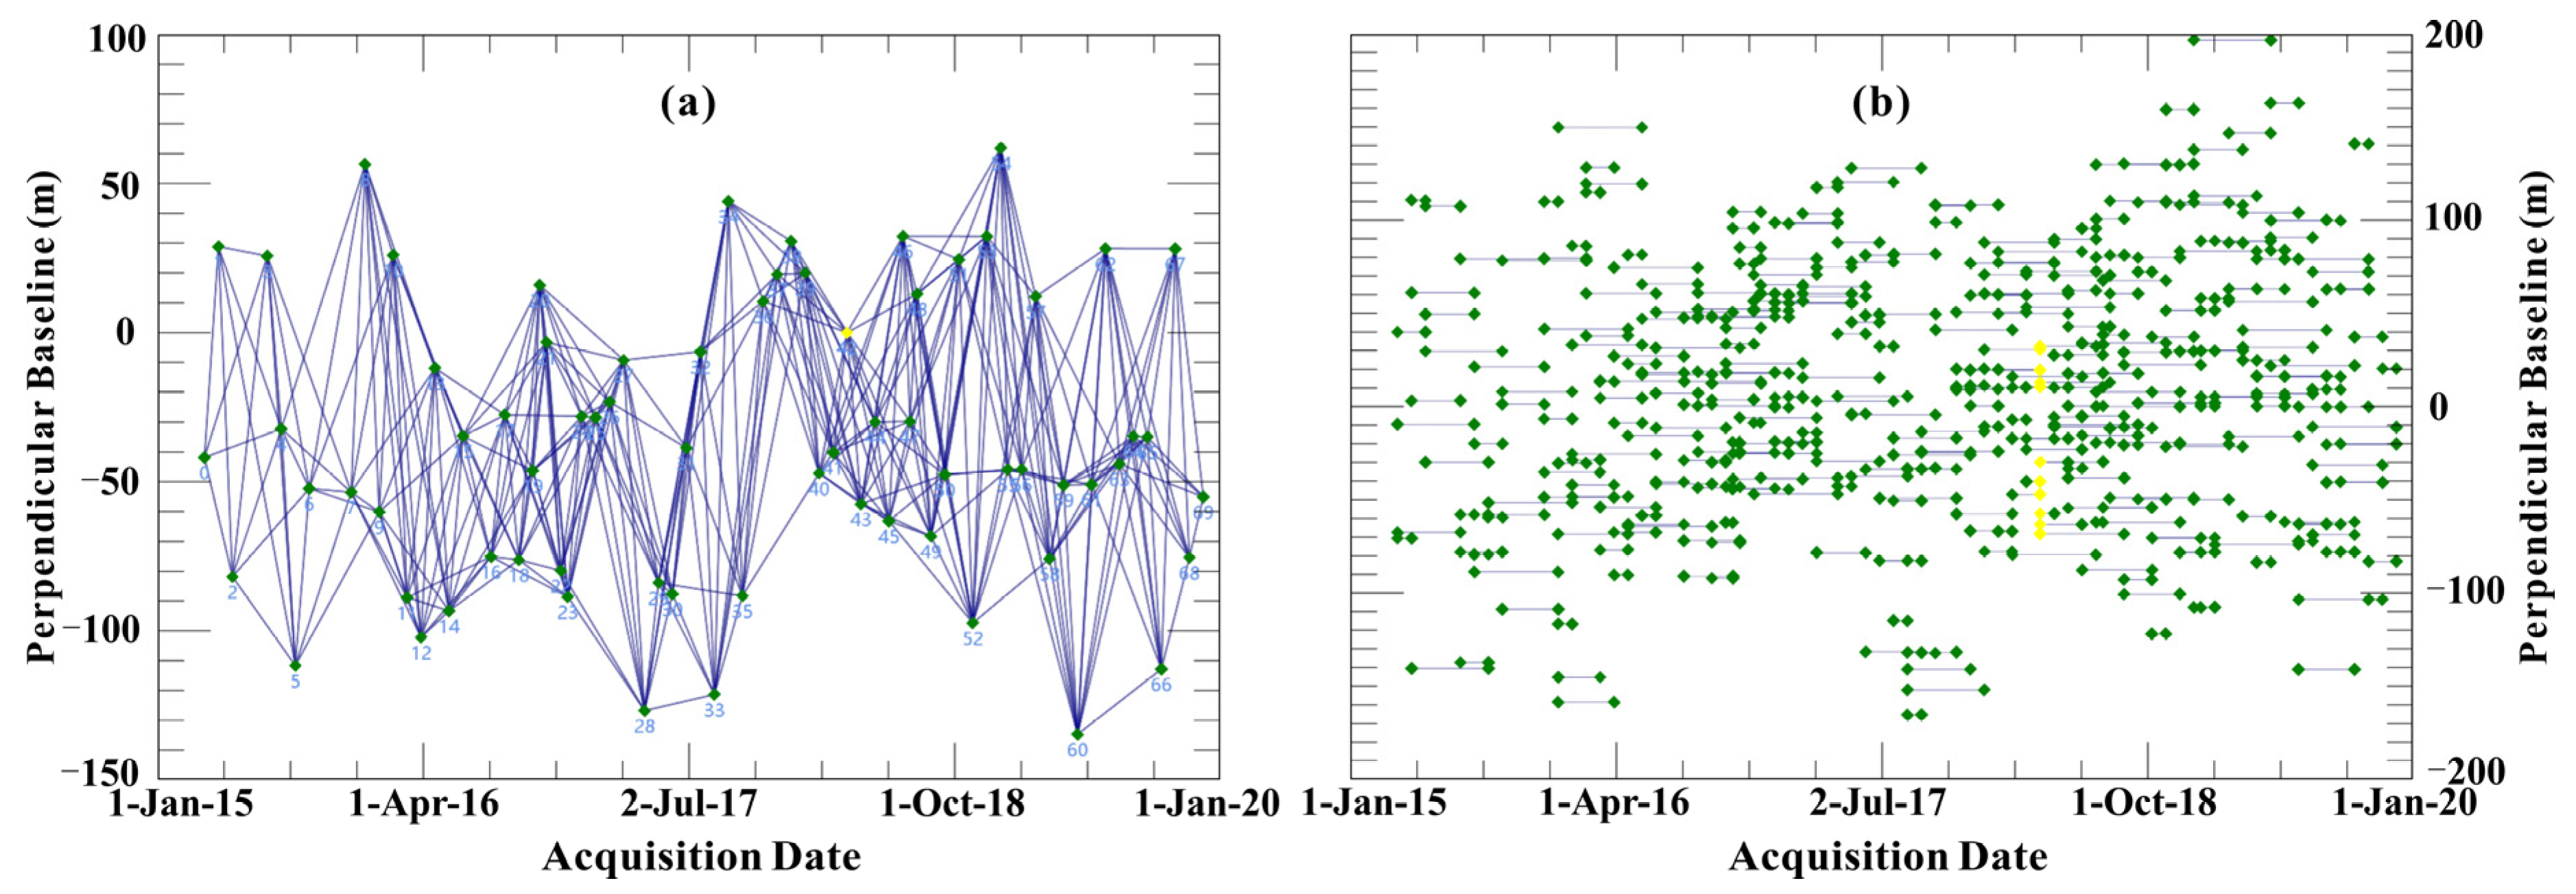
2.2. SBAS-InSAR Processing

SBAS is a post-processing algorithm designed to generate deformation velocity maps and displacement time series by using standard multi-look DInSAR interferograms. According to the relevant literature [26,27,28], we here provide a simplified basic theory of SBAS to facilitate a preliminary understanding of the methodology, and the corresponding workflow is shown in Figure 3.
A set of N + 1 SAR images over the same area was acquired at ordered times (t0, ⋯, tN). Additionally, it was assumed that all images are co-registered with respect to one image that was selected as the common master image so that a common grid can be used. Then, M interferograms can be generated and combined by creating the thresholds of the small baseline conditions:
N + 1 2 M N ( N + 1 2 )
For a generic interferogram i, generated from SAR images acquired at times tB and tA ( tB > tA), the phase signal of each unwrapped interferogram for a coherent pixel, located at coordinates (x, r), is as follows:
δ ϕ i ( x , r ) = ϕ ( t B , x , r ) ϕ ( t A , x , r ) Δ ϕ d i s p + Δ ϕ t o p o + Δ ϕ o r b + ϕ a t m + Δ ϕ n o i s e
where (x, r) is the coordinate of the image with a high coherence point, ϕ (tB, x, r) and ϕ (tA, x, r) are the phases of the two SAR images, and ∆ϕ disp is the deformation phase caused by the change in the distance between the target and the radar in the line of sight (LOS) direction from tA to tB. In addition, ∆ϕ topo, ∆ϕ orb, ∆ϕ atm, and ∆ϕ noise account for the phase errors induced by topography, satellite orbit, atmosphere, and other noises, respectively. For SBAS-InSAR, deformation phase ∆ϕ disp can be obtained by removing the residual components from the interferometric phase, and then a system of M equations with N unknowns can be defined as follows:
A ϕ = δ ϕ
where A represents an M × N coefficient matrix related to the set of interferograms generated from the available data, and ϕ = [ϕ(t1), ϕ(t2), …, ϕ(tN)]T is the N × 1 vector of unknown deformation phases based on measurement points. Moreover, the unwrapped phase values can be expressed as δϕ = [δϕ(t1), δϕ(t2), …, δϕ(tN)]T. Moreover, the present unknowns can be replaced with the mean phase velocity ν, given by the following:
v = [ v 1 , v 2 , v N ] T = [ ϕ 1 t 1 t 0 , ϕ 2 ϕ 1 t 2 t 1 , , ϕ N ϕ N 1 t N t N 1 ] T
Accordingly, Equation (3) can be rewritten as follows:
B v = δ ϕ
where B is an M × N coefficient matrix corresponding to the unknown vector. Finally, the least square (LS) and singular value decomposition (SVD) methods can be applied to matrix B to calculate the deformation velocity. Then, the accumulated deformation of each image, relative to the first image, can be obtained by summing the deformation velocity and time span products. However, SBAS-derived displacements are in the LOS direction, and can be converted to vertical deformations because the vertical deformations dominate ground deformation in reclamation areas [47]. Therefore, the LOS measurements dLOS were converted into a vertical direction dv, according to the following incidence angle θ:
d v = d L O S c o s θ
The SAR data were collected from the Sentinel-1 satellite that was launched by the European Space Agency [48,49,50]. The corresponding precise orbital ephemeris data of AUX_POEORB was also acquired to refine the orbit. It should be noted that the study area was only covered by ascending SAR images. For SBAS-InSAR, the more data inputted, the more accurate the obtained results can be. Additionally, we focused on the latest and most detailed ground deformation characteristics, so 70 Sentinel-1 single-look complex (SLC) SAR images were collected from 22 March 2015 to 2 December 2019, with a mean sampling interval of approximately 24.5 days. In addition, global terrain data (shuttle radar topography mission, SRTM), provided by the National Aeronautics and Space Administration (NASA), were also needed to simulate and remove the topographical phase. The basic parameters of the SAR datasets are shown in Table 2.
The Environment for Visualizing Images (ENVI) and SARscape software were used to process the SAR images. The first step is to generate interferometric pairs with a high coherence. Only interferometric pairs with a spatial baseline smaller than 191 m and a temporal baseline shorter than 150 days were selected, following the small baseline rules. As shown in Figure 4, the SAR image on 30 March 2018 was selected as the common master image, and is denoted by the yellow diamond. The green diamonds represent the slave images and each line donates a connection between two SAR images. Finally, 371 interferometric pairs were generated with uniform connections. During the interferometric process, a Goldstein filter was used to remove the noise phase [51] and the minimum cost flow (MCF) method was applied for phase unwrapping [52]. The coherence threshold, used for the pixel selection, was set to 0.3. In addition, the azimuth looks and range looks were set to 5 and 1, respectively. When generating ground deformation, one hundred and twenty-five ground control points (GCPs) that approved the quality inspection were utilized in the area to the west of the G40 expressway in order to eliminate the change of phase caused by satellite orbit errors and remove the residual topographic phase. An atmosphere high path size of 365 days and an atmosphere low path size of 1200 days were utilized to alleviate the atmosphere delay [53].

3. Results and Discussion

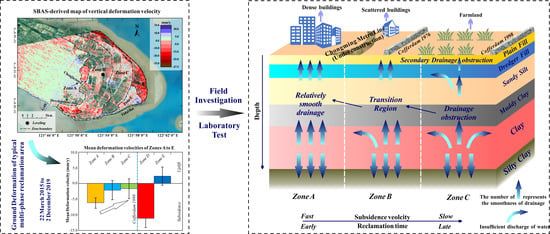
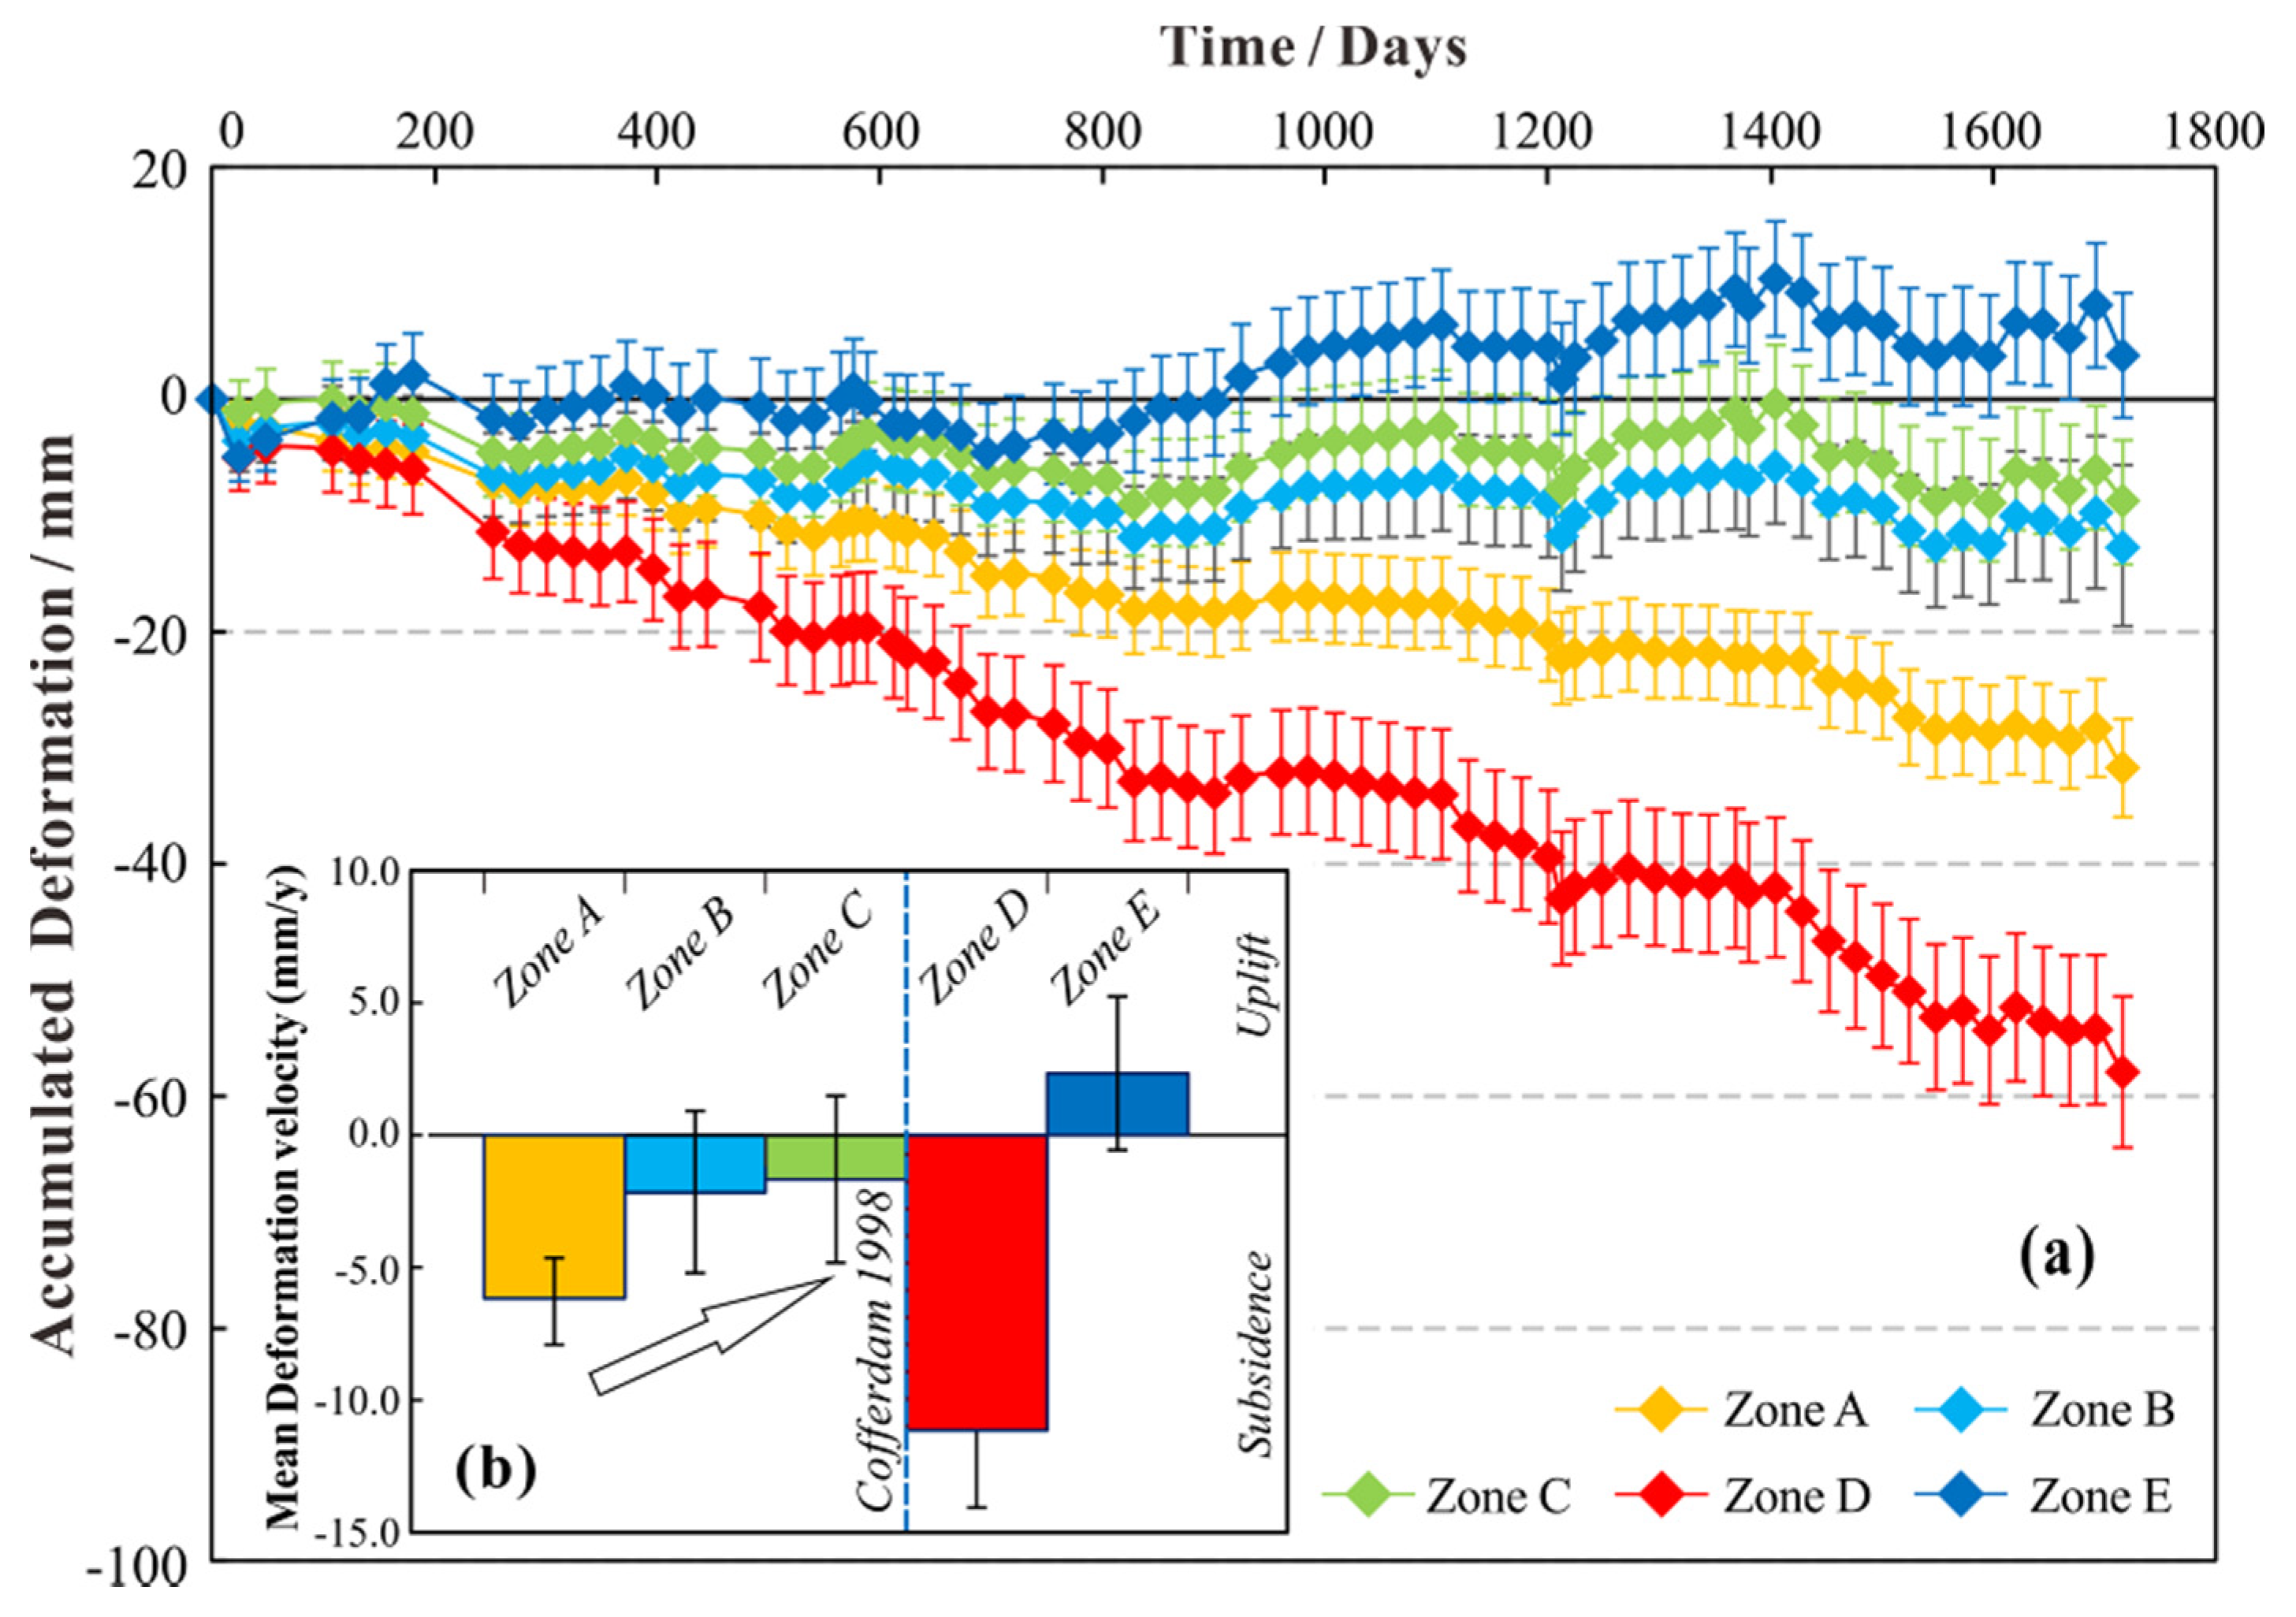
3.1. Ground Deformation Characteristics

Using the SBAS technique, we detected the deformation velocity map (Figure 5a) in CES, as measured from 22 March 2015 to 2 December 2019. The negative values of deformation velocity represent land subsidence, whereas the positive values reflect uplift. The errors of velocity were estimated in order to determine the precision and uncertainty of the SBAS results, as shown in Figure 5b. The SBAS results are highly accurate (0.2–3.0 mm/y) within the earlier regions before 1949, especially in dense building areas, such as Chenjia Town and the southern development zone (0.2–1.0 mm/y). However, the velocity in the east of the cofferdam built in 1949 shows a relatively low precision (3.0–5.5 mm/y) due to a certain degree of decorrelation caused by widespread crops.

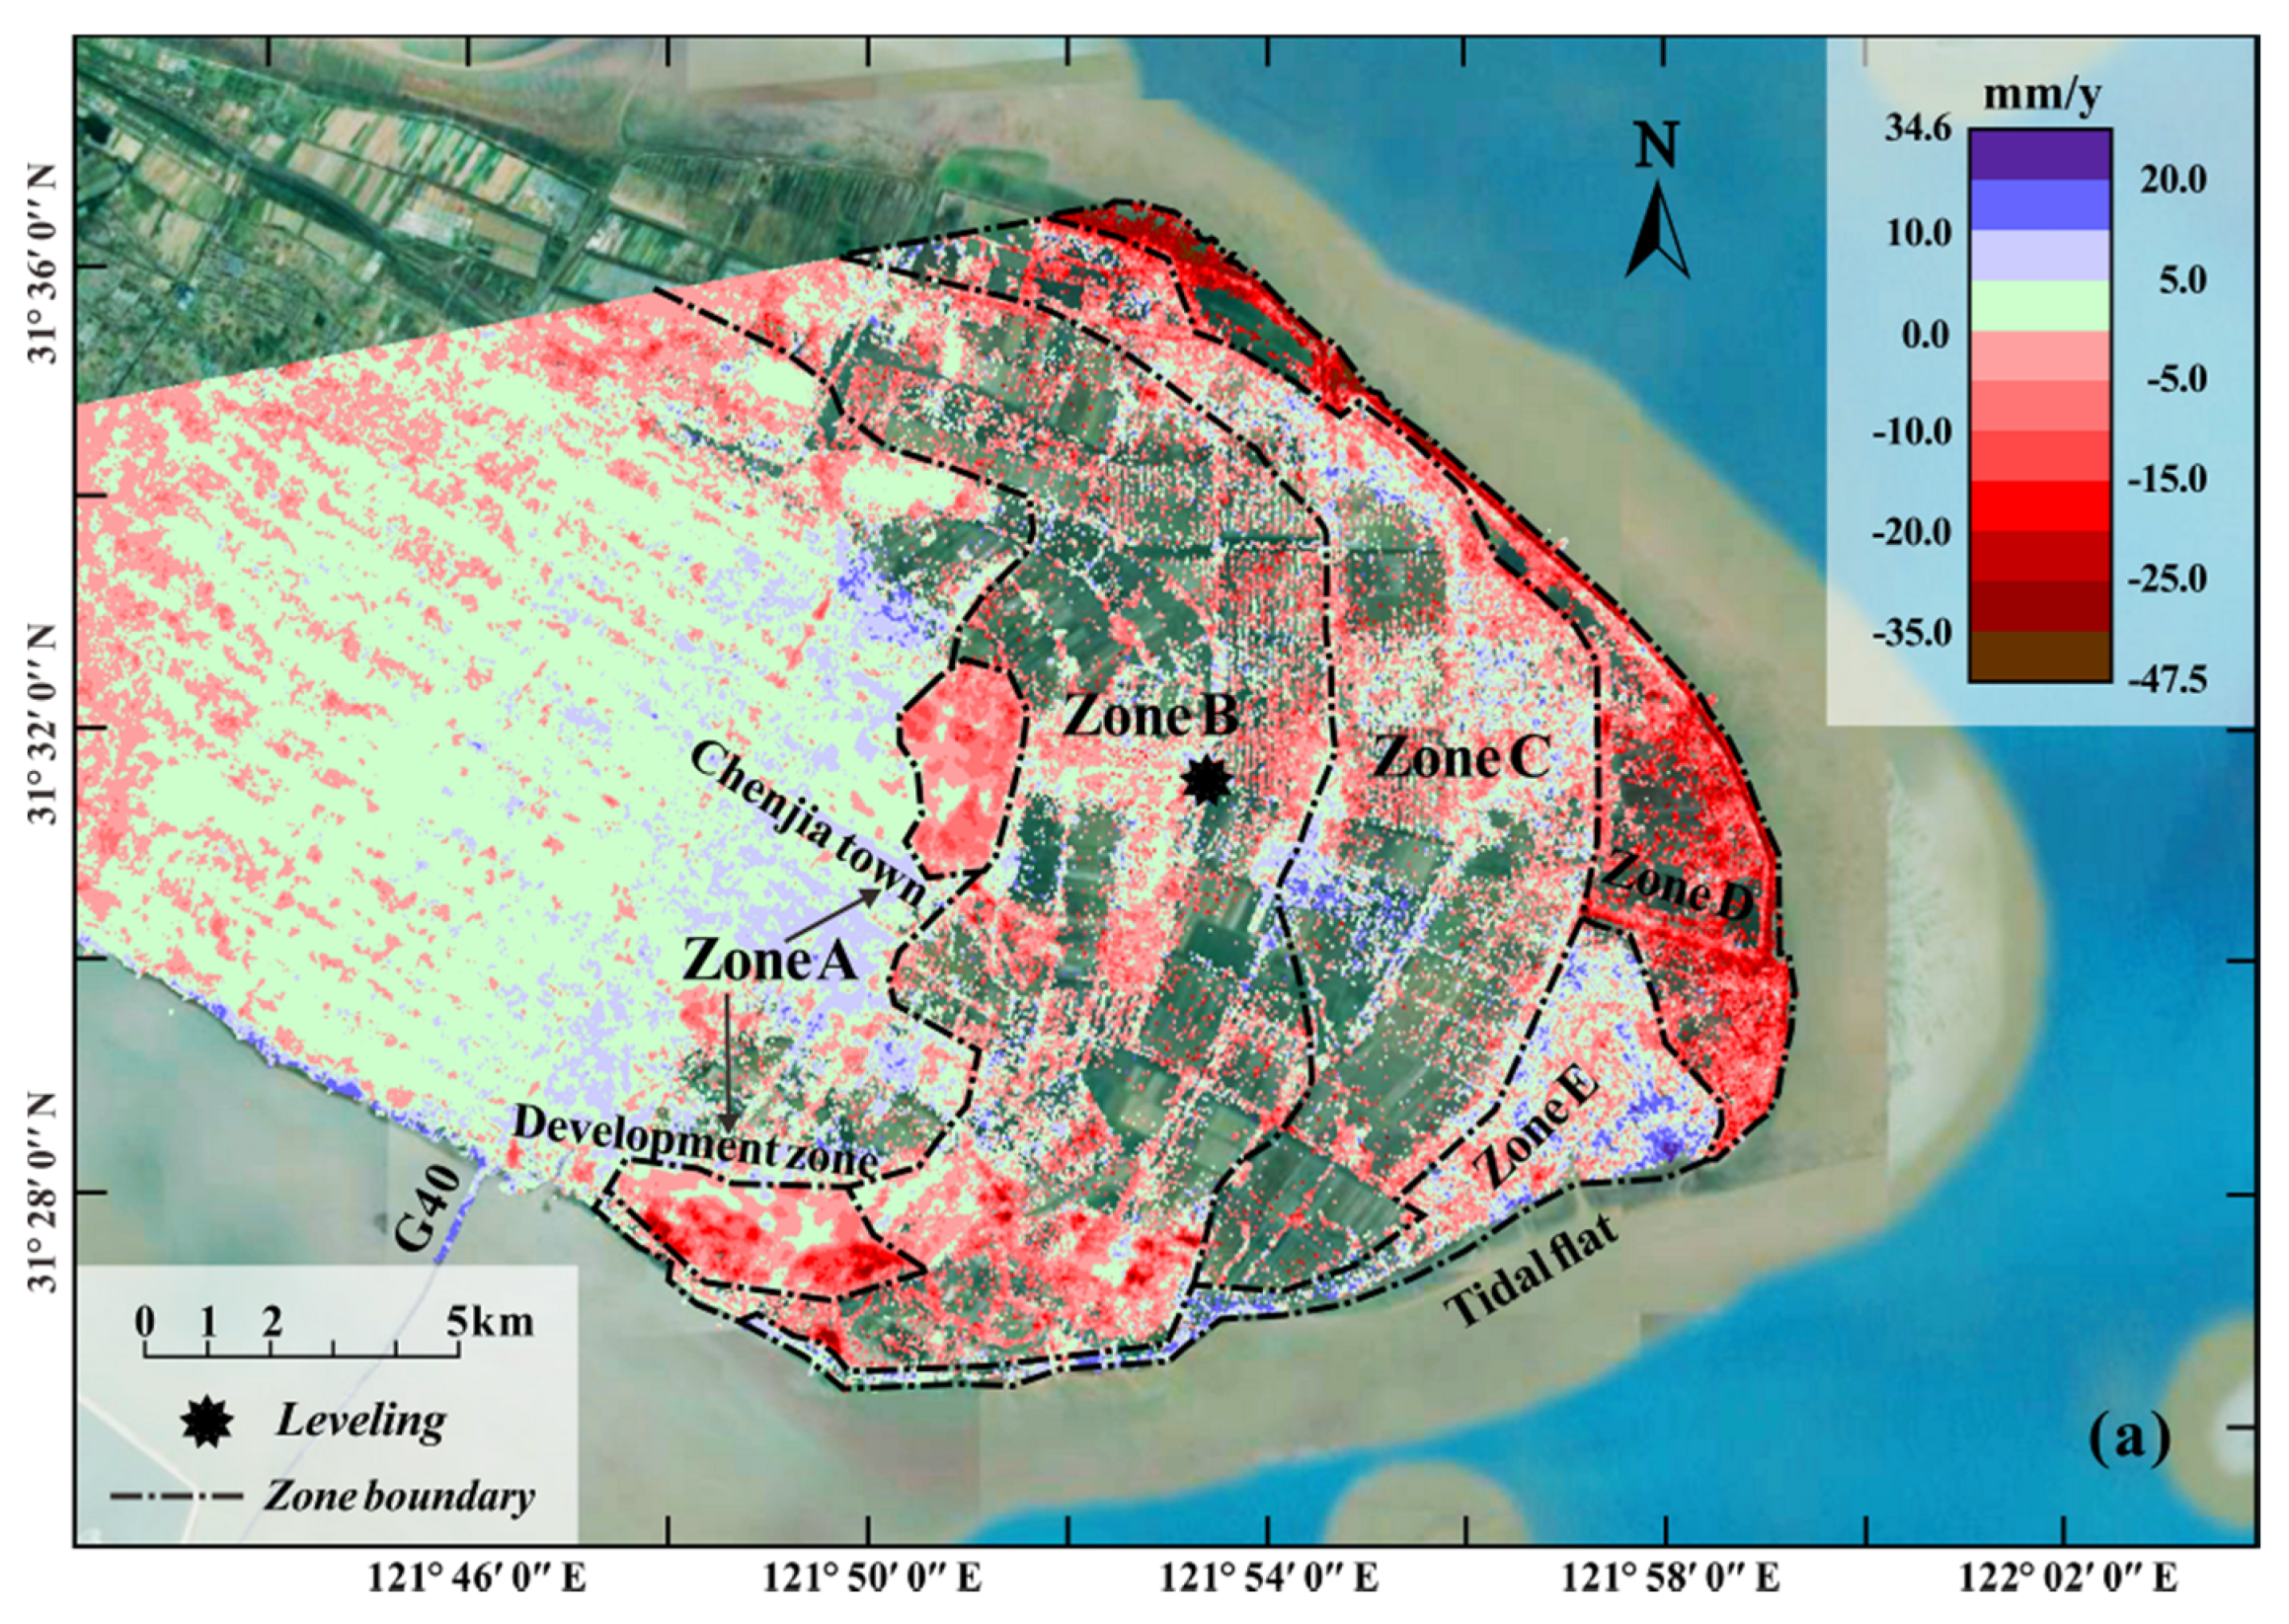
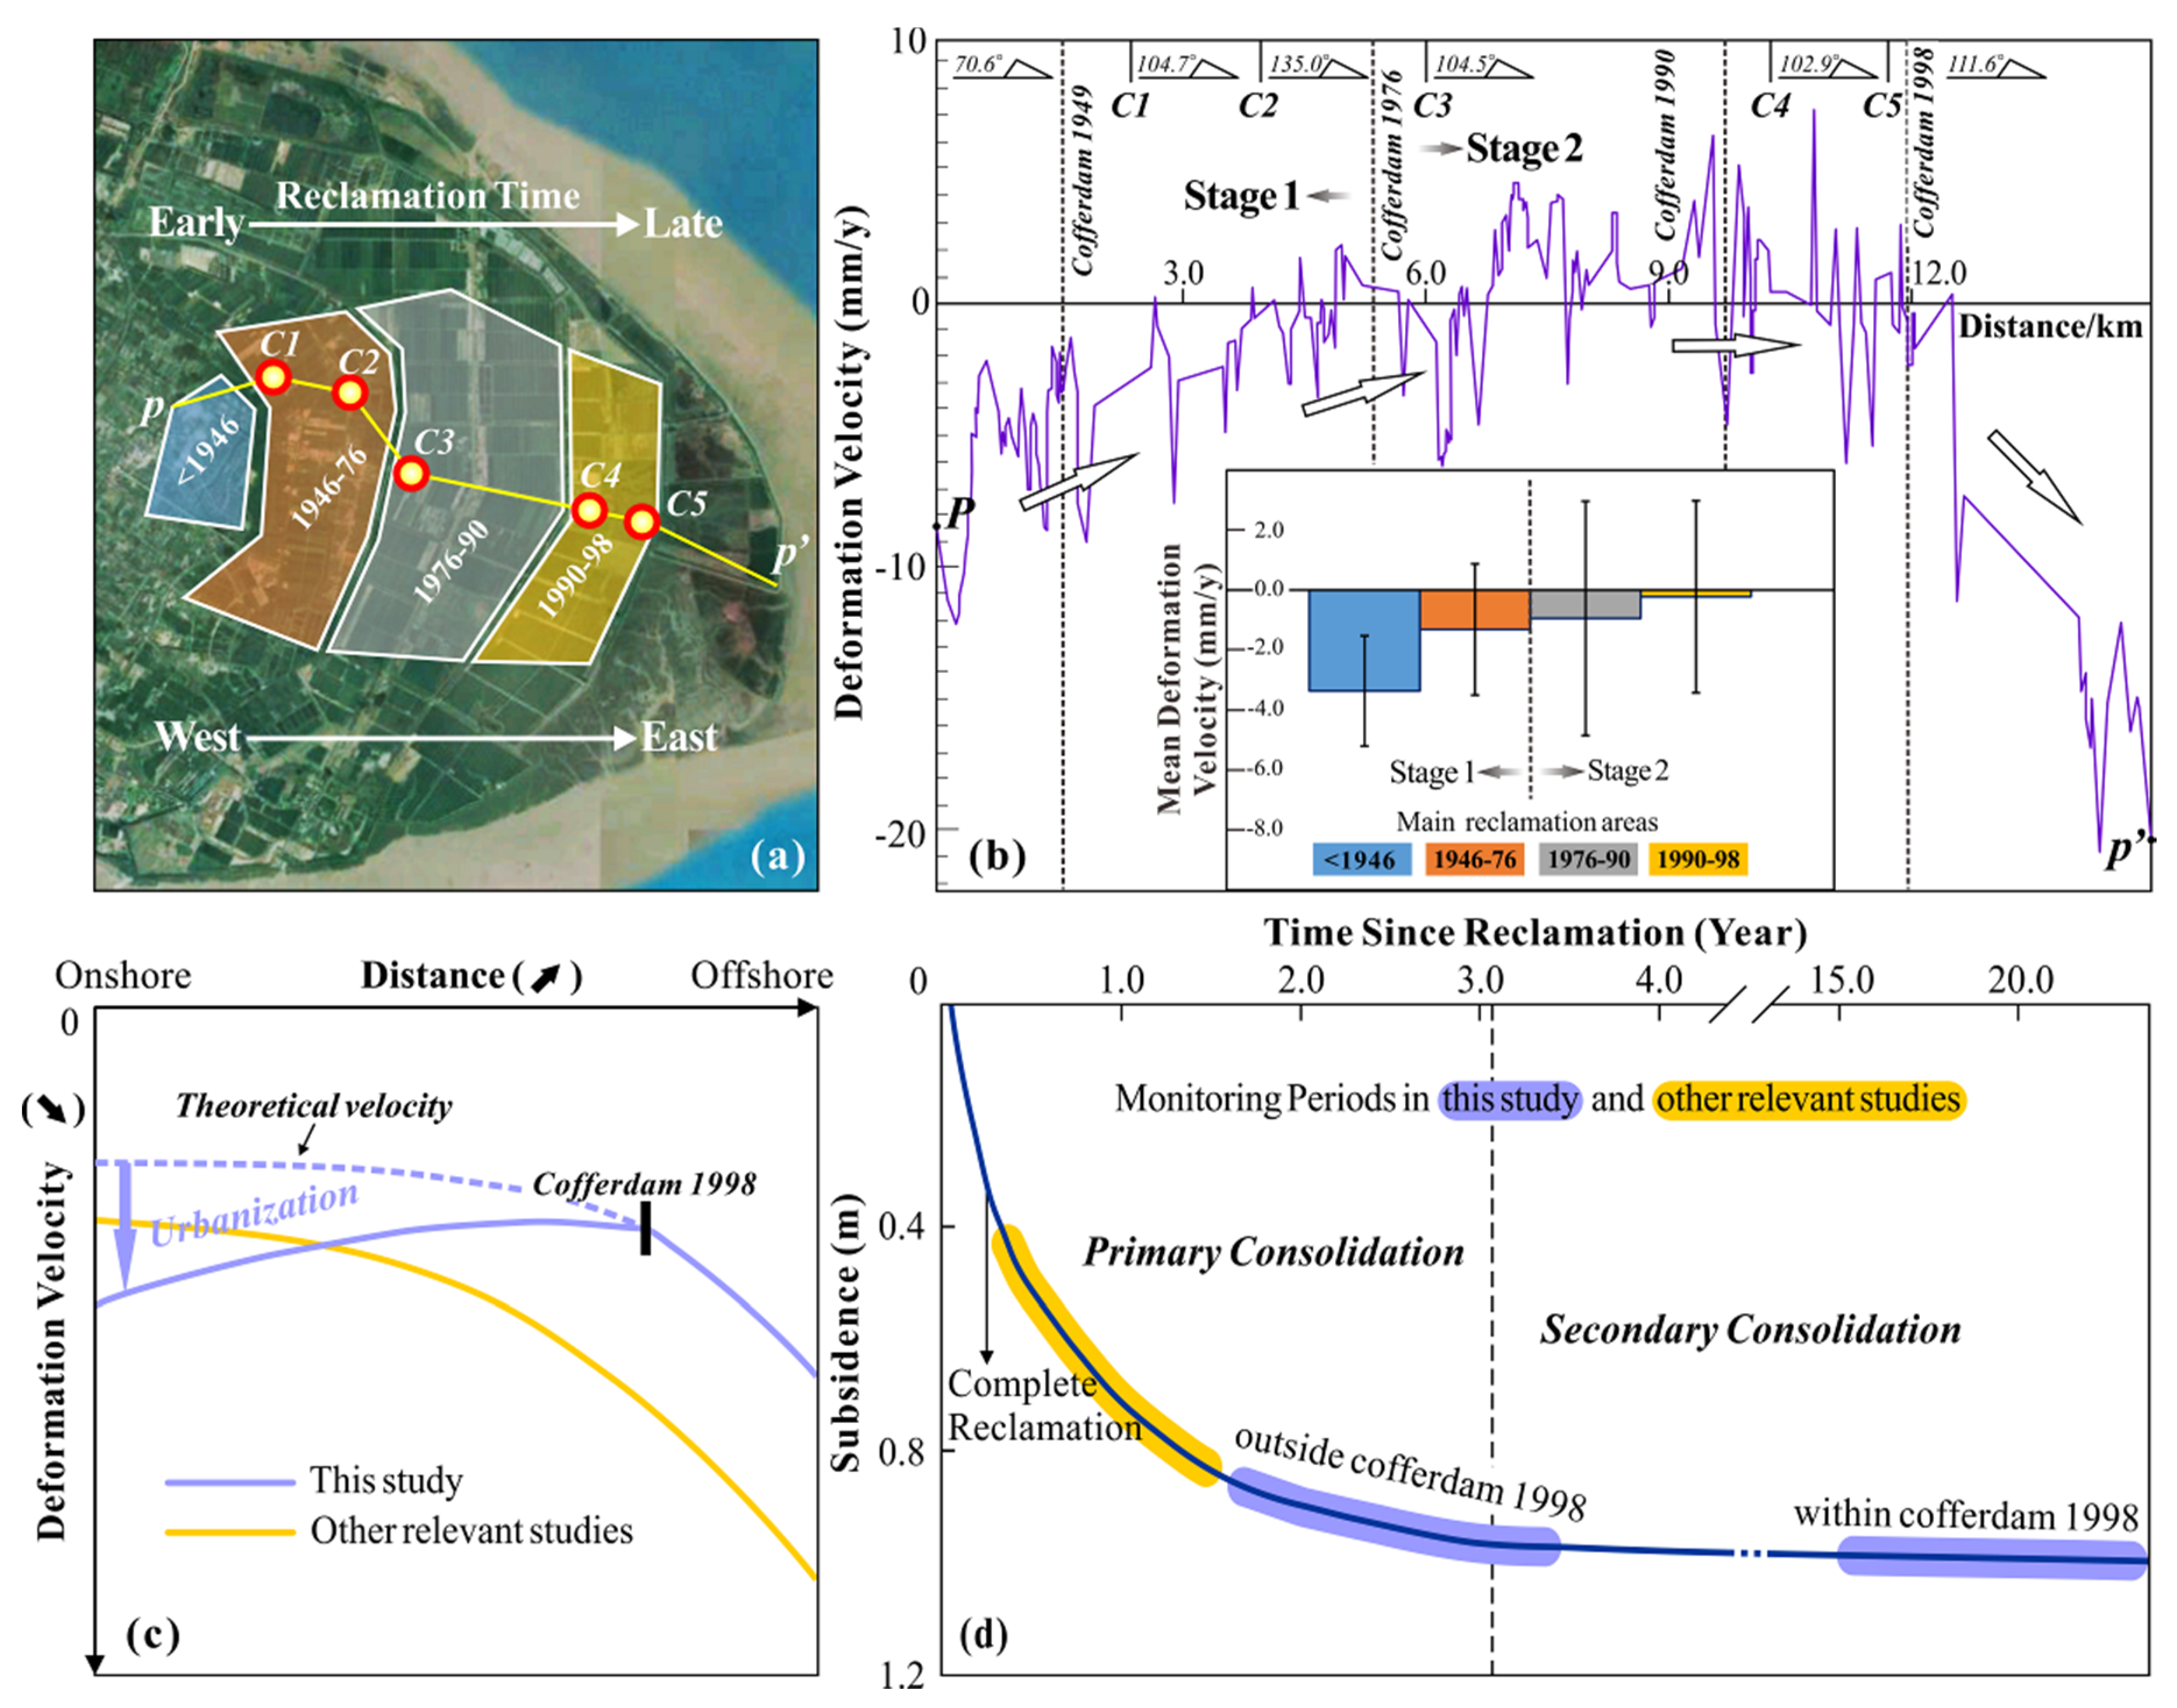
3.1.1. Spatial Distribution of Ground Deformation

According to the InSAR measurements in Figure 5a, the CES can be roughly divided into five zones (A, B, C, D, and E). Zone A, with concentrated and continuous subsidence pixels, coincides with the main urban area in CES. For zone B, its western part is determined by the boundary of relatively obvious subsidence and uplift, while its eastern part is bounded according to different velocity distributions (compared with zone B) and cofferdam locations. Zone C shows a staggered distribution of subsidence pixels and uplift pixels, where the number of uplift pixels (over 5 mm/y) has also significantly increased. Zones D and E were bounded by the peripheral cofferdam and most of the dark red pixels were concentrated in zone D.
When the boundary of each zone was determined, we could obtain statistics on the deformation velocity and evolution of each zone’s pixels to clarify the corresponding deformation characteristics (Figure 6). Subsiding zone A, with a deformation velocity of −6.2 mm/y and an accumulated deformation around −28.6 mm, was identified. Zone A includes Chenjia Town and the southern commercial development zone, where many roads and buildings cover the reclaimed land. In contrast, slight subsidence (−2.2 mm/y) was found in zone B, where the accumulated deformation had reached around −10.9 mm. Zone B is a transition area between the town and farmland, where relatively low buildings are scattered in villages. Zone B is also the key area for the next step of urbanization, where a large area of construction land has been planned. Ground deformation in zone C, as an agricultural area with few buildings, appeared quite stable with a deformation velocity of −1.6 mm/y, and the accumulated deformation over the past five-years was approximately 7.6 mm.
The above three zones are all within the cofferdam built in 1998, outside of which sit zones D and E, with the opposite deformation pattern. The most significant subsidence (−11.6 mm/y) occurred in the easternmost zone D, with accumulated deformation up to about −55.6 mm. The land there is barren. Finally, the southeastern zone E was the only zone to experience an uplift deformation, with 2.3 mm/y, and its accumulated deformation reached to around 10 mm. The increasing ground elevation is induced by sediment accumulation, and no reclamation project has been conducted here. Furthermore, driven by the tide or currents, the sediment on the surface of the tidal flat will displace to various degrees, inducing the largest deformation fluctuation of zone D among all five zones.

3.1.2. Correlation between Ground Deformation and Reclamation Time and Urbanization

As shown in Figure 6, the subsidence velocity from west to east (A→ B→ C) tends to decrease gradually within the cofferdam built in 1998. We calculated the mean deformation velocities of four main reclamation zones (Figure 7a) in the long axis direction and along the borehole profile (Figure 7b). In the reclamation area within the cofferdam built in 1998, along the long axis direction, the subsidence velocity does show a decreasing trend from −3.4 to −0.3 mm/y, along with a shortening of the reclamation time. At the same time, according to the deformation velocity along the statistics profile P–P’, the deformation in stage 1 is mainly subsidence, while the deformation in stage 2 tends to uplift. The results in Figure 7b show reasonable consistency with the pattern observed in Section 3.1.1.
In this study, the SBAS-derived deformation patterns of reclamation projects in different phases were not consistent with other relevant studies (Figure 7c) on land deformation associated with reclamation projects in coastal areas of China, such as Lin’gang New City, Shanghai [13,14], Xiamen New Airport, Fujian [47], and Shenzhen, Guangdong [29]. As mentioned before, primary consolidation, the long-term secondary consolidation of alluvial clay deposits beneath the dredger fill, and creep within the dredger fill are recognized as the three mechanisms relative to land subsidence in reclamation areas [32,40,41]. Subsidence induced by the primary consolidation of alluvial clays represents the majority of the settlement (70% or more in the case of the airport), and the typical secondary consolidation commenced three years after the reclamation was completed [32]. Moreover, the subsidence velocity in primary consolidation is faster than that due to secondary consolidation and creep within the dredger fill [41]. A typical time-settlement curve, including primary consolidation and second consolidation of alluvial clay beneath the reclamation, is shown in Figure 7d [32]. For the studies used as examples [13,14,29,47], the time intervals between the completion of the last reclamation projects and the start of the monitoring are almost all less than three years. Consequently, the main compression soil layer undergoing sharp, rapid deformation belongs to the primary consolidation in their monitoring periods. Therefore, offshore lands undergo higher subsidence velocity than onshore lands.
As for CES, the reclamation project outside the cofferdam built in 1998 was finished in 2015 and had the fastest subsidence (−11.6 mm/y) because the consolidation state of the soil layers there was closer to the primary consolidation shown in Figure 7c; the reclamation project within the cofferdam built in 1998 had been completed for at least 15 years by 2015. The soil layer had already entered the secondary consolidation and land subsidence should, in theory, be relatively stable (Figure 7c,d). However, land subsidence in CES develops with decreasing velocity for the zones from the west to east. Within the cofferdam built in 1998, concentrated and rapid subsidence occurred in Chenjia Town and the southern commercial development zone (Figure 5a). The common feature of these two locations is relatively dense buildings. In addition, there was not a large amount of groundwater exploited in the two areas. Since the mid-1960s, Shanghai has implemented comprehensive control measures of land subsidence in succession. The groundwater dynamics have basically been stable over the years, with regional distribution being relatively balanced. The land subsidence caused by groundwater exploitation has been effectively curbed. The mean land subsidence velocity monitored by Shanghai layered marks was only 1.8 mm/y in 2011 [54]. The land subsidence effect of engineering construction is gradually becoming more prominent and has become one of the new subsidence constraints in Shanghai in recent years [55]. Within this framework, after more than 15 years of reclamation projects, the most important factor causing land subsidence in the study area is the building load, whereas the reclamation land is first used for agriculture or land reserves, rather than construction. With the continuous progress of urbanization, the types of land use will change from agriculture to construction accordingly and will induce inevitable land subsidence, especially in areas with unconsolidated alluvial deposits and reclamation projects [56]. External factors such as buildings and human activities have a greater impact on triggering accelerated subsidence than the temporal evolution of reclamation.

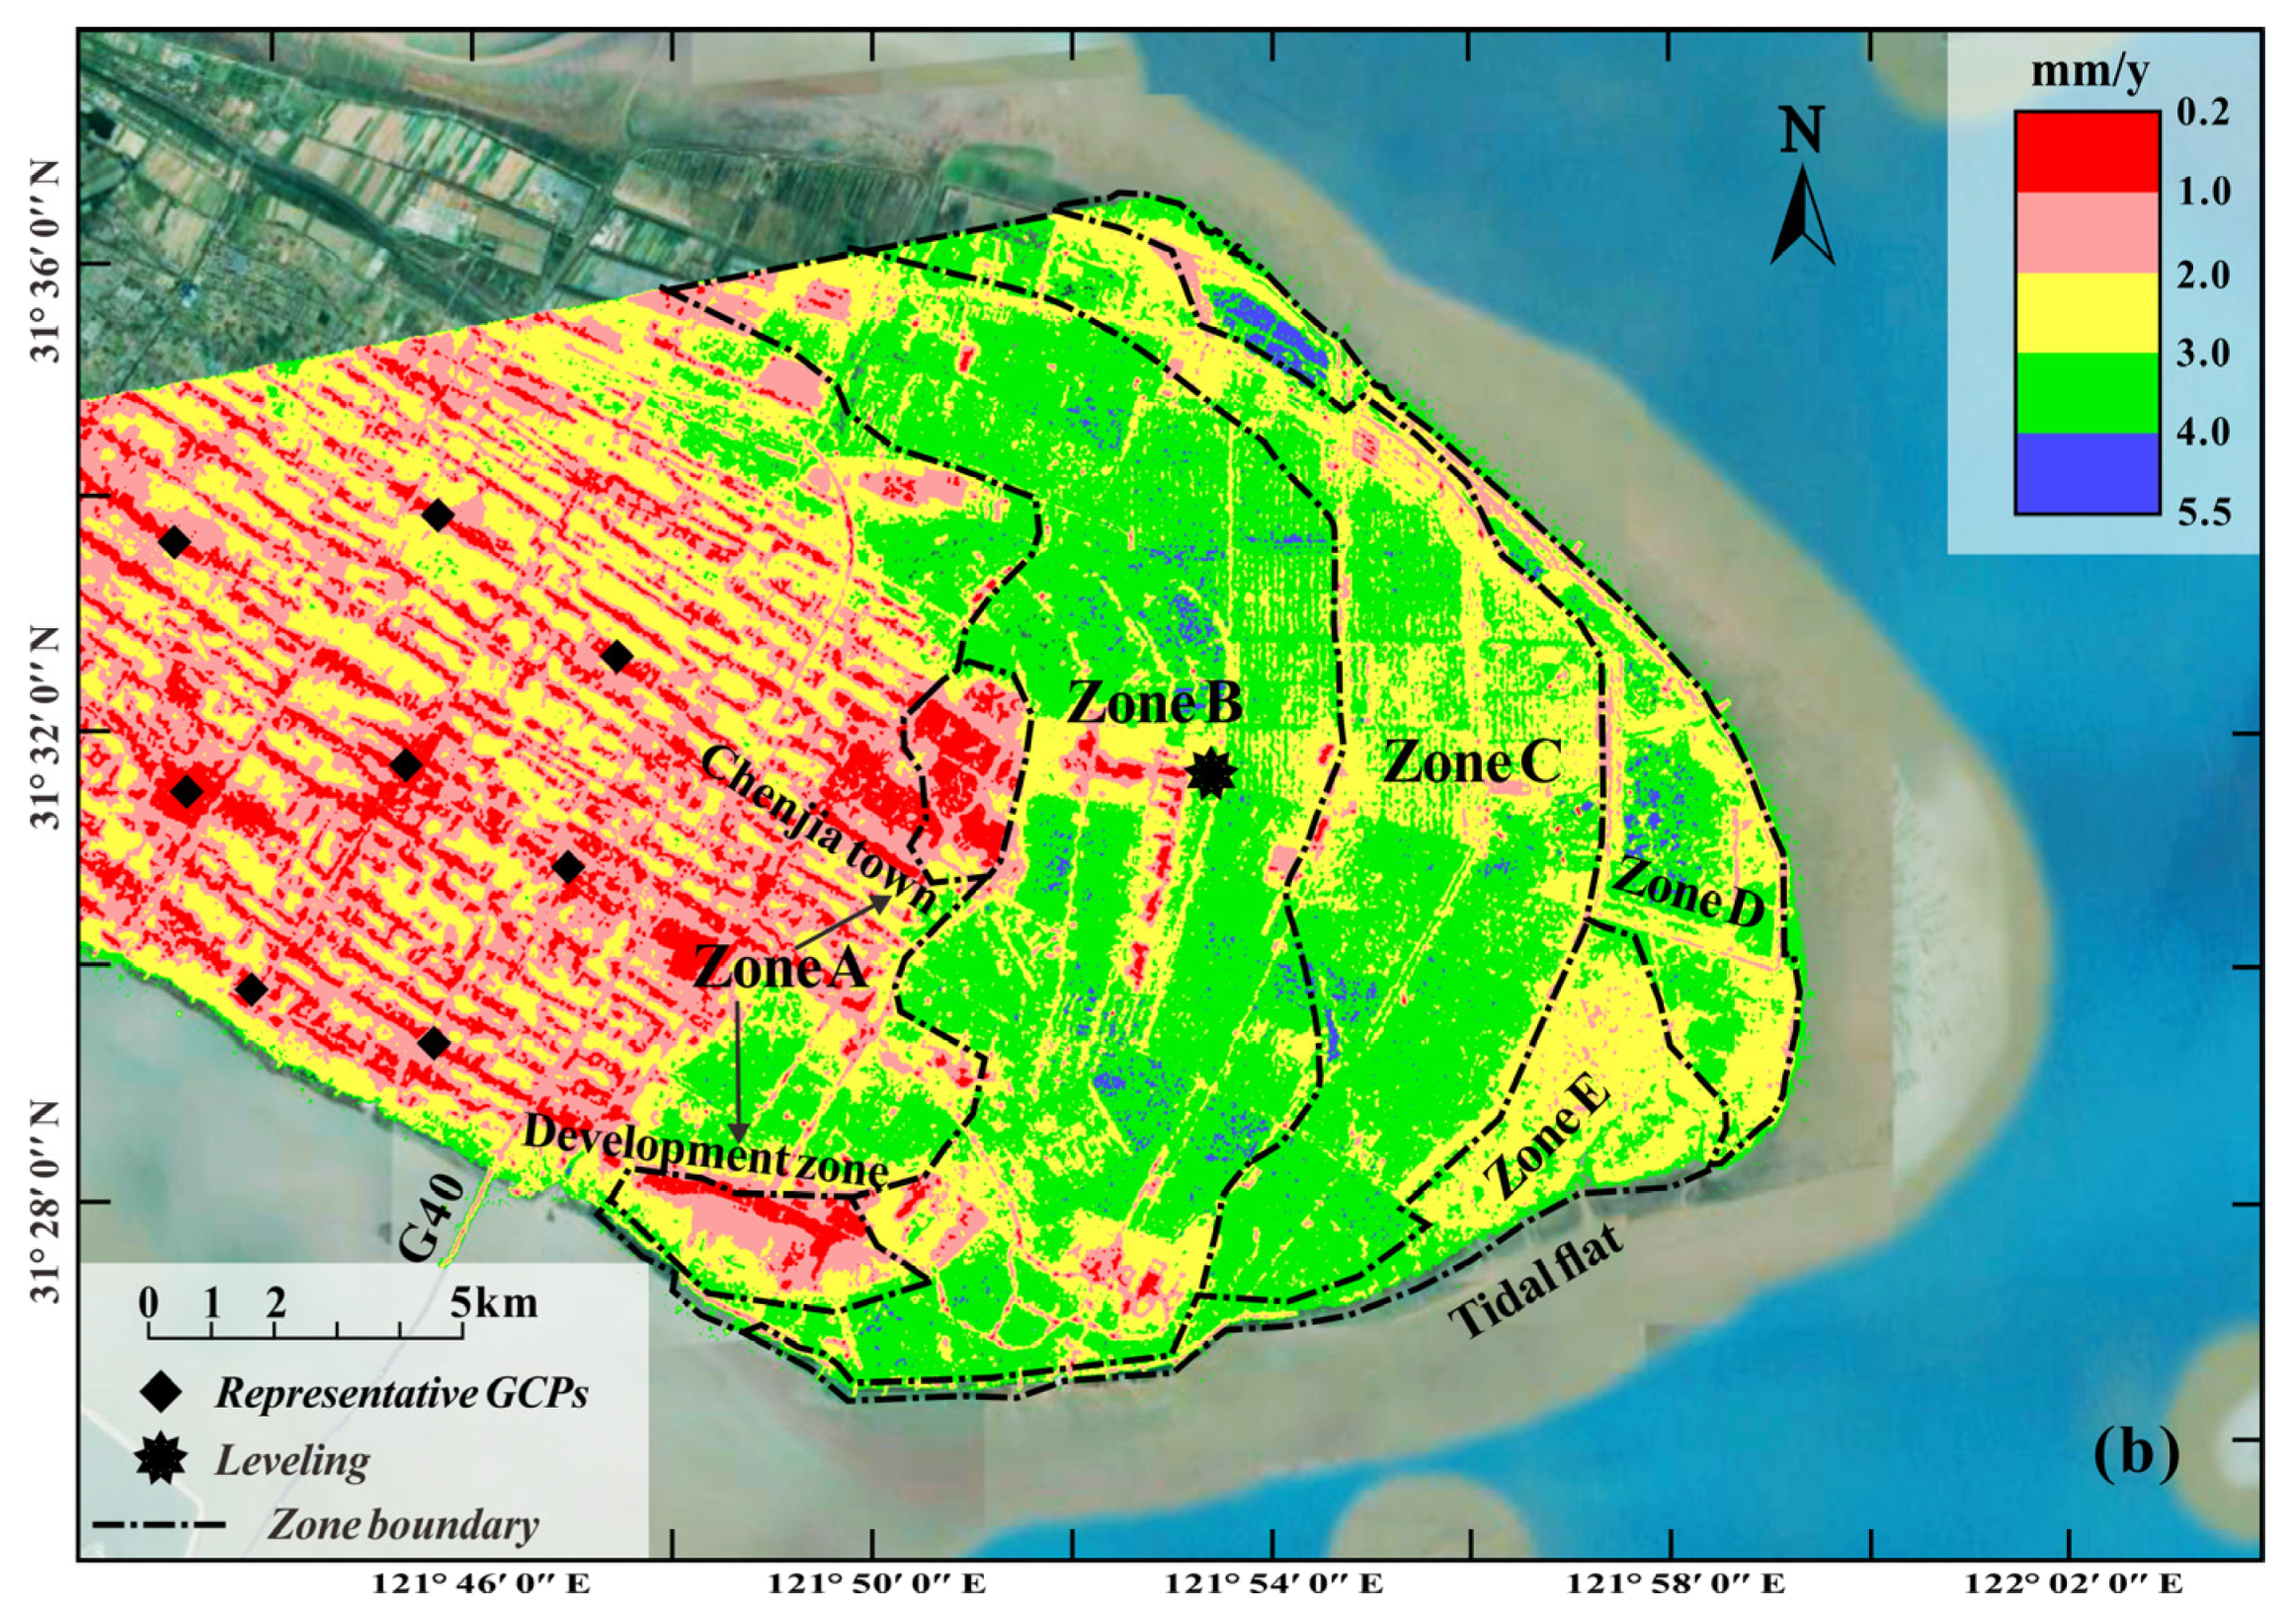
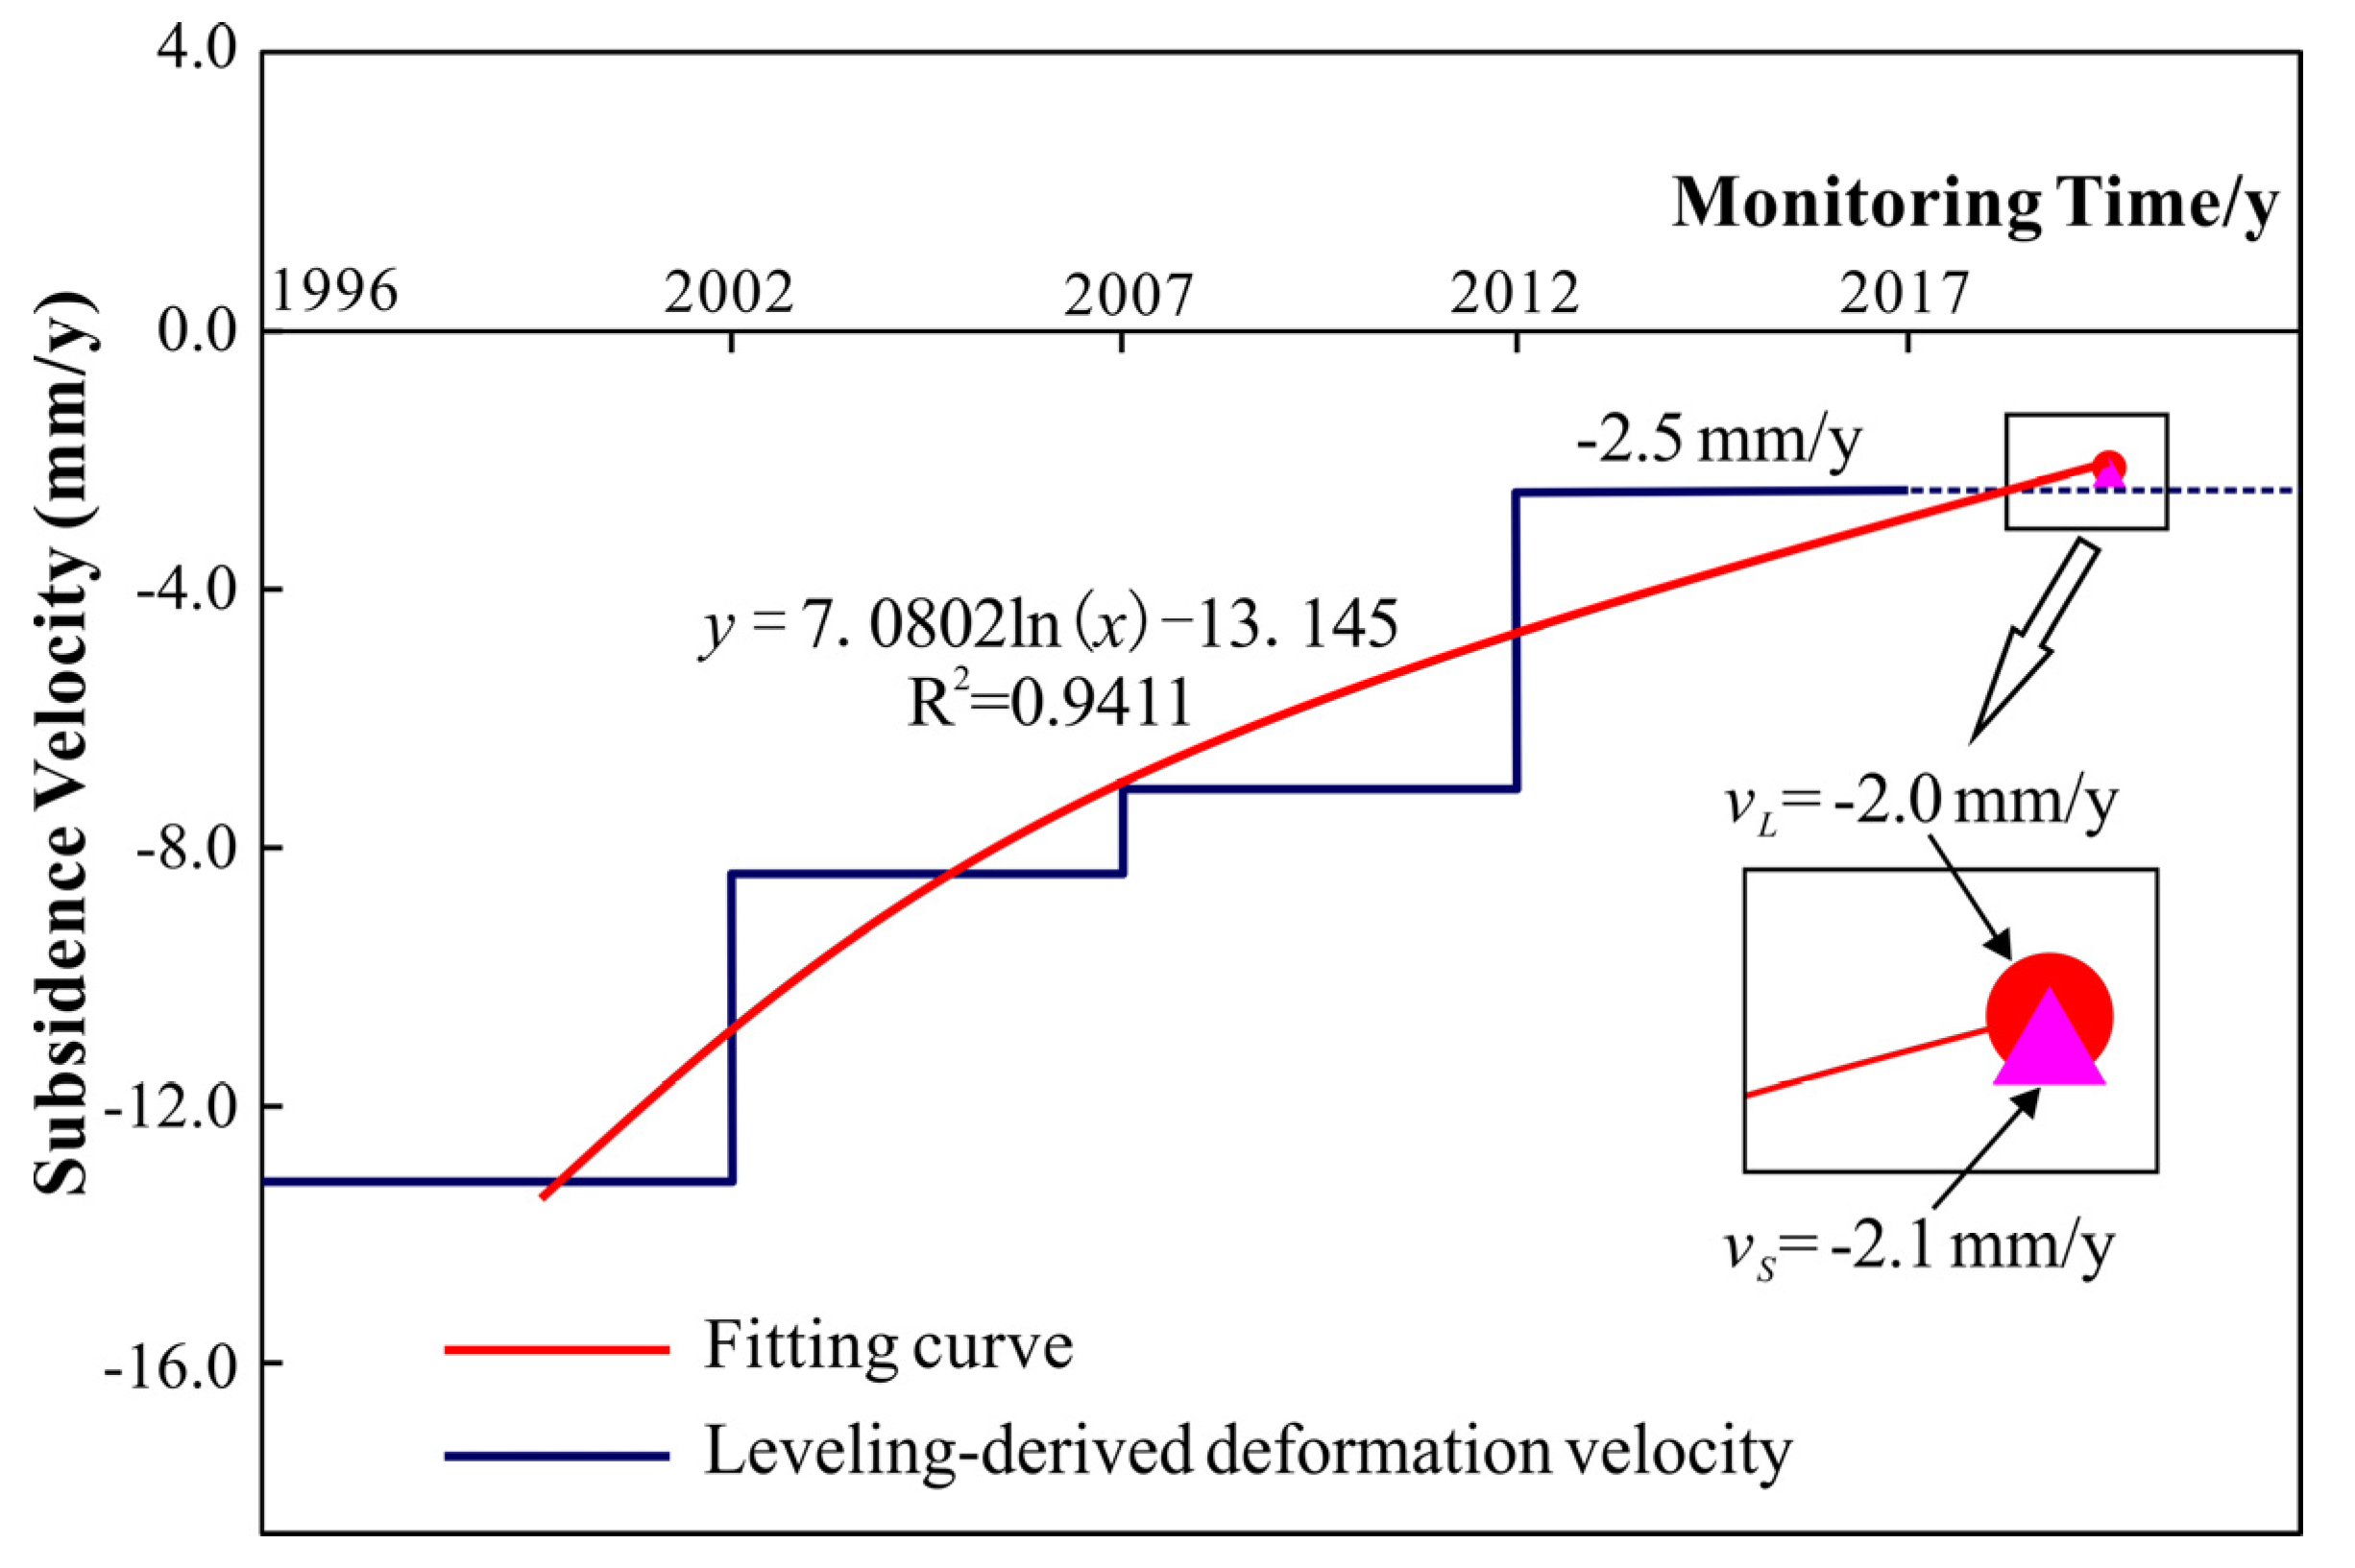
3.1.3. Validation of SBAS-Derived Results

In CES, external monitoring data are not sufficient, and only one leveling point (Figure 5), monitored by the Shanghai Institute of Geological Survey (SIGS), can be utilized to validate the SBAS results. The leveling measurement followed the specification of the second-order leveling with an error of 2 mm, based on the Chinese national height data from 1985. The level was measured in March 1996, 2002, 2007, 2012, and 2017 with a low observation frequency because the study of land subsidence in CES is in its infancy. The height differences of two adjacent measurements were converted to linear velocities in order to estimate the deformation of each interval. Then, the linear velocities from 1997–2001, 2002–2006, 2007–2011, and 2012–2016 were plotted and fitted in order to predict the velocity of the next interval, ranging from 2017 to 2021 (labeled as νL). The leveling site was located on the side of the road, which was not under construction. In the case of constant land use, the deformation velocity of the next time interval should be between −2.5 and 0 mm/y, according to the changing pattern. As shown in Figure 8, a satisfactory fitting curve (R2 = 0.9411) was obtained at νL is −2.0 mm/y. Moreover, the corresponding SBAS-derived pixel, with the deformation velocity measured from 22 March 2015 to 2 December 2019 (labeled as νS), included the location of the level. We can preliminarily estimate the data processing results by comparing νL and νS. One of the purposes of this study is to guide to establish a monitoring network soon, according to SBAS-derived ground deformation, so that sufficient attention can be paid to subsidence areas. The comparison of νS (−2.1 mm/y) and νL (−2.0 mm/y) shows reasonable consistency. Although the leveling data are absent, the data source and deformation process are consistent, which indicates that the SBAS-derived results in CES yielded relatively reliable results.

3.2. Geological Features

In this study, water content, dry density, porosity, cation exchange capacity, and the compression index were detected by laboratory tests. Figure 9 shows the variation patterns of the geological features of the soil layers with reduced reclamation time from west to east.

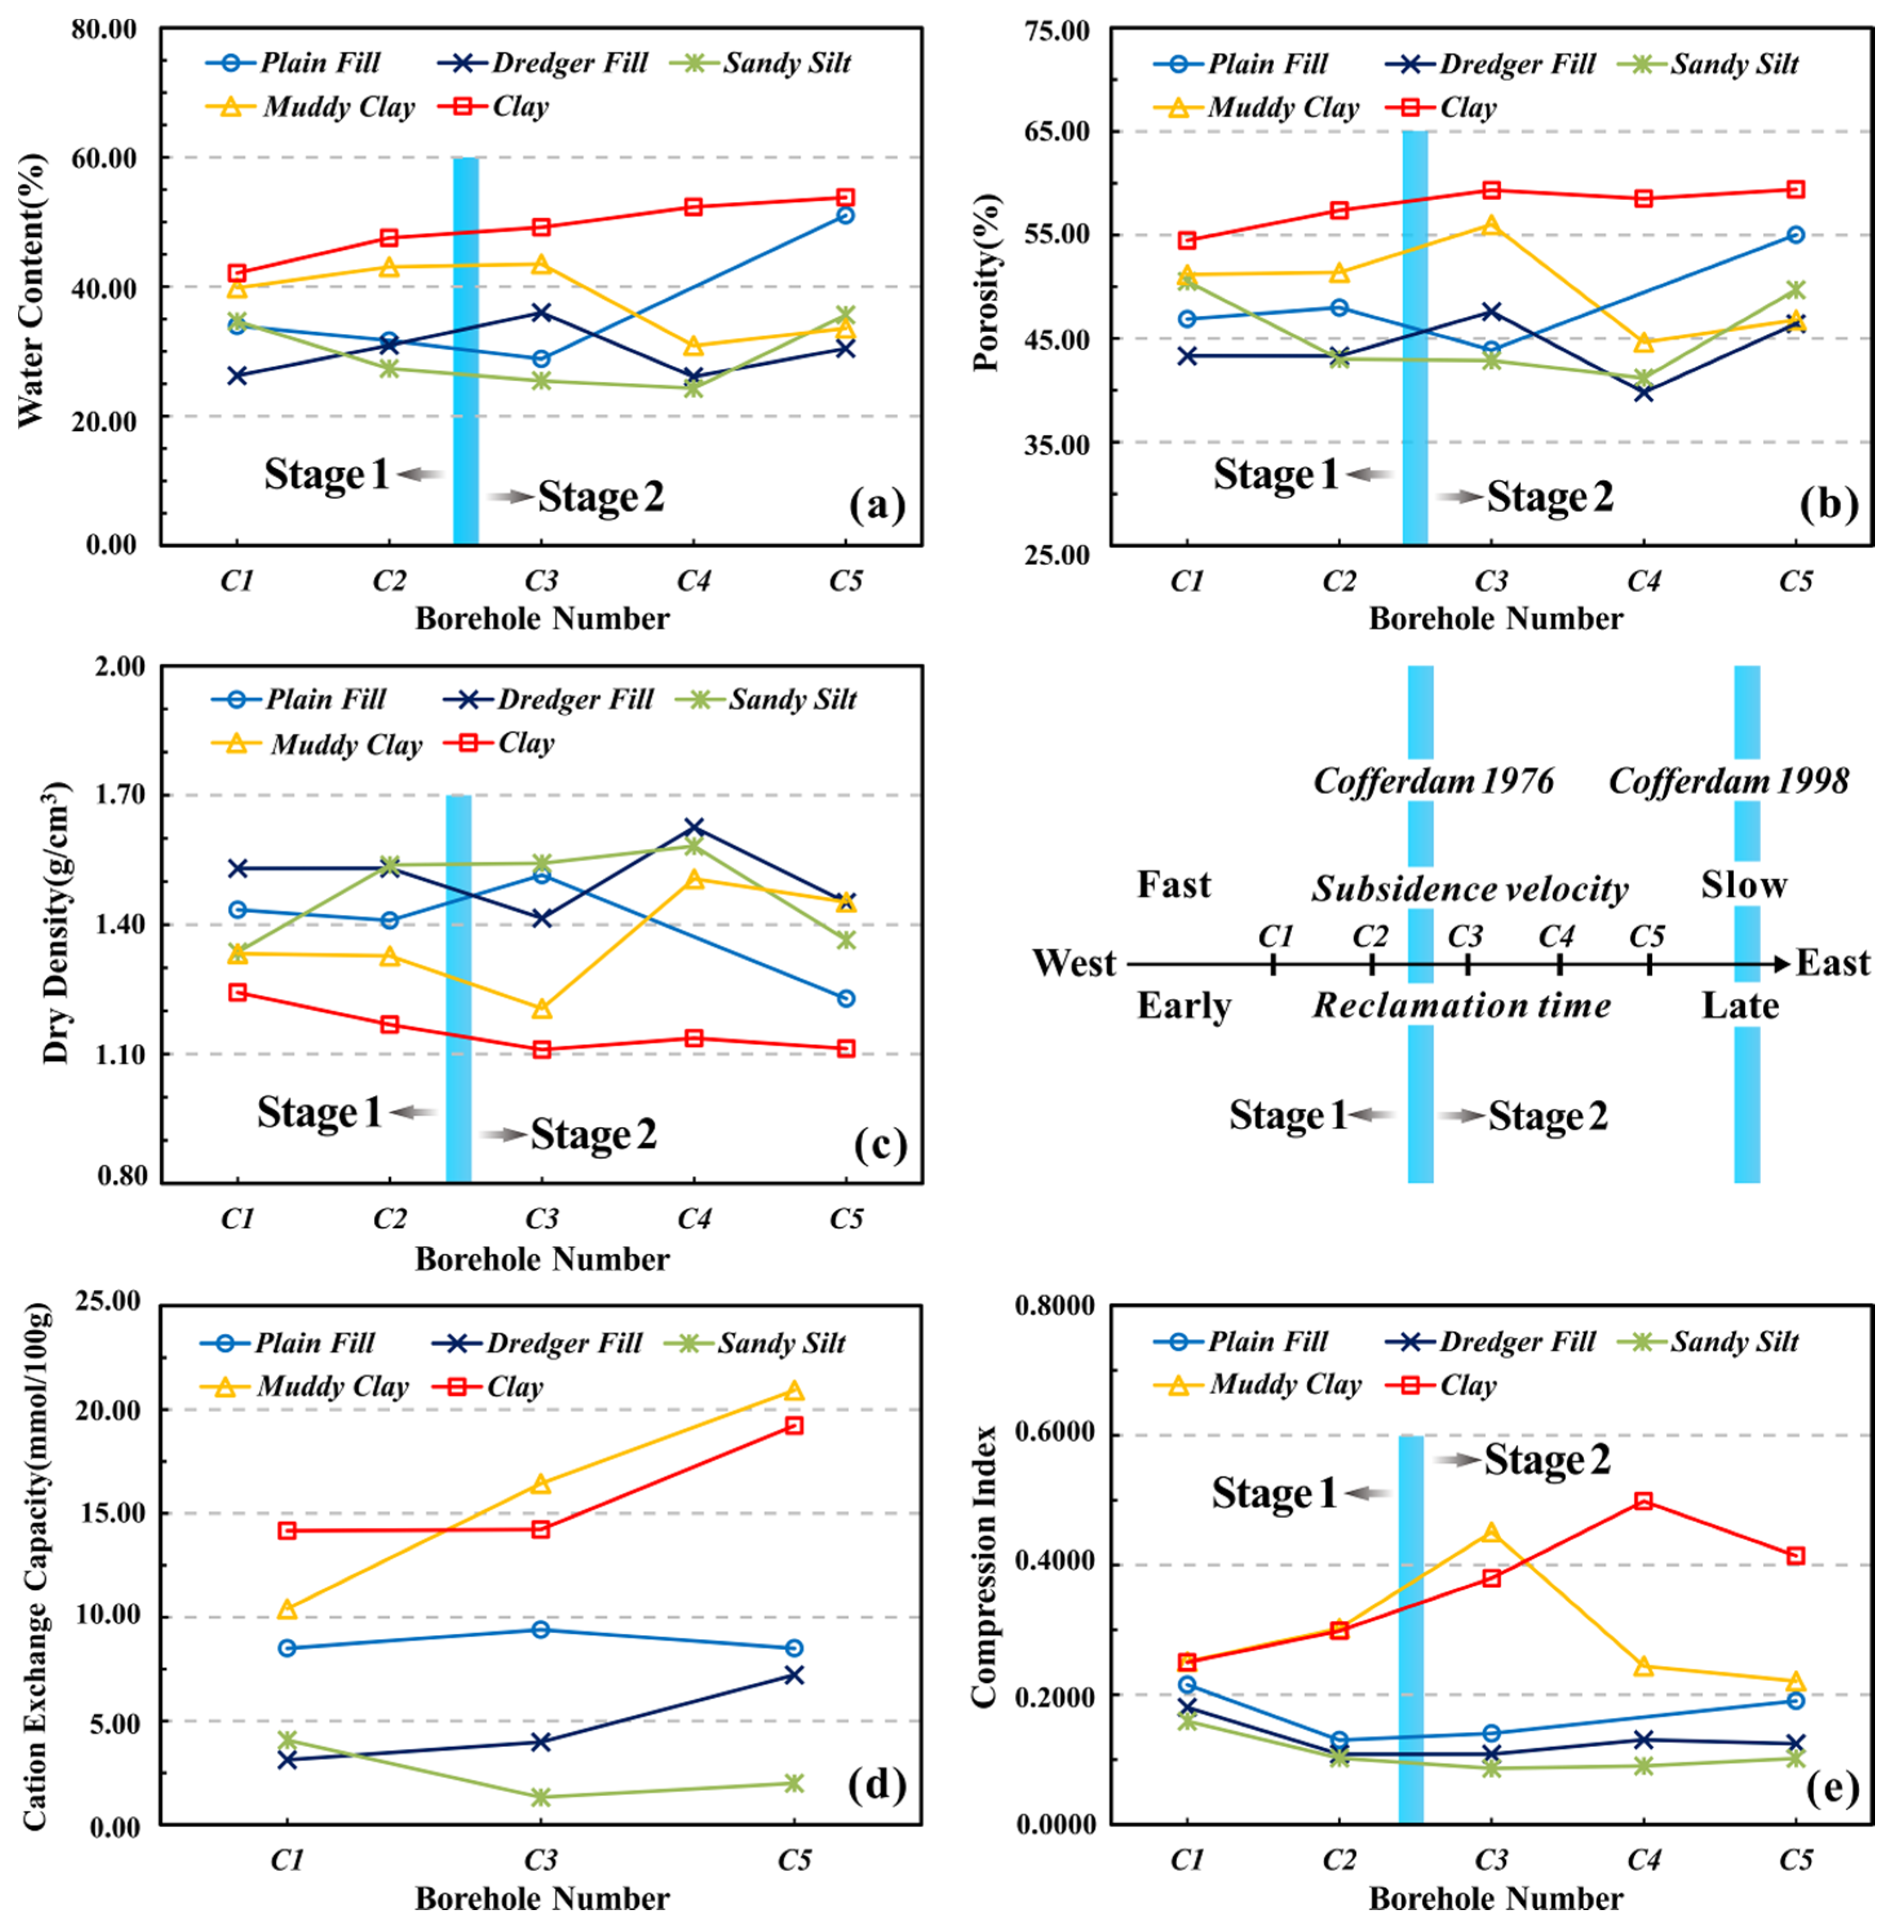
3.2.1. Basic Physical Properties

In this study, the soil samples were saturated because the degree of saturation for all of them was over 80% [57]. As shown in Figure 9a, the water content of the plain fill in stage 1 was relatively low (30%-35%), and there was a significant increase in water content in stage 2, especially the water content of PC5, which peaked at 51.02%. This shows that there was still a large amount of water in PC5, which hampered the drainage of water from the underlying soil layer. The dredger fill and sandy silt had the lowest water content (25%-35%). The range was small and close because both kinds of soil belong to cohesionless soil, and the water in them can be discharged quickly. Therefore, reclamation time had a relatively small impact on the water content of the dredger fill and sandy silt. In contrast, the water content appeared quite close (40%-45%) for MC1-MC3, while it dropped to 30% for MC4-MC5.
When water and air are discharged from pores, the effective stress in the soil will increase. The soil particles will move correspondingly and will then become close to each other, resulting in a reduced pore volume and compression of soil. It can be seen that porosity represents the theoretically compressible space of soil, and the changing pattern of porosity was almost consistent with that of the water content (Figure 9b), as the pores were almost completely filled with water, for saturated soil. The porosity of PC1-PC3 varied a little, at 46.3% on average, while the porosity of PC5 reached 55.0%. The porosity of clay was always high (54.5%-59.4%), indicating large compression spaces in clay layers; the average porosity of MC1MC3 was 52.3%, while it was 45.7% for MC4-MC5, and the porosity of muddy clay from west to east was significantly reduced, especially for the muddy clay in stage 2, indicating that the compressible space of silt clay in stage 2 was small. The porosity of sandy silt and dredger fill still slightly fluctuated.
The changing trend of dry density (Figure 9c) was the opposite to that of water content. Dry density indirectly reflects the compactness of the soil arrangement [58,59]. Soil with high water content is arranged loosely, and vice versa. Within this framework, the dry density of the plain fill dropped, with the decrease in reclamation time (from west to east). The clay layer showed the lowest dry density (1.10–1.25 g·cm−3), the value of which declined continually from west to east, indicating that the eastern clay layer was not fully compacted, as compared to the western clay layer. On the whole, the dry density of dredger fill and sandy silt was relatively high and stable (1.30–1.60 g·cm−3), due to the greater coarse particle content than the other soil layers. It should be noted that, for muddy clay, the dry density of MC4 and MC5 was significantly higher than in MC1-MC3. Moreover, the poor permeability of muddy clay, coupled with its dense arrangement of soil particles, was responsible for the slow water infiltration.
In general, according to the above findings, the curves in stage 1 were evenly distributed in the changing range, while the curves in stage 2 were relatively discrete. This shows that the differences in basic physical properties among soil layers with late reclamation time were greater than those in the area with early land formation.

3.2.2. Cation Exchange Capacity and Compressibility

The cation exchange capacity (CEC) test was conducted on representative soil samples collected from boreholes C1, C3, and C5. The higher the CEC, the stronger the ability of the soils with electric charges, resulting in thicker hydrated films, which makes it difficult for soil to compress and consolidate effectively. As shown in Figure 9d, the CEC of plain fill varied a little, in the range of 8.50–9.39 mmol/100 g. The CEC of dredger fill and sandy silt was the lowest, with all the values being below 5 mmol/100 g, except for DC5 (7.22 mmol/100 g). The CEC of dredger fill had an obvious upward trend with the shortening of the reclamation time. The CEC of muddy clay and clay increased significantly from west to east. In borehole C5, the CEC of SC5 and CC5 was 20.93 mmol/100 g and 19.23 mmol/100 g, respectively. To sum up, it was difficult for muddy clay and clay to be compacted and consolidated in areas with late reclamation times, where dredger fill also played a certain role in blocking the consolidation and compaction of the underlying soil layer.
According to the rapid consolidation test (Figure 9e), the compression index of each soil layer in borehole C1 was very close, in the range of 0.1591-0.2509. Planned comparisons revealed that the differences in the compression index of soil layers gradually appeared in the eastern direction. The compression index of plain fill, dredge fill, and sandy silt was generally low, but the compressibility of plain fill increased gradually, especially for borehole C5. The compressibility of muddy clay increased at first and then dropped, with a peak value of 0.4507 occurring in borehole C3. The lowest values (average 0.2326) were observed in boreholes C4 and C5, which was consistent with the description of the basic physical properties. The compressibility of the clay layer obviously increased, especially for the offshore clay layer. The results confirmed that the clay layer close to the coastline had not been effectively consolidated.

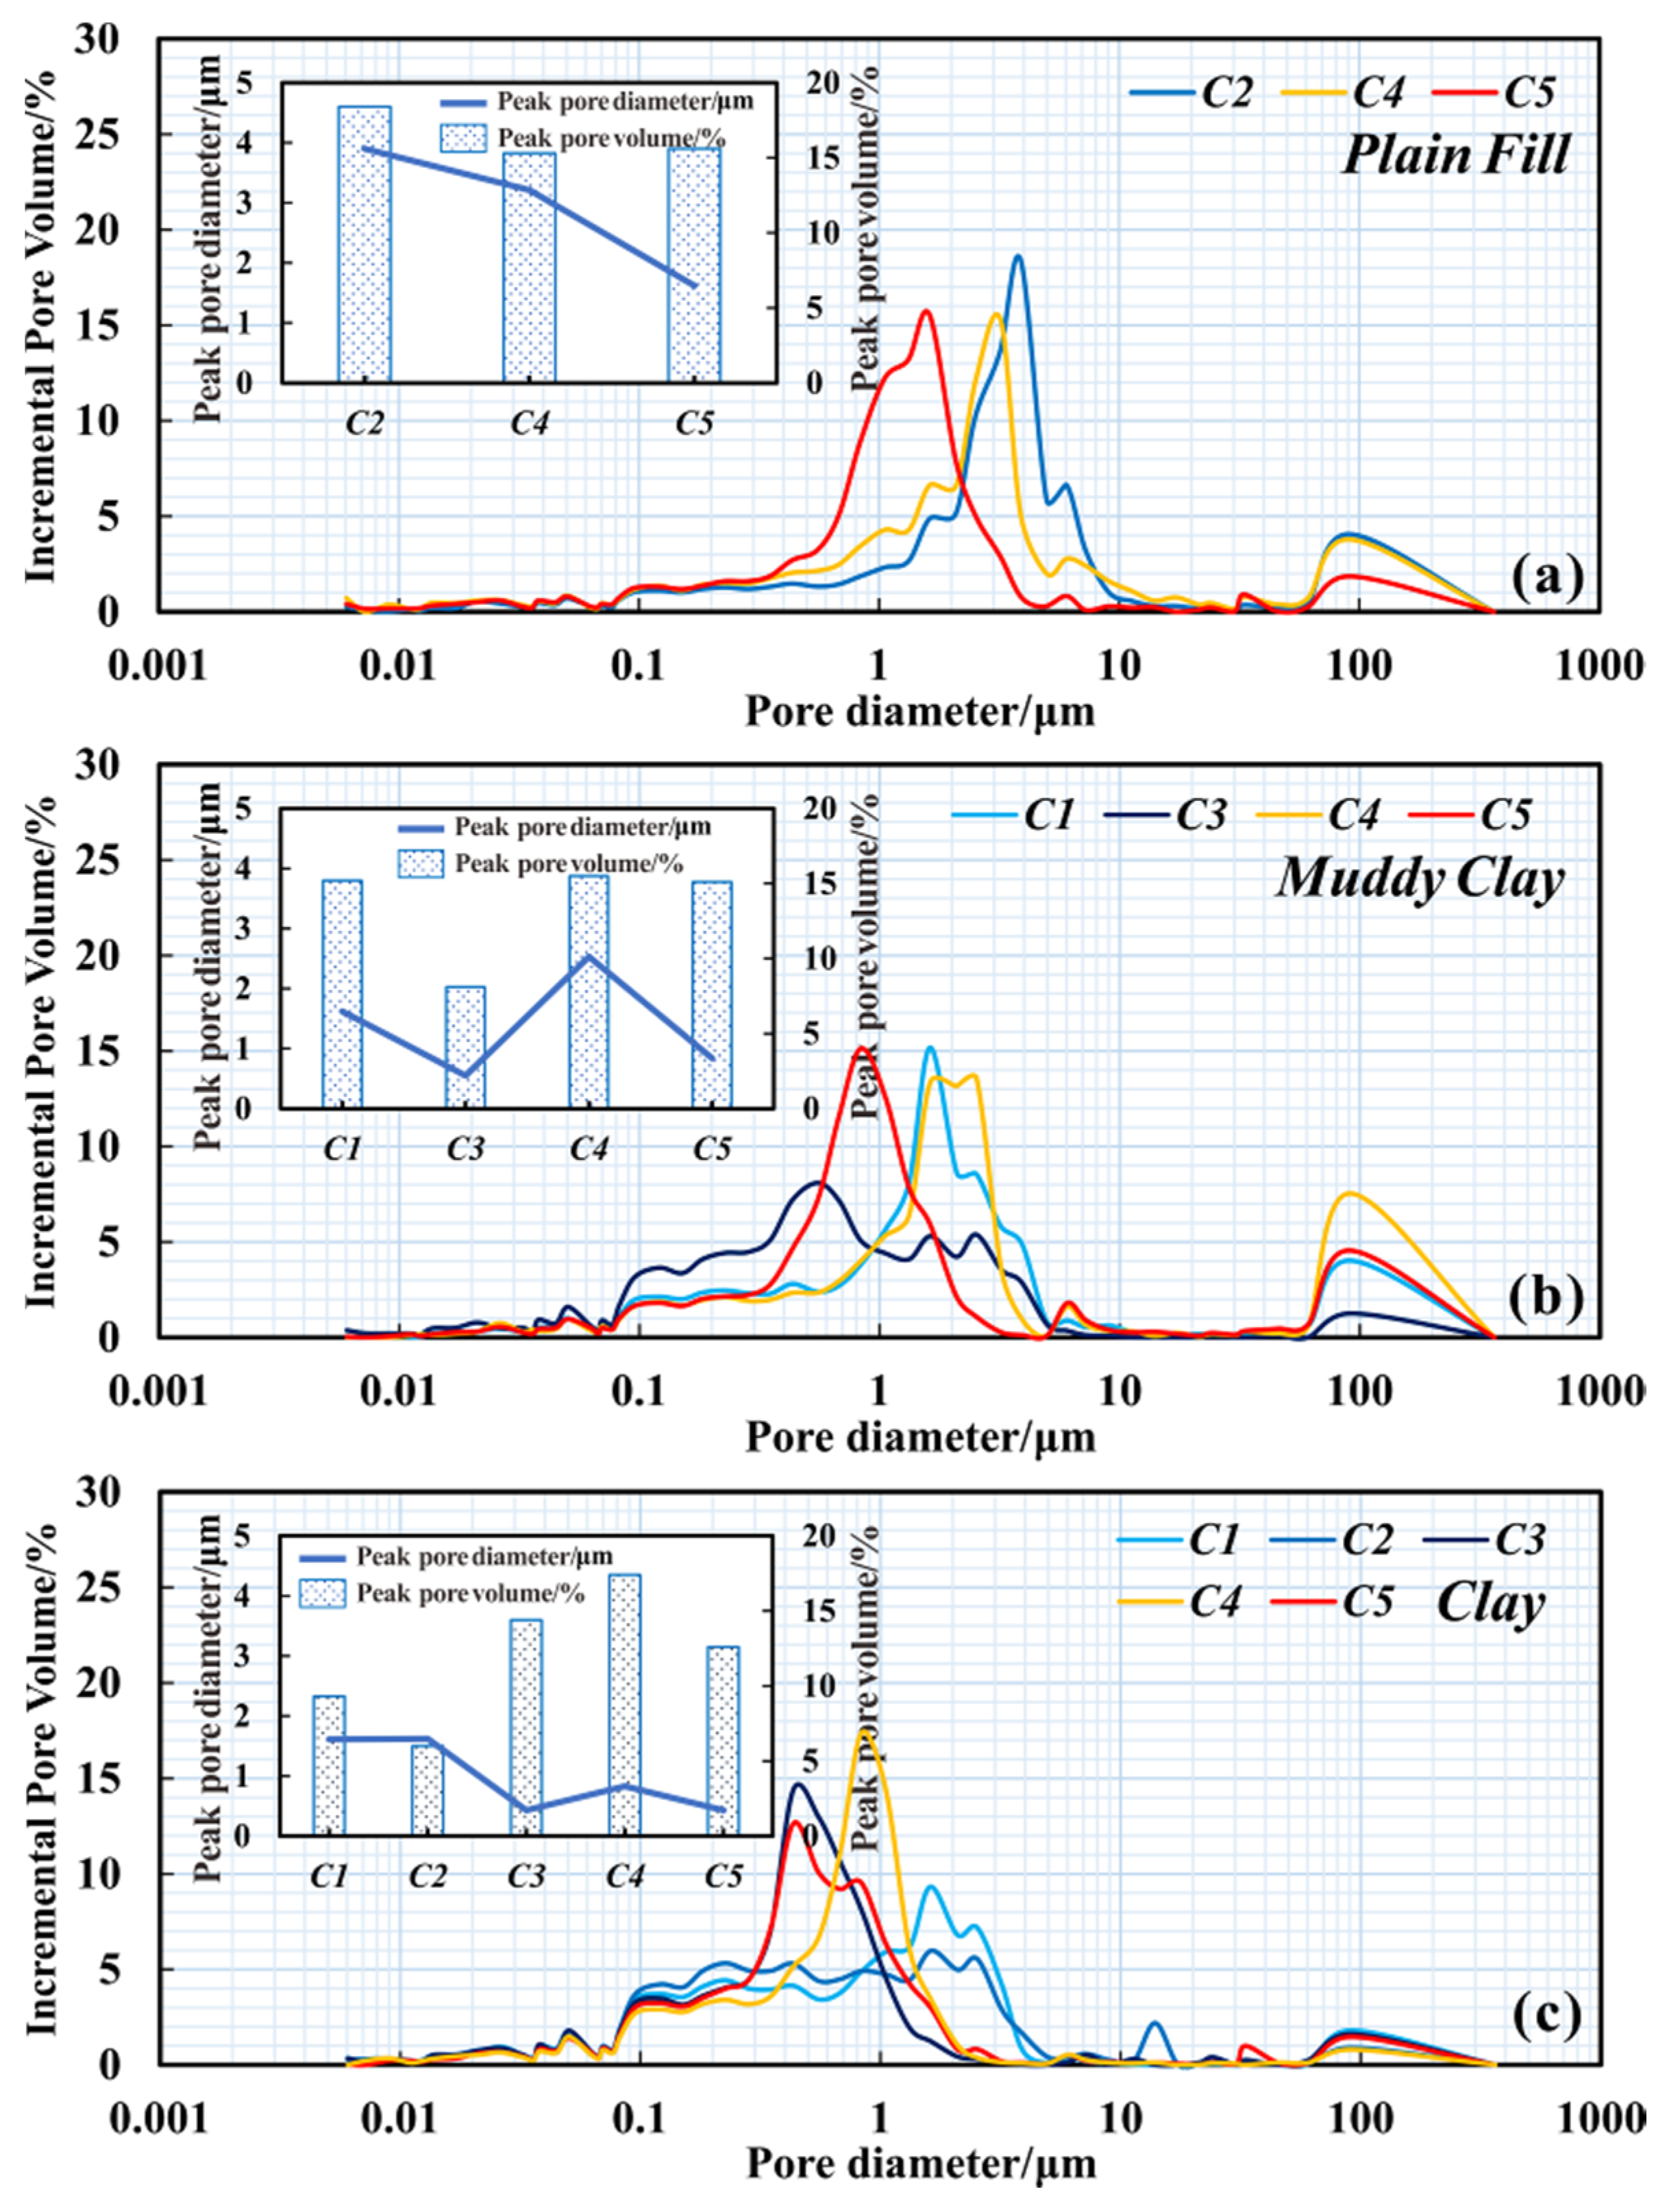
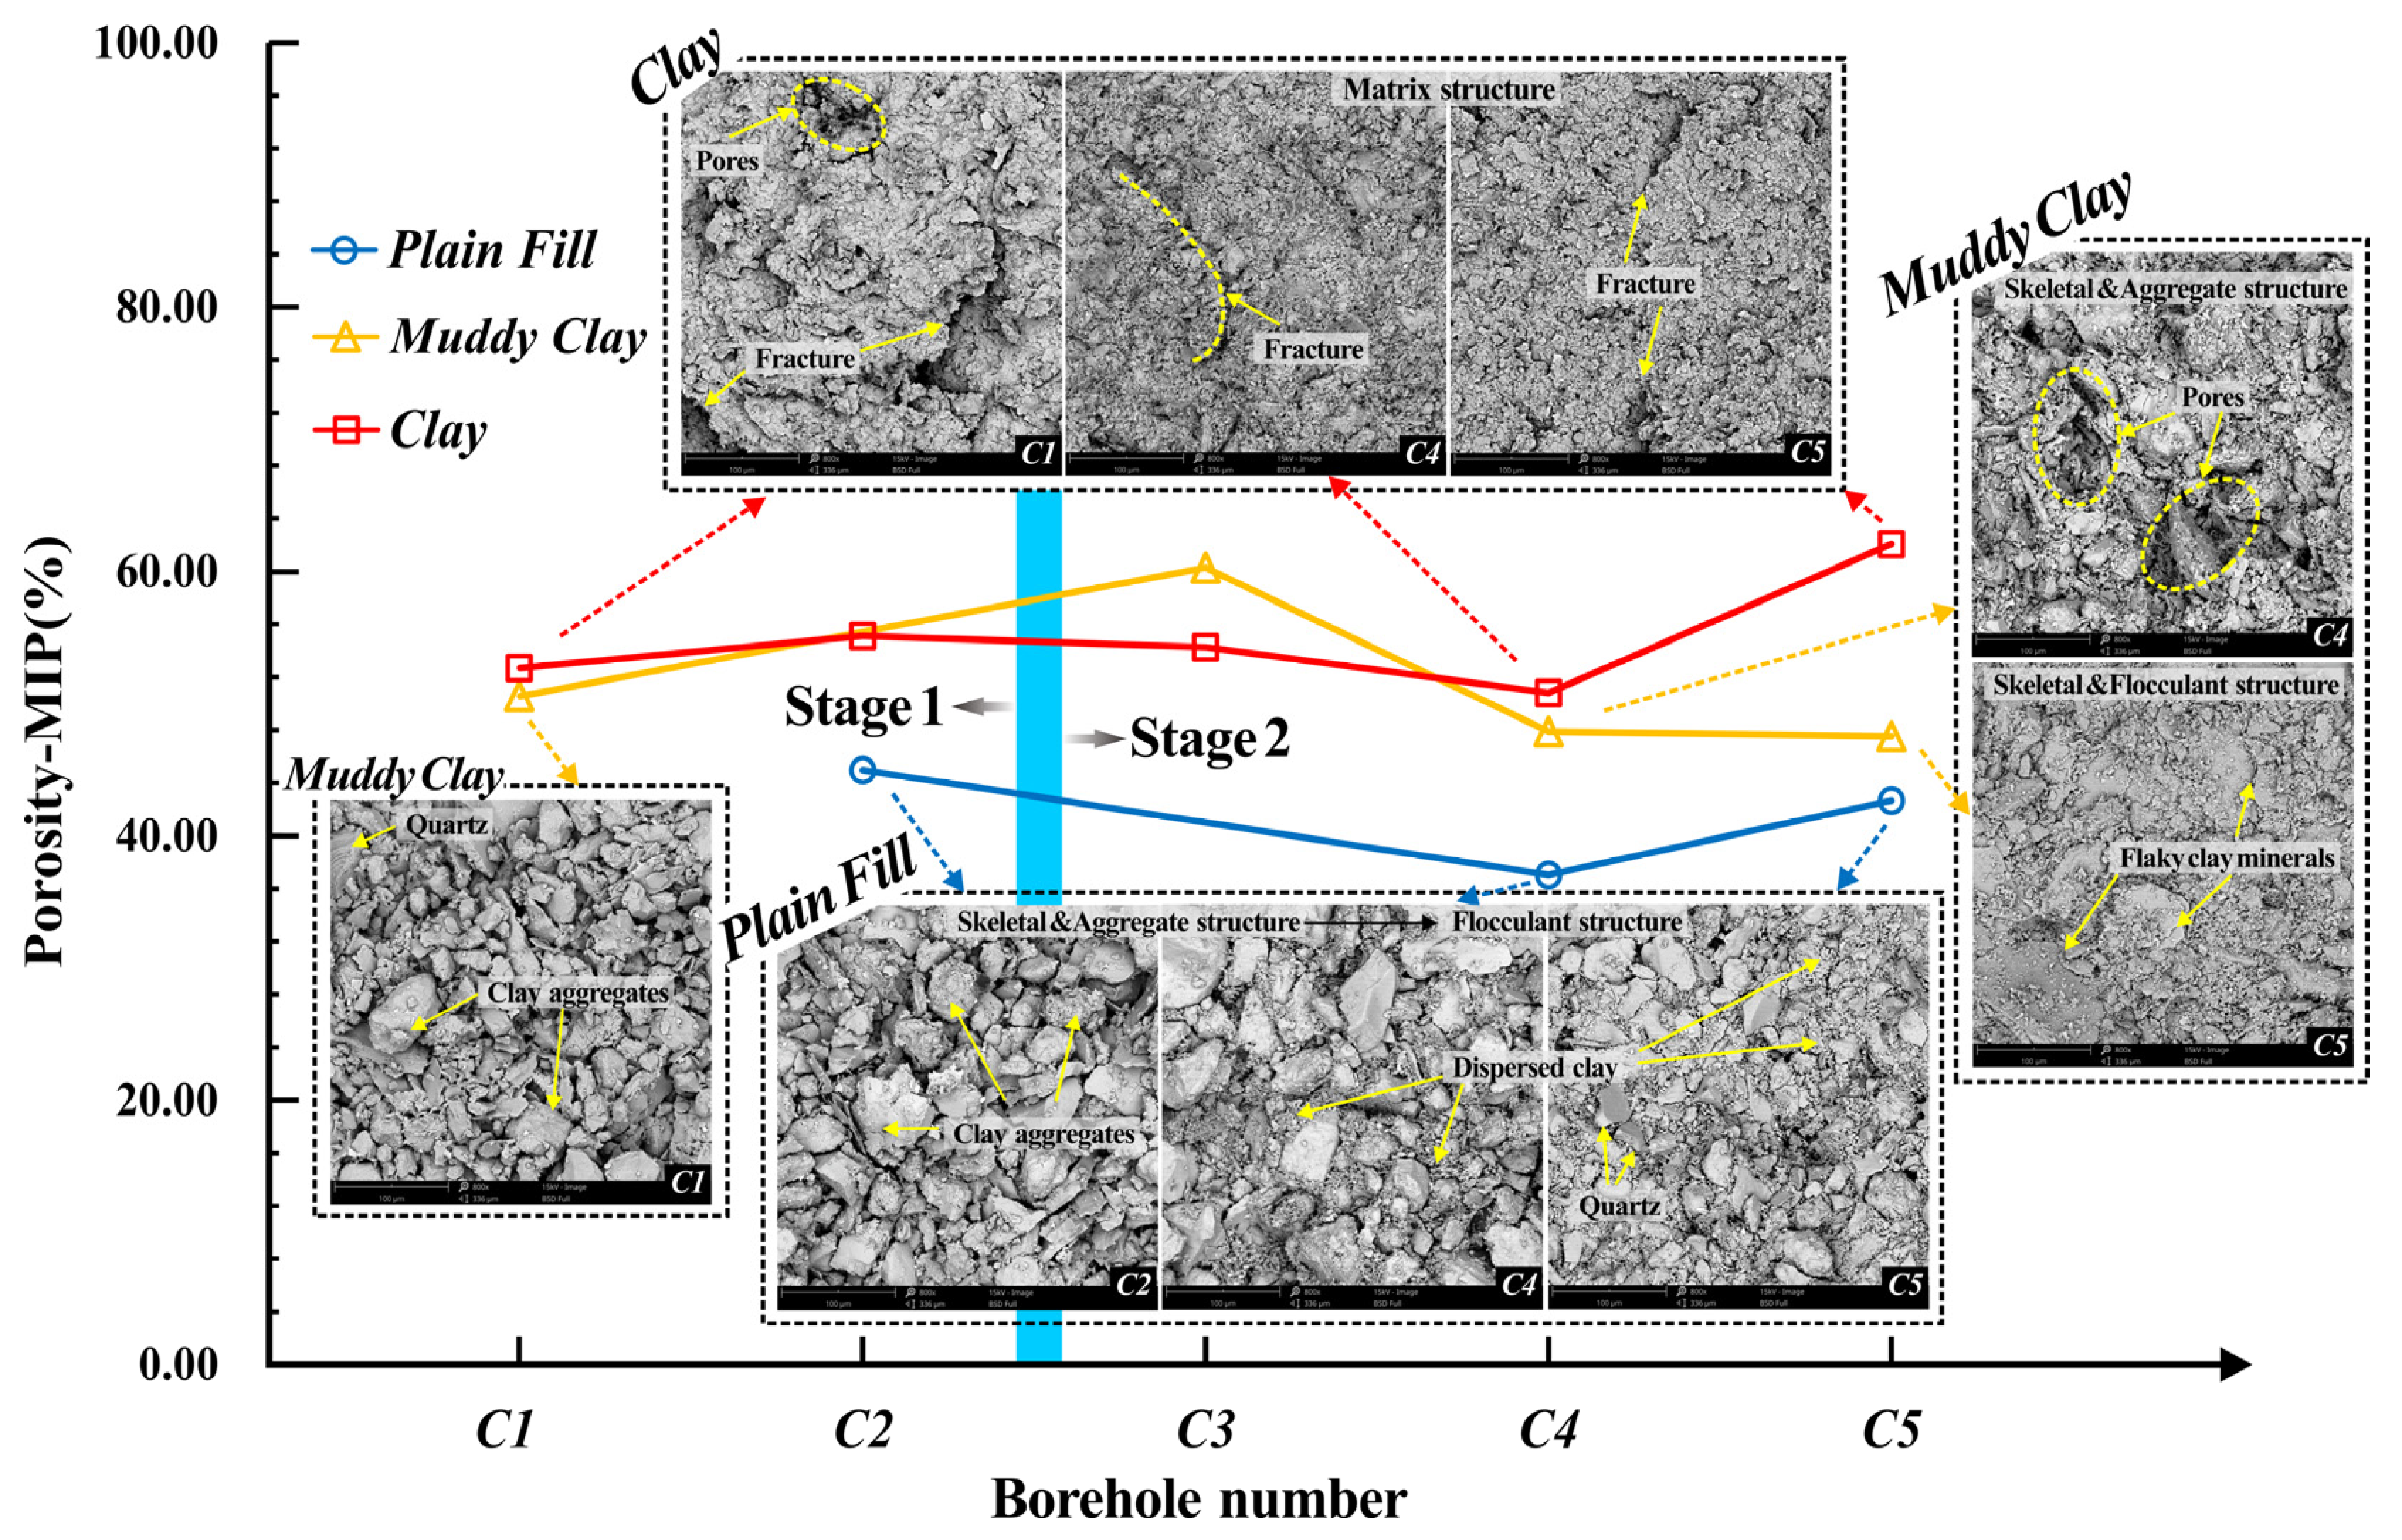
3.2.3. Microscale Structure and Pore

According to Section 3.2.1 and Section 3.2.2, the geological features of dredger fill and plain fill were stable among the boreholes, with a relatively small difference in the drainage consolidation. Therefore, we focused on the microscale structure and pore characteristics of plain fill, silty clay, and clay.
As shown in Figure 10, for plain fill, both the peak pore diameter and the corresponding pore content showed a decreasing trend. It is clear that there was a relatively greater large pore content of plain fill in the early-reclaimed area than in the late-reclaimed area. Soil with relatively large pores is less affected by the hydrated film, leading to smooth water infiltration. As for muddy clay, the peak pore size and content do not show obvious regularity. However, a small peak pore size was observed in boreholes C3 and C5, although borehole C5 presented a higher content. The small pores were often more difficult to compact than large ones. For clay, the peak pore diameter decreased gradually from west to east, but the content of peak pore diameter increased significantly. This pattern also weakened the drainage conditions.
The principle of MIP is to inject mercury into the pores of soil in order to obtain the mercury intake under increasing pressures. Therefore, the distribution of soil pores can be reflected. In general, the porosity of MIP and the calculated porosity were similar (Figure 9b and Figure 11), especially for muddy clay and clay. However, for plain fill, the calculated porosity rose from west to east (Figure 9b), while the opposite was observed for the porosity of MIP, and thus the calculated porosity of borehole C5 was 12.4% higher than the porosity of MIP. The pores measured by MIP are connected and exclude closed pores. For PC5, although the calculated porosity was high, there were many closed pores, so the water could not be effectively discharged. The clay layer did not obviously show closed pores. Due to its low MIP porosity and calculated porosity, the clay layer showed strong impermeability.
According to the SEM images shown in Figure 11, for plain fill, the particles of PC2 were coarse (50–100 μm); clay particles mainly appeared as clay aggregates with good connectivity. While the soil particles of PC4 were also coarse (50–100 μm), the clay particles were dispersed in the skeleton formed by large particles, resulting in alternate pore sizes and poor connectivity. The particle size and pore size of PC5 decreased sharply to 50 μm, with clay particles dispersed in the pores. From west to east, the microstructure gradually changed from having a skeletal/aggregate structure to a flocculent structure, indicating that the drainage conditions of plain fill were getting worse; for muddy clay, MC1 was mainly composed of soil particles with a size of less than 50 μm. Clay particles existed as soil aggregates (50-100 μm) with small pores. In addition, quartz particles and flaky clay minerals were also visible. There were large soil particles in MC4, with clay particles dispersed in corresponding pores. However, the pores of MC5 were fine, and the flaky soil particles were in face-to-face contact. The microstructure of muddy clay transitioned from having a skeletal/aggregate to skeletal/ flocculent structure from west to east. Compared to the above two kinds of soil, clay showed a matrix structure with fine and uniform soil particles. In addition, there were some fractures among the cemented clay particles. However, the fractures of CC1 were obviously long and wide, but the development degree of the fractures in CC4 and CC5 decreased. The SEM test indicated that, in the early-reclaimed area, the agglomeration of clay particles was stronger, the fractures and pores were more developed, and the connectivity was stronger compared to the late-reclaimed area. However, in the area with a late reclamation time, the clay particles were mainly dispersed in the pores, which made the connectivity weak and the drainage capacity poor.

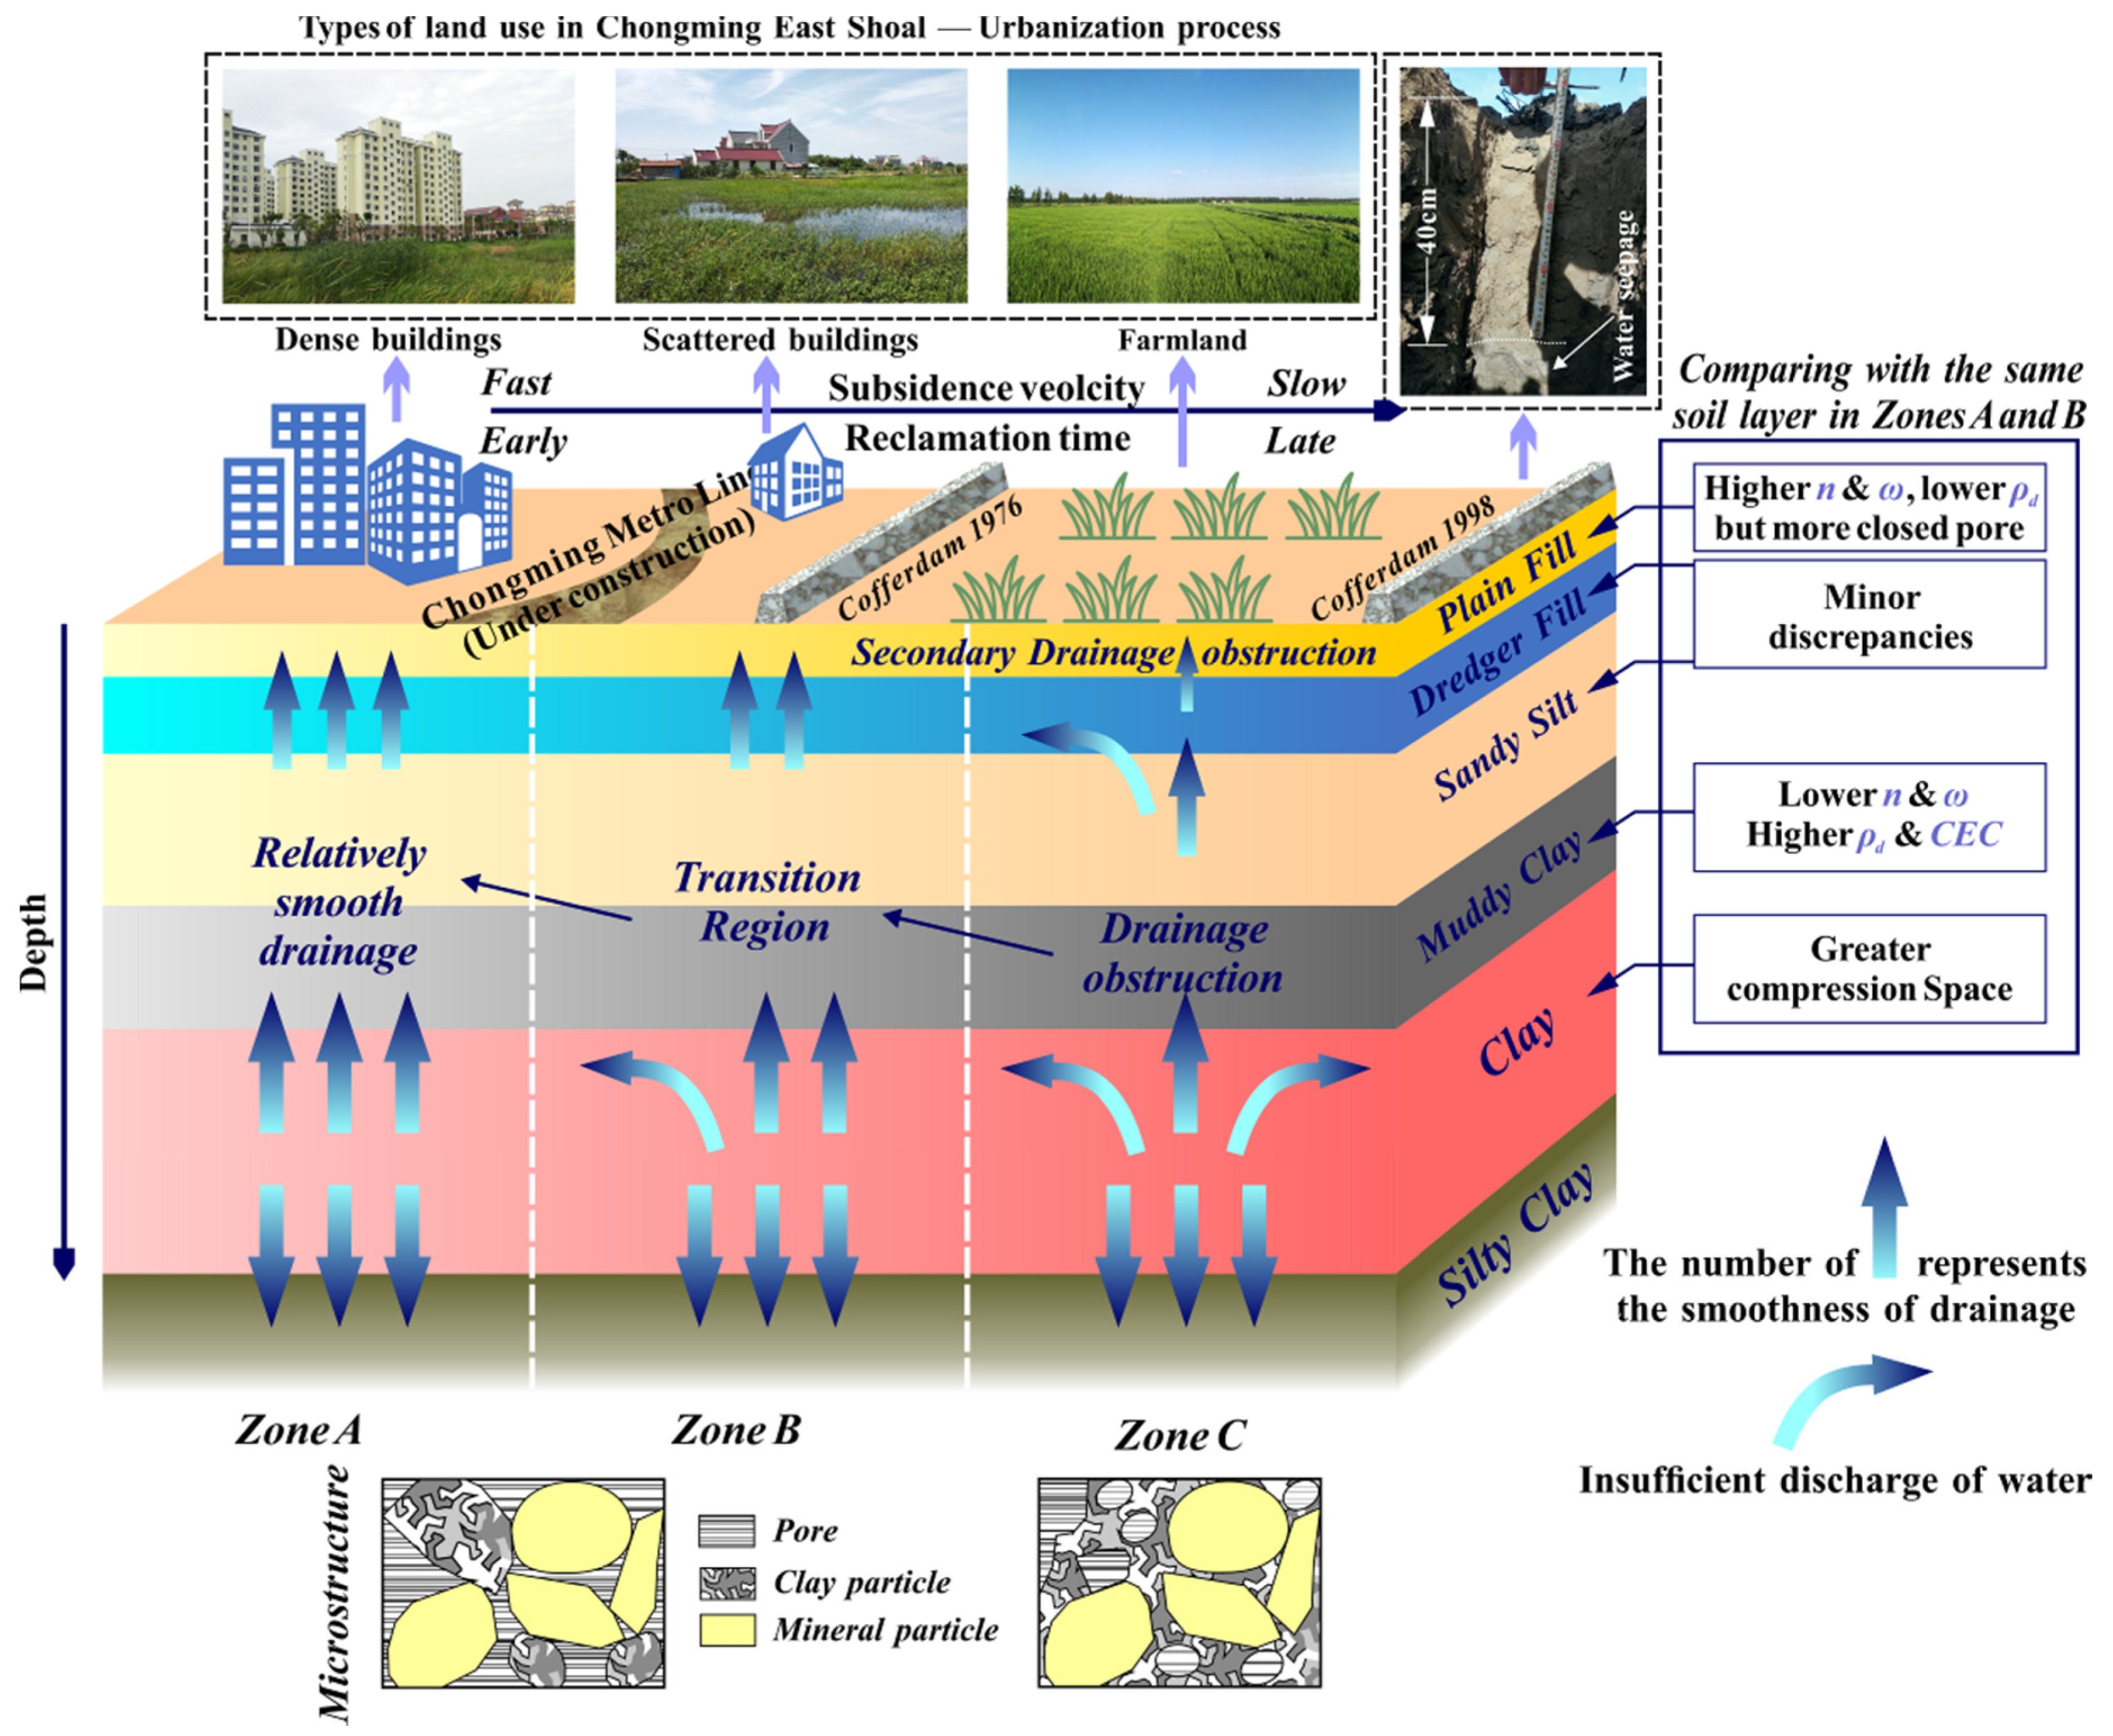
3.2.4. Subsidence Mechanism

Figure 12 indicates the simplified stratum and drainage condition of zones A, B, and C (shown in Figure 5). Compared to zones A and B, zone C has significant differences in ground deformation characteristics, land use types, and geological features:
First, from west to east, the types of land use in CES gradually transform from dense buildings to scattered buildings, and finally large-area farmland. This transformation, as a process of land development and utilization from high to low, indicates the different load types that change from the building load and self-weight of soil to only the self-weight of soil. Second, zone C, as a representative area with a late reclamation time, undergoes a lower subsidence velocity and accumulated deformation than zones A and B. Finally, although the clay layer in zone C shows higher compressibility, its consolidation suffers from the limitation of a higher cation exchange capacity (CEC). Moreover, the overlying muddy clay layer has a worse drainage capacity; only a small amount of water can be smoothly discharged, thus reducing the efficiency of the consolidation. Both dredger fill and sandy silt belong to the category of silty soil and show relatively close geological features with relatively smooth drainage. However, the water content of plain fill in zone C increases significantly. In the offshore areas (with late reclamation time), when the topsoil is excavated to a depth of 40 cm, water seepage can be observed. It needs a long time to discharge the water, further hindering and delaying the consolidation of the underlying soil layer. From the perspective of the microstructure, the clay particles in zone C are dispersed in the pores formed by large-grain skeletons, with small pores and poor connectivity. The clay particles in zones A and B are often in the form of aggregates, leading to larger pore size and better connectivity.
From the above results, it is clear that, although the soil layers in the offshore reclamation area have more compression space, their poor drainage condition limits the consolidation deformation. Therefore, the offshore reclamation area undergoes a lower subsidence velocity (−0.3 mm/y) than the interior (−3.4 mm/y).

4. Summary and Conclusions

In this study, SBAS-InSAR was used to interpret and process 70 Sentinel SAR images covering Chongming East Shoal (CES) in Shanghai. Moreover, the spatial distribution of ground deformations and geological features along typical profiles was analyzed in order to facilitate an understanding of ground deformation associated with different reclamation projects and the mechanism. The main conclusions are as follows:
1. Non-uniform ground deformation ranging from −47.5 to 34.6 mm/y was measured from 22 March 2015 to 2 December 2019 with relatively reliable precision. Furthermore, differential land subsidence was identified in multi-phase reclamation areas, except for the southeast tidal flat.
2. For the reclamation areas completed more than 20 years ago, the offshore lands where projects started late underwent lower subsidence velocity than the onshore areas. The reason is that urbanization shows a greater impact on triggering accelerated subsidence than the temporal evolution of reclamation when compression layers enter long-term secondary consolidation. Chenjia Town and the southern commercial development zone have, therefore, become the centers of ground subsidence.
3. The stratigraphic structure and geological features of soil layers also play a critical role in ground deformation. According to the laboratory test, the drainage condition of the soil layer in the offshore area is worse, as compared to the area with early reclamation time, so the soil layer is not fully compressed, resulting in slow subsidence.
The SBAS-InSAR method, coupled with laboratory tests, is vital for assessing land subsidence, and provides support for planning land use efficiently and mitigating associated risks, although this study suffers the limitation of relatively few leveling points. Further work on improved leveling networks, together with a higher sampling frequency, would also be of merit to enrich and improve these preliminary results.

Author Contributions

Conceptualization, Q.Y.; validation, X.Y. and T.Y.; formal analysis, Q.Y. and K.Z.; investigation, M.Y.; writing—original draft preparation, Q.Y.; writing—review & editing, Q.W. and S.S.; project administration, Q.W. and X.H.; funding acquisition, Q.W., X.Y. and T.Y. All authors have read and agreed to the published version of the manuscript.

Funding

This research was funded by the Key Laboratory of Land Subsidence Monitoring and Prevention, Ministry of Land and Resources, grant number KLLSMP201801 and 2019(D)-004(F)-01; the UNESCO-IUGS project, grant number IGCP 663; the Key Program of International (Regional) Cooperation and Exchange of National Natural Science Foundation, grant number 41820104001; the National key research and development plan, grant number2018YFC1505301 and 2018YFC1505304.

Acknowledgments

In this study, Sentinel-1 data were provided by European Space Agency (ESA) through the Copernicus Open Access Hub. Precise orbital ephemeris data of AUX_POEORB were collected through the Sentinel-1 Quality Control. Global terrain data (shuttle radar topography mission, SRTM) were provided by the National Aeronautics and Space Administration (NASA). Google Earth images were used to generate results and describe the location of study area. We are very grateful for the above support. Meanwhile, we sincerely thank the editors and all anonymous reviewers for their constructive and excellent reviews that helped to improve the paper.

Conflicts of Interest

The authors declare no conflict of interest.

References

  1. Bi, X.; Liu, F.; Pan, X. Coastal projects in China: From reclamation to restoration. Environ. Sci. Technol 2012, 46, 4691–4692. [Google Scholar] [CrossRef] [PubMed]
  2. McLeod, E.; Poulter, B.; Hinkel, J.; Reyes, E.; Salm, R. Sea-level rise impact models and environmental conservation: A review of models and their applications. Ocean Coast. Manag. 2010, 53, 507–517. [Google Scholar] [CrossRef]
  3. Yan, H. Aging characteristics of material, structure changes and settlement prediction of dredger fill in the consolidation process of step vacuum preloading. Ph.D. Thesis, Jilin University, Changchun, China, 2015. [Google Scholar]
  4. Song, J. Laboratory simulation test and PFC3D numerical analysis of high clay dredger fill in the consolidation process of step vacuum preloading. Ph.D. Thesis, Jilin University, Changchun, China, 2011. [Google Scholar]
  5. Pepe, A.; Bonano, M.; Zhao, Q.; Yang, T.; Wang, H. The use of C-/X-band time-gapped SAR data and geotechnical models for the study of Shanghai’s ocean-reclaimed lands through the SBAS-DInSAR technique. Remote Sens. 2016, 8. [Google Scholar] [CrossRef] [Green Version]
  6. Zhang, W.; Chen, J.-W.; Liu, W.; Li, Q.-X. Evaluation of exploitative land resources in major function zoning of Shanghai. Shanghai Geol. 2009, 3. [Google Scholar] [CrossRef]
  7. Yuan, X.-Q.; Wang, Q.; Lu, W.-X.; Zhang, W.; Chen, H.-E.; Zhang, Y. Indoor simulation test of step vacuum preloading for high-clay content dredger fill. Mar. Georesour. Geotec. 2018, 36, 83–90. [Google Scholar] [CrossRef]
  8. Haas, J.; Ban, Y. Urban growth and environmental impacts in Jing-Jin-Ji, the Yangtze, River Delta and the Pearl River Delta. Int. J. Appl. Earth. Obs. 2014, 30, 42–55. [Google Scholar] [CrossRef]
  9. Sarychikhina, O.; Glowacka, E.; Mellors, R.; Vidal, F.S. Land subsidence in the Cerro Prieto Geothermal Field, Baja California, Mexico, from 1994 to 2005. An integrated analysis of DInSAR, leveling and geological data. J. Volcanol. Geoth. Res. 2011, 204, 76–90. [Google Scholar] [CrossRef]
  10. Hu, R.L.; Yue, Z.Q.; Wang, S.J.; Wang, L.C. Review on current status and challenging issues of land subsidence in China. Eng. Geol. 2004, 76, 65–77. [Google Scholar] [CrossRef]
  11. Galloway, D.; Jones, D.R.; Ingebritsen, S.E. Land subsidence in the United States. US Geol. Surv. Circul. 2000, 1–175. [Google Scholar] [CrossRef]
  12. Leighton, J.M. GPS and PSI integration for monitoring urban land motion. Ph.D. Thesis, University of Nottingham, Nottingham, UK, 2010. [Google Scholar]
  13. Yang, M.; Yang, T.; Zhang, L.; Lin, J.; Qin, X.; Liao, M. Spatio-temporal characterization of a reclamation settlement in the Shanghai coastal area with time series analyses of X-, C-, and L-band SAR datasets. Remote Sens. 2018, 10, 329. [Google Scholar] [CrossRef] [Green Version]
  14. Zhao, Q.; Pepe, A.; Gao, W.; Lu, Z.; Bonano, M.; He, M.L.; Wang, J.; Tang, X. A DInSAR Investigation of the Ground Settlement Time Evolution of Ocean-Reclaimed Lands in Shanghai. IEEE J-STARS. 2015, 8, 1763–1781. [Google Scholar] [CrossRef]
  15. Zebker, H.A.; Gabriel, A.K.; Goldstein, R.M. Mapping small elevation changes over large areas - Differential radar interferometry. J. Geophys. Res. 1989, 94, 9183–9191. [Google Scholar] [CrossRef]
  16. Massonnet, D.; Rossi, M.; Carmona, C.; Adragna, F.; Peltzer, G.; Feigl, K.; Rabaute, T. The displacement field of the Landers earthquake mapped by radar interferometry. Nature 1993, 364, 138–142. [Google Scholar] [CrossRef]
  17. Massonnet, D.; Feigl, K.L.; Massonnet, D.; Feigl, K.L. Radar interferometry and its application to changes in the Earth’s surface. Rev. Geophys. 1998, 36, 441–500. [Google Scholar] [CrossRef] [Green Version]
  18. Rignot, E.J. Fast recession of a west antarctic glacier. Science 1998, 281, 549–551. [Google Scholar] [CrossRef] [PubMed] [Green Version]
  19. Bürgmann, R.; Rosen, P.A.; Fielding, E.J. Synthetic Aperture Radar Interferometry to Measure Earth’s Surface Topography and Its Deformation. Ann.rev.earth Planet.sci 2000, 28, 169–209. [Google Scholar] [CrossRef]
  20. Zebker, H.A.; Villasenor, J. Decorrelation in interferometric radar echoes. IEEE T. Geosci. Remote. 1992, 30, 950–959. [Google Scholar] [CrossRef] [Green Version]
  21. Lanari, R.; Casu, F.; Manzo, M.; Zeni, G.; Berardino, P.; Manunta, M.; Pepe, A. An Overview of the Small BAseline Subset Algorithm: a DInSAR Technique for Surface Deformation Analysis. Pure Appl. Geophys. 2007, 164, 637–661. [Google Scholar] [CrossRef]
  22. Usai, S.; Klees, R. SAR interferometry on a very long time scale: a study of the interferometric characteristics of man-made features. IEEE T. Geosci. Remote. 1999, 37, 2118–2123. [Google Scholar] [CrossRef] [Green Version]
  23. Ferretti, A.; Prati, C.; Rocca, F. Nonlinear subsidence rate estimation using permanent scatterers in differential SAR interferometry. IEEE T. Geosci. Remote. 2000, 38, 2202–2212. [Google Scholar] [CrossRef] [Green Version]
  24. Hooper, A.; Zebker, H.; Segall, P.; Kampes, B. A new method for measuring deformation on volcanoes and other natural terrains using InSAR persistent scatterers. Geophys. Res. Lett. 2004, 31, L23611-n/a. [Google Scholar] [CrossRef]
  25. Bürgmann, R.; Hilley, G.; Ferretti, A.; Novali, F. Resolving vertical tectonics in the San Francisco Bay Area from permanent scatterer InSAR and GPS analysis. Geology 2006, 34, 221–224. [Google Scholar] [CrossRef]
  26. Berardino, P.; Fornaro, G.; Lanari, R.; Sansosti, E. A new algorithm for surface deformation monitoring based on small baseline differential SAR interferograms. IEEE T. Geosci. Remote. 2002, 40, 2375–2383. [Google Scholar] [CrossRef] [Green Version]
  27. Lanari, R.; Mora, O.; Manunta, M.; Mallorqui, J.J.; Berardino, P.; Sansosti, E. A small-baseline approach for investigating deformations on full-resolution differential SAR interferograms. IEEE T. Geosci. Remote. 2004, 42, 1377–1386. [Google Scholar] [CrossRef]
  28. Casu, F.; Manzo, M.; Lanari, R. A quantitative assessment of the SBAS algorithm performance for surface deformation retrieval from DInSAR data. Remote Sens. Environ. 2006, 102, 195–210. [Google Scholar] [CrossRef]
  29. Bing, X.; Feng, G.; Li, Z.; Wang, Q.; Wang, C.; Xie, R. Coastal Subsidence Monitoring Associated with Land Reclamation Using the Point Target Based SBAS-InSAR Method: A Case Study of Shenzhen, China. Remote Sens. 2016, 8, 652. [Google Scholar] [CrossRef] [Green Version]
  30. Canova, F.; Tolomei, C.; Salvi, S.; Toscani, G.; Seno, S. Land subsidence along the Ionian coast of SE Sicily (Italy), detection and analysis via Small Baseline Subset (SBAS) multitemporal differential SAR interferometry. Earth Surf. Proc. Land. 2012, 37, 273–286. [Google Scholar] [CrossRef]
  31. Hu, B.; Wang, H.-S.; Sun, Y.-L.; Hou, J.-G.; Liang, J. Long-term land subsidence monitoring of Beijing (China) using the small baseline subset (SBAS) technique. Remote Sens. 2014, 6, 3648–3661. [Google Scholar] [CrossRef] [Green Version]
  32. Jiang, L.; Lin, H. Integrated analysis of SAR interferometric and geological data for investigating long-term reclamation settlement of Chek Lap Kok Airport, Hong Kong. Eng. Geol. 2010, 110, 77–92. [Google Scholar] [CrossRef]
  33. Fan, H.; Deng, K.; Ju, C.; Zhu, C.; Xue, J. Land subsidence monitoring by D-InSAR technique. Min. Sci. Technol. 2011, 21, 869–872. [Google Scholar] [CrossRef]
  34. Miao, D. The geological structure of the shanghai district and the East China Sea. Mar. Sci. Bull. 1983, 2, 50–57. [Google Scholar]
  35. Jiang, G.; Yao, Y.; Tang, Z. The analysis for influencing factors of fine sediment flocculation in the Changjiang Estuary. ACTA OCEANOL. SIN. 2002, 24, 51–57. [Google Scholar] [CrossRef]
  36. Li, J.; Dai, Z.; Liu, Q.; Li, W.; Wu, R.; Zhao, J. In-situ observation of floccule size and fluid mudin the Changjiang Estuary. J. Sediment Res. 2008, 3, 26–32. [Google Scholar] [CrossRef]
  37. Shi, L.G.; Li, C.; Yang, S.L. The microscopic characteristics of Shanghai soft clay and its effect on soil body deformation and land subsidence. Environ. Geol. 2009, 56, 1051–1056. [Google Scholar] [CrossRef]
  38. Yan, X.X.; Shi, Y.J. Structure characteristic of engineering geology in Shanghai. Shanghai Land Resour. 2006, 19–24. [Google Scholar] [CrossRef]
  39. Zhang, W.L.; Shi, Y.J. Discussion on Shanghai Engineering Geological Division. Shanghai Land Resour. 2013, 34, 5–9. [Google Scholar] [CrossRef]
  40. Plant, G.W.; Covil, C.S.; Publishing, T.T. Site Preparation for the new Hong Kong International Airport - the Design, Construction and Performance of the Airport Platform; Institution of Civil Engineers Publishing: London, UK, 1998. [Google Scholar]
  41. Terzaghi, K.; Peck, R.B.; Mesri, G. Soil Mechanics in Engineering Practice; John Wiley & Sons: Hoboken, NJ, USA, 1996. [Google Scholar]
  42. Standard for Soil Test Methods (GB/T 50123-1999); China Planning Press: Beijing, China, 1999.
  43. Wang, Q.; Wang, F.-Y.; Xiao, S.-F. A quantitative study of the microstructure characteristics of soil and its application to the engineering. J. Chengdu U. Technol. 2001, 28, 148–153. (In Chinese) [Google Scholar] [CrossRef]
  44. Wang, Q.; Chen, H.; Cai, K. Quantitative evaluation of microstructure features of soil contained some cement. Rock Soil Mech. 2003, s1, 12–16. (In Chinese) [Google Scholar] [CrossRef]
  45. Yuan, X.-Q.; Wang, Q.; Sun, T.; Xia, Y.-B.; Chen, H.-E.; Song, J. Pore distribution characteristics of dredger fill during hierarchical vacuum preloading. J. Jilin U. (Earth Science Edition) 2012, 42, 169–176. [Google Scholar] [CrossRef]
  46. Song, S.; Wang, Q.; Sun, T.; Yan, H.; Sun, M.; Yuan, X. Pore distribution characteristics of dredger fill consolidated by different methods. J. Chang’an U. (Natural Science Edition) 2015, 35. (In Chinese) [Google Scholar] [CrossRef]
  47. Liu, X.; Zhao, C.; Zhang, Q.; Yang, C.; Zhang, J. Characterizing and monitoring ground settlement of marine reclamation land of Xiamen New Airport, China with Sentinel-1 SAR Datasets. Remote Sens. 2019, 11, 585. [Google Scholar] [CrossRef] [Green Version]
  48. Yague-Martinez, N.; Prats-Iraola, P.; Rodriguez Gonzalez, F.; Brcic, R.; Shau, R.; Geudtner, D.; Eineder, M.; Bamler, R. Interferometric Processing of Sentinel-1 TOPS Data. IEEE T. Geosci. Remote. 2016, 54, 2220–2234. [Google Scholar] [CrossRef] [Green Version]
  49. Torres, R.; Snoeij, P.; Geudtner, D.; Bibby, D.; Davidson, M. GMES Sentinel-1 mission. Remote Sens. Environ. 2012, 120, 9–24. [Google Scholar] [CrossRef]
  50. Yang, K.; Yang, J.; Jiang, B. Sentinel-1 Satellite Overview. Urban Geotech. Invest. Surv. 2015, 2, 24–27. (In Chinese) [Google Scholar] [CrossRef]
  51. Goldstein, R.M.; Werner, C.L. Radar interferogram filtering for geophysical applications. Geophys. Res. Lett. 1998, 25, 4035–4038. [Google Scholar] [CrossRef] [Green Version]
  52. Costantini, M. A novel phase unwrapping method based on network programming. IEEE Trans. Geosci. Remote. 1998, 36, 813–821. [Google Scholar] [CrossRef]
  53. Wu, Q.; Jia, C.; Chen, S.; Li, H. SBAS-InSAR Based Deformation Detection of Urban Land, Created from Mega-Scale Mountain Excavating and Valley Filling in the Loess Plateau: The Case Study of Yan’an City. Remote Sens. 2019, 11, 1673. [Google Scholar] [CrossRef] [Green Version]
  54. Luo, Y.; Ye, S.; Wu, J.; Jiao, X.; Wang, H. Characterization of land subsidence during recovery of groundwater levels in Shanghai. Geol. J. Chin. U. 2015, 21, 243–254. (In Chinese) [Google Scholar] [CrossRef]
  55. Yan, X.; Gong, S.; Zeng, Z.; Yu, J.; Shen, G.; Wang, T. Relationship between building density and land subsidence in Shanghai urban zone. Hydroge. Eng. Geol. 2002, 29, 21–25. (In Chinese) [Google Scholar] [CrossRef]
  56. Solari, L.; Ciampalini, A.; Raspini, F.; Bianchini, S.; Zinno, I.; Bonano, M.; Manunta, M.; Moretti, S.; Casagli, N. Combined use of C- and X-band SAR data for subsidence monitoring in an urban area. Geosciences (Switzerland) 2017, 7, 21. [Google Scholar] [CrossRef] [Green Version]
  57. Tang, D.; Liu, Y.; Zhang, W. Science of Engineering Rock and Soil; Geological Publishing House: Beijing, China, 1999. [Google Scholar]
  58. Reynolds, W.D.; Bowman, B.T.; Drury, C.F.; Tan, C.S.; Lu, X. Indicators of good soil physical quality: Density and storage parameters. Geoderma 2002, 110, 131–146. [Google Scholar] [CrossRef]
  59. Dexter, A.R. Advances in characterization of soil structure. Soil Till. Res. 1988, 11, 199–238. [Google Scholar] [CrossRef]
Figure 1. Google Earth-based maps of (a) Shanghai city and the northeastern study area, (b) spatial evolution of land reclamation in Chongming East Shoal (CES) since the 1990s, and (c) sampling points (C1-C5) at different phases. Note that stage 1 and stage 2 were bounded by the cofferdam built in 1976.
Remotesensing 12 01016 g001
Figure 2. (a) Geological section map of borehole profiles (different depth gauges were used here due to the large gap in soil thickness) based on field investigations; (b) photographs of representative soil layers; (c) the black interlayer between dredger fill and sandy silt; (d) finger marks on the clay surfaces.
Remotesensing 12 01016 g002
Figure 3. Block diagram of the small baseline subset (SBAS) algorithm. LOS: line of sight; SVD: singular value decomposition.
Remotesensing 12 01016 g003
Figure 4. (a) Time-position plot of synthetic aperture radar (SAR) image acquisitions and (b) the time baseline of Sentinel-1 interferometric pairs.
Remotesensing 12 01016 g004
Figure 5. SBAS-derived maps of (a) vertical deformation velocity and (b) its error superimposed onto a Google Earth image, based on Sentinel-1 SAR images that were collected from 22 March 2015 to 2 December 2019. Five zones (A to E), with different deformation patterns, were divided according to land use and the locations of partial cofferdams. The black diamonds shown in Figure 5b indicate the locations of representative ground control points (GCPs).
Remotesensing 12 01016 g005aRemotesensing 12 01016 g005b
Figure 6. (a) Time series deformation of zones A to E and (b) their mean deformation velocities, during the period ranging from 2015 to 2019 from 22 March 2015 to 2 December 2019. Note that the time unit, shown in Figure 6a, has been converted from the date, when each Sentinel-1 SAR image was acquired, to days.
Remotesensing 12 01016 g006
Figure 7. (a) Statistical range of deformation in each reclamation area along the long axis direction and the location of borehole profile P–P’, and (b) statistical results. (c) A schematic of the correlation between deformation velocity and reclamation time in this study, and other relevant studies [13,14,29,47]. (d) The positions of the monitoring periods on the typical time-settlement prediction curve of alluvial clay under reclamation [32,41].
Remotesensing 12 01016 g007
Figure 8. Comparison of SBAS-derived deformation velocity (νS) and fitting leveling data (νL) at the leveling location.
Remotesensing 12 01016 g008
Figure 9. Changes in the geological features of the soil layers around boreholes from west to east. The geological features include (a) water content, (b) porosity, (c) dry density, (d) cation exchange capacity, and (e) the compression index. The boreholes were divided into two groups (C1-C2 and C3-C5) by the cofferdam built in 1976. Different locations of boreholes indicate the various phases of reclamation projects.
Remotesensing 12 01016 g009
Figure 10. Mercury intrusion porosimetry (MIP)-based micropore distribution of (a) plain fill, (b) muddy clay, and (c) clay.
Remotesensing 12 01016 g010
Figure 11. Variation of porosity based on MIP and corresponding SEM images.
Remotesensing 12 01016 g011
Figure 12. Schematic of the consolidation and drainage of soil layers at different reclamation times (zones A, B, and C here correspond to the zones shown in Figure 5).
Remotesensing 12 01016 g012
Table 1. Stratigraphic division in Chongming East Shoal (CES).
Geological AgeLayer Number and LithologyDeposit TypeDistributionThickness (m)
Holocene
Q 4
Q 4 3 3-1 Plain fillArtificial/reclamation projectReclamation area1.0–2.4
3-2 Dredger fill1.6–2.4
1 Silty clay with sandy siltLittoral–estuarinePartial0.0–1.3
3 Sandy siltWhole2.9–7.0
Q 4 2 ③ Muddy silty clayLittoral–shallow seaPartial0.0–1.7
④ Muddy clay4.1–6.5
Q 4 1 1-1 ClaySupralittoral–swampyWhole16.0–28.6
1-2 Silty clay4.0–13.4
Note: Q 4 1 , Q 4 2 and Q 4 3 indicates three sedimentary periods from early to late Holocene.
Table 2. Basic parameters of Sentinel-1 images and shuttle radar topography mission (SRTM) data.
OrbitNear Polar Sun-Synchronous @ 693 km;
175 orbits per cycle
Orbital period98.6 min
Orbital directionAscending
Imaging modeInterferometric wide swath mode (IW)
Swath250 km
Ground resolution5 m × 20 m
PolarizationVertical polarization (VV)
Relative orbit number171
SRTMResolution30 m
Positioning accuracy20 m
Elevation accuracy16 m

