Article

Quality Assessment of PROBA-V LAI, fAPAR and fCOVER Collection 300 m Products of Copernicus Global Land Service

1
Earth Observation Laboratory (EOLAB), Parc Cientific University of Valencia, C/ Catedràtic Agustín Escardino, 9, 46980 Paterna, Valencia, Spain
2
CREAF, 08193 Bellaterra (Cerdanyola del Vallès), Catalonia, Spain
3
CSIC, Global Ecology Unit CREAF-CSIC-UAB, 08193 Bellaterra (Cerdanyola del Vallès), Catalonia, Spain
4
HYGEOS, Euratechnologies, 165 avenue de Bretagne, 59000 Lille, France
5
UMR1114 EMMAH, INRA, Centre PACA, Bâtiment Climat, Domaine Saint-Paul, 228 route de l’Aérodrome, CS 40509, 84914 Avignon CEDEX, France
6
Flemish Institute for Technological Research (VITO), Remote Sensing Unit, Boeretang 200, B-2400 Mol, Belgium
*
Author to whom correspondence should be addressed.
Submission received: 3 February 2020 / Revised: 12 March 2020 / Accepted: 19 March 2020 / Published: 22 March 2020
(This article belongs to the Special Issue Recent Advances in Satellite Derived Global Land Product Validation)

Abstract

:
The Copernicus Global Land Service (CGLS) provides global time series of leaf area index (LAI), fraction of absorbed photosynthetically active radiation (fAPAR) and fraction of vegetation cover (fCOVER) data at a resolution of 300 m and a frequency of 10 days. We performed a quality assessment and validation of Version 1 Collection 300 m products that were consistent with the guidelines of the Land Product Validation (LPV) subgroup of the Committee on Earth Observation System (CEOS) Working Group on Calibration and Validation (WGCV). The spatiotemporal patterns of Collection 300 m V1 LAI, fAPAR and fCOVER products are consistent with CGLS Collection 1 km V1, Collection 1 km V2 and Moderate Resolution Imagery Spectroradiometer Collection 6 (MODIS C6) products. The Collection 300 m V1 products have good precision and smooth temporal profiles, and the interannual variations are consistent with similar satellite products. The accuracy assessment using ground measurements mainly over crops shows an overall root mean square deviation of 1.01 (44.3%) for LAI, 0.12 (22.2%) for fAPAR and 0.21 (42.6%) for fCOVER, with positive mean biases of 0.36 (15.5%), 0.05 (10.3%) and 0.16 (32.2%), respectively. The products meet the CGLS user accuracy requirements in 69.1%, 62.5% and 29.7% of the cases for LAI, fAPAR and fCOVER, respectively. The CGLS will continue the production of Collection 300 m V1 LAI, fAPAR and fCOVER beyond the end of the PROBA-V mission by using Sentinel-3 OLCI as input data.

1. Introduction

The Copernicus programme is the European Union’s Earth observation and monitoring programme, and it records data on the Earth and its ecosystems for the ultimate benefit of all citizens. A variety of technologies, including satellites and ground-based, sea-based and air-based measurements systems, allows Copernicus to deliver operational data and information services openly and freely in a wide range of application areas. In particular, the Copernicus Land Monitoring Service (CLMS) provides geographical information on land cover, land change and a variety of geophysical variables of the biosphere and the cryosphere. The CLMS global component, known as the Copernicus Global Land Service (CGLS) [1], ensures operational monitoring of the continental ecosystems through the provision of terrestrial geophysical variables that are needed to characterise the energy, carbon and water cycles. The CGLS products are delivered in near real time on a worldwide scale. The near-real-time products are complemented by the production of historical time series with a focus on their temporal consistency and change detection. The CGLS provides data for European Union policies in agriculture and food security, biodiversity and environmental protection, natural resources management and climate change.
The CGLS portfolio includes leaf area index (LAI) and fraction of the photosynthetically active radiation absorbed by vegetation (fAPAR) data, which are essential climate variables [2]. The LAI and fAPAR play key roles in several surface processes, rain interception, photosynthesis, respiration, transpiration, productivity and the energy balance of the surface. In the CGLS, the LAI is defined as half the total developed area of green elements per unit horizontal ground area [3], while fAPAR is defined as the fraction of radiation absorbed by green vegetation elements in the 400 to 700 nm spectral domain around 10:00 solar time under clear sky conditions. Other vegetation variables are also provided by the CGLS, including the fraction of vegetation cover (fCOVER), which is defined as the fraction of ground area covered by green vegetation as seen from nadir. fCOVER is required to separate the contributions of soil and vegetation in soil-vegetation-atmosphere transfer, energy balance and evapotranspiration models [4]. The CGLS LAI, fAPAR and fCOVER variables are derived from SPOT/VEGETATION (for the period from 1999 to May 2014) [5] and PROBA-V (from May 2014 to present) [6] data. The variables are generated at a 1 km resolution (Version 1 and Version 2 detailed in Section 2.2) and 300 m V1 (only from PROBA-V). The PROBA-V 300 m V1 processing lines were designed in the framework of the FP7 ImagineS project [7,8].
LAI, fAPAR and fCOVER products must be associated with quantitative uncertainties to properly assimilate them in process models. The CEOS WGCV LPV subgroup has established a set of protocols and good practices for the validation of global LAI products [9]. The proposed methodology relies on intercomparison and direct validation approaches [10,11,12,13,14]. Intercomparisons with similar remote sensing products (i.e., indirect validation) can determine whether the products behave similarly in space and time on a global scale and allow us to identify differences between products to be investigated in more detail in order to diagnose product anomalies and devise algorithm refinements. Spatial and temporal consistencies of the products can be quantified without concurrent ground measurements, and such work can provide an estimate of the attached precision over a larger range of situations. Finally, comparisons with in situ measurements (i.e., direct validation) allows the accuracy of the products to be quantified. Comparisons with ground data are achieved by scaling up the ground measurements using decametric imagery, which is then aggregated to match the medium-resolution products [14,15]. However, ground datasets are still quite limited in time and space and thus are poorly representative of global conditions. In the framework of the FP7 ImagineS project, field campaigns were conducted over a network of mostly cropland sites across the world for the collection of ground measurements [16] following well-established protocols for validation of satellite-based products [17]. These protocols were developed during the Validation of Land European Remote Sensing Instruments (VALERI) project [18]. The ground data were upscaled using high spatial resolution (10–30 m) imagery [16] based on CEOS WGCV LPV recommendations [9,14].
The aim of this paper is to assess the quality of Collection 300 m V1 LAI, fAPAR and fCOVER products derived from PROBA-V sensor data and to determine whether they are compliant with CGLS requirements. The quality assessment is based on three components:
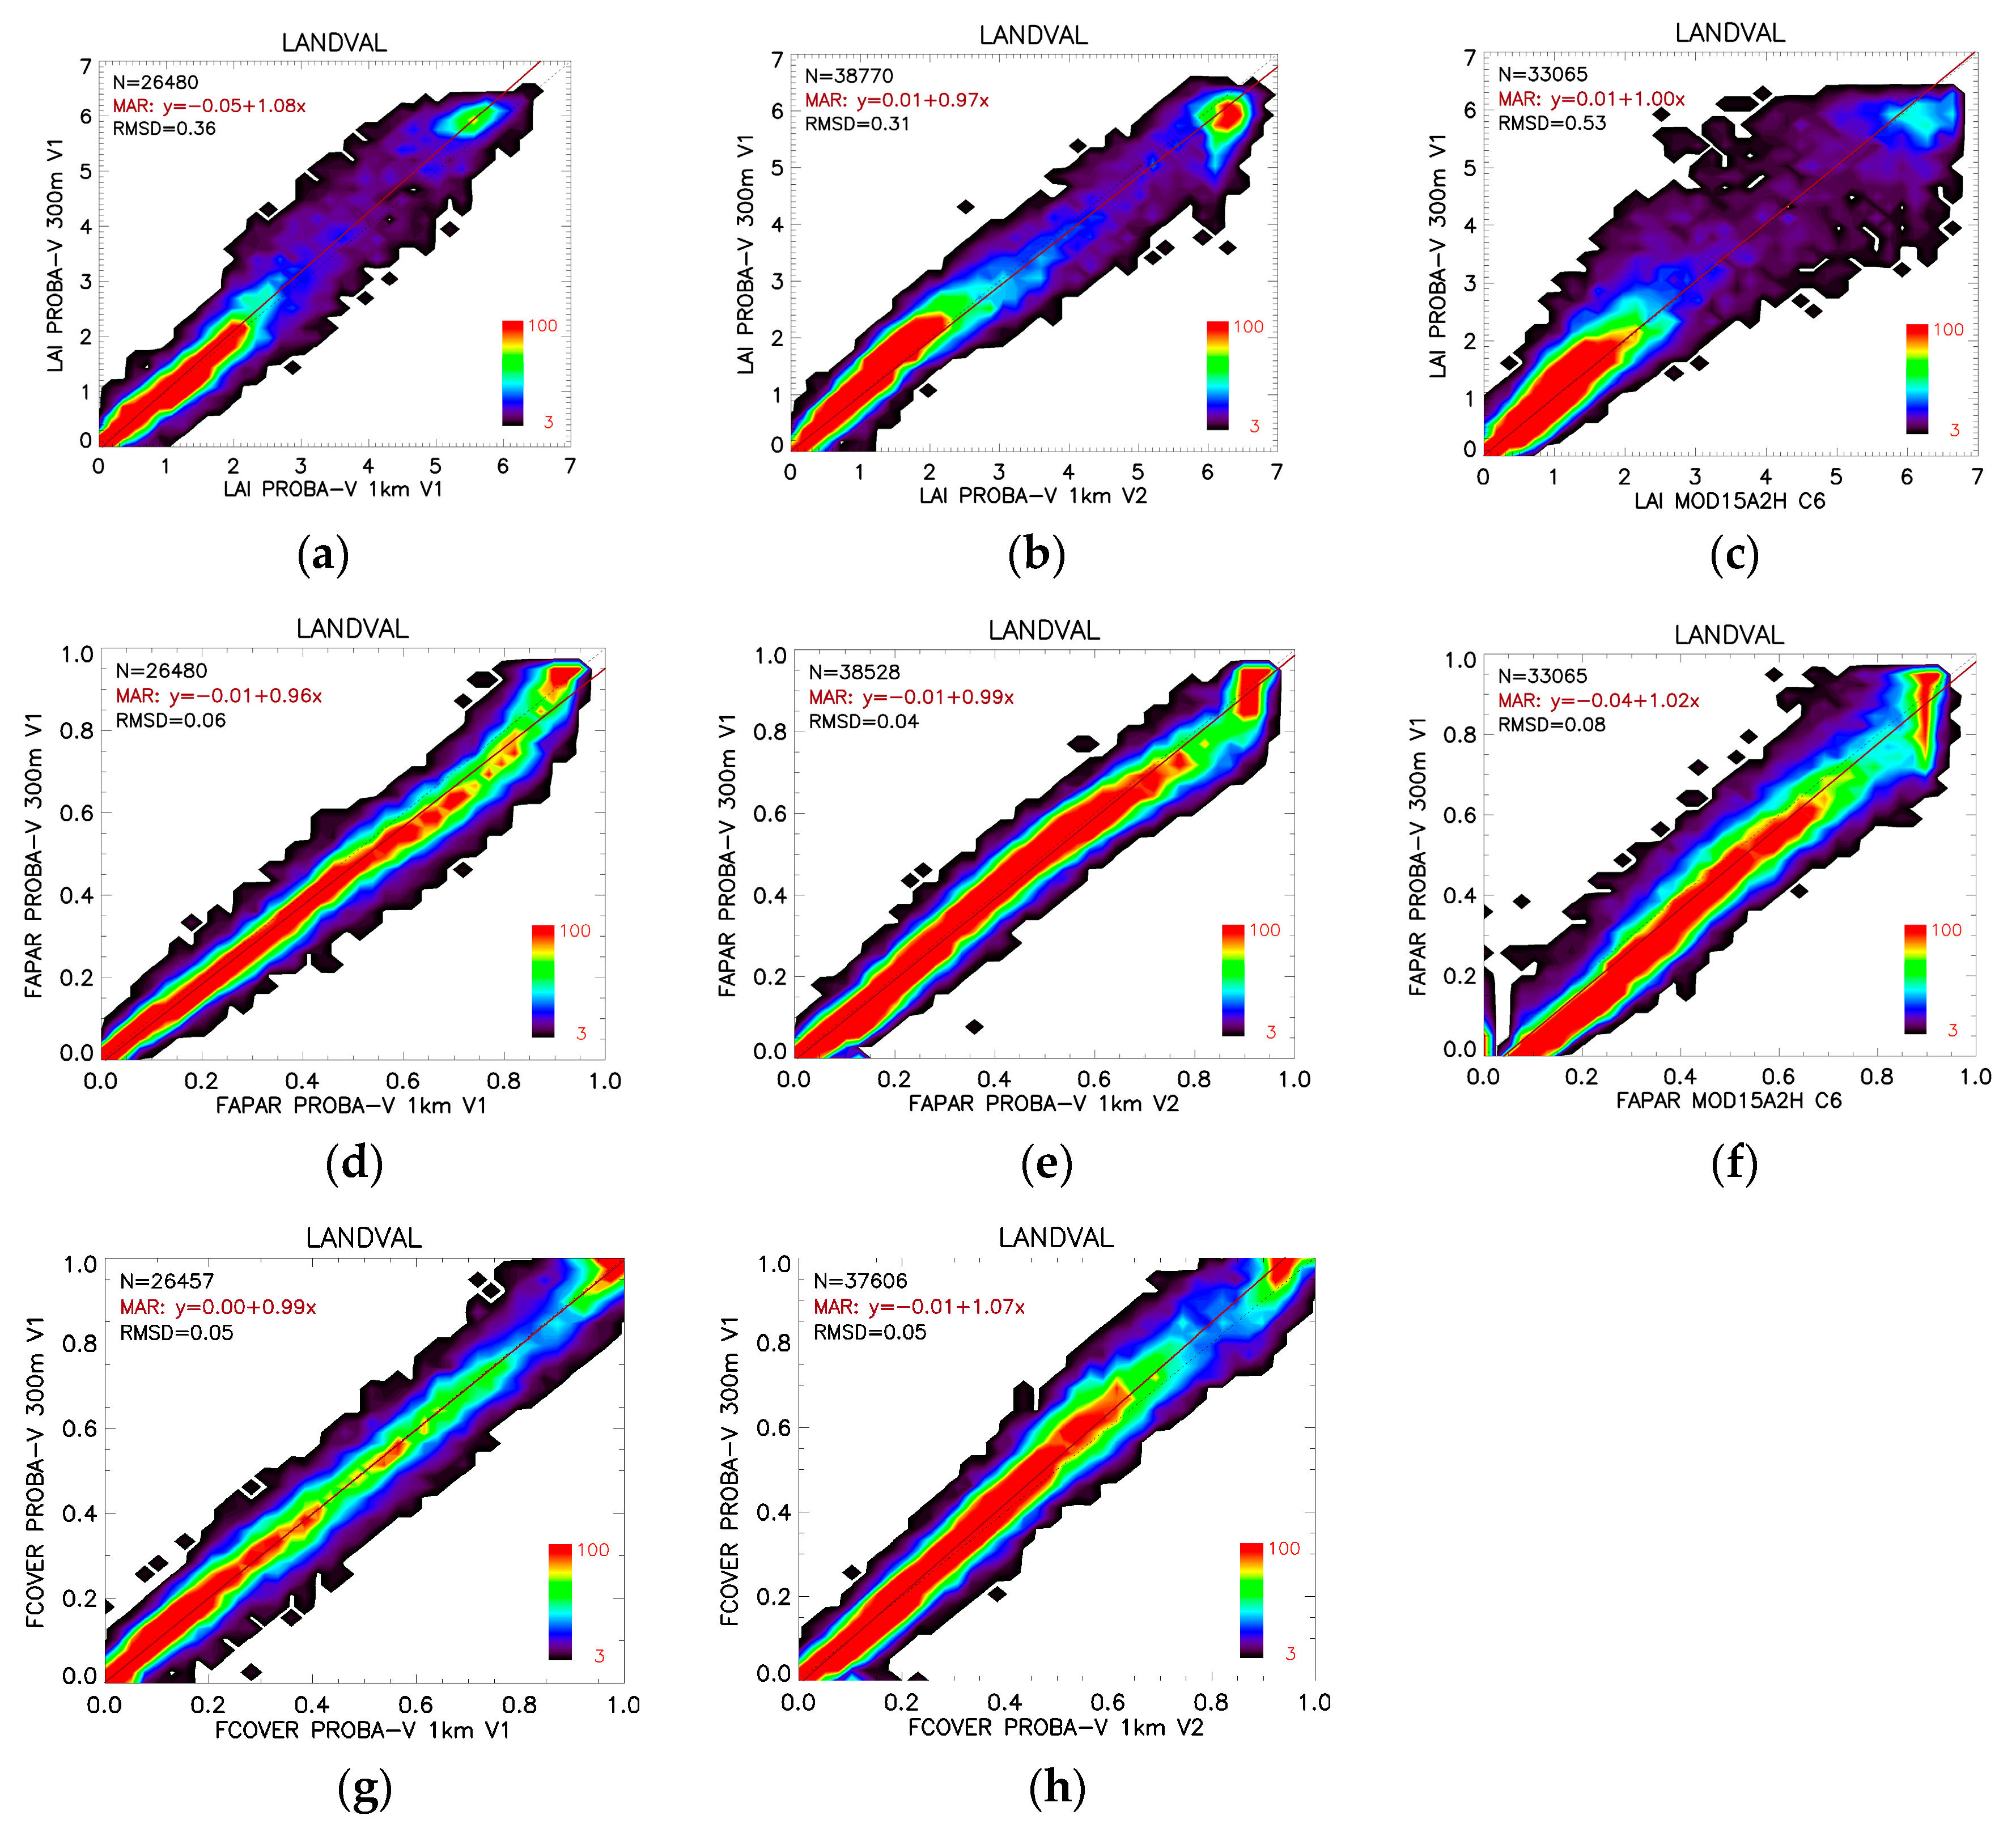
  • Assessment of the product spatiotemporal consistency with similar (CGLS PROBA-V Collection 1 km V1 and V2 and MODIS C6) satellite products;
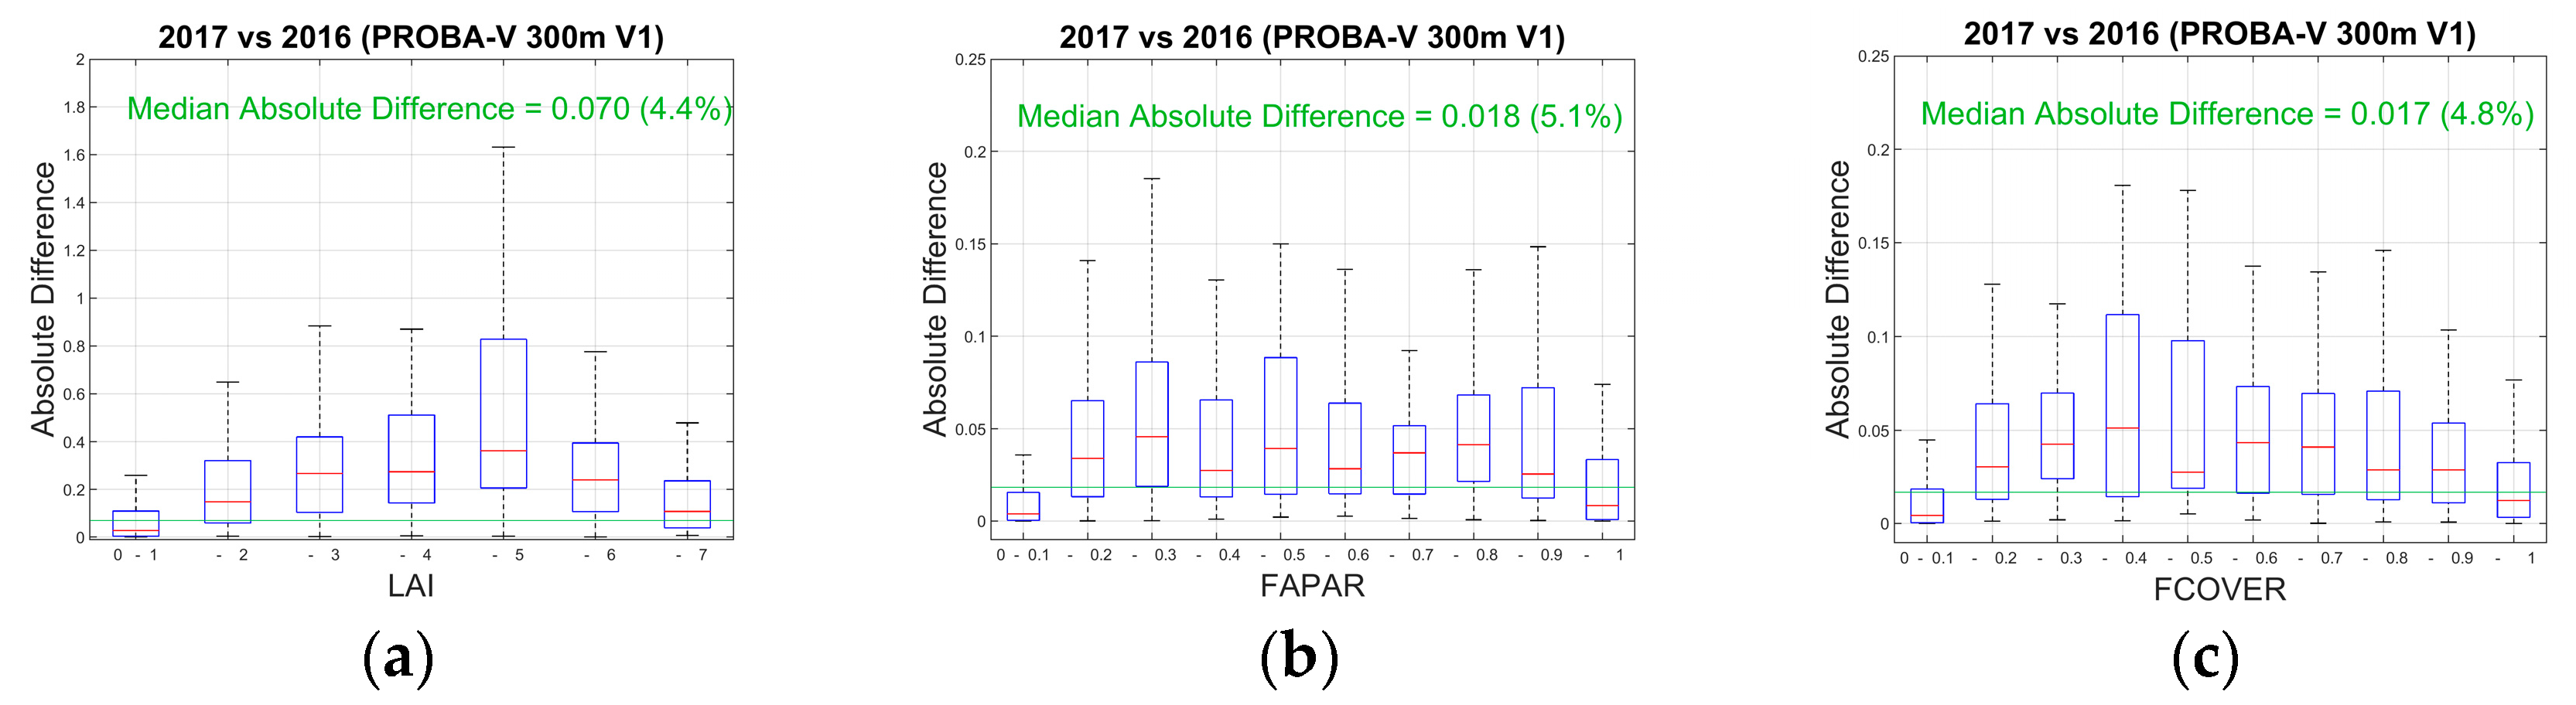
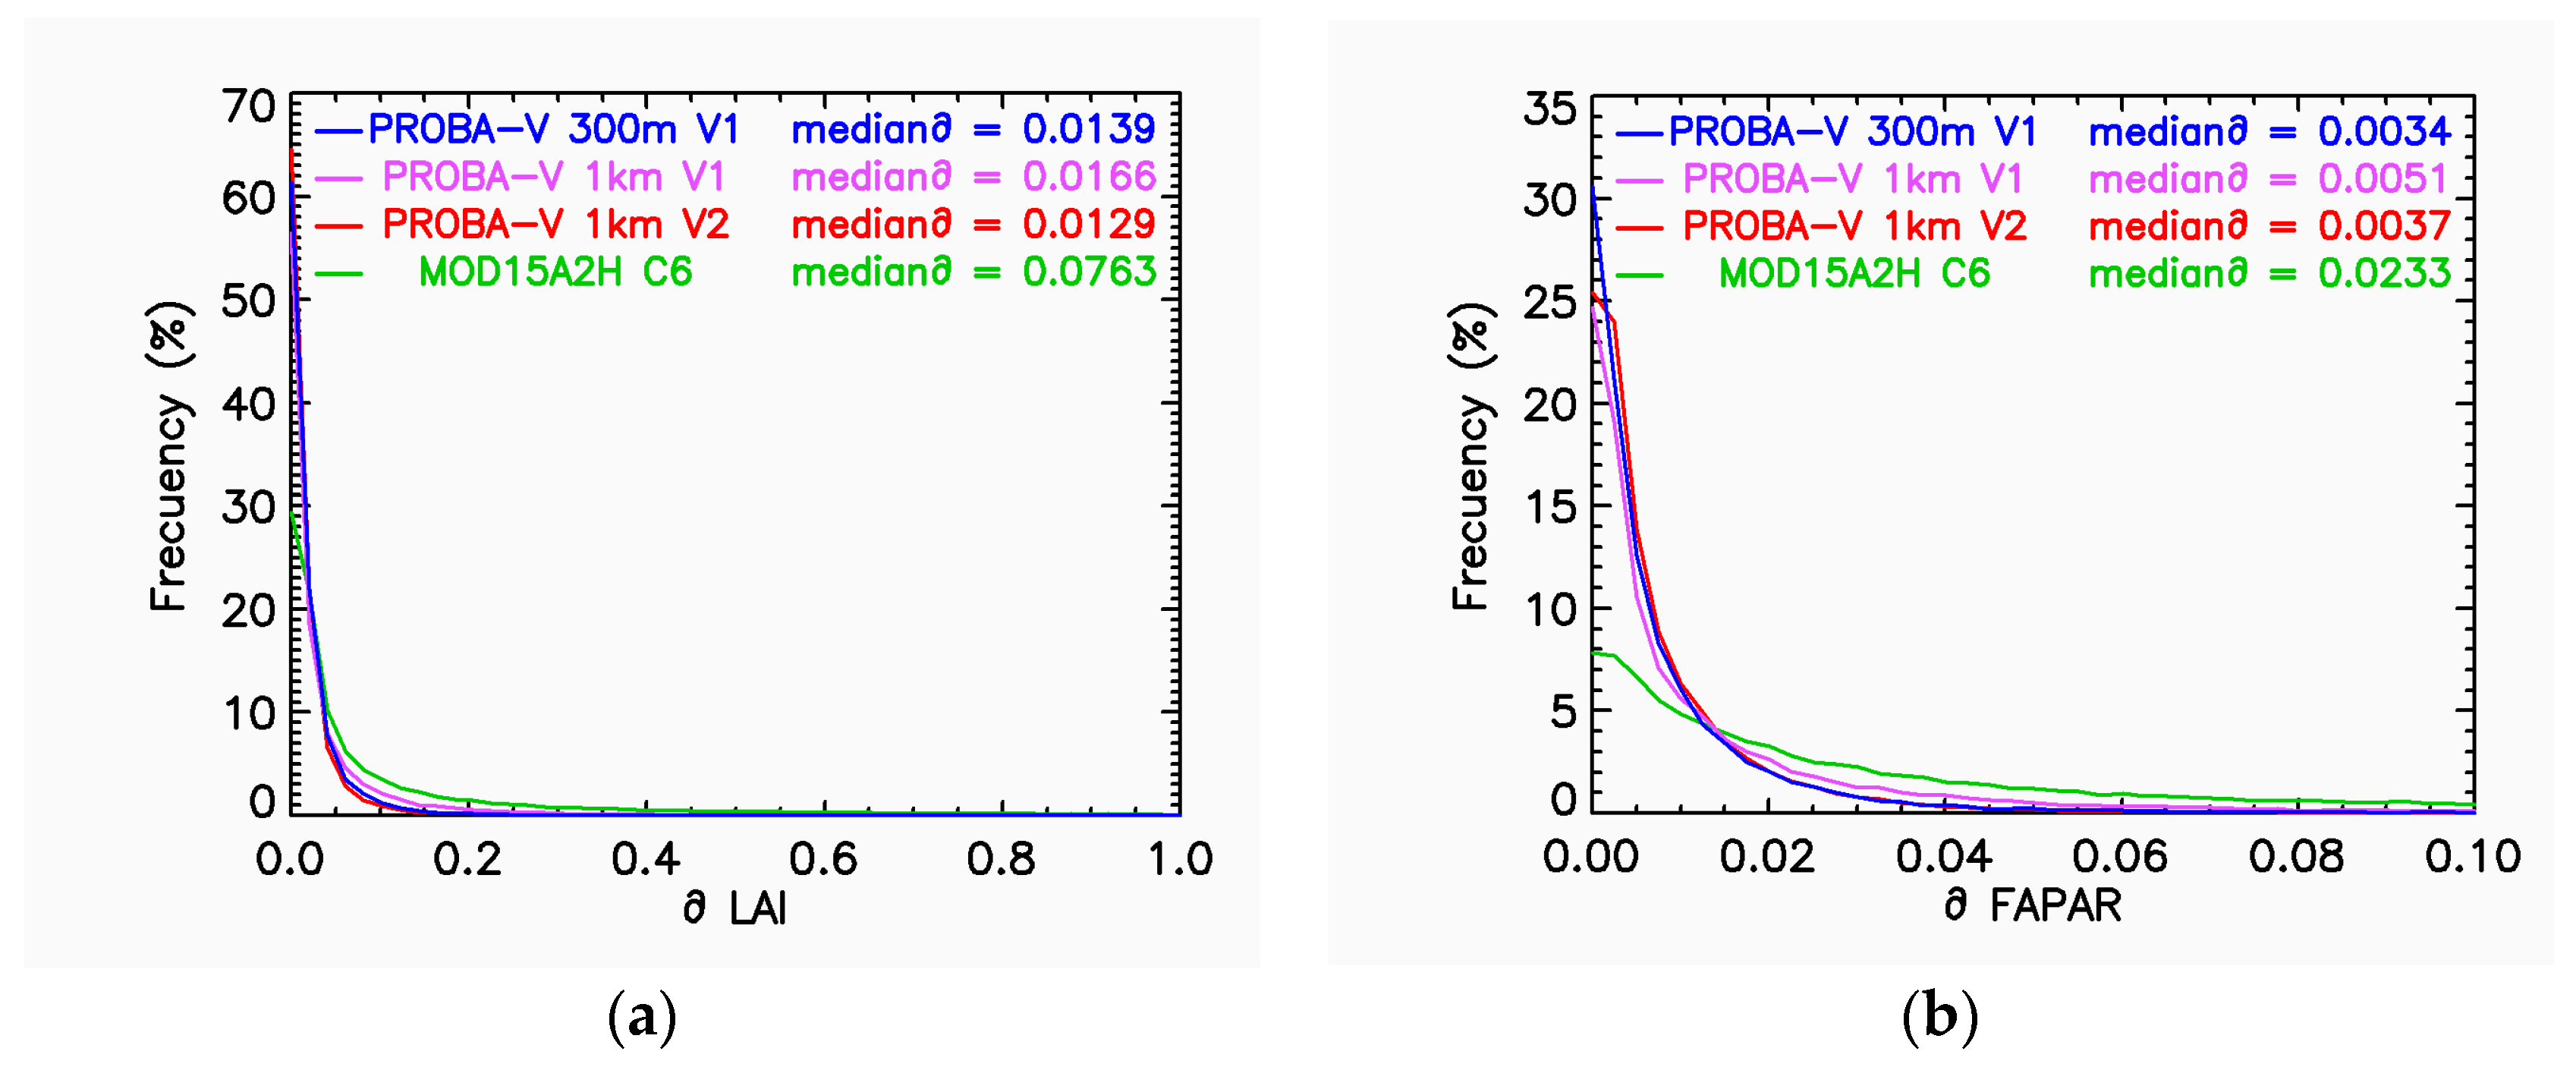
  • Assessment of the inter-annual and intra-annual precision of the product;
  • Quantify product accuracy by comparisons with available in situ measurements collected mainly during the FP7 Imagines project.
This article is structured as follows. Section 2 describes the satellite-based LAI, fAPAR and fCOVER products used in this study. Section 3 describes the ground datasets and the validation methodology. Section 4 presents the intercomparison and validation results. Section 5 discusses the results, and Section 6 presents the conclusions.

2. Satellite-Derived LAI, fAPAR and fCOVER Products

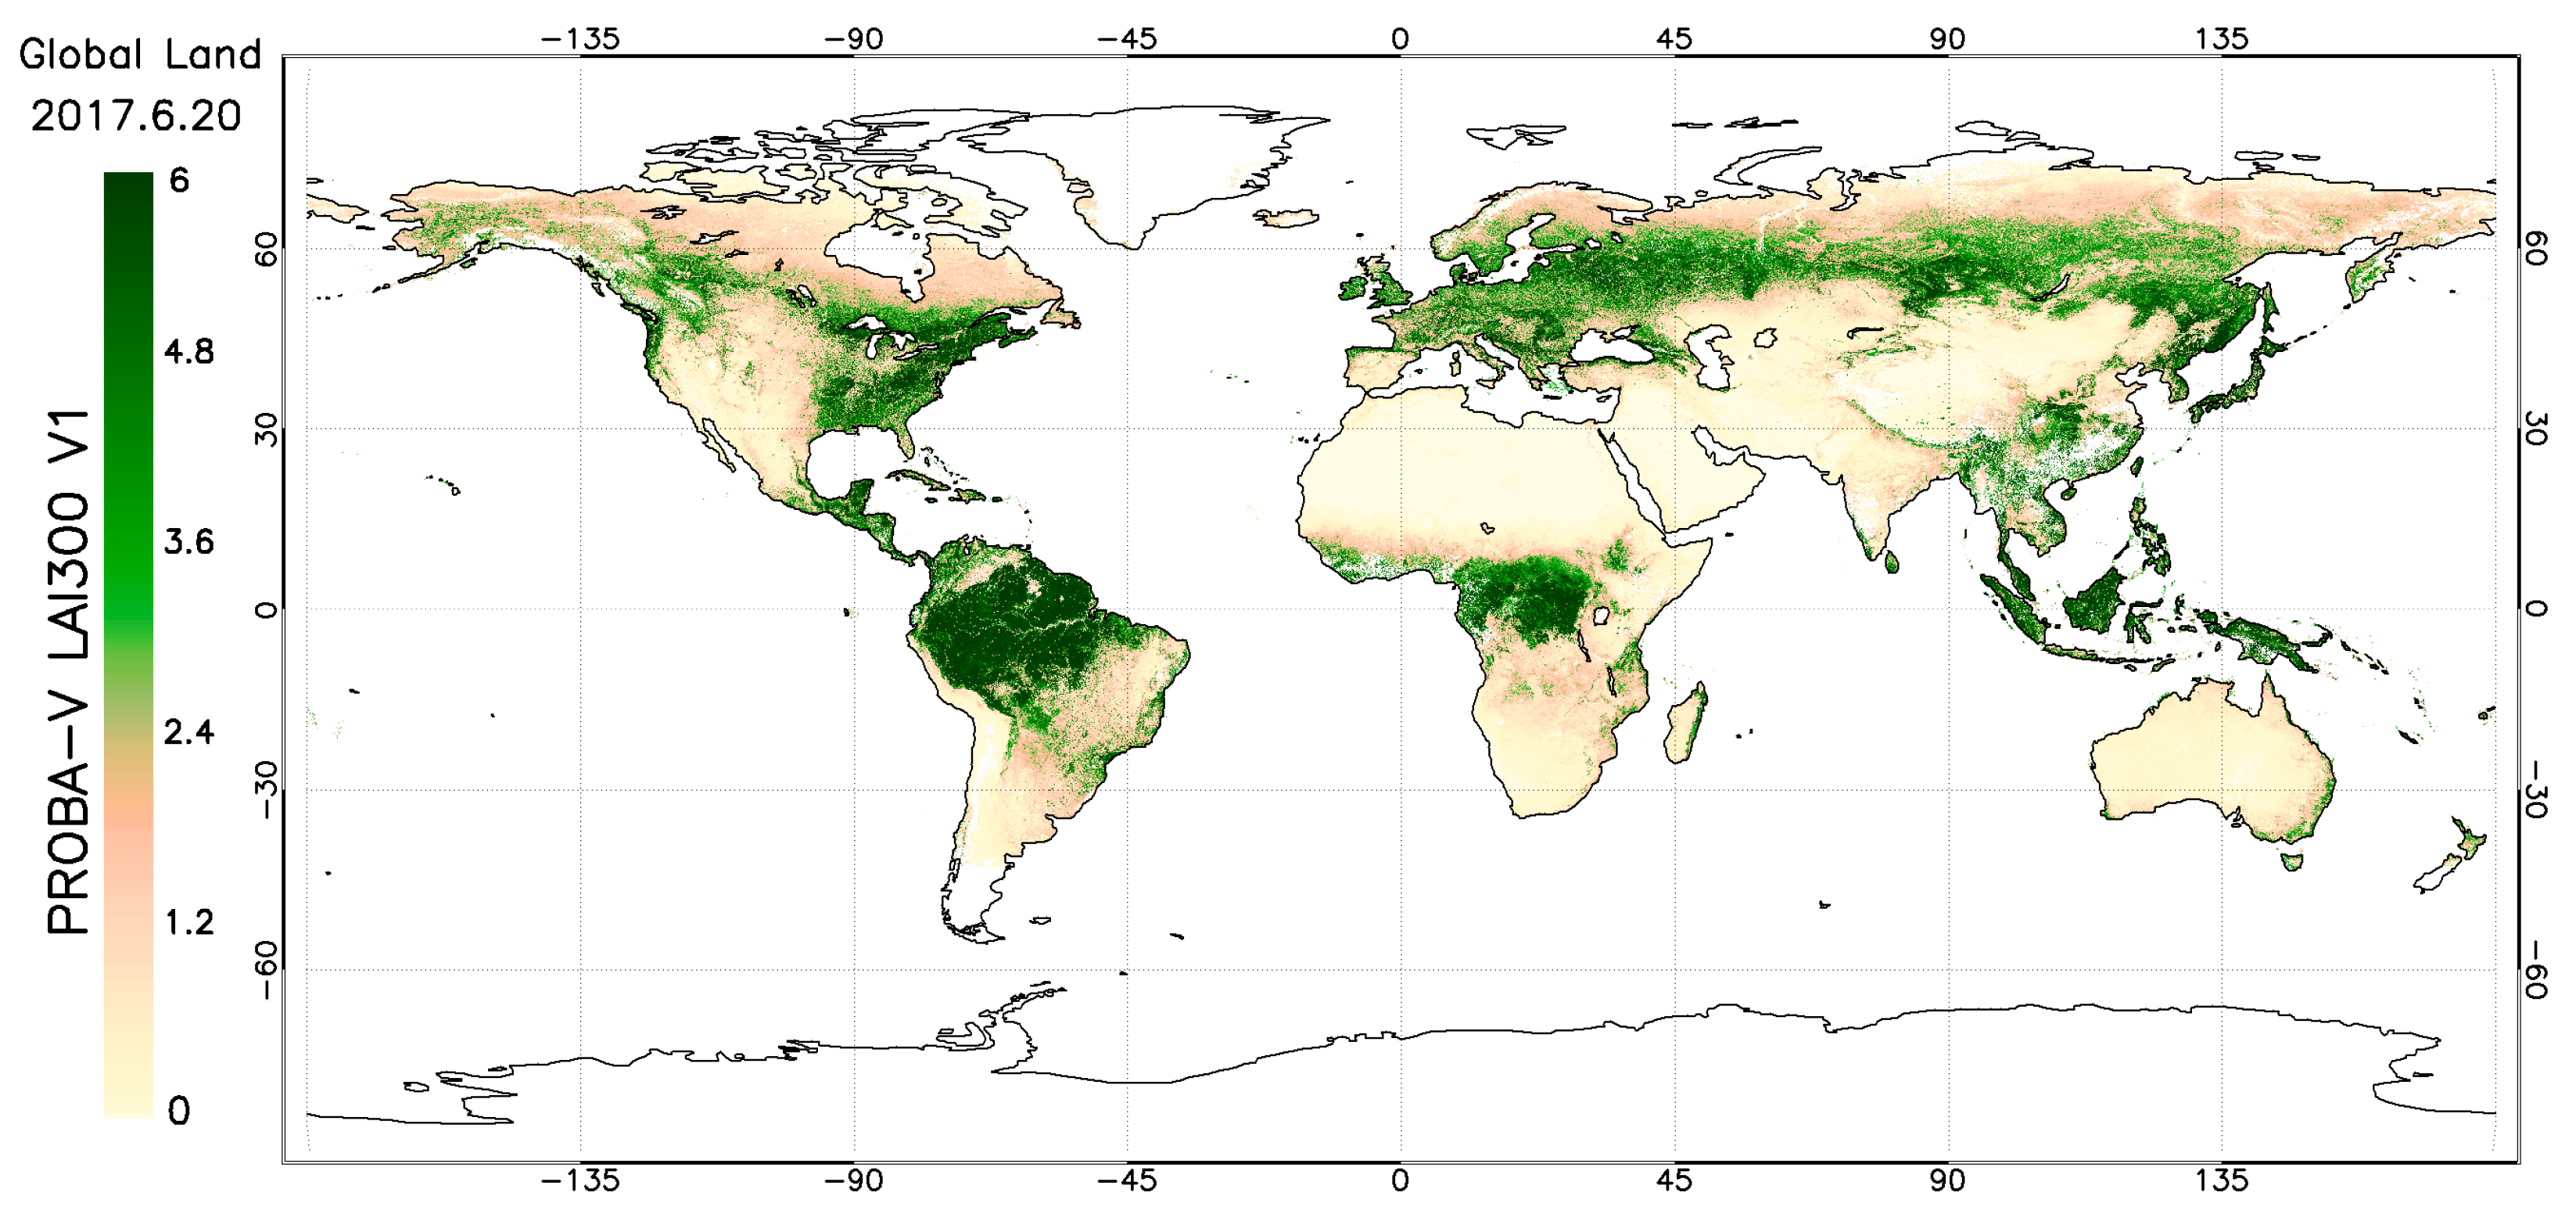
2.1. Collection 300 m V1 PROBA-V LAI, fAPAR and fCOVER Products Under Evaluation

The retrieval algorithm of the CGLS PROBA-V Collection 300 m Version 1 LAI, fAPAR and fCOVER products [8] is based on a two-step process. Daily top of the atmosphere (TOA) reflectances in the blue, red and near infrared (NIR) PROBA-V spectral bands are used in the Simplified Method for the Atmospheric Correction (SMAC) algorithm [19] to retrieve top of canopy (TOC) reflectance values, which are in turn used as inputs to the neural networks (NNTs) to retrieve daily estimates of LAI, fAPAR and fCOVER. The NNTs were calibrated using four years of VEGETATION-2 reflectance data as input. The outputs corresponded to the fusion of the MODIS C5 [20] and CYCLOPES V3.1 [21] for the LAI and fAPAR products and the scaling of the CYCLOPES V3.1 for fCOVER. Then, the final 10-day (dekadal) product values are generated using a dedicated compositing scheme over a dissymmetric temporal window characterized by a flexible size that depends on the availability of valid daily estimates [8]. The compositing includes the application of temporal filters to remove outliers as well as smoothing and gap-filling techniques. A specific process is applied to evergreen broadleaf forests that are highly affected by cloud occurrence, which induces higher noise levels (cloud misdetection) and missing data [8]. The products are delivered in near-real-time (RT0). Then, two successive consolidated estimates after one (RT1) and two (RT2) dekads are generated. A final estimate (RT5) is computed at the end of the consolidation period (i.e., 50 days). The final RT5 product is used in this study. An example of the PROBA-V LAI 300 m V1 spatial distribution is shown in Figure 1. The products are associated with quantitative quality information such as the number of valid daily values available in the compositing window, the root mean square errors of the dekadal values compared to the daily estimates and the length in days of the semiperiod of the compositing window before and after the dekad of interest. In addition, qualitative information is provided through a quality flag. The retrieval algorithm and the products are described in detail in the Algorithm Theoretical Basis Document [8] and the Product User Manual [22]. The first validation results that include all RT modes are reported in the Quality Assessment Report [23].

2.2. CGLS PROBA-V Collection 1 km

There are two versions of the CGLS Collection 1 km LAI, fAPAR and fCOVER products. Both Version 1 (V1) [24] and Version 2 (V2) [25] capitalize on existing CYCLOPES V3.1 [21] and MODIS Collection 5 (C5) products [20] and the use of NNTs calibrated with SPOT/VEGETATION reflectances in the red, NIR and SWIR bands. LAI is defined as the green area index, and it includes all the green vegetative elements and partly accounts for clumping; fAPAR is defined as the instantaneous black sky green fAPAR at 10:00–10:30; fCOVER is defined as the fraction of ground area covered by green vegetation [24].
The main differences between V2 and V1 are as follows:
  • V2 uses daily TOC reflectances and the associated cosine of the view zenith and sun zenith angles as inputs for the NNT, whereas V1 uses 10-day composite TOC reflectances;
  • V2 applies temporal compositing over daily biophysical estimates by first removing outliers (e.g., mainly cloud mis-detection) by assuming a smooth temporal profile and then applying the CACAO method [26] (e.g., adjusting the magnitude and shift of the climatology) on a temporal window spanning a period between 30 and 60 days depending on the number of available observations, whereas V1 applies compositing at the TOC reflectance level by the inversion of a kernel-driven model over a temporal window [27];
  • V2 delivers near-real-time estimates that are updated every 10 days until a consolidated value is reached after two months, whereas V1 products are delivered with a temporal delay of 20 days;
  • V2 uses dedicated temporal smoothing and gap filling based on interannual climatology information [28] to ensure consistency and continuity (no missing data) of products, whereas V1 does not apply temporal smoothing or gap filling.
The main differences between the V2 algorithm and 300 m V1 algorithm are as follows:
  • The SWIR spectral band is not used since it is not available at a resolution of 300 m;
  • No climatology is used as background information to fill gaps in the 300 m V1product, and gap filling is only applied over a local temporal window, which results in residual gaps for long periods of missing observations.
The CGLS PROBA-V Collection 1 km V1 products were validated over the year 2014 [29]. The accuracy assessment with ground measurements (25 samples) showed RMSD values of 0.54, 0.13 and 0.18 for LAI, fAPAR and fCOVER respectively and a positive bias of up to 0.15 for fCOVER.
The CGLS PROBA-V Collection 1 km V2 products were validated over the period October 2013–October 2014 [30], and the quality stability was systematically checked every year. The reports are available on the CGLS website [1]. The products displayed better spatial coverage (no gaps) and smoother profiles than V1 and MODIS C5 products. Specifically, over evergreen broadleaf forests, the CGLS 1 km V2 presented smooth trajectories with high values and very limited seasonality while the CGLS 1 km V1 showed unexpectedly low LAI, fAPAR and fCOVER values and seasonality and noise due to permanent clouds. The accuracy assessment over a limited number of concomitant ground-based measurements (<15) showed RMSD values of 0.79, 0.12 and 0.12 for LAI, fAPAR and fCOVER, respectively, with a positive significant fCOVER mean bias of 0.1.

2.3. NASA MOD15A2H Collection 6

The Terra MODIS LAI/fAPAR (MOD15A2H) Collection 6 (2000-present), available at https://lpdaac.usgs.gov/products/, is produced at a spatial resolution of 500 m and a step of eight days over a sinusoidal grid [20]. We consider only the products derived from the main algorithm since the retrievals from the back-up algorithm are generated from surface reflectances with high uncertainties [31]. The main algorithm is based on the use of Look Up Tables (LUTs) built for six different types of biomes, with simulations from a three-dimensional radiative transfer model [32]. The MODIS red and NIR atmospherically corrected reflectances and associated uncertainties [33] and the corresponding illumination-view geometries and the biome type issued from the MODIS land cover product are used as inputs of the LUTs. The output is the mean LAI/fAPAR values for which simulated and measured MODIS surface reflectances are within the expected uncertainty ranges. Note that MODIS C6 does not provide fCOVER data and that over desert areas MODIS C6 does not provide LAI/fAPAR values, which are assumed to be zero.
An accuracy assessment performed over 45 fAPAR ground measurements from the CEOS Online Interactive Validation Exercise (OLIVE) dataset showed an overestimation of the C6 fAPAR products over sparsely vegetated areas [34]. Comparisons with CGLS Collection 1 km V1 products at the global scale showed similar spatiotemporal patterns except in evergreen broadleaf forests where noisy retrievals are observed, with a positive mean bias over benchmarking sites of 0.3 (0.13) units for LAI (fAPAR) [34].

2.4. Quality Flags

The quality flag information of the PROBA-V Collection 1 km V1 and V2 products and the two quality flag layers of MODIS C6 (FparLai provides information on retrieval status and FparExtra on clouds, water and land) were used to retain only the best-quality values (Table 1). Low-quality pixels and filled values for PROBA-V Collection 1 km V2 were not considered except in temporal profiles and global maps of residuals. All PROBA-V Collection 300 m V1 pixels were used since the retrieval algorithm keeps only the best PROBA-V quality pixels, i.e., pixels that presented good radiometric quality and were located over land and not covered by ice, cloud or snow [8].

3. Quality Assessment Methods and Ground Datasets

This section first describes the ground datasets (Section 3.1) used as validation references and then presents the quality assessment and validation methodology (Section 3.2). Appendix A describes the LANDVAL network of sites selected for benchmarking with reference satellite-derived vegetation products.

3.1. Ground Measurements

Ground measurements were mostly collected during the FP7 ImagineS project [7] over a network of sites, including a large variety of crop types and phenological stages, during the period 2013–2016 [16]. Approximately 90% of the sites belonged to crop areas (see Table 2), and the representativeness of other biome types was very limited in this dataset. Field data were collected according to well-defined protocols [17] that are consistent with the VALERI sampling strategy for upscaling. Between 13 and 15 Digital Hemispherical Photographs (DHPs) were taken in most of the sites to characterize the Elementary Sampling Unit (ESU) of approximately20 m × 20 m size and between 30 and 50 ESUs were measured following a stratified sampling per crop type to characterize the site of approximately 3 km × 3 km. In some sites, a LI-COR LAI-2200 Plant Canopy Analyzer (PCA) and an AccuPar LP-80 ceptometer were used following a similar sampling strategy [16]. The DHP measurements were processed with the CAN-EYE version 6.4.92 (CEV6.49) software [35] to retrieve the LAI, fAPAR and fCOVER. LAI was computed as the average value of two CAN-EYE (CV5.1 & CV6.1) solutions [36], and the clumping index was considered. The clumping index was computed using the [37] logarithm gap fraction averaging method, although some uncertainties are associated with this method [38]. The effective LAI (LAIeff) (i.e., assuming random distribution of elements in the canopy) was computed as the average value of the CEV5.1, CEV6.1 and Miller [39] methods; and the instantaneous black sky fAPAR was computed at 10:00 local solar time. It should be noted that all measurements were conducted from green-up to maturity of the plants with a negligible amount of nonphotosynthetically active material (i.e., retrieved variables correspond to green elements of the plants) and that using indirect methods no distinction is made between leaves and other plant elements (stems, bulbs, spikes). Consequently, for the LAI, the ground data definition corresponds better to a green area index (GAI). Note that when using the LAI-2200 PCA or AccuPAR LP-80, the clumping index is not computed; thus, the retrieved value corresponds better to an effective green area index. To maintain consistency with the satellite products, we retained the term LAI instead of GAI in the ground dataset. Ground-based maps were produced using CEOS LPV guidelines [9] and following the approach described in [15], and an iterative reweighted least squares (IRLS) regression algorithm was used to derive the transfer function between the ground data and the high-resolution Operational Land Imager (OLI)/Landsat-8 data [16]. The transfer function was applied to an area of 3 km x 3 km around the site. A quality flag was generated based on the convex hull technique described in [15] to identify the level of confidence in the transfer function estimate depending on whether the pixel falls within the convex hull (i.e., the transfer function behaves as an interpolator and has good confidence) or outside this domain (i.e., the transfer function behaves as an extrapolator and has lower confidence). The quality flag is used for the comparison with satellite products as described in Section 2.4. A total of 35 ground-based maps coincident with PROBA-V products are used in this study (sites #1–14, #17–31 and #36–41 in Table 2).
Six additional ground-based maps were generated by EOLAB during the 2016-2017 period (samples #15, #16 and #32–#35 in Table 2). The dataset was collected with DHP and processed following the same procedures used in ImagineS [17]; however, the recently available Sentinel-2A/MSI imagery was used for upscaling instead of Landsat-8/OLI.
Values averaged over 3 km x 3 km around the site centre (Table 2) were included in the OLIVE DIRECT 2.0 ground database, which is available at the European Space Agency (ESA) cal/val portal and endorsed by the CEOS WGCV LPV [40].

3.2. Validation Methods

The quality assessment procedure was defined so that it was consistent with CEOS WGCV LPV good practices for global LAI product validation [9] and previous validation and intercomparison of vegetation satellite product research work [10,11,12]. Several performance criteria were assessed in this study, including (i) the product consistency with similar products in its temporal and spatial dimensions (Section 3.2.1), (ii) the inter-annual and intra-annual precision of the product (Section 3.2.2), and (iii) the accuracy of the product assessed by comparison with match-ups of upscaled ground-based measurements (Section 3.2.3). The assessment was performed for a two-year period (2016–2017) except for the accuracy assessment with ground measurements (2014–2017) to provide a more representative dataset.
Satellite products must be compared over a similar spatial support area and temporal support period. In this study, a 10-day temporal support (using the closest date of each product) and a 3 km × 3 km spatial support (i.e.,9 × 9 pixels in the case of Collection 300 m V1 products, 6 × 6 pixels in the case of MODIS C6, and 3 × 3 pixels in the case of Collection 1 km products) were used, except for the temporal profiles, where each product is displayed with its nominal temporal and spatial resolutions. For the spatial support, the Plate Carrée projection over 1/112º corresponding to the CGLS products was used as a common grid. Reference products were resampled to the CGLS grid considering only the best-quality pixels (Table 1). The LANDVAL network of 725 sites was used for sampling global conditions.

3.2.1. Consistency Assessment with Similar Satellite Products

Spatial consistency refers to the realism of the spatial distribution of values over the globe. The consistency of the spatial distribution of retrievals with respect to similar satellite products was assessed by calculating the residuals between the Collection 300 m V1 products and the reference satellite products. The residual (ε) was estimated by assuming a linear relationship between two products (y = a·x + b + ε) and it represents the remaining discrepancies regarding the general relationship between both products. In this way, systematic relationships were not considered so that the patterns associated with the spatial distribution of the retrievals could be more clearly depicted. Note that deviations of the regression equation (i.e., residuals) are only used for the product spatial consistency assessment (Section 4.1.1).
Temporal consistency refers to the realism of seasonal and inter-annual variations, and it was qualitatively investigated via comparisons with the reference satellite products. Temporal profiles over the LANDVAL network of sites were analysed per biome type for the period January 2016-December 2017. Temporal consistency was quantitatively assessed with the inter-annual and intra-annual precision metrics (Section 4.1.2).
Finally, the overall spatiotemporal consistency between the Collection 300 m V1 and reference products was assessed over the LANDVAL network of sites considering the best-quality observations (Table 1) for the two-year period. Scatterplots between pairs of products were produced, and the associated validation metrics (Table 3) were quantified (Section 4.1.3).

3.2.2. Precision Assessment

In the absence of linear trends, upper and lower percentile anomalies for a biophysical variable are indicators of inter-annual precision, i.e., the dispersion of variable values from year to year [9]. A good practice is to report a boxplot of the median absolute deviation versus product bins and a single statistic corresponding to the median [9]. In this study, we assessed the absolute difference between two consecutive years of the 5th and 95th percentiles of the annual vegetation cycle over the LANDVAL network of sites. Cultivated sites were not considered in this analysis due to the non-natural variability of this land cover type induced by agricultural practices (e.g., crop rotation).
Intra-annual precision corresponds to temporal noise assumed to have no serial correlation within a season. In this case, the anomaly of a variable value predicted by linear interpolation of its neighbours in time can be used as an indication of intra-annual precision [9]. It can be characterized as suggested by [13] (Equation (1)) by computing the absolute value of the difference between the centre P(dn+1) and the corresponding linear interpolation between the two extremes P(dn) and P(dn+2) for each triplet of consecutive observations:
δ = | P ( d n + 1 ) P ( d n ) P ( d n ) P ( d n + 2 ) d n d n + 2 ( d n d n + 1 ) |
The histogram of δ   values (Equation (1)) for the Collection 300 m V1 and reference products over LANDVAL were compared, and the median was used as a quantitative indicator of the inter-annual precision [9]. Hence, the lower the median of δ values, the higher the inter-annual precision.

3.2.3. Accuracy Assessment with Ground Measurements

Product accuracy was assessed against ground reference data that were upscaled using high-resolution imagery. The closest product date to the field campaign was used. Available ground-based maps were provided over an area of 3 km × 3 km and remapped to the native PROBA-V resolution of 300 m for matching up with the satellite products. The aggregation was performed considering the effective point spread function (PSF) of the satellite product to account for several factors, including the PSF of the instrument, the geolocation uncertainty, the effect of the reprojection (from raw images to UMT) and atmospheric scattering [59]. This method improves the performance of the evaluation compared to the ordinary average [60], which is partly explained by the compensation of geolocation or reprojection errors. The PSF of the PROBA-V instrument can be approximated by the convolution of a Gaussian function characterizing the optical PSF [61]. The effective PSF was computed by maximizing the correlation coefficient between the 300 m V1 PROBA-V product and the corresponding high-resolution map [59,60,61]. During the PSF optimization process, an iterative approach in which we combined both the extension of the pixel size and the Full Width at Half Maximum (FWHM) of the Gaussian functions in the x and y directions was developed according to the scheme shown by Mira et al. [60]. The extension of the pixel was varied by steps of 1/8 up to 1/2 of the PROBA-V pixel size, whereas the FWHM was varied in steps of 1/20 up to 1/2 of the pixel size plus the enlargements.
Ground-based maps were provided with a quality flag indicating the pixels that belong to the convex hull computed from the set of pixels used to calibrate the up-scaling transfer function [15]. For the accuracy assessment we considered only the Collection 300 m V1 PROBA-V pixels for which more than 70% (threshold more restrictive than in previous studies [11,12]) of the corresponding high-resolution pixels were within the convex hull. The accuracy with respect to ground measurements was then assessed using the metrics defined in Table 3. Overall uncertainty (i.e., root mean square deviation, RMSD) includes systematic measurement error (i.e., bias) and random measurement error (i.e., standard deviation of bias). RMSD is recommended to report the accuracy of LAI products when there is only one product estimate to each ground mapping unit [9]. Major Axis Regression (MAR) was used because it is specifically formulated to handle errors in both the x and y products [62]. In addition, the accuracy assessment with ground data was conducted at 3 km × 3 km using the same number of samples; if there was a missing value in one dataset, then this observation was removed from the other datasets in order to have a consistent database for intercomparisons of results.
Finally, the percentage of pixels meeting the CGLS requirements was assessed (Table 4). Because of the lack of an uncertainty requirement for LAI products, we have considered the actual Global Climate Observing System (GCOS) uncertainty requirement of 15% as the optimal level and the former GCOS requirement of Max (0.5, 20%) [63] as the target level. For the threshold level, a value of Max (0.75, 25%) was considered following the same incremental step in the relative terms. For fAPAR and fCOVER, an additional minimum uncertainty value of 0.05 or 0.1 was considered for the target and threshold level to avoid the large relative values that can be obtained for very low vegetation values. Note that the GCOS requirement for fAPAR corresponds to the target level.

4. Quality Assessment Results

4.1. Consistency with Similar Products

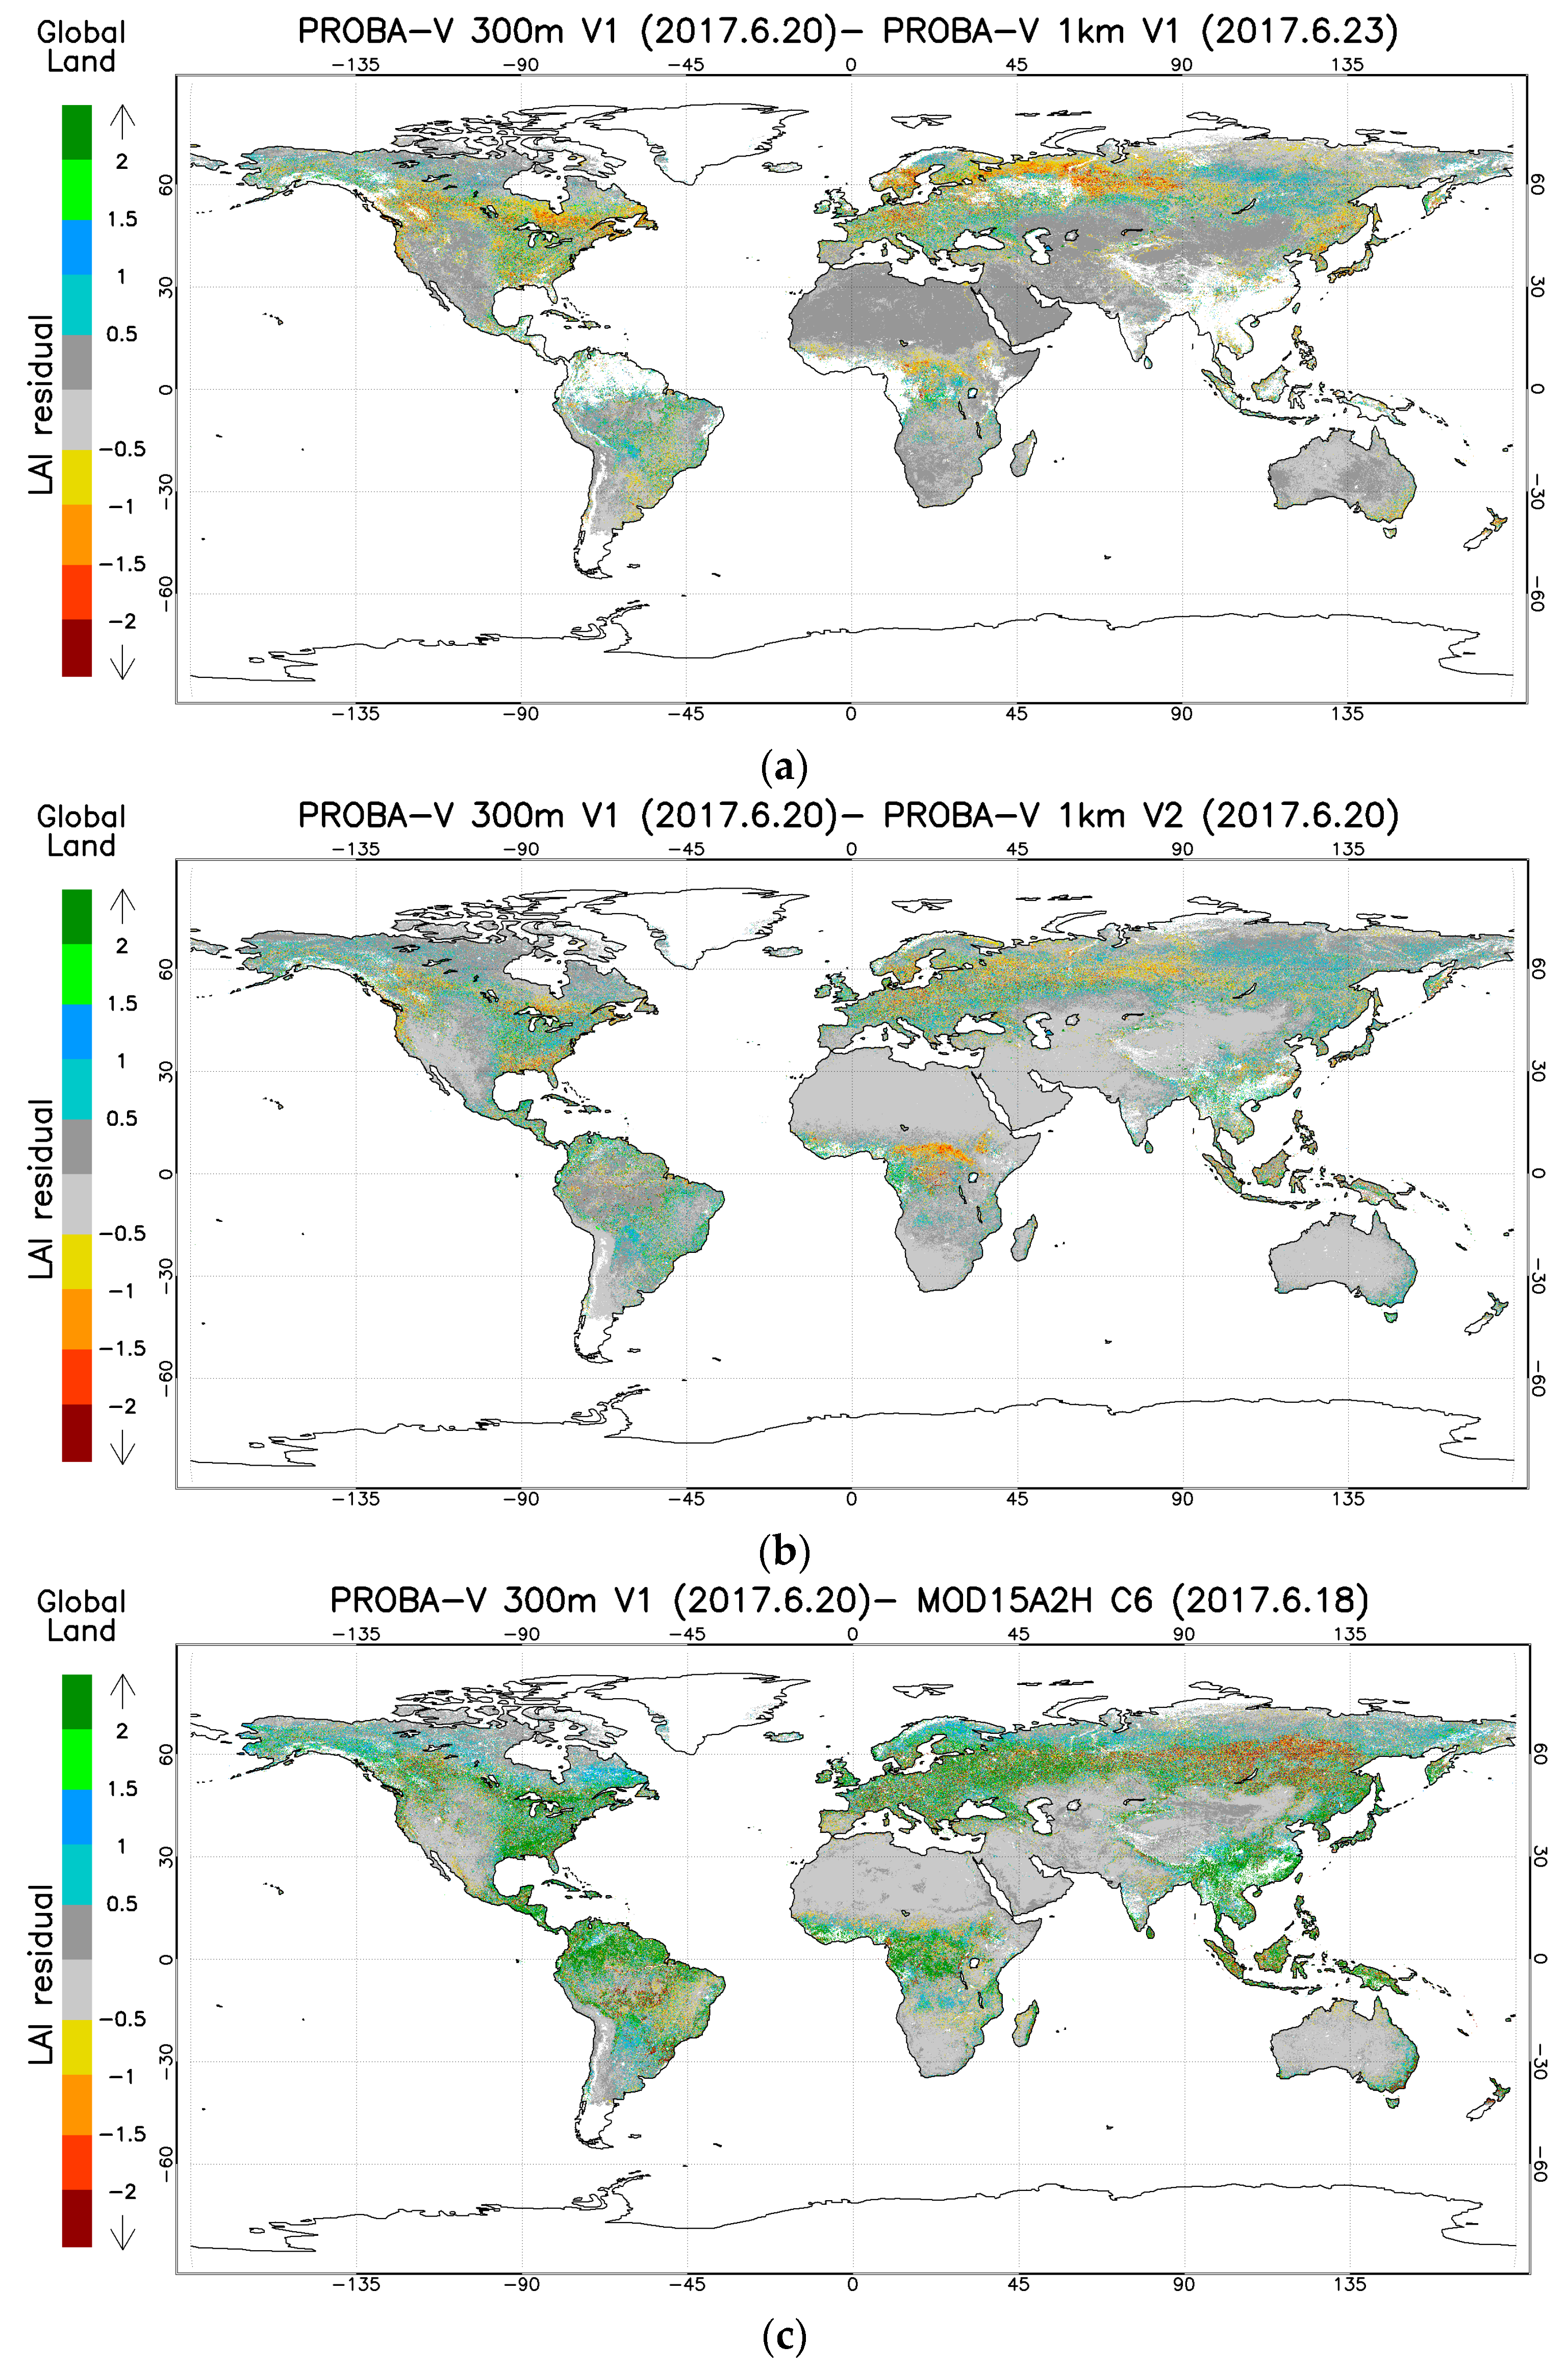
4.1.1. Spatial Consistency

The spatial distribution of residuals between the PROBA-V Collection 300 m V1 and reference LAI products is investigated (Figure 2). Note that white areas correspond to missing data or water. The LAI collection 300 m V1 shows residuals within ±1 LAI units in most of the land vegetated regions and within ±0.5 LAI units for sparsely vegetated or arid regions when compared to the PROBA-V Collection 1 km (both V1 and V2). Some regions over northern latitudes and Central Africa exhibit larger negative residuals, typically between −1 and −2 LAI units. Similar spatial consistency between PROBA-V collections is found for the fAPAR and fCOVER, which can be seen in the Supplementary Materials (Figure S1, Figure S2).
The analysis of residuals between PROBA-V 300 m V1 and MODIS C6 LAI products (Figure 2) reveals larger discrepancies over most of the vegetated areas, with good consistency for sparsely vegetated or semiarid regions whilst for desert areas MODIS does not retrieve a value (we assumed LAI and fAPAR equal to zero). Positive residuals of approximately two LAI units are found in tropical forest, in the east part of North America and in large areas of Europe and Asia. Conversely, negative residuals of around −2 LAI units are found in large areas of Siberia. The spatial consistency between PROBA-V 300 m V1 and MODIS C6 is worse for fAPAR, and both positive and negative residuals are found around the world, including sparsely vegetated areas (Figure S1).

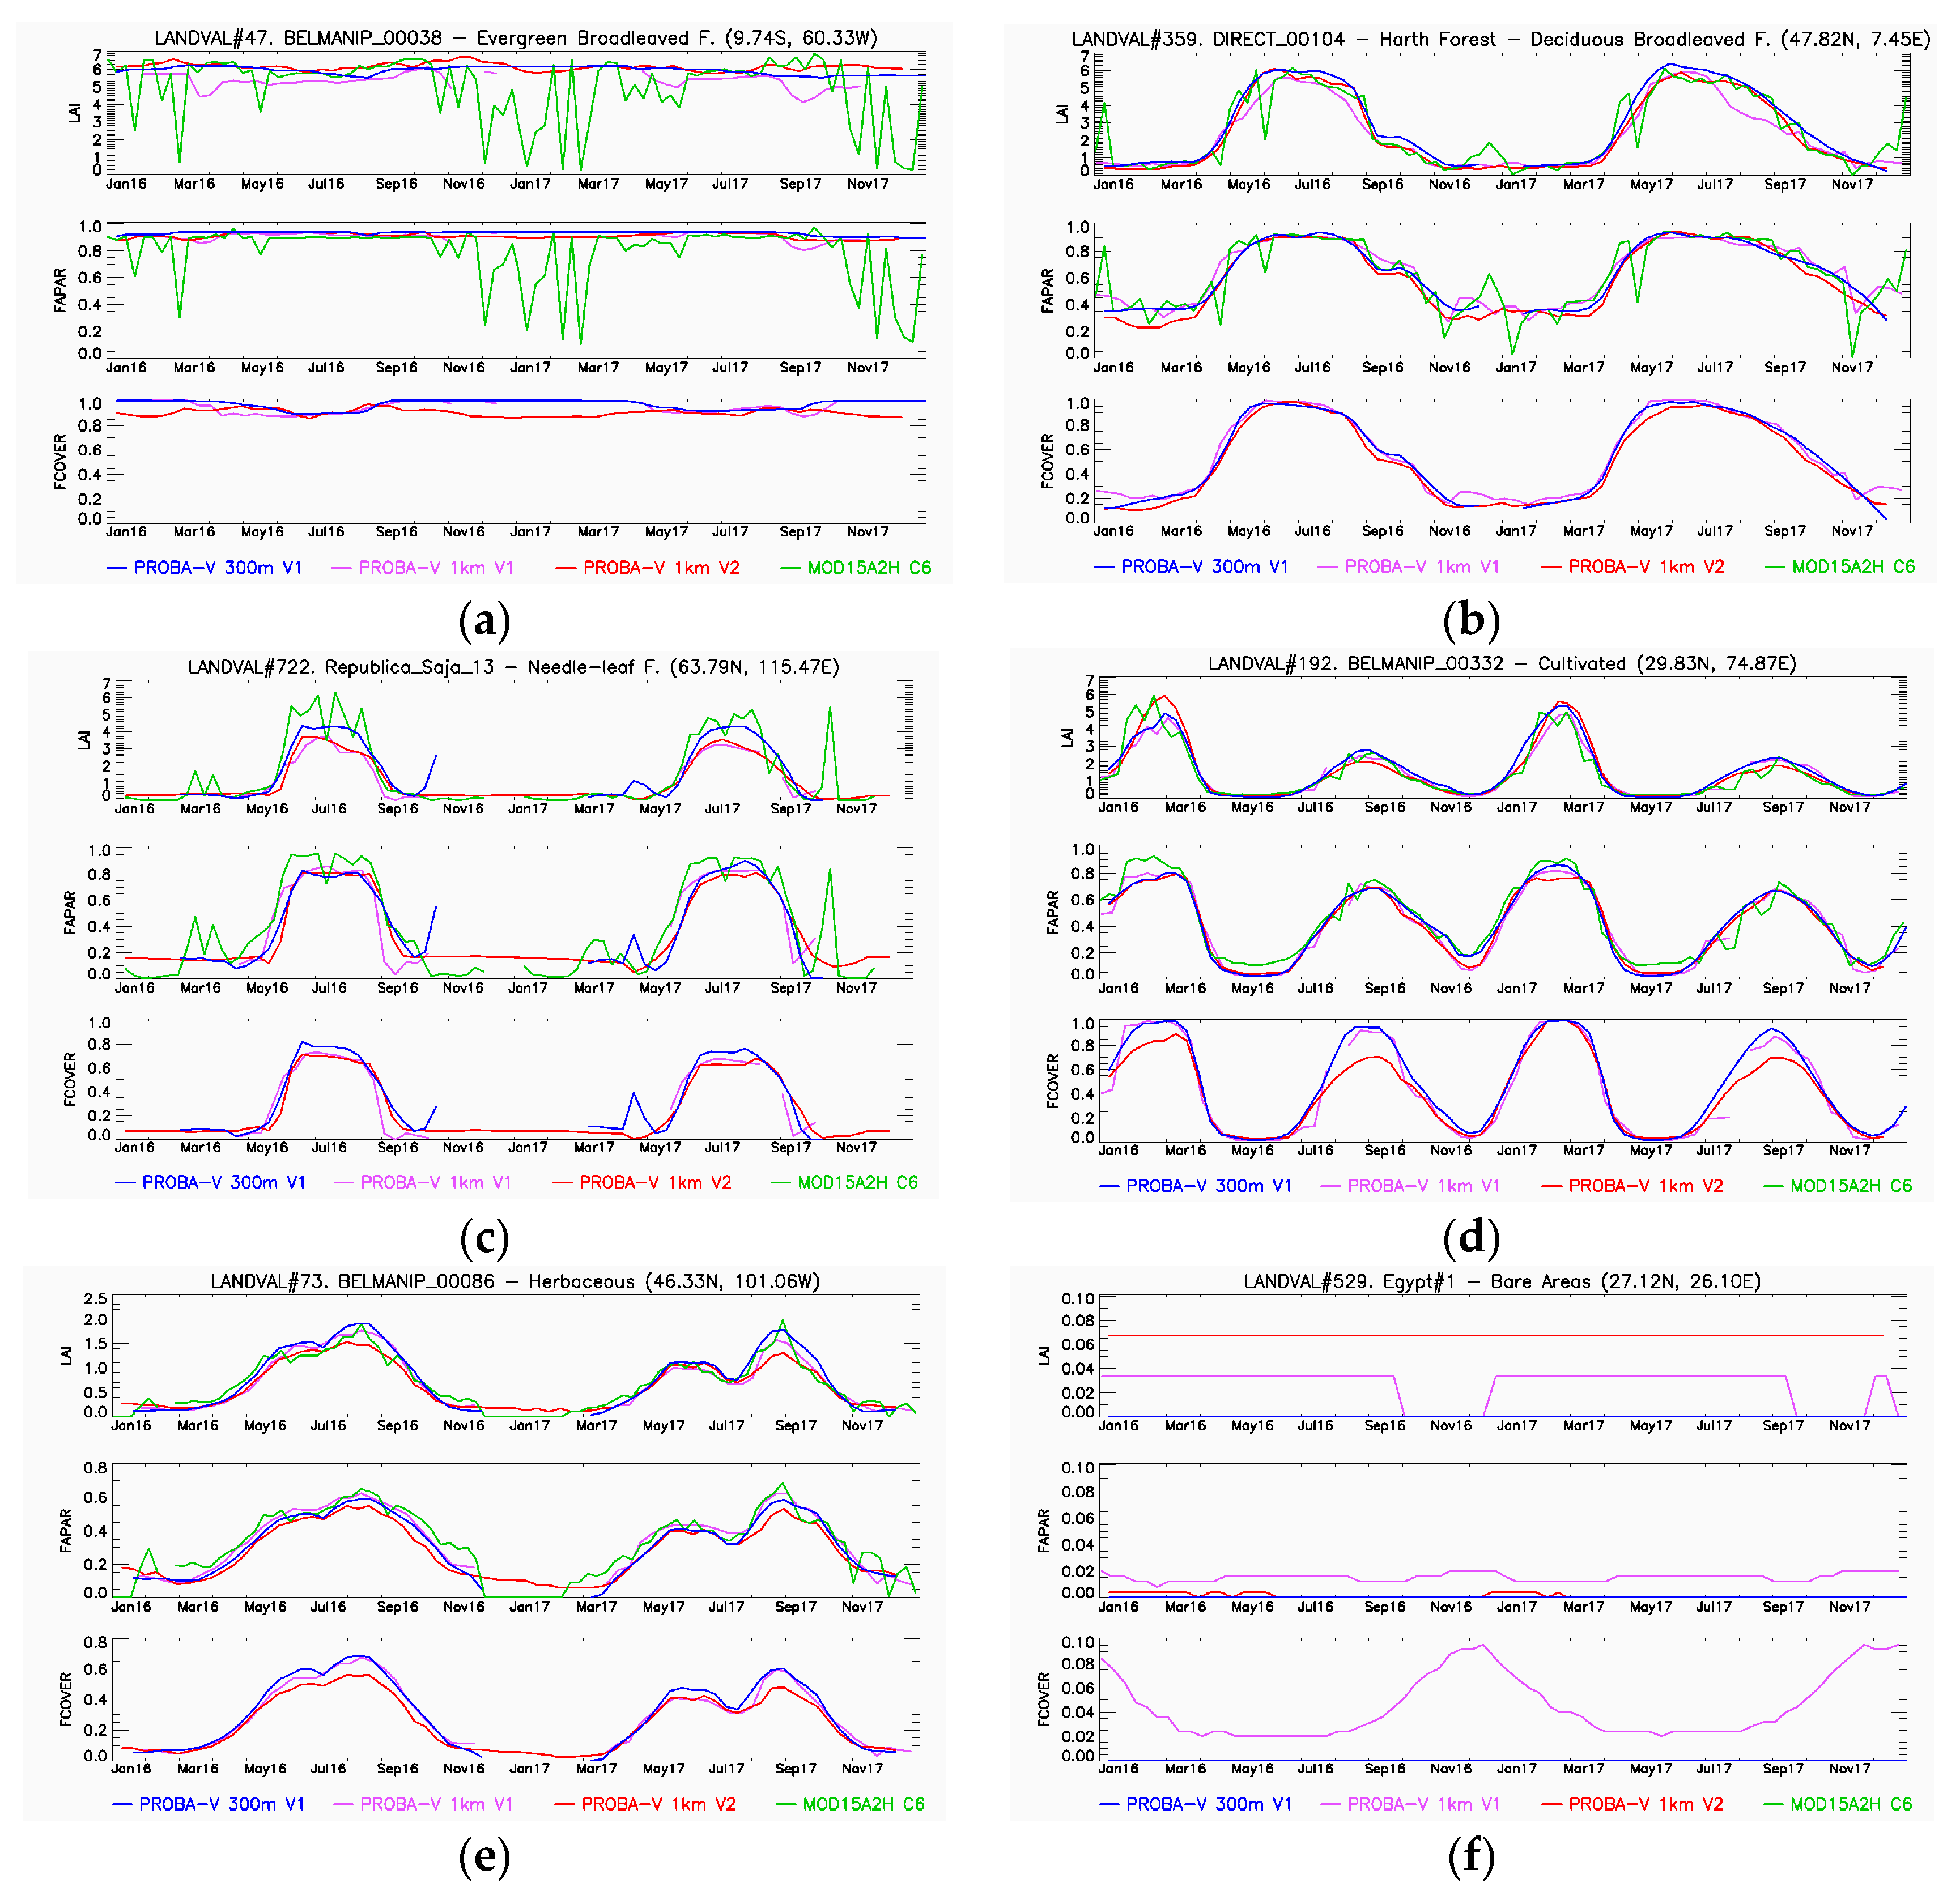
4.1.2. Temporal Consistency

Figure 3 shows some examples of Collection 300 m V1 temporal profiles for several sites corresponding to different biomes. Note that all LANDVAL temporal profiles can be found in the digital annex of the validation report [23]. Overall, good consistency in the temporal variations is observed between Collection 300 m V1 and the reference products, with consistent seasonal and inter-annual variations. The temporal consistency between the three PROBA-V products is noticeable, although some differences are observed in the magnitude of retrievals. MODIS C6 also shows overall similar seasonal and inter-annual variations but displays noisier temporal profiles. For evergreen broadleaf forest sites, the Collection 300 m V1 temporal trajectories are smooth with low seasonality, which is similar to that of the Collection 1 km V2 products as a result of the temporal compositing and smoothing techniques applied over this biome; conversely, MODIS C6 is significantly affected by cloud occurrence and displays noisy profiles for this biome type. For the needle-leaf forest sites located in the Siberia region, we observed dropouts during the peak of the season for MODIS C6, which explains the large differences found with respect to PROBA-V 300 m V1 in this area (Figure 2). For fCOVER, Collection 300 m V1 in bare areas shows no seasonality as expected; hence, the false seasonality observed in PROBA-V Collection 1 km V1 is corrected.

4.1.3. Overall Spatiotemporal Consistency Between Products

For LAI, the product scatterplots show high consistency between the Collection 300 m V1 and reference products (Figure 4), with correlations of 0.98 for Collection 1 km V1 and V2 products and 0.94 for MODIS C6 (Table 5). The comparison of Collection 300 m V1 LAI product with MODIS C6 shows a linear fit close to the 1:1 line (slope 1.00 and intercept 0.01) but with large scattering and overall discrepancies (RMSD) of 0.53 LAI units (Table 5). The large scattering corresponds to spatial and temporal differences observed over some regions and time periods as observed previously (Figure 2 and Figure 3). The comparison with V1 and V2 shows a slight positive and negative mean bias (slope) of 0.04 (1.08) and −0.03 (0.97), respectively, with overall discrepancies (RMSD) of 0.36 and 0.31, respectively. The analysis per biome shows that systematic differences between Collection 300 m V1 and Collection 1 km are mainly affecting evergreen broadleaf forest sites (Figures S3 and S6).
For fAPAR, correlations higher than 0.95 are found between Collection 300 m V1 and reference products, with linear fits close to the 1:1 line. The Collection 300 m V1 fAPAR product shows a small negative mean bias (slope of the fit) of −0.02 (0.96) compared with Collection 1 km V1 (Table 6), with an overall discrepancy (RMSD) of approximately 0.06. The analysis per biome type shows that the largest negative differences (bias of −0.076) are affecting the needle-leaf forest sites (Figure S4). The overall consistency with MODIS C6 is lower (RMSD = 0.08); MODIS C6 tends to provide higher values for low fAPAR ranges, which is mainly observed for nonforest sites (Figure S10), but overall it displays a negative bias (−0.03), which can be mainly observed in the needle-leaf and broadleaf deciduous forest sites (Figure S10).
Finally, for the fCOVER results, the scatterplots show good linear consistency (Figure 4), with correlations of 0.99 and overall discrepancies (RMSD) of 0.05 between PROBA-V Collection 300 m V1 and both PROBA-V Collection 1 km V1 and V2 products (Table 7). Almost no mean bias is found in the comparison with Collection 1 km V1, although Collection 300 m V1 tends to provide higher values than Collection 1 km V2 (bias = 0.012, slope = 1.07). The analysis per biome reveals that bias mainly occurs for the cultivated and herbaceous sites with medium and high vegetation values (Figure S8).

4.2. Product Precision

4.2.1. Inter-Annual Precision

Figure 5 shows the boxplots of the inter-annual absolute difference between two consecutive years for Collection 300 m V1 products. For LAI, larger absolute differences are found in the range of 4–5 LAI units, with differences of approximately 0.4 and typically below 0.3 for the other ranges. The median value for all the samples is 0.070 (4.4%), which is lower than that of Collection 1 km V1 and MODIS C6 (Table 8). The Collection 1 km V2 LAI product shows the lowest median absolute difference (approximately 3%). The fAPAR Collection 300 m V1 product shows median absolute differences lower than 0.05 for all levels of fAPAR values, and the median absolute difference of 0.018 (5.1%) is slightly higher than that for the Collection 1 km product but lower than that for the MODIS C6 product. The Collection 300 m V1 fCOVER products show similar precision as the LAI and fAPAR, and the results are similar to that of Collection 1 km V1 fCOVER.

4.2.2. Intra-Annual Precision

Figure 6 shows the histograms of the δ values (Equation (1)) for LAI and fAPAR products under study. The PROBA-V Collection 300 m V1 products show very similar histograms to the Collection 1 km V2 products since both are smoothed products, which also explains the lower median δ values obtained. The MODIS C6 histograms show higher frequencies for large delta values indicating noisier temporal evolution and lower intra-annual precision. For Collection 300 m V1, the median value used as an indicator of precision over short time scales shows values of 0.014 for LAI and 0.003 for fAPAR and fCOVER (not shown here for the sake of brevity), indicating high precision, and the result is slightly better than that of the Collection 1 km V1 products (0.017 for LAI and 0.005 for fAPAR and fCOVER). The MODIS C6 products show median δ values higher than Collection 300 m V1, indicating lower intra-annual precision as observed in the temporal profiles (Figure 3).

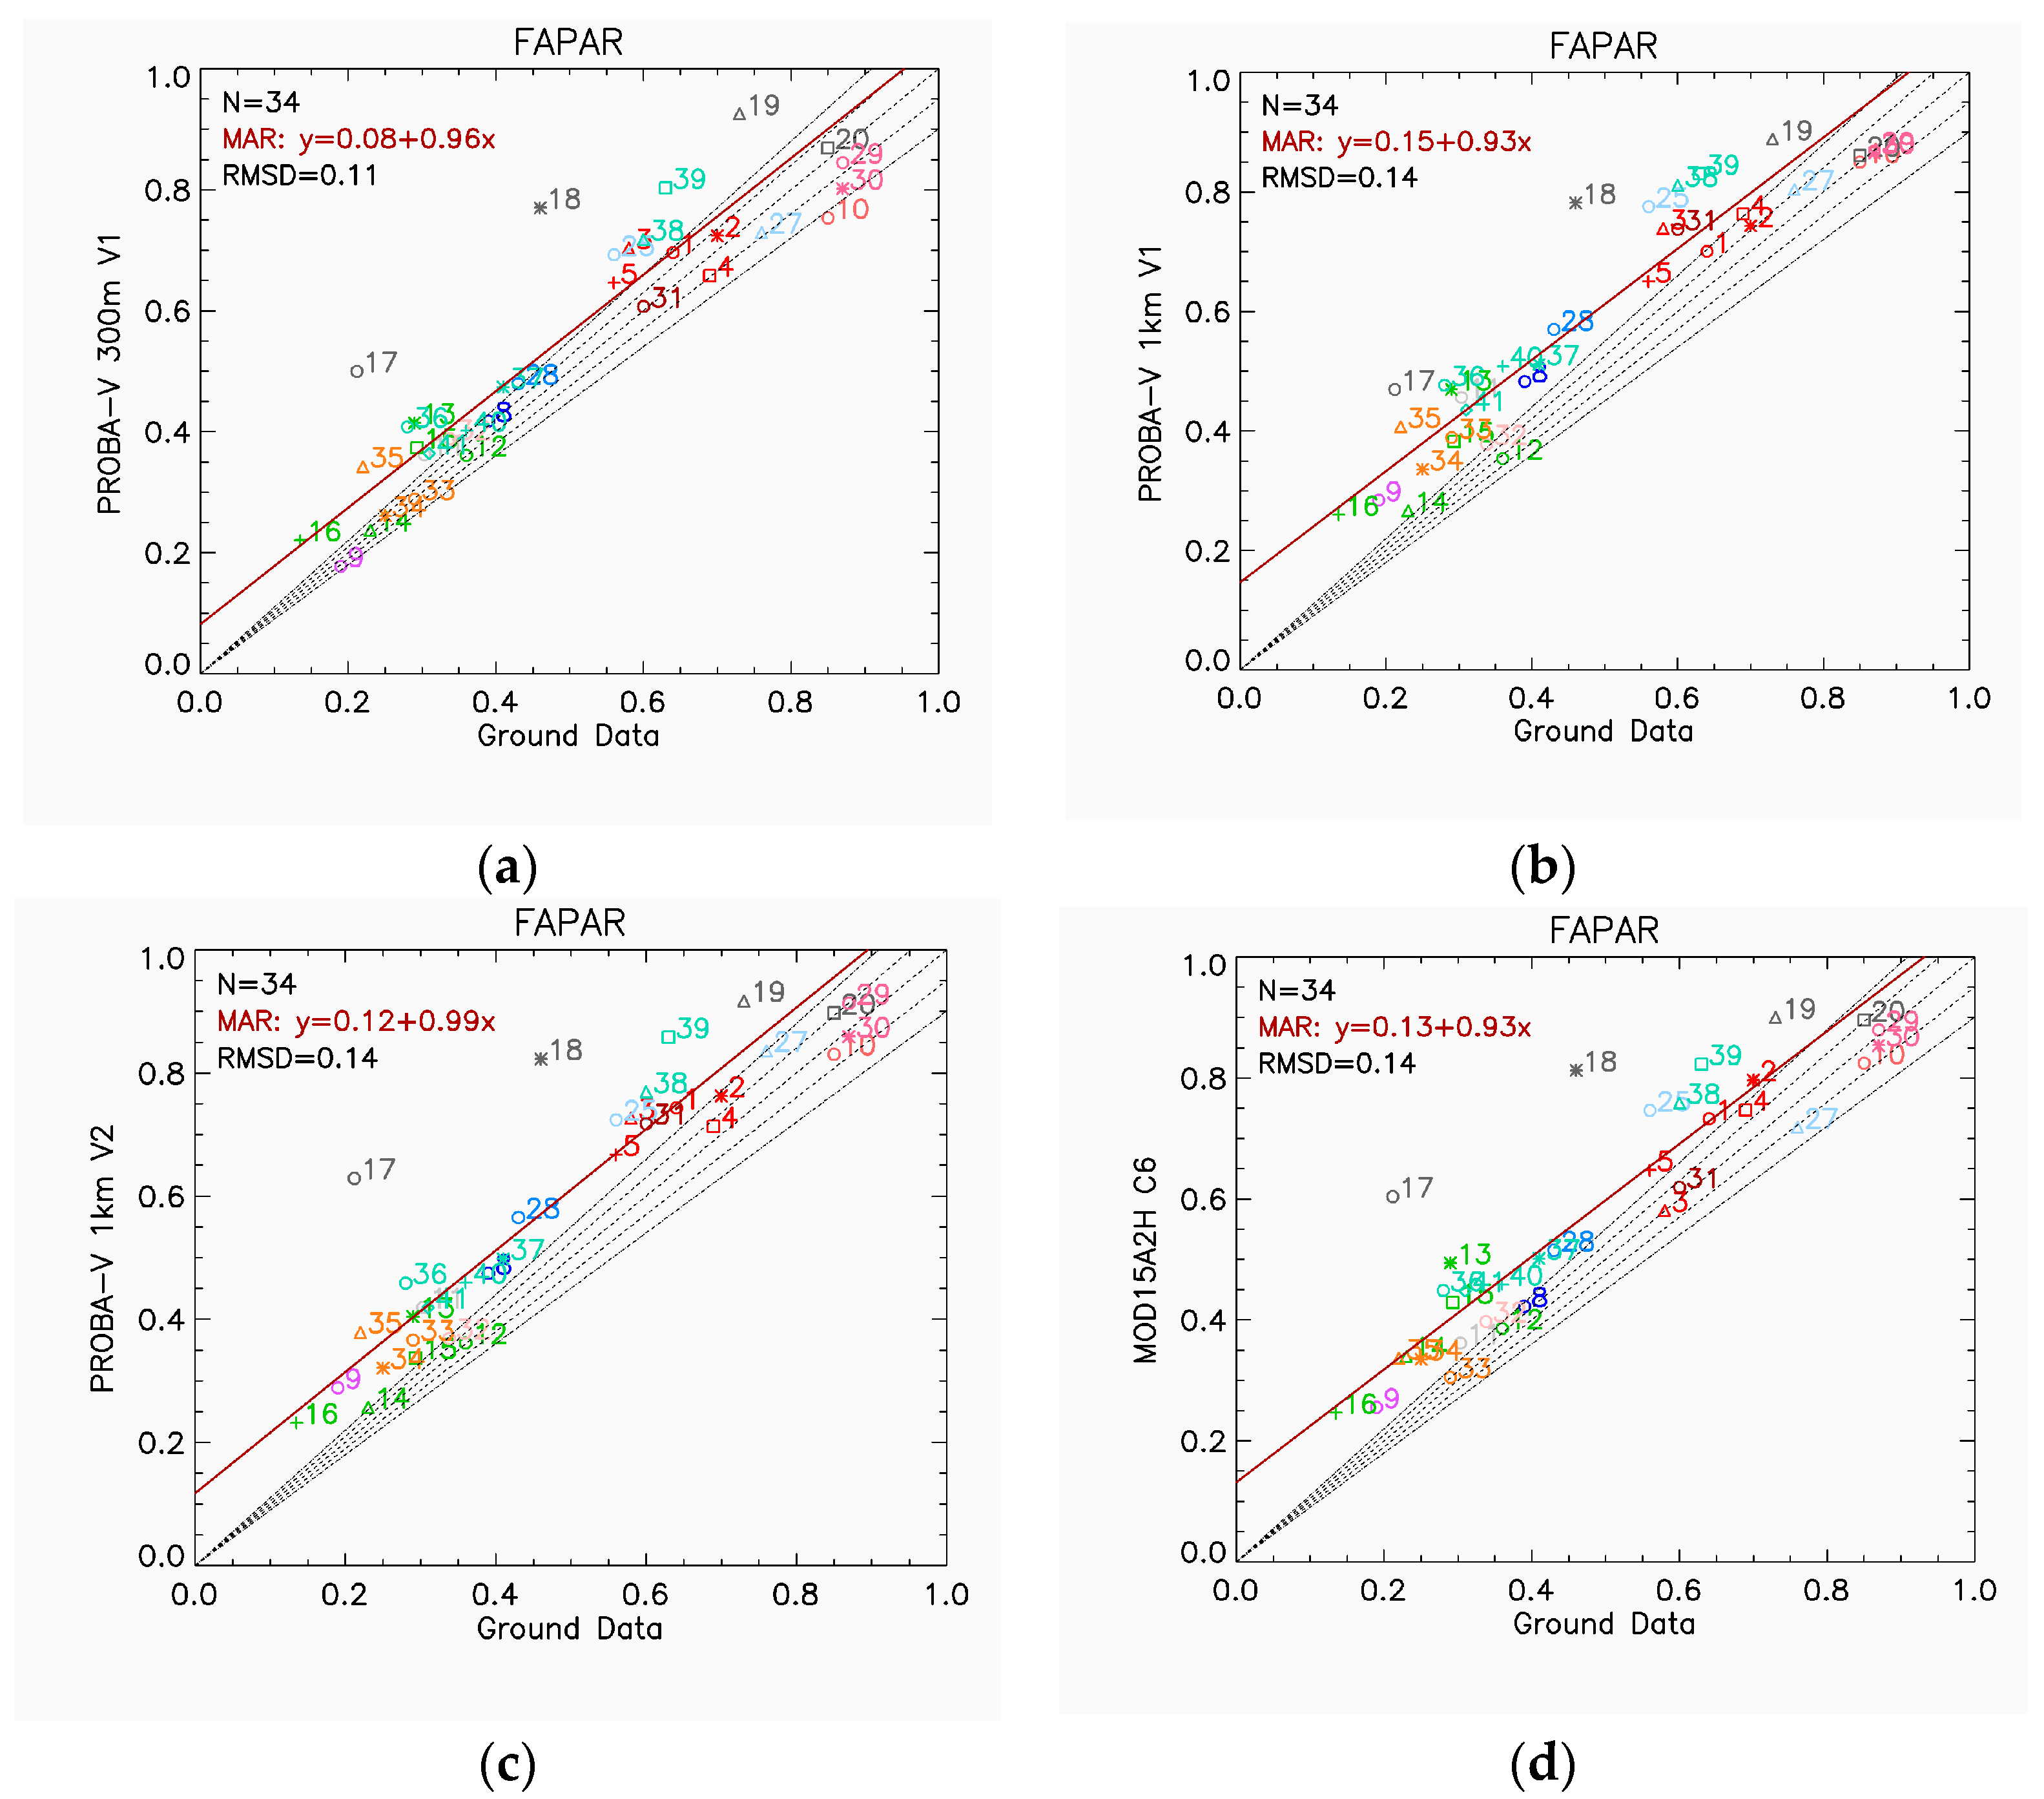
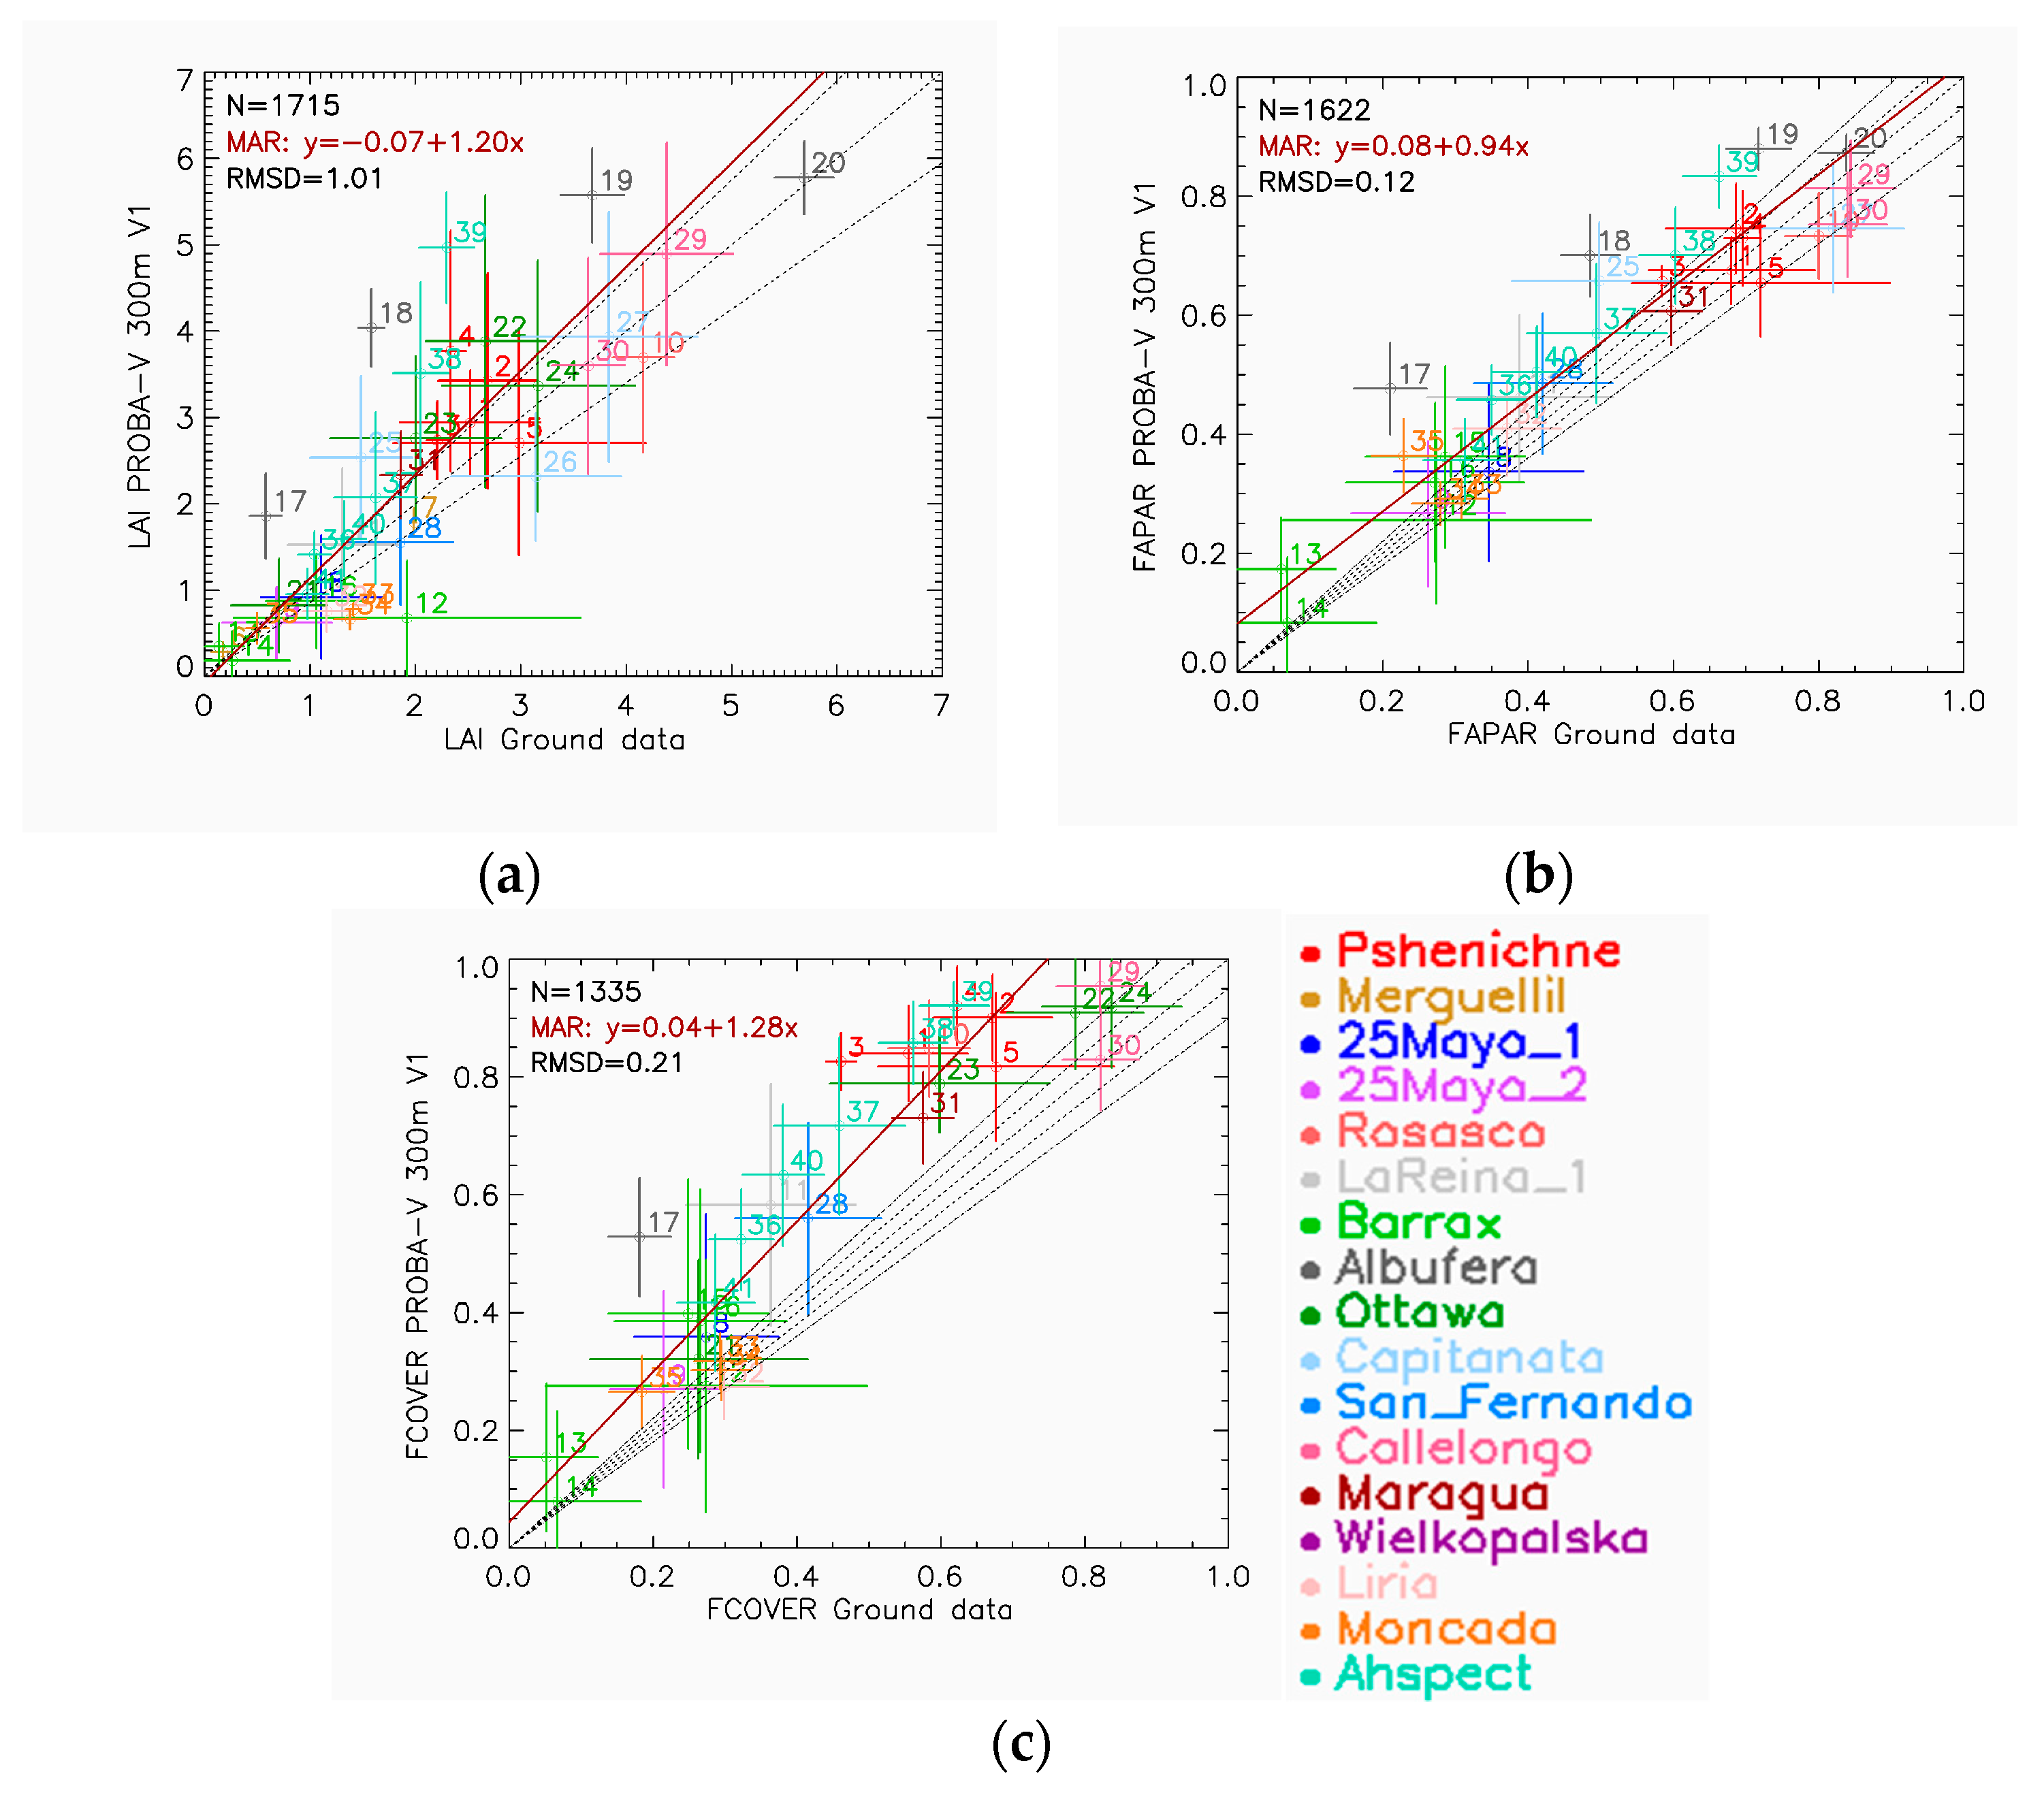
4.3. Accuracy Assessment with Ground Measurements

4.3.1. Validation of PROBA-V Collection 300 m V1

Figure 7 shows the scatterplots between the PROBA-V Collection 300 m V1 products and ground-based reference maps at a spatial resolution of 300 m. For the sake of clarity, the mean value of each site along with the standard deviation over the 3 km × 3 km area is presented. However, the validation statistics are computed over all pixels at the nominal spatial resolution of 300 m. The accuracy assessment for each specific site over an extended area of the reference map can be found in the validation report [23].
The LAI shows an accuracy (RMSD) of 1.01 (44.3%) (Table 9), with a positive mean bias of 0.36 (15.5%) and slope of the linear fit that is significantly different to 1. A large overestimation is found for medium LAI ranges over a few cropland sites (Albufera site: #17, #18 and #19 and the AHSPECT sites: #38 and #39), while an underestimation is observed for the Barrax (#12) and Moncada (#33 and #34) sites. For the limited samples of other biomes, good performance was found for the Shrublands (20Mayo_2: #9), deciduous broadleaf forest (Collelongo site: #29 and #30) and needle-leaf forest (Lliria: #32).
For fAPAR, the Collection 300 m V1 product shows a high correlation (0.91) with respect to ground reference data, with an overall accuracy (RMSD) of 0.12 (22.2%) and a slight positive mean bias of 0.05 (10.3%). Systematic positive bias occurs for all levels of fAPAR except for the highest values as can be observed by the linear fit (intercept 0.08, slope 0.94; Table 9). The largest overestimations are also found for croplands at the Albufera (#17, #18 and #19) and the AHSPECT sites (#39) as well as for the Barrax (#13), Capitanata (#25) and Moncada sites in wintertime (#35).
For fCOVER, the Collection 300 m V1 product shows a RMSD of 0.21 (42.6%), a statistically significant positive mean bias of 0.16 (32.2%) and slope of the linear fit of 1.28 (Table 9). For almost all sites, positive biases with ground references are found except for the Collelongo (#30) and Liria (#32) forest sites and the Moncada crop site (#33, #34), with the largest deviation found again for the Albufera rice site (#17) with the ground fCOVER values.
Finally, compliance with the CGLS user requirements (Table 10) shows that 58.1% (69.1%) of the limited number of samples are within the target (threshold) level for LAI, 35.7% (62.5%) for fAPAR and only 13.3% (29.7%) for fCOVER.

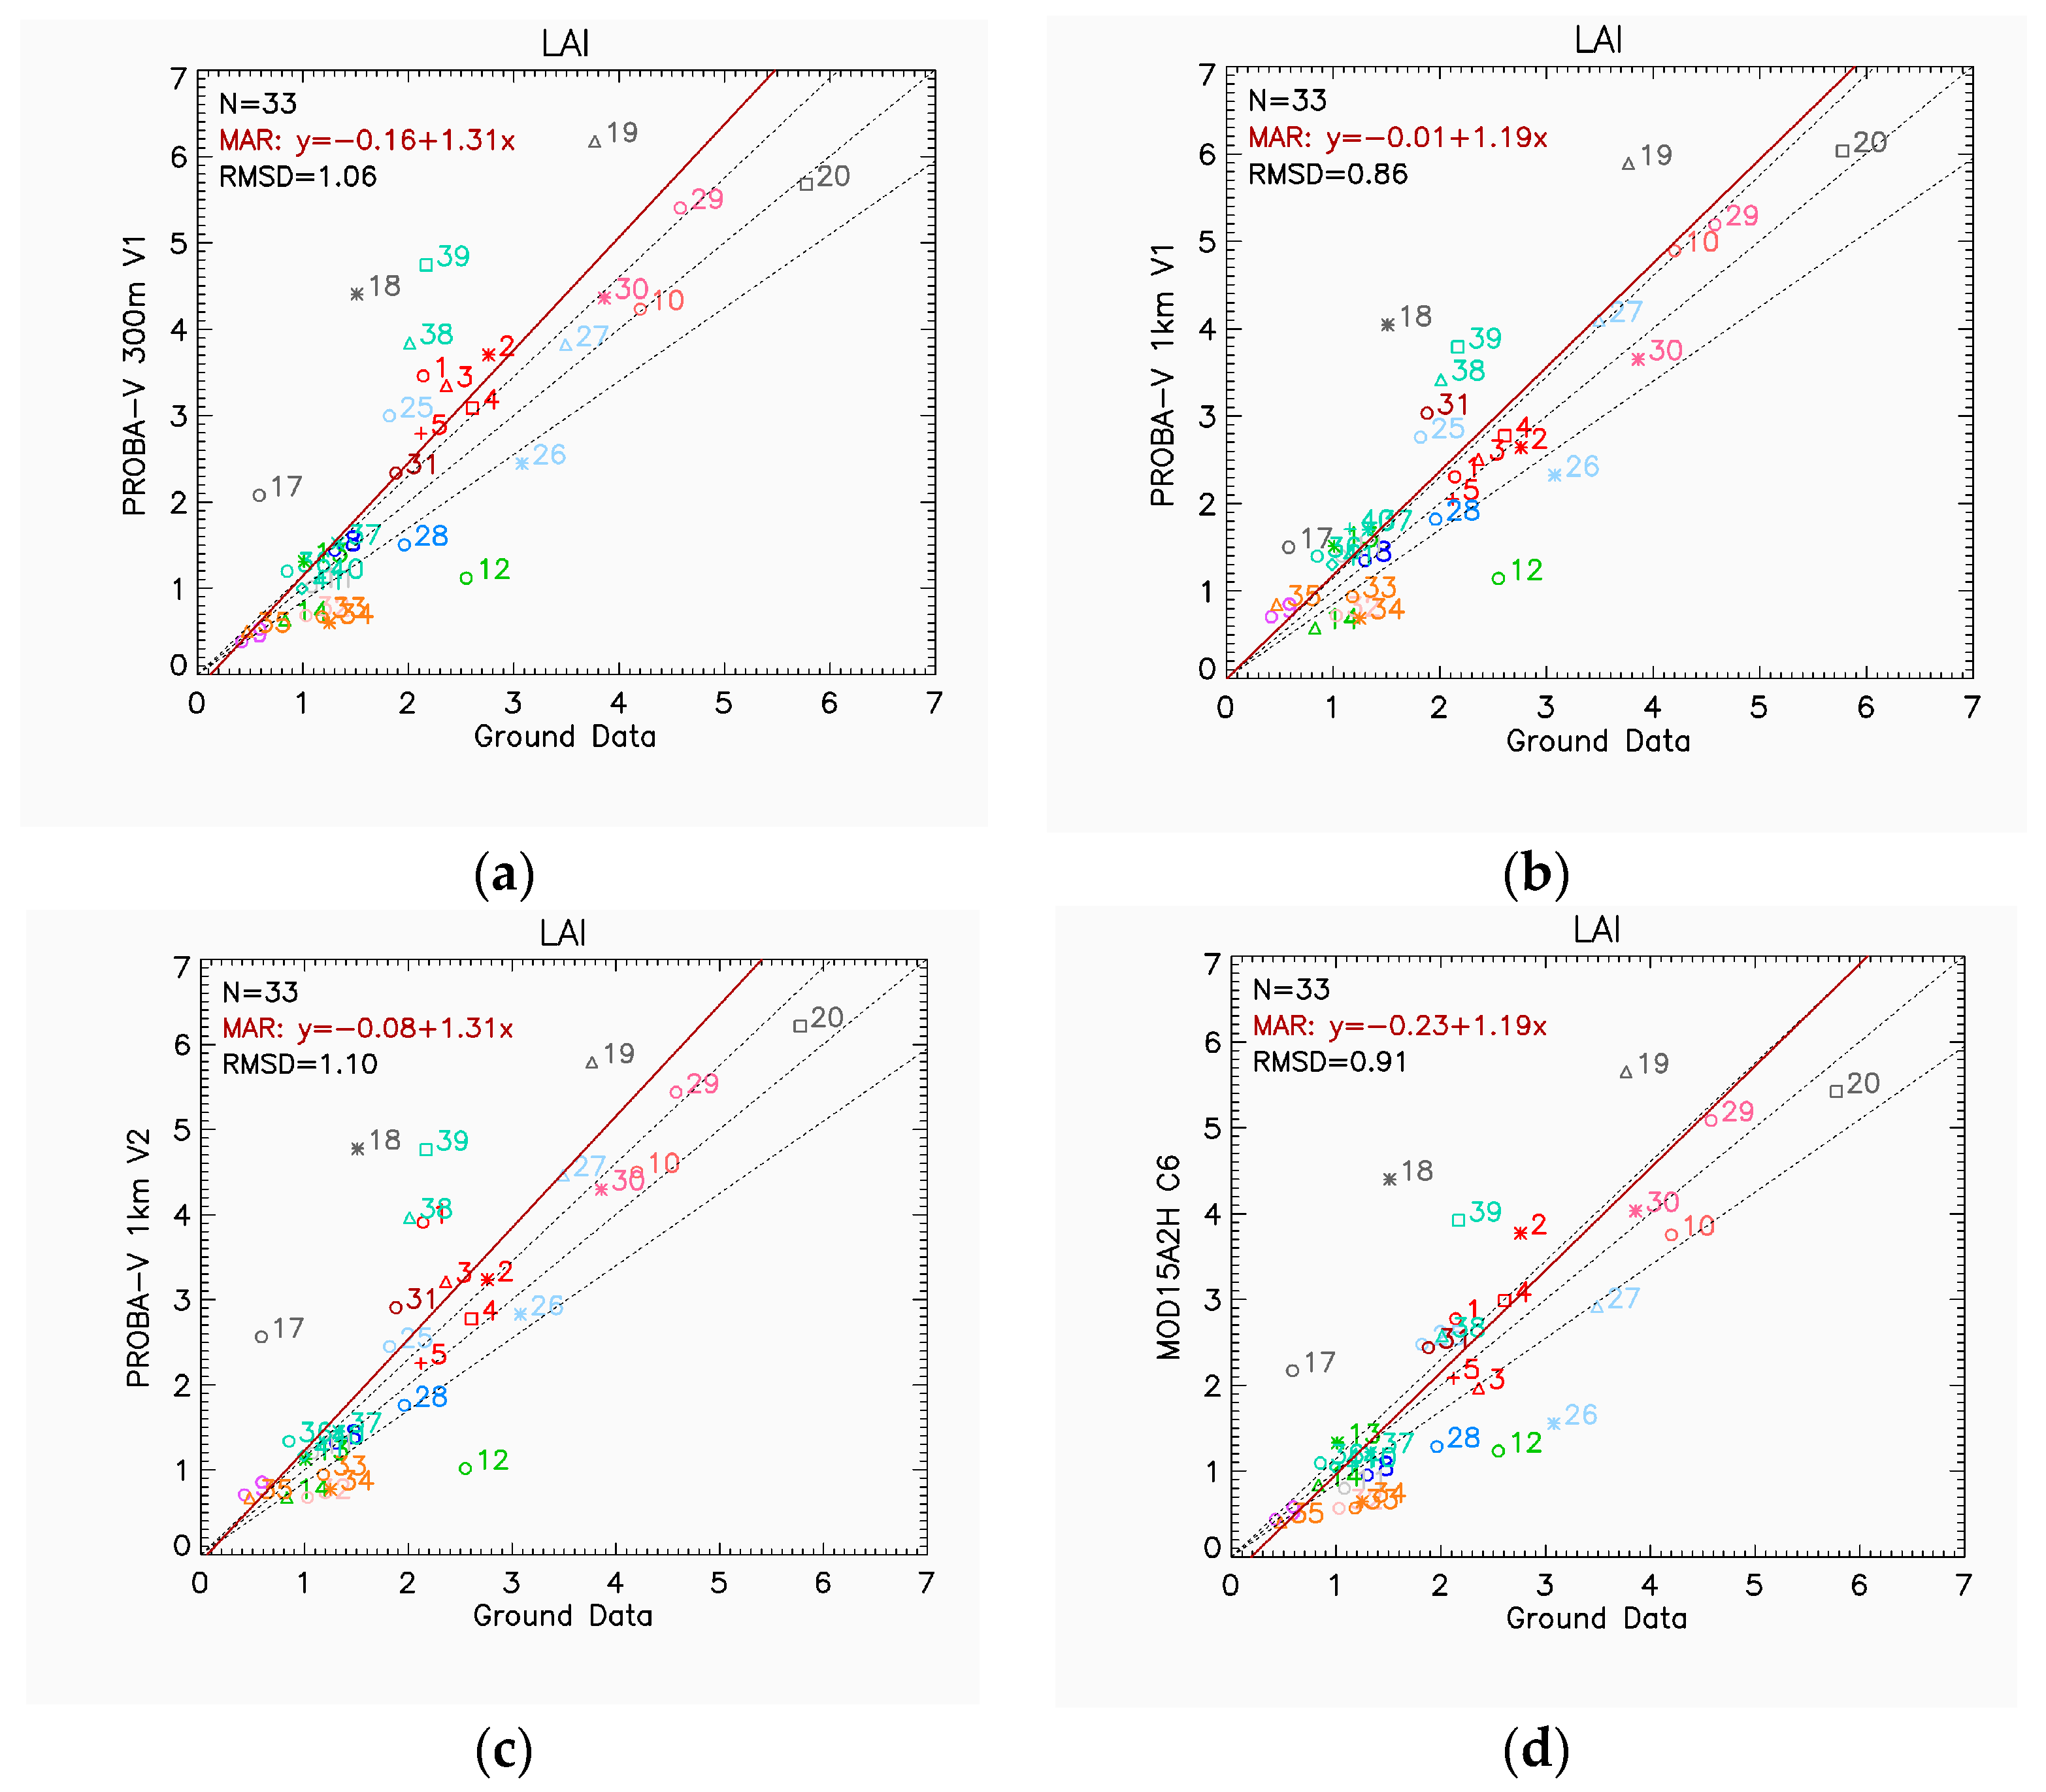
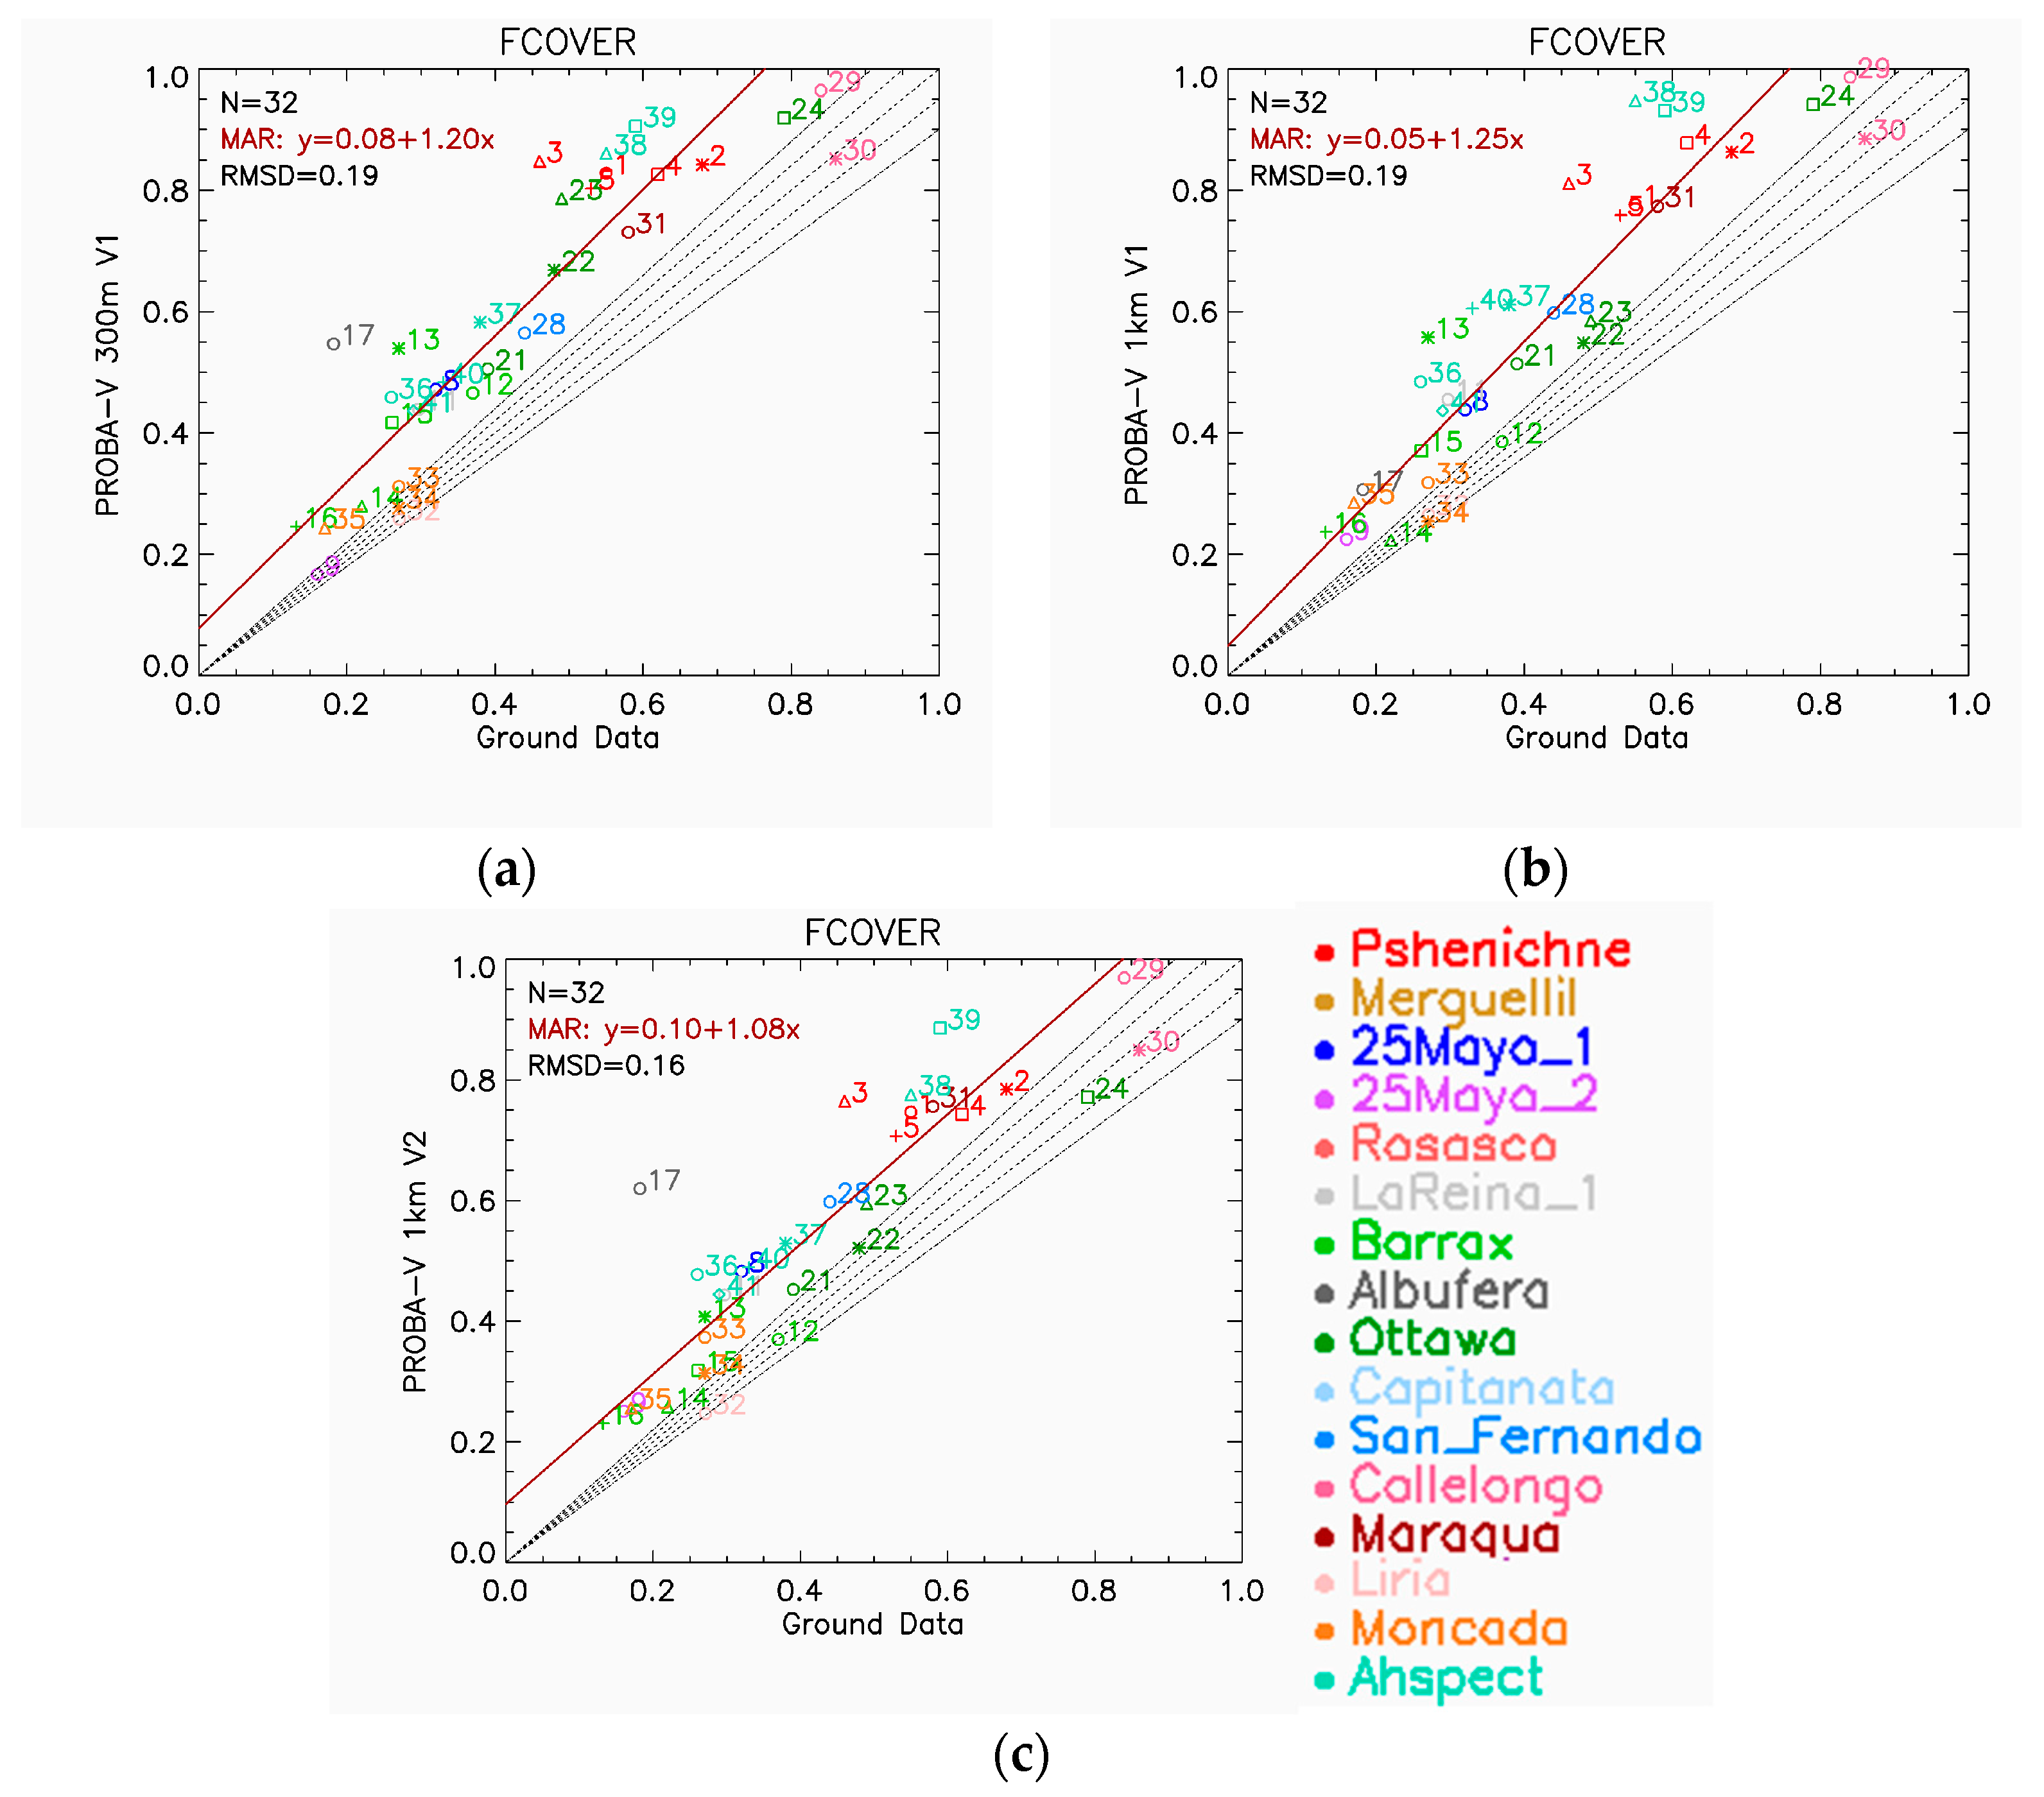
4.3.2. Validation of MODIS and PROBA-V Products over the Common Samples

The accuracy assessment with common ground measurements is also conducted at a reduced resolution using averaged values over 3 km × 3 km (Table 2) to intercompare with reference satellite products.
The scatterplots for the different LAI products (Figure 8) show similar correlations and linear relationships for all the products. The best agreement in terms of RMSD is found for Collection 1 km V1 (0.86, Table 11), which is similar to MODIS C6, whereas Collection 300 m V1 shows a RMSD of 1.06. The three CGLS PROBA-V LAI products show a positive mean bias of approximately 0.5 (~20%) (Table 11) and slopes that are different from 1 (not statistically significant), whereas MODIS C6 displays a lower mean bias 0.16 (7.5%). All the products show large discrepancies for the Albufera site at the early stages of development (#17–19) as well as for some AHSPECT sites (#38–39). The negative bias for Barrax (#12) is also common among all products.
For the different fAPAR products (Figure 9), similar accuracy results are observed, with high correlations for all products (R > 0.91, Table 12). The best accuracy is found for Collection 300 m V1, with an RMSD of 0.11 (21.3%) and a mean positive bias of 0.06 (12.5%). The other three satellite products show very similar statistics, with an RMSD of 0.14 (~26%) and bias of approximately 0.1 (~20%). A large overestimation is found for the Albufera rice site during the early stages and growing period.
For the fCOVER products (Figure 10), the three CGLS PROBA-V products show very similar results and display a systematic positive mean bias of approximately 30% compared with the ground reference maps. The best results are found for Collection 1 km V2 (mean bias of 0.13) whereas Collection 300 m V1 and Collection 1 km V1 show a mean bias of 0.16 (Table 13).

5. Discussion

The CGLS offers global PROBA-V LAI, fAPAR and fCOVER products at resolutions of 1 km and 300 m. Overall good spatial and temporal consistency is found between the several CGLS PROBA-V collections for the three variables, which is partly explained by the fact that all the CGLS PROBA-V vegetation products are retrieved from the same sensor and based on the same NNT retrieval approach. The main differences between the algorithms for the different collections occur in the temporal compositing method: for V1 1 km, compositing is performed at the reflectance level without considering smoothing and gap filling; for V2 1 km, compositing is applied at the biophysical variable level and applies smoothing and gap filling with the use of climatology data for large gaps. Finally, for Collection 300 m V1, the approach is similar to that for the 1 km V2 but instead of using climatology data, which are not available in the 300 m V1 product, small gaps are filled by performing an interpolation in a local window while large gaps are not filled. The differences in these compositing approaches explain the larger differences observed when the number of valid observations is low. The largest residuals are found over northern latitudes or equatorial areas, which are affected by long periods of missing data due to persistent cloudiness and noise in the input data because of residual clouds and snow contamination. In terms of biomes, the evergreen broadleaf forest in tropical areas and needle-leaf forest in northern latitudes are affected by larger discrepancies between CGLS PROBA-V products. The comparison of Collection 300 m V1 with MODIS C6 shows overall good consistency for LAI with a linear relationship close to the 1:1 line but larger RMSD values than between PROBA-V products. However, for fAPAR, bias is found for low and high values. MODIS C6 displays higher values for very low and very high fAPAR values than Collection 300 m V1 products. These results are consistent with previous validation studies between SPOT/VGT V1 and MODIS C5 [29]. Large differences between satellite fAPAR products over forest sites have also been reported by a number of previous studies [10,64,65,66]. The large RMSD values are partly explained due to large temporal variability of MODIS products (lower precision) as observed mainly over forest sites.
Collection 300 m V1 shows good precision, with smooth profiles and consistent inter-annual variations compared with the reference satellite products. The median absolute anomalies between consecutive years are only slightly higher than for the PROBA-V Collection 1 km products and better than MODIS C6 products, which show unstable profiles. The Collection 300 m V1 products display a slight systematic positive bias for LAI (0.36, 16%) and fAPAR (0.05, 10%) and significant deviations for fCOVER (0.16, 32%), with an overall accuracy (RMSD) of approximately 1 (44%) for LAI, 0.12 (22%) for fAPAR and 0.21 (42%) for fCOVER. The absolute location error for PROBA-V 300 m V1 is approximately 70 m on average for the different channels [67], which may introduce additional errors in the per-pixel based comparison. Nevertheless, the effective PSF method used for upscaling reduces the impact of geolocation errors in the accuracy assessment [60]. Indeed, the comparison at a spatial resolution of 3 km shows similar product accuracy (just slightly better) to that at a resolution of 300 m. The accuracy of Collection 300 m V1 is similar to that of the other reference satellite 1 km products for LAI and improved for fAPAR. All the satellite products show large overestimations for the Albufera rice crop site during the early and growing periods of development (June–July), and this result was previously observed for LAI products by Campos-Taberner et al. [68] and by Fang et al. [69] for rice crops in China. Satellite retrieval algorithms misinterpret the decreased reflectance due to strong water absorption as a denser canopy (i.e., increasing artificially LAI, fAPAR and fCOVER values). The user is advised to mask or apply specific corrections over flooded vegetated areas. Future improvements on the representativeness of the background spectra used for the calibration of retrievals algorithms should include the very dark background of flooded areas, such as those in paddy rice fields, during the growing period.
The overestimations found for PROBA-V fCOVER products was also reported over croplands for SPOT/VGT 1 km V1 using a different ground dataset [70]. The results of our study seem to indicate that the scale factor (1/0.687) applied to the CYCLOPES fCOVER product to derive the PROBA-V fCOVER product might be too high. However, correcting the fCOVER bias from the measurements might lead to some artefacts due to the limitations of the ground dataset in terms of accuracy and representativity. Further investigation is required before proposing any correction for the observed bias of fCOVER products. Indeed, the validation of fCOVER was conducted over a limited number of sites (mostly crops), and the accuracy of the ground measurements from DHP data is the best that could be obtained; however, it is still not very high, especially because of the footprint of the measurements compared to LAI/fAPAR. This footprint corresponds to approximately 2.2 m² per plot for an acquisition at 1 m height or fCOVER because only the 0–10° range of view angles are used, whereas a footprint of approximately 60 m² is sampled for LAI and fAPAR using the 0–60° range of view angles. Finally, more research is needed to confirm whether this overestimation is also affecting other biomes.
Furthermore, it should be noted that ground reference data could have larger uncertainties than the CGLS optimal and target uncertainty requirements for fCOVER and fAPAR (5% and 10%, respectively). Thus, ground measurement uncertainties must be characterized, which is the main purpose in the fiducial reference measurement for vegetation (FRM4Veg) project [71], to better estimate the satellite product uncertainty budget.

6. Conclusions and Prospects

The quality assessment of PROBA-V Collection 300 m LAI, fAPAR and fCOVER Version 1 products was conducted following the CEOS WGCV LPV best practices for validating LAI products. The quality assessment was focused on evaluating the spatial and temporal consistency with similar products to identify similarities and discrepancies among similar datasets as well as the precision over a two-year period (2016–2017). The accuracy assessment using ground measurements was performed over a four-year period (2014–2017). Additional assessments of near real time estimates are not shown in this manuscript for the sake of brevity; however, they can be found in the validation report [23]. The main conclusions are as follows.
  • Collection 300 m V1 shows overall good spatial consistency with respect to Collection 1 km products, with some discrepancies mainly observed over areas where the inputs are more likely to show large uncertainties. Low spatial consistency is found with respect to MODIS C6, mainly for fAPAR products.
  • Collection 300 m V1 can be used to monitor the temporal evolution of vegetation with improved spatial resolution, good precision, a proper dynamic range (i.e., from 0 values for bare areas to maximum values for the densest canopies) and similar seasonal and inter-annual variations to reference products. Furthermore, it corrects some artefacts detected in PROBA-V Collection 1 km V1 for bare areas and northern latitudes.
  • Collection 300 m V1 shows low overall discrepancies (RMSD) with respect to ground reference data with a slight positive bias for LAI and fAPAR while fCOVER displays large systematic deviations with ground measurements. All variables are overestimated over paddy rice fields, which has been observed for other satellite reference products, and similarly low performance is expected for flooded vegetated targets. The user should use the products with caution for applications related to such ecosystems.
The relevance of the spatial and temporal consistency assessment is limited by the fact that no truly independent datasets have been considered, and because reference satellite products could suffer of the same inconsistencies, as we have observed over the Albufera site. Future work should include independent dataset (e.g., using high resolution imagery or temporal variations of vegetation derived at ground level) to assess the spatial and temporal consistency of the Collection 300 m dataset. Moreover, the relevance of the accuracy assessment using ground measurements is limited by the low number of appropriate ground reference datasets. In this context, the Ground-Based Observations for Validation (GBOV) [72] component of CGLS, which aims at facilitating the use of measurements from operational ground-based monitoring networks and their comparison to Earth observations products, will make a significant contribution to validation activities. Once the GBOV methodologies, in particular the up-scaling approaches, are validated by independent experts, the database will be a very useful reference for accuracy assessments of remotely sensed biophysical products.
Currently based on PROBA-V data, the production of Collection 300 m V1 will continue at the end of the operational PROBA-V mission (April 2020) using Sentinel-3 OLCI data as input. The retrieval methodologies are being updated to ensure the consistency of the time series.

Supplementary Materials

The following are available online at https://0-www-mdpi-com.brum.beds.ac.uk/2072-4292/12/6/1017/s1, Figure S1: fAPAR residual map between PROBA-V Collection 300 m V1 and Collection 1 km V1 (a), Collection 1 km V2 (b) and MODIS C6 (c) for 20th June 2017. Figure S2: fCOVER residual map between PROBA-V Collection 300 m V1 and Collection 1 km V1 (a) and Collection 1 km V2 (b) for 20th June 2017. Figure S3: LAI PROBA-V 300 m V1 versus PROBA-V 1 km V1 scatterplots for the 2016-2017 period over LANDVAL sites corresponding to evergreen broadleaved forest (a), deciduous broadleaved forest (b), needle-leaf forest (c), cultivated (d), herbaceous (e) and bare areas (f). Figure S4: fAPAR PROBA-V 300 m V1 versus PROBA-V 1 km V1 scatterplots for the 2016-2017 period over LANDVAL sites corresponding to evergreen broadleaved forest (a), deciduous broadleaved forest (b), needle-leaf forest (c), cultivated (d), herbaceous (e) and bare areas (f). Figure S5: fCOVER PROBA-V 300 m V1 versus PROBA-V 1 km V1 scatterplots for the 2016-2017 period over LANDVAL sites corresponding to evergreen broadleaved forest (a), deciduous broadleaved forest (b), needle-leaf forest (c), cultivated (d), herbaceous (e) and bare areas (f). Figure S6: LAI PROBA-V 300 m V1 versus PROBA-V 1 km V2 scatterplots for the 2016-2017 period over LANDVAL sites corresponding to evergreen broadleaved forest (a), deciduous broadleaved forest (b), needle-leaf forest (c), cultivated (d), herbaceous (e) and bare areas (f). Figure S7: fAPAR PROBA-V 300 m V1 versus PROBA-V 1 km V2 scatterplots for the 2016-2017 period over LANDVAL sites corresponding to evergreen broadleaved forest (a), deciduous broadleaved forest (b), needle-leaf forest (c), cultivated (d), herbaceous (e) and bare areas (f). Figure S8: fCOVER PROBA-V 300 m V1 versus PROBA-V 1 km V2 scatterplots for the 2016-2017 period over LANDVAL sites corresponding to evergreen broadleaved forest (a), deciduous broadleaved forest (b), needle-leaf forest (c), cultivated (d), herbaceous (e) and bare areas (f). Figure S9: LAI PROBA-V 300 m V1 versus MOD15A2H C6 scatterplots for the 2016-2017 period over LANDVAL sites corresponding to evergreen broadleaved forest (a), deciduous broadleaved forest (b), needle-leaf forest (c), cultivated (d), herbaceous (e) and bare areas (f). Figure S10: fAPAR PROBA-V 300 m V1 versus MOD15A2H C6 scatterplots for the 2016-2017 period over LANDVAL sites corresponding to evergreen broadleaved forest (a), deciduous broadleaved forest (b), needle-leaf forest (c), cultivated (d), herbaceous (e) and bare areas (f).

Author Contributions

Conceptualization, F.C.; methodology, F.C. & J.S.-Z.; software development and validation, B.F. & J.S.-Z.; all authors contributed to the formal analysis, writing, review and editing of the manuscript; scientific project coordination, R.L.; and project management, B.S. All authors have read and agreed to the published version of the manuscript.

Funding

This research was funded by European Commission/Joint Research Centre under the Framework Service Contract N°199494 of the Copernicus Global Land Service.

Acknowledgments

We would like to thank the FP7 ImagineS project (Grant Agreement N°311766) for the ground dataset provided for the accuracy assessment, all scientists involved in the data collection and Consuelo Latorre and David Vinué from EOLAB, who contributed to the production of the ground-based maps used for validation.

Conflicts of Interest

The authors declare no conflicts of interest.

Appendix A. LANDVAL Network of Sites

The LANDVAL network of sites was defined for intercomparison with similar satellite products. The LANDVAL network is composed of 725 sites (Figure A1), of which 521 sites are from Surface Albedo Validation Sites (SAVS 1.0) [73], including 256BELMANIP 2.1 sites [10]. SAVS 1.0 (available at http://savs.eumetsat.int) was created during the ALBEDOVAL-2 study [74] in the framework of the Quality Assurance for Essential Climate Variable (QA4ECV) project and is a static database of 2186 potential reference sites correlated with various ancillary data with respect to their spatial and temporal homogeneity to fully characterize the sites for land product validation. The selection criteria that have been chosen for each SAVS 1.0 to build LANDVAL sites are shown in Table A1. In addition, 20 calibration sites in the Sahara Desert and Arabia Desert are included in order to increase the sampling over desertic areas. These calibration sites, which are well-known for their high temporal stability, are used by CNES for the absolute calibration of remote sensing sensors. Finally, 184 sites from other networks (e.g., FP7 ImagineS [7], AsiaFlux (http://asiaflux.net/), OzFlux (http://www.ozflux.org.au/)) or identified through the Geo-Wiki platform (http://www.geo-wiki.org/) were included with same criteria (Table A1) in order to cover undersampled regions (e.g., Asia, Africa, Oceania) and biome types (e.g., shrub, deciduous broadleaf forest or needle-leaf forest).
Figure A1. Global distribution of the 725 LANDVAL sites.
Remotesensing 12 01017 g0a1
Table A1. Criteria for selection of the LANDVAL sites.
ParameterThresholdPurpose
Distance to open water bodies [km]5Avoid open water bodies and their changing reflectance behaviour with viewing geometry
Minimum fraction of majority land cover type at 5 km distance60%Avoid areas with heterogeneous land cover
Land Cover Majority at 5 kmExclude “Water bodies” and “Urban areas”
Vertical range [m] within a distance of 5 km<300 mAvoid areas with significant terrain variability close to a site.
Location (Latitude)60°S to 80°NExclude sites over extreme latitudes, where CGLS products do not provide data

References

  1. Copernicus Global Land Service Site. Available online: https://land.copernicus.eu/global/ (accessed on 27 January 2020).
  2. GCOS#200. The Global Observing System for Climate: Implementation Needs. WMO, Geneva, Switzerland. Available online: https://gcos.wmo.int/en/gcos-implementation-plan (accessed on 8 October 2019).
  3. Chen, J.M.; Black, T.A. Foliage area and architecture of plants canopies from sunfleck size distributions. Agric. For. Meteorol. 1992, 60, 249–266. [Google Scholar] [CrossRef]
  4. Avissar, R.; Pielke, R.A. A Parameterization of heterogeneous Land Surfaces for Atmospheric Numerical Models and Its Impact on Regional Meteorology. Mon. Weather Rev. 1989, 117, 2113–2136. [Google Scholar] [CrossRef] [Green Version]
  5. Toté, C.; Swinnen, E.; Sterckx, S.; Clarijs, D.; Quang, C.; Maes, R. Evaluation of the SPOT/VEGETATION Collection 3 reprocessed dataset: Surface reflectances and NDVI. Remote Sens. Environ. 2017, 201, 219–233. [Google Scholar] [CrossRef]
  6. Dierckx, W.; Sterckx, S.; Benhadj, I.; Livens, S.; Duhoux, G.; Van Achteren, T.; Francois, M.; Mellab, K.; Saint, G. PROBA-V mission for global vegetation monitoring: Standard products and image quality. Int. J. Remote Sens. 2014, 35, 2589–2614. [Google Scholar] [CrossRef]
  7. ImagineS Website. Available online: http://fp7-imagines.eu/ (accessed on 27 January 2020).
  8. Baret, F.; Weiss, M.; Verger, A.; Smets, B. Atbd for Lai, Fapar and Fcover from Proba-V Products at 300 Mresolution (Geov3). Imagines_rp2.1_atbd-lai 300 m. Issue 1.73. Available online: https://land.copernicus.eu/global/sites/cgls.vito.be/files/products/ImagineS_RP2.1_ATBD-LAI300m_I1.73.pdf (accessed on 8 October 2019).
  9. Fernandes, R.; Plummer, S.; Nightingale, J.; Baret, F.; Camacho, F.; Fang, H.; Garrigues, S.; Gobron, N.; Lang, M.; Lacaze, R.; et al. Global Leaf Area Index Product Validation Good Practices. Version 2.0. In Best Practice for Satellite-Derived Land Product Validation (p.76): Land Product Validation Subgroup (WGCV/CEOS), Canada; 2014. Available online: https://lpvs.gsfc.nasa.gov/PDF/CEOS_LAI_PROTOCOL_Aug2014_v2.0.1.pdf (accessed on 3 February 2020). [CrossRef]
  10. Weiss, M.; Baret, F.; Block, T.; Koetz, B.; Burini, A.; Scholze, B.; Lecharpentier, P.; Brockmann, C.; Fernandes, R.; Plummer, S.; et al. On LineValidation Exercise (OLIVE): A web based service for the validation of medium resolution land products. Application to FAPAR products. Remote Sens. 2014, 6, 4190. [Google Scholar] [CrossRef] [Green Version]
  11. Camacho, F.; Baret, F.; Weiss, M.; Fernandes, R.; Berthelot, B.; Sánchez, J.; Latorre, C.; García-Haro, J.; Duca, R. Validación de algoritmos para la obtención de variables biofísicas con datos Sentinel2 en la ESA: Proyecto VALSE-2. In Proceedings of the XV Congreso de la Asociación Española de Teledetección (AET), Madrid, Spain, 22–24 October 2013. [Google Scholar]
  12. Garrigues, S.; Lacaze, R.; Baret, F.; Morisette, J.T.; Weiss, M.; Nickeson, J.E.; Fernandes, R.; Plummer, S.; Shabanov, N.V.; Myneni, R.B.; et al. Validation and intercomparison of global Leaf Area Index products derived from remote sensing data. J. Geophys. Res. Biogeosci. 2008, 113. [Google Scholar] [CrossRef]
  13. Weiss, M.; Baret, F.; Garrigues, S.; Lacaze, R. LAI and fAPAR CYCLOPES global products derived from VEGETATION. Part 2: Validation and comparison with MODIS collection 4 products. Remote Sens. Environ. 2007, 110, 317–331. [Google Scholar] [CrossRef]
  14. Morisette, J.T.; Baret, F.; Privette, J.L.; Myneni, R.B.; Nickeson, J.E.; Garrigues, S.; Shabanov, N.V.; Weiss, M.; Fernandes, R.A.; Leblanc, S.G.; et al. Validation of global moderate-resolution LAI products: A framework proposed within the CEOS land product validation subgroup. IEEE Trans. Geosci. RemoteSens. 2006, 44, 1804–1814. [Google Scholar] [CrossRef] [Green Version]
  15. Martínez, B.; García-Haro, F.J.; Camacho, F. Derivation of high-resolution leaf area index maps in support of validation activities: Application to the cropland Barrax site. Agric. For. Meteorol. 2009, 149, 130–145. [Google Scholar] [CrossRef]
  16. Camacho, F.; Latorre, C.; Lacaze, R.; Sanchez-Zapero, J.; Baret, F.; Weiss, M. Protocol for building a consistent database for accuracy assessment of LAI, fAPAR and fCover satellite products: The ImagineS database. Remote Sens. In preparation.
  17. Camacho, F.; Baret, F.; Lacaze, R. Guidelines for a Field Campaign. Available online: http://fp7-imagines.eu/pages/documents.php (accessed on 8 October 2019).
  18. Validation of Land European Remote Sensing Instruments (VALERI) Site. Available online: http://w3.avignon.inra.fr/valeri/ (accessed on 27 January 2020).
  19. Rahman, H.; Dedieu, G. SMAC: A Simplified Method for the Atmospheric Correction of satellite measurements in the solar spectrum. Int. J. Remote Sens. 1994, 16, 123–143. [Google Scholar] [CrossRef]
  20. Yang, W.; Huang, D.; Tan, B.; Stroeve, J.C.; Shabanov, N.V.; Knyazikhin, Y.; Nemani, R.R.; Myneni, R.B. Analysis of leaf area index and fraction of PAR absorbed by vegetation products from the terra MODIS sensor: 2000–2005. IEEE Trans. Geosci. Remote Sens. 2006, 44, 1829–1841. [Google Scholar] [CrossRef]
  21. Baret, F.; Hagolle, O.; Geiger, B.; Bicheron, P.; Miras, B.; Huc, M.; Berthelot, B.; Niño, F.; Weiss, M.; Samain, O.; et al. Lai, fapar and fcover cyclopes global products derived from vegetation Part 1: Principles of the algorithm. Remote Sens. Environ. 2007, 110, 275–286. [Google Scholar] [CrossRef] [Green Version]
  22. Smets, B.; Jacobs, T.; Verger, A. Leaf Area Index (LAI), Fraction of Photosynthetically Active Radiation (FAPAR), Fraction of Vegetation Cover (FCOVER) Collection 300 m Version 1. Product User Manual. Issue I1.60. Available online: https://land.copernicus.eu/global/sites/cgls.vito.be/files/products/GIOGL1_PUM_LAI300m-V1_I1.60.pdf (accessed on 8 October 2019).
  23. Sanchez-Zapero, J.; Fuster, B.; Camacho, F. Quality Assessment report LAI, FAPAR and FCOVER Collection 300 m V1. Issue I2.00. Copernicus Global Land Operations—Lot 1. Available online: https://land.copernicus.eu/global/sites/cgls.vito.be/files/products/CGLOPS1_QAR_LAI300-V1_I2.00.pdf (accessed on 8 October 2019).
  24. Baret, F.; Weiss, M.; Lacaze, R.; Camacho, F.; Makhmara, H.; Pacholcyzk, P.; Smets, B. GEOV1: LAI and FAPAR essential climate variables and FCOVER global time series capitalizing over existing products. Part1: Principles of development and production. Remote Sens. Environ. 2013, 137, 299–309. [Google Scholar]
  25. Verger, A.; Baret, F.; Weiss, M. Near real time vegetation monitoring at global scale. IEEE J. Sel. Top. Appl. Earth Obs. Remote Sens. 2014, 7, 3473–3481. [Google Scholar] [CrossRef]
  26. Verger, A.; Baret, F.; Weiss, M.; Kandasamy, S.; Vermote, E. The CACAO Method for Smoothing, Gap Filling, and Characterizing Seasonal Anomalies in Satellite Time Series. Geosci. Remote Sens. 2013, 51, 1963–1972. [Google Scholar] [CrossRef]
  27. Wanner, W.; Strahler, A.H.; Hu, B.; Lewis, P.; Muller, J.-P.; Li, X.; BarkerSchaaf, C.L.; Barnsley, M.J. Global retrieval of bidirectional reflectance and albedo over land from EOS MODIS and MISR data: Theory and algorithm. J. Geophys. Res. 1997, 102, 17143–17161. [Google Scholar] [CrossRef] [Green Version]
  28. Verger, A.; Baret, F.; Weiss, M.; Filella, I.; Peñuelas, J. GEOCLIM: A global climatology of lai, fapar, and fcover from vegetation observations for 1999–2010. Remote Sens. Environ. 2015, 166, 126–137. [Google Scholar] [CrossRef] [Green Version]
  29. Camacho, F.; Sánchez-Zapero, J.; Sánchez-Azofeifa, A.; Calvo-Rodriguez, S. Quality assessment report Proba-V Geov1 Lai, fapar, Fcover Issue i3.11. Gio-Gl lot 1. Available online: https://land.copernicus.eu/global/sites/cgls.vito.be/files/products/GIOGL1_QAR_LAI1km-V1_I3.11.pdf (accessed on 8 October 2019).
  30. Camacho, F.; Sánchez-Zapero, J.; Fuster, B. Quality Assessment Report LAI, FAPAR, FCOVER from PROBA-V Collection 1km Version 2. Issue I1.40. Copernicus Global Land Operations—Lot 1. Available online: https://land.copernicus.eu/global/sites/cgls.vito.be/files/products/CGLOPS1_QAR_LAI1km-PROBAV-V2_I1.40.pdf (accessed on 8 October 2019).
  31. Tan, B.; Hu, J.; Huang, D.; Yang, W.; Zhang, P.; Shabanov, N.; Knyazikhin, Y.; Nemani, R.; Myneni, R. Assessment of the broadleaf crops leaf area index product from the Terra MODIS instrument. Agric. For. Meteorol. 2005, 135, 124–134. [Google Scholar] [CrossRef]
  32. Knyazikhin, Y.; Martonchik, J.V.; Myneni, R.B.; Diner, D.J.; Running, S.W. Synergistic algorithm for estimating vegetation canopy leaf area index and fraction of absorbed photosynthetically active radiation from MODIS and MISR data. J. Geophys. Res. 1998, 103, 32257. [Google Scholar] [CrossRef] [Green Version]
  33. Vermote, E.; Vermeulen, A. Algorithm Technical Background Document. Atmospheric Correction Algorithm: Spectral Refelectances (MOD09), Version 4.0, 1999. Available online: https://lpdaac.usgs.gov/documents/305/MOD09_ATBD.pdf (accessed on 29 November 2019).
  34. Yan, K.; Park, T.; Yan, G.; Liu, Z.; Yang, B.; Chen, C.; Nemani, R.; Knyazikhin, Y.; Myneni, R. Evaluation of MODIS LAI/FPAR Product Collection 6. Part 2: Validation and Intercomparison. Remote Sens. 2016, 8, 460. [Google Scholar] [CrossRef] [Green Version]
  35. CAN-EYE Website. Available online: https://www6.paca.inra.fr/can-eye/ (accessed on 27 January 2020).
  36. CAN-EYE Output Variable. Definitions and Theoretical Background. Available online: https://www6.paca.inrae.fr/can-eye/content/download/3012/30459/version/4/file/Variables_Meaning_CAN_EYE.pdf (accessed on 27 January 2020).
  37. Lang, A.R.G.; Xiang, Y. Estimation of leaf area index from transmission of direct sunlight in discontinuous canopies. Agric. For. Meteorol. 1986, 37, 229–243. [Google Scholar] [CrossRef]
  38. Demarez, V.; Duthoit, S.; Baret, F.; Weiss, M.; Dedieu, G. Estimation of leaf area and clumping indexes of crops with hemispherical photographs. Agric. For. Meteorol. 2008, 48, 644–655. [Google Scholar] [CrossRef] [Green Version]
  39. Miller, J.B. A formula for average foliage density. Aust. J. Bot. 1967, 15, 141–144. [Google Scholar] [CrossRef]
  40. OLIVE Description. Available online: http://calvalportal.ceos.org/web/olive/descriptions (accessed on 27 January 2020).
  41. Latorre, C.; Piñó, M.C.; Camacho, F.; Kussul, N.; Skakun, S.; Kolotii, A.; Shelestov, A. Vegetation Field Data and Production of Ground-Based Maps: “Pshenichne Site, Ukraine” 12th June, 31st July 2014. Available online: https://search.datacite.org/works/10.13140/rg.2.1.1864.6165 (accessed on 8 October 2019).
  42. Piñó, M.C.; Latorre, C.; Camacho, F.; Kussul, N.; Skakun, S.; Kolotii, A.; Shelestov, A. Vegetation Field Data and Production of Ground-Based Maps: “Pshenichne Site, Ukraine” Multi-Temporal Campaign: April–July, 2015. Available online: https://www.researchgate.net/publication/303843859_Vegetation_Field_Data_and_Production_of_Ground-Based_Maps_Pshenichne_site_Ukraine_Multi-temporal_campaign_April_to_July_2015 (accessed on 8 October 2019).
  43. Latorre, C.; Camacho, F.; Zribi, M.; Ayari, H.; Mougenot, B.; Chahbi, A. Vegetation Field Data and Production of Ground-Based Maps: “Merguellil Site, Tunisia” January–May 2014. Available online: https://www.researchgate.net/publication/298791645_Vegetation_Field_Data_and_Production_of_Ground-Based_Maps_Merguellil_site_Tunisia_January_to_May_2014 (accessed on 8 October 2019).
  44. Latorre, C.; Camacho, F.; Pérez, M.; Beget, M.E.; Bella, C. Vegetation Field Data and Production of ground-Based Maps: “25 de Mayo site, La Pampa, Argentina” 7th–9th February 2014. Available online: https://www.researchgate.net/publication/280229289_Vegetation_Field_Data_and_Production_of_Ground-based_maps_25_DE_MAYO_SITE_LA_PAMPA_ARGENTINA_7th-_9th_February_2014 (accessed on 8 October 2019).
  45. Latorre, C.; Camacho, F.; Boschetti, M.; Busetto, L.; Nutini, F.; Fontanelli, G.; Ranghetti, L. Vegetation Field Data and Production of Ground-Based Maps: “Rosasco site, Pavia, Italy” 3rd July 2014. Available online: https://www.researchgate.net/publication/298790864_Vegetation_Field_Data_and_Production_of_Ground-Based_Maps_Rosasco_site_Pavia_Italy_3rd_July_2014 (accessed on 8 October 2019).
  46. Latorre, C.; Camacho, F.; González, M.P.; Muñoz, F.L. Vegetation Field Data and Production of Ground-Based Maps: “La Reina Site, Córdoba, Spain” 19th–20th May 2014. Available online: https://www.researchgate.net/publication/280078556_Vegetation_Field_data_and_production_of_ground-based_maps_LA_REINA_SITE_CORDOBA_SPAIN_19-_20_MAY_2014 (accessed on 8 October 2019).
  47. Latorre, C.; Camacho, F.; Cruz, F.; Atienzar, F. Vegetation Field Data and Production of Ground-Based Maps: “Las Tiesas—Barax site, Albacete, Spain” 29th–30th May 2014. Available online: https://www.researchgate.net/publication/282124254_Vegetation_field_data_and_production_of_ground-based_maps_LAS_TIESAS_-_BARRAX_SITE_ALBACETE_SPAIN_29th-_30th_May_2014 (accessed on 8 October 2019).
  48. Latorre, C.; Camacho, F.; Piñó, M.C.; Cruz, F. Vegetation Field Data and Production of Ground-Based Maps: “Las Tiesas—Barax Site, Albacete, Spain” 27th May and 22nd July 2015. Available online: https://www.researchgate.net/publication/298790723_Vegetation_Field_Data_and_Production_of_Ground-Based_Maps_Las_Tiesas-BARRAX_site_Albacete_Spain_27th_May_and_22nd_July_2015 (accessed on 8 October 2019).
  49. Camacho, F.; Vinué, D. Ground Data Processing & Production of High-Resolution Biophysical Maps: “Las Tiesas—Barax Site, Albacete, Spain” 6th May and 5th June 2016. Available online: https://www.researchgate.net/publication/340078415_Ground_Data_Processing_Production_of_High-Resolution_Biophysical_Maps_Las_Tiesas-Barax_Site_Albacete_Spain_6th_May_and_5th_June_2016(accessed on 8 October 2019).
  50. Sendra, V.; Latorre, C.; Camacho, F.; Sánchez, J.; García Haro, J.; Campos-Taberner, M.; Martínez, B. Vegetation Field Data and Production of Ground-Based Maps: “Albufera Site, Valencia, Spain” June–August 2014. Available online: https://www.researchgate.net/publication/304152122_Vegetation_Field_Data_and_Production_of_Ground-Based_Maps_Albufera_site_Valencia_-_Spain_June-August_2014 (accessed on 8 October 2019).
  51. Latorre, C.; Camacho, F.; Pattey, E. Vegetation Field Data and Production of Ground-Based Maps: “Ottawa Site, Canada” May to August 2014. Available online: https://www.researchgate.net/publication/298790768_Vegetation_Field_Data_and_Production_of_Ground-Based_Maps_Ottawa_site_Canada_May_to_August_2014 (accessed on 8 October 2019).
  52. Latorre, C.; Camacho, F.; Castrignanò, A.; Benedetto, D.; Stellacci, A.M.; Ventrella, D.; Campi, P.; Rinaldi, M.; Maddaluno, C.; Mucci, M.; et al. Vegetation Field Data and Production of Ground-Based Maps: “Capitanata Site, Italy” 18th March and 13th May, 2014. Available online: https://www.researchgate.net/publication/304151758_Vegetation_Field_Data_and_Production_of_Ground-Based_Maps_Capitanata_site_Italy_Multi-temporal_campaign_18th_March_and_13th_May_2014 (accessed on 8 October 2019).
  53. Latorre, C.; Camacho, F.; Mattar, C.; Santamaría-Artigas, A.; Leiva-Büchi, N. Vegetation Field Data and Production of Ground-Based Maps: “San Fernando Site, Chile” 19th January 2015. Available online: https://www.researchgate.net/publication/279852726_Vegetation_field_data_and_production_of_ground_based_maps_San_Fernando_site_Chile_19th_January_2015_i100 (accessed on 8 October 2019).
  54. Latorre, C.; Camacho, F.; Piñó, M.C.; Nestola, E.; Calfapietra, C.; Matteucci, G. Vegetation Field Data and Production of Ground-Based Maps: “Collelongo Site, Selvapiana, Italy” 8th July and 25th September 2015. Available online: https://www.researchgate.net/publication/303843874_Vegetation_Field_Data_and_Production_of_Ground-Based_Maps_Collelongo_site_-_Selvapiana_Italy_8th_July_and_25th_September_2015 (accessed on 8 October 2019).
  55. Camacho, F.; Latorre, C.; Cordingley, J.; Bossio, D.; Nganga, K.W.; Gicheha, J. Vegetation Field Data and Production of Ground-Based Maps: “Maragua Site (Upper Tana Basin), Kenya” 8th March 2016. Available online: https://www.researchgate.net/publication/304151992_Vegetation_Field_Data_and_Production_of_Ground-Based_Maps_Maragua_siteUpper_Tana_Basin_Kenya_8th_March_2016 (accessed on 8 October 2019).
  56. Camacho, F.; Vinué, D. Ground data Processing & Production of High-Resolution Biophysical Maps: “Liria Site, Spain” 9th February 2017. Available online: https://www.researchgate.net/publication/322952997_Ground_data_processing_production_of_high_resolution_biophysical_maps_Liria_Spain_9th_February_2017 (accessed on 8 October 2019).
  57. Fuster, B.; Camacho, F.; Vinué, D. Ground Data Processing & Production of High-Resolution Biophysical Maps: “Moncada Site, Spain” 22nd May, 18th July and 8th November 2017. Available online: https://www.researchgate.net/publication/324247280_Ground_data_processing_production_of_the_high_resolution_biophysical_maps_Moncada_site_-_Spain (accessed on 8 October 2019).
  58. Camacho, F.; Latorre, C.; Roujean, J.L. Vegetation Field Data and Production of Ground-Based Maps: “Ahspect Campaign, South-West, France” 22nd–25th June 2015. Available online: https://www.researchgate.net/publication/298723027_Vegetation_Field_data_and_Production_of_Ground-Based_Maps_AHSPECT_multi-site_campaign_South_West_France_22nd_-_25th_June_2015 (accessed on 8 October 2019).
  59. Li, W.; Baret, F.; Weiss, M.; Buis, S.; Lacaze, R.; Demarez, V.; Dejoux, J.; Battude, M.; Camacho, F. Combining hectometric and decametric satellite observations to provide near real time decametric FAPAR product. Remote Sens. Environ. 2017, 200, 250–262. [Google Scholar] [CrossRef]
  60. Mira, M.; Weiss, M.; Baret, F.; Courault, D.; Hagolle, O.; Gallego-Elvira, B.; Olioso, A. The MODIS (collection V006) BRDF/albedo product MCD43D: Temporal course evaluated over agricultural landscape. Remote Sens. Environ. 2015, 170, 216–228. [Google Scholar] [CrossRef] [Green Version]
  61. Nestola, E.; Sánchez-Zapero, J.; Latorre, C.; Mazzenga, F.; Matteucci, G.; Calfapietra, C.; Camacho, F. Validation of PROBA-V GEOV1 and MODIS C5 & C6 fAPAR Products in a Deciduous Beech Forest Site in Italy. Remote Sens. 2017, 9, 126. [Google Scholar] [CrossRef] [Green Version]
  62. Harper, W.V. Reduced Major Axis Regression: Teaching Alternatives to Least Squares. In Proceedings of the ICOTS 9 International Conference on the Teaching of Statistics, Flagstaff, AZ, USA, 13–18 July 2014; Available online: https://digitalcommons.otterbein.edu/math_fac/24 (accessed on 8 October 2019).
  63. GCOS-154. Systematic Observation Requirements for Satellite-Based Products for Climate Supplemental Details to the Satellite-Based Component of the Implementation Plan for the Global Observing System for Climate in Support of the UNFCCC–2011 Update; WMO: Geneva, Switzerland, 2011. [Google Scholar]
  64. Tao, X.; Shulnlin, L.; Wang, D. Assessment of five global satellite products of fraction of absorbed photosynthetically active radiation: Intercomparison and direct validation against ground-based data. Remote Sens. Environ. 2015, 163, 270–285. [Google Scholar] [CrossRef]
  65. D’Odorico, P.; Gonsamo, A.; Pinty, B.; Gobron, N.; Coops, N.; Mendez, E.; Schaepman, M.E. Intercomparison of fraction of absorbed photosynthetically active radiation products derived from satellite data over Europe. Remote Sens. Environ. 2014, 142, 141–154. [Google Scholar] [CrossRef]
  66. Martínez, B.; Camacho, F.; Verger, A.; García-Haro, F.J.; Gilabert, M.A. Intercomparison and quality assessment of MERIS, MODIS and SEVIRI FAPAR products over the Iberian Peninsula. Int. J. Appl. Earth Obs. Geoinf. 2013, 21, 463–476. [Google Scholar] [CrossRef]
  67. Geolocation Accuracy of PROBA-V. Available online: http://proba-v.vgt.vito.be/en/quality/platform-status-information/geolocation-accuracy (accessed on 27 January 2020).
  68. Campos-Taberner, M.; García-Haro, F.; Busetto, L.; Ranghetti, L.; Martínez, B.; Gilabert, M.A.; Camps-Valls, G.; Camacho, F.; Boschetti, M. A Critical Comparison of Remote Sensing Leaf Area Index Estimates over Rice-Cultivated Areas: From Sentinel-2 and Landsat-7/8 to MODIS, GEOV1 and EUMETSAT Polar System. Remote Sens. 2018, 10, 763. [Google Scholar] [CrossRef] [Green Version]
  69. Fang, H.; Zhang, Y.; Wei, S.; Li, W.; Ye, Y.; Sun, T.; Liu, W. Validation of global moderate resolution leaf area index (LAI) products over croplands in northeastern China. Remote Sens. Environ. 2019, 233, 111377. [Google Scholar] [CrossRef]
  70. Mu, X.; Huang, S.; Ren, H.; Yan, G.; Song, W.; Ruan, G. Validating GEOV1 Fractional Vegetation Cover Derived from Coarse-Resolution Remote Sensing Images Over Cropland. IEEE J. Sel. Top. Appl. Earth Obs. Remote Sens. 2015, 8, 439–446. [Google Scholar] [CrossRef]
  71. Fiducial Reference Measurement for Vegetation (FRM4Veg) Site. Available online: https://frm4veg.org/ (accessed on 27 January 2020).
  72. Ground-Based Observations for Validation (GBOV) of Copernicus Global Land Products Site. Available online: https://land.copernicus.eu/global/gbov (accessed on 27 January 2020).
  73. Loew, A.; Bennartz, R.; Fell, F.; Lattanzio, A.; Doutriaux-Boucher, M.; Schulz, J. A database of global reference sites to support validation of satellite surface albedo datasets (SAVS 1.0). Earth Syst. Sci. Data 2016, 8, 425–438. [Google Scholar] [CrossRef]
  74. Fell, F.; Bennartz, R.; Loew, A. Validation of the EUMETSAT Geostationary Surface Albedo Climate Data Record -2- (ALBEDOVAL-2). Available online: https://www.eumetsat.int/website/home/Data/TechnicalDocuments/index.html (accessed on 4 November 2019).
Figure 1. Global distribution of leaf area index (LAI) values from CGLS PROBA-V Collection 300 m V1 for 20th June 2017.
Remotesensing 12 01017 g001
Figure 2. LAI residual map between PROBA-V Collection 300 m V1 and Collection 1 km V1 (a), Collection 1 km V2 (b), and MODIS C6 (c) for 20th June 2017.
Remotesensing 12 01017 g002
Figure 3. Example of temporal profiles (Jan 16–Dec 17) of PROBA-V Collection 300 m V1 and reference products (PROBA-V Collection 1 km V1, PROBA-V Collection 1 km V2 and MODIS15A2 C6) for sites corresponding to evergreen broadleaved forest (a), deciduous broadleaved forest (b), needle-leaf forest (c), cultivated (d), herbaceous (e) and bare areas (f).
Remotesensing 12 01017 g003
Figure 4. Scatterplots between different pairs of LAI (ac), fAPAR (df) and fCOVER (g,h) PROBA-V Collection 300 m V1 and reference satellite products (PROBA-V Collection 1 km V1 (a,d,g), PROBA-V Collection 1 km V2 (b,e,h) and MODIS C6 (c,f) computed over all LANDVAL sites for the 2016-2017 period. Statistics of the comparisons are reported in Table 5, Table 6 and Table 7.
Remotesensing 12 01017 g004
Figure 5. Boxplots of inter-annual absolute differences (year 2017 versus year 2016) of the 5th and 95th percentiles of the PROBA-V Collection 300 m V1 LAI (a), fAPAR (b) and fCOVER (c) products over LANDVAL sites. Red bars indicate median values, and the green line corresponds to the median absolute anomalies for all LAI, fCOVER and fAPAR ranges.
Remotesensing 12 01017 g005
Figure 6. Histograms of the delta function for LAI (a), and fAPAR (b) by the PROBA-V Collection 300 m V1 (blue), PROBA-V Collection 1 km V1 (purple), PROBA-V Collection 1 km V2 (red) and MODIS C6 (green) products over LANDVAL sites from 2016 to 2017.
Remotesensing 12 01017 g006
Figure 7. PROBA-V Collection 300 m V1 products against ground-based maps for LAI (a), fAPAR (b) and fCOVER (c). Numbers identify the ground data. Dashed lines correspond to the 1:1 line and optimal and target requirements, and the red line corresponds to the linear fit using Major Axis Regression (MAR). Each point represents the mean value, and error bars correspond to the standard deviation. Numbers identify the sample (Table 2), and colours identify the site. Statistics of the comparisons are reported in Table 9.
Remotesensing 12 01017 g007
Figure 8. Comparison of the satellite LAI products (Collection 300 m V1 (a), Collection 1 km V1 (b), Collection 1 km V2 (c) and MODIS C6 (d)) with ground-based maps. Numbers indicate the sample (Table 2) and colours indicate the site (legend in Figure 10). Dashed lines correspond to the 1:1 line and optimal and target requirements, and the red line corresponds to the linear fit using MAR.
Remotesensing 12 01017 g008
Figure 9. Comparison of satellite fAPAR products (Collection 300 m V1 (a), Collection 1 km V1 (b), Collection 1 km V2 (c) and MODIS C6 (d)) with ground-based maps. Numbers indicate the sample (Table 4), and colours indicate the site (legend in Figure 10). Dashed lines correspond to the 1:1 line and optimal and target requirements, and the red line corresponds to the linear fit using MAR.
Remotesensing 12 01017 g009
Figure 10. Comparison of the satellite fCOVER products (Collection 300 m V1 (a), Collection 1 km V1 (b) and Collection 1 km V2 (c)) with ground-based maps. Numbers indicate the sample, and colours indicate the site (Table 2). Dashed lines correspond to the 1:1 line and optimal and target requirements, and the red line corresponds to the linear fit using MAR.
Remotesensing 12 01017 g010
Table 1. Quality flag information used to filter low quality or invalid pixels.
ProductQuality Flag
PROBA-V Collection 1 km V1Sea (bit 1), Snow (bit 2), Input status out of range or invalid (bit 6), Output status out of range or invalid (bits 7,8,9), B2 saturated (bit 10), B3 saturated (bit 11).
PROBA-V Collection 1 km V2Sea (bit 1), Filled (bit 3), Input status out of range or invalid (bit 6), Output status out of range or invalid (bits 7,8,9).
MODIS C6Cloud state not clear (bit 4, 5 -FparLai), Main method failed or could not retrieve pixel value (bit 6, 7, 8 -FparLai). Shore, freshwater, ocean (bit 1, 2 - FparExtra), Cirrus detected (bit 5 - FparExtra)
Table 2. Characteristics of the validation sites and associated ground biophysical values over an area of 3 km × 3 km.
SiteCountryLat
(deg)
Lon
(deg)
Land CoverSampleDates
(mm/yyyy)
LAIfAPARfCOVERReference
PshenichneUkraine50.0730.23Crops#106/20142.140.640.55[41]
#207/20142.760.700.68
#306/20152.360.580.46[42]
#407/20152.610.690.62
#507/20152.120.560.53
MerguellilTunisia35.56629.9122Crops#601/20140.18*N/AN/A[43]
#704/20140.93*N/AN/A
25Mayo_1Argentina−37.9065−67.7459Crops#802/20141.300.390.32[44]
25Mayo_2Argentina−37.9389−67.7890Shrub#902/20140.420.190.16
RosascoItaly45.2538.562Crops
(Rice)
#1007/20144.20.85N/A[45]
LaReinaSpain37.8189−4.8624Crops#1105/20141.080.300.29[46]
BarraxSpain39.0544−2.1007Crops#1205/20142.550.360.37[47]
#1305/20151.010.290.27[48]
#1407/20150.830.230.22
#1503/2016N/A0.290.26[49]
#1607/20160.46*0.130.13
AlbuferaSpain39.2744−0.3164Crops
(Rice)
#1706/20140.580.210.18[50]
#1806/20141.510.46N/A
#1907/20143.770.73N/A
#2008/20145.780.85N/A
OttawaCanada45.3056−75.7673Crops#2106/20141.03*N/A0.39[51]
#2206/20141.46*N/A0.48
#2307/20141.82*N/A0.49
#2407/20142.79*N/A0.79
CapitanataItaly41.463715.4867Crops#2503/20141.820.56N/A[52]
#2605/20143.08N/AN/A
#2704/20153.490.76N/A
San FernandoChile−34.7227−71.0019Crops#2801/20151.960.430.44[53]
CollelongoItaly41.850013.5900DBF#2907/20154.580.870.84[54]
#3009/20153.860.870.86
MaraguaKenya−0.772036.9742Crops#3103/20161.880.600.59[55]
LiriaSpain39.7519−0.7005NLF#3202/20171.030.340.27[56]
MoncadaSpain39.5204−0.38697Crops#3305/20171.180.290.27[57]
#3407/20171.250.250.27
#3511/20170.470.220.17
Ahspect-MTOFrance43.57281.3745Crops#3606/20150.850.280.26[58]
Ahspect-PEYFrance43.66620.2195Crops#3706/20151.330.410.38
Ahspect-URGFrance43.6397−0.4340Crops#3806/20152.010.600.55
Ahspect-CREFrance43.9936−0.0469Crops#3906/20152.170.630.59
Ahspect-CONFrance43.97430.3360Crops#4006/20151.160.360.33
Ahspect-SAVFrance43.82421.1749Crops#4106/20150.990.310.29
(*) LAIeff values (no actual LAI was provided).
Table 3. Metrics computed for product validation, either comparison with ground measurements or intercomparisons of satellite products; x stands for the reference, and y stands for the estimated data.
StatisticsInterpretation
N: Number of samplesIndicative of the power of the validation.
RMSD: Root Mean Square DeviationOverall Uncertainty.
Relative   values   between   the   average   of   x   and   y   were   also   computed .   R e l a t i v e   R M S D   ( % ) = 100 R M S D m e a n   ( x , y )
B: Mean BiasDifference between the average values of x and y. Indicative of accuracy.
Relative   values   between   the   average   of   x   and   y   were   also   computed .   R e l a t i v e   b i a s ( % ) = 100 b i a s m e a n   ( x , y )
S: Standard deviation Standard deviation of the pair differences. Indicates precision.
R: Correlation coefficientIndicates the strength of the relationship between two variables. The Pearson coefficient was used.
Major Axis Regression (slope, offset)Indicates bias.
Uncertainty requirements (%)Percentage of pixels meeting the CGLS or GCOS requirements.
p-valueTest to determine whether the slope is significantly different from 1 (p < 0.05).
Table 4. Uncertainty requirements considered for LAI, fAPAR and fCOVER.
OptimalTargetThreshold
LAI15%1Max (0.5, 20%)Max (0.75, 25%)
fAPAR / fCOVER5%Max (0.05, 10%)1Max (0.1, 20%)
1 GCOS requirement.
Table 5. LAI PROBA-V Collection 300 m V1 versus reference validation metrics computed over all LANDVAL sites for the 2016–2017 period. Relative values (%) are shown in brackets.
LAI PROBA-V
Collection 300 m V1 versus
PROBA-V
Collection 1 km V1
PROBA-V
Collection 1 km V2
MOD15A2H C6
N264803877033065
Correlation (R)0.980.980.95
Bias0.04 (3.4%)−0.03 (2.5%)0.016 (1.3%)
RMSD0.36 (29.3%)0.31 (25.1%)0.53 (41.9%)
Intercept (MAR)−0.050.010.01
Slope (MAR)1.080.971.00
p-value<0.001<0.0010.001
Table 6. fAPAR PROBA-V Collection 300 m V1 versus reference validation metrics computed over all LANDVAL sites for the 2016–2017 period. Relative values (%) are shown in brackets.
fAPAR PROBA-V
Collection 300 m V1 versus
PROBA-V
Collection 1 km V1
PROBA-V
Collection 1 km V2
MOD15A2H C6
N264803852833065
Correlation (R)0.980.990.97
Bias−0.02 (6.6%)−0.009 (2.7%)−0.03 (9.5%)
RMSD0.06 (16.9%)0.04 (13.9%)0.08 (23.6%)
Intercept (MAR)−0.01−0.01−0.04
Slope (MAR)0.960.991.02
p-value<0.0010.001<0.001
Table 7. fCOVER PROBA-V Collection 300 m V1 versus reference validation metrics computed over all LANDVAL sites for the 2016–2017 period. Relative values (%) are shown in brackets.
fCOVER PROBA-V
Collection 300 m V1 versus
PROBA-V
Collection 1 km V1
PROBA-V
Collection 1 km V2
N2645737606
Correlation (R)0.990.99
Bias<0.001 (0.1%)0.012 (4.0%)
RMSD0.05 (16.6%)0.05 (17.8%)
Intercept (MAR)0.00-0.01
Slope (MAR)0.991.07
p-value0.001<0.001
Table 8. Inter-annual median absolute difference (year 2017 versus year 2016) of PROBA-V Collection 300 m V1, Collection 1 km V1 and V2 and MODIS C6 LAI, fAPAR and fCOVER products over LANDVAL sites. Relative values (%) are shown in brackets.
PROBA-V
Collection 300 m V1
PROBA-V
Collection 1 km V1
PROBA-V
Collection 1 km V2
MOD15A2H C6
LAI0.070 (4.4%)0.081 (5.3%)0.048 (2.9%)0.102 (6.7%)
fAPAR0.018 (5.1%)0.018 (4.7%)0.011 (2.9%)0.025 (6.7%)
fCOVER0.017(4.8%)0.019 (5.3%)0.012 (3.5%)-
Table 9. Accuracy assessment statistics for PROBA-V Collection 300 m V1 products. Relative values (%) are shown in brackets.
LAIfAPARfCOVER
N171516221335
Correlation (R)0.850.910.89
Bias0.36 (15.5%)0.05 (10.3%)0.16 (32.2%)
RMSD1.01 (44.3%)0.12 (22.2%)0.21 (42.6%)
Intercept (MAR)−0.070.080.04
Slope (MAR)1.200.941.28
p-value<0.0010.001<0.001
Table 10. Compliance matrix (%) of PROBA-V Collection 300 m V1 products against CGLS uncertainty requirements.
LAIfAPARfCOVER
Optimal29.0119.26.9
Target58.135.7113.3
Threshold69.162.529.7
1GCOS requirements.
Table 11. Accuracy assessment with ground measurements statistics for different satellite LAI products at 3 km spatial resolution. Relative values (%) are shown in brackets.
Ground Data VersusPROBA-V Collection 300 m V1PROBA-V Collection 1 km V1PROBA-V Collection 1 km V2MOD15A2H C6
N33333333
Correlation (R)0.820.860.820.81
Bias0.5 (20.4%)0.4 (16.9%)0.6(23.7%)0.16 (7.5%)
RMSD1.06 (46.1%)0.86 (38.2%)1.10 (47.2%)0.91 (42.2%)
Intercept (MAR)−0.16−0.01−0.08−0.23
Slope (MAR)1.311.191.311.19
p-value0.0770.1210.0550.221
Table 12. Accuracy assessment with ground measurements statistic for different satellite fAPAR products at 3 km spatial resolution. Relative values (%) are shown in brackets.
Ground Data VersusPROBA-V Collection 300 m V1PROBA-V Collection 1 km V1PROBA-V Collection 1 km V2MOD15A2H C6
N34343434
Correlation (R)0.920.930.910.91
Bias0.06 (12.5%)0.11 (21.2%)0.11 (20.7%)0.10 (18.8%)
RMSD0.11 (21.3%)0.14 (25.8%)0.14 (26.8%)0.14 (25.8%)
Intercept (MAR)0.080.150.120.13
Slope (MAR)0.960.930.990.93
p-value0.5870.2500.8160.247
Table 13. Accuracy assessment with ground measurement statistics for different satellite fCOVER products at 3 km spatial resolution. Relative values (%) are shown in brackets.
Ground Data VersusPROBA-V Collection 300 m V1PROBA-V Collection 1 km V1PROBA-V Collection 1 km V2
N323232
Correlation (R)0.900.910.89
Bias0.16 (32.8%)0.16 (31.4%)0.13 (26.8%)
RMSD0.19 (39.0%)0.19(37.9%)0.16 (33.7%)
Intercept (MAR)0.080.050.10
Slope (MAR)1.201.251.08
p-value0.0760.0290.399

