Article

Radiometric Cross-Calibration of the Wide Field View Camera Onboard GaoFen-6 in Multispectral Bands

1
State Key Laboratory of Remote Sensing Science, Aerospace Information Research Institute, Chinese Academy of Sciences, Beijing 100101, China
2
China Centre for Resources Satellite Data and Application, Beijing 100094, China
3
Changchun Institute of Optics, Fine Mechanics and Physics, Chinese Academy of Sciences, Changchun 130033, China
*
Author to whom correspondence should be addressed.
Submission received: 10 March 2020 / Revised: 20 March 2020 / Accepted: 20 March 2020 / Published: 24 March 2020
(This article belongs to the Special Issue Quality Improvement of Remote Sensing Images)

Abstract

:
GaoFen6 (GF-6), successfully launched on June 2, 2018, is the sixth satellite of the High-Definition Earth observation system (HDEOS). Although GF-6 is the first high-resolution satellite in China to achieve precise agricultural observation, it will be widely used in many other domains, such as land survey, natural resources management, emergency management, ecological environment and so on. The GF-6 was not equipped with an onboard calibration instrument, so on-orbit radiometric calibration is essential. This paper aimed at the on-orbit radiometric calibration of the wide field of view camera (WFV) onboard GF-6 (GF-6/WFV) in multispectral bands. Firstly, the radiometric capability of GF-6/WFV is evaluated compared with the Operational Land Imager (OLI) onboard Landsat-8, Multi Spectral Instrument (MSI) onboard Sentinel-2 and Moderate Resolution Imaging Spectroradiometer (MODIS) onboard Terra, which shows that GF-6/WFV has an obvious attenuation. Consequently, instead of vicarious calibration once a year, more frequent calibration is required to guarantee its radiometric consistency. The cross-calibration method based on the Badain Jaran Desert site using the bi-directional reflectance distribution function (BRDF) model calculated by Landsat-8/OLI and ZY-3/Three-Line Camera (TLC) data is subsequently applied to GF-6/WFV and much higher frequencies of calibration are achieved. Finally, the cross-calibration results are validated using the synchronized ground measurements at Dunhuang test site and the uncertainty of the proposed method is analyzed. The validation shows that the relative difference of cross-calibration is less than 5% and it is satisfied with the requirements of cross-calibration.

Graphical Abstract

1. Introduction

On June 2, 2018, Gaofen-6 (GF-6) was successfully launched at Jiuquan Satellite Launch Center. GF-6 is a low-earth orbit optical remote sensing satellite and the first high-resolution satellite in China to achieve precise agricultural observation. So far, six satellites (GF-1~GF-6) have been launched based on the China High-Definition Earth observation system (HDEOS). GF-6 has the characteristics of high resolution, wide coverage and high-quality imaging. GF-6 loaded very similar imaging systems with GF-1, therefore networking of both GF-1 and GF-6 can achieve a higher frequent observation and it is therefore widely used in many other domains, such as natural resources, emergency management, ecological environment and so on. GF-6 is designed for an 8-year life time, which could ensure the continuous and stable supply capability of high spatio-temporal earth observation data.
GF-6 is equipped with a panchromatic/multi-spectral high-resolution camera (PMS) and a multi-spectral medium resolution wide field view (WFV) camera. The observation width of the PMS is 90 km, while the WFV has a wide swath up to 800 km. GF-6/WFV with 16m resolution has 8 bands, including one costal band (400~450 nm), three visible bands (450~520 nm, 520~590 nm and 630~690 nm), one yellow band (590~630 nm), two red-edge bands (690~730 nm and 730~770 nm), one near-infrared (NIR) band (770–890 nm). GF-6/PMS contains one panchromatic band with 2 m resolution and four multispectral bands with 8 m resolution. The detail technical indicators of PMS and WFV are shown in Table 1 (including spectral type, spectral range, spatial resolution, swath width and side swing). The revisiting period of GF-6 or GF-1 is 4 days, while the cooperation of the two satellites could cover the world once every 2 days in 16 m resolution. The details can be referred to in Table 1.
For the first time, GF-6 has realized the localization of 8-band Complementary Metal Oxide Semiconductor (CMOS) detector in China, and it is also the first practice to add the "red-edge" bands on high-resolution sensor which can effectively capture the specific spectral characteristics of crops. GF-6 breaks through the single projection center ultra-large field of view imaging technology, resolves the problems of high-time imaging, overseas imaging, weak multi-target imaging ability, and improves the image quality of large field of view camera. The technical indicators of GF-6 in detection spectrum, image quantization bits and side swing angle have reached the leading position in China and advanced in the world.
Like most land observation satellites in China (HJ-1, GF-1, GF-4, etc.), GF-6 also lacks on-board calibration equipment, so on-orbit vicarious calibration is the major way to do radiometric calibration. The Working Group on Calibration and Validation of the Committee on Earth Observation Satellites by the China Centre for Resources Satellite Data and Application (CRESDA) performs the vicarious calibration in Dunhuang calibration site for these sensors and publishes the calibration coefficients once a year through its official website (http://www.cresda.com). The vicarious calibration coefficients have been retrieved from an average of multiple observations during June to August of the year. Obviously, the radiometric performance of these sensors could be changed at any time of the year because attenuation in radiometric performance may occurs in the operation process in space. Thus, the annual vicarious calibration cannot meet the quantitative application requirements, and the calibration frequency of on-orbit sensors needs to be greatly increased.
Zhong et al. developed a method in 2014 in order to cross-calibrate the charge-coupled device (CCD) onboard HJ (HJ-1/CCD) [1]. In this method, a new site, named Badain Jaran Desert site, is established. Multi-angle dataset is built with the Landsat Enhanced Thematic Mapper (TM) plus (ETM+) data and slope and aspect from the Advanced Spaceborne Thermal Emission and Reflection Radiometer Global Digital Elevation Model (ASTER GDEM) product. Then the site’s BRDF is built based on the multi-angle dataset [1]. The method was performed for HJ-1/CCD in 2009, and the results were verified less than 5% error using ground measurements. In the following years, Yang et al. [2] updated the method in 2015. In the updated version, the vertical observation data from Landsat-8/Operational Land Imager (OLI) images and slope and aspect from ZY-3/TLC are used for fitting the BRDF model of the Badain Jaran Desert site instead of the Landsat-TM/ETM+ and ASTER GDEM data [2]. The new BRDF model has a high accuracy and more details. Then the updated method was used to cross-calibrate the GF-1/WFV [2] and GF-4/PMS [3]. The calibration results were validated by cross-comparing with synchronized OLI images in transit with WFV at Dunhuang test site. The synchronized image pair should satisfy: (1) transit on the same day, (2) transit time difference within half an hour, (3) the weather of the observation day is good and the sky is clean, (4) the view zenith difference is less than 15°. The validation results are proved to have a pretty high accuracy (less than 5% error), even better than the coefficients published by CRESDA [2,3].
This paper focuses on the on-orbit radiometric cross-calibration of GF-6/WFV in multispectral bands (1~4) (blue band, green band, red band and near infrared band). In order to show the necessity of cross calibration, radiometric capability of GF-6/WFV is evaluated by comparing with OLI onboard Landsat8, Multi Spectral Instrument (MSI) on Sentinel-2 and Moderate Resolution Imaging Spectroradiometer (MODIS) onboard Terra and Aqua. The cross-calibration method, which has been successfully applied to HJ-1/CCD, GF-1/WFV, GF-4/PMS [1,2,3], is employed to GF-6/WFV. This method still takes the Badain Jaran Desert as the calibration site and the nadir viewing Landsat-8/OLI and DEM products from ZY-3/Three-Line Camera (TLC) are combined to construct the calibration site’s bi-directional reflectance distribution function (BRDF). Based on the method, a much higher frequent cross-calibration is achieved finally and the cross-calibration results are validated using the synchronized ground measurements at Dunhuang test site. The validation shows that the relative difference of cross-calibration is less than 5% and it is satisfied with the requirements of cross-calibration.

2. Materials and Method

2.1. Study Area

2.1.1. Dunhuang Site

Dunhuang site is chosen as the evaluation reference site. It is located on Danghe alluvial fan about 20 km northwest of Dunhuang City, Gansu Province (Figure 1). Dunhuang site is the first national radiometric calibration site in China, and also an internationally calibration site recognized by the Committee on Earth Observation Satellites (CEOS) (https://calval.cr.usgs.gov/apps/test_sites_catalog). A flat ground without vegetation at an unpolluted region makes it highly stable and uniform (less than 2% variation over the 10 km * 10 km central region [4]). This site has been used to calibrate and validate many of China’s satellites, like FY series [5,6], CBERS series [7], HJ [8] and GF series [9,10]. In this study, Dunhuang site is only used for radiometric capability evaluation and validation purposes for two reasons: (1) routine ground campaigns have been carried out yearly during June to August and the synchronized ground measurements have subsequently been taken routinely; (2) the flat surface makes it impossible to construct BRDF characterization using nadir viewing Landsat8/OLI data.

2.1.2. Badain Jaran Desert Site

Badain Jaran Desert site is chosen as the cross-calibration site. The site is located at the Badain Jaran Desert in Central Inner Mongolia of Northern China (about 30 × 30 km or 1000 × 1000 pixels, shown in Figure 2). The homogeneity and stability of this area are assessed and proved qualified as a calibration site [1]. Furthermore, a dozen uncontaminated lakes are distributed in this area, which could be treated as dark objects (DO) [11] and used for atmospheric correction to obtain the aerosol optical depth (AOD) with high accuracy. Although this area is covered by sand and the topography is hilly, the sand hills are stable and have not moved in decades, which means the BRDF of this area is stable. The abundant slopes and aspects from the numerous sand hills could be helpful in fitting the BRDF model of this area.

2.2. Radiometric Capability Evaluation

The radiometric capability of GF-6/WFV can be evaluated by comparing top of atmosphere (TOA) reflectance in long time series with other sensors with good radiation performance. The MODIS onboard Terra and Aqua satellites is recognized as a well calibrated instrument with an absolute accuracy better than 2% [12,13,14,15], and also used as reference for radiometric cross-calibration and performance evaluation of other sensors [16,17]. However, the spatial resolution between MODIS (1km) and GF-6/WFV (16m) is quite different, which may affect the evaluation result. Landsat-8/OLI and Sentinel-2/MSI are two widely used medium resolution sensors. For Landsat-8/OLI, its drift is less than 0.1% per year measured by on-board calibrator lamps and diffusers, and the temporal uncertainty is better than 0.5% by trending over vicarious targets, like Pseudo Invariant Calibration Sites (PICS) [18,19]. The radiometric performance of Landsat-8 is also proved better than the previous Landsat generations [19]. As to Sentinel-2/MSI, a robust light calibration strategy is used, which made its radiometric absolute uncertainty is less than 5% and annual change estimate is less than 1% [20,21]. The Sentinel-2/MSI has a good radiometric performance on both accuracy and stability. In this study, MODIS, OLI and MSI are all chosen as the references to assess the radiometric performance of GF-6/WFV.
The TOA reflectance of GF-6/WFV can be calculated using Equation (1)
ρ λ = π L λ d 2 E S U N λ cos ( θ S Z )
L λ = D N × g a i n + b i a s
where ρ λ and L λ are the TOA reflectance and radiance of GF-6/WFV in band λ ; d is the distance between Sun and Earth at the observation time expressed in AU (Astronomical Unit) divided by the mean distance between Earth and SUN (1 AU), and it is a dimensionless quantity and changes with the image observation date; θ S Z is the solar zenith; E S U N λ is the solar irradiance at the top of atmosphere. For GF-6/WFV, the E S U N s are 1969.61 W m 2 μ m 1 in the blue band, 1852.80 W m 2 μ m 1 in the green band, 1557.53 W m 2 μ m 1 in the red band and 1073.29 W m 2 μ m 1 in the near infrared (NIR) band. L λ can be calculated using Equation (2), and its unit is W m 2 sr 1 μ m 1 ; D N is the digital read from the GF-6/WFV image; g a i n and b i a s are the coefficients. As of October 31, 2019, CRESDA has published only one set of calibration coefficients on February 1, 2019. This set of coefficients comes from ground measurements in the summer of 2018.
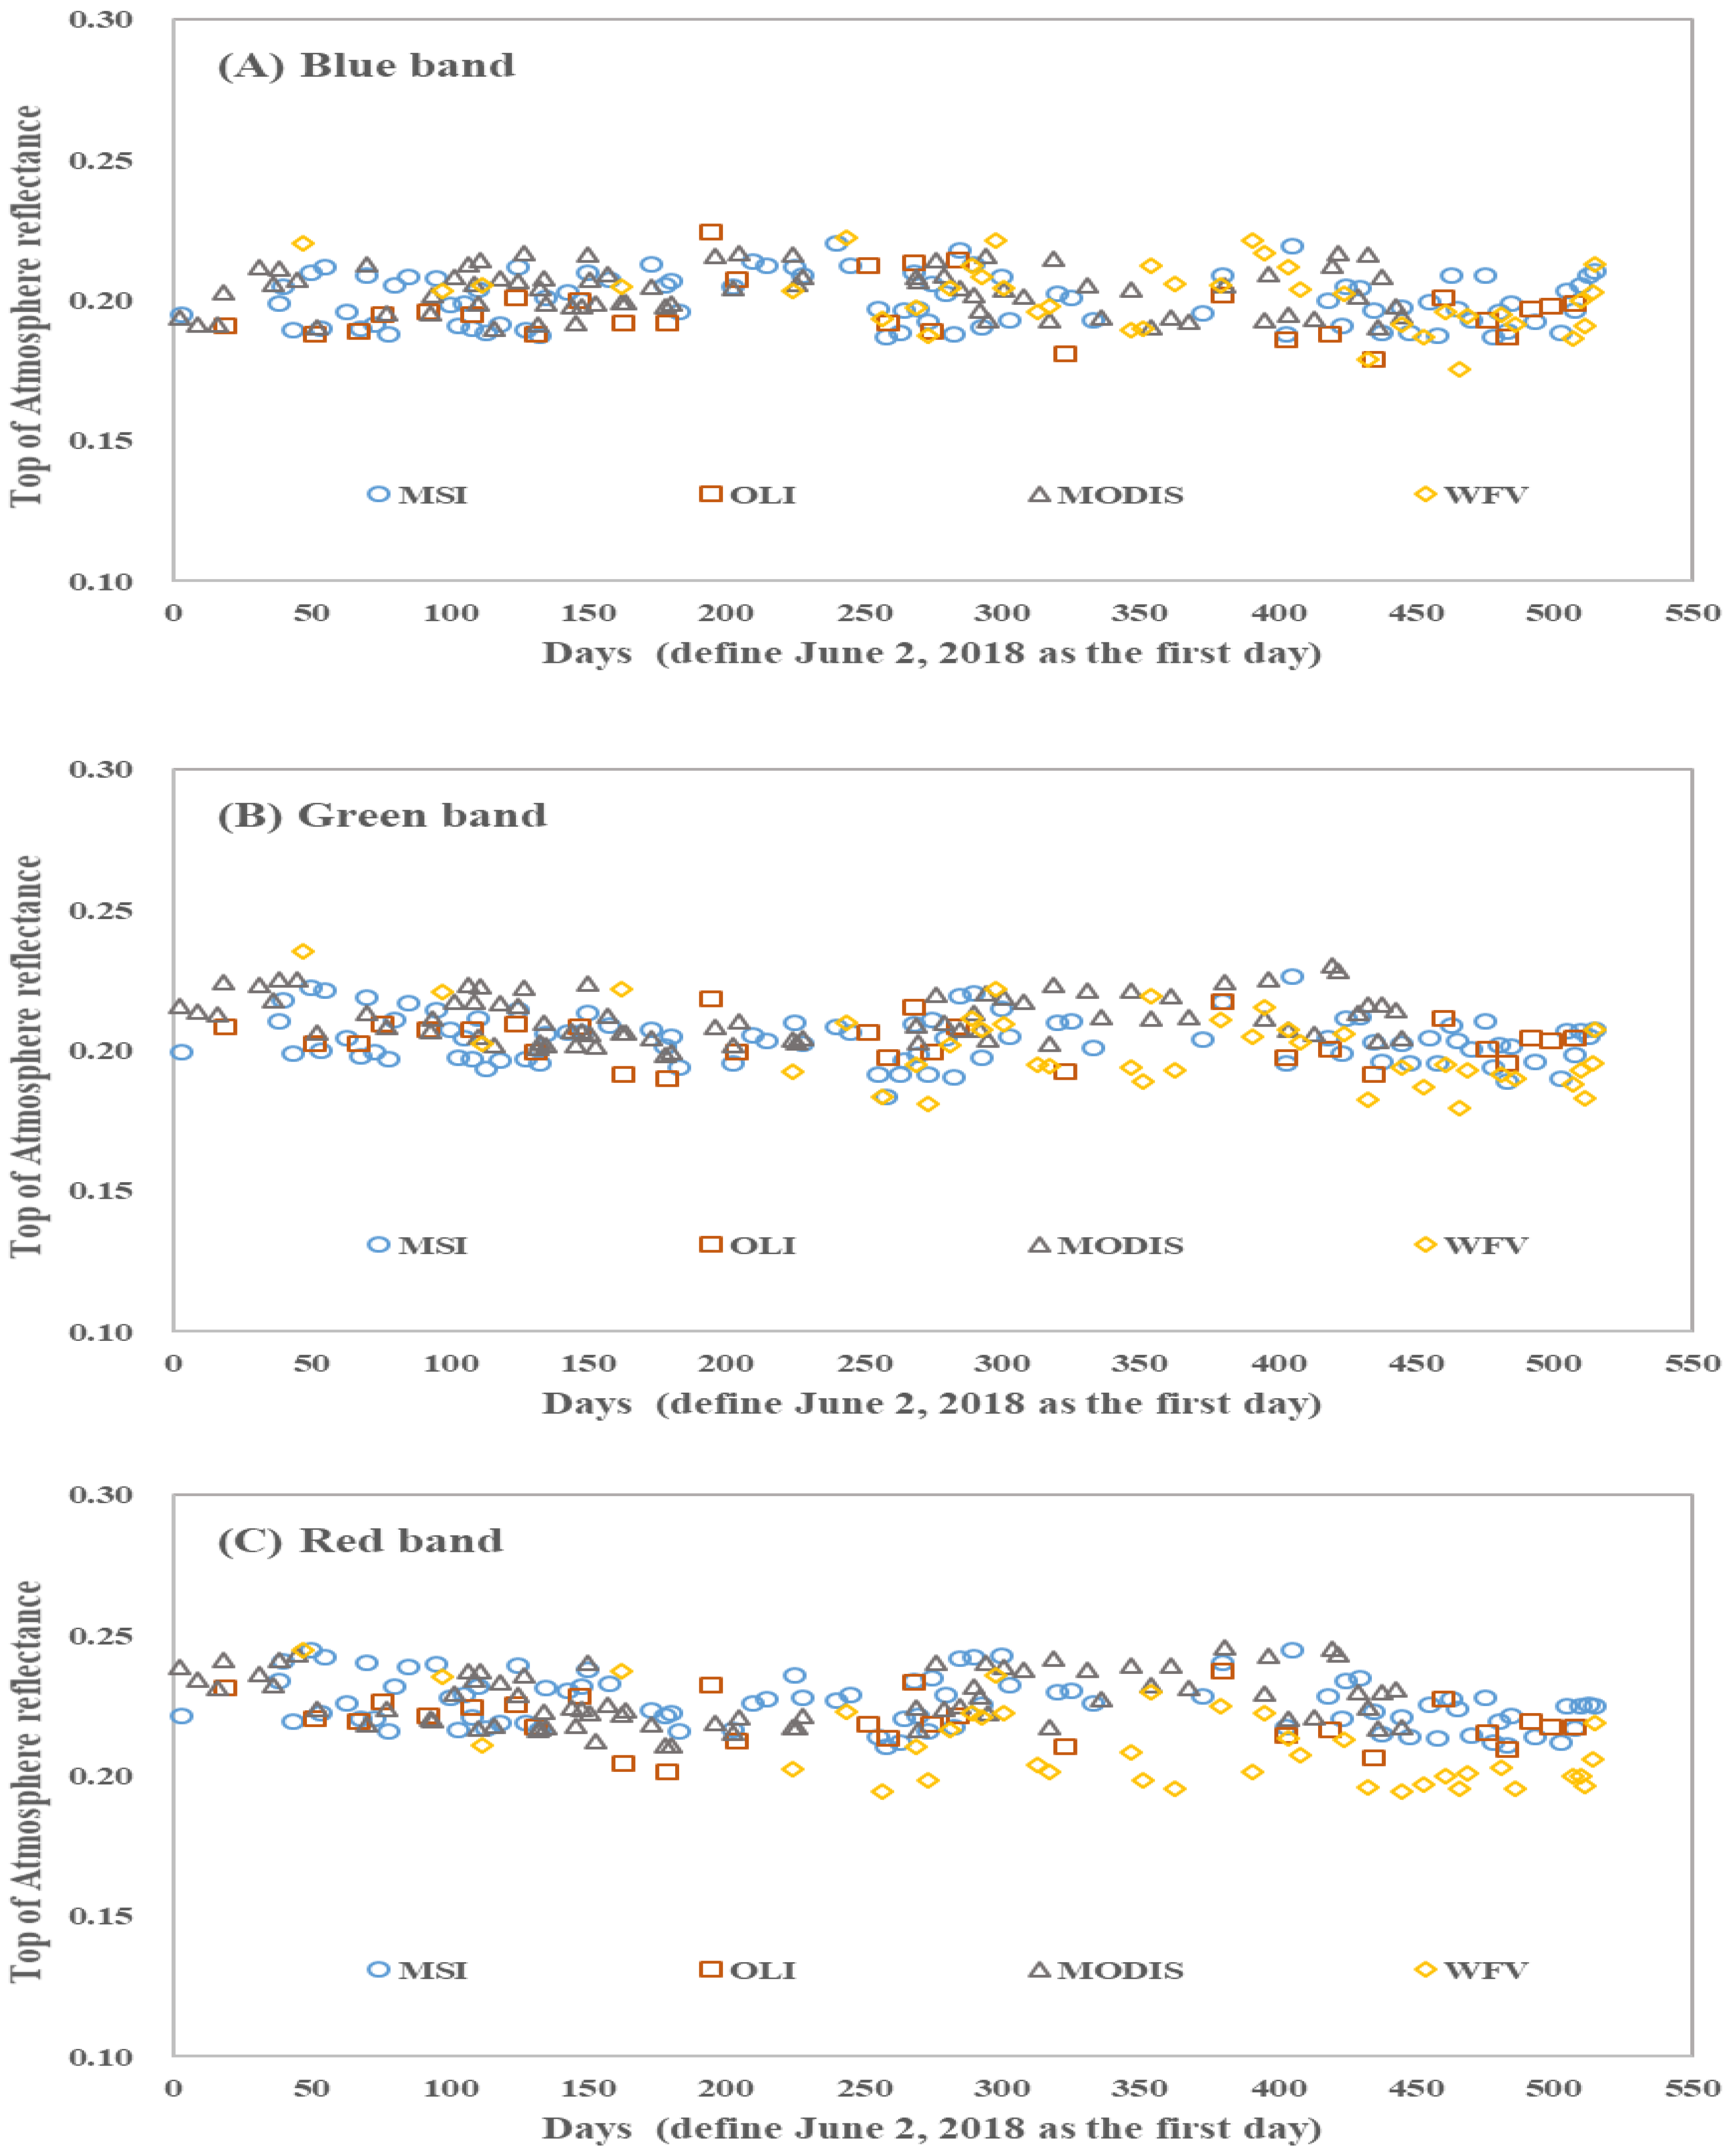
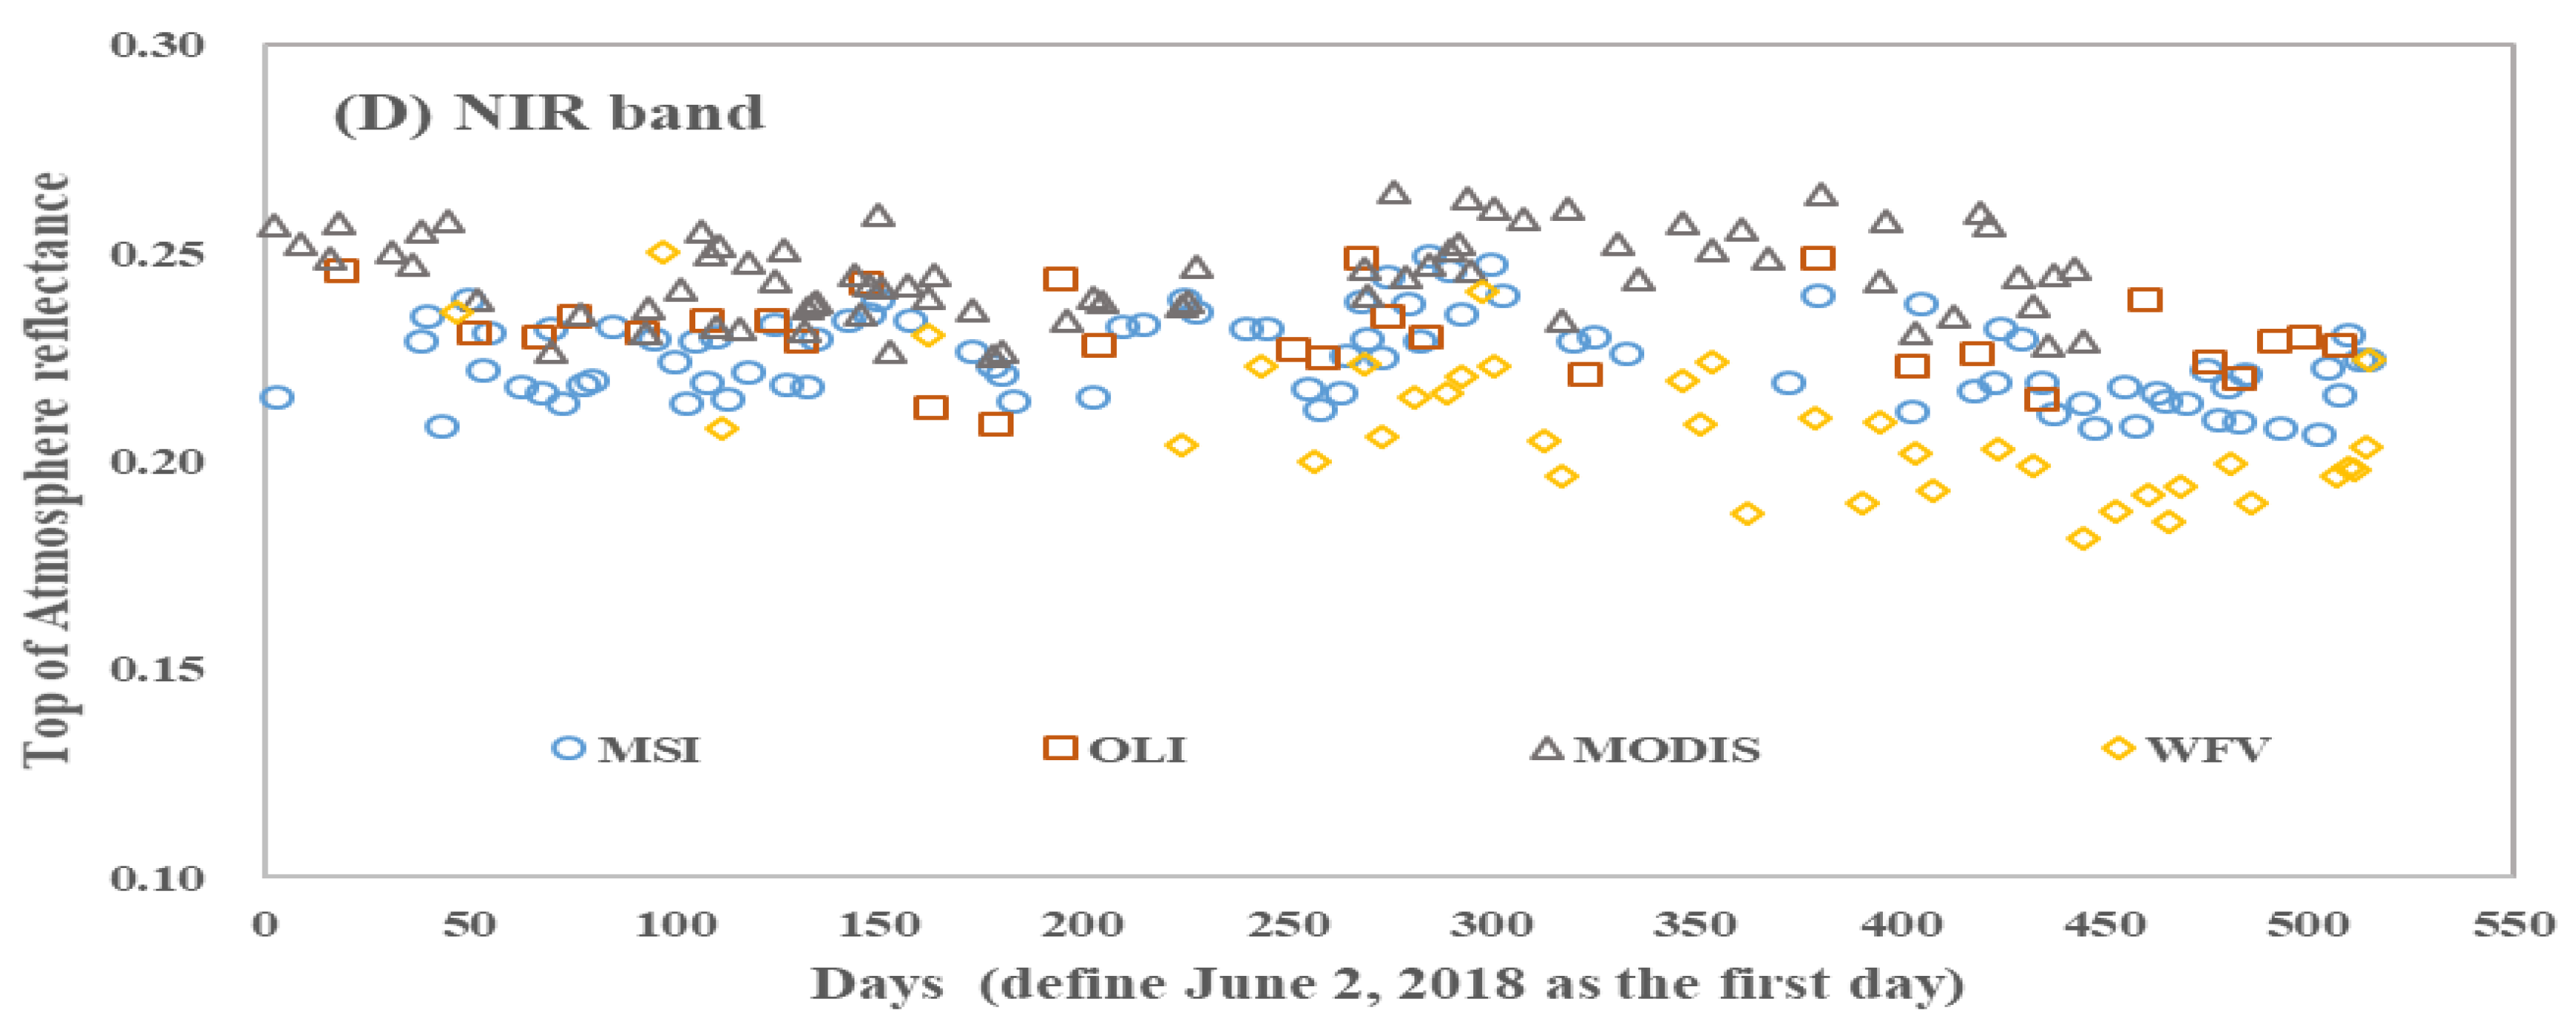
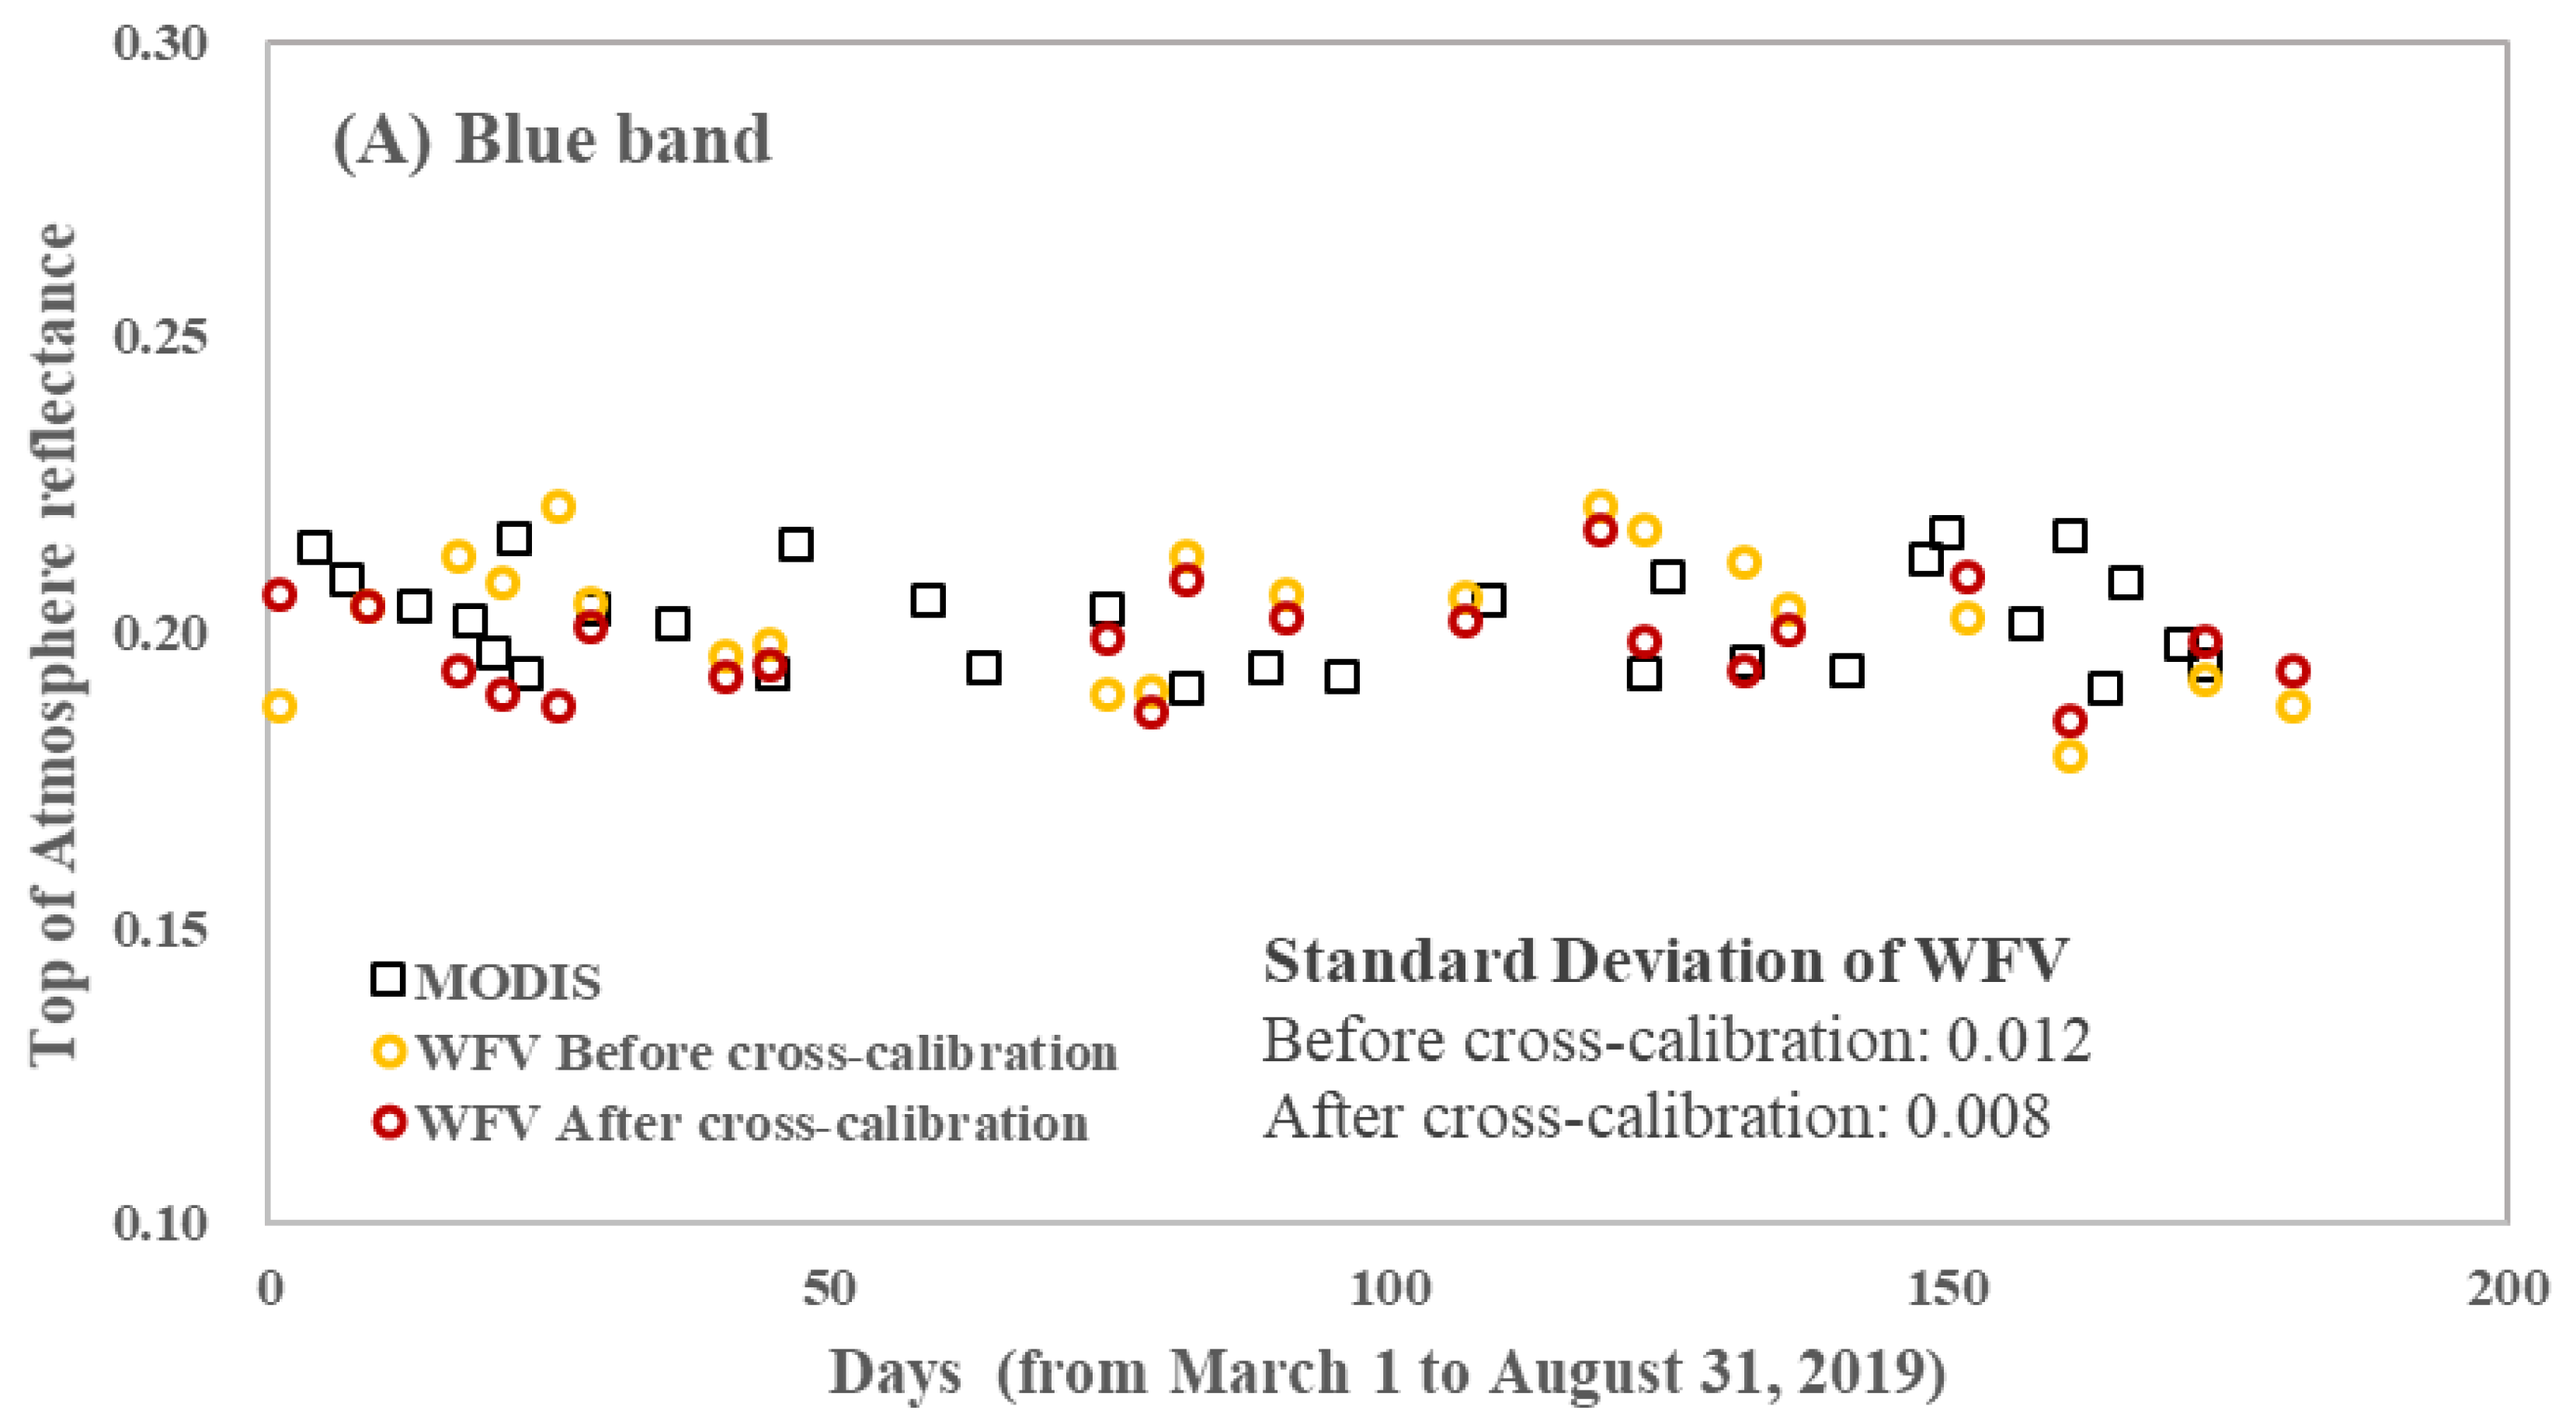
The TOA reflectance of WFV, OLI, MSI and MODIS are plotted in Figure 3. The spatial resolution of WFV (16 m), MSI (10 m), MODIS (250 m/500 m) and OLI (30 m) is different, therefore resampling the four sensors’ spatial resolution to 500 m is required when doing cross comparison. In order to reduce the influence of angle, and obtain more data at the same time, only the data with the observation zenith angle less than 15° are included in the comparison. From this Figure, we can see that the OLI, MSI and MODIS show better consistency and stability than WFV. Four statistical indices [22] are calculated, including slope of the trend line, mean value, standard deviation of the TOA reflectance values and relative error compared with WFV. The results are listed in Table 2. The slope of the trend line represents a drift of calibration during the long term of a sensor. The mean value indicates the average amount of the sensor’s obtained radiation. The standard deviation indicates the sensor’ radiometric variation.
In order to clearly explain the evaluation result, two indicators are proposed: (a) the relative change in radiometric response during a year (Table 3), and (b) the relative differences in radiometric response (Table 4). For the former indicator ( r ), it is calculated using the equation r = ( S l o p e 365 ) / M e a n , where the S l o p e and M e a n corresponding to columns 2 and 3, Table 2. For the second indicator, it is the relative difference between WFV and the mean of all other instruments.
From Table 2, Table 3 and Table 4, the following conclusions are drawn:
(1) WFV has the largest radiometric attenuation at all the four bands and they are all over 10% except blue band. MSI, OLI and MODIS all have different degrees of attenuation, but the attenuation is around 1%. MSI has the largest attenuation in the red band (3.23%) and the least attenuation in the blue band (0.73%); OLI has the largest attenuation in the red band (1.66%) and the least attenuation in the blue band (0.93%); MODIS has the largest attenuation in the near infrared band (1.34%) and the least attenuation in the blue band (0.18%); WFV has the largest attenuation in the near infrared band (15.83%) and the least attenuation in the blue band (7.26%). MODIS has the least attenuation at all the four bands.
(2) WFV has lower TOA reflectance than other three sensors except in the blue band. The TOA reflectance between MSI, OLI, MODIS and WFV in four bands were compared, separately. For MSI and WFV, the maximum difference appears in the NIR band (8.29%), and the minimum difference appears in the blue band (0.55%). For OLI and WFV, the maximum difference appears in the NIR band (10.84%), and the minimum difference appears in the green band (1.65%). For MODIS and WFV, the maximum difference appears in the NIR band (17.88%), and the minimum difference appears in the blue band (0.99%). However, the TOA reflectance difference between WFV and the other sensors is much smaller at the beginning stage of calibration, which means the radiometric gap between WFV and the other sensor is induced by the larger radiometric attenuation of WFV.
(3) WFV has the larger variation than MSI, OLI and MODIS in all these four bands. Comparing the corresponding bands of the four sensors, the blue band of MODIS is most stable, while the green band, red band and NIR band of OLI are most stable. For MSI, the most and least stable bands are blue band (0.0085) and NIR band (0.0101). For OLI, the most and least stable bands are the green band (0.0075) and the blue band (0.0102). For MODIS, the most and worst stable bands are the green band (0.0081) and the NIR band (0.0102). For WFV, the most and least stable bands are the blue band (0.0114) and the NIR band (0.0159).
From the above, the TOA reflectance of WFV has much larger attenuation (over 10% except blue band), lower value and larger variation than that of OLI, MSI and MODIS. Although the difference of SRF and view angle may cause the above phenomenon to some extent, the main reason is that the yearly vicarious calibration coefficients is unable to correct changes in sensor performance timely, and cannot ensure the consistency of the TOA reflectance in a long time series. Thus, it is necessary and important to calibrate the radiation of on-orbit WFV at much higher frequency.

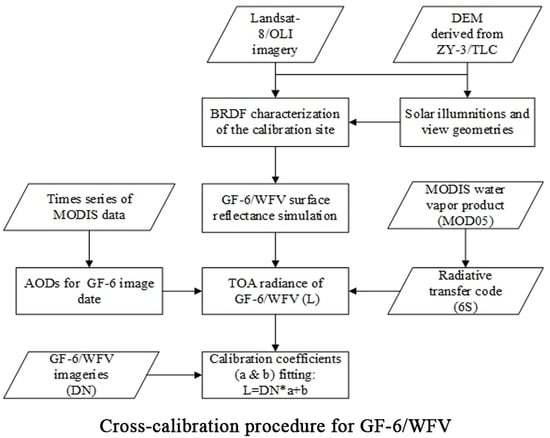
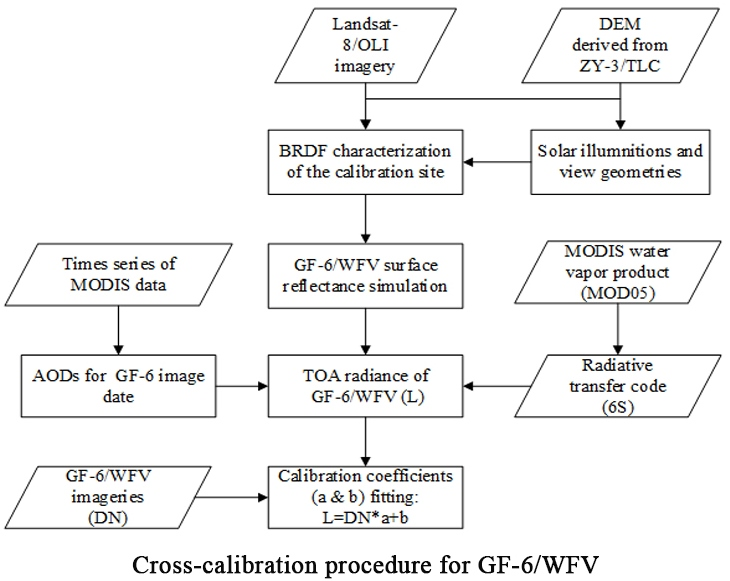
2.3. Cross-Calibration of WFV

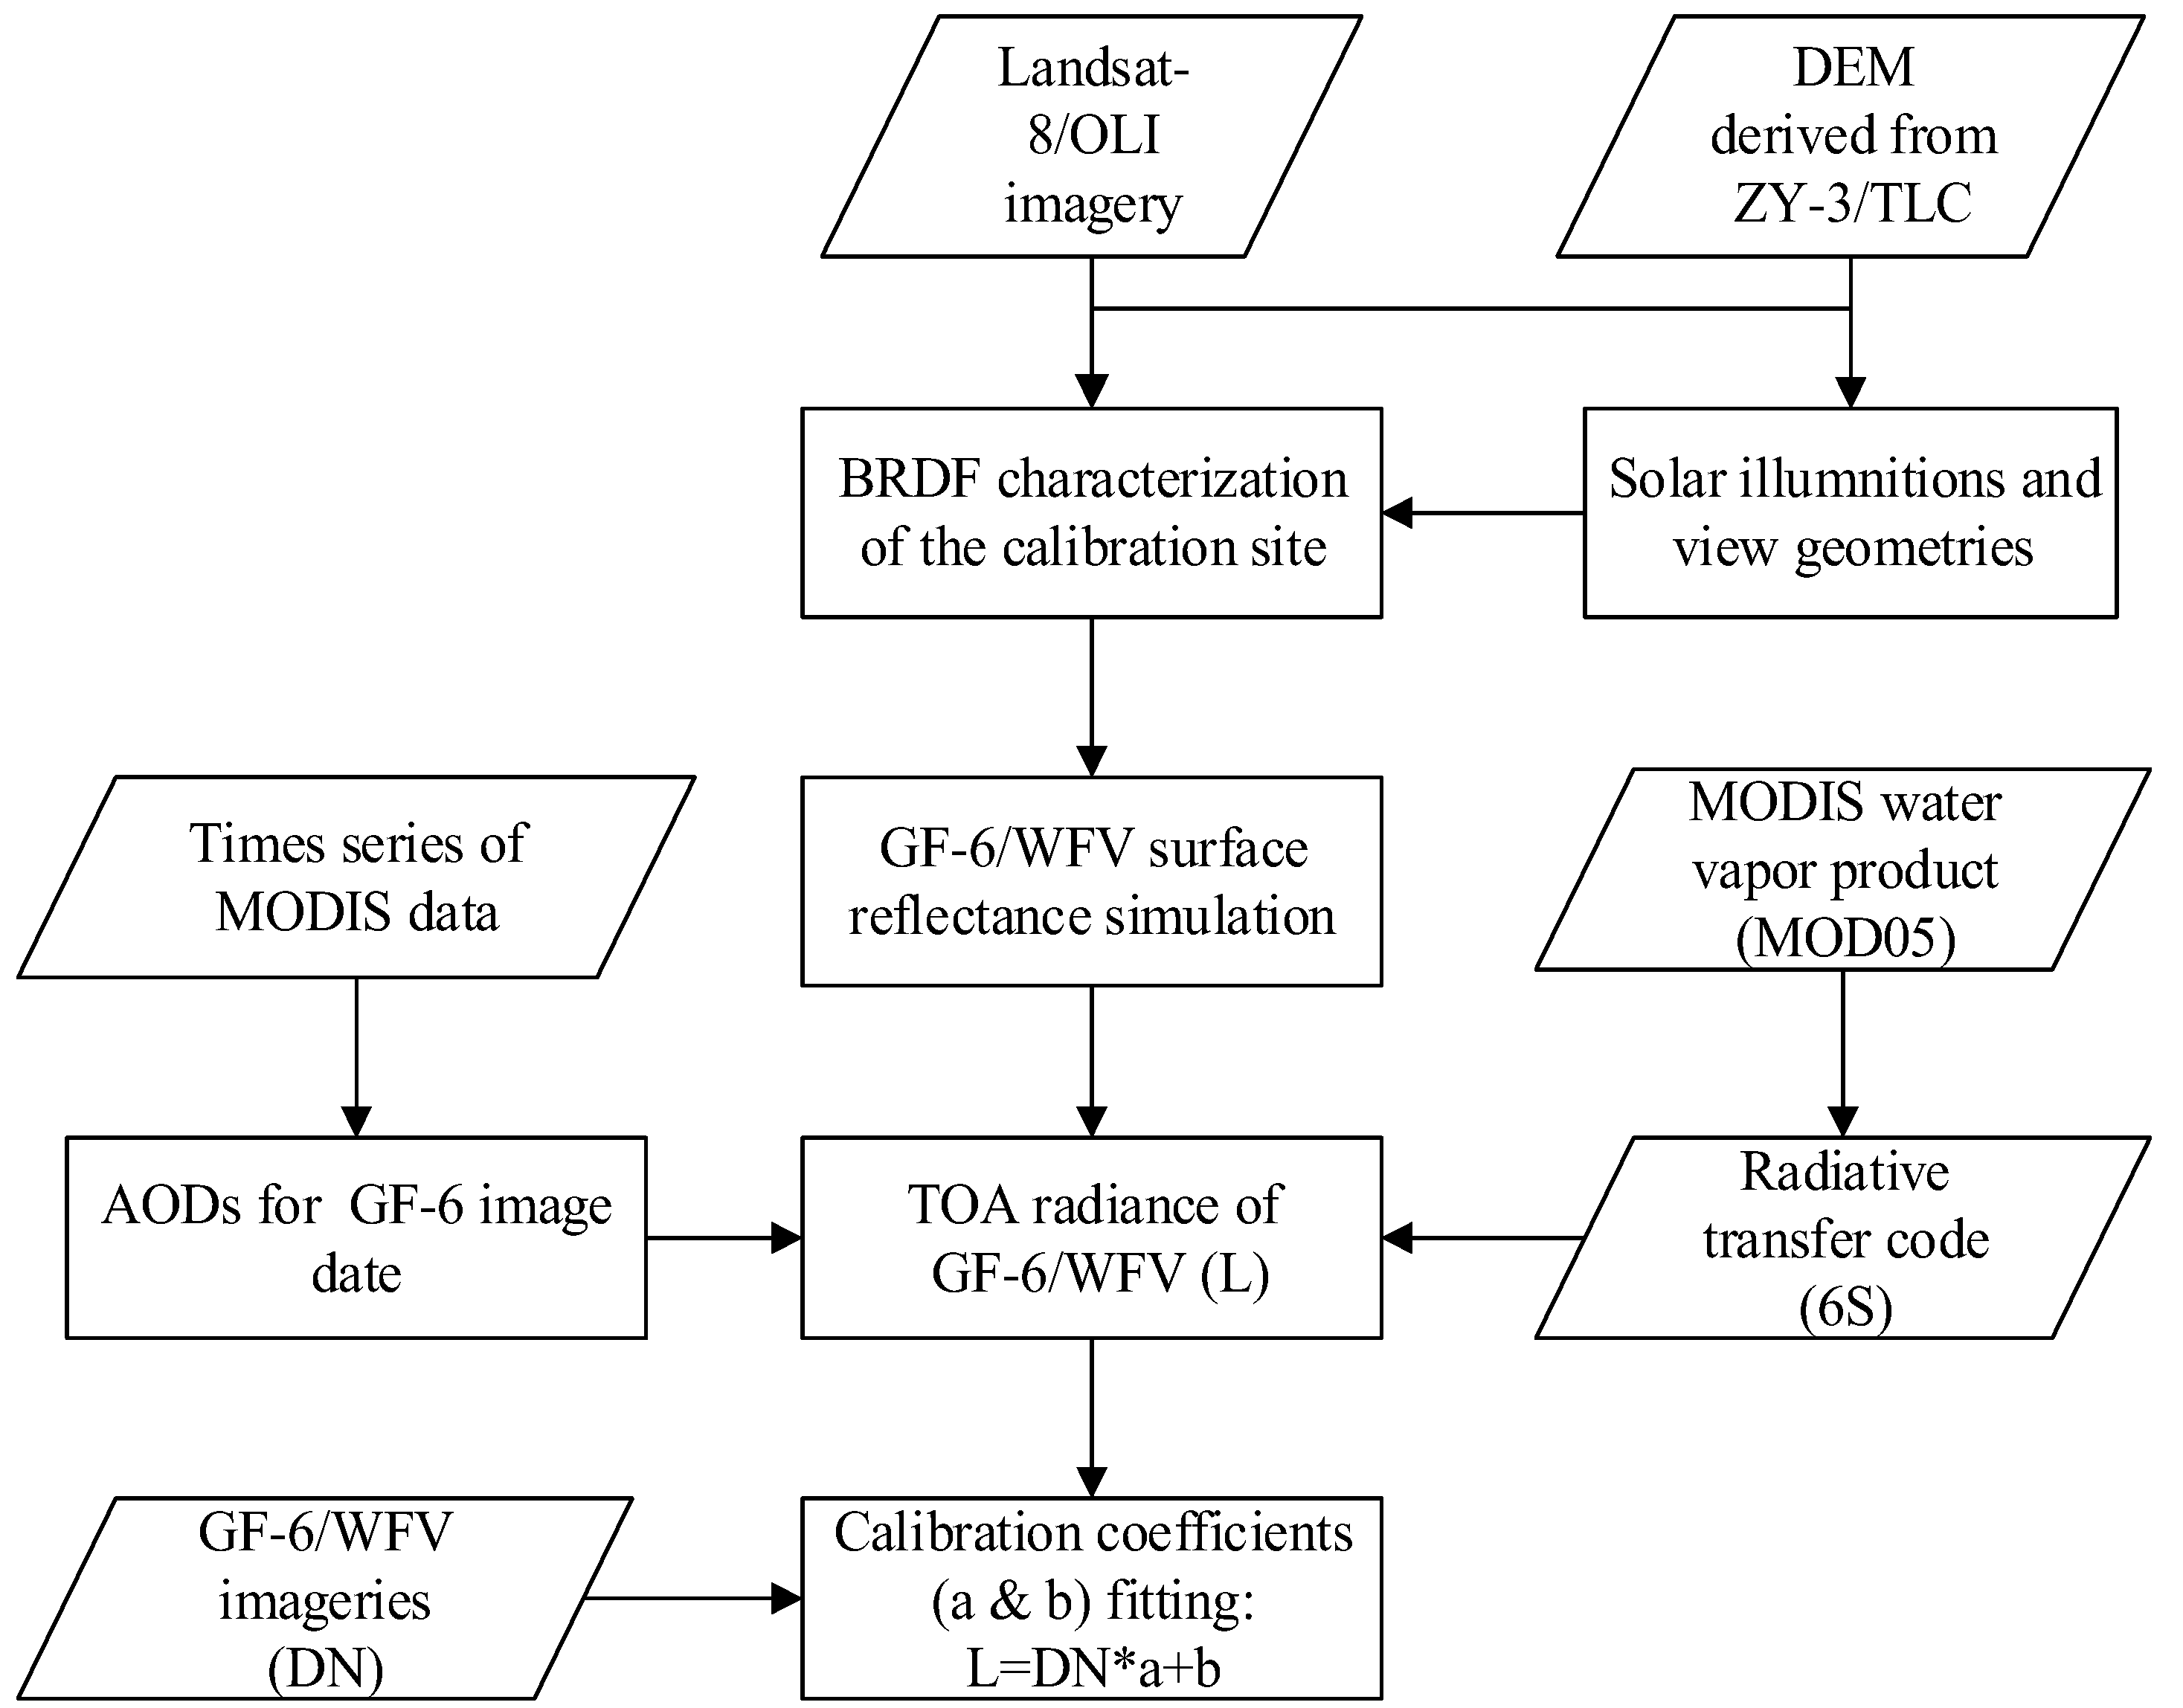
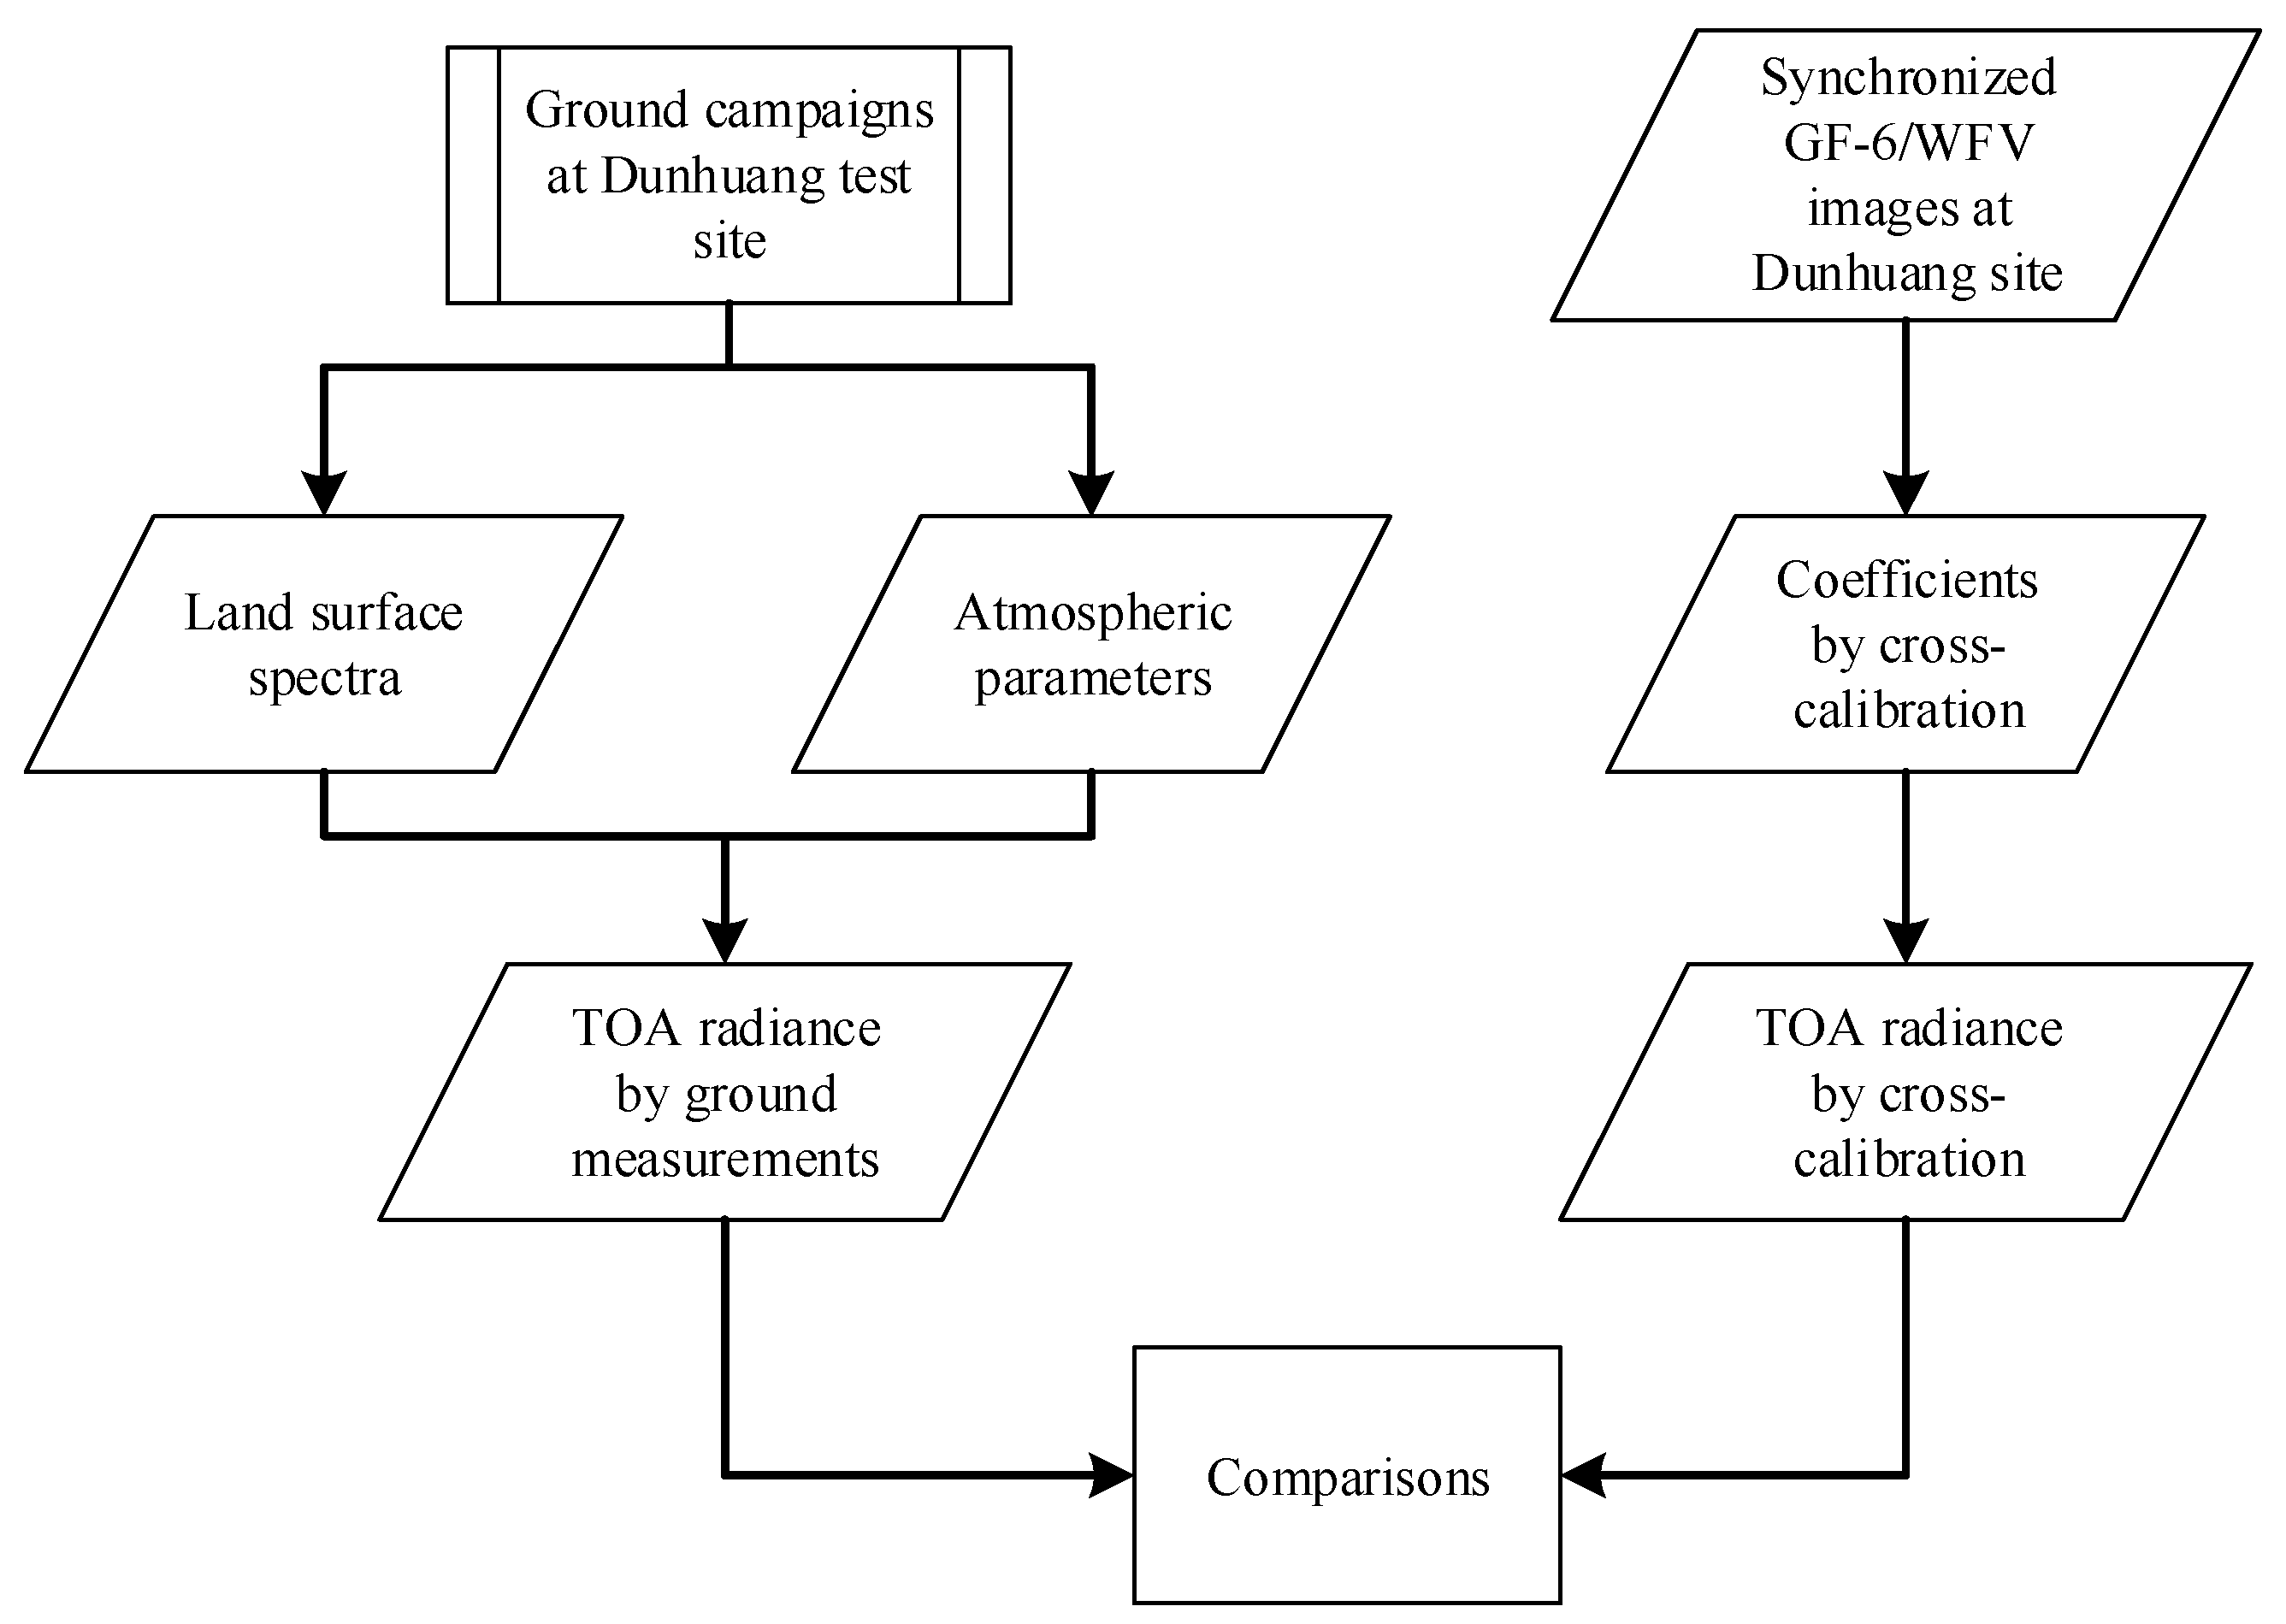
The cross-calibration procedure for GF-6/WFV used in this study is illustrated in Figure 4. It contains the following main steps.
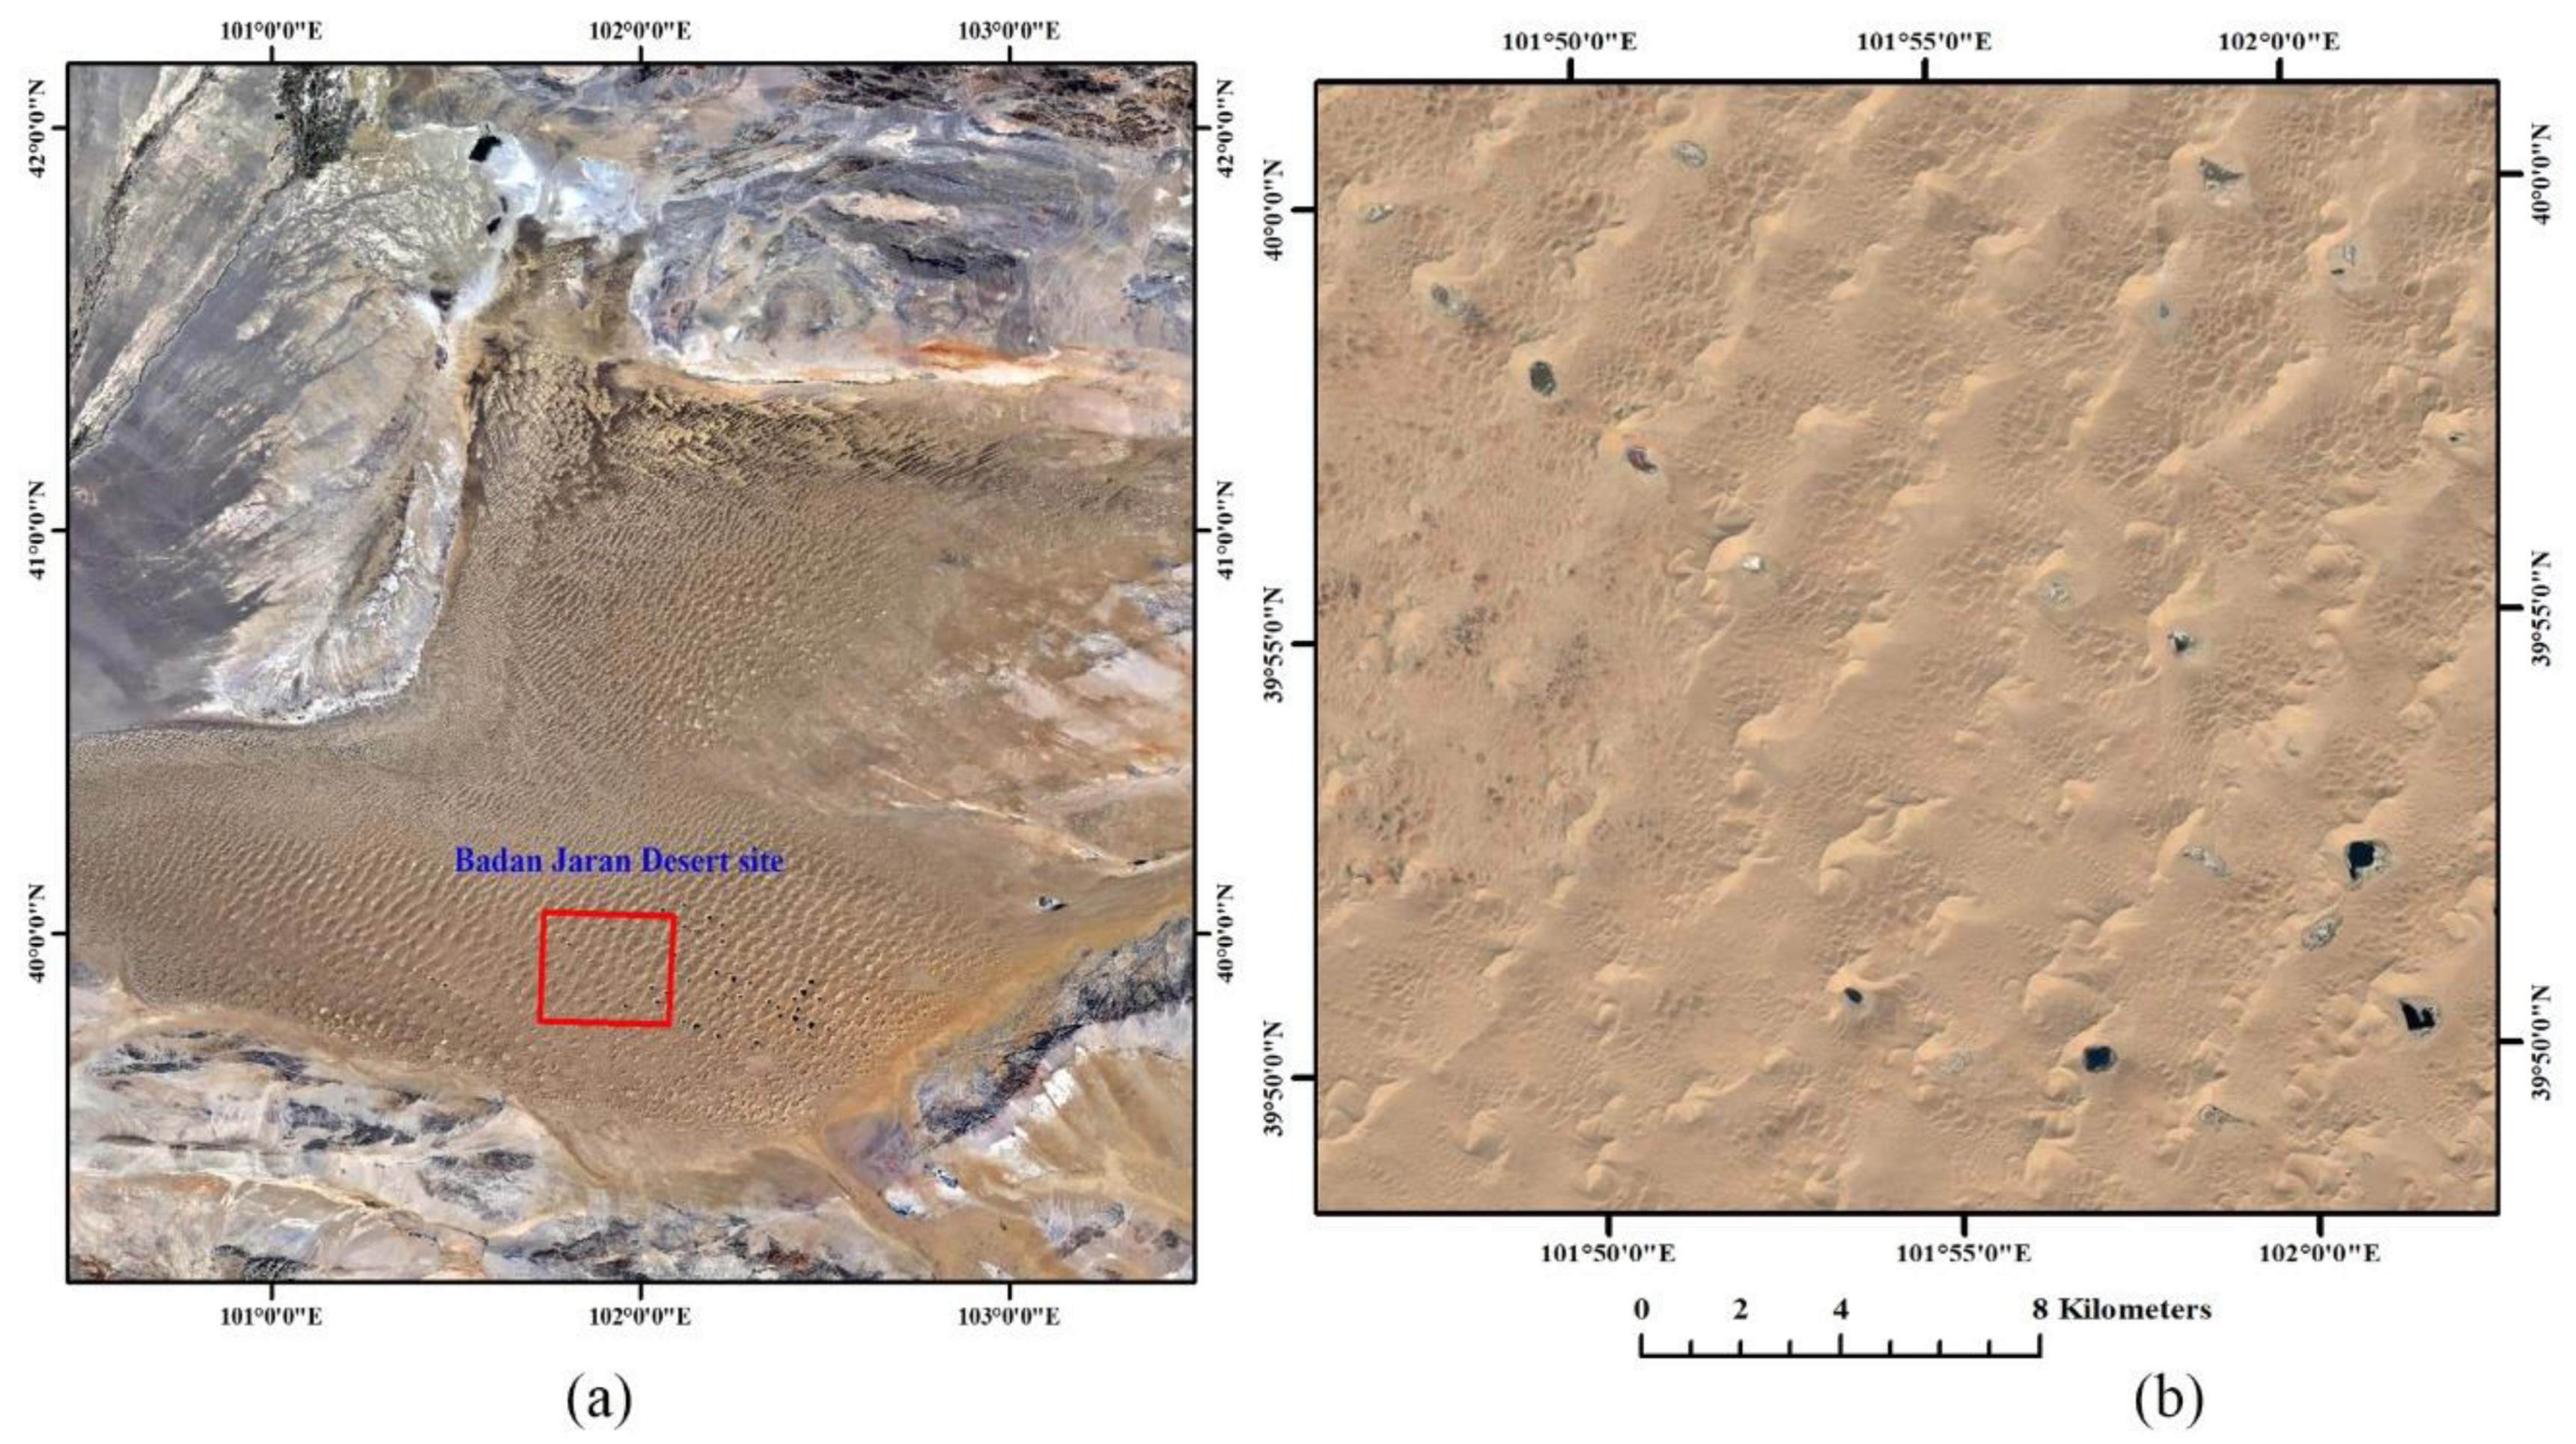
(1) The BRDF model of Badain Jaran Desert site is fitted using both the Landsat-8/OLI and the ZY-3/TLC data. The radiometric performance of Landsat-8/OLI is recognized as exceptional, which makes it suitable for cross-calibration as the reference. The TLC camera onboard ZY-3 consists of three panchromatic scanners: one with nadir-viewing, one with forward-viewing and one with backward viewing. The resolution of the three scanners is 2.1 m, 3.6 m and 3.6 m, respectively. The high resolution of ZY-3/TLC make the resolution of DEM product extracted from it as high as about 10m, with the less than 2 m error [23,24]. The BRDF model is a 4-D Look Up Table (LUT) including solar zenith, view zenith, relative azimuth and surface reflectance [2]. The records from the LUT come from the statistics of the selected OLI clean images after atmospheric correction. Among that, the solar zenith, view zenith and relative azimuth (absolute difference between solar azimuth and view azimuth) are come from the multi-angle dataset composed by vertical angular information from Landsat-8/OLI and slope information of DEM from ZY-3/TLC. The solar illuminations (solar zenith and azimuth angles) and view geometries (viewing zenith and azimuth angles) are varied pixel by pixel because of the hilly topography, and only related to the slope and aspect once the positions of the sun and the sensor are given. It should be noted that the coordinate system used by DEM product (local coordinate system with pixel as origin) is different with that used by the solar illuminations and view geometries (global coordinate system with pixel as origin), so coordinate system conversion between local and global is required. The surface reflectance of each pixel in OLI images is obtained after atmospheric correction using the DO method [11] (taking the clean lakes in the calibration site as the dark objects). The accuracy of BRDF is verified, and it showed a less than 2.2% error [2].
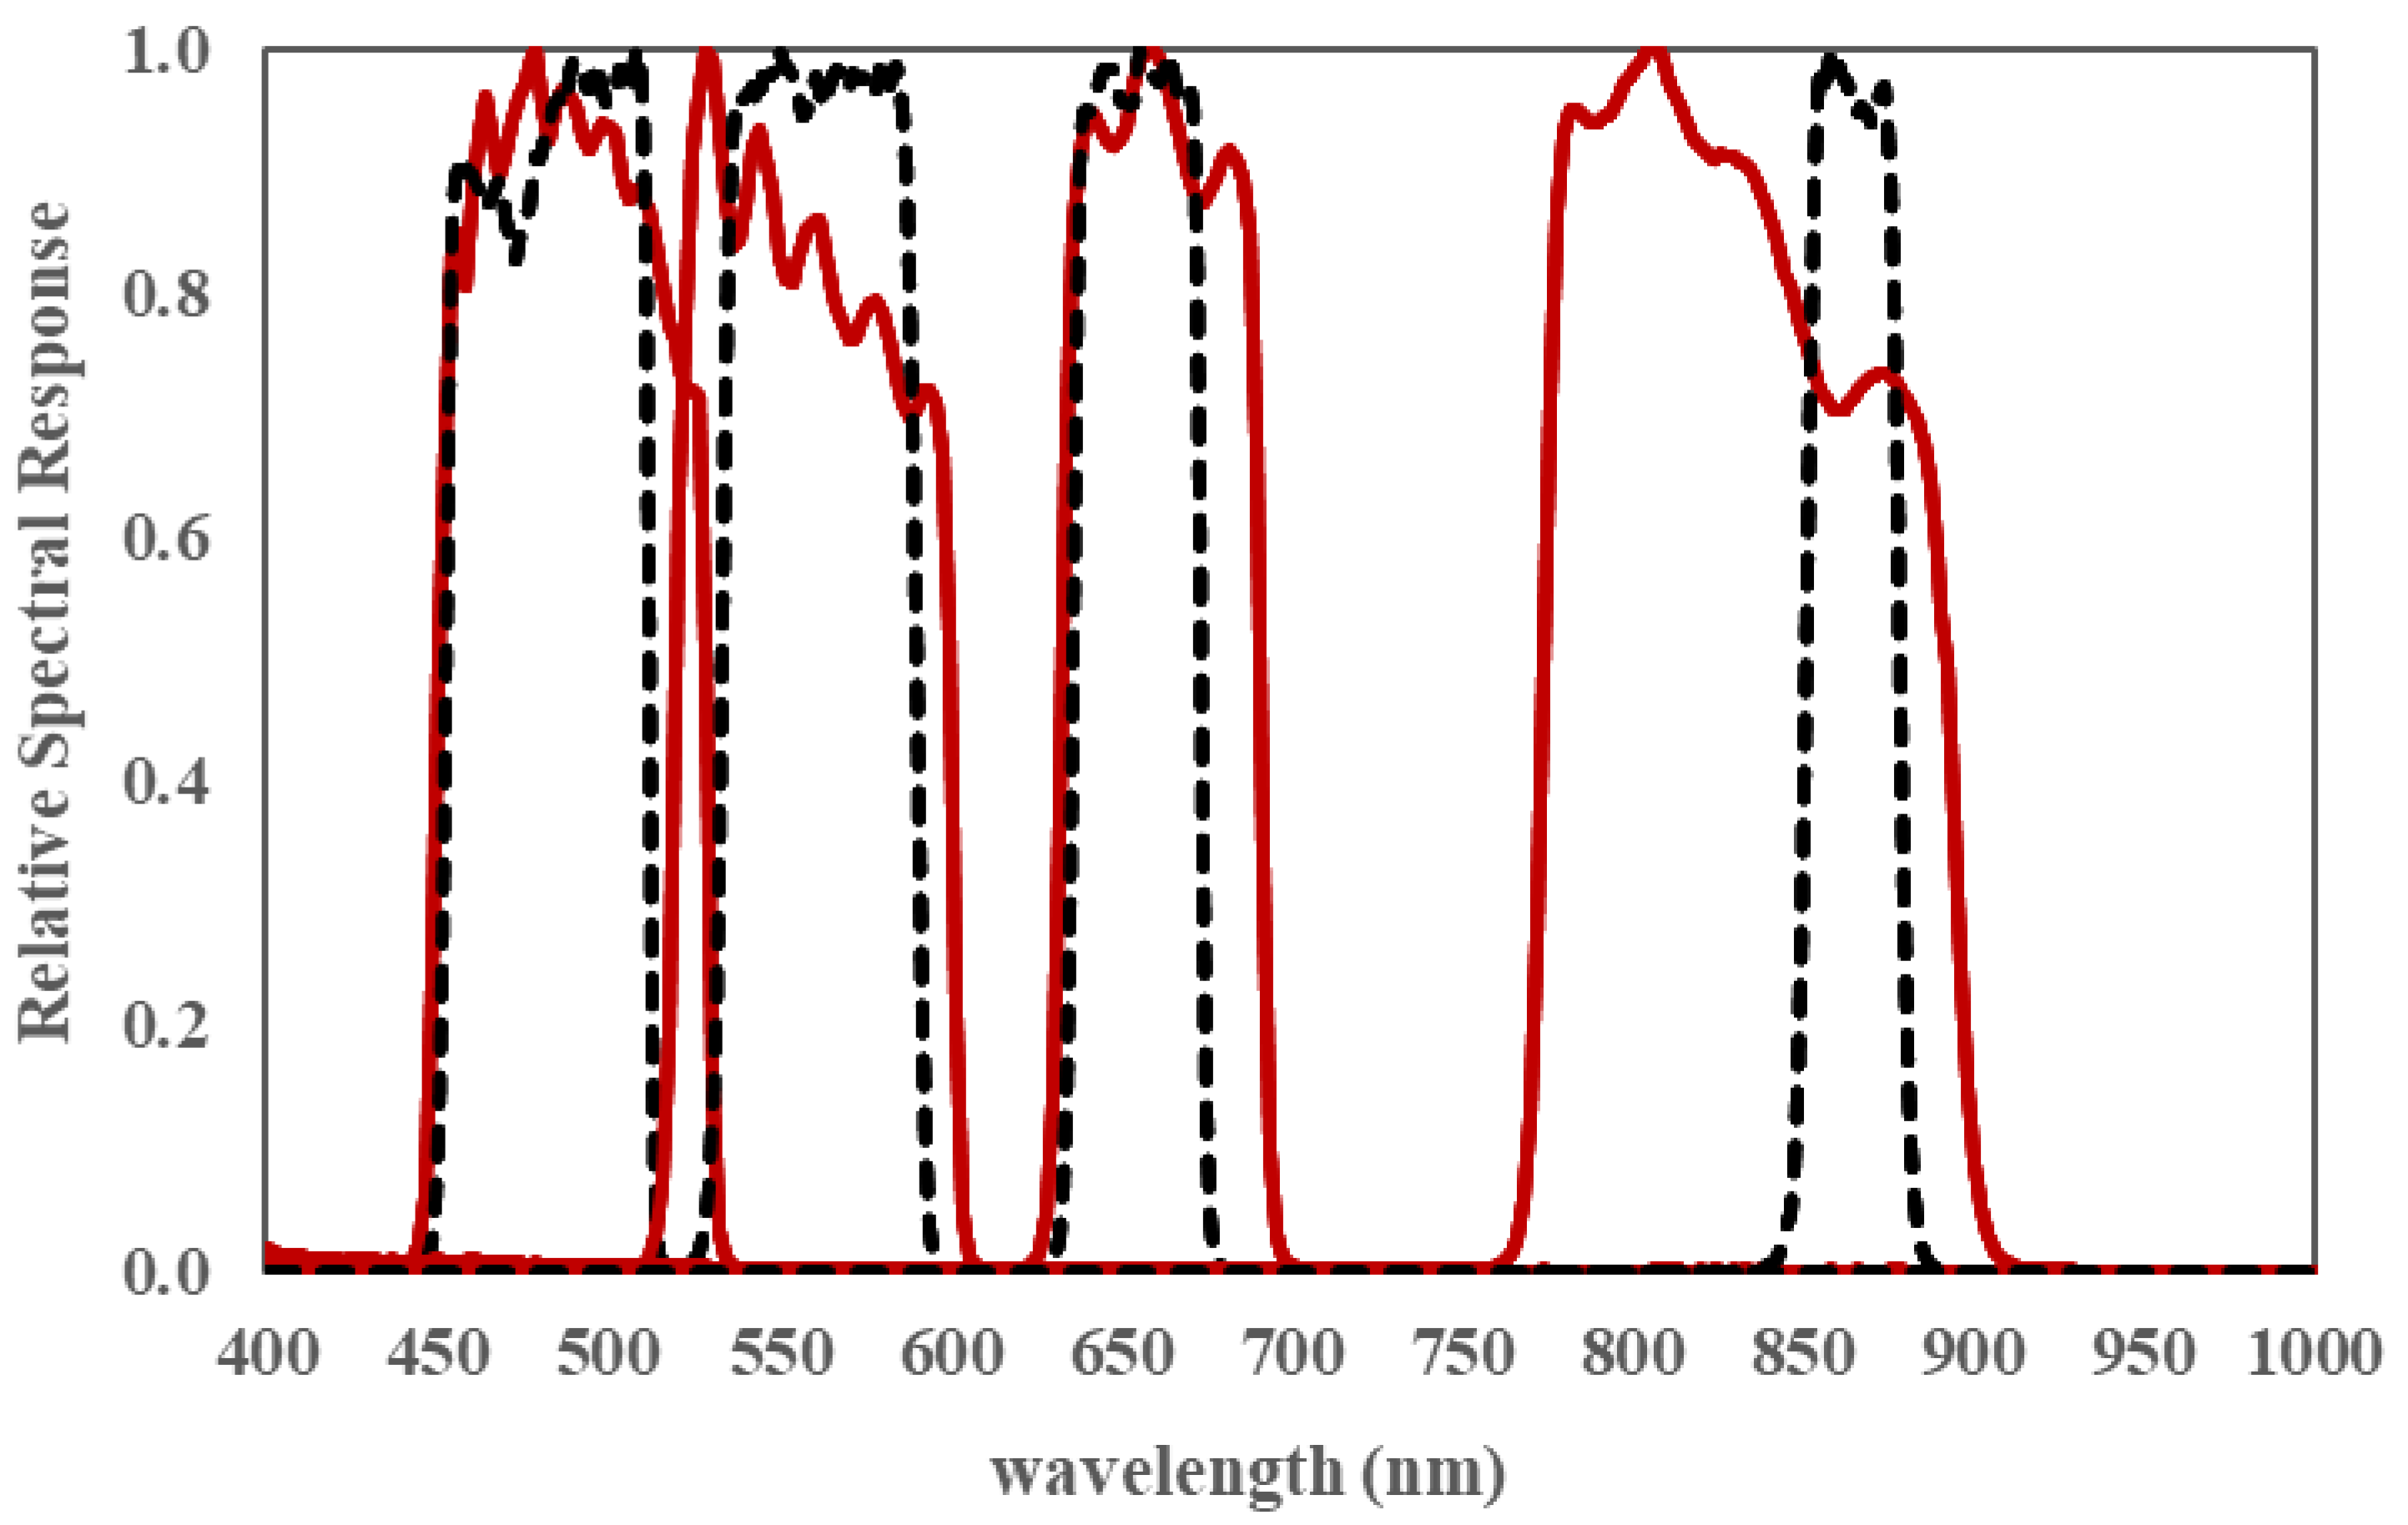
(2) The surface reflectance of GF-6/WFV’s solar illumination and view geometries is simulated using the retrieved BRDF. The angle information in each pixel of GF-6/WFV image is obtained by interpolating the records from the angle file (*.nav) in original data package. The surface reflectance in the BRDF LUT is from OLI, so when simulating the reflectance under WFV’s solar illumination and view geometries, the spectral response difference between WFV and OLI needs to be taken into account. The spectral response functions (SRFs) of WFV and OLI in multispectral bands are plotted in Figure 5. The SMFs between OLI and WFV in corresponding bands are calculated using the Equation (3) [1,2,3,
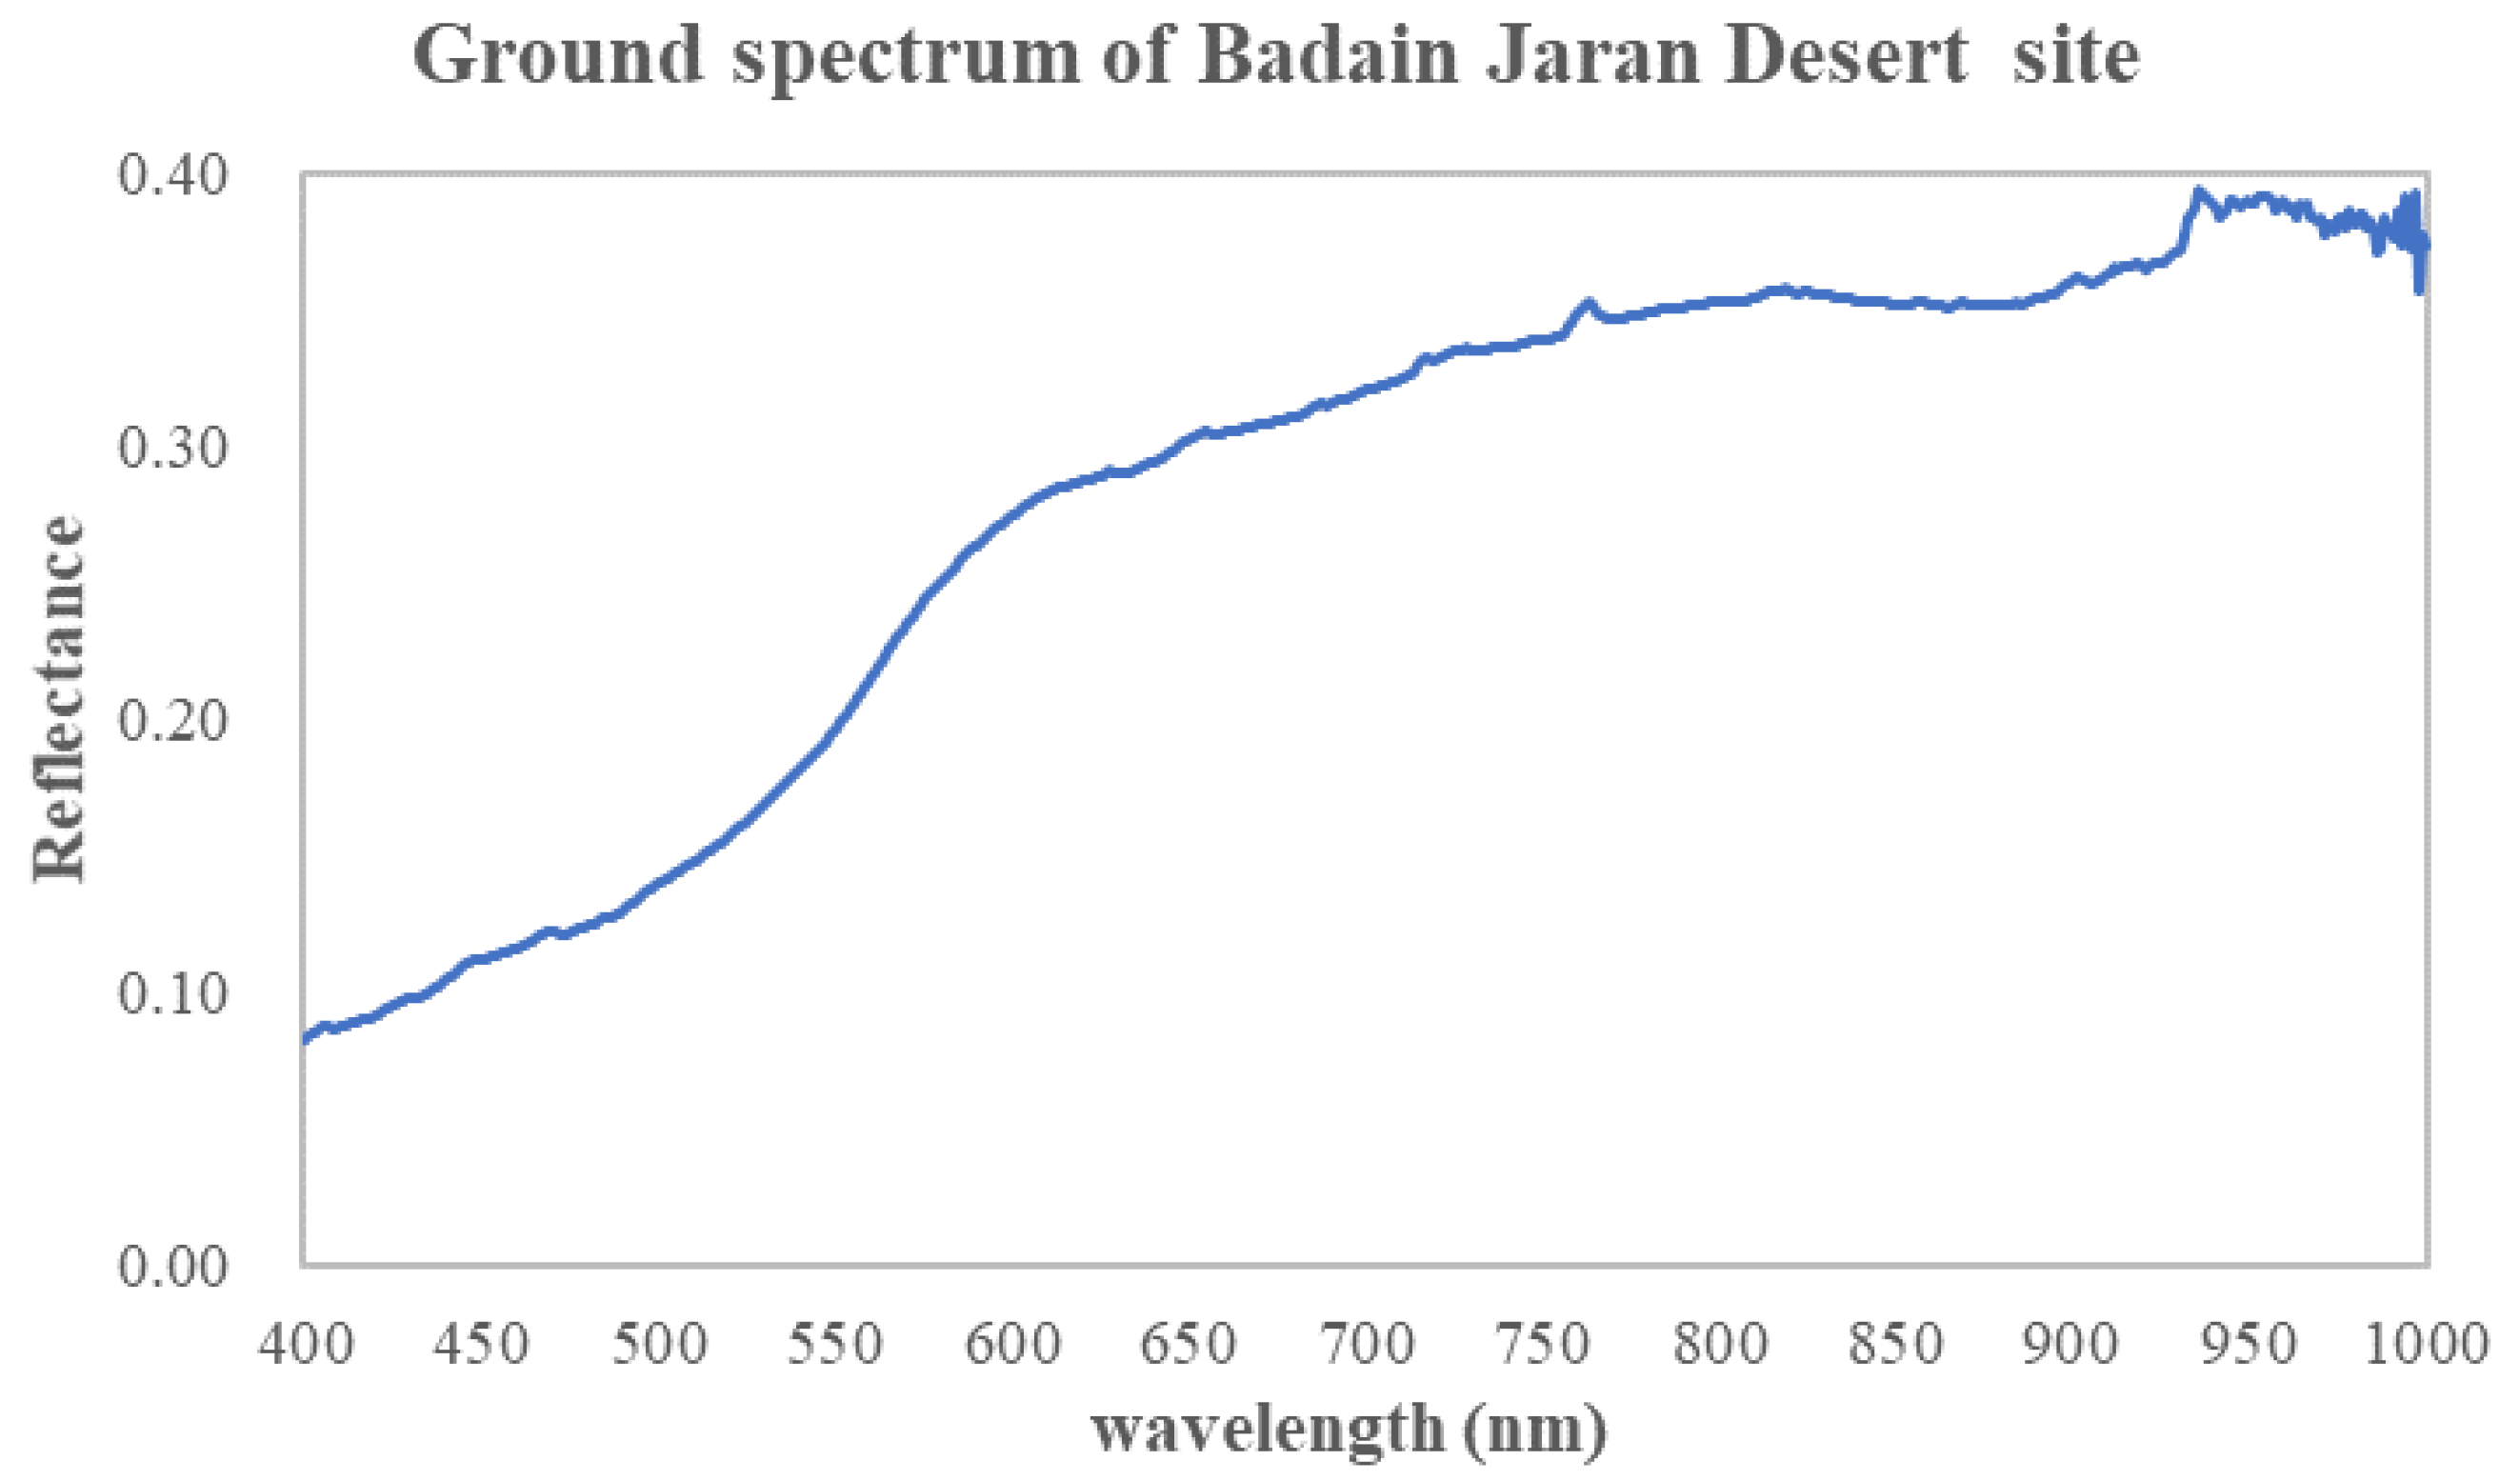
25]. The ground-measured spectrum of the Badain Jaran Desert site is used as ρ λ (comes from the measurement on July, 2012, and is shown in Figure 6).
a = λ 1 WFV λ 2 W F V ρ λ f W F V ( λ ) d λ / λ 1 OLI λ 2 O L I ρ λ f O L I ( λ ) d λ
where f w f v ( λ ) and f O L I ( λ ) are the SRFs of the WFV and OLI, respectively. λ 1 ~ λ 2 is the spectral range of WFV and OLI. The TOA reflectance of WFV can be spectrally normalized using the spectral matching factors using the equation ρ W F V = ρ O L I a . 
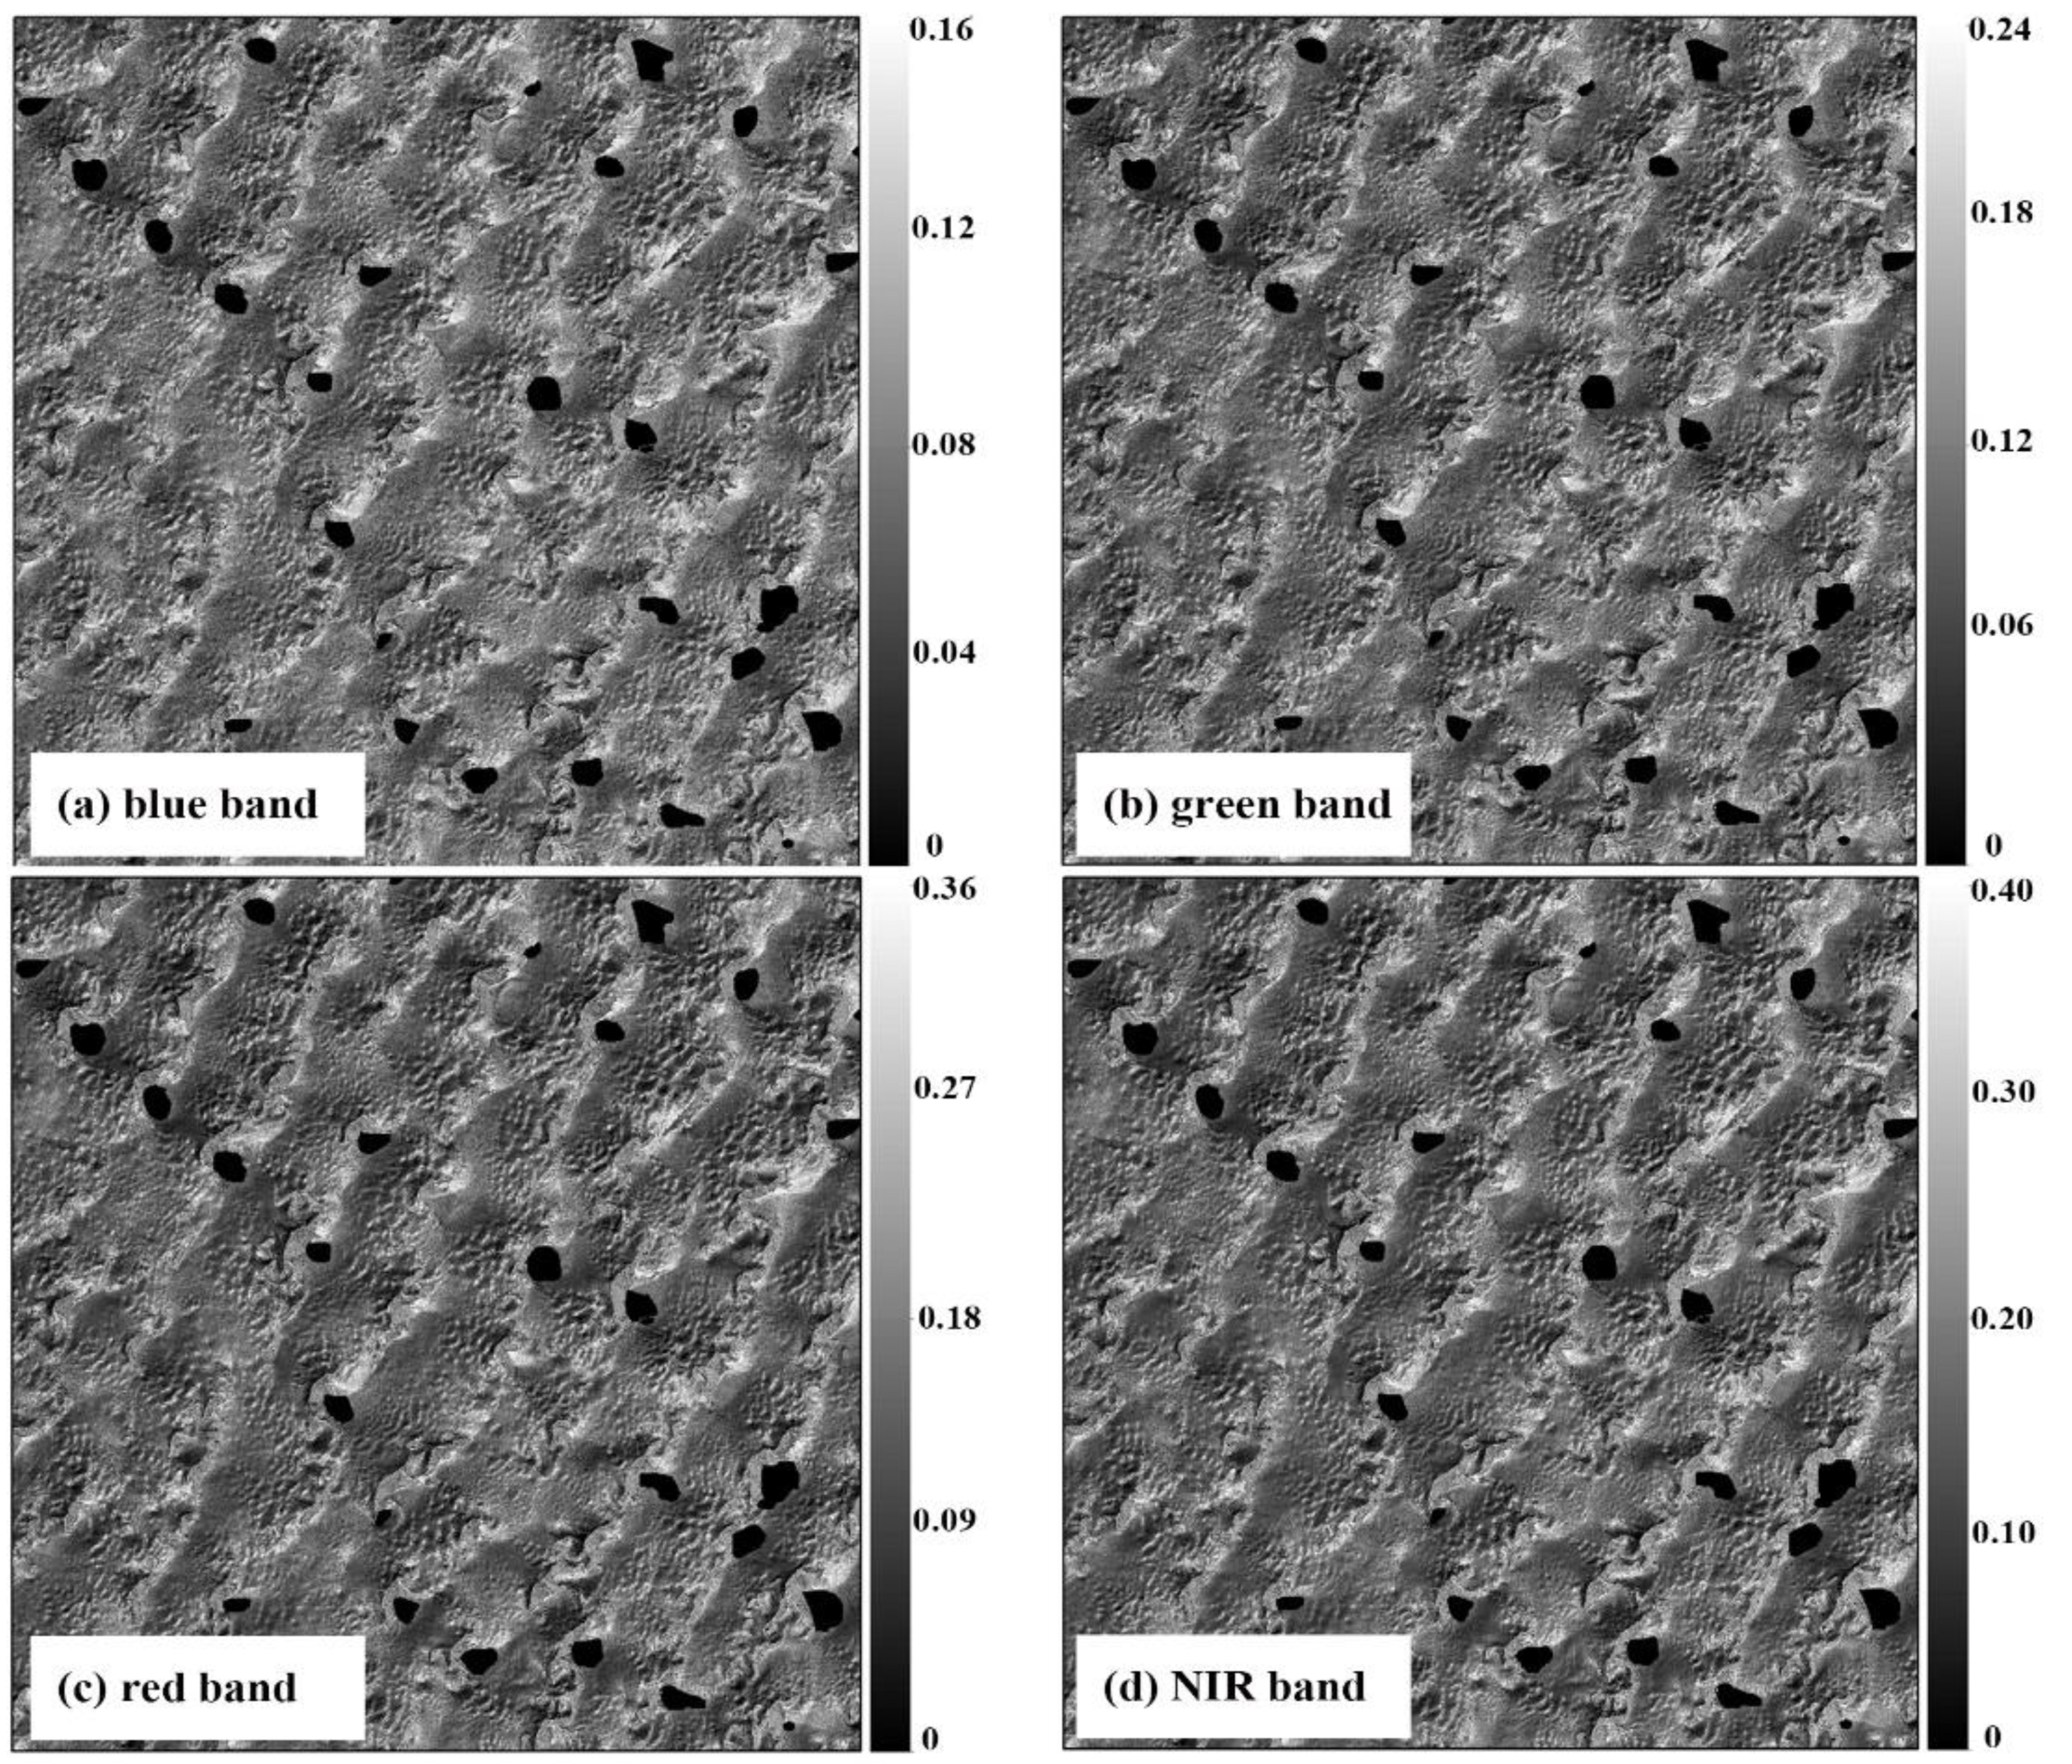
Figure 7 shows an example of the simulated surface reflectance on 5 July 2019.
(3) The Aerosol Optical Depths (AODs) of the GF-6/WFV images are retrieved using times series of MODIS data. The AOD retrieval algorithm is proposed by Liang et al. [26] and updated by Zhong et al. [27]. Firstly, calculating the TOA reflectance of MODIS after radiometric calibration from the time series. Secondly, sorting these TOA reflectance values, and classifying them per 10° angle range. Then selecting the TOA reflectance values as the “clearest” observation (with low aerosol and water vapor (WV), covered with no cloud and cloud shadow) during each pixel’s temporal window. The AODs of the “clearest” observations could be obtained through high-resolution images like OLI using DO method. Then the BRDF model in low-resolution can be fitted (the Staylor-Suttles BRDF model [21] is selected in this algorithm). Once the BRDF model is fitted, the surface reflectance of each pixel could be calculated and the AOD of each pixel could be retrieved using atmospheric radiative transferring model (TOA reflectance is known) [27]. The AOD retrieval algorithm using MODIS data ensures that AOD can be obtained every day. This method has been used to cross-calibrate reflective bands of major moderate resolution remotely sensed data, and proved a high accuracy [28]. In this paper, 12 WFV images are selected. Figure 8 shows an example of the retrieved AOD on 5 July 2019. The acquisition time of these images and their retrieved AODs are listed in Table 5.
(4) The TOA radiance of WFV is calculated using the simulated surface reflectance in step (2) and retrieved AOD in step (3) through the atmospheric radiative transferring model. After the surface reflectance is simulated and the AOD is retrieved, the Second Simulation of a Satellite Signal in the Solar Spectrum (6S) model is chosen [29] to calculate the TOA radiance. This computation of radiative transfer model needs to be performed in each pixel of each WFV image, which is time consuming. In order to improve the efficiency of calculation, a 6S LUT is built up. The water vapor content used in this paper comes from the MODIS precipitable water product (MOD05). The parameters are set in Table 6. 
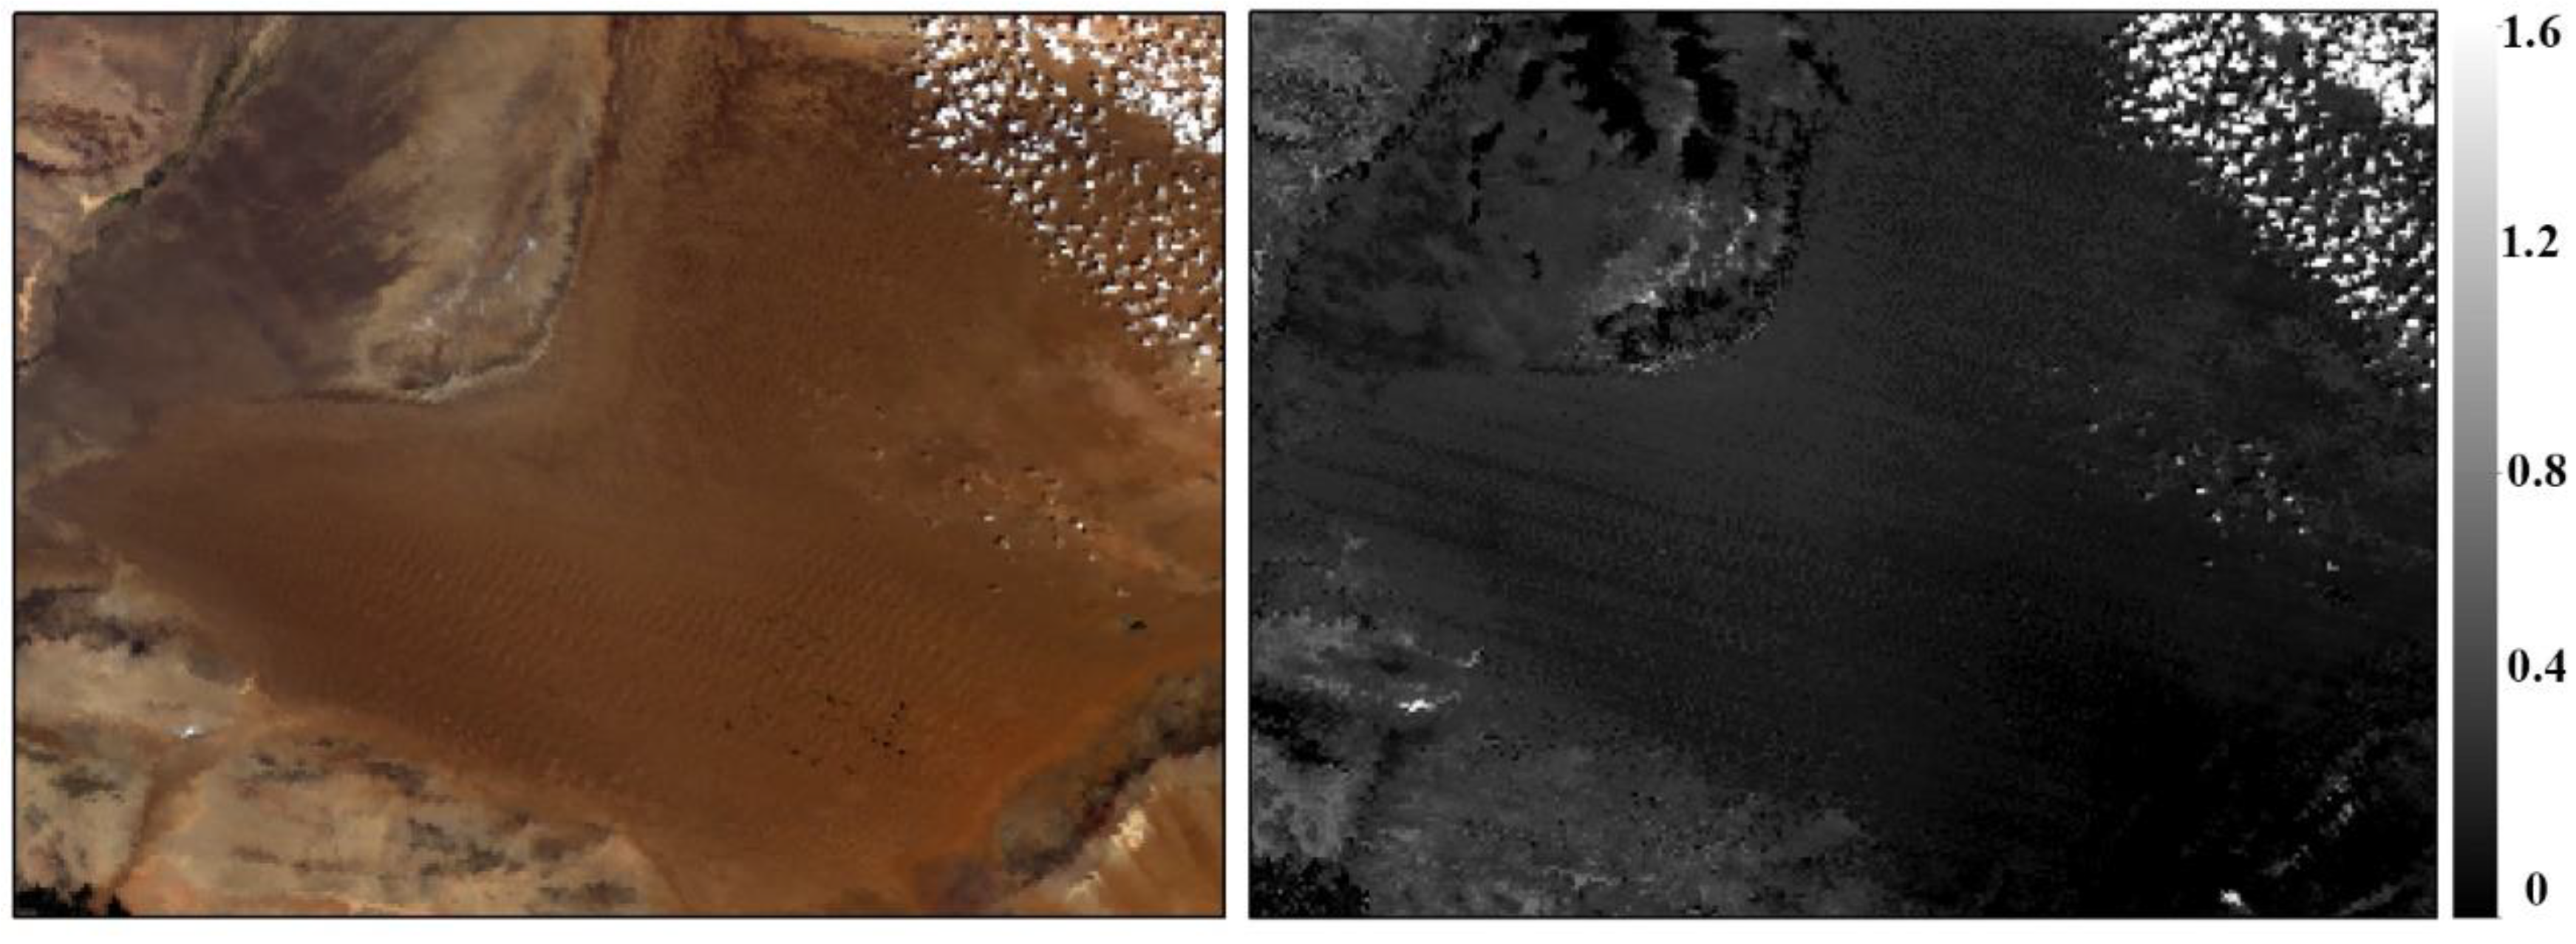
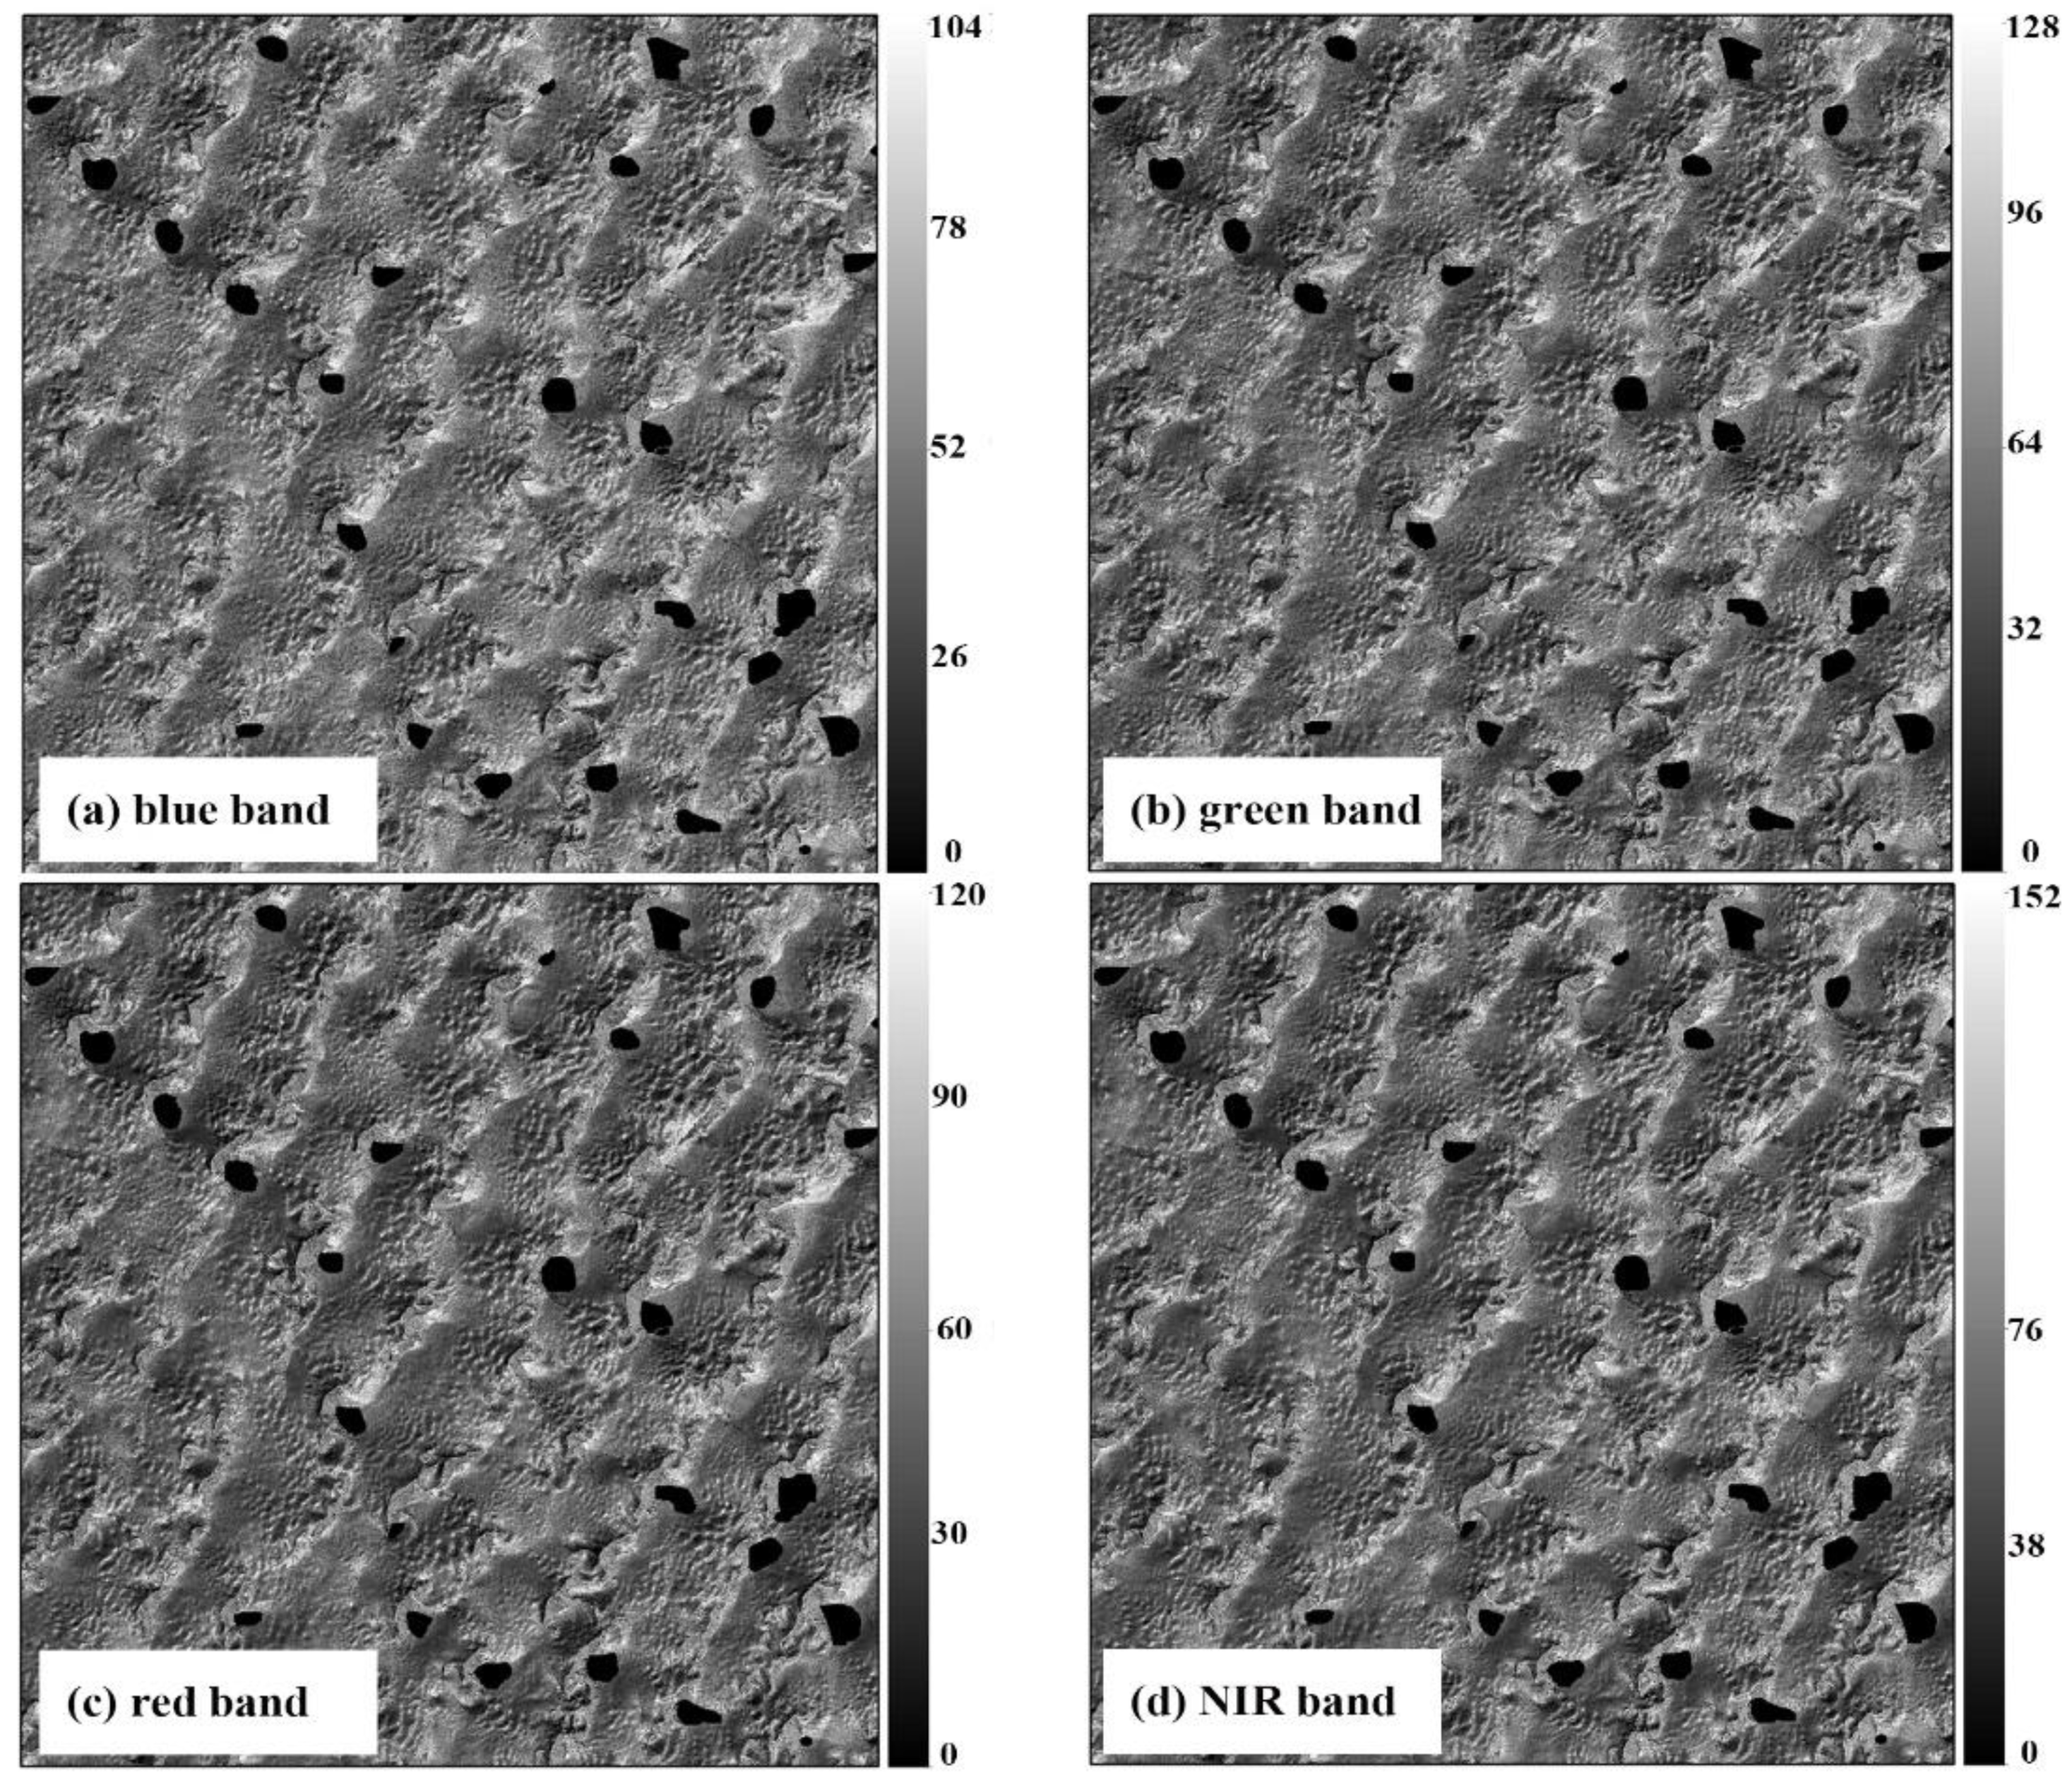
Figure 9 is an example of calculated TOA radiance on 5 July 2019.
(5) The calibration coefficients are fitted using the calculated TOA radiance and the Digital Data (DN) read from the GF-6/WFV image.

3. Results

3.1. Cross-calibration Results

The calibration coefficients of each WFV image can be calculated using Equation (2). In this paper, parameter b i a s is used the pre-launch offset value (0 for each band). The calibration coefficients of GF-6/WFV calculated are shown in Table 7. The uncertainty shown here is the value of standard deviation.

3.2. Validation

For the purpose of validating the accuracy of the cross-calibration results obtained in this paper, the synchronized ground measurements with GF-6/WFV (ground measurements at Dunhuang site during GF-6 overpasses) at Dunhuang test site are used. The measurements come from the ground campaigns for vicarious calibration carried by the CRESDA from June to August 2019 by the Working Group on Calibration and Validation of the Committee. The size of the validation area is 400 m × 400 m. A total of 4 groups of synchronized ground measurements data are obtained. The parameters of ground measurements include the land surface spectra, AOD, profile of temperature and humidity and WV. Some parameters of synchronized ground measurements including the chosen WFV images and ground measurements are listed in Table 8. The validation procedure is illustrated in Figure 10.
The TOA radiances are calculated using parameters from synchronized ground measurements and cross-calibration coefficients retrieved in this study, respectively. The relative error compared with WFV is calculated using the following equations:
r e l a t i v e   e r r o r = a b m e a n ( a , b )
a b = a b s ( a b ) ± δ a 2 + δ b 2
where a is the TOA radiance from cross-calibration in this paper, b is the TOA radiance calculated from the ground measurements, a b is the difference between a and b , m e a n ( a , b ) is the mean value of a and b , δ a and δ b are the standard deviation of a and b , respectively.
The TOA radiance calculated from the cross-calibration and from the synchronized ground measurements and the relative difference of the two calculations for each band are listed in Table 9. Almost all relative differences of the two TOA radiance calculations are less than 5%. The largest difference is 5.05% and it happens at band 1 on August 8, 2019. Therefore, the proposed cross-calibration method has the potential for improving the radiometric capability of GF-6/WFV effectively with much higher frequency (monthly).
In order to observe the effect after cross-calibration, the TOA reflectance was compared before cross-calibration (using coefficients published by the CRESDA) and after cross-calibration (using coefficients calculated in this paper) from March 1 to August 31, 2019 in Dunhuang site (Figure 11). From the figure, we can see the trend and value of TOA reflectance after cross-calibration is closer to MODIS. In addition, the dispersion degree is decreased in all the four bands (the standard deviation is less).

3.3. Uncertainty Analysis

Based on radiative transfer theory, the uncertainty in this cross-calibration procedure mainly comes from (1) 6S model, (2) DN, (3) sun irradiance, (4) view angle, (5) BRDF LUT, (6) AOD, (7) WV product and (8) spectral matching factor calculation. The uncertainty of each part and total are shown in Table 10.
(1) 6S model. The uncertainty of 6S model is 1.6% according to the reference [29].
(2) DN. The standard deviations for bands blue, green, red and NIR are 1.87%, 3.23%, 6.17% and 6.47% [1]. Taking these standard deviations to simulate TOA reflectance using WFV bands, the uncertainty is shown in Table 10.
(3) Sun irradiance. The TOA reflectance is calculated using Equation (1). Here the sun irradiance is calculated using oldkur.dat from MODTRAN. The RMSE is almost less than 5%. Take this RMSE to simulate TOA reflectance using WFV bands, the uncertainty is very small (less than 0.01%) and even can be ignored.
(4) View angle. The angle range used in this paper is 0~15°. Take this angle range to simulate TOA reflectance using WFV bands, the uncertainty is very small (less than 0.01%) and even can be ignored.
(5) BRDF LUT. The difference errors of the BRDF are 1.82% for blue band, 2.10% for green band, 1.88% for red band and 1.94% for NIR band [1]. Take this RMSE to simulate TOA reflectance using WFV bands, the uncertainty is shown in Table 10.
(6) AOD. We validate the AOD’s accuracy using the Dunhuang ground measurements data. Firstly, the BRDF model in Dunhuang site, coming from CRESDA, was used. Secondly, the AODs of Table 8’s dates are simulated using the method introduced in Section 2.3. Thirdly, the accuracy is evaluated with the Dunhuang ground measurements result. The RMSE is 0.092. Take this RMSE to simulate TOA reflectance using WFV bands, the uncertainty is shown in Table 10.
(7) WV product. According to the MODIS water vapor product’s ATBD, the standard deviation of MODIS WV product is 5%~15%. Here we selected 15% as the standard deviation, and take this to simulate TOA reflectance using WFV bands, the uncertainty is shown in Table 10.
(8) Spectral matching factor calculation. The uncertainty of spectral matching factor comes from the ground-measured spectrum (2%).
From the table, the total uncertainty is 3.35% for blue band, 3.56% for green band, 4.23% for red band and 4.60% for NIR band, all less than 5%.

4. Discussion

The cross-calibration method used in this paper is based on a desert site (Badain Jaran Desert), and validated based on a Gobi site (Dunhuang site). The surface reflectance ranges of the two sites (medium reflectivity, not too high and not too low) are similar, so the results obtained using the two sites can be cross-compared. However, we have no idea about whether the calibration result is also applicable to high reflectivity surface or low reflectivity surface. If the WFV’s radiometric is not linear, then the results are not applicable to other types of surface.
We did a simple comparison between MSI and WFV using simultaneous nadir overpass (SNO) method [30] on December 30, 2019. The results are showed in Figure 12. From the figure, the WFV shows a good linearity in blue band, green band, red band and NIR band, respectively. However, the validation images are insufficient, further verification is still needed. The coefficients used here are from the new coefficients published by CRESDA in October, 2019.

5. Conclusions

GF-6, launched on June 2, 2018, is the sixth satellite of the HDEOS, and the first high-resolution satellite in China to achieve precise agricultural observation. As a very important camera onboard GF-6, WFV’s radiometric performance is significant to the accuracy of quantitative application. Similar to the former HDEOS optical satellites (HJ-1, GF-1 and GF-4), GF-6 still lacks onboard calibration equipment, so on-orbit vicarious radiometric calibration is necessary for keeping the radiometric capability at a high quality. The Working Group on Calibration and Validation of the Committee on Earth Observation Satellites from CRESDA has been taking synchronized ground measurements at the Dunhuang test site for years to update calibration coefficients once a year. However, due to the limitation of human and material resources, the coefficients only can be updated once a year. For GF-6/WFV, the official calibration coefficients have been updated once until now. Therefore, cross-calibration becomes an alternative for updating the calibration coefficients with lower cost, higher efficiency and higher frequency, which is very useful for keeping the radiometric consistency of GF-6/WFV in practices.
The radiometric capability of GF-6/WFV is evaluated to prove the necessity of cross-calibration. Three referenced sensors are chosen, including Landsat-8/OLI, Sentinel-2/MSI and Terra/MODIS. Clear images in Dunhuang test site of these four sensors are selected from June 2, 2018 (launch date of GF-6) to October 30, 2019. The TOA reflectance of the four sensors are calculated and compared. Three statistical indices including slope of the trend line, mean value and standard deviation are used to evaluate the radiometric capability. The evaluation shows that: (1) WFV has the largest radiometric attenuation and they are over 10% except blue band (over 7%); (2) WFV has a lower TOA reflectance than other three sensors except in blue band; (3) WFV has a larger variation than MSI, OLI and MODIS at all four bands. The evaluation subsequently proved the necessity to cross-calibrate WFV.
In this study, the approach firstly proposed by Zhong et al. to cross-calibrate HJ-1/CCDs and updated by Yang et al. to cross-calibrate GF-1/WFVs and GF-4/PMS is successfully applied to GF-6/WFV. Then, 12 sets of calibration coefficients are obtained from March 2019 to October 2019, which has achieved a much higher calibration frequency. Furthermore, the GF-6/WFV synchronized ground measurements at the Dunhuang test site are used to validate the cross-calibration results and less than 5% error has been achieved. In addition, a thorough uncertainty analysis shows that the total uncertainty is 3.35% for the blue band, 3.56% for the green band, 4.23% for the red band and 4.60% for the NIR band, all less than 5%.

Author Contributions

A.Y. was responsible for the data analysis and writing the manuscript. B.Z. contributed to the main research ideas. L.H. and S.W. wrote the program. Z.X. provided the GF-6 synchronized ground measurements data. H.W. (Hongbo Wu) provided technical information about the sensor. X.G. and H.W. (Haibo Wang) provided the GF-6 data. J.W. assisted in collating validation data. Q.L. reviewed the manuscript and provided valuable suggestions. All authors have read and agreed to the published version of the manuscript.

Funding

This research received no external funding.

Acknowledgments

This work was supported in part by the National Key R&D Program of China under Grant under Grant 2018YFA0605500, the GF6 Project under Grant 30-Y20A02-9003-17/18 and the National Key R&D Program of China under Grant under Grant 2017YFA0603000. The GF-6/WFV imagery used in this research is supported by the China Centre for Resources Satellite Data and Application (http://www.cresda.com). The Landsat-8/OLI data is downloaded from USGS website (http://landsat.usgs.gov).

Conflicts of Interest

The authors declare no conflict of interest.

References

  1. Zhong, B.; Zhang, Y.; Du, T.; Yang, A.; Lv, W.; Liu, Q. Cross-Calibration of HJ-1/CCD over a desert site using Landsat ETM+ imagery and ASTER GDEM product. IEEE Trans. Geosci. Remote. Sens. 2014, 52, 7247–7263. [Google Scholar] [CrossRef]
  2. Yang, A.; Zhong, B.; Lv, W.; Wu, S.; Liu, Q. Cross-calibration of GF-1/WFV over a desert site using Landsat-8/OLI imagery and ZY-3/TLC data. Remote. Sens. 2015, 7, 10763–10787. [Google Scholar] [CrossRef] [Green Version]
  3. Yang, A.; Zhong, B.; Wu, S.; Liu, Q. Radiometric Cross-Calibration of GF-4 in Multispectral Bands. Remote. Sens. 2017, 9, 232. [Google Scholar]
  4. Hu, C.; Muller-Karger, F.E.; Andrefouet, S.; Carder, K.L. Atmospheric correction and cross-calibration of LANDSAT-7/ETM+ imagery over aquatic environments: A multiplatform approach using SeaWiFS/MODIS. Remote. Sens. Environ. 2001, 78, 99–107. [Google Scholar] [CrossRef]
  5. Sun, L.; Hu, X.; Xu, N.; Liu, J.; Zhang, L.; Rong, Z. Postlaunch Calibration of FengYun-3B MERSI Reflective Solar Bands. IEEE Trans. Geosci. Remote. Sens. 2012, 51, 1383–1392. [Google Scholar]
  6. Gao, C.; Zhao, Y.; Li, C.; Ma, L.L.; Wang, N.; Qian, Y.; Ren, L. An Investigation of a Novel Cross-Calibration Method of FY-3C/VIRR against NPP/VIIRS in the Dunhuang Test Site. Remote. Sens. 2016, 8, 77. [Google Scholar] [CrossRef] [Green Version]
  7. Gao, C.; Jiang, X.; Li, X.; Li, X. The cross-calibration of CBERS-02B/CCD visible-near infrared channels with Terra/MODIS channels. Int. J. Remote. Sens. 2012, 34, 3688–3698. [Google Scholar] [CrossRef]
  8. Chen, C.; Zhang, B.; Zhang, H.; Zhang, W.; Zhang, Y. HJ-1A multispectral imagers radiometric performance in the first year. In Proceedings of the 2010 IEEE International Geoscience and Remote Sensing Symposium (IGARSS), Honolulu, HI, USA, 25–30 July 2010 ; pp. 4264–4267. [Google Scholar]
  9. Liu, L.; Shi, T.; Fu, Q.; Han, Q. Spectral band adjustment factors for cross calibration of GF-1 WFV and Terra MODIS. In Proceedings of the 2015 IEEE International Geoscience and Remote Sensing Symposium (IGARSS), Milan, Italy, 26–31 July 2015; pp. 2119–2122. [Google Scholar]
  10. Gao, H.; Gu, X.; Yu, T.; Sun, Y.; Liu, Q. Cross-Calibration of GF-1 PMS Sensor With Landsat 8 OLI and Terra MODIS. IEEE Trans. Geosci. Remote. Sens. 2016, 54, 4847–4854. [Google Scholar] [CrossRef]
  11. Kaufman, Y.J.; Karnieli, A.; Tanre, D. Detection of dust over deserts using satellite data in the solar wavelengths. IEEE Trans. Geosci. Remote. Sens. 2000, 38, 525–531. [Google Scholar] [CrossRef] [Green Version]
  12. Guenther, B.; Xiong, X.; Salomonson, V.; Barnes, W.; Young, J. On-orbit performance of the Earth Observing System Moderate Resolution Imaging Spectroradiometer; first year of data. Remote. Sens. Environ. 2002, 83, 16–30. [Google Scholar] [CrossRef]
  13. Chander, G.; Xiong, X. (Jack); Choi, T. (Jason); Angal, A. Monitoring on-orbit calibration stability of the Terra MODIS and Landsat 7 ETM+ sensors using pseudo-invariant test sites. Remote. Sens. Environ. 2010, 114, 925–939. [Google Scholar] [CrossRef]
  14. Xiong, X.; Sun, J.; Xie, X.; Barnes, W.L.; Salomonson, V.V. On-Orbit Calibration and Performance of Aqua MODIS Reflective Solar Bands. IEEE Trans. Geosci. Remote. Sens. 2009, 48, 535–546. [Google Scholar] [CrossRef]
  15. Angal, A.; Xiong, X.; Wu, A.; Chander, G.; Choi, T. Multitemporal Cross-Calibration of the Terra MODIS and Landsat 7 ETM+ Reflective Solar Bands. IEEE Trans. Geosci. Remote. Sens. 2013, 51, 1870–1882. [Google Scholar] [CrossRef]
  16. Heidinger, A.; Cao, C.; Sullivan, J.T. Using Moderate Resolution Imaging Spectrometer (MODIS) to calibrate advanced very high resolution radiometer reflectance channels. J. Geophys. Res. Space Phys. 2002, 107, AAC 11. [Google Scholar] [CrossRef] [Green Version]
  17. Vermote, E.; Saleous, N. Calibration of NOAA16 AVHRR over a desert site using MODIS data. Remote. Sens. Environ. 2006, 105, 214–220. [Google Scholar] [CrossRef]
  18. Roy, D.; Wulder, M.A.; Loveland, T.; Woodcock, C.E.; Allen, R.; Anderson, M.C.; Helder, D.; Irons, J.; Johnson, D.; Kennedy, R.; et al. Landsat-8: Science and product vision for terrestrial global change research. Remote. Sens. Environ. 2014, 145, 154–172. [Google Scholar] [CrossRef] [Green Version]
  19. Mishra, N.; Helder, D.; Barsi, J.; Markham, B. Continuous calibration improvement in solar reflective bands: Landsat 5 through Landsat 8. Remote. Sens. Environ. 2016, 185, 7–15. [Google Scholar] [CrossRef] [Green Version]
  20. Markham, B.; Barsi, J.; Kvaran, G.; Ong, L.; Kaita, E.; Biggar, S.F.; Czapla-Myers, J.S.; Mishra, N.; Helder, D. Landsat-8 Operational Land Imager Radiometric Calibration and Stability. Remote. Sens. 2014, 6, 12275–12308. [Google Scholar] [CrossRef] [Green Version]
  21. Zhang, H.K.; Roy, D.P.; Yan, L.; Li, Z.; Huang, H.; Vermote, E.; Skakun, S.; Roger, J.-C. Characterization of Sentinel-2A and Landsat-8 top of atmosphere, surface, and nadir BRDF adjusted reflectance and NDVI differences. Remote. Sens. Environ. 2018, 215, 482–494. [Google Scholar] [CrossRef]
  22. Yang, A.; Zhong, B.; Wu, S.; Liu, Q. Evaluation on Radiometric Capability of Chinese Optical Satellite Sensors. Sensors 2017, 17, 204. [Google Scholar] [CrossRef] [PubMed] [Green Version]
  23. Tang, X.; Zhang, G.; Zhu, X.; Pan, H.; Jiang, Y.; Zhou, P.; Wang, X. Triple linear-array image geometry model of ZiYuan-3 surveying satellite and its validation. Int. J. Image Data Fusion 2013, 4, 33–51. [Google Scholar] [CrossRef]
  24. Huang, X.; Wen, D.; Xie, J.; Zhang, L. Quality Assessment of Panchromatic and Multispectral Image Fusion for the ZY-3 Satellite: From an Information Extraction Perspective. IEEE Geosci. Remote. Sens. Lett. 2013, 11, 753–757. [Google Scholar] [CrossRef]
  25. Huang, H.; Zhong, B.; Liu, Q.; Sun, L. Retrieving BRDF of desert using time series of MODIS imagery. In Proceedings of the 2011 IEEE International Geoscience and Remote Sensing Symposium (IGARSS), Vancouver, BC, Canada, 24–29 July 2011; pp. 4273–4276. [Google Scholar]
  26. Liang, S.; Zhong, B.; Fang, H. Improved estimation of aerosol optical depth from MODIS imagery over land surfaces. Remote. Sens. Environ. 2006, 104, 416–425. [Google Scholar] [CrossRef]
  27. Zhong, B.; Liang, S.; Holben, B. Validating a new algorithm for estimating aerosol optical depths over land from MODIS imagery. Int. J. Remote. Sens. 2007, 28, 4207–4214. [Google Scholar] [CrossRef]
  28. Zhong, B.; Yang, A.; Wu, S.; Li, J.; Liu, S.; Liu, Q. Cross-calibration of reflective bands of major moderate resolution remotely sensed data. Remote. Sens. Environ. 2018, 204, 412–423. [Google Scholar] [CrossRef]
  29. Vermote, E.; Tanre, D.; Deuze, J.; Herman, M.; Morcette, J.-J. Second Simulation of the Satellite Signal in the Solar Spectrum, 6S: An overview. IEEE Trans. Geosci. Remote. Sens. 1997, 35, 675–686. [Google Scholar] [CrossRef] [Green Version]
  30. Cao, C.; Uprety, S.; Blonski, S. Establishing radiometric consistency among VIIRS, MODIS, and AVHRR using SNO and SNOx methods. In Proceedings of the 2012 IEEE International Geoscience and Remote Sensing Symposium (IGARSS), Munich, Germany, 22–27 July 2012; pp. 6928–6931. [Google Scholar]
Figure 1. Location (a) and close view (b) of the Dunhuang test site from Google Earth.
Remotesensing 12 01037 g001
Figure 2. Location (a) and close view (b) of the Badain Jaran Desert site from Google Earth.
Remotesensing 12 01037 g002
Figure 3. Time series of the top of atmosphere (TOA) reflectance of Multi Spectral Instrument (MSI), Operational Land Imager (OLI), Moderate Resolution Imaging Spectroradiometer (MODIS) and WFV in blue band (A), green band (B), red band (C) and near infrared band (D), respectively.
Remotesensing 12 01037 g003aRemotesensing 12 01037 g003b
Figure 4. Cross-calibration procedure for GF-6/WFV used in this paper.
Remotesensing 12 01037 g004
Figure 5. Spectral response functions (SRFs). (The red solid line represents the SRF of WFV, while the black dotted line represents the SRFs of OLI, respectively).
Remotesensing 12 01037 g005
Figure 6. Ground-measured spectrum of the Badain Jaran Desert site.
Remotesensing 12 01037 g006
Figure 7. Example of the simulated surface reflectance of GF-6/WFV image on 5 July, 2019.
Remotesensing 12 01037 g007
Figure 8. Example of the Aerosol Optical Depth (AOD) of GF-6/WFV image on 5 July, 2019.
Remotesensing 12 01037 g008
Figure 9. Example of the calculated TOA radiance of GF-6/WFV image on 5 July, 2019.
Remotesensing 12 01037 g009
Figure 10. Validation procedure using synchronized ground measurements at Dunhuang test site.
Remotesensing 12 01037 g010
Figure 11. Comparison of the TOA reflectance between WFV and MODIS (before and after cross-calibration).
Remotesensing 12 01037 g011aRemotesensing 12 01037 g011b
Figure 12. Comparison of the TOA reflectance between MSI and WFV using SNO method on December 30, 2019.
Remotesensing 12 01037 g012
Table 1. Technical indicators of GaoFen-6 (GF-6) payloads (panchromatic/multi-spectral high-resolution (PMS) and wide field of view (WFV)).
PayloadSpectral NumberSpectral TypeSpectral Range (nm)Spatial Resolution (m)Swath Width (km)Side Swing
PMS1Panchromatic450~900290Maneuvering side swing: ±25°;
Emergency side swing: ±35°.
2Blue450~5208
3Green520~590
4Red630~690
5Near infrared770~890
WFV1Blue450~52016800
2Green520~590
3Red630~690
4Near infrared770~890
5Costal400~450
6Yellow590~630
7RedEdge1690~730
8Rededge2730~770
Table 2. The statistical indices from the time series TOA reflectance of WFV, OLI, MSI and MODIS.
BandSensorSlopeMeanStandard Deviation
BlueMSI−4 × 10−60.20010.0089
OLI−5 × 10−60.19610.0102
MODIS−1 × 10−60.20320.0082
WFV−4 × 10−50.20120.0114
GreenMSI−9 × 10−60.20400.0085
OLI−8 × 10−60.20340.0075
MODIS−4 × 10−60.21220.0081
WFV−6 × 10−50.20010.0130
RedMSI−2 × 10−50.22570.0090
OLI−1 × 10−50.21930.0086
MODIS−7 × 10−60.22770.0094
WFV−7 × 10−50.21020.0138
NIRMSI−1 × 10−50.22470.0101
OLI−1 × 10−50.23000.0098
MODIS−9 × 10−60.24460.0102
WFV−9 × 10−50.20750.0159
Table 3. The relative change in radiometric response during a year (%).
BandMSIOLIMODISWFV
Blue −0.73−0.93−0.18−7.26
Green −1.61−1.44−0.69−10.94
Red −3.23−1.66−1.12−12.16
NIR −1.62−1.59−1.34−15.83
Mean of all bands−1.80−1.40−0.83−11.55
Table 4. The relative difference in radiometric response (%).
BandsWFV & MSIWFV & OLIWFV & MODISWFV & Mean *
Blue 0.552.53−0.990.70
Green −1.95−1.65−6.05−3.22
Red−7.37−4.33−8.33−6.68
NIR−8.29−10.84−17.88−12.34
* Mean in this location is the mean value of MSI, OLI and MODIS in column 4, Table 4.
Table 5. AODs of WFV images.
Acquisition Time (YYYY/MM/DD)AOD (550 nm)Acquisition Time (YYYY/MM/DD)AOD (550 nm)
2019/03/080.29422019/07/250.4612
2019/03/200.05582019/09/040.4654
2019/03/240.13582019/09/250.2703
2019/04/140.05772019/09/290.3138
2019/04/220.31982019/10/070.0995
2019/07/050.16252019/10/110.3514
Table 6. 6S parameters.
ParameterNumber of ParametersValue
Date2{June 1, December 1}
Solar zenith170~80, interval 5
Solar azimuth130~360, interval 30
View zenith170~80, interval 5
View azimuth130~360, interval 30
Wavelength 4Band1~band4
Surface reflectance110~0.5, interval 0.05
AOD set9{0, 0.01, 0.02, 0.05, 0.1, 0.2, 0.4, 0.6, 0.8}
Table 7. Calibration coefficients of GF-6/WFV.
Date
(YYYY/MM/DD)
Blue BandGreen BandRed BandNIR Band
GainGainGainGain
2019/03/080.0606 ± 0.00010.0511 ± 0.00030.0521 ± 0.0005 0.0335 ± 0.0001
2019/03/200.0590 ± 0.00010.0493 ± 0.0001 0.0508 ± 0.0001 0.0329 ± 0.0001
2019/03/240.0565 ± 0.00040.0463 ± 0.0004 0.0463 ± 0.0002 0.0302 ± 0.0002
2019/04/140.0655 ± 0.00070.0557 ± 0.0006 0.0565 ± 0.0003 0.0362 ± 0.0001
2019/04/220.0699 ± 0.00050.0565 ± 0.0003 0.0556 ± 0.0002 0.0366 ± 0.0003
2019/07/050.0709 ± 0.00090.0600 ± 0.0006 0.0609 ± 0.0003 0.0375 ± 0.0002
2019/07/250.0609 ± 0.00070.0481 ± 0.0005 0.0475 ± 0.00040.0349 ± 0.0002
2019/09/040.0689 ± 0.00070.0549 ± 0.00060.0542 ± 0.0005 0.0377 ± 0.0002
2019/09/250.0779 ± 0.00080.0663 ± 0.00070.0689 ± 0.0006 0.0433 ± 0.0002
2019/09/290.0714 ± 0.00050.0578 ± 0.0004 0.0582 ± 0.0003 0.0366 ± 0.0002
2019/10/070.0667 ± 0.00020.0553 ± 0.0003 0.0572 ± 0.0001 0.0355 ± 0.0001
2019/10/110.0689 ± 0.00040.0543 ± 0.0002 0.0539 ± 0.0003 0.0356 ± 0.0002
Table 8. Parameters of synchronized ground measurements at Dunhuang.
DateSatellite Transit Time (UTC)Solar Azimuth Angle (°)Solar Zenith Angle (°)View Azimuth Angle (°)View Zenith Angle (°)AOD (550 nm)WV (g/cm2)
2019072705:10:48155.6110 22.3860 299.0170 26.7417 0.1950 0.8771
2019080805:03:53154.8450 25.7393 305.8480 15.9232 0.23241.0178
2019081205:01:35154.8700 26.9710 312.2140 12.1461 0.2982 0.7518
2019082405:54:38155.4910 30.9459 35.8970 6.2175 0.3142 0.6545
Table 9. Validation results for GF-6/WFV’s cross-calibration results.
Value typeTOA radiance calculated from cross-calibration coefficients
DateBand1Band2Band3Band4
20190727105.25 ± 0.15 101.55 ± 0.15 87.14 ± 0.13 60.32 ± 0.09
20190808111.33 ± 0.16 107.65 ± 0.15 92.23 ± 0.14 62.45 ± 0.09
20190812102.24 ± 0.15 9890 ± 0.15 84.49 ± 0.1357.44 ± 0.09
20190824104.30 ± 0.16 102.81 ± 0.15 88.94 ± 0.13 60.71 ± 0.09
Value typeTOA radiance calculated from cross-calibration coefficients
DateBand1Band2Band3Band4
20190727101.12 ± 0.20 100.89 ± 0.20 89.23 ± 0.18 61.48 ± 0.12
20190808106.70 ± 0.21 103.35 ± 0.20 91.03 ± 0.17 64.61 ± 0.13
2019081298.45 ± 0.19 98.05 ± 0.20 85.68 ± 0.16 54.61 ± 0.11
20190824105.62 ± 0.21 103.50 ± 0.21 88.02 ± 0.18 58.55 ± 0.12
Value typeRelative error (%) of the two TOA radiance calculations
DateBand1Band2Band3Band4
201907274.00 ± 0.240.65 ± 0.25 2.37 ± 0.25 1.90 ± 0.25
201908084.25 ± 0.24 4.08 ± 0.24 1.31 ± 0.24 3.40 ± 0.25
201908123.78 ± 0.25 0.86 ± 0.251.40 ± 0.24 5.05 ± 0.25
201908241.26 ± 0.25 0.67 ± 0.24 1.04 ± 0.25 3.62 ± 0.25
Table 10. Uncertainty of the GF-6/WFV’s cross-calibration procedure.
NumberUncertainty SourceUncertainty
BlueGreenRedNIR
(1) 6 S   model   ( σ 1 ) 1.6%1.6%1.6%1.6%
(2) DN   ( σ 2 ) 0.01%0.02%0.04%0.05%
(3) Sun   irradiance   ( σ 3 ) <0.01%<0.01%<0.01%<0.01%
(4) View   Angle   ( σ 4 ) <0.01%<0.01%<0.01%<0.01%
(5) BRDF   LUT   ( σ 5 ) 2.13%2.47%3.36%3.77%
(6) AOD   ( σ 6 ) 0.38%0.20%0.15%0.22%
(7) WV   product   ( σ 7 ) 0.02%0.03%0.13%0.57%
(8) Spectral   matching   factor   calculation   ( σ 8 ) 2.0%2.0%2.0%2.0%
Total   uncertainty   ( σ O ) *3.35%3.56%4.23%4.60%
* σ O = σ 1 2 + σ 2 2 + σ 3 2 + σ 4 2 + σ 5 2 + σ 6 2 + σ 7 2 + σ 8 2 .

