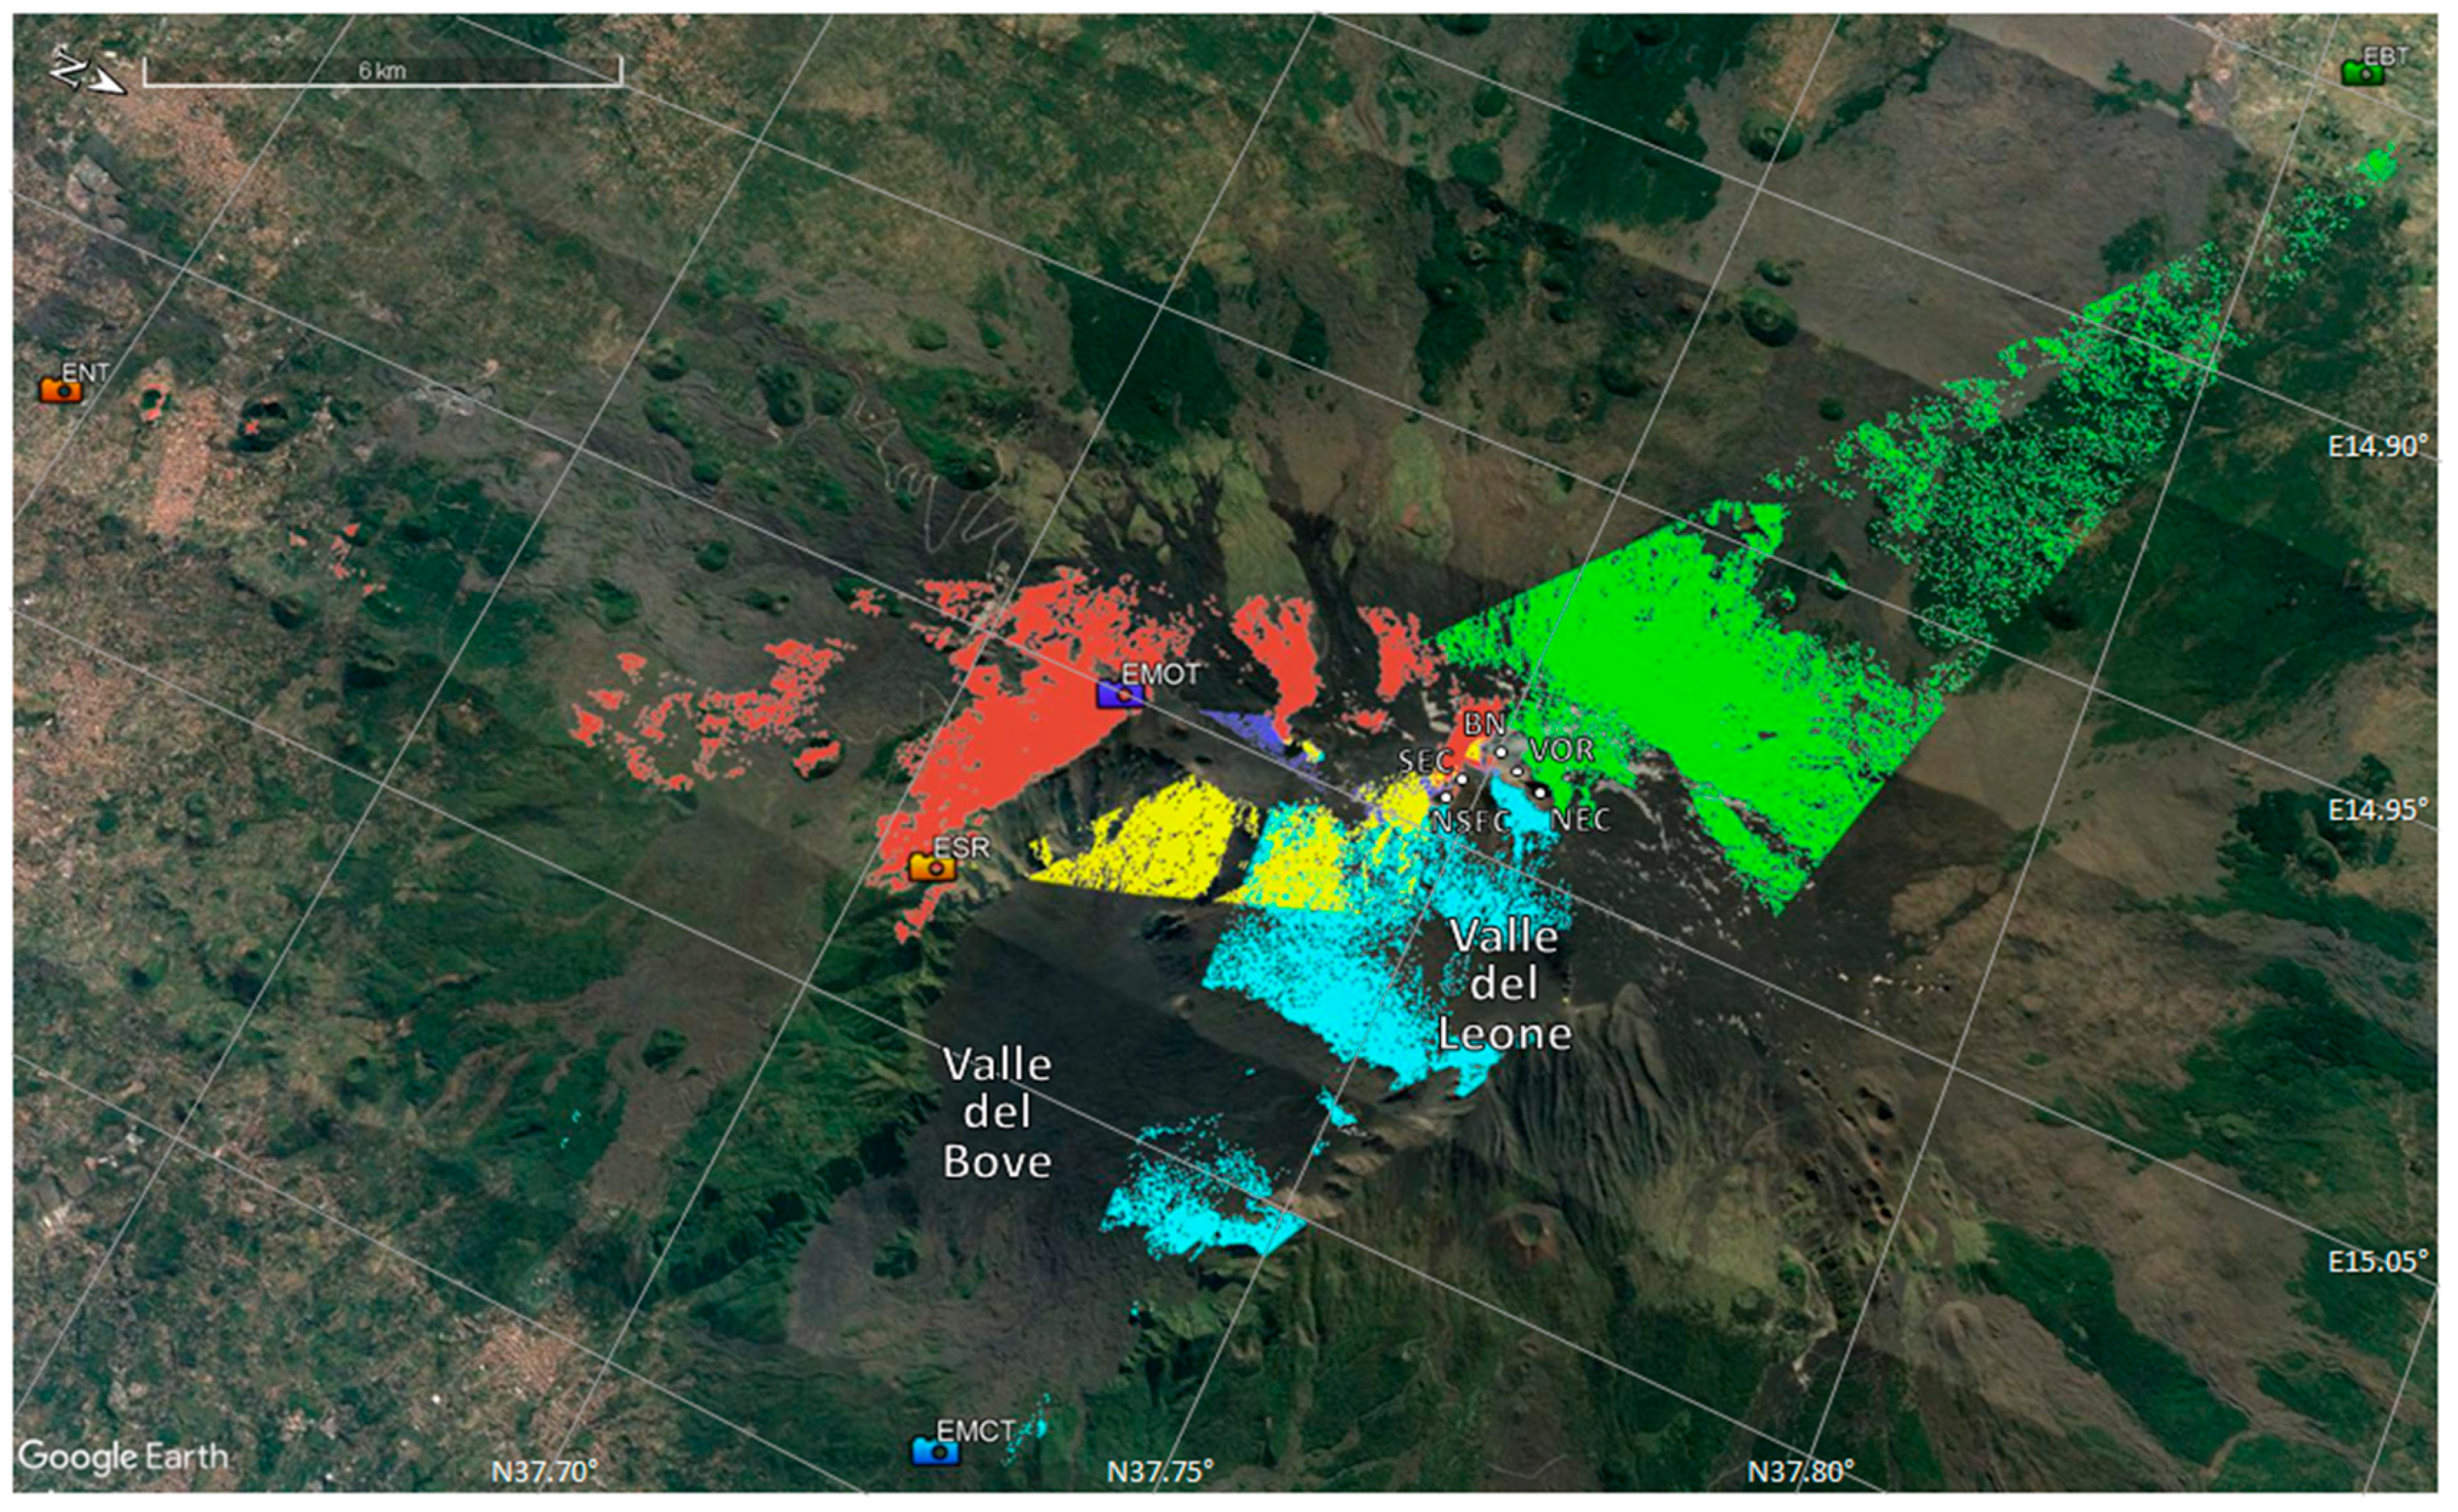
Figure 1.
Location of thermal cameras on Etna. Google Earth view of summit area with the five active craters: North-East Crater (NEC), Voragine (VOR), Bocca Nuova (BN), South-East Crater (SEC) and New South-East Crater (NSEC). “Valle del Bove” is a huge depression on Etna’s eastern flank. “Valle del Leone” is the northern east part of “Valle del Bove”. Colors represent the different views of the thermal cameras: ENT (red), ESR (yellow), EMOT (violet), EBT (green) and EMCT (azure).
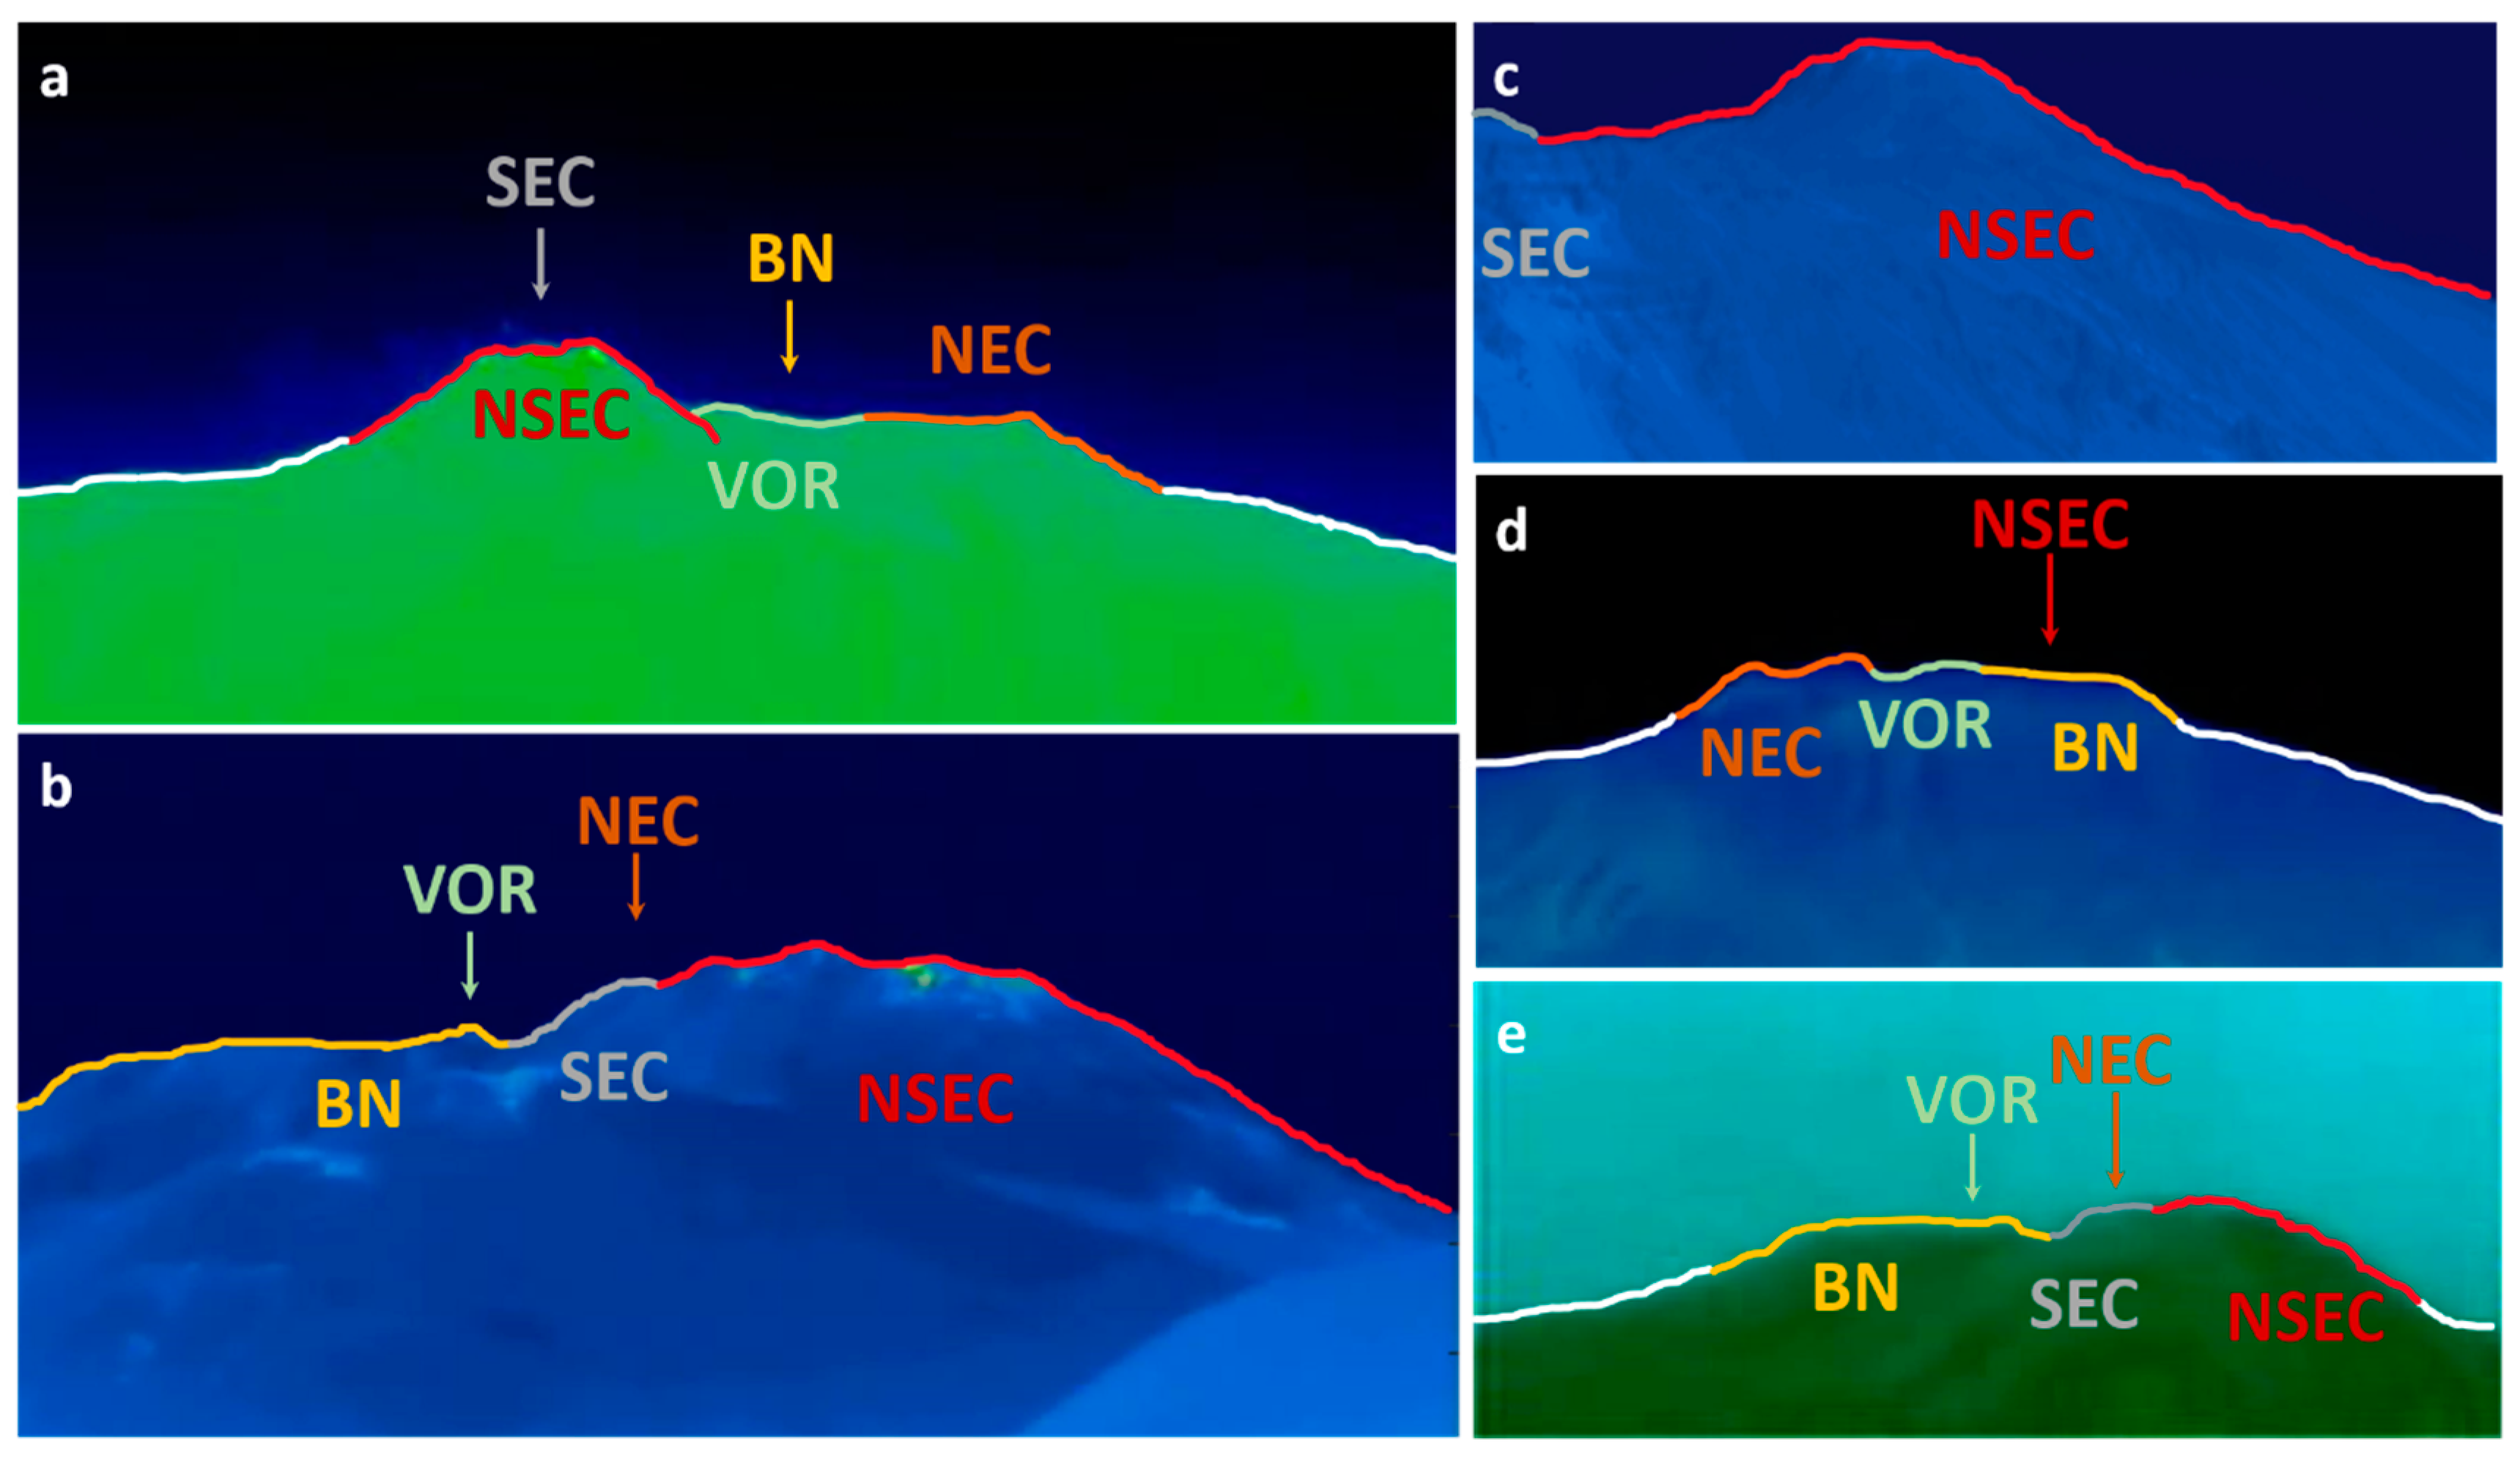
Figure 2.
Summit area views from EMCT (a), EMOT (b), ESR (c), EBT (d), and ENT cameras. Each color curve is associated with the corresponding summit crater name, while the arrows indicate that the corresponding craters are out of sight. The white curve delimits the outline of the flanks of Etna.
Figure 2.
Summit area views from EMCT (a), EMOT (b), ESR (c), EBT (d), and ENT cameras. Each color curve is associated with the corresponding summit crater name, while the arrows indicate that the corresponding craters are out of sight. The white curve delimits the outline of the flanks of Etna.
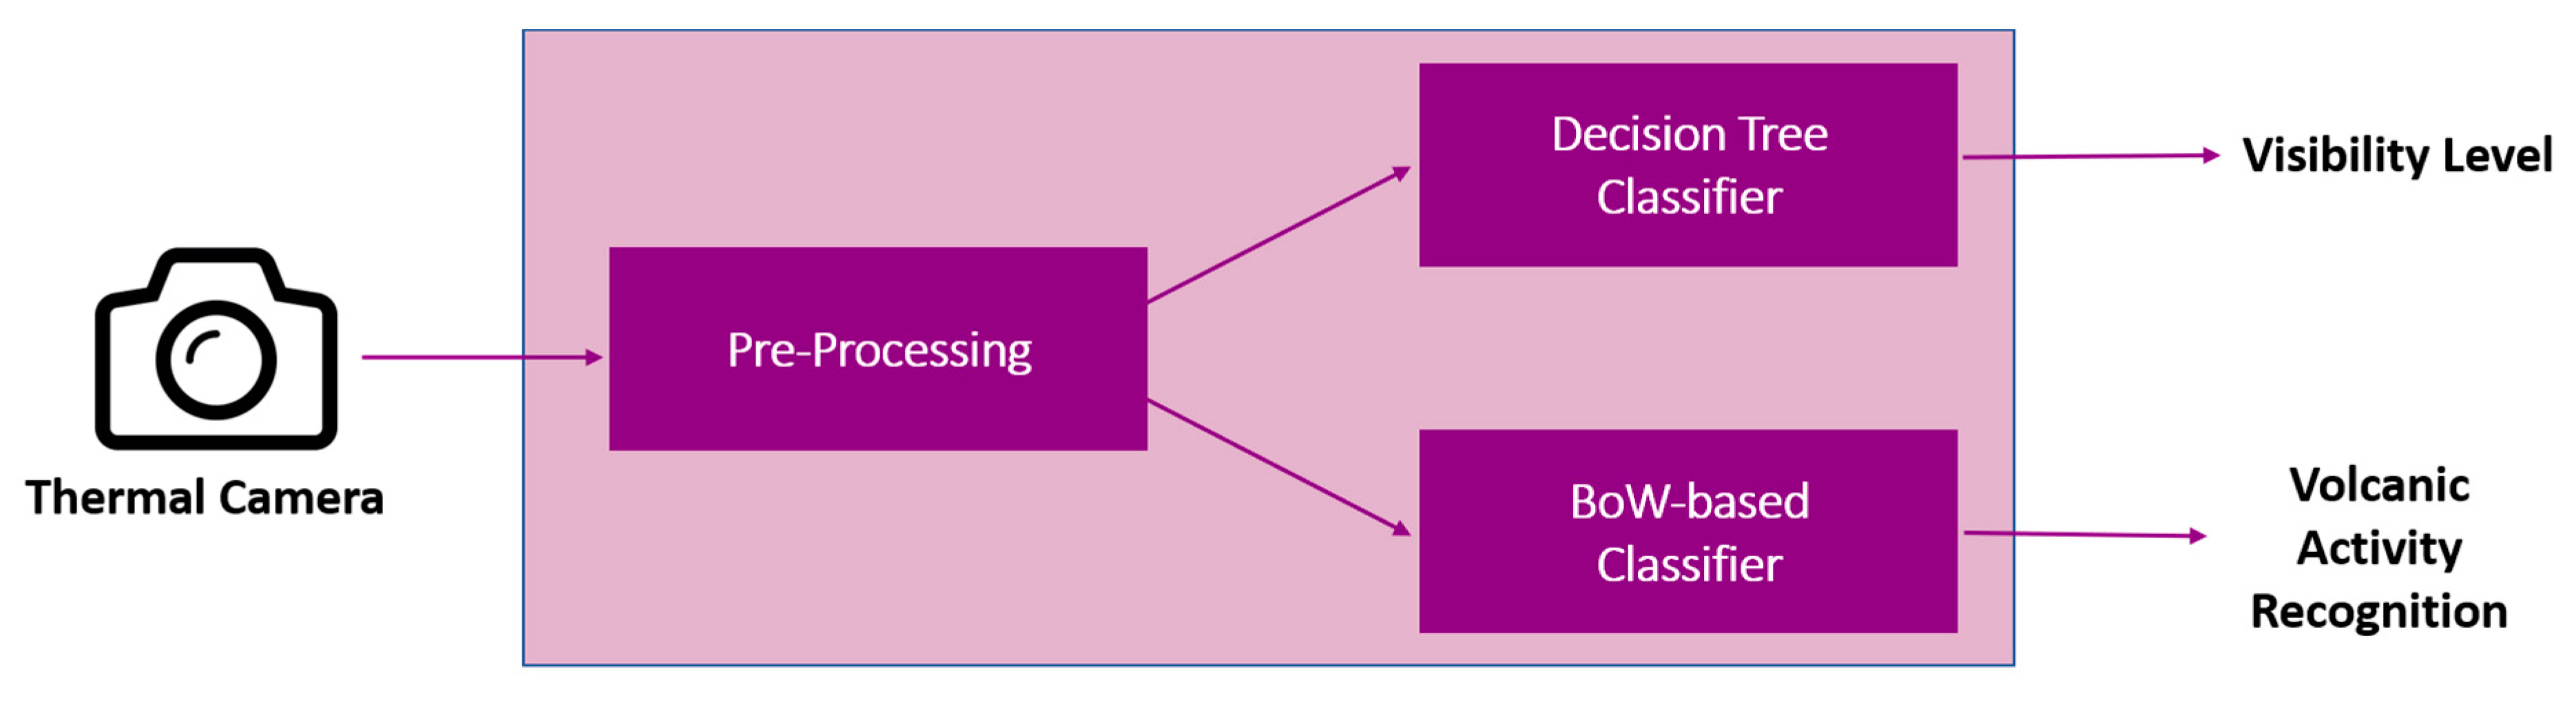
Figure 3.
The scheme of the machine learning classifier of thermal images composed of 3 tasks: (i) preprocessing; (ii) decision tree classifier; and (iii) BoW-based classifier.
Figure 3.
The scheme of the machine learning classifier of thermal images composed of 3 tasks: (i) preprocessing; (ii) decision tree classifier; and (iii) BoW-based classifier.
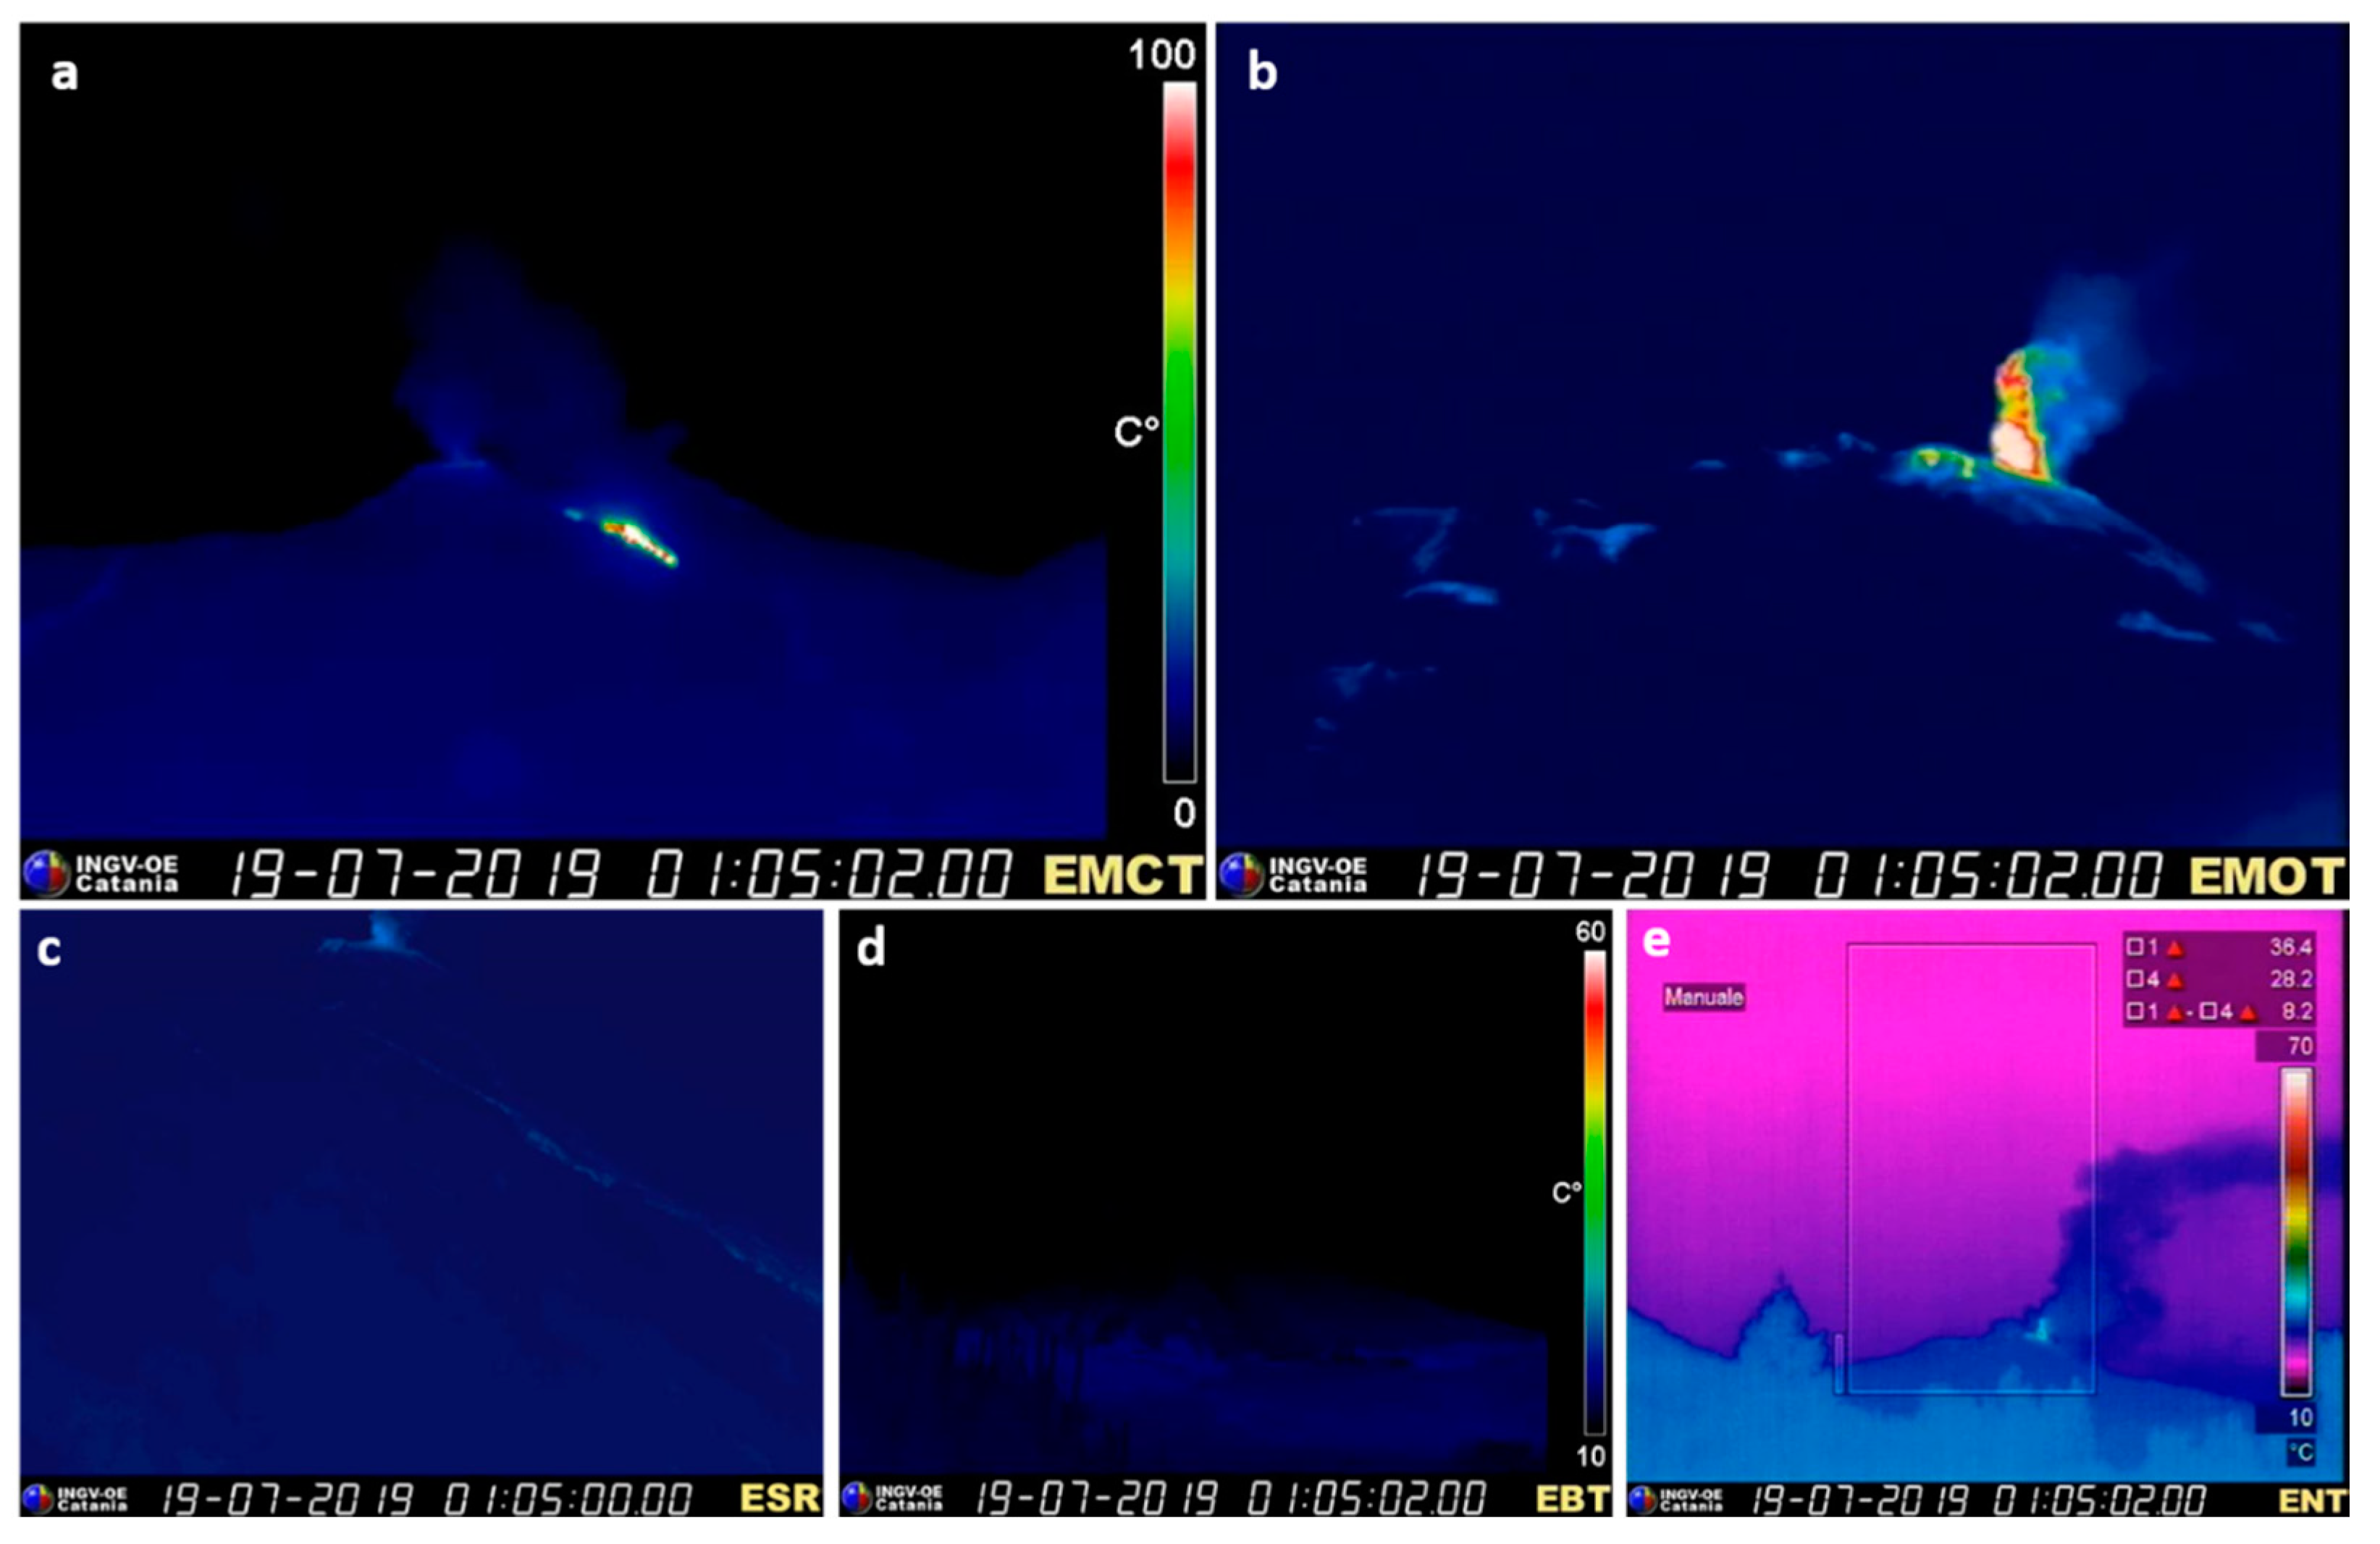
Figure 4.
Raw images as acquired on 19 July, 2019 at 01:05 UTC by EMCT (a), EMOT (b), ESR (c), EBT (d) and I (e). The ESR camera has a lower frame rate than the others, i.e., 2fps; for this case, the ESR image closer to the other cameras is shown. The monitored scene shows the Strombolian activity which started on the 15 of July, 2019 together with a lava flow produced by the opening of the new vent on the lower northeastern side of the NSEC on 18 July, 2019.
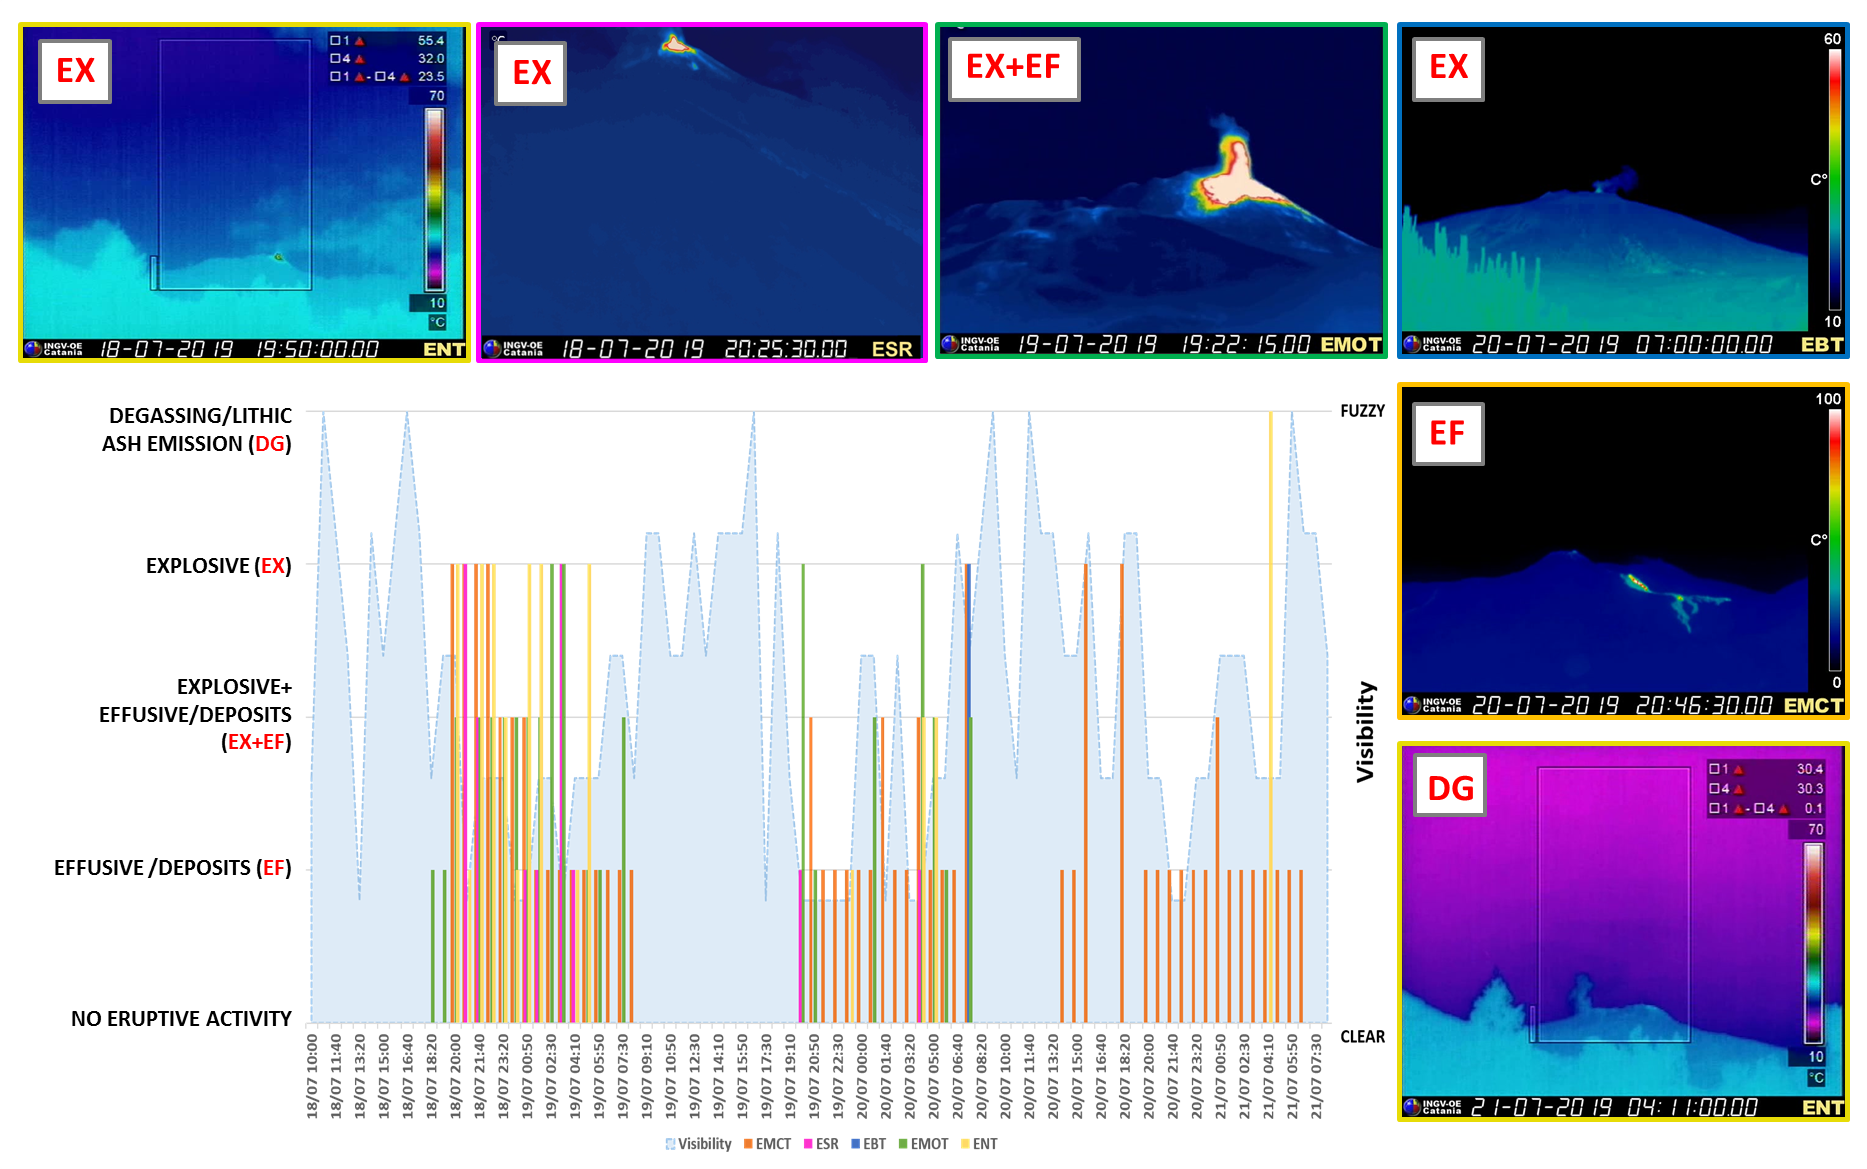
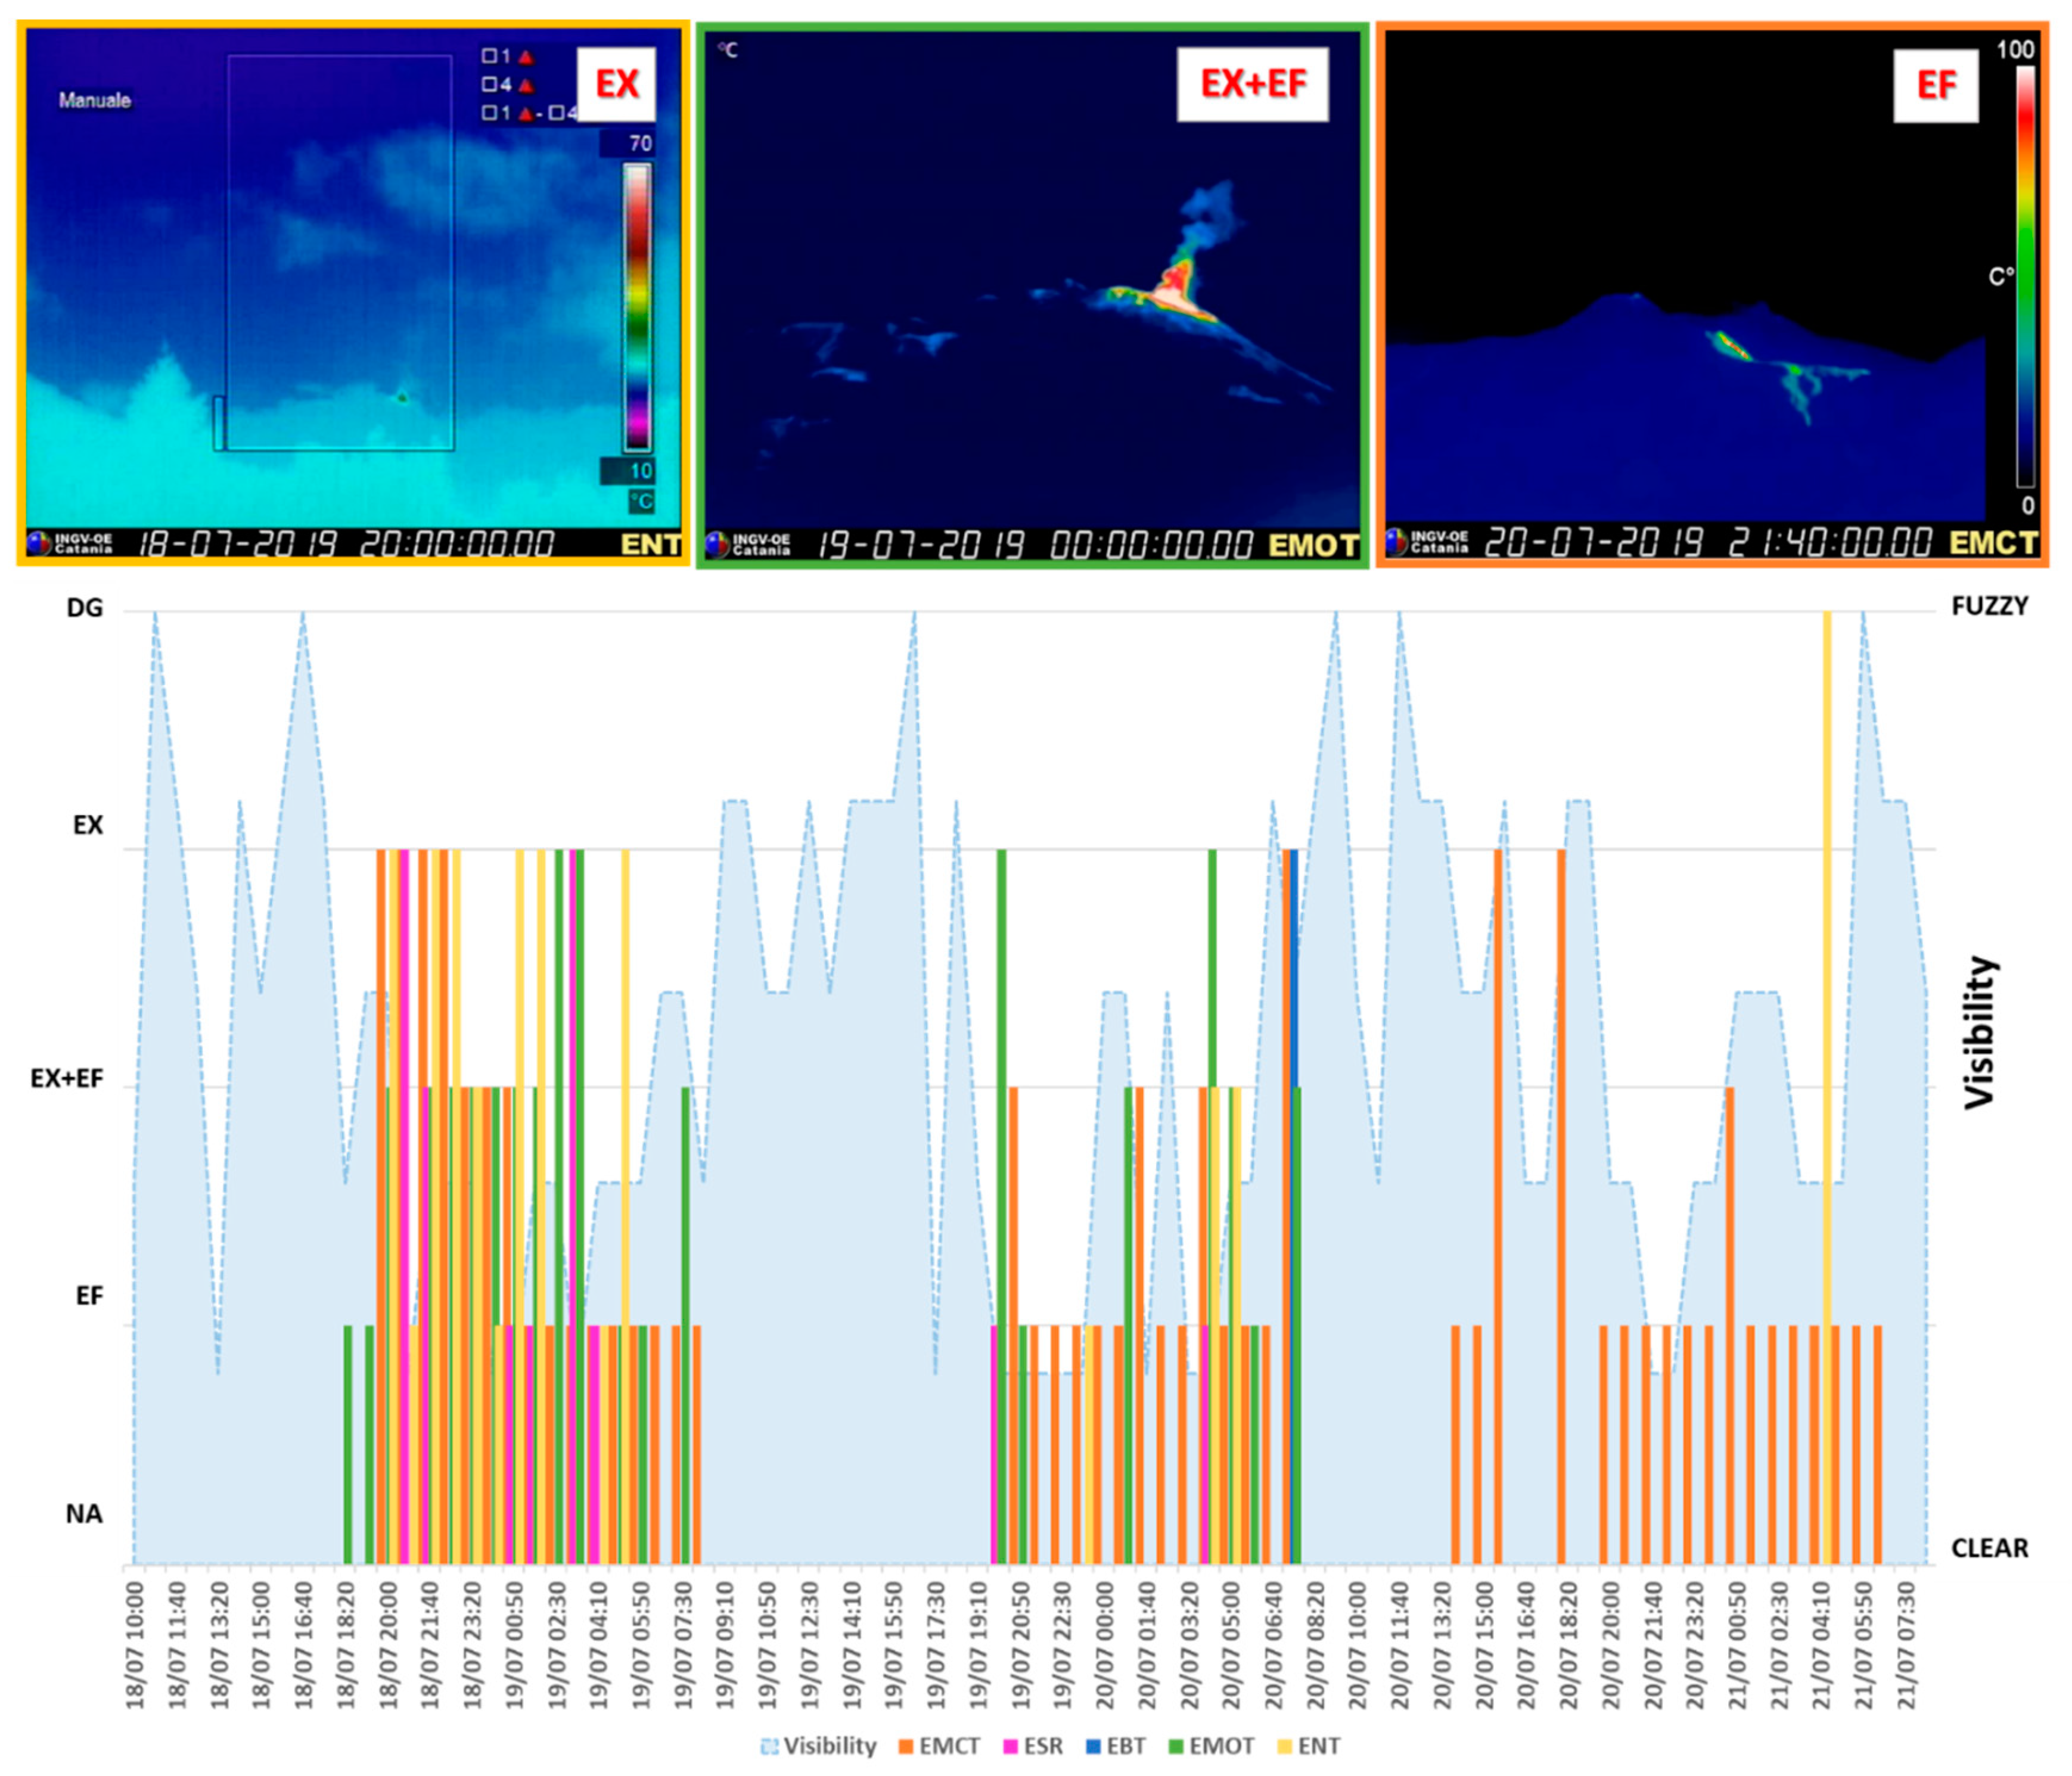
Figure 5.
Volcanic activity evolution detected by the ML algorithm from the 18th to the 21st July, 2019. “DG”, “EX”, “EX+EF”, “EF” and “NA” stand for degassing, explosive, explosive and effusive, effusive and no activity respectively. The visibility index is given by the average of the visibility indexes for all the cameras.
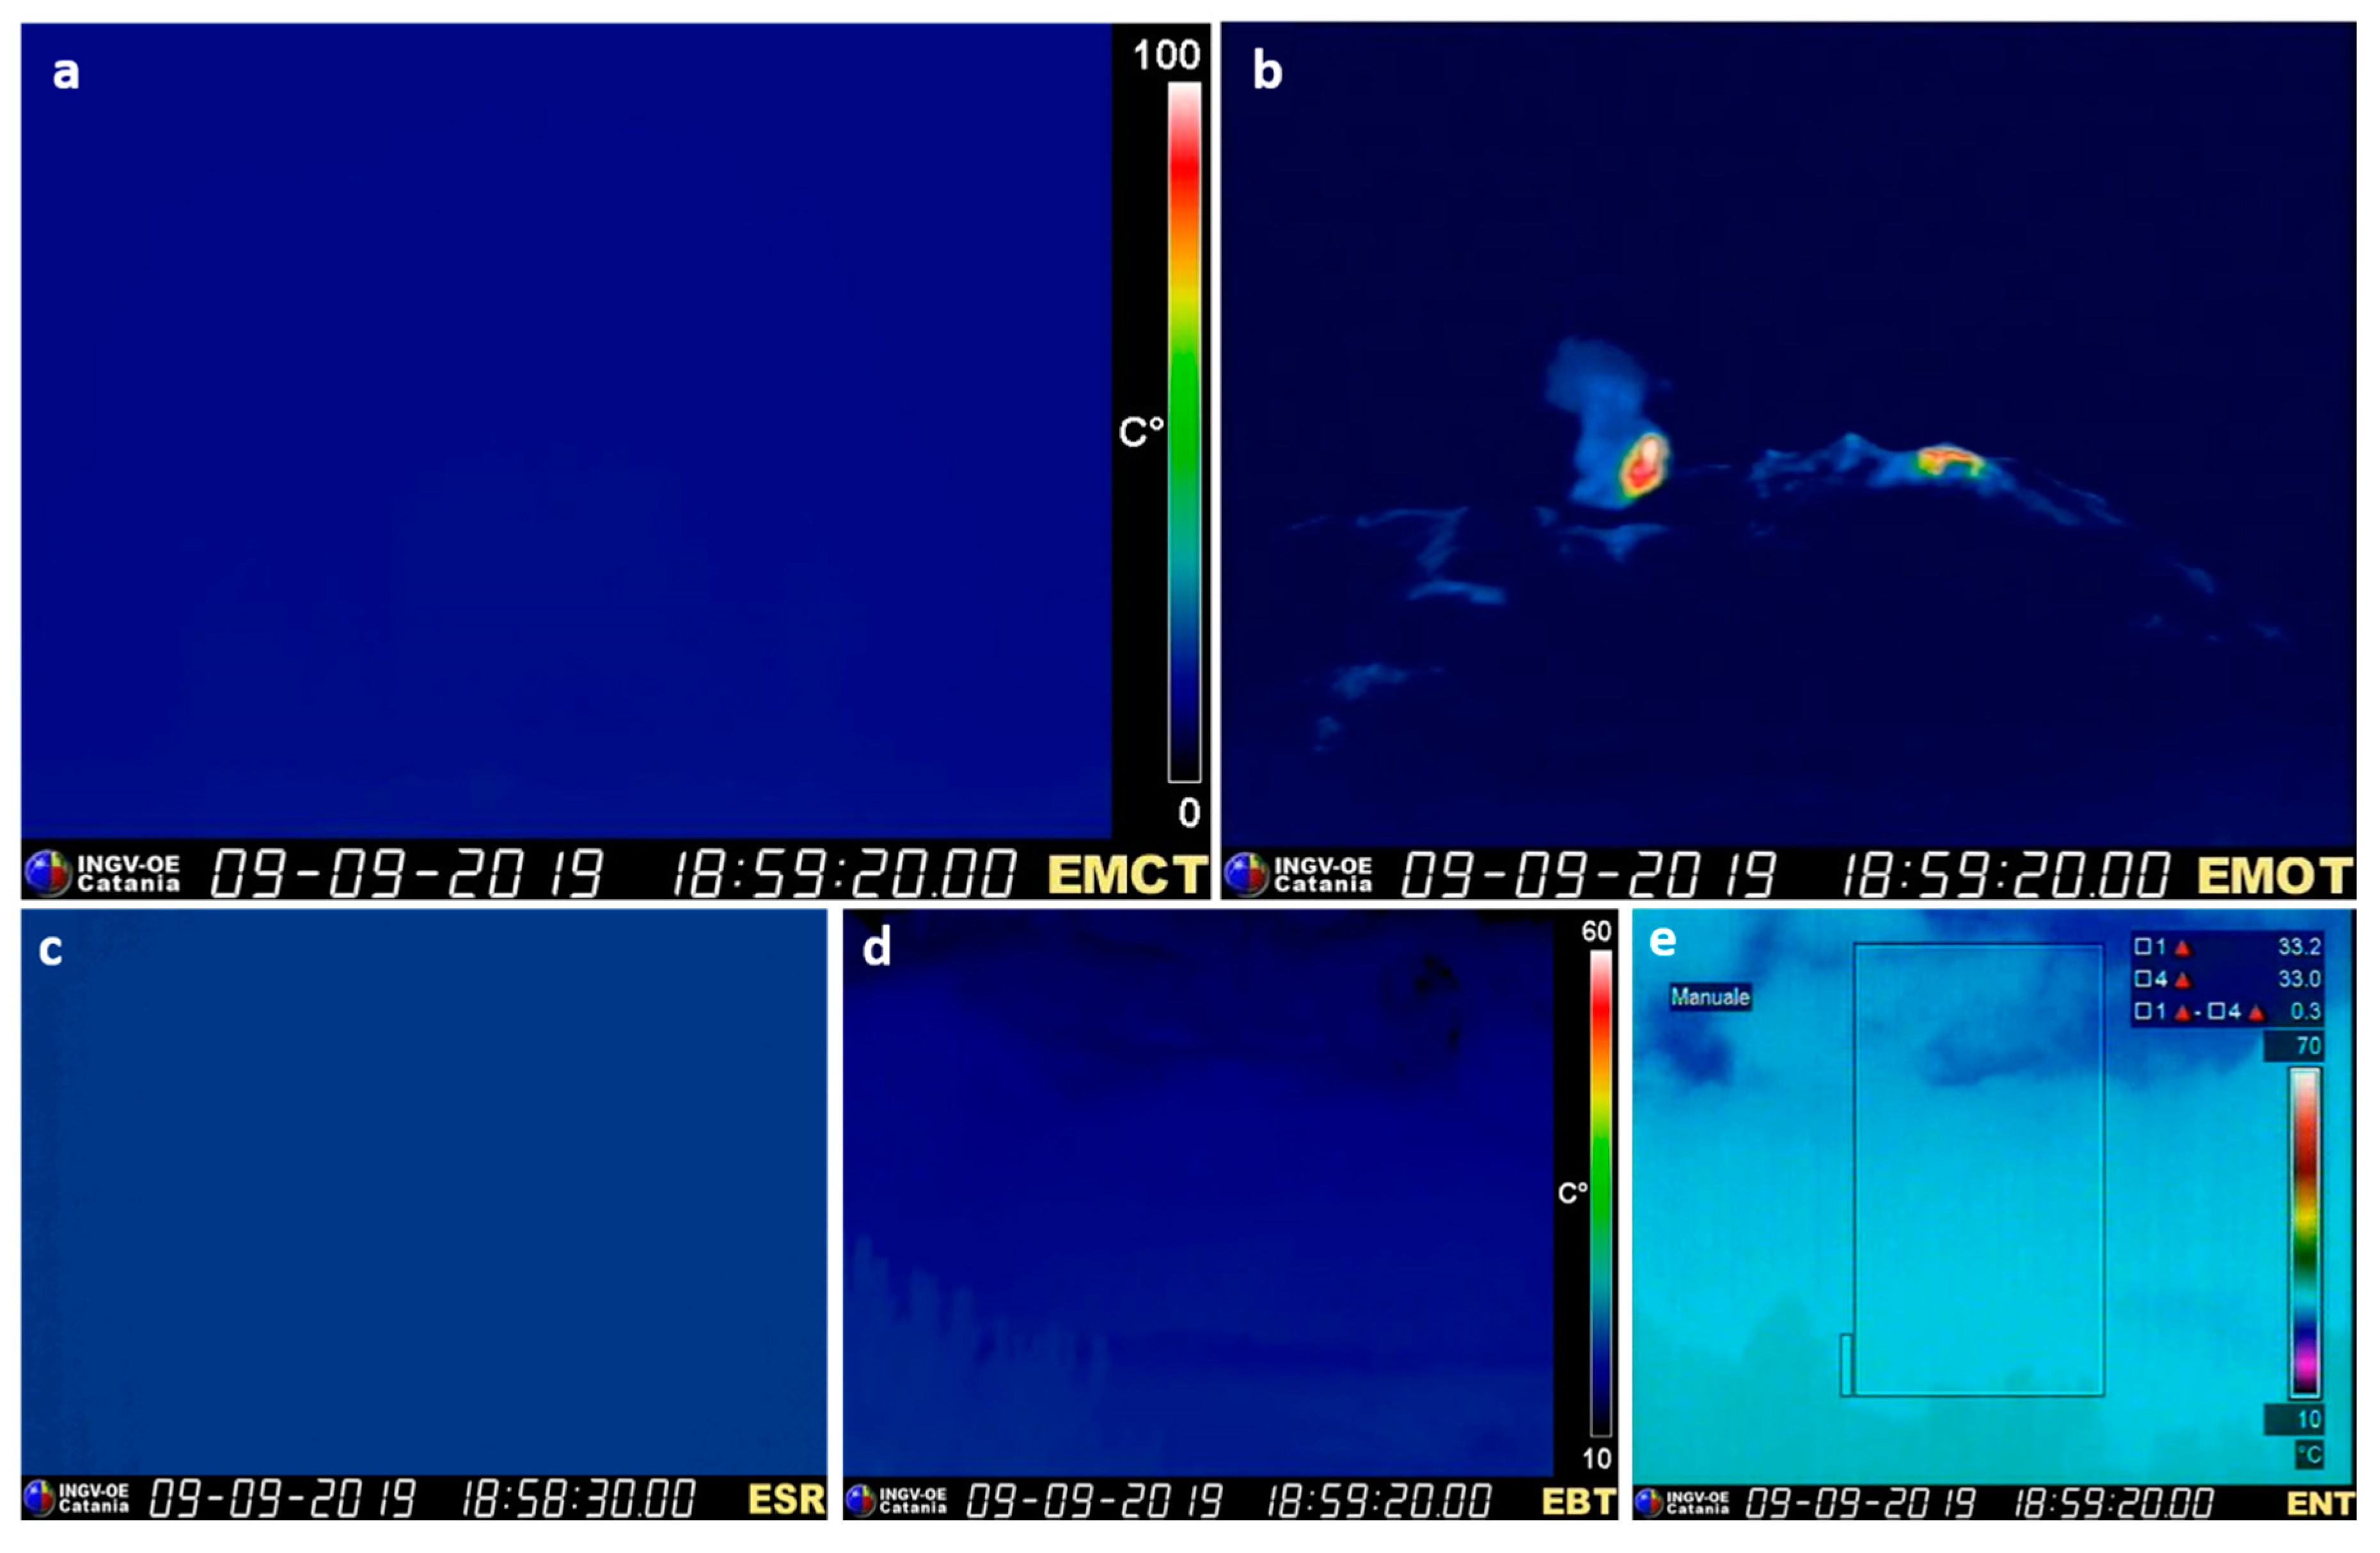
Figure 6.
Raw images as acquired on 9 September, 2019 at 18:58:20 UTC by EMCT (a), EMOT (b), ESR (c), EBT (d) and ENT (e). The ESR camera has a lower frame rate than the others, i.e., 2fps; for this case, the ESR image closer to the other cameras is shown. The monitored scene shows the Strombolian activity which started on the first half of September and was only just detected because of the low visibility conditions.
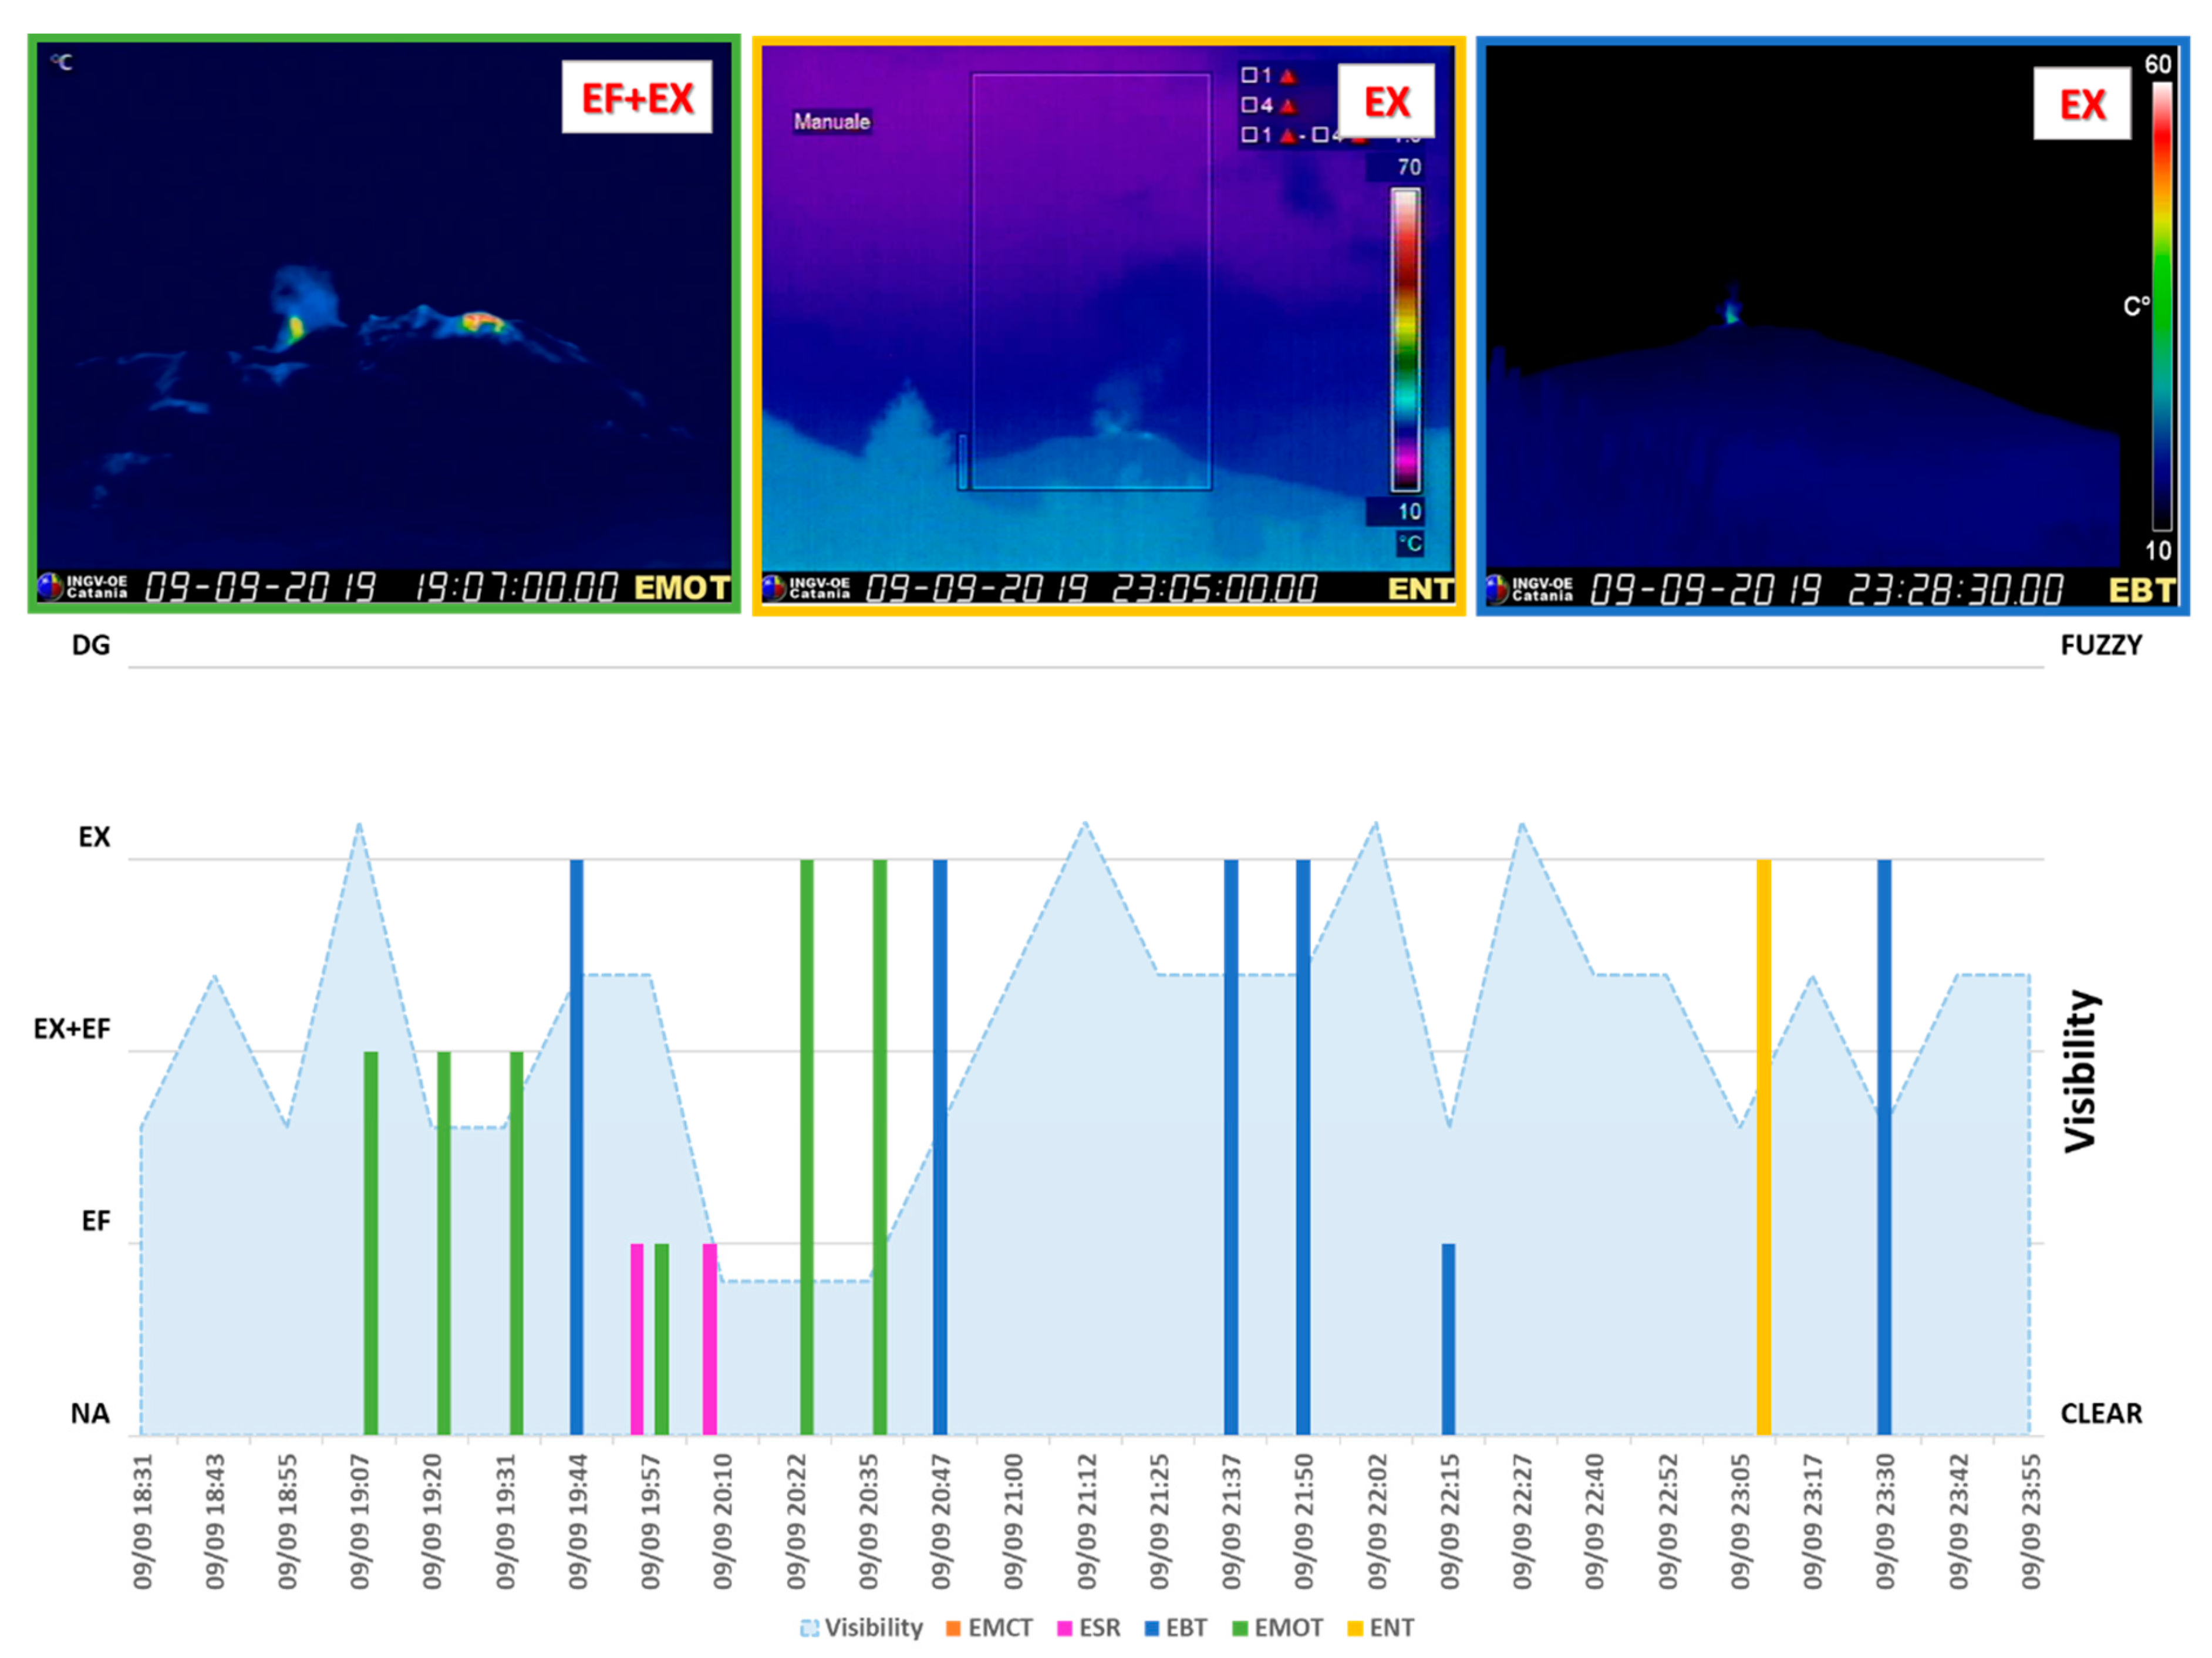
Figure 7.
Volcanic activity evolution detected by the ML algorithm from the 18:26 to 23:38 UTC of 9 September, 2019. “DG”, “EX”, “EX+EF”, “EF” and “NA” stand for degassing, explosive, explosive and effusive, effusive and no activity respectively. The visibility index is given by the average of the visibility indexes for all the cameras.
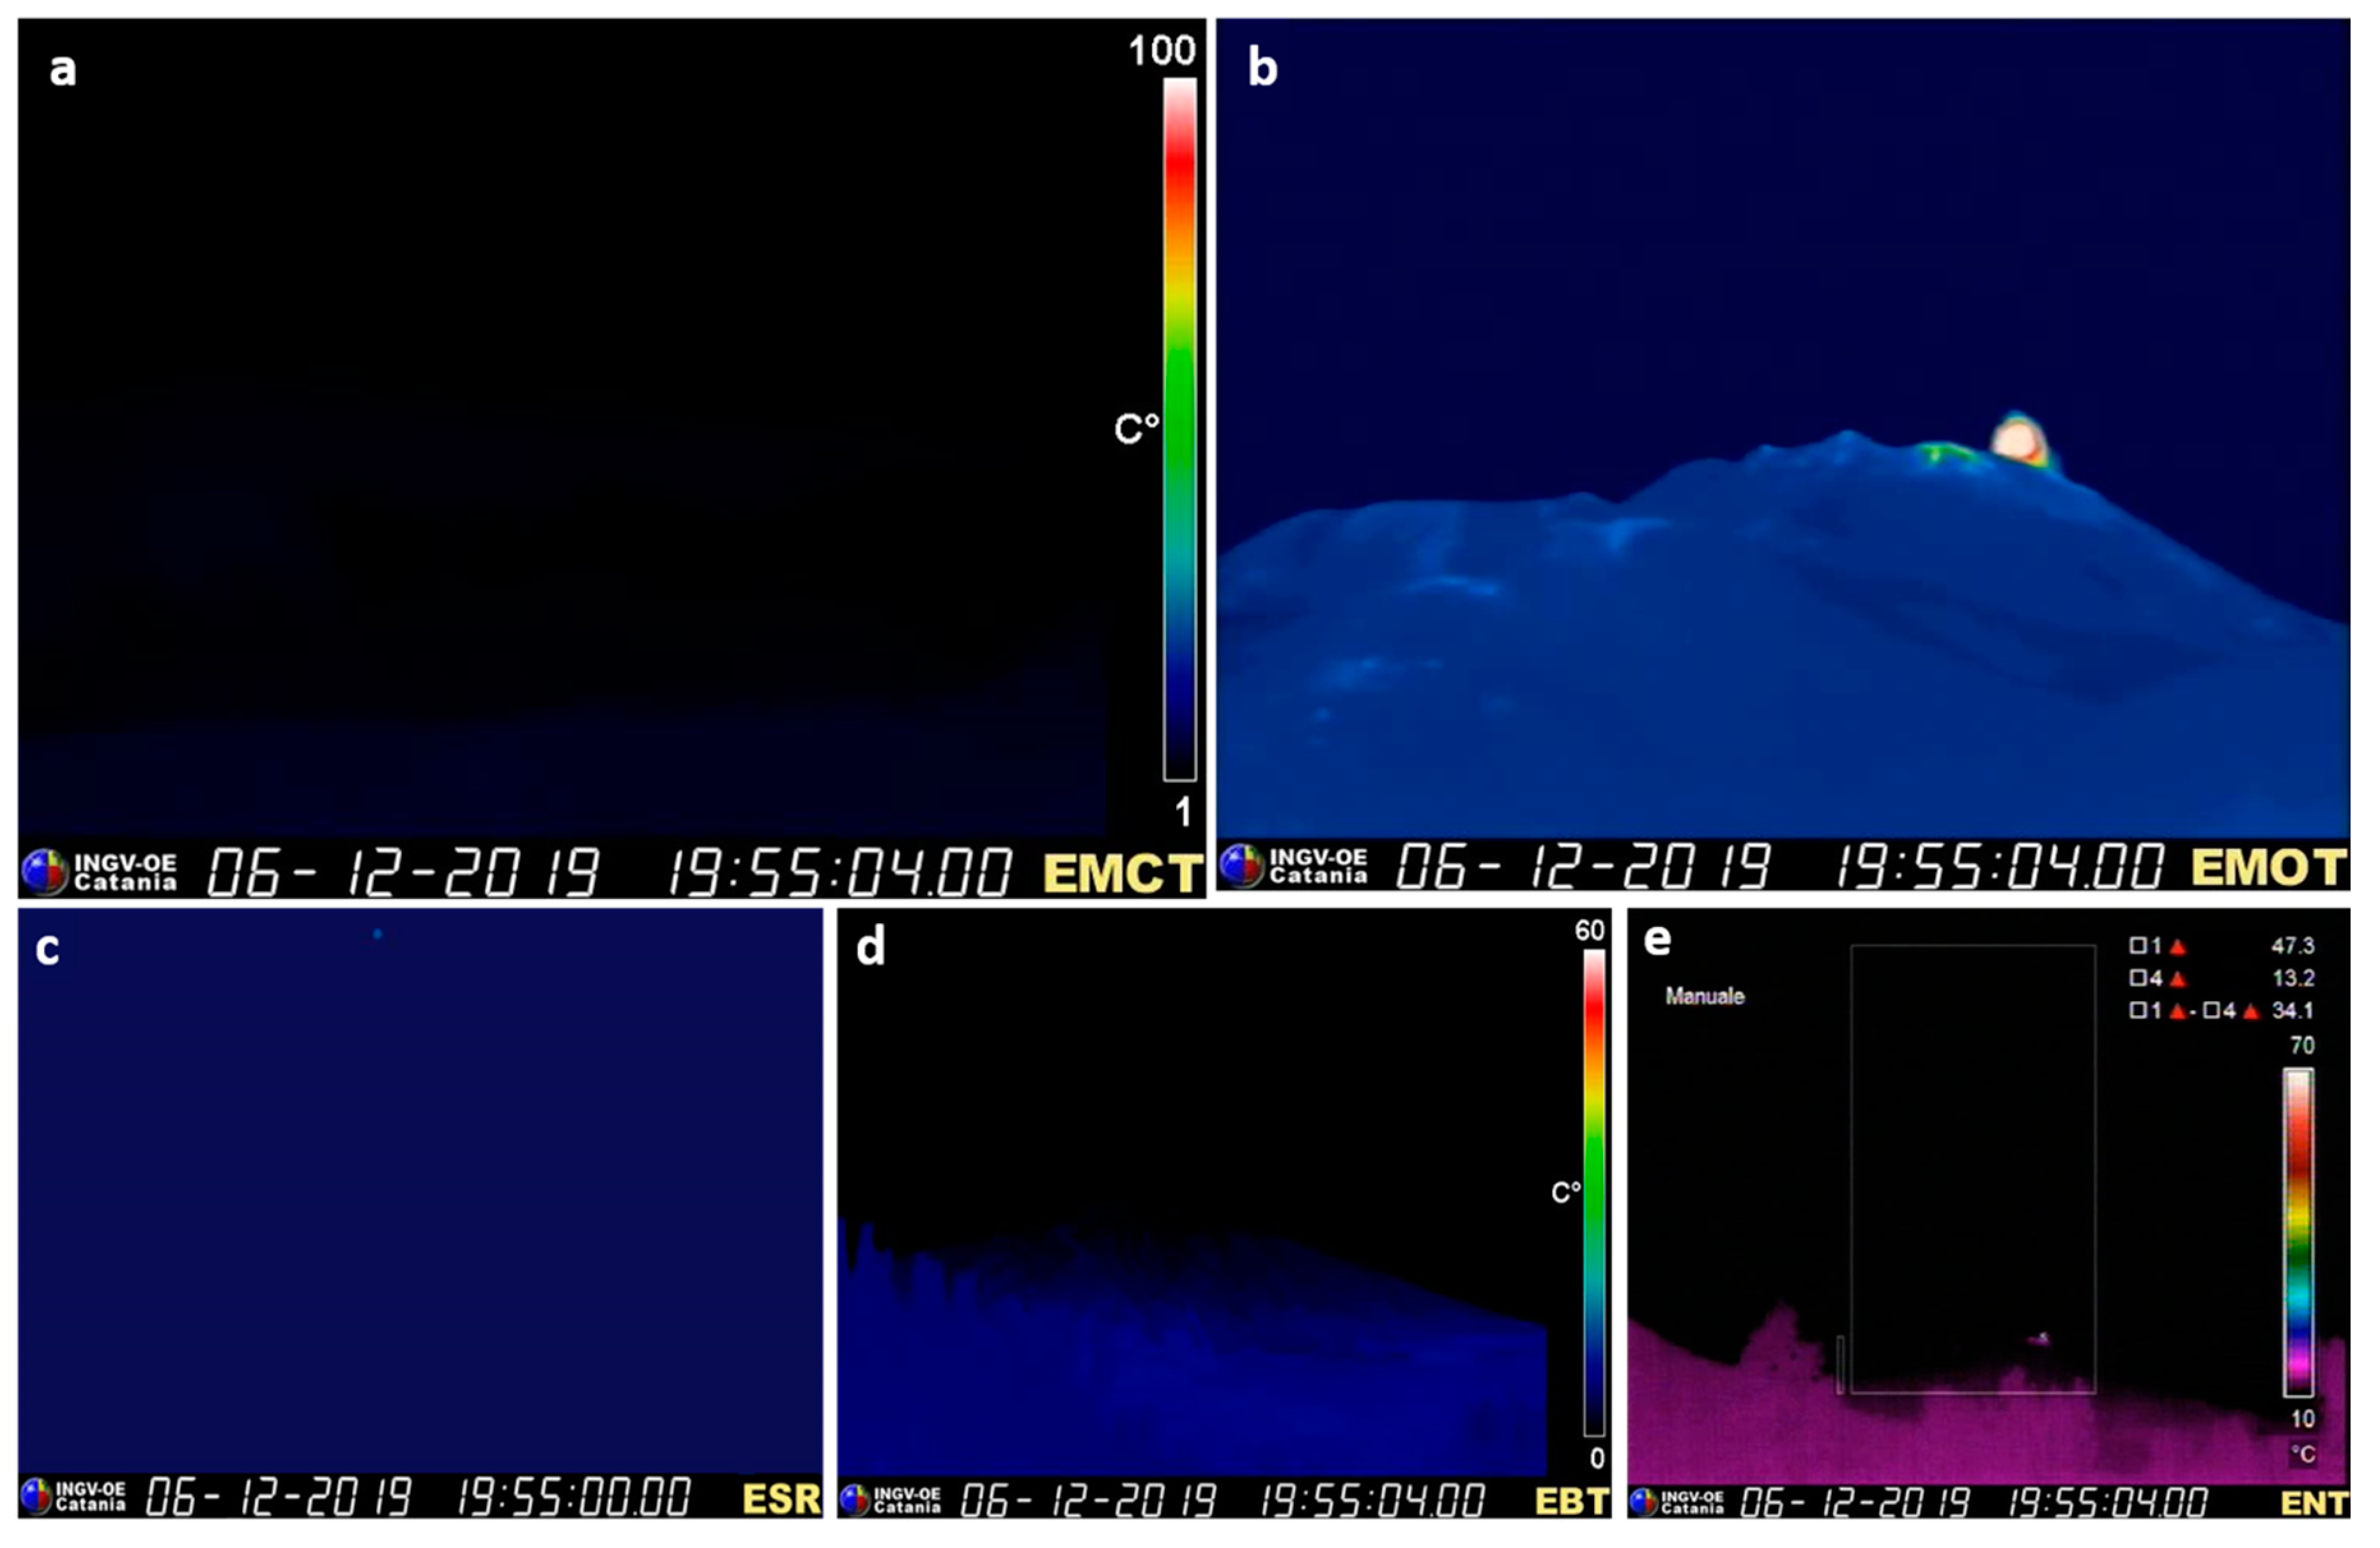
Figure 8.
Raw images acquired on 6 December, 2019 at 19:55:04 UTC by EMCT (a), EMOT (b), ESR (c), EBT (d) and ENT (e). The ESR camera has a lower frame rate than the others, i.e., 2fps; for this case, the ESR image closer to the other cameras is shown. The monitored scene showed the Strombolian activity started on 6 December, 2019, and was clearly visible from EMOT and ENT cameras.
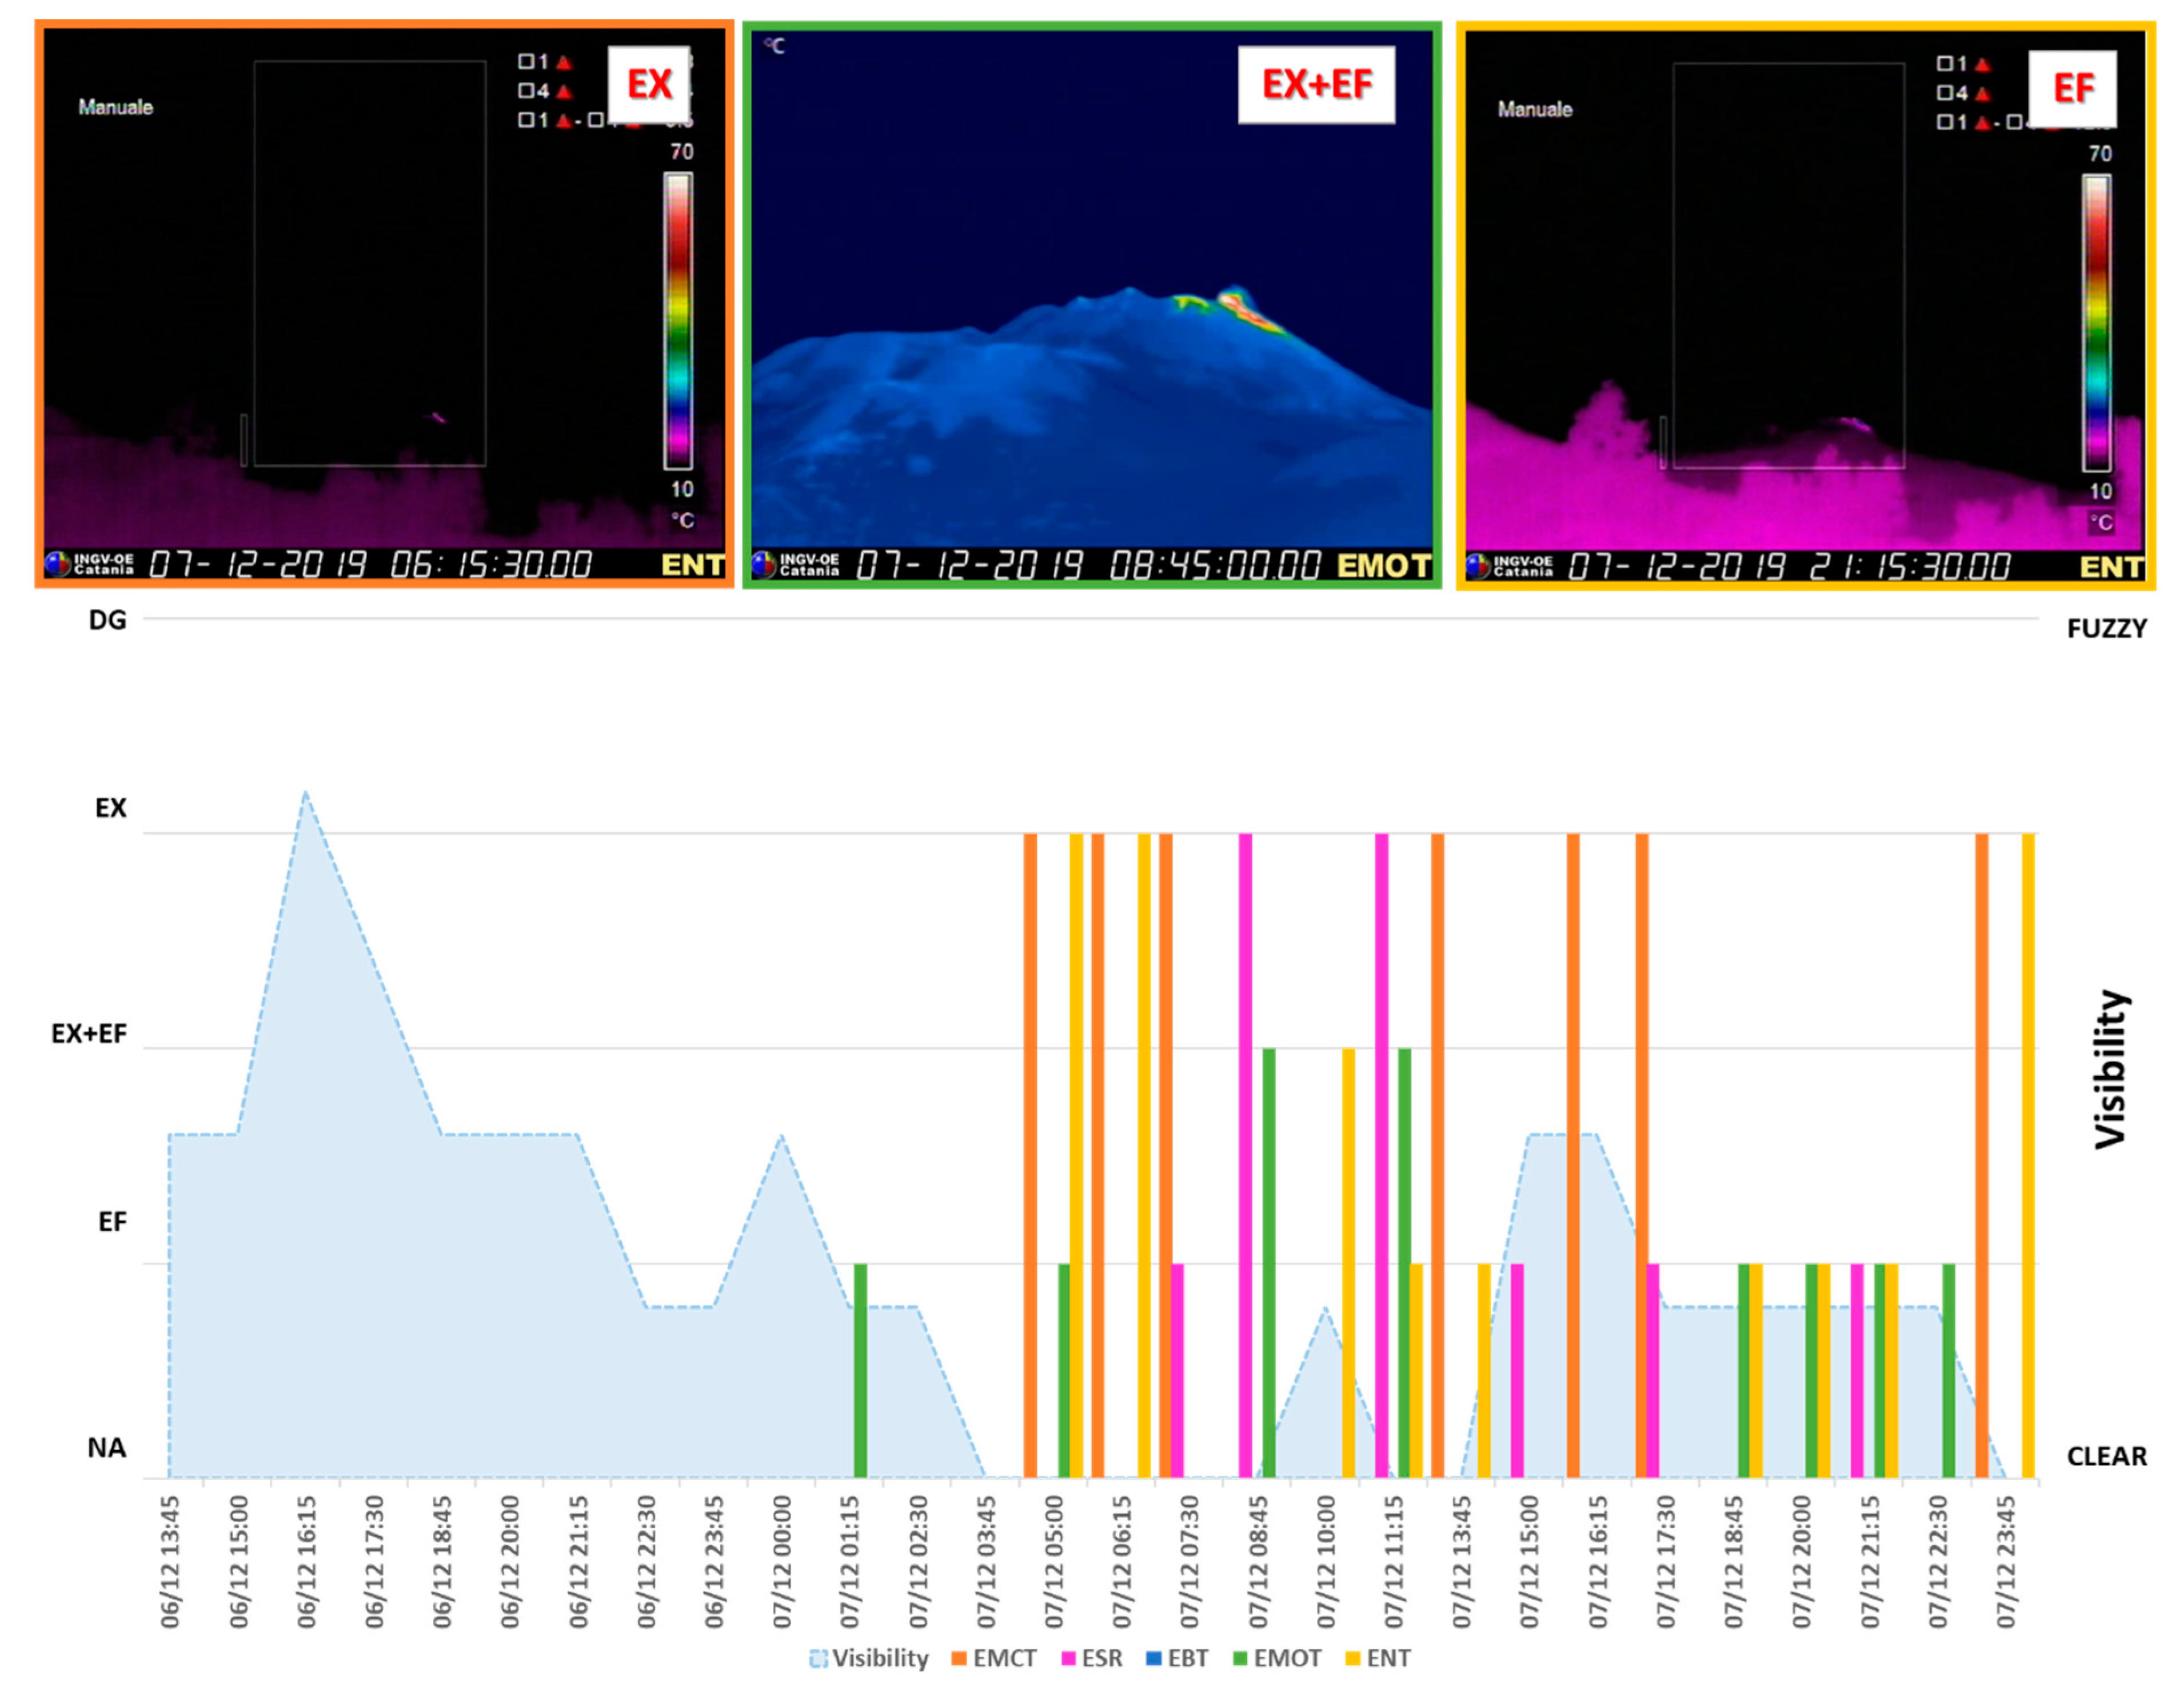
Figure 9.
Volcanic activity evolution detected by the ML algorithm from 6 to 7 December, 2019. “DG”, “EX”, “EX+EF”, “EF” and “NA” stand for degassing, explosive, explosive and effusive, effusive and no activity respectively. The visibility index is given by the average of the visibility indexes for all the cameras.
Table 1.
Thermal cameras comprising the INGV network installed on Etna. For each camera, the main features are reported (location, distance from the summit, elevation, field of view and model).
Table 1.
Thermal cameras comprising the INGV network installed on Etna. For each camera, the main features are reported (location, distance from the summit, elevation, field of view and model).
| Camera | Location | Distance from Summit | Elevation | Field of View | Model |
|---|
| EMOT | La Montagnola | 3 km S | 2600 m a.s.l. | 18.8° × 25° | FLIR A320 |
| ESR | Schiena dell’Asino | ~5 km SSE | 1985 m a.s.l. | 18.8° × 25° | FLIR A320 |
| EMCT | Monte Cagliato | 8.5 km ESE | 1160 m a.s.l. | 18.8° × 25° | FLIR A320 |
| EBT | Bronte | ~13 km WNW | 971 m a.s.l. | 18° × 24° | FLIR A320 |
| ENT | Nicolosi | 15 km S | 730 m a.s.l. | 18° × 24° | FLIR A40 |
Table 2.
Main activity categories and scenes outputted by the DT classifier.
Table 2.
Main activity categories and scenes outputted by the DT classifier.
| Visibility Category | Monitored Scene |
|---|
| “clear” | Sunny day, clear night, slightly foggy and slightly cloudy scenes |
| “fuzzy” | Heavily foggy and cloudy scenes |
Table 3.
Main activity categories and scenes outputted by the BoW-based classifier.
Table 3.
Main activity categories and scenes outputted by the BoW-based classifier.
| Activity Category | Monitored Scene |
|---|
| “degassing/lithic ash emission” | lithic ash emission or gas plume (without magmatic explosions) |
| “explosive” | Strombolian (with or without plume), lava fountain (with or without plume) and explosive activity in general |
| “explosive and effusive” | explosive activity with lava flow and/or incandescent deposits |
| “effusive” | effusive activity/incandescent deposits |
| “no activity” | no activity, low degassing/ash level, cooled lava flows and deposits |
Table 4.
Algorithm Outcomes of the DT and BoW-based classifiers for the eruptive activity occurred at SEC on 19 July, 2019.
Table 4.
Algorithm Outcomes of the DT and BoW-based classifiers for the eruptive activity occurred at SEC on 19 July, 2019.
| Thermal Camera | Visibility | Volcanic Activity |
|---|
| EMOT | “clear” | “explosive” |
| EMCT | “clear” | “effusive” |
| ESR | “clear” | “no activity” |
| ENT | “clear” | “explosive” |
| EBT | “clear” | “no activity” |
Table 5.
Algorithm Outcomes of the DT and BoW-based classifiers for the eruptive activity at NEC and VOR on 9 September, 2019.
Table 5.
Algorithm Outcomes of the DT and BoW-based classifiers for the eruptive activity at NEC and VOR on 9 September, 2019.
| Thermal Camera | Visibility | Volcanic Activity |
|---|
| EMOT | “clear” | “explosion” |
| EMCT | “fuzzy” | “no activity” |
| ESR | “fuzzy” | “no activity” |
| ENT | “fuzzy” | “no activity” |
| EBT | “fuzzy” | “no activity” |
Table 6.
Algorithm Outcomes of the DT and BoW-based classifiers for the eruptive activity at NSEC on 6 December, 2019.
Table 6.
Algorithm Outcomes of the DT and BoW-based classifiers for the eruptive activity at NSEC on 6 December, 2019.
| Thermal Camera | Visibility | Volcanic Activity |
|---|
| EMOT | “clear” | “explosion” |
| EMCT | “clear” | “no activity” |
| ESR | “fuzzy” | “no activity” |
| ENT | “fuzzy” | “explosion” |
| EBT | “clear” | “no activity” |
Table 7.
Confusion matrix for the output of the DT classifier. Each value of the matrix represents the number of observations that are correctly and incorrectly classified.
Table 7.
Confusion matrix for the output of the DT classifier. Each value of the matrix represents the number of observations that are correctly and incorrectly classified.
| | PREDICTED |
|---|
| Clear | Fuzzy |
|---|
| KNOWN | clear | 0.996 | 0.004 |
| fuzzy | 0.003 | 0.997 |
Table 8.
Confusion Matrix of the BoW-based classifier. Each value of the matrix represents the number of observations that are correctly and incorrectly classified.
Table 8.
Confusion Matrix of the BoW-based classifier. Each value of the matrix represents the number of observations that are correctly and incorrectly classified.
| | PREDICTED |
|---|
| Explosive | Effusive | Explosive and Effusive | Degassing/Ash Emission | No Activity |
|---|
| KNOWN | explosive | 0.960 | 0.009 | 0.0046 | 0.027 | 0.000 |
| effusive | 0.007 | 0.977 | 0.002 | 0.014 | 0.000 |
| explosive and effusive | 0.008 | 0.004 | 0.984 | 0.004 | 0.000 |
| degassing/ash emission | 0.000 | 0.000 | 0.000 | 0.620 | 0.380 |
| no activity | 0.020 | 0.000 | 0.010 | 0.000 | 0.970 |

 ,
, 


