Letter

Deciphering Circular Anthropogenic Anomalies in PALSAR Data—Using L-Band SAR for Analyzing Archaeological Features on the Steppe

1
Department of Archaeology, University of Sydney, The Quadrangle A14, Sydney 2006, Australia
2
Institute of Archaeological Sciences, University of Bern, Mittelstrasse 43, 3012 Bern, Switzerland
3
Institute for the History of Material Culture, Russian Academy of Sciences, Dvortsovaya nabereznaya 18, 191186 St. Petersburg, Russia
4
State Key Laboratory of Information Engineering in Surveying, Mapping and Remote Sensing, Wuhan University, Wuhan 430072, China
*
Author to whom correspondence should be addressed.
Submission received: 12 March 2020 / Revised: 23 March 2020 / Accepted: 24 March 2020 / Published: 27 March 2020

Abstract

:
Synthetic aperture radar has been employed for archaeological purposes for nearly forty years: nonetheless, its application among archaeological practitioners has remained limited. We analyzed circular anthropogenic anomalies in a steppe environment in PALSAR-2 data, which appeared as a homogeneous group of signatures. Each anomaly was examined using additional SAR and optical data, as well as investigated through extensive ground truth and, in one case, excavation. We found the anomalies to originate from a wide range of processes and structural characteristics showing the non-intuitive complexity of SAR data interpretation. We found that this is likely the reason for the limited application SAR has seen within the archaeological community. In order to improve the usage of SAR for archaeological purposes beyond change detection and digital elevation models, specific products that are more readily understandable and superior to optical data in a narrow frame of application should be developed.

Graphical Abstract

1. Introduction

Despite a broad number of possible applications of synthetic aperture radar (SAR) in the archaeological context, SAR falls behind very high-resolution optical data and LiDAR-derived digital elevation models when it comes to usage within the archaeological practitioner community [1]. SAR has been successfully applied in many areas of landscape archaeology [2]. High-resolution digital elevation models and the detection of paleochannels for the purposes of paleoenvironmental reconstruction have seen a relatively wide application in landscape archaeological studies [3,4,5,6], but beyond topographic models and the integration of macro-features of paleolandscapes into archaeological analyses, the potential of SAR data seems to be largely underexploited. Its basic unaffectedness by atmospheric clouds and aerosols, and usually high revisiting times give it a gap-filler function for areas where the acquisition of optical data is difficult, for example in areas of conflict [7]. However, the perceived low resolution and difficulty processing data (as opposed to the rather intuitively understandable, very high-resolution optical data) might contribute to the limited usage SAR products have experienced within the archaeological practitioner community. The strength of SAR data lies less in its geometric resolution rather than its temporal resolution, making it ideal for monitoring efforts of threatened cultural heritage in areas where rapid changes occur [8,9]. For traditional landscape archaeological analyses, these short-term changes play a smaller role. They are seen as a potentially obscuring layer of the landscape archaeological palimpsest, which, though acknowledged, does contribute little to the understanding of a chosen prehistoric time period. As long as only small-scale changes occur, it can be hypothesized that the archaeological practitioner is content with a view of the archaeological landscape that ignores short-term alterations. This is different in areas that have experienced radical changes, such as the rapid expansion of agglomerations [10], or the agro-economic utilization and intensification of previously only slowly evolving landscapes [11]. Even though the earliest usage of SAR data for paleoenvironmental studies dates back to the 1980s [12,13], early optical data, for example CORONA satellite images, provide a much higher resolution look into the past, and are therefore preferred when it comes to analyzing landscapes unobstructed by recent large-scale changes.
In addition to its all-weather capability, the minimal atmospheric effects, and potential penetration of vegetation and dry soil, SAR is sensitive to dielectric properties and structure. Rather than trying to use it the same way as optical data and noticing the disparities, SAR data is much better used in specific circumstances, where the environmental parameters are unfavorable to the usage of optical data. The problem is that SAR data can be difficult to interpret. Therefore, we conducted a PALSAR data-based survey of the Uyuk Valley (Figure 1), a region in Southern Siberia, known as the “Valley of the Kings” due to its notably high concentration of large archaeological features, namely Early Iron Age burial mounds [14]. Archaeologist’s interest in this landscape is high, due to the valley harboring some of the earliest and largest “royal” tombs of highly mobile nomadic pastoralists, as well as evidence for an important economic transition between the Late Bronze Age and the Early Iron Age connected with the emergence of the so-called “Scythian” material culture [15,16]. Whereas most of the archaeological features in the valley appear to be located on the northern river terrace, which displays characteristics of an arid steppe landscape, substantial areas of the valley are regularly flooded meadows. In the southern part of the valley, these encompass former river terraces that used to be selected by various steppe cultures for constructing features connected to funerary ritual purposes [17,18]. These circumstances allow for the identification and assessment of anomalies in PALSAR data within different environments with tall and short grass vegetation, as well as under dry and wet conditions. Through a survey of circular anthropogenic features in PALSAR data and complete ground truth, we aim to gain insights into how L-band SAR can be used in these environments for archaeological purposes beyond change detection and identification of macro-landscape features, and what the associated problems with this approach are.

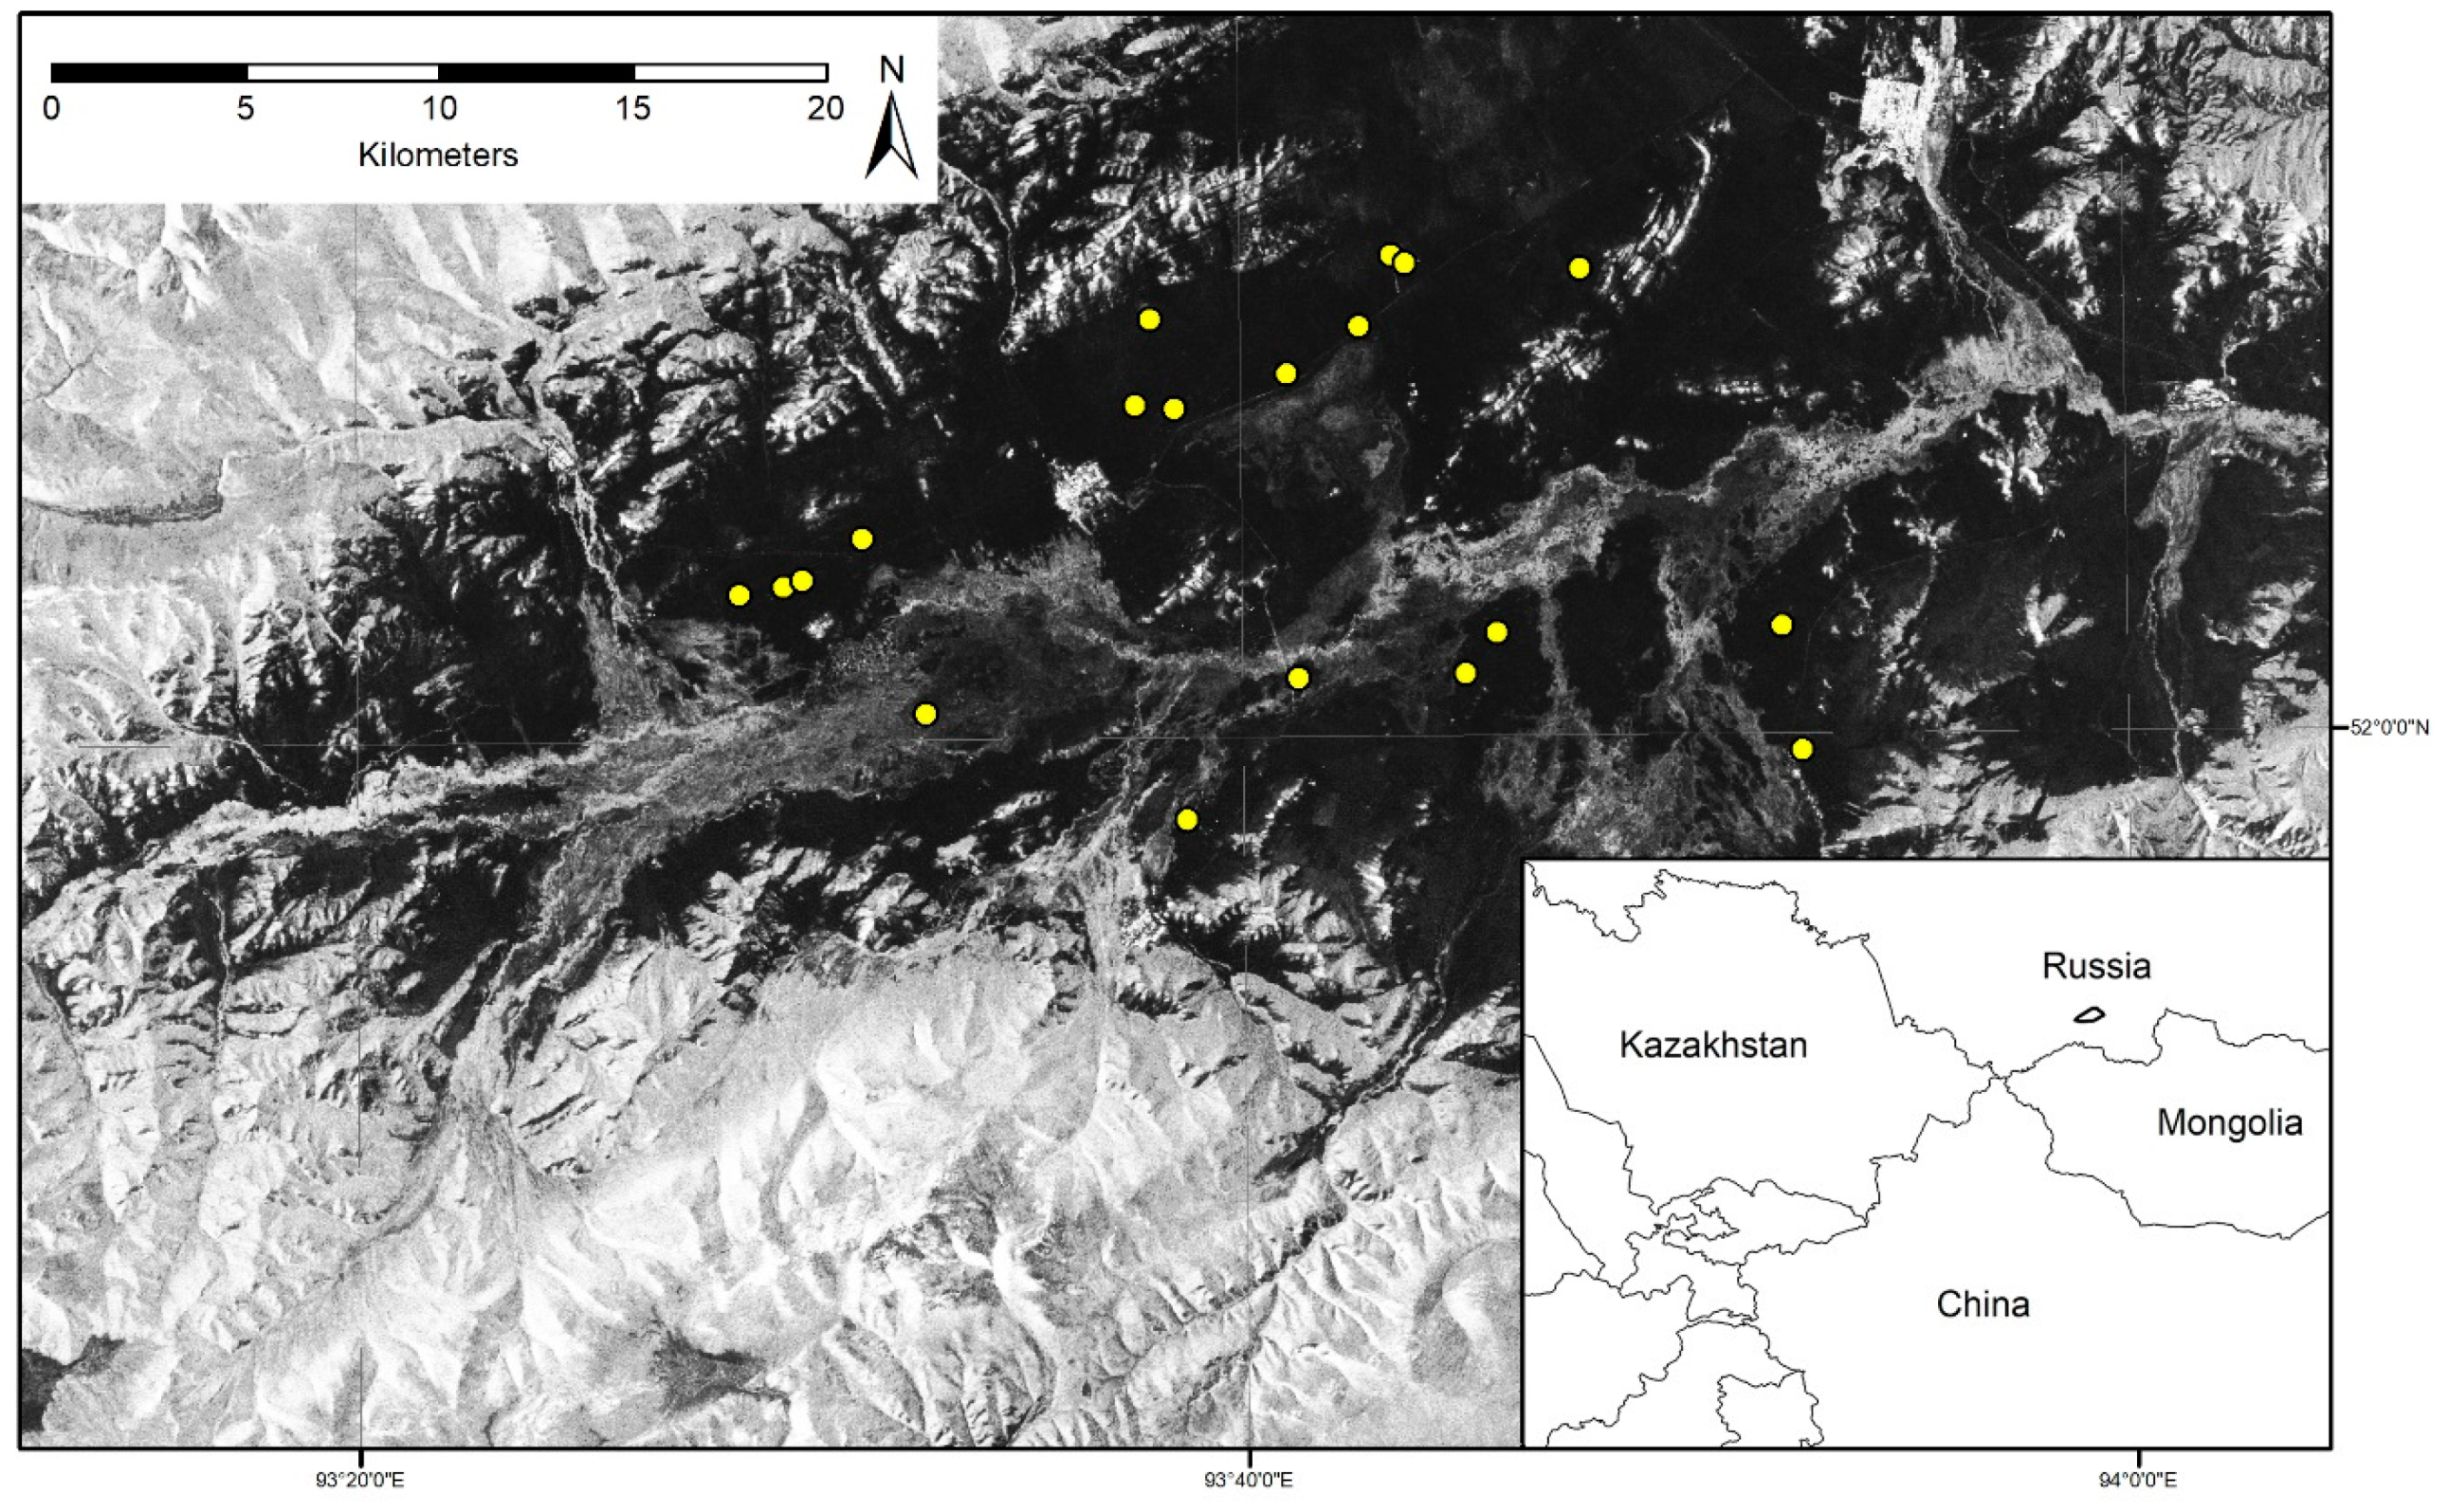
2. Materials and Methods

During the excavation project at Tunnug 1, extensive geophysical and remote sensing surveys were carried out [17]. Ground-penetrating radar did not produce any results due to clay-rich soils and high moisture content. When monitoring the site with PALSAR data, it was however noticed that the large Early Iron Age burial mound appears very clearly in L-band SAR data. Reasons for this clear signature could be due to the better penetrating capabilities of the L-band, which largely ignores the low bushy vegetation on top of the burial mound and produces a backscatter from the rocky surface underneath. Therefore, we decided to map all large circularly appearing structures (>80 m) in the PALSAR data. We did this by drawing a search grid with 1000 × 1000 m cells over the raster data of an ascending scene acquired on February 20 2017. Each square was then searched manually for circular anomalies in HH (horizontally transmitted -horizontally received) and HV (horizontally transmitted – vertically received). Low backscatter (dark) areas of the valley floor provide a good contrast when trying to identify bright circular anomalies. In the adjacent mountains that define the valley to the north and south, the backscatter is much more intense. These are accidentally also the areas with few large archaeological features [14], making the successful detection of sites in PALSAR highly unlikely. After mapping these anomalies, we then visited all locations on the ground in order to verify whether or not the similar signature in the PALSAR data stood for a homogenous group of features. We tried to identify the cause for the anomaly and documented each location with oblique drone shots as well as on-ground photography.

3. Results

Based on the ground truth, we can categorize the similar looking features into distinctive groups. We correctly identified a number of Early Iron Age burial mounds, but also documented many features that are causes for false positives. Overall, 19 large circular anomalies were identified, out of which five were known burial mounds, and one represented a previously unknown archaeological site. Thirteen anomalies turned out to be false positives (n = 19, sensitivity = 6/19).

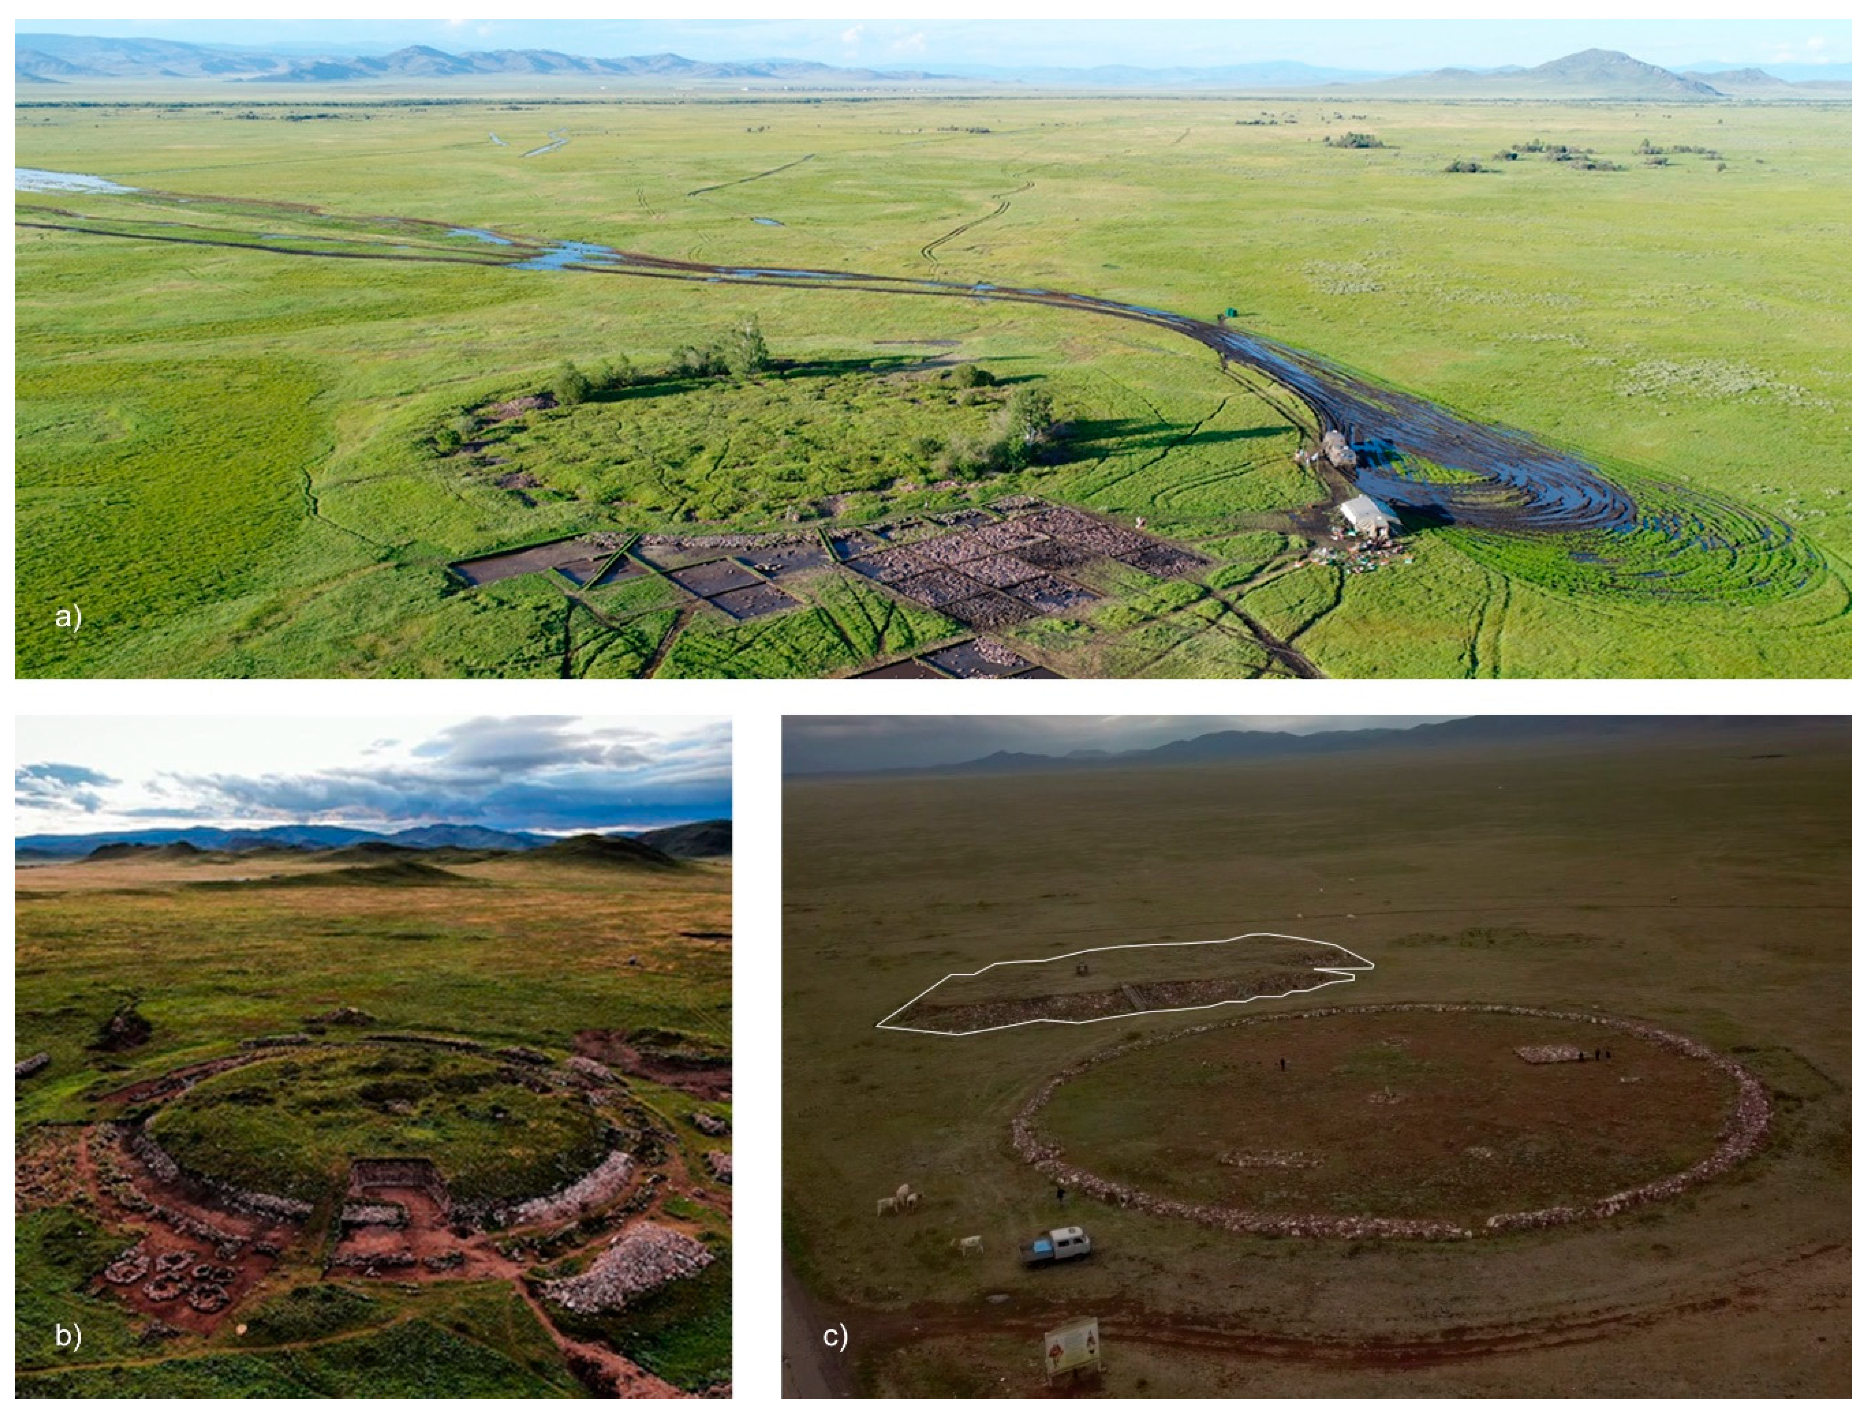
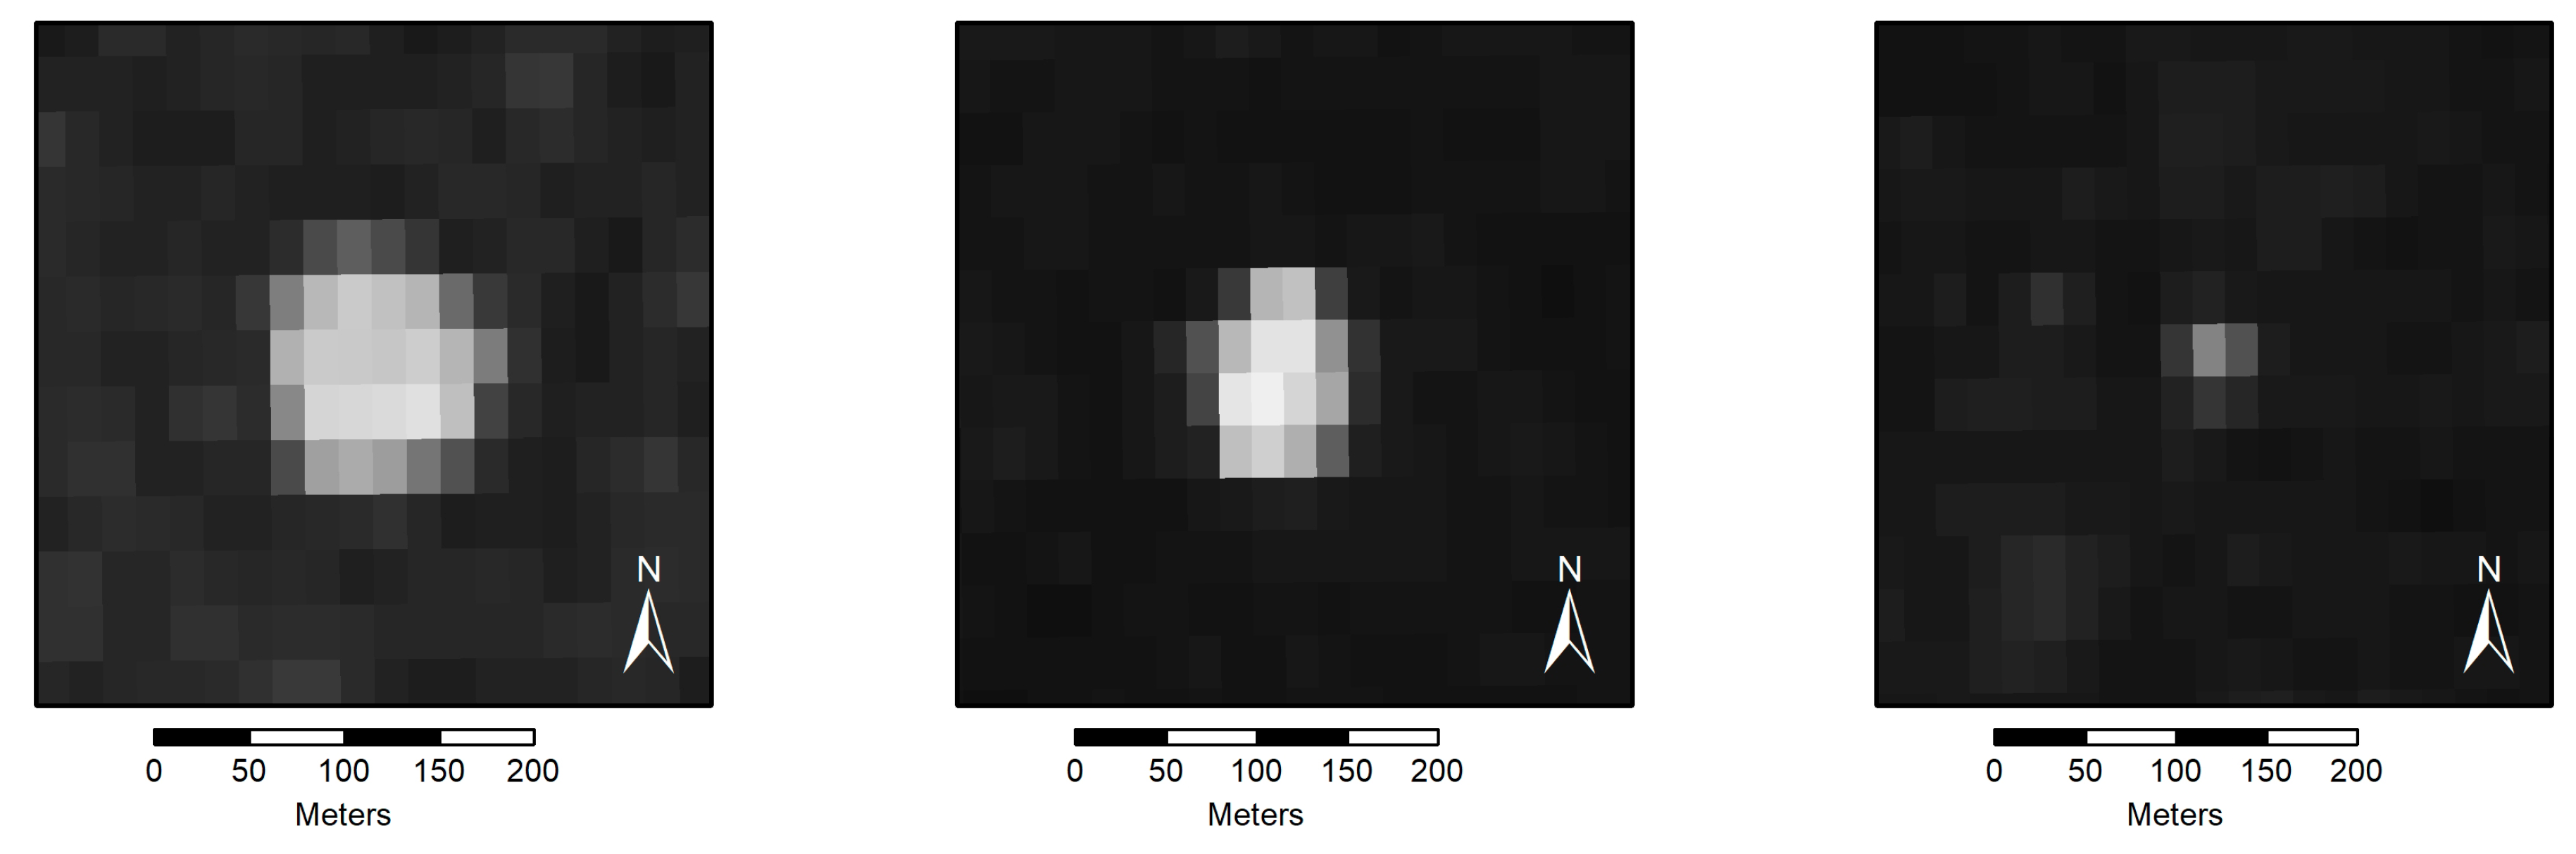
3.1. True Positives (Archaeological Sites)

While identifying archaeological sites clearly visible in the PALSAR data, we noticed that mainly one type of large burial mound with a stone layer on the surface showed up among the anomalies. We were able to identify the known royal burial mounds Arzhan 3, Arzhan 4, Arzhan 5, Chinge-tei 1, and Tunnug 1. Even the spoil heap of the excavated royal burial mound Arzhan 2 [19] was easy to identify. The pile of stones next to the excavation site leaves a clear signature in PALSAR data (Figure 2). During the excavation the stones were removed and arranged to a roughly 3 m high pile next to the reconstructed site. Of course, this is technically a false positive, and the original site itself has become invisible in the PALSAR data. Interestingly, size is clearly not the only criterion for visibility (Figure 3).
Whereas the large burial mound, Tunnug 1, with a diameter of around 140 m [16], shows very clearly in the PALSAR data, the burial mound, Arzhan 4, which also has to be counted among the most massive archaeological features of the Uyuk Valley, only produces a very faint signature. Conversely, the smaller burial mound, Arzhan 5, which has only half the diameter of the other two, shows up extremely bright and large. This might be connected to the recently conducted excavations on the site [20].

3.1.1. Finding Known “Royal” Burial Mounds

We started analyzing the well-known burial mounds along the northern river terrace based on previous work [14]. With a dual-polarized PALSAR-2 FBD (Fine-Beam Double polarization) image with about 4 m spatial resolution, the structures of Tunnug 1 and Arzhan 5 are well distinguishable, as shown in Figure 4. The dual-polarized SAR slant-range image is visualized in red and green, with HH being shown in red and HV in green, and the blue channel set to zero. The SAR images in Figure 4 are shown in the original slant-range radar coordinate system to stay as close to the original data as possible and avoid additional errors from coordinate conversions. However, as can be seen in Figure 4 and others, this leads to different spatial resolutions in the x- and y-directions, so that the original circular structures may appear elliptical in slant-range.
We can see that the backscattering is dominated by the HV polarization. This effect gets even clearer when looking at the polarizations separately. In Figure 5, the same PALSAR-2 image of Tunnug 1 is shown, with the HV polarization in (a) and the HH polarization in (b). The structure of Tunnug 1, which is a huge burial mound with a stone-covered surface, is clearly visible in the HV polarization, also due to the higher signal-to-clutter ratio (SCR) caused by the generally lower backscattering power found in HV images. In the HH polarization, the structure is still visible, but less clearly distinguishable from the relatively high background noise in the vicinity of Tunnug 1.
Analyzing a TerraSAR-X strip map image acquired in HH polarization clearly demonstrates the good discernibility of Tunnug 1 and Arzhan 5, as shown in Figure 6. The higher spatial resolution makes these data depict the archaeological sites more clearly.

3.1.2. A Previously Unknown Archaeological Site

PALSAR-2 HV images seemed to provide the best discernibility of the burial mounds in the L-band. Analyzing the scenes, the structure shown in Figure 7 clearly indicated the signature of a burial mound with a round structure, strong backscattering in HV, and comparably weak backscattering in HH.
The archaeological structure is also visible in the TerraSAR-X image shown in Figure 7d, but less distinguishable from other elements in the proximity such as hilltops, and it can only be identified via its roundness. This provides first hints that the L-band is not necessarily inferior when it comes to detecting archaeological structures, and that spatial resolution is a useful (but not the only) decisive criterion for the identification of archaeological sites in SAR data. We surveyed the site and created a high-resolution 3D model based on a structure from a motion approach. Despite similarities with the surface structure of Early Iron Age burial mounds, the site’s position in the landscape is highly unusual. Being located on top of a hill, it is not visible from the valley floor, but standing on the site, large stretches of the valley can be overlooked. Bushy vegetation conceals the stones of the structure. Several smaller peripheral stone circles indicate that it is clearly an anthropogenic structure, likely connected with a funerary ritual purpose. The stones used for its construction are different than the surrounding rock of the hill and were transported to the site. Small-scale excavation is needed to further reveal the date and nature of the site.

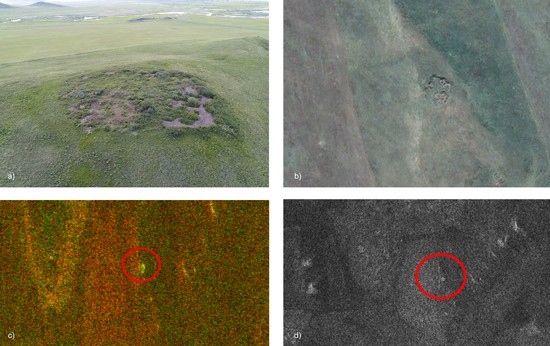
3.2. False Positives

A larger number of false positives was found and documented. The false positive detections can be categorized into a number of classes, namely hilltops, farms, quarries, and modern cemeteries. Most of them have in common that they represent denuded areas with a larger amount of visible stones on the surface, increasing backscatter and thus appearing bright in the PALSAR-2 data.

3.2.1. Hilltops

Hilltops often lie bare of any vegetation, and rock outcrops show a rough surface on which large stones lie scattered across a bigger area. The smoothed-out hills in the Uyuk Valley were shaped by glaciers [21], and round or oval hill shapes are a frequent occurrence. This leads to a phenomenon wherein exposed hilltops are often circular or oval in shape and thus can have a certain resemblance in the PALSAR-2 data to the Early Iron Age burial mounds.

3.2.2. Farms

The larger denuded areas around farmsteads that lie bare of any ground cover and the circular area of activity around several farm buildings seems to lead to a similar signature to those of the Early Iron Age burial mounds. Frequent activities like herding cattle and bringing the animals back to the farm, driving with vehicles close to the buildings, and the practice of dumping in the vicinity of farms damage the natural vegetation cover. The low resolution of L-band PALSAR imagery seemingly leads to these areas appearing approximately circular.

3.2.3. Quarries

Quarries are often slightly bigger than the largest Early Iron Age burial mounds, but again they do show denuded surfaces with large stones leading to a similar backscatter pattern to those of the surfaces of stone covered burial mounds (Figure 8). Due to the relatively low resolution of the PALSAR-2 data, the irregular shape of the quarries is often interpreted by the viewer as round or oval, leading to a false positive detection.

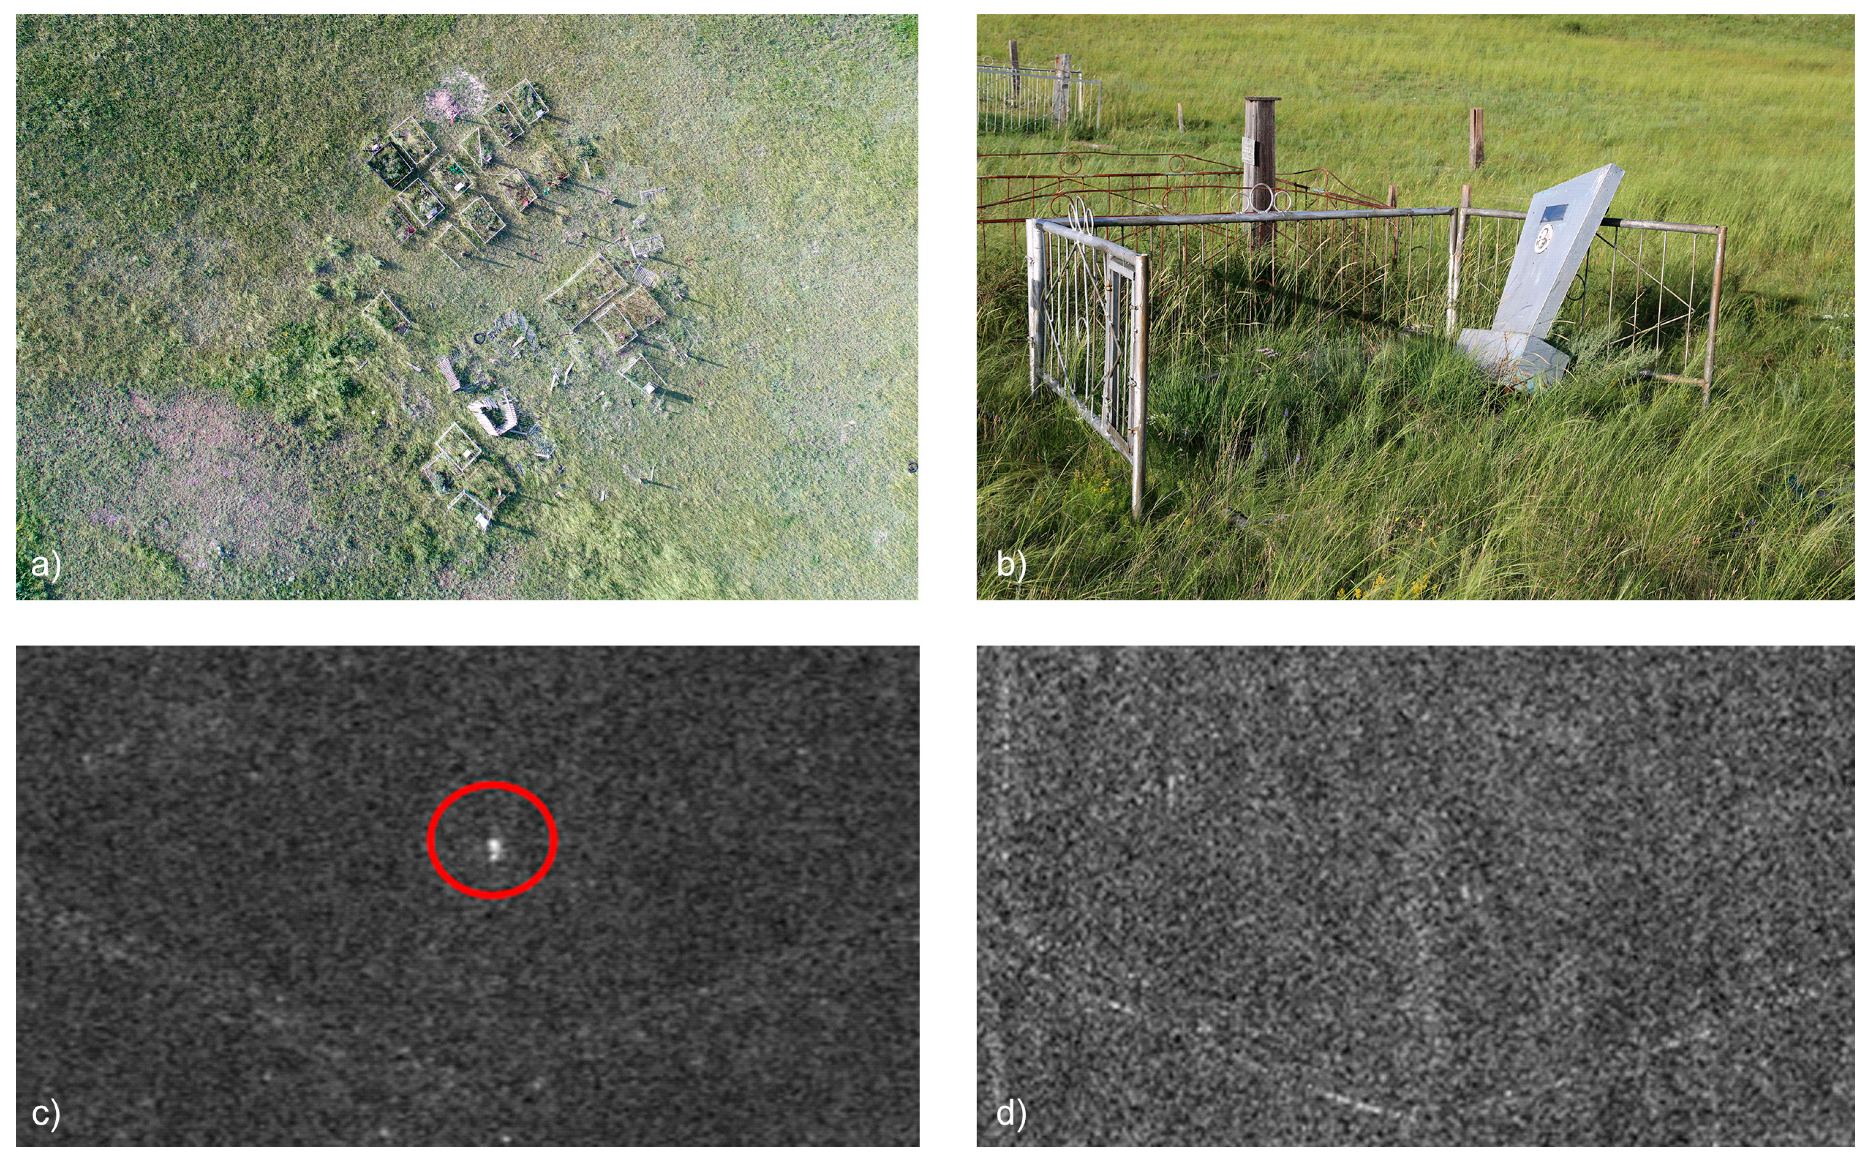
3.2.4. Modern Cemeteries

Modern cemeteries represent a different case and need to be treated separately since the strong backscattering does not seem to result from a denuded stone-rich area (Figure 9). Comparable to the results of the burial mounds, we can see clear and strong backscattering in the HV polarization, but nothing distinguishable from the background in the HH polarization of the PALSAR-2 FBD image, as shown in Figure 9. Similarly, nothing can be seen in the TerraSAR-X strip map image shown in Figure 10.

4. Discussion

The good discernibility of several Early Iron Age burial mounds in the PALSAR-2 images only seems to stand in contrast with our own work on burial mound identification in TerraSAR-X images [22]. In this work, we stated that high-resolution SAR images, e.g., TerraSAR-X spotlight images, are needed to clearly identify burial mounds in the Altai Mountains. Although the burial mounds of Tunnug 1 and Arzhan 5 are much larger than the examples in [22], the PALSAR-2 results clearly show that the spatial resolution is just one factor to be considered, with the system’s wavelength and polarization also being decisive. The composition of the burial mounds in the Uyuk Valley is rather different from the ones we surveyed in the southern Chinese Altai. Whereas the large Saka burial mounds in the Chinese Altai were made from soil and smaller pebbles [23], the Early Iron Age “royal” burial mounds in the Uyuk Valley are completely built up or at least covered in stones. In the case of Tunnug 1, these stones are up to 100 cm in size, but usually around 30–50 cm. This also caused stronger backscattering from the stones since the features lie within the same size range as the wavelength of the L-band.
At first glance, we might expect the stones to produce many small corner reflectors, leading to a strong co-polar signature. However, we found strong cross-polar backscattering. For a radar signal to change its polarization from transmission to reception, the backscattering of the signal must induce a tilt in the signal. This is often the case in chaotic volumetric backscattering, e.g., inside forest canopies. However, this phenomenon can also be observed in urban areas, when backscattering surfaces, like houses, are not perpendicular to azimuth and therefore can cause a tilt in the signal’s polarization [24]. Similarly with the L-band signal penetrating the vegetation on top of the burial mound, it is reflected by the stones forming the surface of the archaeological feature. As we can see from the profile of the burial mound Tunnug 1 (Figure 11), the burial mounds in the Uyuk Valley are covered with stones. The stones are oriented chaotically, so that non-perpendicular surfaces that can cause tilting are always present, leading to a comparably strong backscattering in cross-polar signals, such as the HV signal used in our analysis. With the HV backscattering typically weaker, the contrast of the burial mounds is strongly increased in HV, compared to the co-polar (HH or VV) backscattering.
The strong reflection in HV polarization in the modern cemetery (see Figure 9) is an interesting example for the complexity of SAR image analysis. We assume the reflection was caused from the surrounding fences. As shown in Figure 12, such fences can act as cross-polarizing antennas. The incoming signal in horizontal polarization is received by the horizontally-oriented bars of the fence. The fence can then be imagined as a transmitting antenna. Such an antenna would transmit mainly in the vertical polarization, especially if the distance of the bars is close to the wavelength or to a multiple of the wavelength of the system. This seems to be the case in the example shown in Figure 9b. We can therefore see strong backscattering in HV, especially considering the generally weaker HV backscattering, so that the comparably strong signal appears very clearly, with a strong contrast to the weak background.
Structure plays a major role in forming the anomalies we see in the PALSAR-2 data. Many of the identified anomalies show denuded surfaces, but all of them were formed through different anthropogenic or natural processes. As the example concerning the modern cemeteries demonstrates, in-depth examination and ground truth is necessary to understand why these anomalies appear. An intuitive approach to understanding SAR data does not appear to be possible.

5. Conclusions

Assuming that most archaeological practitioners would look after clearly distinguishable anomalies in data by means of visual interpretation in order to identify archaeological sites, we were able to show that it is possible to detect individual large burial mounds with a stone-covered surface in L-band SAR data. Both known sites, as well as previously unknown sites, were detected. A major problem for the wider use of SAR for direct archaeological mapping is not only the data’s non-intuitive nature—as opposed to optical imagery that can be readily understood by someone not intimately familiar with the intricacies of SAR—but the high number of false positive detections. In our case, when just using PALSAR-2 data we found burial mounds, farms, hilltops, quarries, and modern cemeteries showing similar signatures for different reasons. Mapping circular anomalies in L-band SAR is a possibility for identifying points of interest if not much is known about a particular archaeological landscape. These anomalies, however, need to be thoroughly examined. Since cross-checking with other data types and on-ground surveys (in comparison to remote sensing surveys) are relatively time- and cost-intensive, these economic constraints can easily keep practitioners from employing SAR data as a go-to means for archaeological investigations if optical data are available. It is clear that due to its non-intuitive complexity SAR is not ideal for a naïve approach for surveying archaeological sites. In order to find more widespread use in the archaeological community, it is necessary to develop applications for specific archaeological problems and questions in which SAR is superior to optical data. One such application might be the rapid and large scale surveying of big stone monuments in the Eurasian Steppes, due to the good coverage and the comparatively low cost per area of SAR data.

Author Contributions

Conceptualization, G.C. and T.B.; methodology, G.C. and T.B.; validation, G.C., J.B., and T.B.; formal analysis, G.C. and T.B.; investigation, G.C., J.B., T.S., and T.B.; resources, G.C., T.S., and T.B.; writing—original draft preparation, G.C. and T.B.; writing—review and editing, G.C., J.B., T.S., and T.B.; visualization, G.C., J.B., T.S., and T.B.; supervision, G.C. and T.B. All authors have read and agreed to the published version of the manuscript.

Funding

This research was funded by the Swiss National Science Foundation, grant number P400PG_190982. The European Space Agency supplied high-resolution satellite data under the Project Start-Up id. 54058. The PALSAR-2 data was supported by JAXA, grant number ER2A2N159. The field research was supported by Dr. F. Paulsen and the Foundation for the Exploration of EurAsia. The archaeological excavation project was made possible through a grant from the Russian Ministry of Culture (GZ 656-01-1-41/12-18) in 2018 and in 2019 through an agreement with the Russian Geographical Society (N 53/04/2019). Field research was conducted as a joint expedition of the Institute of the History of Material Culture of the Russian Academy of Sciences, the Russian Geographical Society (project “Expedition Tunnug”) and the Swiss ArchaeoExploration.

Conflicts of Interest

The authors declare no conflicts of interest.

References

  1. Tapete, D.; Cigna, F. COSMO-SkyMed SAR for detection and monitoring of archaeological and cultural heritage sites. Remote Sens. 2019, 11, 1326. [Google Scholar] [CrossRef] [Green Version]
  2. Tapete, D.; Cigna, F. SAR for Landscape Archaeology; Springer: Cham, Switzerland, 2017; pp. 101–116. [Google Scholar]
  3. Erasmi, S.; Rosenbauer, R.; Buchbach, R.; Busche, T.; Rutishauser, S. Evaluating the quality and accuracy of TanDEM-X digital elevation models at archaeological sites in the Cilician Plain, Turkey. Remote Sens. 2014, 6, 9475–9493. [Google Scholar] [CrossRef] [Green Version]
  4. Chen, F.; Masini, N.; Yang, R.; Milillo, P.; Feng, D.; Lasaponara, R. A space view of radar archaeological marks: First applications of COSMO-SkyMed X-band data. Remote Sens. 2015, 7, 24–50. [Google Scholar] [CrossRef] [Green Version]
  5. Linck, R.; Busche, T.; Buckreuss, S.; Fassbinder, J.W.E.; Seren, S. Possibilities of archaeological prospection by high-resolution X-band satellite radar–a case study from Syria. Archaeol. Prospect. 2013, 20, 97–108. [Google Scholar] [CrossRef]
  6. Caspari, G.; Plets, G.; Balz, T.; Fu, B. Landscape archaeology in the Chinese Altai Mountains–Survey of the Heiliutan Basin. Archaeol. Res. Asia 2017, 10, 48–53. [Google Scholar] [CrossRef]
  7. Tapete, D.; Cigna, F. Trends and perspectives of space-borne SAR remote sensing for archaeological landscape and cultural heritage applications. J. Archaeol. Sci. Rep. 2017, 14, 716–726. [Google Scholar] [CrossRef] [Green Version]
  8. Tapete, D.; Cigna, F.; Donoghue, D.N. ‘Looting marks’ in space-borne SAR imagery: Measuring rates of archaeological looting in Apamea (Syria) with TerraSAR-X Staring Spotlight. Remote Sens. Environ. 2016, 178, 42–58. [Google Scholar] [CrossRef] [Green Version]
  9. Cigna, F.; Tapete, D.; Lasaponara, R.; Masini, N. Amplitude change detection with ENVISAT ASAR to image the cultural landscape of the Nasca Region, Peru. Archaeol. Prospect. 2013, 20, 117–131. [Google Scholar] [CrossRef]
  10. Lasaponara, R.; Yang, R.; Chen, F.; Li, X.; Masini, N. Corona satellite pictures for archaeological studies: A review and application to the lost Forbidden City of the Han–Wei Dynasties. Surv. Geophys. 2018, 39, 1303–1322. [Google Scholar] [CrossRef]
  11. Casana, J.; Cothren, J. The CORONA atlas project: Orthorectification of CORONA satellite imagery and regional-scale archaeological exploration in the Near East. In Mapping Archaeological Landscapes from Space; Springer: New York, NY, USA, 2013; pp. 33–43. [Google Scholar]
  12. Adams, R.E.; Brown, W.E.; Culbert, T.P. Radar mapping, archeology, and ancient Maya land use. Science 1981, 213, 1457–1468. [Google Scholar] [CrossRef] [PubMed]
  13. Elachi, C.; Roth, L.E.; Schaber, G.G. Spaceborne radar subsurface imaging in hyperarid regions. IEEE Trans. Geosci. Remote Sens. 1984, 4, 383–388. [Google Scholar] [CrossRef]
  14. Caspari, G. Mapping and Damage Assessment of “Royal” Burial Mounds in the Siberian Valley of the Kings. Remote Sens. 2020, 12, 773. [Google Scholar] [CrossRef] [Green Version]
  15. Gryaznov, M.P. Arzhan: Tsarskii Kurgan Ranneskifskogo Vremeni (Arzhan: A Royal Barrow of Early Scythian Time); Nauka: Leningrad, Russia, 1980. [Google Scholar]
  16. Caspari, G.; Sadykov, T.; Blochin, J.; Hajdas, I. Tunnug 1 (Arzhan 0)–an early Scythian kurgan in Tuva Republic, Russia. Archaeol. Res. Asia 2018, 15, 82–87. [Google Scholar] [CrossRef]
  17. Caspari, G.; Sadykov, T.; Blochin, J.; Buess, M.; Nieberle, M.; Balz, T. Integrating remote sensing and geophysics for exploring early nomadic funerary architecture in the “siberian valley of the kings”. Sensors 2019, 19, 3074. [Google Scholar] [CrossRef] [PubMed] [Green Version]
  18. Caspari, G.; Sadykov, T.; Blochin, J.; Bolliger, M.; Szidat, S. New Evidence for a Bronze Age Date of Chariot Depictions in the Eurasian Steppes. Aust. Rock Art Res. Assoc. 2020, 37, 1–6. [Google Scholar]
  19. Chugunov, K.; Parzinger, H.; Nagler, A. Der skythenzeitliche Fürstenkurgan Aržan 2 in Tuva: Archäologie in Eurasien 26. Steppenvölker Eurasiens 3; Philipp von Zabern: Mainz, Germany, 2010. [Google Scholar]
  20. Rukavishnikova, I.; Gladchenkov, A. Studies of Arzhan-5 in the Turan-Uyuk Basin. KSIA 2016, 243, 49–58. [Google Scholar]
  21. Arzhannikov, S.G.; Braucher, R.; Jolivet, M.; Arzhannikova, A.V.; Vassallo, R.; Chauvet, A.; Chauvet, F. History of late Pleistocene glaciations in the central Sayan-Tuva Upland (southern Siberia). Quat. Sci. Rev. 2012, 49, 16–32. [Google Scholar] [CrossRef]
  22. Balz, T.; Caspari, G.; Fu, B.; Liao, M. Discernibility of Burial Mounds in High-Resolution X-Band SAR Images for Archaeological Prospections in the Altai Mountains. Remote Sens. 2016, 8, 817. [Google Scholar] [CrossRef] [Green Version]
  23. Caspari, G. Quantifying the Funerary Ritual Activity of the Late Prehistoric Southern Kanas Region (Xinjiang, China). Asian Perspect. 2020, 59, 2. [Google Scholar]
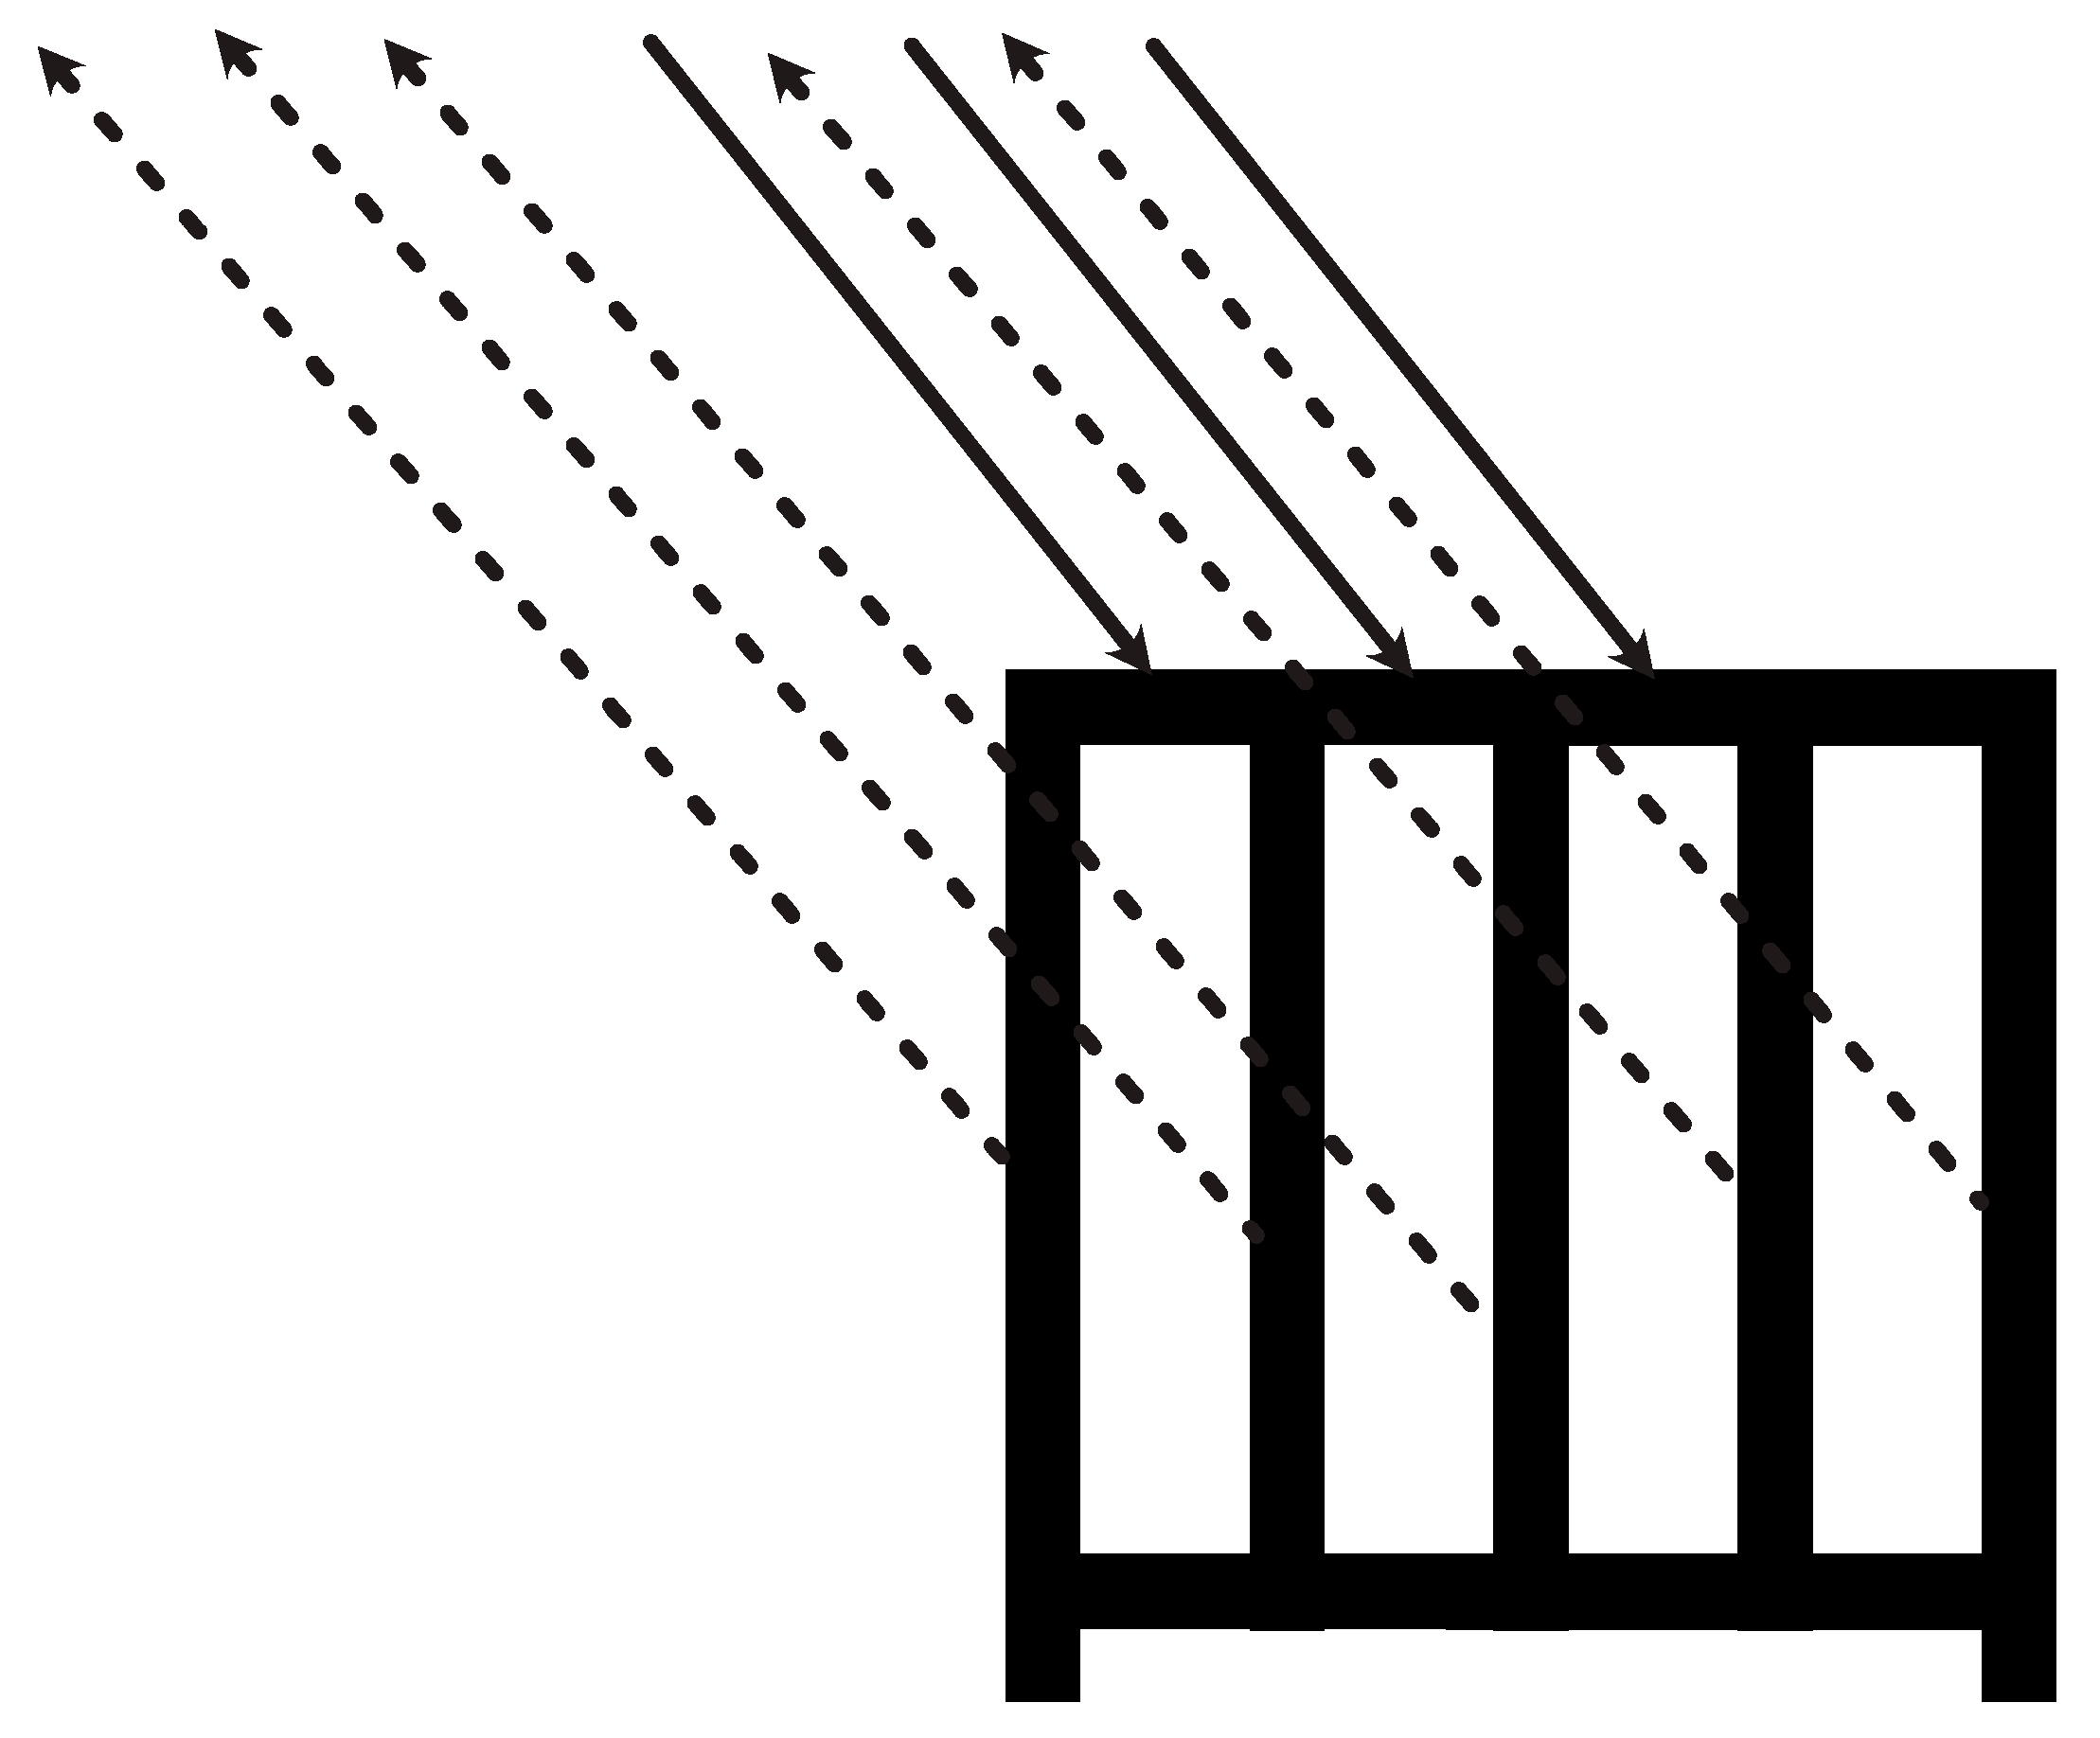
  24. Iribe, K.; Sato, M. Analysis of polarization orientation angle shifts by artificial structures. IEEE Trans. Geosci. Remote Sens. 2007, 45, 3417–3425. [Google Scholar] [CrossRef]
Figure 1. The survey area in Southern Siberia, Tuva Republic (Russian Federation), with circular anomalies detected in PALSAR-2 data indicated in yellow.
Remotesensing 12 01076 g001
Figure 2. The burial mounds (a) Tunnug 1, (b) Chinge-tei 1, and (c) Arzhan 2. Tunnug 1 and Chinge-tei 1 show very clearly in the PALSAR data. The completely excavated burial mound, Arzhan 2, does not show, but the spoil heap from the excavation (marked with a white outline) is still visible. (Photo credits: Blochin/Wallace).
Remotesensing 12 01076 g002
Figure 3. Size and brightness comparison of three royal Early Iron Age burial mounds in PALSAR data. Left: Tunnug 1 with a site diameter of around 140 m. Middle: Arzhan 5 with a diameter of 55 m. Right: Arzhan 4 with a diameter of >100 m. All diameter measurements adapted from [16].
Remotesensing 12 01076 g003
Figure 4. PALSAR-2 slant-range image of (a) Tunnug 1 and (b) Arzhan 5. Red: HH; green: HV; blue: 0. © JAXA.
Remotesensing 12 01076 g004
Figure 5. PALSAR-2 slant-range image of Tunnug 1: (a) HV and (b) HH. © JAXA.
Remotesensing 12 01076 g005
Figure 6. TerraSAR-X slant-range strip map HH image of (a) Tunnug 1 and (b) Arzhan 5. © DLR, 2013.
Remotesensing 12 01076 g006
Figure 7. (a) The newly found archaeological structure on top of a hill near Torzh-hol (oblique drone shot); (b) the Torzh-hol structure from high-resolution open-source optical satellite imagery (© CNES/Airbus 2019); (c) PALSAR-2 slant-range image; (d) archaeological structure in the TerraSAR-X image. Red: HH; green: HV; blue: 0 (© JAXA). TerraSAR-X slant-range image (© DLR, 2013).
Remotesensing 12 01076 g007
Figure 8. Example of a false positive detection of the Taygora quarry: (a) from high-resolution open-source optical satellite data (© CNES/Airbus 2019); (b) oblique drone shot; and (c) from the ground.
Remotesensing 12 01076 g008
Figure 9. (a) Drone image of the modern cemetery showing an anomaly in the PALSAR-2 image; (b) a possible explanation for the strong backscatter of this area or the grave markers welded from metal sheets and the surrounding fences. PALSAR-2 slant-range image of the cemetery: (c) HV and (d) HH. © JAXA
Remotesensing 12 01076 g009
Figure 10. In a TerraSAR-X slant-range strip map HH image of the same cemetery, we can clearly understand that we are not dealing with an Early Iron Age burial mound. © DLR, 2013
Remotesensing 12 01076 g010
Figure 11. Partial profile E of the burial mound Tunnug 1, excavated and documented in 2019. A layer of stones is covering clay architecture built over a structure of larch logs dating to the 9th century BCE [18].
Remotesensing 12 01076 g011
Figure 12. Metallic fence working as cross-polarizing antenna with incoming signal in horizontal polarization received by the horizontal bars and reflected/transmitted in vertical polarization by the vertical bars.
Remotesensing 12 01076 g012

