1. Introduction
Many European countries are heavily committed to developing a sustainable and decarbonized energy system [
1]. This may be due, in a large part, to the lack of oil and natural gas resources in most countries of Europe. In the challenge to reduce CO
2 emissions, the building stock plays a very important role because it is responsible for 36% of emissions in the European Union (EU) [
2].
Heating and cooling systems powered by electricity instead of fossil fuels may become more and more important in the future due to the upcoming policies of CO
2 emissions control [
3]. In this environment, the low enthalpy geothermal systems may emerge as one of the best solutions available due to the wide locations where it is possible to install these systems and the high efficiency of them [
4].
The above-mentioned systems do not depend on great geothermal anomalies; they can be installed in many other places where a certain heat conductivity of the ground and some initial temperature conditions can be found [
5]. In exchange for this wide availability, these systems are not able to use geothermal energy directly; they need to include a heat pump in their core.
These heat pumps may work with electricity or with natural gas or even biogas. The first group may be the most environmentally friendly, however, under certain circumstances, the natural gas and biogas driven heat pumps can be more efficient in terms of CO2 emissions and annual costs.
The idea of the present work is to make a comparison between heat pumps belonging to low enthalpy geothermal systems, working under different conditions (technical, economic, and energetic), in many different European countries This will be carried out by considering a fixed quantity of thermal energy (10 MWh, chosen according to some circumstances explained in
Section 2) to describe how this thermal energy is delivered by each one of the different heat pumps in each case and then reveal the economic and environmental costs of the process.
Heat pumps (HPs) constitute a very important part of the aforementioned installations [
6] so one of the main concerns about using them in low enthalpy geothermal systems is associated with their primary energy consumption. The performance of the HP is commonly characterized by the coefficient of performance (COP) and the seasonal performance factor (SPF). Both are performance coefficients, defined by the ratio between the heat obtained through the HP and the primary energy consumed by it (most of it goes to the activation and operation of the compressor’s power unit). The COP is obtained using instantaneous values, while the SPF considers annual behaviors [
7,
8]. For the present work, the COP of the chosen HPs is used to make the comparisons due to data availability; nevertheless, using the SPF instead would not change the results in a significant way.
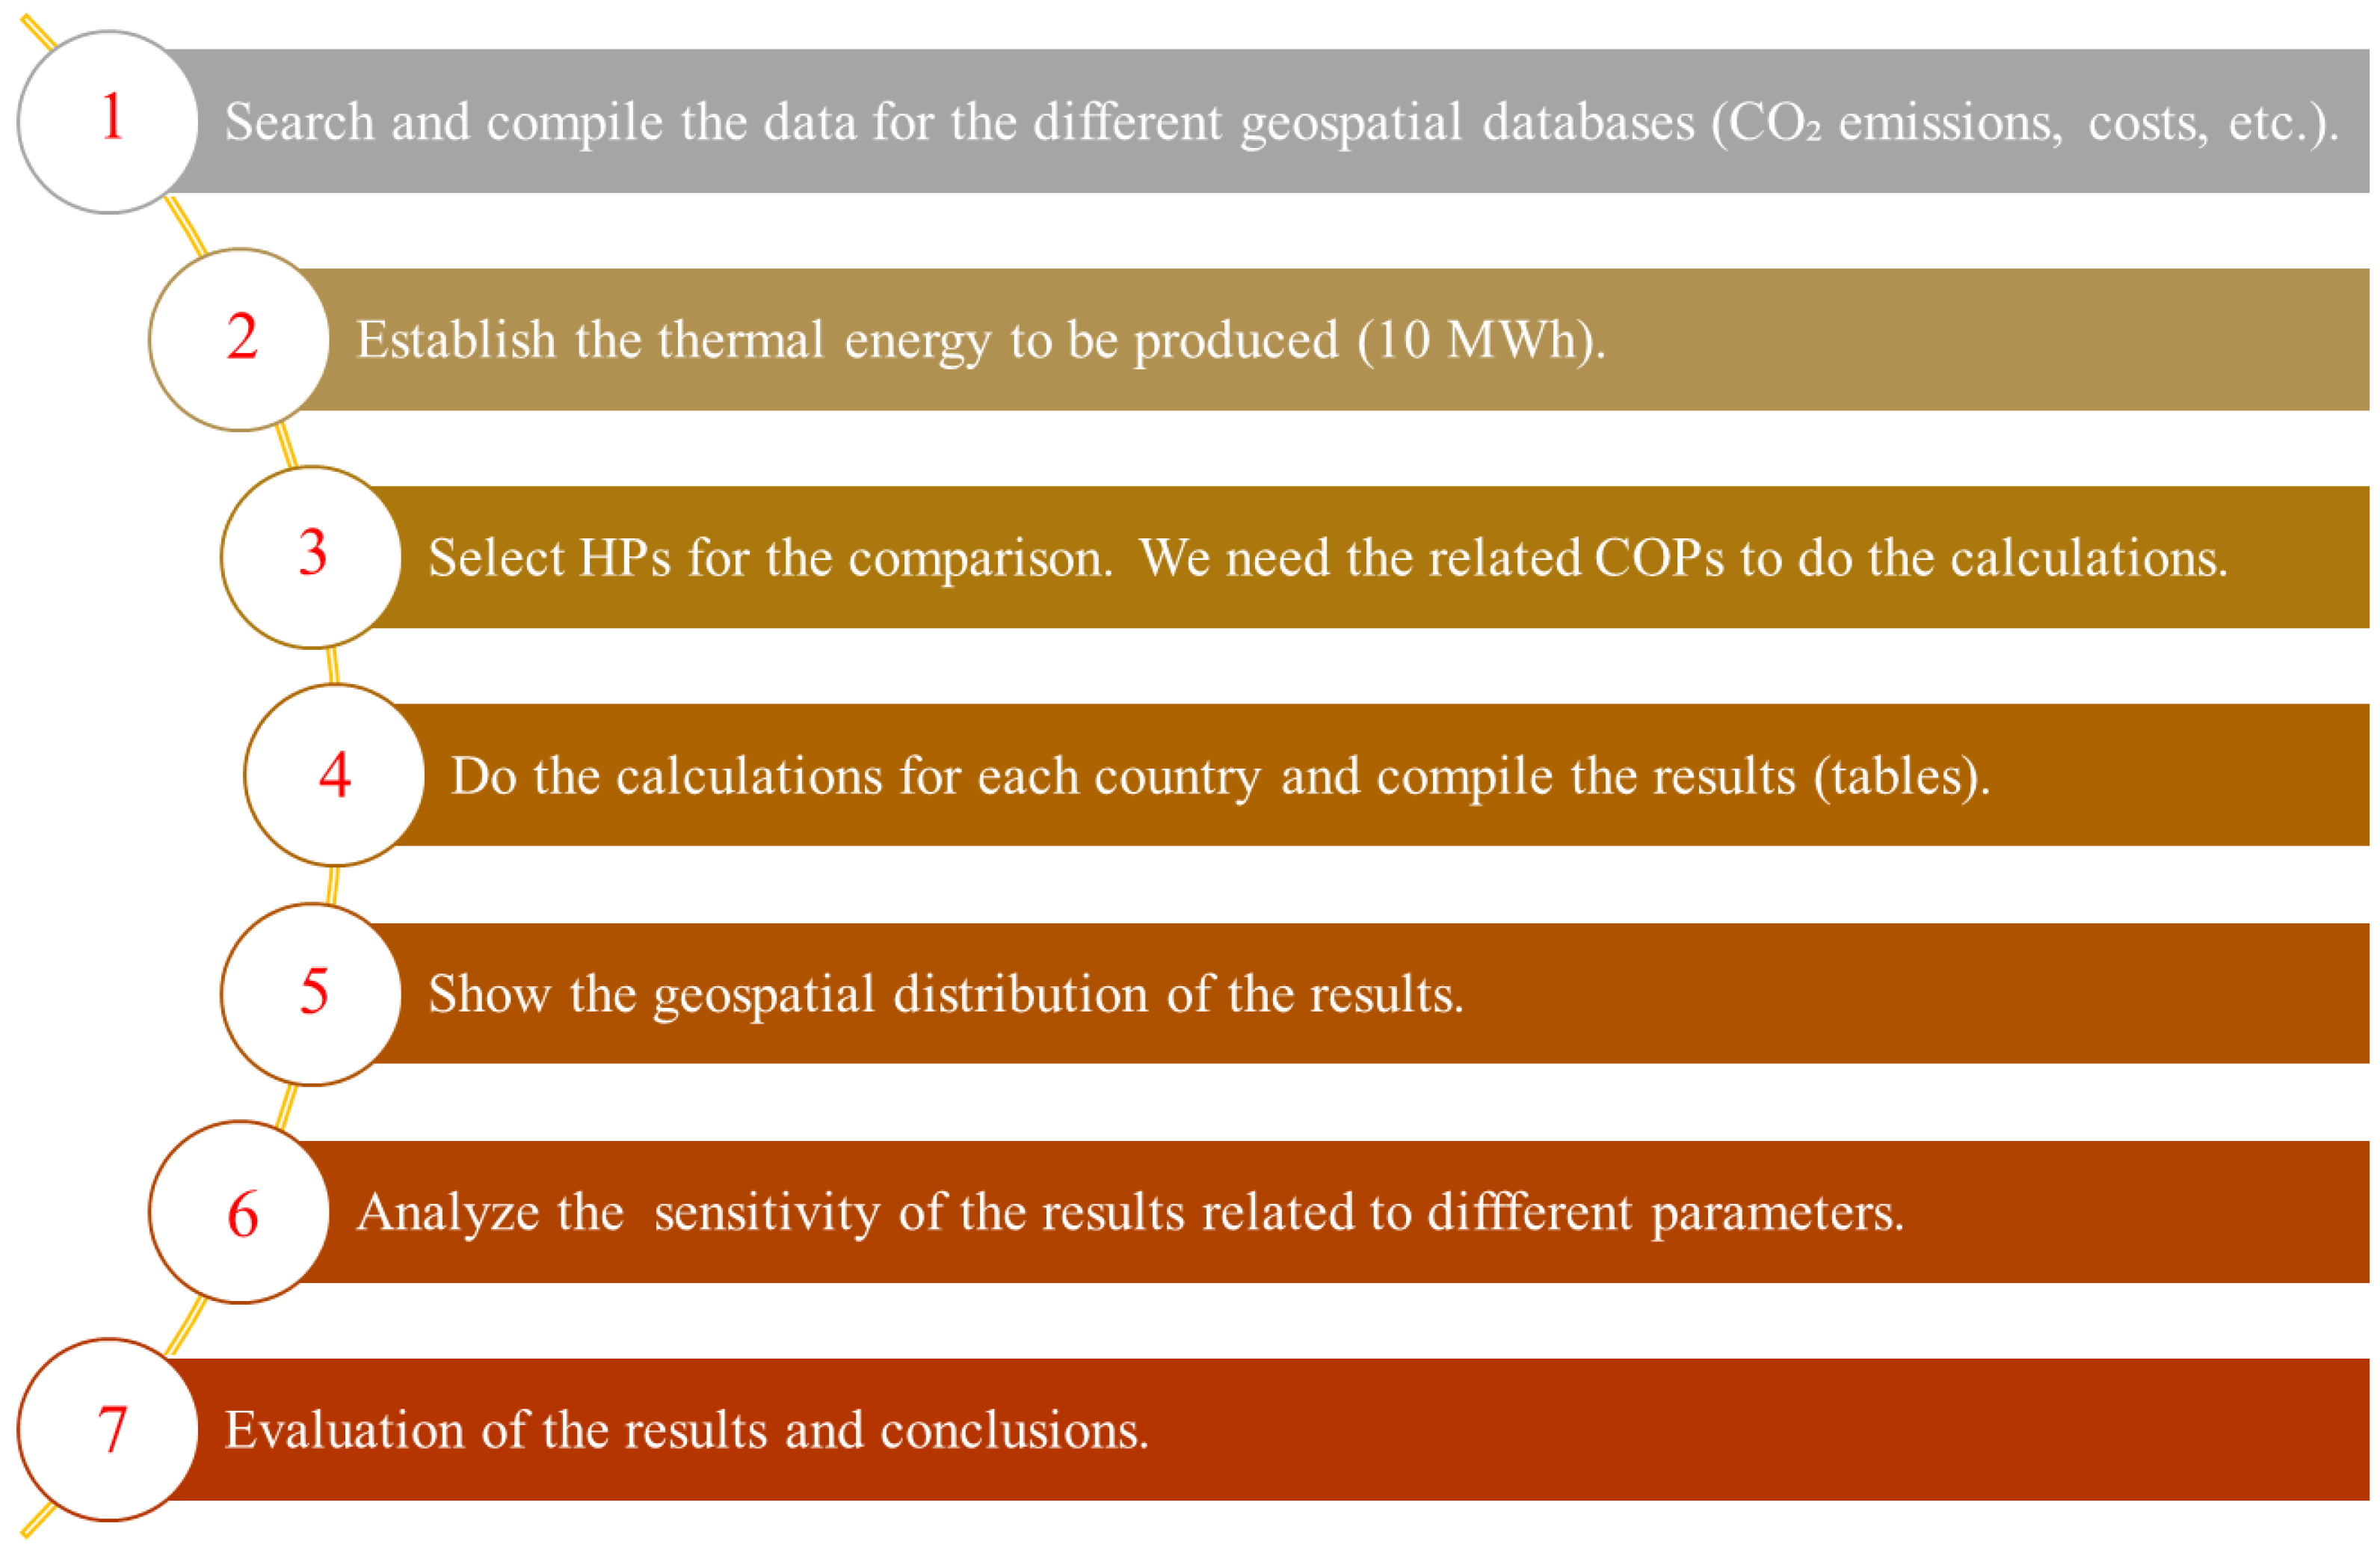
The general workflow followed in this study is shown in the next diagram (
Figure 1):
It is important to notice that the COP of the HP conditions the design of the well field associated with the geothermal system. A higher COP means that the field must supply a lot more energy to the system so a much larger well field is needed. In the HPs driven by natural gas and biogas, the COPs are much lower; this reduces the drilling length of the well field so the initial investment is smaller [
9].
Regarding the different options of energy feeds proposed, the main focus is on the comparison of electricity versus natural gas. This is due to the present availability of these kinds of HPs in the market, although the electric ones are more widely available through European countries.
As an additional option to think about, and to introduce a new trend which could be a source of future works, the biogas alternative to the natural gas-driven HPs is suggested and taken into account in the comparisons. Although this has to be done with the following assumptions:
There are no biogas HPs available in the market at the moment, although a direct use in the natural gas HP is considered here, this may not be possible to apply in real devices due to the different composition and the different higher calorific values (HCV) of the two gases. To introduce biogas driven HPs, these probably must have some differences in the gas engine section at least.
If the internal combustion engine of the heat pump is not supplied by natural gas but by biogas, the emissions of the energy sources associated with the use of this gas are usually considered zero because of the neutral cycle contemplated during its production [
10].
Transport and classification are mandatory whatever use is given to the residue (so emissions in this phase are not accounted to biogas).
If the biogas is produced in large-scale biogas plants, where capture and possible reuse of the different gases produced in the process could be achieved (carbon oxide CO, nitrogen oxides NOx, sulfur dioxide SO2, hydrocarbons HC, etc.) and the distribution of biogas is ideally done via gas-pipe to the surrounding vicinity of the biogas-plant, then emissions on distribution may ideally be near zero.
2. Materials and Methods
2.1. Heat Pumps Technology
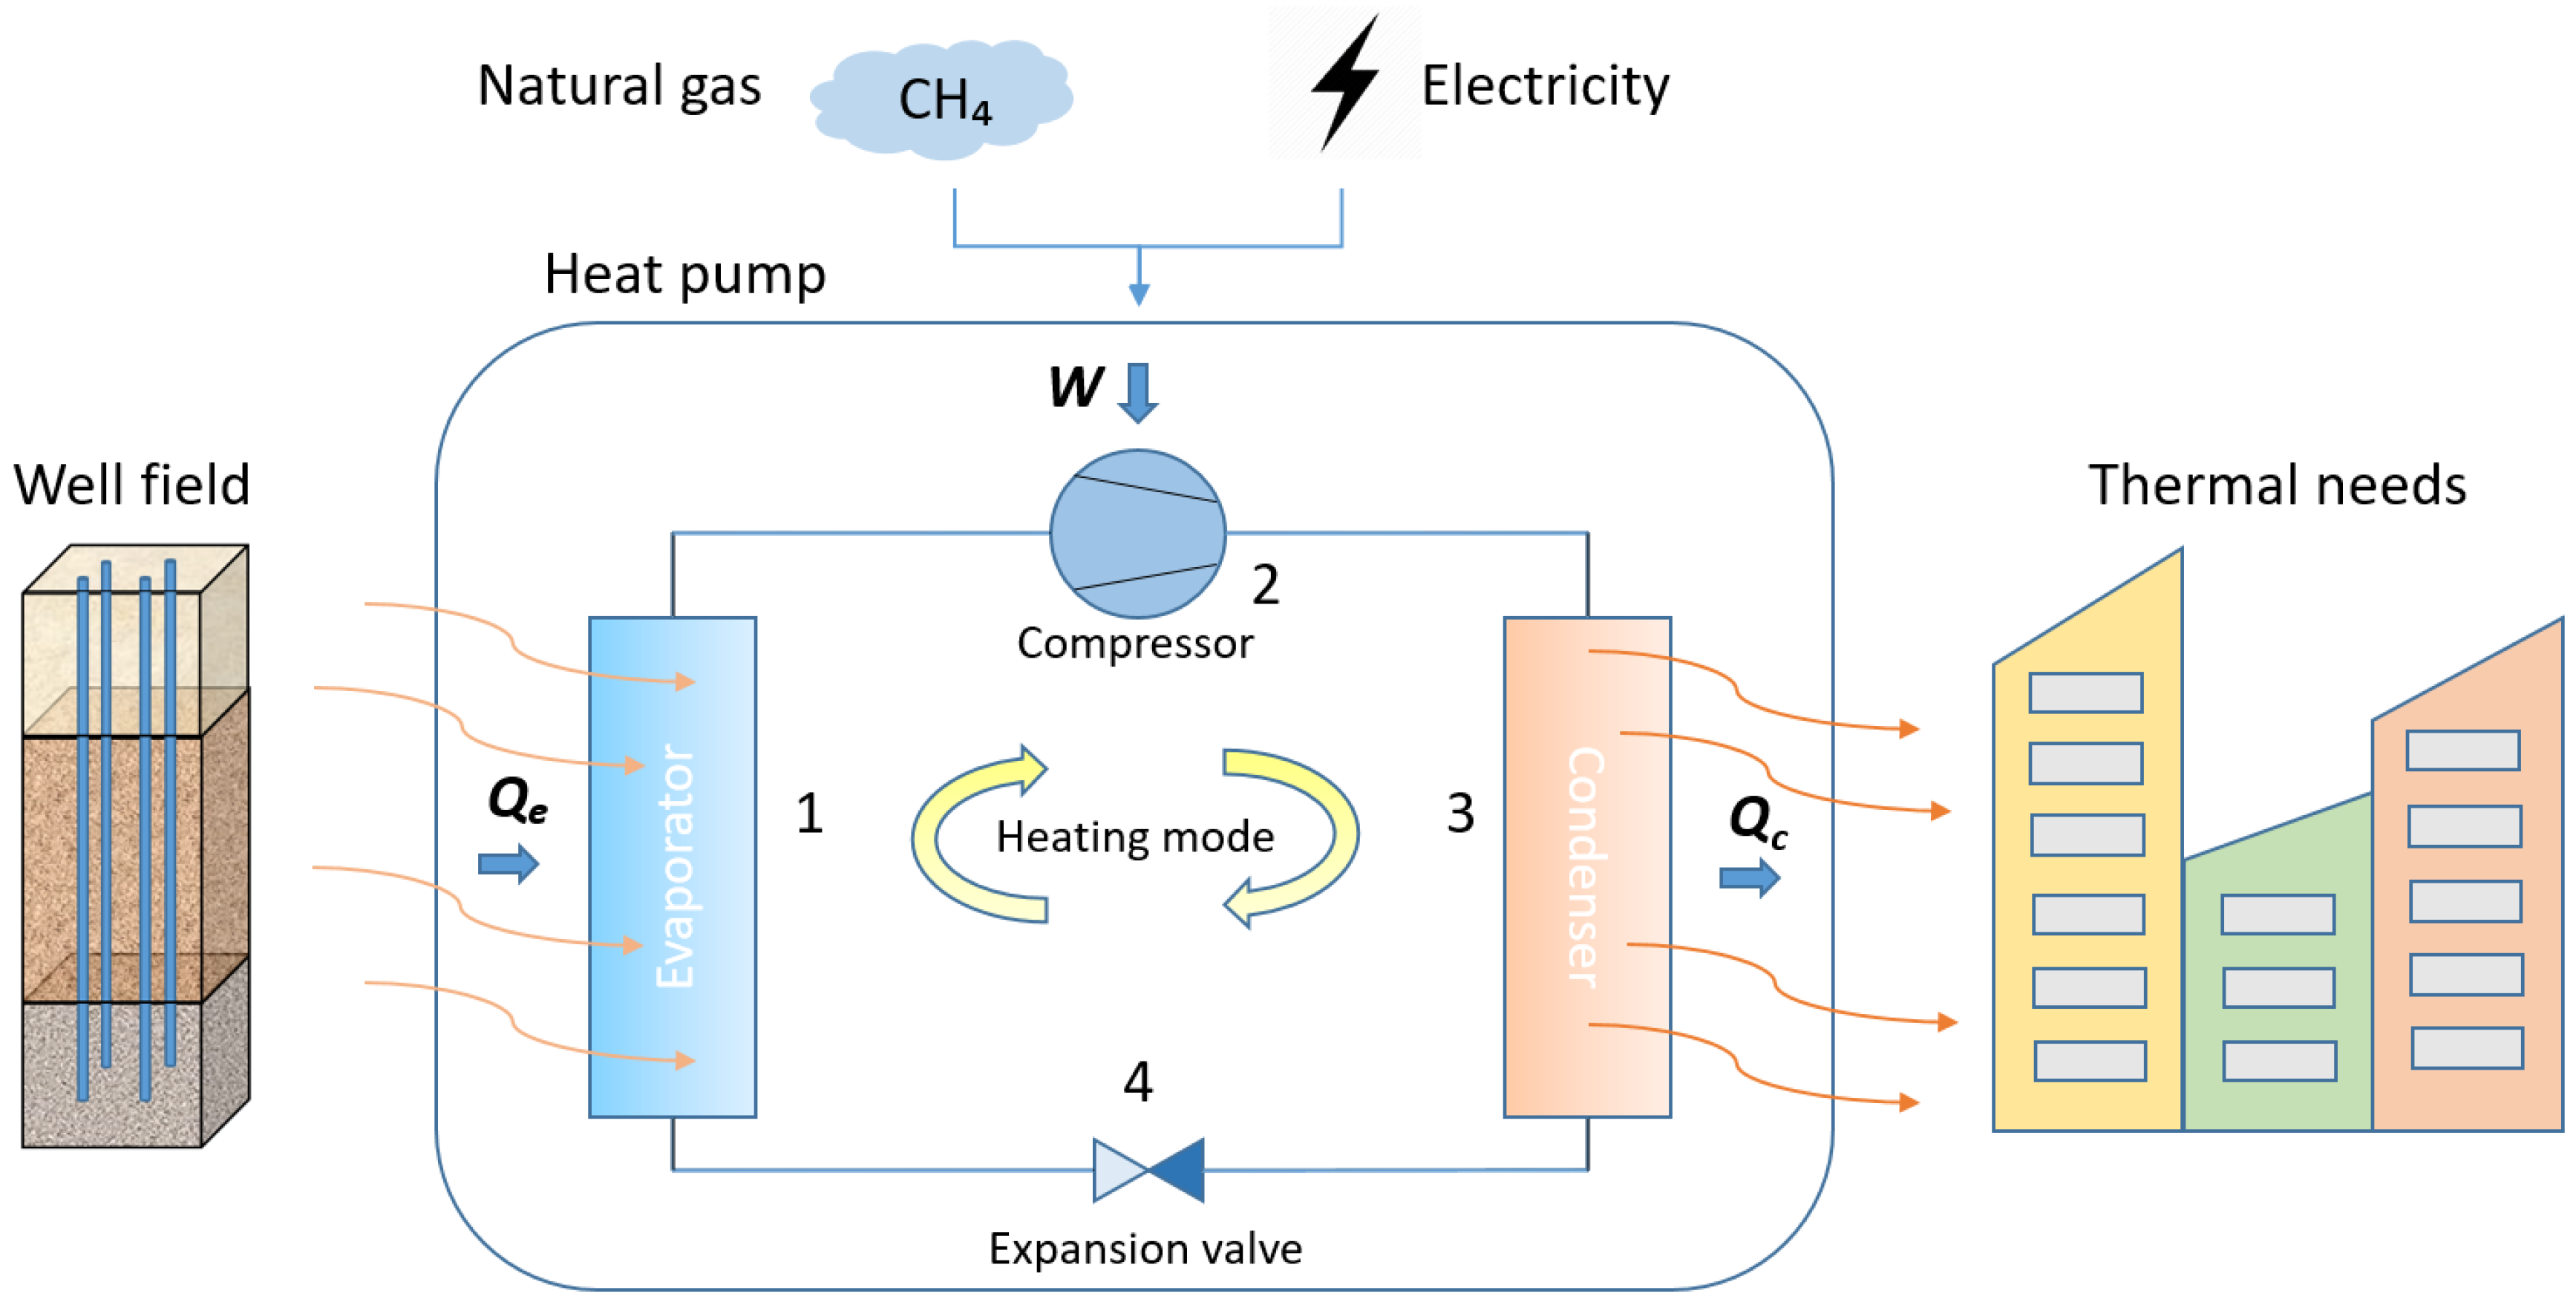
Ground source heat pumps geothermal systems (GSHPs) use the ground as a heat source or sink depending on seasonal working conditions. In heating mode (winter), heat is extracted from the ground by a set of boreholes, the energy that is taken from the ground is then lifted by the heat pump up into the building/s. For cooling applications (summer), this process can be reversed, injecting the heat extracted from the building into the ground.
In order to perform the thermal delivery from the ground to the building, the heat pump performs a cyclic process with 4 phases as shown in
Figure 2 for the heating cycle(for the cooling cycle it is the same in a reversed order).
In step 2 (
Figure 2) a compressor is mentioned, and the way of powering the compressor shaft will condition the type of heat pump (HP) that is chosen. Although the cycle described above is the same in all HPs, depending on the primal energy, there are some differences between HPs which are worth commenting on.
Heat pumps are usually categorized as electric heat pumps (EHPs) or gas engine heat pumps (GEHPs) [
11]. Most of the current heat pump models in the market are driven by electric motors. Regarding gas engine heat pumps, this equipment has recently been used as an alternative to the conventional electric heat pumps. They use natural gas, liquefied petrol gas (LPG) or biogas and they are able to recover the waste heat released by the engine to enhance the total heating capacity (this characteristic makes it possible to significantly reduce the drilling length of the well field) [
12].
For an EHP operating in heating mode, the energy efficiency can be established as follows. A quite intuitive start, thinking about the balance between the energy introduced and the heat obtained. Thus, a COP (coefficient of performance) which is the most widespread coefficient to compare performances of heat pumps (European Standard EN-14825-2016 of good practices in the calculation of HPs’ performance), can be defined, as follows (Equation (1)).
The concept of the performance of our system can be extended to the electrical supply and performance of the compressor (electric), defining what is known as a global coefficient of performance (Equation (2)):
The coefficient of performance of the electric motors (C
1) of heat pumps in the domestic regime is around 90%. C
2 depends on the electric mix of which the HP is operating [
13].
Data from the EHP selected for this study are presented in a table (
Table 1) later on, the typical COP of these heat pumps is around 4-4.5 [
14].
There are heat pumps on the market (GEHPs) that perform the thermodynamic heat exchange cycle described above driven by a compressor, which in turn, is driven by an internal combustion engine (most commonly fueled by natural gas or biogas). In this case, Equation (2) turns into Equation (3).
For the thermodynamic performance obtained from the Otto cycle engine, C
1 from Equation (3) is usually around 30–35% [
15]. This reduces the COP of the heat pump in terms of the energy provided (from the natural gas) and the energy obtained from the land to be transferred to the building. The COP from GEHPs is usually around 1.5–1.7 (more detailed data about the GEHP selected for this study can be found in
Table 1).
The effect of the lower performance of the Otto cycle engine from the GEHPs compared to EHPs may induce GSHP designers to think that the EHP is a better choice, however, we must take into account some considerations:
The heat pumps selected for this study are described in
Table 1. All the characteristics are from a real heat pump that can be purchased and included in a geothermal system.
The same characteristics for the GEHP and the biogas HP are assumed, although there are some differences between the two energy sources explained in the next section. These differences may require specific designs of the devices in biogas HPs which are not yet available in the market.
2.2. Analysis Description
The objective of this study, as presented in the introduction, is to compare the economic and environmental performances of different HPs in different European countries. This will be done by considering a certain quantity of thermal energy (equal for all cases) in order to describe how this thermal energy is delivered by each one of the different heat pumps in each case and then reveal the economic and environmental costs of the process. The annual energy demand in Europe of a single-family home strongly depends on the climate area where it is located [
12,
17]. In the cited article [
12], the thermal needs are described for the same building located in three different climate areas as established by the European Directive 2009/28/CE [
18]. The annual thermal needs in these three equivalent buildings are: 39.088, 71.742, and 88.882 MWh per year. As can be seen, the usual thermal needs in Europe for a regular home are in the order of magnitude of some tens of MWh per year. There is also another reason related to the annual thermal (domestic) needs per person in Europe, which are around 10 MWh also depending on the circumstances related above. So, 10 MWh of thermal energy has been established as the reference energy to be produced in this comparison by the different systems. The data related to the energy mix and CO
2 emissions for each location come from different geospatial databases such as Eurostat, the International Energy Agency, etc. All this is referenced in Tables 3 and 4 in
Section 4.
2.2.1. Heat Pump Selection
For this study, two types of domestic heat pumps have been selected to perform the analysis on a real basis, in
Table 2 the characteristics of both devices are shown.
The GEHP will also work with Biogas for the sake of this study and although this technology is not fully developed, it could be one of the best solutions from the economic and environmental points of view. To be able to work with biogas, some considerations about the system must be assumed. First of all, at the moment there are not yet any HPs in the market ready to be fed with biogas, so for this study, the data from the GEHP selected in
Table 2 will be used as if it were possible to feed that HP with biogas. Secondly, the consumption of the GEHP fed with biogas will be greater than with natural gas to get the same amount of energy, this is because the biogas higher calorific value (HCV) is lower than the natural gas HCV. According to the Institute for Diversification and Energy Saving “idea” [
12], the biogas HCV is 46.21% lower than the natural gas HCV, so the volumetric gas consumption will be 46.21% higher in this case. However, the COP of the biogas GEHP will remain the same because it only depends on the energy balance of the thermodynamic process, and here the thermal energy supplied by natural gas and biogas is the same.
2.2.2. Input Energies
A brief look at the energies used in the operation of the correspondent HPs. Main characteristics and sources are given, in order to establish the framework for the economic and environmental calculations in the next section.
1. Natural gas
An equal natural gas composition is established for all countries, consisting of 99% methane and 1% of other components, mainly CO
2 [
19].
Energy data comes from the IDAE in its report on the calorific powers of fuels, where it quotes sources from EUROSTAT and the International Energy Agency (IEA). HCV of natural gas is set to 9667 kcal / Nm3 (11.23 kWh / Nm3).
Regarding the emissions, data from IDAE in its guide of CO
2 emissions for each energy source [
19] has been considered. Therefore, 0.252 kg CO2/ kWh of final energy will be used in further calculations. These energy and CO
2 emissions data can be extended to all countries since we have set equal natural gas conditions.
2. Biogas
The IDAE data for calorific powers of fuels mentioned in
Section 2.2.1 has been used as a reference here also. HCV of 5200 kcal / Nm3 (6.04 kWh / Nm3) for biogas is set from that same source.
The biogas type composition is 53.5% methane and 46.5% CO2. The energetic consequence of this chemical composition, established as the standard for all countries, is clear if we compare the calorific values of the natural gas and biogas. This is also mentioned in the previous sections.
The assumptions for the biogas HPs made in the introduction must be taken into account, all the data and analysis are from this point of view.
3. Electricity
In order to calculate CO2 emissions by electric energy use, data from the International Energy Agency have been used. The fraction of the CO2 emissions that should come from electricity production has been proportionally separated, taking into account the amount of generation that comes from the renewable energies and those that do not (data in I.A.E. Statistics by country).
The process of obtaining CO2 emissions by electricity production in each country started from the separation of total emissions by electricity and large-scale heating. Here, it has been taken into account that the data on the production of electricity from fossil fuels (those that contribute to these emissions) is given to us in the form of electrical energy, a performance factor in that transformation of 0.4 has been considered to evaluate the thermal energy used and to establish the proportion that determines the electrical contribution to the total emissions of the data.
3. Results
In
Table 3, the countries selected and the CO
2 emissions and household prices for the three types of energies considered to feed the different HPs are presented.
Emissions and costs in the three cases of primal energy feed to the HPs in different countries selected can be found in
Table 4. Emissions from biogas combustion are usually considered to be zero, because of the neutral cycle contemplated during its production. For the costs and emissions in EHP and GEHP fed by natural gas, the associated calculations have been performed as follows:
Biogas prices are an estimation based on prices offered in Spain by some biogas producers extended to all the other countries by keeping the ratio of the price with natural gas (this seems to fit in the countries with biogas prices available to compare).
As shown, while biogas prices are related to the natural gas prices or taken directly from suppliers, biogas emissions are considered zero.
With all the data from
Table 3 and the formulas referred above, we can introduce
Table 4.
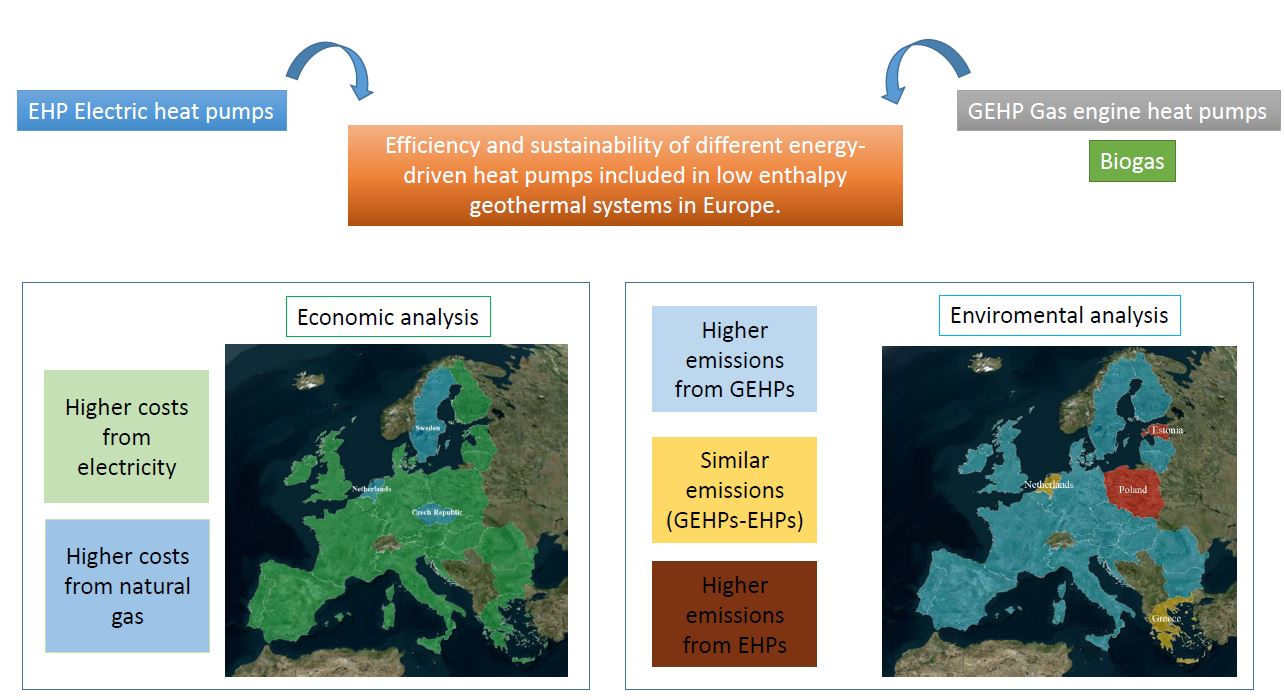
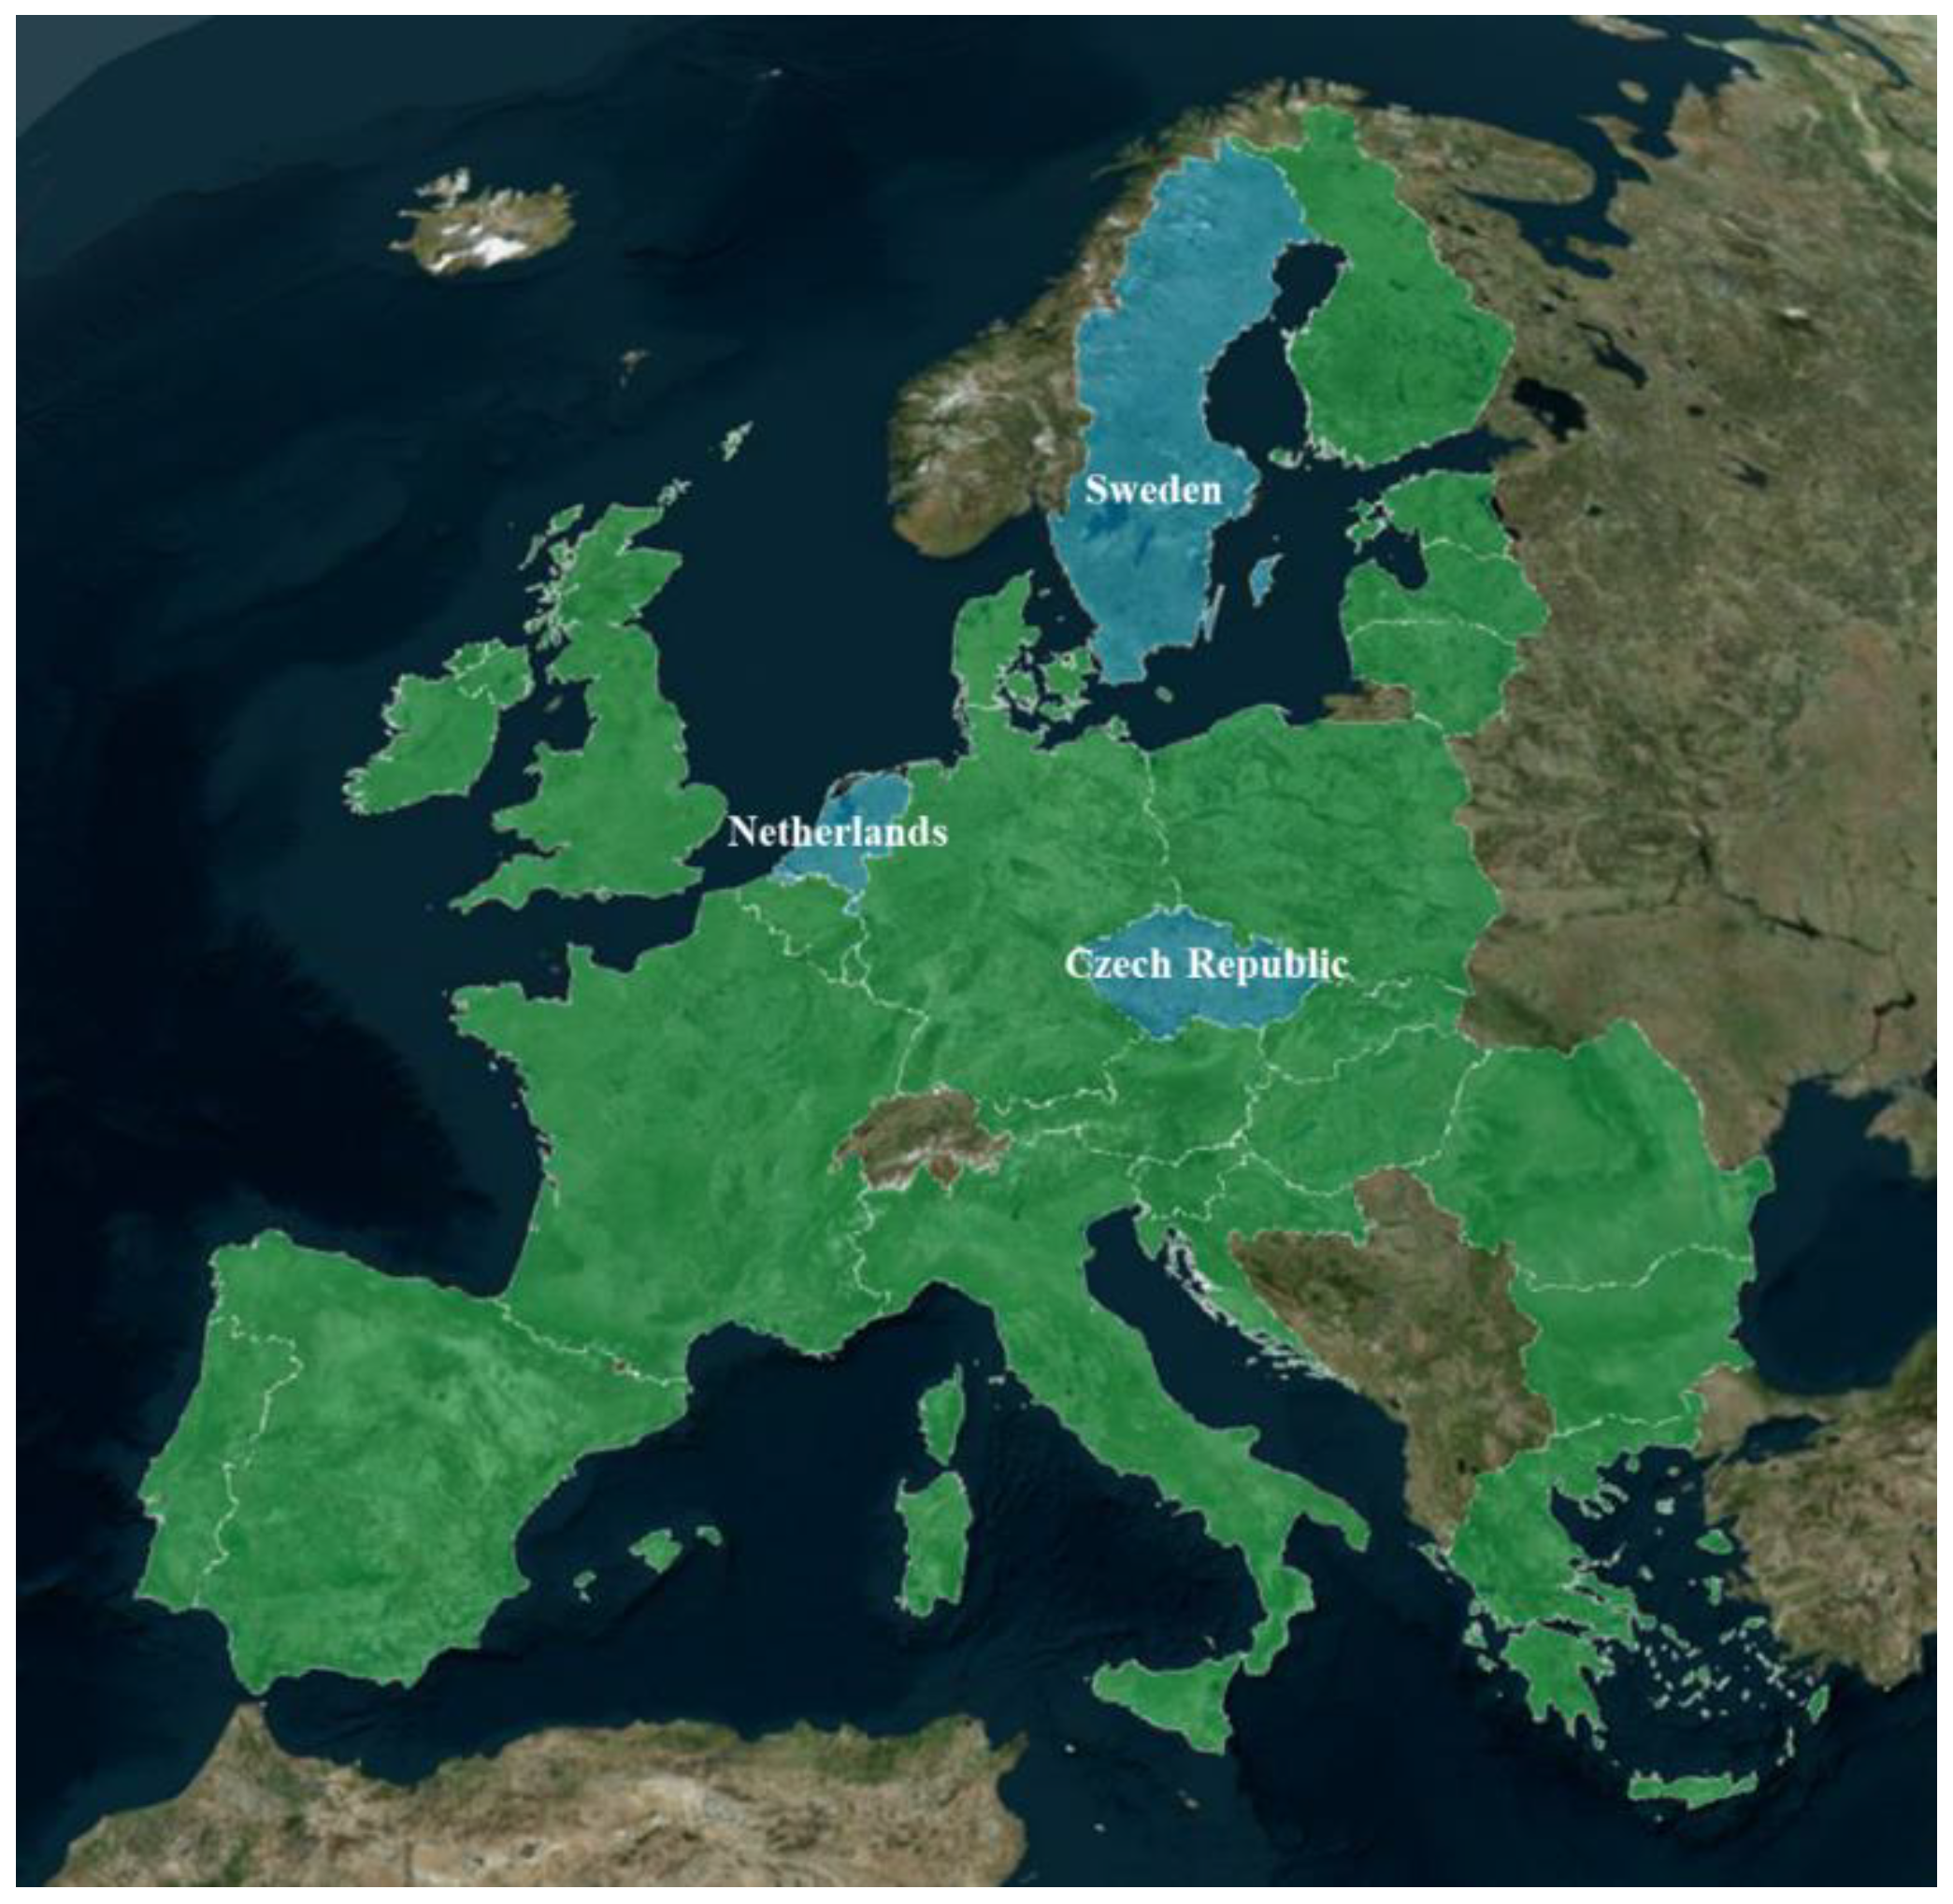
There are some remarkable results in
Table 4. Regarding the economic aspect, biogas costs are, by far, the cheapest of all three options. EHPs prices to get 10 MWh are commonly higher than the ones from GEHPs except for three countries: The Netherlands, Sweden, and the Czech Republic. (
Figure 3).
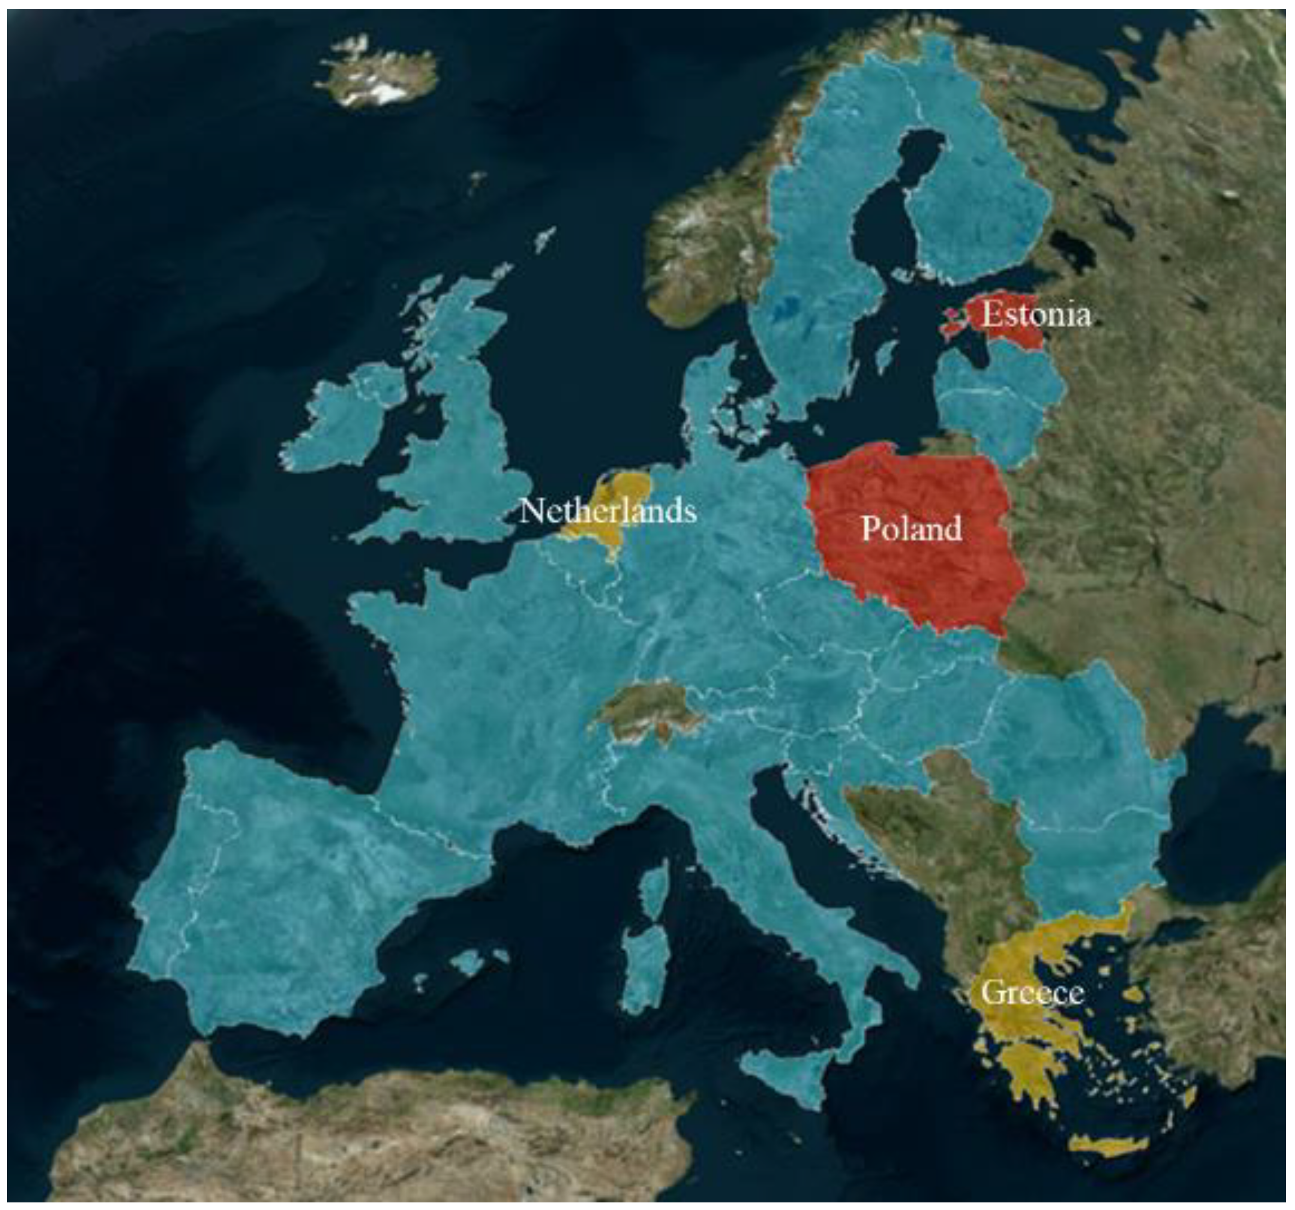
From the emissions point of view,
Table 4 shows that there are two countries (Poland and Estonia), where EHPs CO
2 emissions are higher than GEHPs emissions as suggested in previous sections. We can see also that there are some countries where both emissions are quite similar. (
Figure 4).
Combining cost and emissions, Poland and Estonia showed lower costs and lower emissions scenario for GEHPs against EHPs. Greece shows lower costs from GEHPs and similar emissions, and The Netherlands presents similar emissions but higher costs from GEHPs.
Evolutions expected and extended conclusions are detailed in the next sections.
4. Discussion
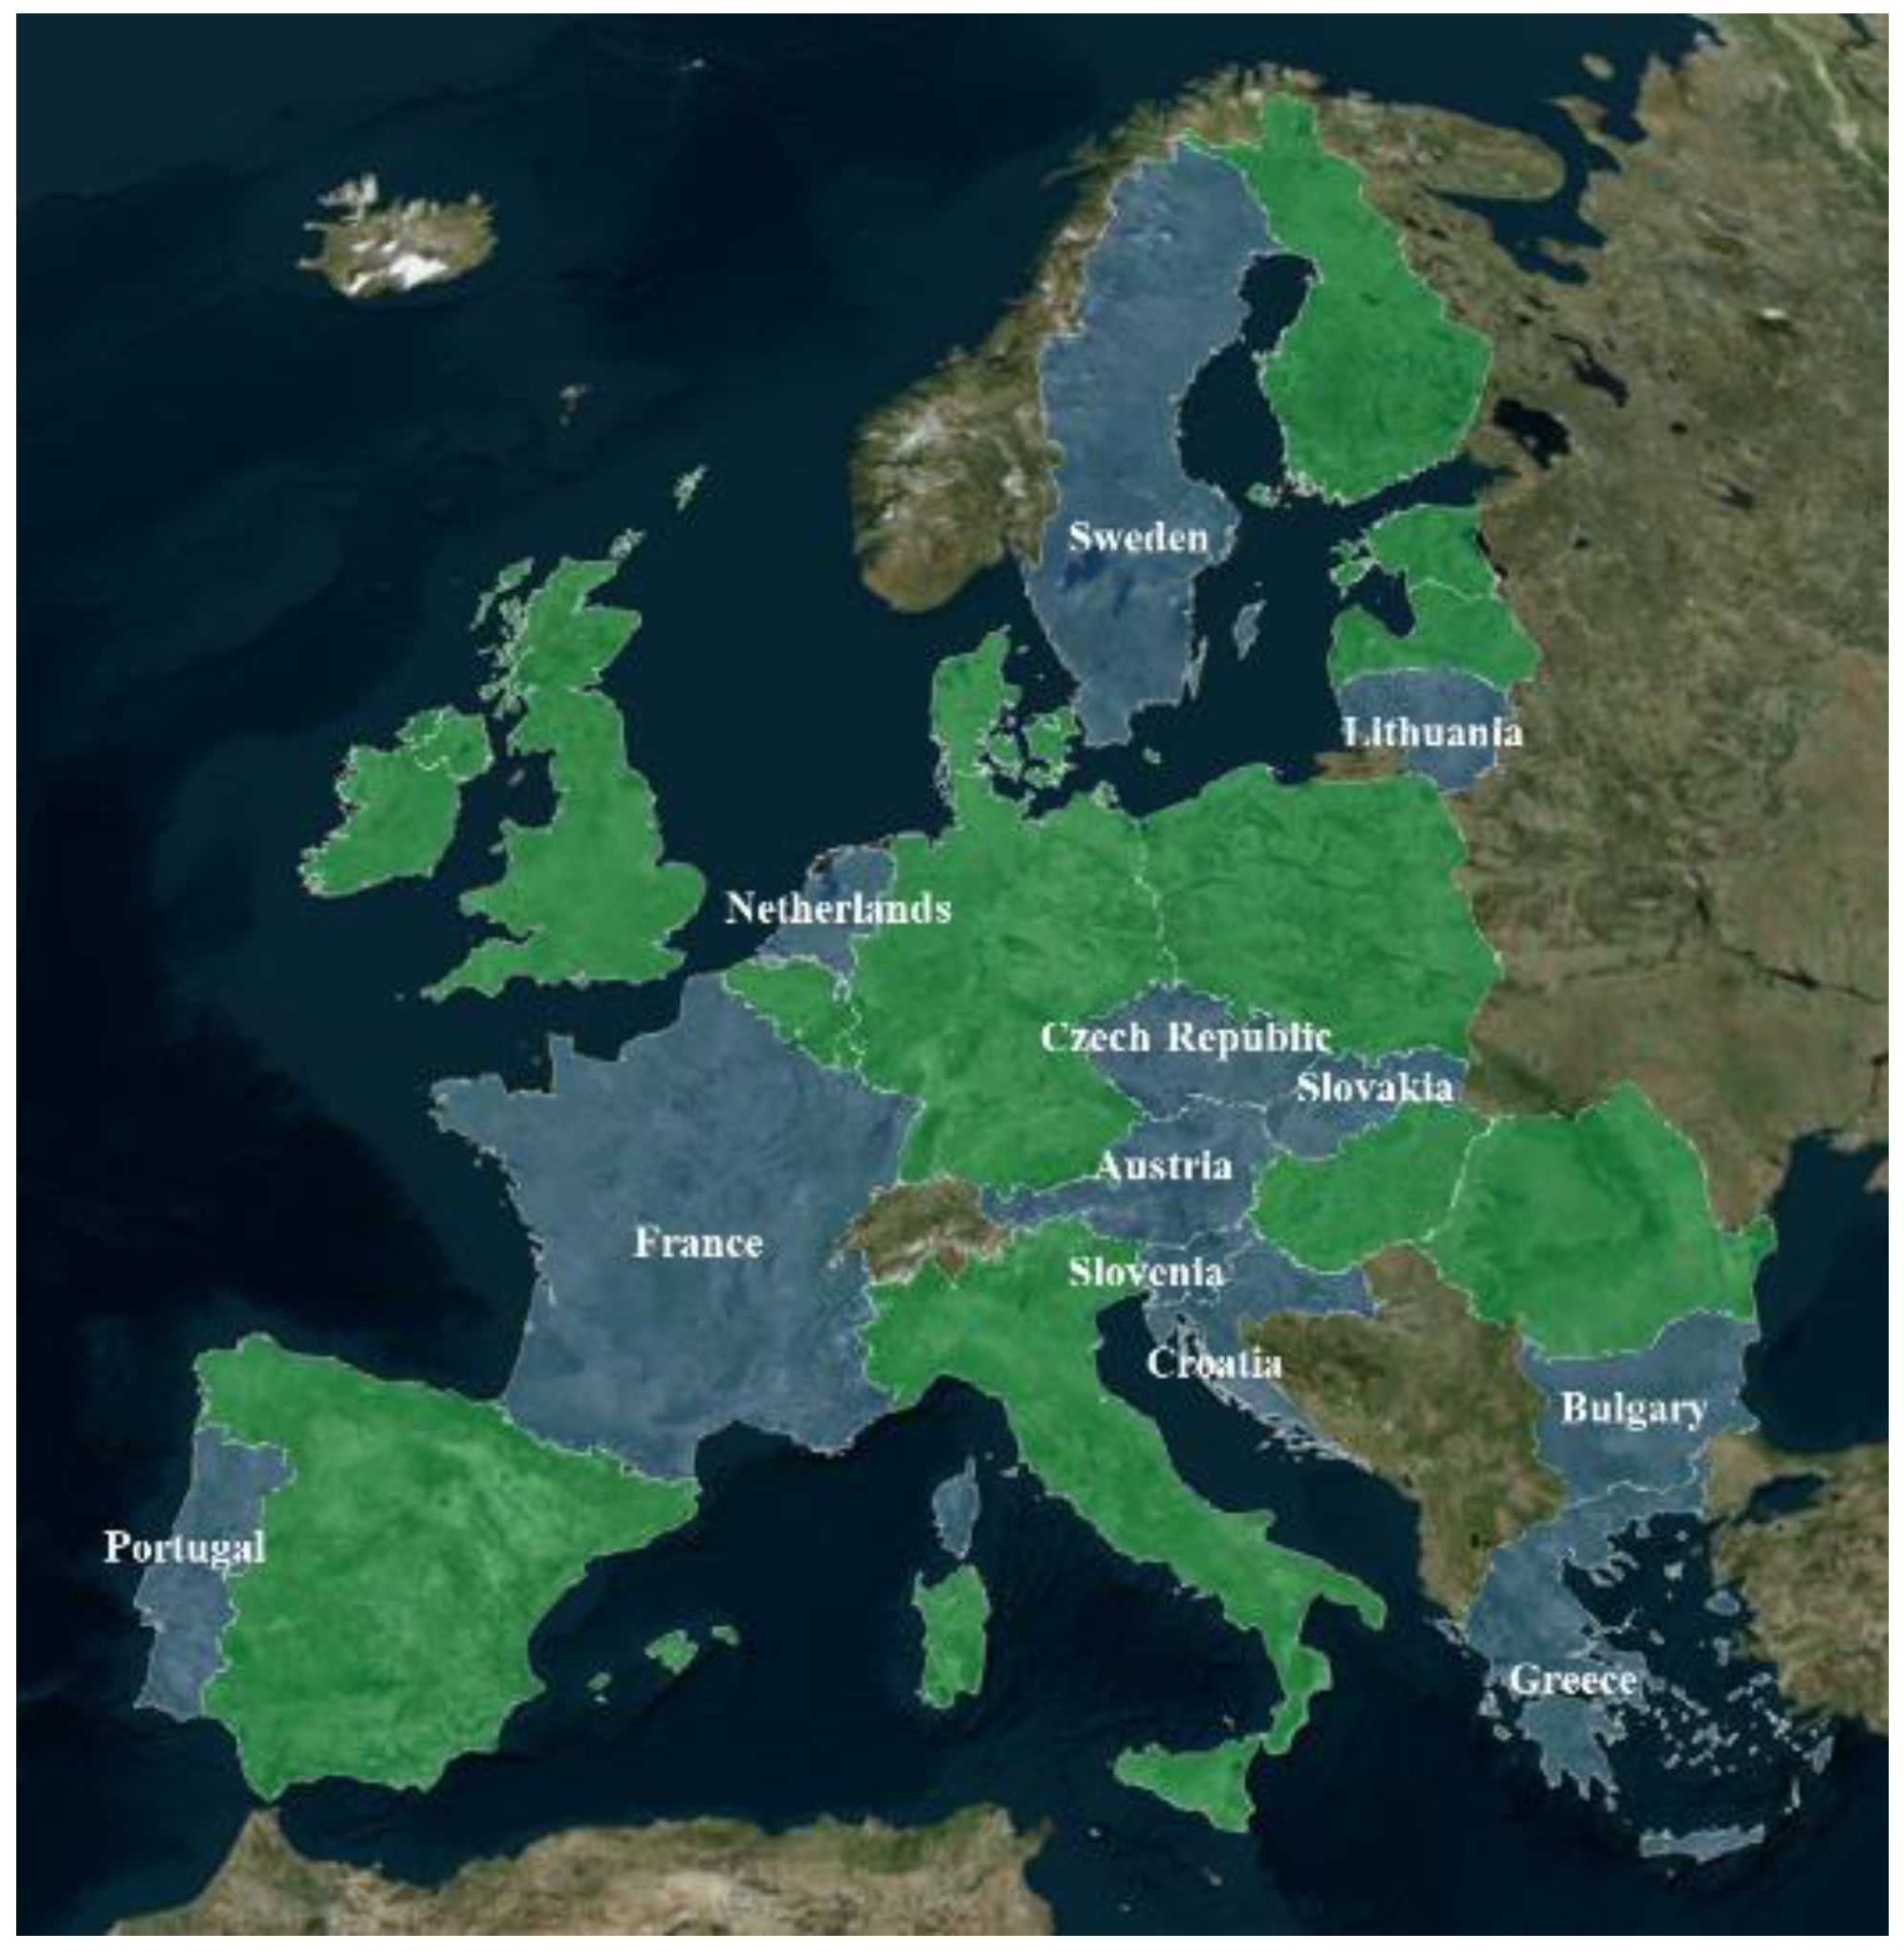
Concerning the economical aspect from
Figure 3, it is clear that, despite the difference between the COPs of the HPs, the GEHPs have less operational costs in most countries. This may be surprising due to the different natural gas supplies in Europe. There seems to be no difference between the southern-Mediterranean area, where the natural gas usually comes from than the north of Africa and the east-northern-central parts of the continent, where the gas comes through the gas-pipes from Russia. The countries not following this trend (The Netherlands, Czech Republic, and Sweden) have especially higher taxes on imported natural gas due to advanced green policies.
CO
2 emissions shown in
Figure 4 are quite clarifying regarding the impact of fossil fuels on the electrical mix of each country. Three groups of countries can be clearly distinguished:
The majority of countries (in light blue in the map from
Figure 4) present less CO
2 emissions from EHPs than from GEHPs. As commented above, this should be expected because of the present policies in the EU and also because of the difference in the COPs of the two types of HPs considered. This difference between the COPs means that it is necessary to spend much more energy from GEHPs than from EHPs (0.58 against 0.22 factors) to obtain the same amount of thermal energy considered (10 MWh).
The Netherlands and Greece have quite similar emissions from both systems (the difference is less than 20%). These countries are the most sensible for future trends, in the next sub-section (4.1 Sensitivity analysis) some future scenarios are analyzed.
Poland and Estonia present more emissions from EHPS than from GEHP systems (17% and 22%, respectively). This can only resemble the high percentage of electricity mix derived from fossil fuel combustion in those countries. Some future developments may change this scenario and it is worth analyzing some possibilities (next sub-section).
In
Appendix A, a description of the electricity mixes of these four countries is included.
4.1. Sensitivity Analysis
This section presents a sensitivity analysis to evaluate how different factors may influence the costs and the emissions of the different HPs considered. We will be proposing changes to the main factors guided by the recent circumstances around them, and taking into account the geographical, political, and social environment.
4.1.1. Sensitivity Related to COP Improvement in EHPs
A 25% improvement in the COP of the EHPs (from 4 to 5 in our case) could be possible in the near future according to past behavior, so it seems interesting to take into account this scenario.
This COP enhancement may come from new and improved designs on this device and also because of the improvements in the design of the geothermal systems where an improvement in the working conditions may affect the COP [
20].
With this COP improvement in the EHPs, the map from
Figure 3 changes a lot (
Figure 5). We have 12 countries now (instead of two) where the cost to get 10 MWh of thermal energy is higher from the GEHPs than from the EHPs.
Regarding the emissions in this scenario, it is interesting to compare
Figure 4 with
Figure 6. Whereas in the first case, there are two countries with higher emissions from the electricity mix than from the gas engine heat pumps, in the new scenario, there is only one country in this situation, Estonia, and two other countries where emissions are similar (the difference is less than 25%), Poland and Greece. The Netherlands have now clearly lower emissions from EHPs.
4.1.2. Sensitivity Related to COP Improvement in GEHPs
Due to the low market penetration of these models of HPs, it is not expected that there will be an improvement in the COP of these systems based on research and development in the factories. In addition to this, the political environment in Europe is not favoring these kinds of devices, although the geothermal systems should be considered as important in future plans for the heating and air-conditioning industry.
It is also worth mentioning that an important improvement in the COP of these systems will mean that one of the main advantages of the GEHPs could be compromised. This is the ability to reduce, in a considerable way, the drilling length of the well field.
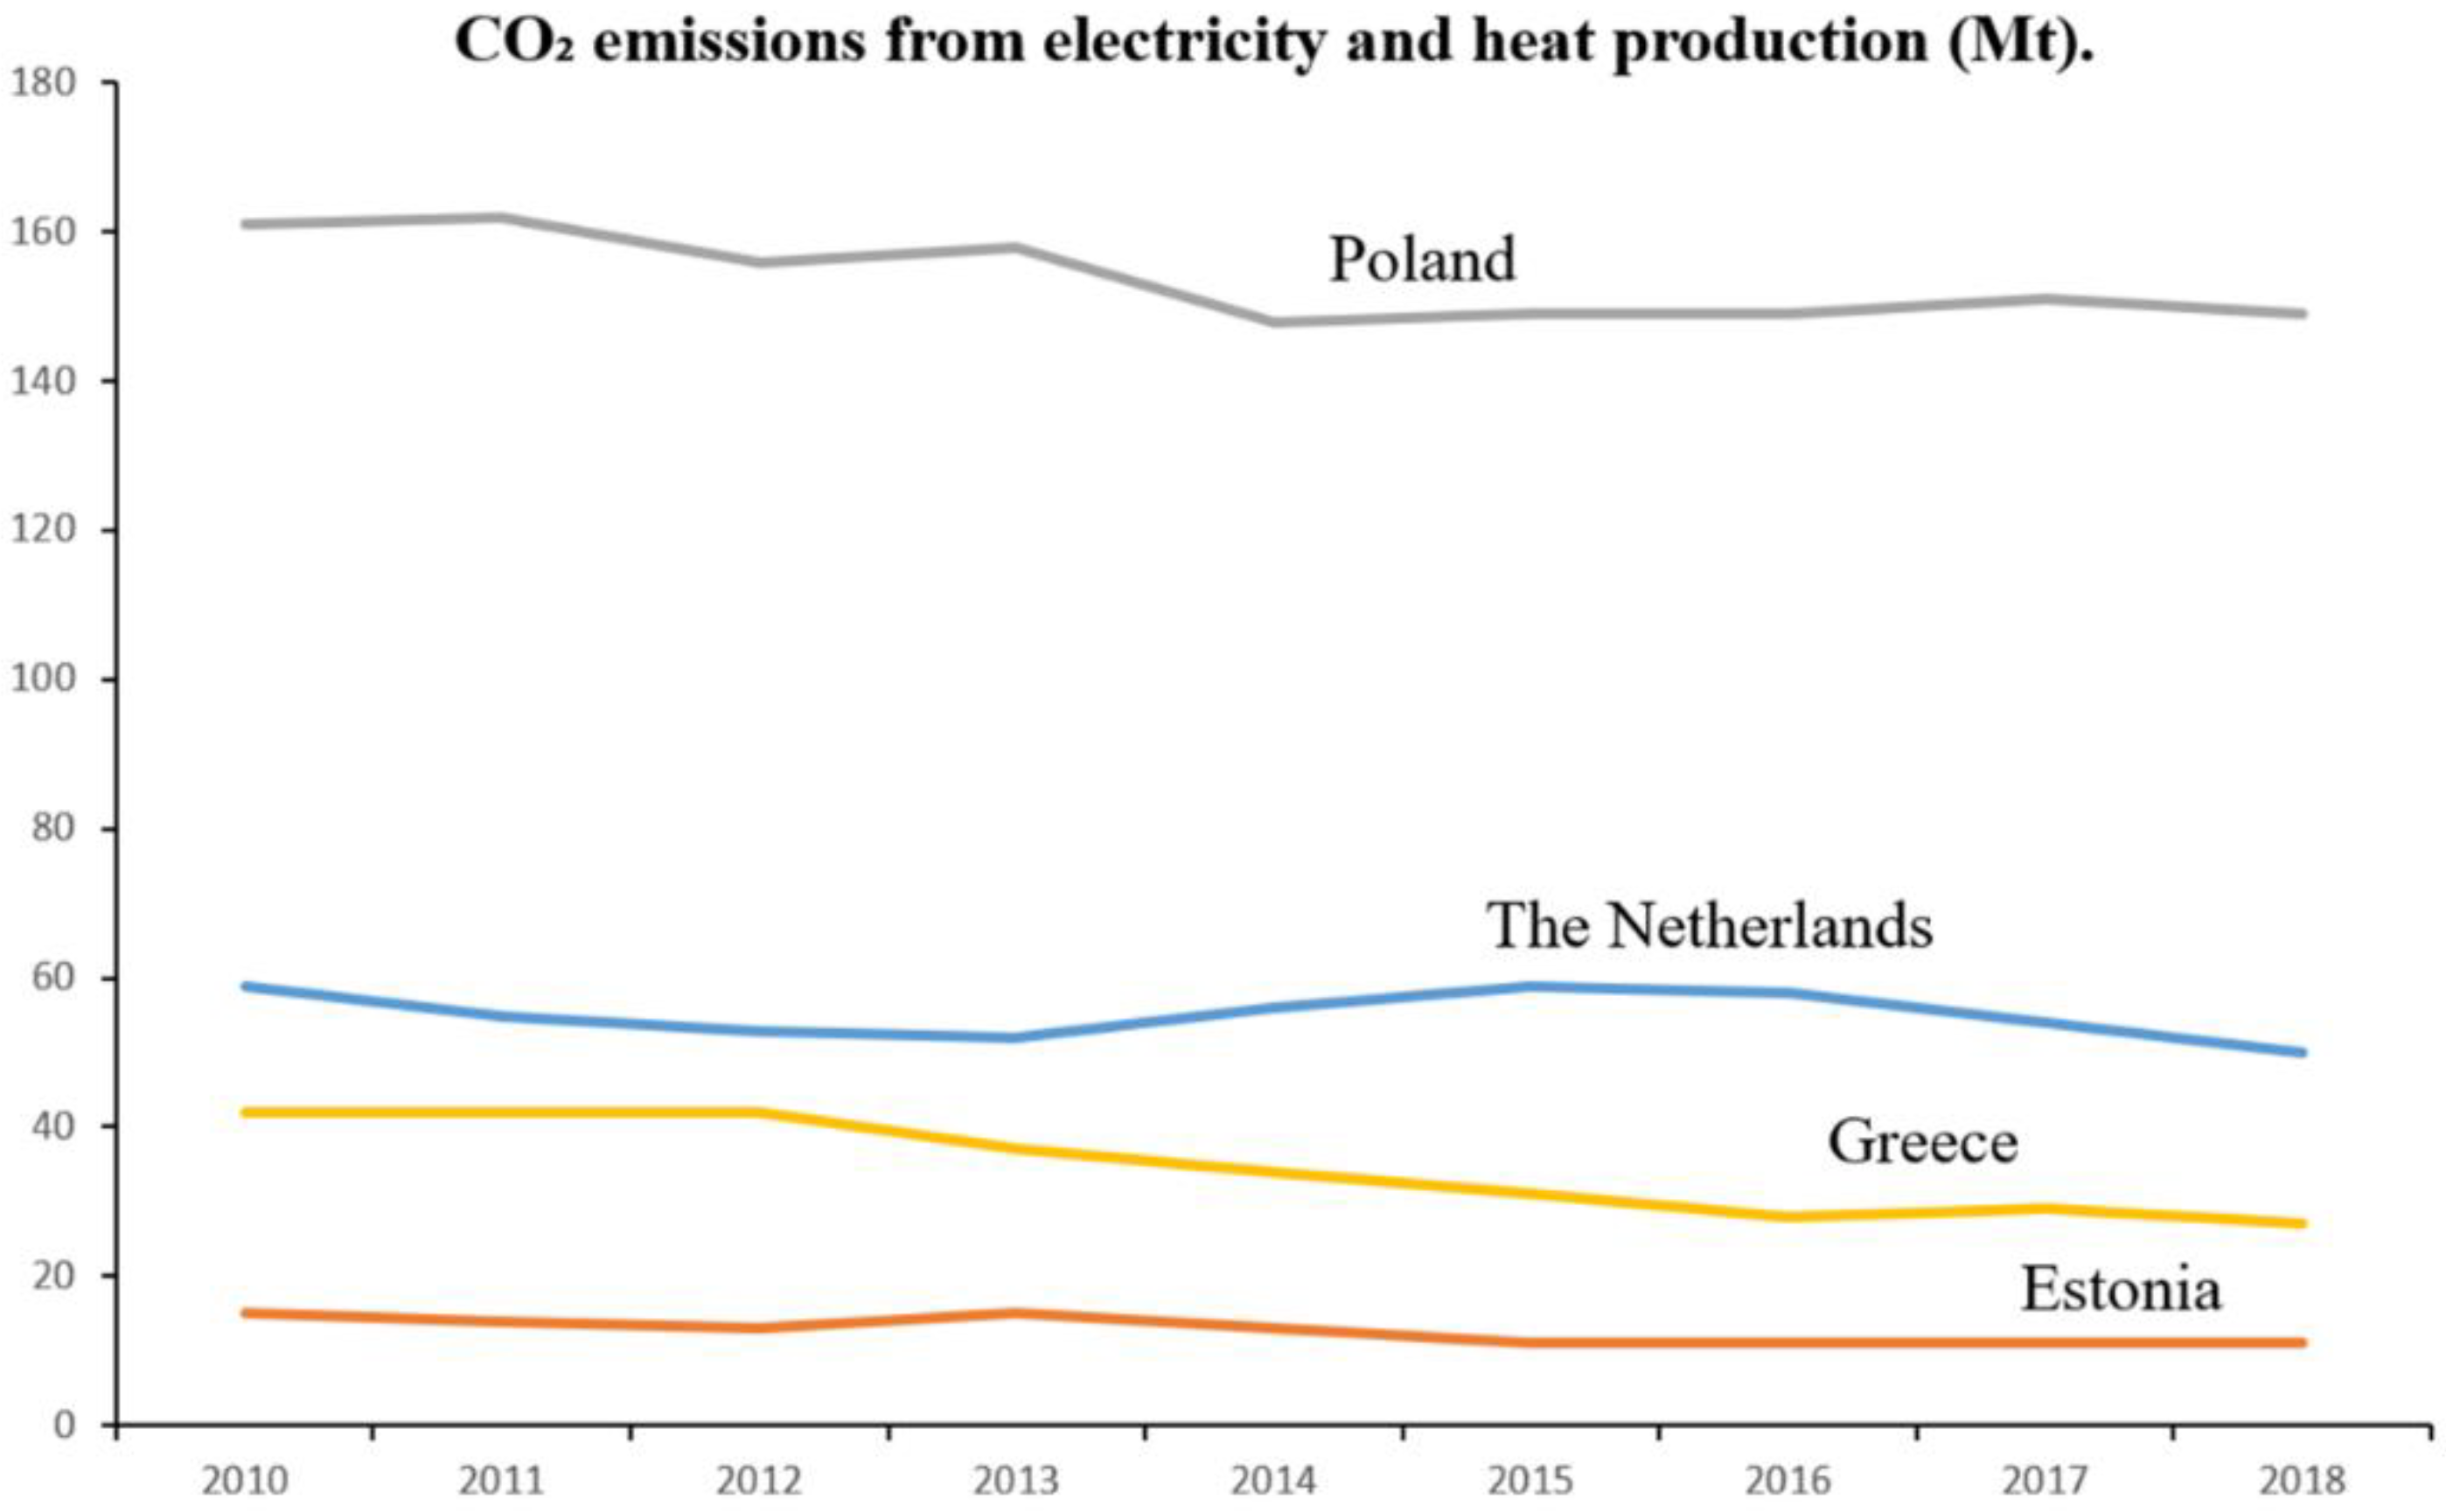
4.1.3. Sensitivity Related to Emissions in Electricity Production
This scenario is especially important for the countries in
Figure 3, where emissions from EHPs are higher than the ones from GEHPs, and it is in those cases where an improvement in the emissions from electricity production could produce a change concerning solutions with fewer emissions.
Figure 7 shows the evolution of CO
2 emissions from electricity production in these four countries.
In two countries, Poland and Estonia, the emissions from GEHPs were less than the ones from EHPs. As
Figure 6 shows in both cases, there is not any clear decreasing signal in the evolution of emissions over the last 4–5 years. So it is unlikely to find a significant change in the near future [
21].
The two other countries from
Figure 3, Greece and The Netherlands, are special because their emissions from EHPs are lower but quite near the ones from GEHPs. Here a downward trend in the emissions is observed, especially in The Netherlands. This may affect the selection of GEHPs since the costs are also higher there.
5. Conclusions
Homogeneity with some interesting exceptions seems to be the rule in the economic and environmental sections of this study. In the economic part (summarized in
Figure 3) GEHPs prevail in most countries, though the sensitivity analysis shows that this could not last long (
Figure 5). However, from the environmental point of view, the EHPs system is better in most countries with some exceptions as commented below.
It is clear from all the data collected and compiled in this work, that the biogas driven HPs would be the best solution from the economic and environmental points of view. The development and widespread usage of these types of GSHP systems would contribute to the low emission policies to be implemented in Europe in the near future [
22].
Apart from this, in most countries, EHPs are much more common than GEHPs. The results from this work seem to agree with this selection of most Europeans. However, although emissions are clearly higher from GEHPs in most geographical locations, the reduction of the drilling length, with the reduced initial investment derived from this, may be an important factor to consider. Additionally, the annual costs seem to be lower from natural gas in most countries. Maybe the purchase price of the GEHP is higher but this is fully balanced with the price reduction in the construction of the well field.
In
Table 5 we identify the four locations where the selection of the type of HP may not be so straight forward.
It is clear that in Poland and Estonia, under the current circumstances (which are not expecting to change much in the near future [
15]) the GEHP is the ideal selection from the economic and environmental points of view.
In the Netherlands, the gas price is against the GEHPs and the emissions are lower from EHPs and are continuing in that direction in the future Therefore, the usual selection would be electrical. The Greek case is similar, here, even the annual costs are lower for the GEHPs. However, future developments in CO2 emissions from electricity production and COP improvements in EHPs seem to recommend the electric choice also.
We can conclude that, for some geographical areas and under certain circumstances, it may be a good idea to recommend the GEHPs to reduce the thermal energy costs and the CO2 emissions at the same time. The cutout in the initial investment is also an advantage to take into consideration.
Apart from these exceptional cases, in most countries in Europe, the EHP may be a better option (mainly due to the emissions factor) and will be getting even better in the near future.
Author Contributions
Conceptualization, I.M.N., D.B.-D. and C.S.B.; methodology, I.M.N., D.B.-D., C.S.B.; validation, I.M.N., D.B.-D., C.S.B., A.F.M. and D.G.-A.; formal analysis, I.M.N., D.B.-D., C.S.B.; investigation, I.M.N.; resources, A.F.M. and D.G.-A.; data curation, I.M.N., D.B.-D., C.S.B., A.F.M. and D.G.-A.; writing—original draft preparation, I.M.N.; writing—review and editing, I.M.N., D.B.-D., C.S.B., A.F.M. and D.G.-A.; supervision, D.B.-D., A.F.M. and D.G.-A. All authors have read and agreed to the published version of the manuscript.
Funding
This research received no external funding.
Acknowledgments
Authors would like to thank the Department of Cartographic and Land Engineering of the Higher Polytechnic School of Avila, University of Salamanca, for allowing us to use their facilities and their collaboration during the experimental phase of this research. Authors also want to thank the University of Salamanca and Santander Bank for providing a pre-doctoral Grant (Training of University Teachers Grant) to the corresponding author of this paper what has made possible the realization of the present work.
Conflicts of Interest
The authors declare no conflict of interest.
Nomenclature
| HP | heat pump |
| COP | coefficient of performance |
| SPF | seasonal performance factor |
| GSHP | ground source heat pump geothermal system |
| EHP | electric heat pumps |
| GEHP | gas-engine heat pump |
| LPG | liquefied petrol gas |
| W | mechanical energy from the compressor (MWh) |
| Qc | thermal energy from the condenser (MWh) |
| Qe | thermal energy from the evaporator (MWh) |
| C1 | coefficient of performance of the electric motor or the gas engine motor of the HP |
| C2 | average performance of the thermoelectric transformation of the primary energy into electricity |
| HCV | higher calorific value |
| IDAE | Institute for Diversification and Energy Saving |
| EUROSTAT | Statistical Office of the European Union |
| EP | electricity prices (€/kWh) |
| EEC | emissions (CO2) by electricity consumption (g CO₂/kWh) |
| NGP | natural gas prices (€/kWh) |
| ENGC | emissions (CO2) by natural gas consumption (g CO₂/kWh) |
Appendix A
Information about the composition of the electricity mixes of the countries under discussion is presented here. Data from the International Energy Agency (2018).
Table A1.
Poland and Estonia, electricity mix composition (IEA Key energy statistics 2018).
Table A1.
Poland and Estonia, electricity mix composition (IEA Key energy statistics 2018).
| | Electricity [GWh] |
|---|
| Energy Source | Poland | Estonia |
|---|
| Coal | 132.972 | 10.093 |
| Oil | 1.864 | 119 |
| Natural Gas | 12.643 | 58 |
| Biofuels | 6.247 | 1.255 |
| Waste | 525 | 124 |
| Nuclear | --- | --- |
| Hydro | 2388 | 16 |
| Geothermal | --- | --- |
| Solar PV | 301 | --- |
| Wind | 12.844 | 636 |
| Tide | --- | --- |
| Municipal waste | 461 | 124 |
| Waste (renewable) | 83 | --- |
| Other sources | 68 | --- |
Table A2.
Netherlands and Greece electricity mix composition (IEA Key energy statistics 2018).
Table A2.
Netherlands and Greece electricity mix composition (IEA Key energy statistics 2018).
| | Electricity [GWh] |
|---|
| Energy Source | Netherlands | Greece |
|---|
| Coal | 29.884 | 17.907 |
| Oil | 1.292 | 4.788 |
| Natural Gas | 57.536 | 13.649 |
| Biofuels | 2.479 | 325 |
| Waste | 4.291 | --- |
| Nuclear | 3.515 | --- |
| Hydro | 72 | 5.814 |
| Geothermal | --- | --- |
| Solar PV | 3.201 | 3.792 |
| Wind | 10.549 | 6.300 |
| Tide | --- | --- |
| Municipal waste | 4.177 | --- |
| Waste (renewable) | 2.214 | --- |
| Other sources | 719 | --- |
References
- Bouzarovski, S.; Tirado Herrero, S. The energy divide: Integrating energy transitions, regional inequalities and poverty trends in the European Union. Eur. Urban Reg. Stud. 2017, 24, 69–86. [Google Scholar] [CrossRef] [PubMed] [Green Version]
- Mastrucci, A.; Marvuglia, A.; Leopold, U.; Benetto, E. Life Cycle Assessment of building stocks from urban to transnational scales: A review. Renew. Sustain. Energy Rev. 2017, 74, 316–332. [Google Scholar] [CrossRef]
- DIRECTIVE (EU) 2018/2001 of the European Parliament and of the Council of 11 December 2018 on the Promotion of the Use of Energy from Renewable Sources.
- Rybach, L. Geothermal power growth 1995–2013—A comparison with other renewables. Energies 2014, 7, 4802–4812. [Google Scholar] [CrossRef] [Green Version]
- Colmenar-Santos, A.; Palomo-Torrejón, E.; Rosales-Asensio, E.; Borge-Diez, D. Measures to remove geothermal energy barriers in the European Union. Energies 2018, 11, 3202. [Google Scholar] [CrossRef] [Green Version]
- Neuberger, P.; Adamovský, R. Analysis of the potential of low-temperature heat pump energy sources. Energies 2017, 10, 1922. [Google Scholar] [CrossRef] [Green Version]
- Borge-Diez, D.; Colmenar-Santos, A.; Pérez-Molina, C.; López-Rey, Á. Geothermal source heat pumps under energy services companies finance scheme to increase energy efficiency and production in stockbreeding facilities. Energy 2015, 88, 821–836. [Google Scholar] [CrossRef]
- Fraga, C.; Hollmuller, P.; Schneider, S.; Lachal, B. Heat pump systems for multifamily buildings: Potential and constraints of several heat sources for diverse building demands. Appl. Energy 2018, 225, 1033–1053. [Google Scholar] [CrossRef]
- Angrisani, G.; Diglio, G.; Sasso, M.; Calise, F.; d’Accadia, M.D. Design of a novel geothermal heating and cooling system: Energy and economic analysis. Energy Convers. Manag. 2016, 108, 144–159. [Google Scholar] [CrossRef]
- IEA Bioenergy. IEA Bioenergy Task 37: Energy from Biogas. Country Reports Summary 2014; Persson, T., Energiforsk (Sweden) and Baxter, D., Eds.; IEA Bioenergy: Paris, France, 2014; ISBN 978-1-910154-11-3. [Google Scholar]
- Lian, Z.; Park, S.R.; Huang, W.; Baik, Y.J.; Yao, Y. Conception of combination of gas-engine-driven heat pump and water-loop heat pump system. Int. J. Refrig. 2005, 28, 810–819. [Google Scholar] [CrossRef]
- Blázquez, C.S.; Borge-Diez, D.; Nieto, I.M.; Martín, A.F.; González-Aguilera, D. Technical optimization of the energy supply in geothermal heat pumps. Geothermics 2019, 81, 133–142. [Google Scholar] [CrossRef]
- Weisser, D. A guide to life-cycle greenhouse gas (GHG) emissions from electric supply technologies. Energy 2007, 32, 1543–1559. [Google Scholar] [CrossRef]
- Self, S.J.; Reddy, B.V.; Rosen, M.A. Geothermal heat pump systems: Status review and comparison with other heating options. Appl. Energy 2013, 101, 341–348. [Google Scholar] [CrossRef]
- Mozurkewich, M.; Berry, R.S. Optimal paths for thermodynamic systems: The ideal Otto cycle. J. Appl. Phys. 1982, 53, 34–42. [Google Scholar] [CrossRef]
- Sáez Blázquez, C.; Farfán Martín, A.; Nieto, I.M.; González-Aguilera, D. Economic and Environmental Analysis of Different District Heating Systems Aided by Geothermal Energy. Energies 2018, 11, 1265. [Google Scholar] [CrossRef] [Green Version]
- Boyano, A.; Hernandez, P.; Wolf, O. Energy demands and potential savings in European office buildings: Case studies based on EnergyPlus simulations. Energy Build. 2013, 65, 19–28. [Google Scholar] [CrossRef]
- Union, E. Directive 2009/28/EC of the European Parliament and of the Council of 23 April 2009 on the promotion of the use of energy from renewable sources and amending and subsequently repealing Directives 2001/77/EC and 2003/30/EC. Off. J. Eur. Union 2009, 5, 2009. [Google Scholar]
- Factores de Emisión de CO2 y Coeficientes de Paso a Energía Primaria de Diferentes Fuentes de Energía Final Consumidas en el Sector de Edificios en España; Instituto para la Diversificación y Ahorro de la Energía, “IDAE”: Madrid, Spain, 2016.
- AENOR. UNE-EN 14825:2019. Air conditioners, liquid chilling packages and heat pumps, with electrically driven compressors, for space heating and cooling—Testing and rating at part load conditions and calculation of seasonal performance. 2019. [Google Scholar]
- European Environment Agency. Overview of Electricity Production and Use in Europe; Chapter: “Is electricity production in Europe becoming less carbon intensive”; European Environment Agency: Copenhagen, Denmark, 2018. [Google Scholar]
- DIRECTIVE (EU). 2018/844 of the European Parliament and of the Council, amending Directive 2010/31/EU on the energy performance of buildings and Directive 2012/27/EU on energy efficiency. Off. J. Eur. Union. 2018. [Google Scholar]
© 2020 by the authors. Licensee MDPI, Basel, Switzerland. This article is an open access article distributed under the terms and conditions of the Creative Commons Attribution (CC BY) license (http://creativecommons.org/licenses/by/4.0/).

 ,
, 


