A Random Forest Modelling Procedure for a Multi-Sensor Assessment of Tree Species Diversity

 , ,
, , 
Abstract
:
1. Introduction
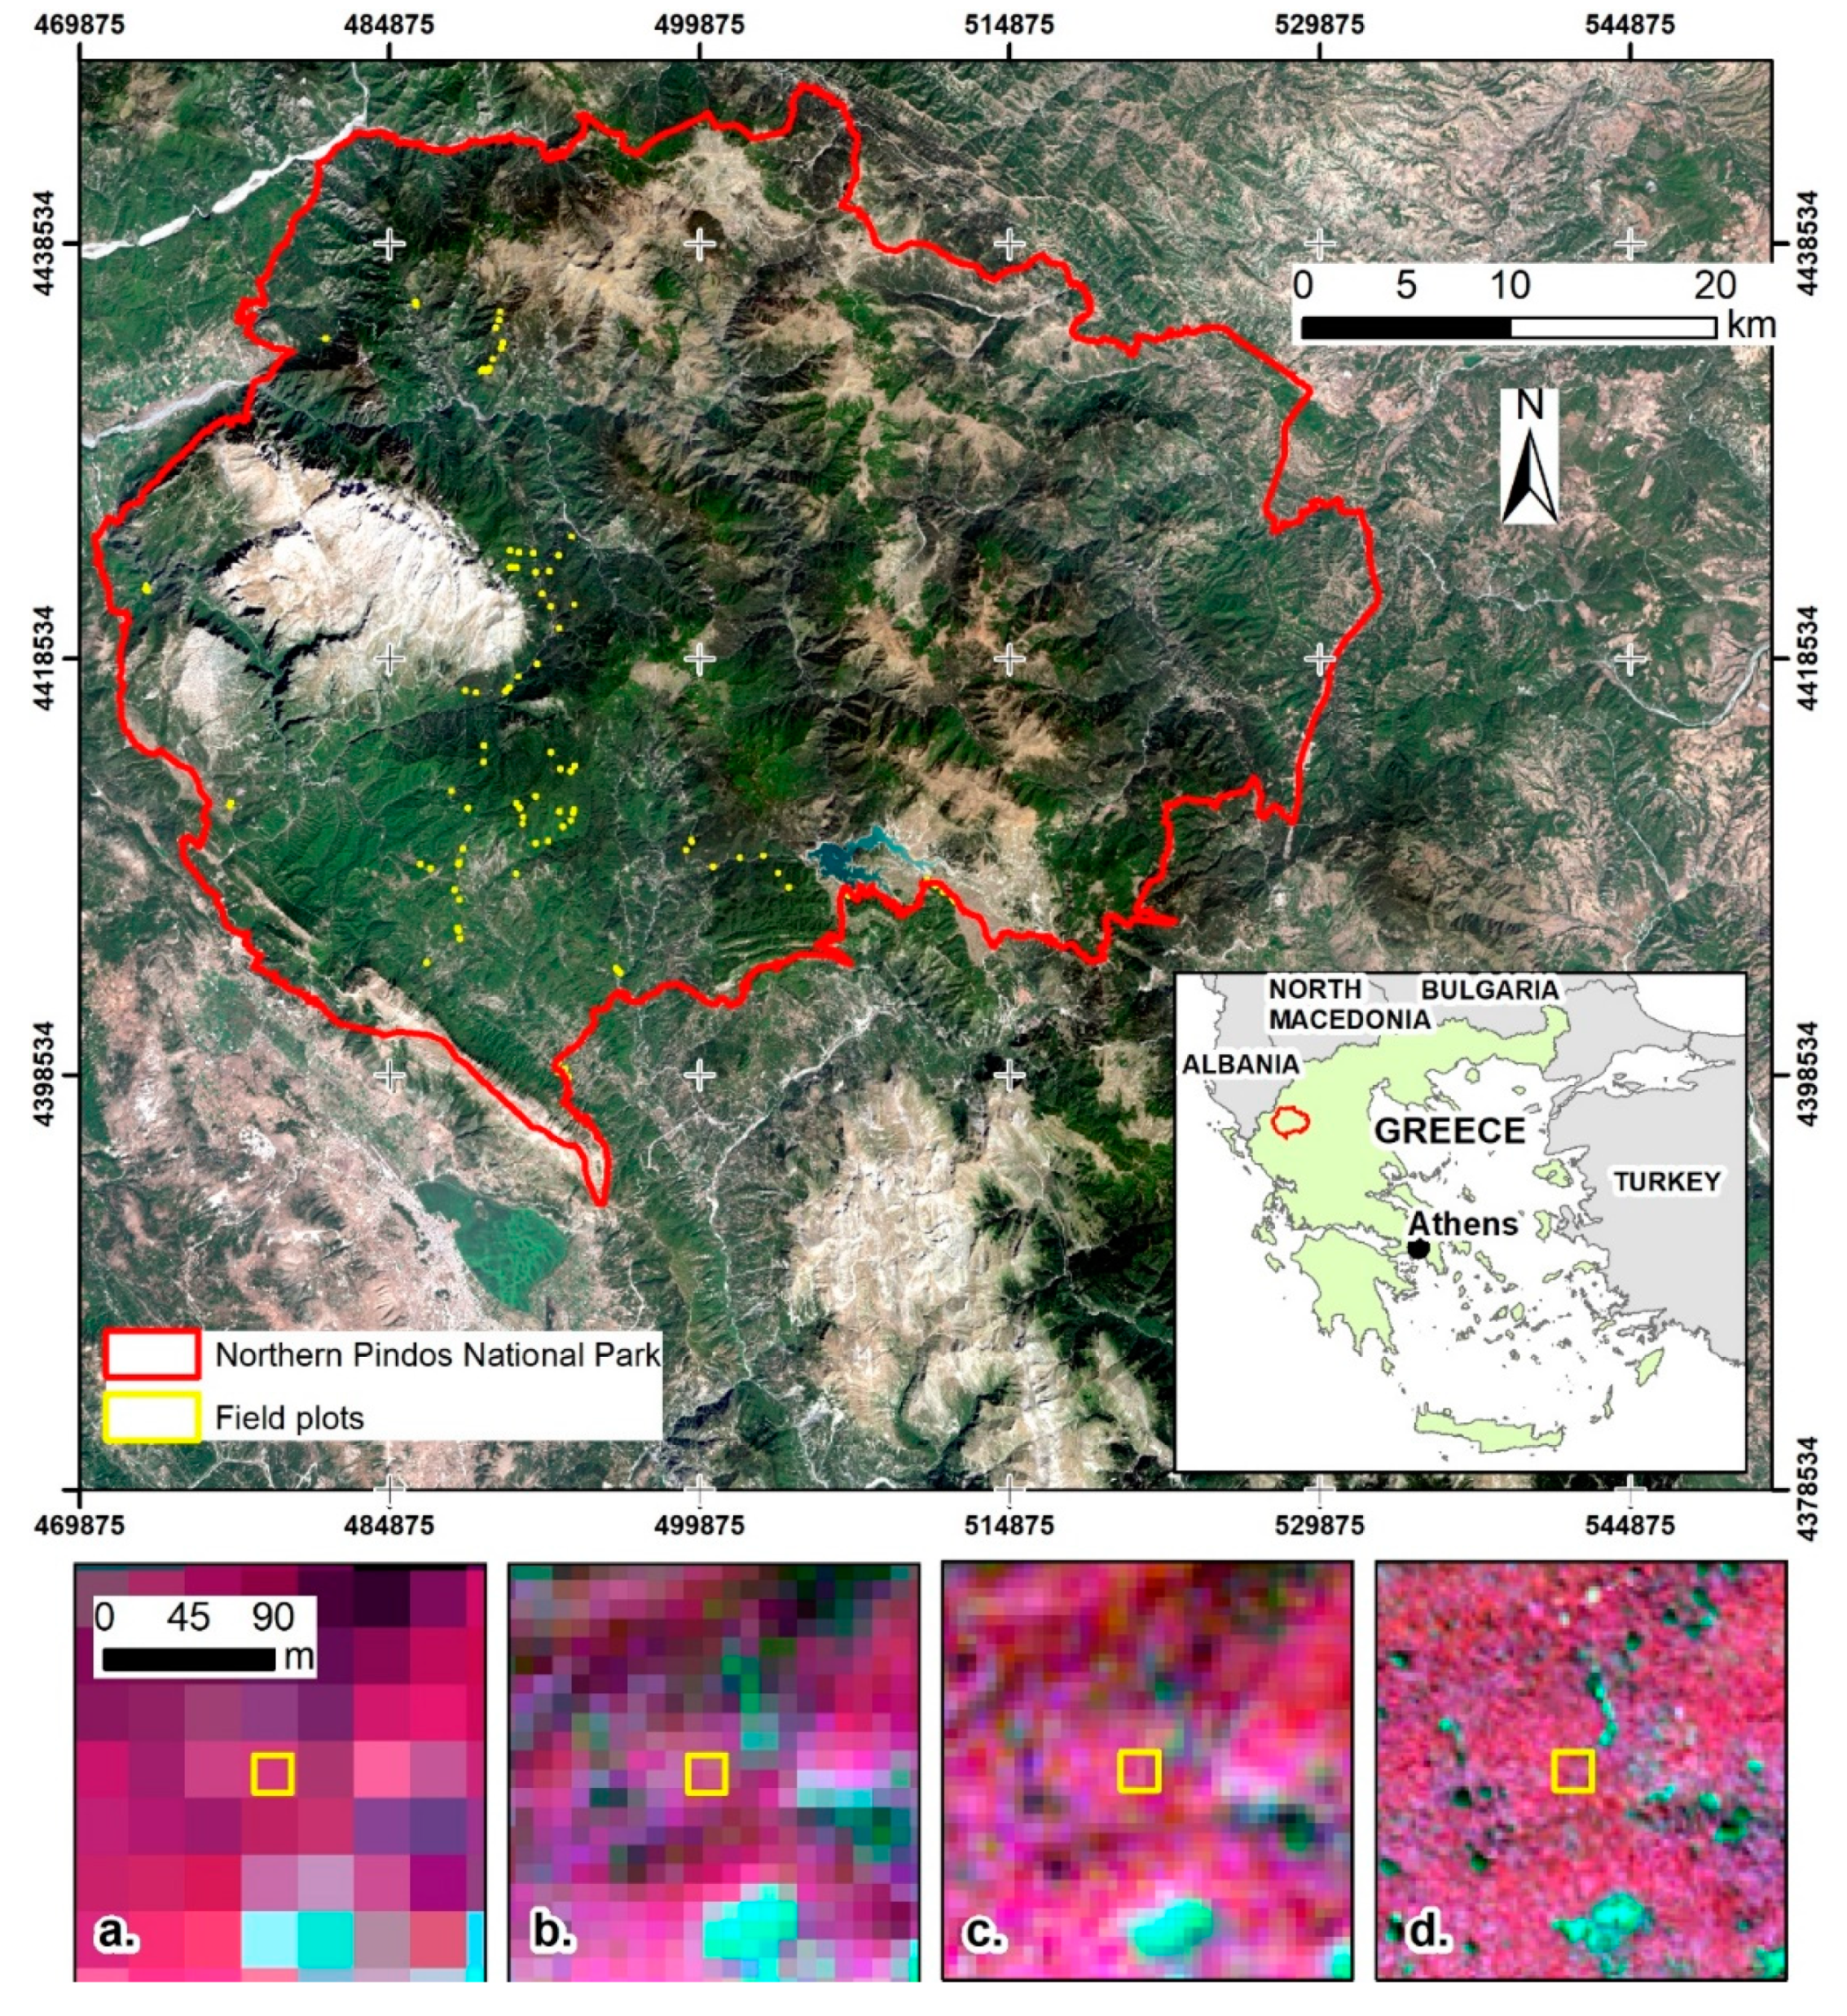
2. Study Area
3. Materials and Methods
3.1. Remote Sensing Data and Preprocessing
3.2. Field Data Collection and Tree Diversity Indices
3.3. Spectral Information Extraction
3.4. Statistical Modelling
4. Results
5. Discussion
6. Conclusions
Author Contributions
Funding
Acknowledgments
Conflicts of Interest
References
- Aerts, R.; Honnay, O. Forest restoration, biodiversity and ecosystem functioning. BMC Ecol. 2011, 11, 29. [Google Scholar] [CrossRef] [PubMed] [Green Version]
- Torresani, M.; Rocchini, D.; Sonnenschein, R.; Zebisch, M.; Marcantonio, M.; Ricotta, C.; Tonon, G. Estimating tree species diversity from space in an alpine conifer forest: The Rao’s Q diversity index meets the spectral variation hypothesis. Ecol. Inform. 2019, 52, 26–34. [Google Scholar] [CrossRef] [Green Version]
- Wang, R.; Gamon, J.A. Remote sensing of terrestrial plant biodiversity. Remote Sens. Environ. 2019, 231, 111218. [Google Scholar] [CrossRef]
- Gamfeldt, L.; Snäll, T.; Bagchi, R.; Jonsson, M.; Gustafsson, L.; Kjellander, P.; Ruiz-Jaen, M.C.; Fröberg, M.; Stendahl, J.; Philipson, C.D.; et al. Higher levels of multiple ecosystem services are found in forests with more tree species. Nat. Commun. 2013, 4, 1340. [Google Scholar] [CrossRef]
- Sugden, A.M. Tree diversity improves forest productivity. Science 2018, 362, 41–43. [Google Scholar]
- Gauquelin, T.; Michon, G.; Joffre, R.; Duponnois, R.; Génin, D.; Fady, B.; Bou Dagher-Kharrat, M.; Derridj, A.; Slimani, S.; Badri, W.; et al. Mediterranean forests, land use and climate change: A social-ecological perspective. Reg. Environ. Chang. 2018, 18, 623–636. [Google Scholar] [CrossRef]
- Médail, F.; Monnet, A.-C.; Pavon, D.; Nikolic, T.; Dimopoulos, P.; Bacchetta, G.; Arroyo, J.; Barina, Z.; Albassatneh, M.C.; Domina, G.; et al. What is a tree in the Mediterranean Basin hotspot? A critical analysis. For. Ecosyst. 2019, 6, 17. [Google Scholar] [CrossRef] [Green Version]
- Food and Agriculture Organization of United Nations (FAO). State of Mediterranean Forests 2013 (SoMF 2013); Besacier, C., Garavaglia, V.D.S., Eds.; FAO: Rome, Italy, 2013; ISBN 9789251075388. [Google Scholar]
- Myers, N.; Mittermeier, R.A.; Fonseca, G.A.B.; Fonseca, G.A.B.; Kent, J. Biodiversity hotspots for conservation priorities. Nature 2000, 403, 853. [Google Scholar] [CrossRef]
- Hernández-Stefanoni, J.L.; Gallardo-Cruz, J.A.; Meave, J.A.; Rocchini, D.; Bello-Pineda, J.; López-Martínez, J.O. Modeling α- and β-diversity in a tropical forest from remotely sensed and spatial data. Int. J. Appl. Earth Obs. Geoinf. 2012, 19, 359–368. [Google Scholar] [CrossRef]
- Rocchini, D.; Hernández-Stefanoni, J.L.; He, K.S. Advancing species diversity estimate by remotely sensed proxies: A conceptual review. Ecol. Inform. 2015, 25, 22–28. [Google Scholar] [CrossRef]
- Lõhmus, A.; Lõhmus, P.; Runnel, K. A simple survey protocol for assessing terrestrial biodiversity in a broad range of ecosystems. PLoS ONE 2018, 13, e0208535. [Google Scholar] [CrossRef] [PubMed]
- Anderson, C.B. Biodiversity monitoring, earth observations and the ecology of scale. Ecol. Lett. 2018, 21, 1572–1585. [Google Scholar] [CrossRef] [PubMed]
- Saatchi, S.; Giorgi, A.P.; Gillespie, T.W.; Rocchini, D.; Foody, G.M. Measuring and modelling biodiversity from space. Prog. Phys. Geogr. 2008, 32, 203–221. [Google Scholar]
- Whittaker, R.H. Evolution and measurement of species diversity. Taxon 1972, 21, 213–251. [Google Scholar] [CrossRef] [Green Version]
- Turner, W.; Spector, S.; Gardiner, N.; Fladeland, M.; Sterling, E.; Steininger, M. Remote sensing for biodiversity science and conservation. Trends Ecol. Evol. 2003, 18, 306–314. [Google Scholar] [CrossRef]
- White, J.C.; Gómez, C.; Wulder, M.A.; Coops, N.C. Characterizing temperate forest structural and spectral diversity with Hyperion EO-1 data. Remote Sens. Environ. 2010, 114, 1576–1589. [Google Scholar] [CrossRef]
- Palmer, M.W.; Earls, P.G.; Hoagland, B.W.; White, P.S.; Wohlgemuth, T. Quantitative tools for perfecting species lists. Environmetrics 2002, 13, 121–137. [Google Scholar] [CrossRef]
- Rocchini, D.; Boyd, D.S.; Féret, J.-B.; Foody, G.M.; He, K.S.; Lausch, A.; Nagendra, H.; Wegmann, M.; Pettorelli, N. Satellite remote sensing to monitor species diversity: Potential and pitfalls. Remote Sens. Ecol. Conserv. 2016, 2, 25–36. [Google Scholar] [CrossRef]
- Foody, G.M.; Cutler, M.E.J. Tree biodiversity in protected and logged Bornean tropical rain forests and its measurement by satellite remote sensing. J. Biogeogr. 2003, 30, 1053–1066. [Google Scholar] [CrossRef]
- Mohammadi, J.; Shataee, S. Possibility investigation of tree diversity mapping using Landsat ETM+ data in the Hyrcanian forests of Iran. Remote Sens. Environ. 2010, 114, 1504–1512. [Google Scholar] [CrossRef]
- Madonsela, S.; Cho, M.A.; Ramoelo, A.; Mutanga, O. Remote sensing of species diversity using Landsat 8 spectral variables. ISPRS J. Photogramm. Remote Sens. 2017, 133, 116–127. [Google Scholar] [CrossRef] [Green Version]
- Carlson, K.M.; Asner, G.P.; Hughes, R.F.; Ostertag, R.; Martin, R.E. Hyperspectral Remote Sensing of Canopy Biodiversity in Hawaiian Lowland Rainforests. Ecosystems 2007, 10, 536–549. [Google Scholar] [CrossRef]
- Kalacska, M.; Sanchez-Azofeifa, G.A.; Rivard, B.; Caelli, T.; White, H.P.; Calvo-Alvarado, J.C. Ecological fingerprinting of ecosystem succession: Estimating secondary tropical dry forest structure and diversity using imaging spectroscopy. Remote Sens. Environ. 2007, 108, 82–96. [Google Scholar] [CrossRef]
- Getzin, S.; Wiegand, K.; Schöning, I. Assessing biodiversity in forests using very high-resolution images and unmanned aerial vehicles. Methods Ecol. Evol. 2012, 3, 397–404. [Google Scholar] [CrossRef]
- Bouvier, M.; Durrieu, S.; Gosselin, F.; Herpigny, B. Use of airborne lidar data to improve plant species richness and diversity monitoring in lowland and mountain forests. PLoS ONE 2017, 12, e0184524. [Google Scholar] [CrossRef] [PubMed] [Green Version]
- Nagendra, H.; Rocchini, D.; Ghate, R.; Sharma, B.; Pareeth, S. Assessing plant diversity in a dry tropical forest: Comparing the utility of landsat and ikonos satellite images. Remote Sens. 2010, 2, 478–496. [Google Scholar] [CrossRef] [Green Version]
- Khare, S.; Latifi, H.; Rossi, S. Forest beta-diversity analysis by remote sensing: How scale and sensors affect the Rao’s Q index. Ecol. Indic. 2019, 106, 105520. [Google Scholar] [CrossRef]
- Ozdemir, I.; Mert, A.; Ozkan, U.Y.; Aksan, S.; Unal, Y. Predicting bird species richness and micro-habitat diversity using satellite data. For. Ecol. Manage. 2018, 424, 483–493. [Google Scholar] [CrossRef]
- Chrysafis, I.; Mallinis, G.; Korakis, G.; Dragozi, E. Forest diversity estimation using Sentinel-2 and RapidEye imagery: A case study of the Northern Pindos National Park. In Proceedings of the Seventh International Conference on Remote Sensing and Geoinformation of the Environment (RSCy2019), Cyprus, 18–21 March 2019; Papadavid, G., Themistocleous, K., Michaelides, S., Ambrosia, V., Hadjimitsis, D.G., Eds.; SPIE: Washington, DC, USA, 2019; p. 50. [Google Scholar]
- Wulder, M.A.; Masek, J.G.; Cohen, W.B.; Loveland, T.R.; Woodcock, C.E. Opening the archive: How free data has enabled the science and monitoring promise of Landsat. Remote Sens. Environ. 2012, 122, 2–10. [Google Scholar] [CrossRef]
- Breiman, L. Random forests. Mach. Learn. 2001, 45, 5–32. [Google Scholar] [CrossRef] [Green Version]
- Ehrlinger, J.; Rajeswaran, J.; Blackstone, E.H. ggRandomForests: Exploring random forest survival. R Vignette 2014. [Google Scholar]
- Genuer, R.; Poggi, J.; Tuleau-Malot, C. Variable selection using random forests. Pattern Recognit. Lett. 2010, 31, 2225–2236. [Google Scholar] [CrossRef] [Green Version]
- Evans, J.S.; Murphy, M.A.; Holden, Z.A.; Cushman, S.A. Modeling Species Distribution and Change Using Random Forest BT—Predictive Species and Habitat Modeling in Landscape Ecology: Concepts and Applications; Drew, C.A., Wiersma, Y.F., Huettmann, F., Eds.; Springer: New York, NY, USA, 2011; pp. 139–159. ISBN 978-1-4419-7390-0. [Google Scholar]
- Smith, P.F.; Ganesh, S.; Liu, P. A comparison of random forest regression and multiple linear regression for prediction in neuroscience. J. Neurosci. Methods 2013, 220, 85–91. [Google Scholar] [CrossRef] [PubMed]
- Meng, J.; Li, S.; Wang, W.; Liu, Q.; Xie, S.; Ma, W. Estimation of forest structural diversity using the spectral and textural information derived from SPOT-5 satellite images. Remote Sens. 2016, 8, 125. [Google Scholar] [CrossRef] [Green Version]
- ENVI. Atmospheric Correction Module: QUAC and FLAASH User’s Guide. In Atmospheric Correction Module; Version 4.7; ITT Visual Information Solutions: White Plains, NY, USA, 2009; p. 44. [Google Scholar]
- Gillison, A.N.; Brewer, K.R.W. The use of gradient directed transects or gradsects in natural resource surveys. J. Environ. Manage. 1985, 20, 103–127. [Google Scholar]
- Daly, J.A.; Baetens, M.J.; De Baets, B. Ecological Diversity: Measuring the Unmeasurable. Mathematics 2018, 6, 119. [Google Scholar] [CrossRef] [Green Version]
- Shannon, C.E. A mathematical theory of communication. Bell Syst. Tech. J. 1948, 27, 379–423. [Google Scholar] [CrossRef] [Green Version]
- Ifo, S.A.; Moutsambote, J.-M.; Koubouana, F.; Yoka, J.; Ndzai, S.F.; Bouetou-Kadilamio, L.N.O.; Mampouya, H.; Jourdain, C.; Bocko, Y.; Mantota, A.B.; et al. Tree Species Diversity, Richness, and Similarity in Intact and Degraded Forest in the Tropical Rainforest of the Congo Basin: Case of the Forest of Likouala in the Republic of Congo. Int. J. For. Res. 2016, 2016, 7593681. [Google Scholar] [CrossRef] [Green Version]
- Simpson, E.H. Measurement of Diversity. Nature 1949, 163, 688. [Google Scholar] [CrossRef]
- Morris, E.K.; Caruso, T.; Fischer, M.; Hancock, C.; Obermaier, E.; Prati, D.; Maier, T.S.; Meiners, T.; Caroline, M.; Wubet, T.; et al. Choosing and using diversity indices: Insights for ecological applications from the German Biodiversity Exploratories. Ecol. Evol. 2014, 3514–3524. [Google Scholar] [CrossRef] [Green Version]
- Wood, E.M.; Pidgeon, A.M.; Radeloff, V.C.; Keuler, N.S. Image texture as a remotely sensed measure of vegetation structure. Remote Sens. Environ. 2012, 121, 516–526. [Google Scholar] [CrossRef]
- Liaw, A.; Wiener, M. Breiman and Cutler’s Random Forests for Classification and Regression. Package RandomForest. 2015. Available online: http://CRAN.R-project.org/package=randomForest (accessed on 19 March 2020). R package version 4.6-12.
- Desbordes, P.; Ruan, S.; Modzelewski, R.; Pineau, P.; Vauclin, S.; Gouel, P.; Michel, P.; Di Fiore, F.; Vera, P.; Gardin, I. Predictive value of initial FDG-PET features for treatment response and survival in esophageal cancer patients treated with chemo-radiation therapy using a random forest classifier. PLoS ONE 2017, 12, e0173208. [Google Scholar] [CrossRef] [PubMed] [Green Version]
- Chrysafis, I.; Mallinis, G.; Gitas, I.; Tsakiri-Strati, M. Estimating Mediterranean forest parameters using multi seasonal Landsat 8 OLI imagery and an ensemble learning method. Remote Sens. Environ. 2017, 199, 154–166. [Google Scholar] [CrossRef]
- Speiser, J.L.; Miller, M.E.; Tooze, J.; Ip, E. A comparison of random forest variable selection methods for classification prediction modeling. Expert Syst. Appl. 2019, 134, 93–101. [Google Scholar] [CrossRef]
- Yuchi, W.; Gombojav, E.; Boldbaatar, B.; Galsuren, J.; Enkhmaa, S.; Beejin, B.; Naidan, G.; Ochir, C.; Legtseg, B.; Byambaa, T.; et al. Evaluation of random forest regression and multiple linear regression for predicting indoor fine particulate matter concentrations in a highly polluted city. Environ. Pollut. 2019, 245, 746–753. [Google Scholar] [CrossRef] [PubMed]
- Ismail, R.; Mutanga, O. A comparison of regression tree ensembles: Predicting Sirex noctilio induced water stress in Pinus patula forests of KwaZulu-Natal, South Africa. Int. J. Appl. Earth Obs. Geoinf. 2010, 12, 45–51. [Google Scholar] [CrossRef]
- Dube, T.; Mutanga, O.; Elhadi, A.; Ismail, R. Intra-and-inter species biomass prediction in a plantation forest: Testing the utility of high spatial resolution spaceborne multispectral Rapideye sensor and advanced machine learning algorithms. Sensors 2014, 14, 15348–15370. [Google Scholar] [CrossRef] [Green Version]
- Advances in Neural Networks—ISNN 2006; Wang, J.; Yi, Z.; Zurada, J.M.; Lu, B.-L.; Yin, H. (Eds.) Lecture Notes in Computer Science; Springer: Berlin/Heidelberg, Germany, 2006; Volume 3972, ISBN 978-3-540-34437-7. [Google Scholar]
- Turner, W.; Rondinini, C.; Pettorelli, N.; Mora, B.; Leidner, A.K.; Szantoi, Z.; Buchanan, G.; Dech, S.; Dwyer, J.; Herold, M.; et al. Free and open-access satellite data are key to biodiversity conservation. Biol. Conserv. 2015, 182, 173–176. [Google Scholar] [CrossRef] [Green Version]
- Khare, S.; Latifi, H.; Ghosh, S.K. Multi-scale assessment of invasive plant species diversity using Pléiades 1A, RapidEye and Landsat-8 data. Geocarto Int. 2018, 33, 681–698. [Google Scholar] [CrossRef]
- Strahler, A.H.; Woodcock, C.E.; Smith, J.A. On the nature of models in remote sensing. Remote Sens. Environ. 1986, 20, 121–139. [Google Scholar] [CrossRef]
- Wang, R.; Gamon, J.A.; Cavender-Bares, J.; Townsend, P.A.; Zygielbaum, A.I. The spatial sensitivity of the spectral diversity-biodiversity relationship: An experimental test in a prairie grassland. Ecol. Appl. 2018, 28, 541–556. [Google Scholar] [CrossRef] [PubMed] [Green Version]
- Gholizadeh, H.; Gamon, J.A.; Townsend, P.A.; Zygielbaum, A.I.; Helzer, C.J.; Hmimina, G.Y.; Yu, R.; Moore, R.M.; Schweiger, A.K.; Cavender-Bares, J. Detecting prairie biodiversity with airborne remote sensing. Remote Sens. Environ. 2019, 221, 38–49. [Google Scholar] [CrossRef]
- Marceau, D.J.; Gratton, D.J.; Fournier, R.A.; Fortin, J.P. Remote sensing and the measurement of geographical entities in a forested environment. 2. The optimal spatial resolution. Remote Sens. Environ. 1994, 49, 105–117. [Google Scholar] [CrossRef]
- Rocchini, D.; Ricotta, C.; Chiarucci, A. Using satellite imagery to assess plant species richness: The role of multispectral systems. Appl. Veg. Sci. 2007, 10, 325–331. [Google Scholar] [CrossRef]
- Wang, R.; Gamon, J.A.; Schweiger, A.K.; Cavender-Bares, J.; Townsend, P.A.; Zygielbaum, A.I.; Kothari, S. Influence of species richness, evenness, and composition on optical diversity: A simulation study. Remote Sens. Environ. 2018, 211, 218–228. [Google Scholar] [CrossRef]
- Hernández-Stefanoni, J.L.; Dupuy, J.M.; Castillo-Santiago, M.A. Assessing species density and abundance of tropical trees from remotely sensed data and geostatistics. Appl. Veg. Sci. 2009, 12, 398–414. [Google Scholar] [CrossRef]
- De La Cueva, A. V Structural attributes of three forest types in central Spain and Landsat ETM plus information evaluated with redundancy analysis. Int. J. Remote Sens. 2008, 29, 5657–5676. [Google Scholar] [CrossRef]
- Mallinis, G.; Koutsias, N.; Makras, A.; Karteris, M. Forest parameters estimation in a European Mediterranean landscape using remotely sensed data. For. Sci. 2004, 50, 450–460. [Google Scholar]
- Ardö, J. Volume quantification of coniferous forest compartments using spectral radiance recorded by Landsat Thematic Mapper. Int. J. Remote Sens. 1992, 13, 1779–1786. [Google Scholar] [CrossRef]
- Hesketh, M.; Sánchez-Azofeifa, G.A. The effect of seasonal spectral variation on species classification in the Panamanian tropical forest. Remote Sens. Environ. 2012, 118, 73–82. [Google Scholar] [CrossRef]
- Ollinger, S.V. Sources of variability in canopy reflectance and the convergent properties of plants. New Phytol. 2011, 189, 375–394. [Google Scholar] [CrossRef] [PubMed]
- Eckert, S. Improved forest biomass and carbon estimations using texture measures from worldView-2 satellite data. Remote Sens. 2012, 4, 810–829. [Google Scholar] [CrossRef] [Green Version]
- Lu, D.; Weng, Q. A survey of image classification methods and techniques for improving classification performance. Int. J. Remote Sens. 2007, 28, 823–870. [Google Scholar] [CrossRef]
- Rautiainen, M.; Lukeš, P. Spectral contribution of understory to forest reflectance in a boreal site: An analysis of EO-1 Hyperion data. Remote Sens. Environ. 2015, 171, 98–104. [Google Scholar] [CrossRef]
- Karlson, M.; Ostwald, M.; Reese, H.; Sanou, J.; Tankoano, B.; Mattsson, E. Mapping Tree Canopy Cover and Aboveground Biomass in Sudano-Sahelian Woodlands Using Landsat 8 and Random Forest. Remote Sens. 2015, 7, 10017–10041. [Google Scholar] [CrossRef] [Green Version]


| Landsat 8 OLI | Sentinel-2 MSI | RapidEye | WorldView-2 | |||||
|---|---|---|---|---|---|---|---|---|
| Spectral Band | Central Wavelength (μm)/Spatial (m) Resolution | Central Wavelength (μm)/Spatial (m) Resolution | Central Wavelength (μm)/Spatial (m) Resolution | Central Wavelength (μm)/Spatial (m) Resolution | ||||
| Coastal (C) | B1 | 0.443/30 | B1 | 0.443/60 | B1 | 0.427/2 | ||
| Blue (B) | B2 | 0.482/30 | B2 | 0.490/10 | B1 | 0.475/5 | B2 | 0.478/2 |
| Green (G) | B3 | 0.561/30 | B3 | 0.560/10 | B2 | 0.555/5 | B3 | 0.546/2 |
| Yellow (Y) | B4 | 0.608/2 | ||||||
| Red (R) | B4 | 0.655/30 | B4 | 0.665/10 | B3 | 0.657/5 | B5 | 0.659/2 |
| Red edge 1 (RE1) | B5 | 0.705/20 | B4 | 0.715/5 | B6 | 0.724/2 | ||
| Red edge 2 (RE2) | B6 | 0.740/20 | ||||||
| NIR narrow1 (NIRn1) | B7 | 0.783/20 | ||||||
| Near infrared (NIR) | B5 | 0.865/30 | B8 | 0.842/10 | B5 | 0.805/5 | B7 | 0.831/2 |
| NIR narrow 2 (NIRn2) | B8a | 0.865/20 | ||||||
| Near infrared 2 (NIR 2) | B8 | 0.908/2 | ||||||
| Shortwave infrared (SWIR1) | B6 | 1.609/30 | B11 | 1.610/20 | ||||
| Shortwave infrared (SWIR2) | B7 | 2.201/30 | B12 | 2.190/20 | ||||
| Species Diversity Index | Formula | Reference |
|---|---|---|
| Shannon Index (H’) | [41] | |
| Simpson’s diversity (D1) | [44] | |
| where pi is the proportion of the ith species in the sampling plot | ||
| Sensor | Shannon Index (H’) | Simpson’s diversity (D1) | ||
|---|---|---|---|---|
| Variables | Accuracy | Variables | Accuracy | |
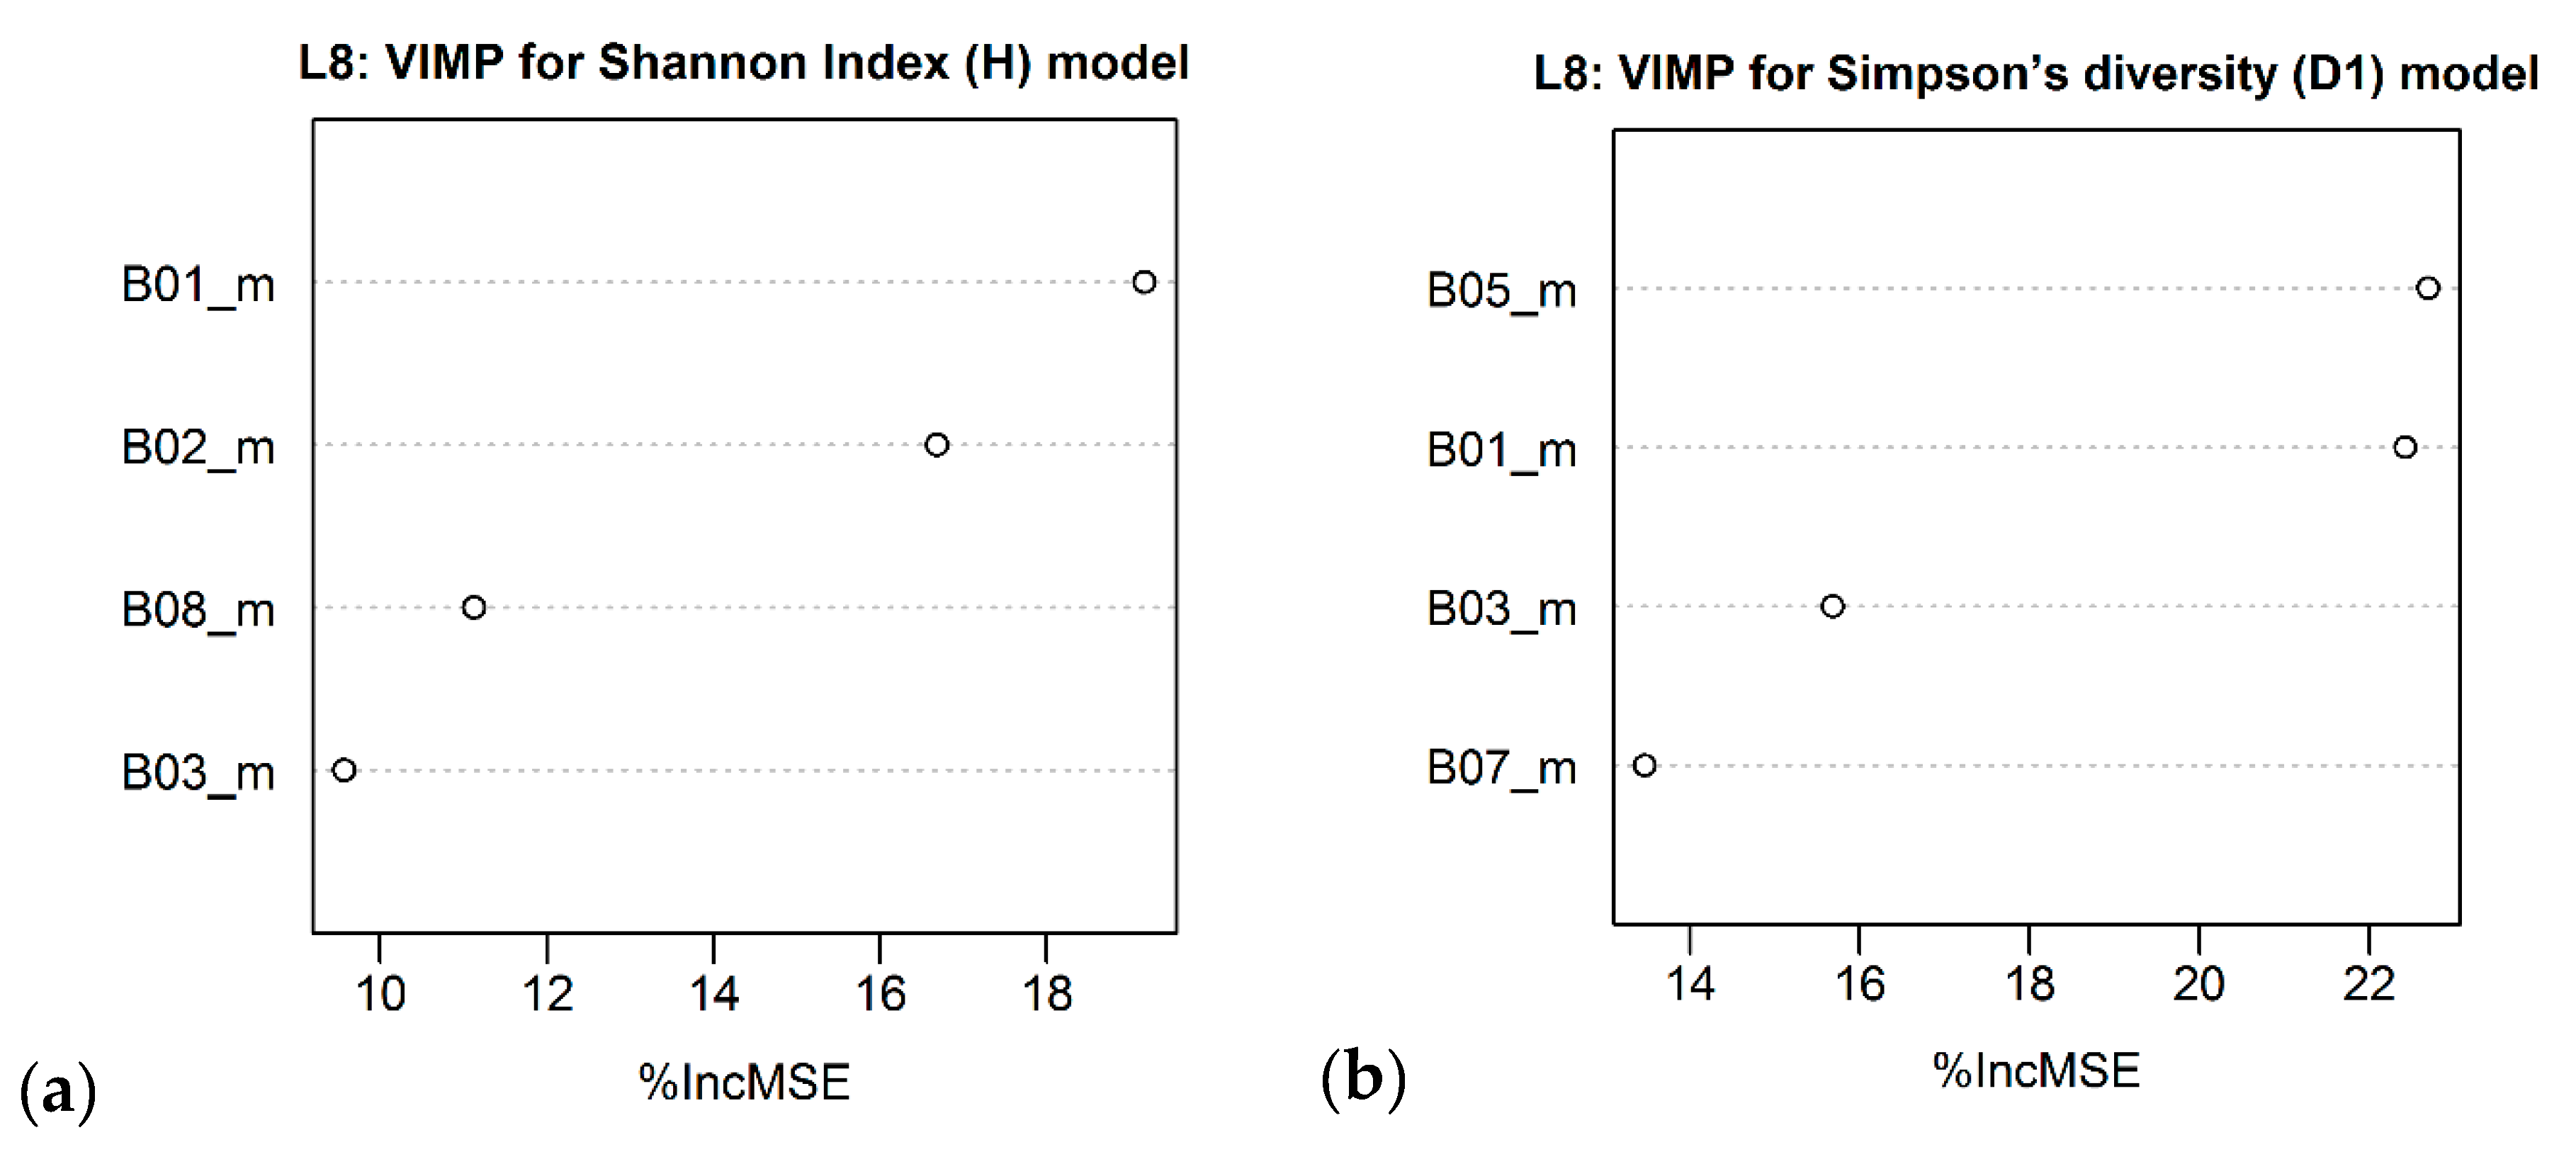
| Landsat – 8 OLI | B05_m B01_m B03_m B07_m | R2 = 0.27 (0.25) RMSE = 0.34 RSE = 0.73 | B05_m B01_m B03_m B07_m | R2 = 0.24 (0.22) RMSE = 0.20 RSE = 0.76 |
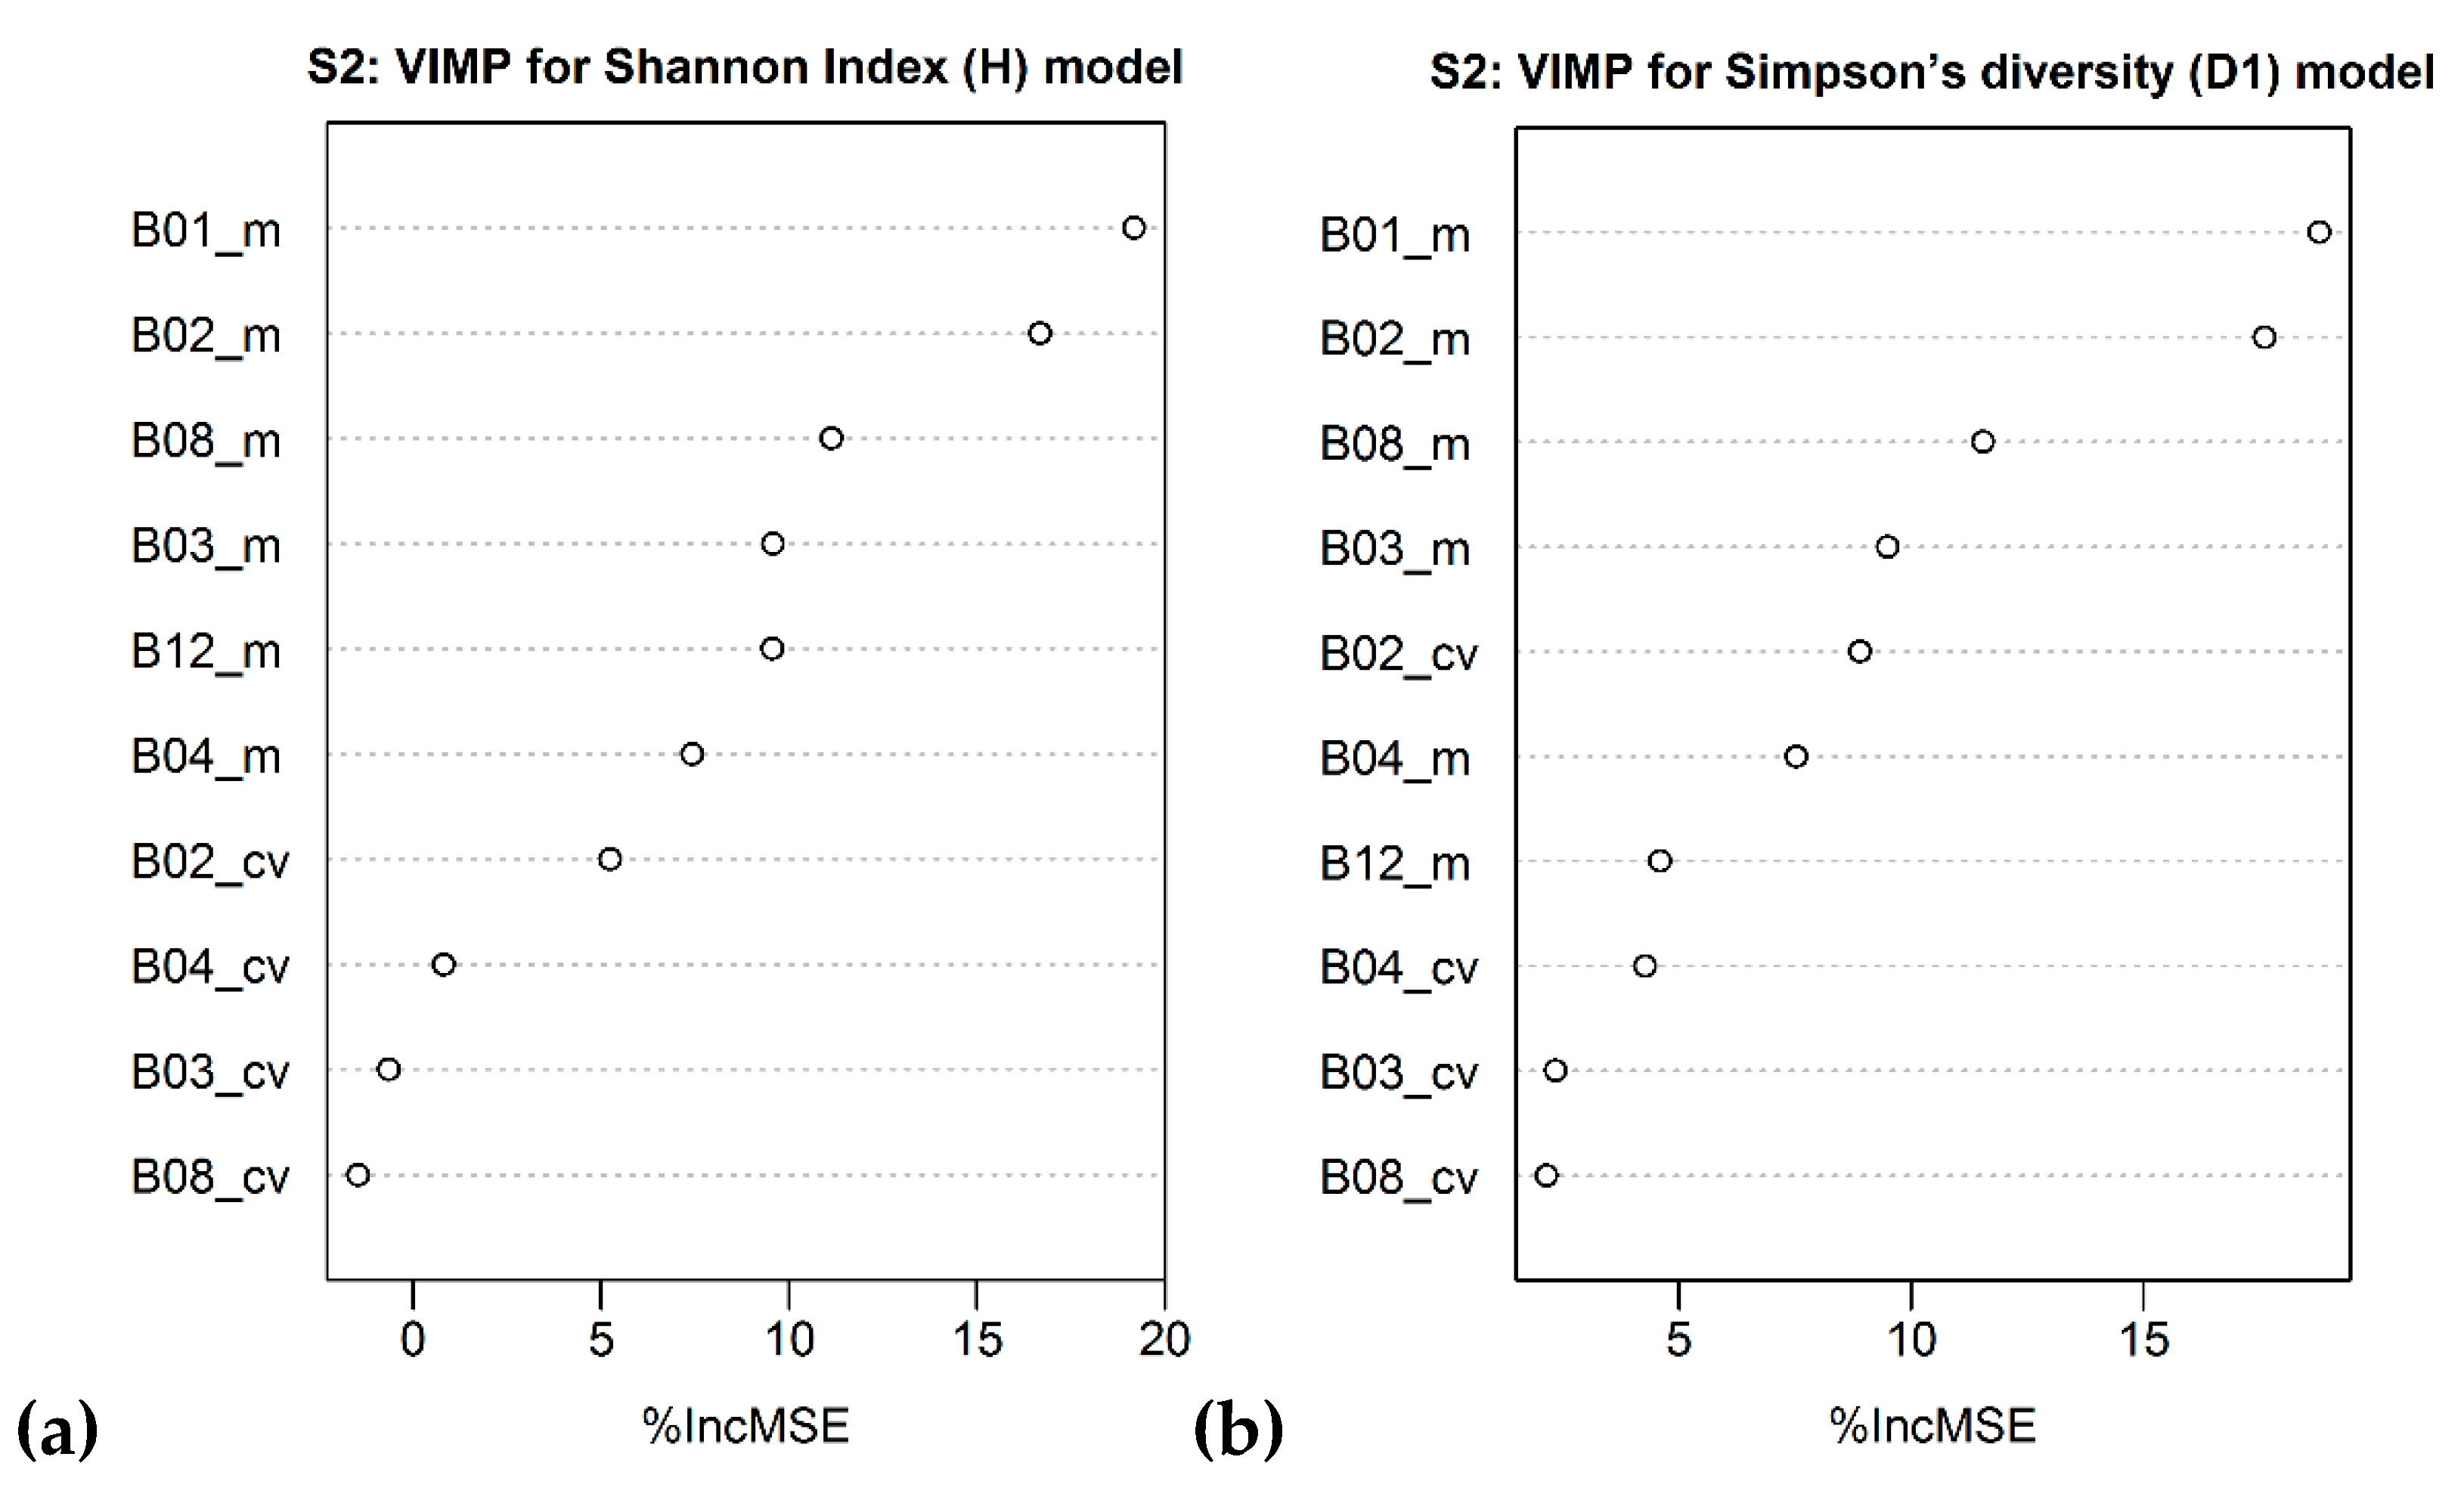
| Sentinel-2 MSI | B01_m B02_m B08_m B03_m B12_m | R2 = 0.29 (0.27) RMSE = 0.33 RSE = 0.71 | B01_m B02_m B08_m B03_m B02_cv B04_m | R2 = 0.31 (0.28) RMSE = 0.20 RSE = 0.69 |
| RapidEye | B01_m B03_m B05_m | R2 = 0.21 (0.18) RMSE = 0.35 RSE = 0.79 | B01_m B03_m B05_m | R2 = 0.18 (0.14) RMSE = 0.21 RSE = 0.82 |
| WorldView 2 | B02_m B08_m | R2 = 0.44 (0.43) RMSE = 0.29 RSE = 0.56 | B02_m B08_m | R2 = 0.37 (0.38) RMSE = 0.19 RSE = 0.63 |
© 2020 by the authors. Licensee MDPI, Basel, Switzerland. This article is an open access article distributed under the terms and conditions of the Creative Commons Attribution (CC BY) license (http://creativecommons.org/licenses/by/4.0/).
Share and Cite
Mallinis, G.; Chrysafis, I.; Korakis, G.; Pana, E.; Kyriazopoulos, A.P. A Random Forest Modelling Procedure for a Multi-Sensor Assessment of Tree Species Diversity. Remote Sens. 2020, 12, 1210. https://0-doi-org.brum.beds.ac.uk/10.3390/rs12071210
Mallinis G, Chrysafis I, Korakis G, Pana E, Kyriazopoulos AP. A Random Forest Modelling Procedure for a Multi-Sensor Assessment of Tree Species Diversity. Remote Sensing. 2020; 12(7):1210. https://0-doi-org.brum.beds.ac.uk/10.3390/rs12071210
Chicago/Turabian StyleMallinis, Giorgos, Irene Chrysafis, Georgios Korakis, Eleanna Pana, and Apostolos P. Kyriazopoulos. 2020. "A Random Forest Modelling Procedure for a Multi-Sensor Assessment of Tree Species Diversity" Remote Sensing 12, no. 7: 1210. https://0-doi-org.brum.beds.ac.uk/10.3390/rs12071210