Global Trends in Evapotranspiration Dominated by Increases across Large Cropland Regions


1
Department of Hydrology and Atmospheric Sciences, University of Arizona, Tucson, AZ 210011, USA
2
School of Natural Resources and the Environment, University of Arizona, Tucson, AZ 210011, USA
3
Jet Propulsion Laboratory, California Institute of Technology, Pasadena, CA 91109, USA
*
Author to whom correspondence should be addressed.
Remote Sens. 2020, 12(7), 1221; https://0-doi-org.brum.beds.ac.uk/10.3390/rs12071221
Submission received: 13 March 2020
/
Revised: 7 April 2020
/
Accepted: 9 April 2020
/
Published: 10 April 2020
(This article belongs to the Special Issue Remote Sensing of Evapotranspiration (ET) II)
Abstract
:Irrigated croplands require large annual water inputs and are critical to global food production. Actual evapotranspiration (AET) is a main index of water use in croplands, and several remote-sensing products have been developed to quantify AET at the global scale. In this study, we estimate global trends in actual AET, potential ET (PET), and precipitation rate (PP) utilizing the MODIS Evapotranspiration product (2001–2018) within the Google Earth Engine cloud-computing environment. We then introduce a new index based on a combination of AET, PET, and PP estimates—the evapotranspiration warning index (ETWI)—which we use to evaluate the sustainability of observed AET trends. We show that while AET has not considerably changed across global natural lands, it has significantly increased across global croplands (+14% ± 5%). The average ETWI for global croplands is −0.40 ± 0.25, which is largely driven by an extreme trend in AET, exceeding both PET and PP trends. Furthermore, the trends in water and energy limited areas demonstrate, on a global scale, while AET and PET do not have significant trends in both water and energy limited areas, the increasing trend of PP in energy-limited areas is more than water-limited areas. Averaging cropland ETWI trends at the country level further revealed nonsustainable trends in cropland water consumptions in Thailand, Brazil, and China. These regions were also found to experiencing some of the largest increases in net primary production (NPP) and solar-induced fluorescence (SIF), suggesting that recent increases in food production may be dependent on unsustainable water inputs. Globally, irrigated maize was found to be associated with nonsustainable AET trends relative to other crop types. We present an online open access application designed to enable near real-time monitoring and improve the understanding of global water consumption and availability.

1. Introduction
Along with the increasing global temperature, evidence from the changes of precipitation [1,2], runoff [3,4], and soil moisture [5,6] suggests that the hydrological cycle has been intensified in many regions of the world during the past decades. As the only connecting component between water balance and energy balance and due to the complex interactions between soil, water, vegetation, and atmosphere, actual evapotranspiration is perhaps the most complicated component of the hydrological cycle [7,8]. Global land ET returns about 60% of the annual land precipitation to the atmosphere [9].
Global warming, due to a combination of natural or anthropogenic changes, has raised questions about the behavior of AET as the climate warms [10]. At a global scale, Jung, et al. [11] concluded that global annual AET increased on average by 7.1 millimeters per year per in the decade from 1982 to 1997, and then stabilized. Zhang, et al. [12] also used a well-validated diagnostic model to estimate the daily AET during 1981–2012. They found that, during this period, ET over land has increased significantly, which has been mainly caused by increases in transpiration from vegetation and vaporization of intercepted rainfall from vegetation. Furthermore, Anabalón and Sharma [13] investigated PET and AET trends of global model datasets over two time periods: from 2003 to 2012 (short term) and from 1980 to 2012 (multidecadal) and found positive significant PET trends but nonsignificant changes over the more recent short-term period.
AET is important for irrigation scheduling and developing water use efficiency in agricultural areas due to the significant relationship between soil water depletion and the evapotranspiration rate [14,15,16]. Therefore, investigating AET in croplands is crucial both at local and global scales. Feng, et al. [17] evaluated ET in 34 eddy covariance (EC) sites over the world. They found that the interannual ET slightly increased during 1982–2009 across the global cropland ecosystem [17]. Although acceleration or intensification of the hydrological cycle with global warming is a long-standing paradigm in climate research, a comprehensive focus on the ET trend in global croplands is still lacking.
There are several drought indices based on the ET concept, which has been used for long-term ET monitoring [18,19]. Palmer [20] used a two-layer bucket model to explore the monthly water supply and demand by accounting for precipitation, AET, runoff, and antecedent soil water status. Crop-specific drought index (CSDI), using temperature, precipitation, and ET, provides daily estimates of soil water availability for different zones and soil layers [21]. Evapotranspiration deficit index (ETDI) using soil moisture and ET considers the water stress ratio in its calculation, and provides weekly values which reflect short-term dry conditions [22]. Yao, et al. [23] used the deviation of the AET to PET ratio from unity to define the evaporative drought index (EDI). Then, Mu, et al. [24] used the ratio of AET to PET in a robust statistical approach as an indicator of terrestrial water availability and associated wetness or drought in their drought severity index (DSI). Anderson, et al. [25] defined the evaporative stress index (ESI) as an indicator of agricultural drought that describes anomalies in the AET/PET ratio, retrieved using remotely sensed inputs of land surface temperature (LST) and leaf area index (LAI). While these indices have significant merits in detecting drought in different ways, they only provide little information about changes in AET, especially in croplands, because they are mainly designed to detect different types of droughts by combing some variables. They do not provide robust information to explore the sustainability of AET trends in a specific region, which is crucial for proper water resources management. This study tries to focus on AET changes on croplands by introducing a new index titled the “evapotranspiration warning index (ETWI)”.
The aim of this study is to investigate global ET trends in croplands and their relationships with other variables. In this study, firstly, spatial and temporal trends of AET, PET, and PP in global lands are investigated. Next, the trends are explored in natural lands and croplands specifically to determine the difference in trends between them. Then, trends in water and energy-limited areas are evaluated to explore the sensitivity of trends to water and energy-limited areas. Next, the world countries are classified based on their trends in croplands to distinguish sustainable and nonsustainable countries in AET trends by introducing the ETWI. Then, the trends in global major crops are investigated separately for irrigated and rainfed crops to determine which major crop is nonsustainable the most in terms of the global AET trend. Additionally, to explore the relationship between sustainability and crop productivity, solar-induced fluorescence (SIF) is compared with the ETWI. Finally, using the Google Earth Engine (GEE), an interactive user-friendly online app is developed for monitoring of the regional trends in AET, PET, PP, and GPP over the global land.
2. Materials and Methods
2.1. Google Earth Engine
Due to the global scale of this study, massive data analysis (i.e., about 4TB of input data and 10TB of intermediate results) is needed. Here, we used the GEE to minimize data downloading and to perform calculations using cloud computing. GEE is a cloudcomputing platform that is designed to store and process big datasets (even at a petabyte-scale) for analysis and further decision-making [26].
The publicly accessible and user-friendly interface provides a convenient environment for interactive data and algorithm development. Additionally, users can import their own data, while using Google’s cloud collections to undertake all the processing. The end result is that this now allows scientists to mine this huge warehouse of data for many kinds of research in Earth science like never before [27]. Due to cloud-processing, users do not need large processing powers of the latest computers or the latest software, meaning that resource-poor researchers in the poorest nations of the world have the same ability to undertake analysis as those in the most advanced nations [26,27].
2.2. Methodology
Considering the strong seasonal component of 8-day AET and PET and monthly PP products, first, all inputs converted to the annual scale from the year 2001 to 2018. By programming in GEE, we were able to do all analyses in the maximum resolution of each input, which is an advantage over previous studies [13]. The trend analysis for each pixel was done for AET, PET, and PP in 500 m, 500 m, and 4 km, respectively, which are the best resolution of the products. For applying trend analysis, the first-order linear regression method selected which is the most unbiased method to the data. It should be mentioned that some barren lands like the Sahara in North Africa and deserts of Asia are excluded in this study because of the MODIS ET product coverage. Additionally, cropland grids in 500-m resolution were obtained by frequency analysis over annual croplands data (i.e., only grids identified as cropland for at least 4 years between 2001 and 2018 were considered as cropland). Since the agricultural lands are often small is size and sparse, especially in arid and semi-arid lands, we performed our analysis at the highest possible resolution enabled by the available cropland mask and the computational strength offered by GEE. Note that the use of coarse-resolution croplands can lead to significant errors, an important point that has not received enough attention in most previous studies on global croplands, partly due to the computational cost and unavailability of high-resolution crop masks [12,13,17,28]. Using GEE, we were able to perform the entire analysis at 500 m, the resolution of the MODIS cropland product.
In this study, we introduce a new index based on a combination of AET, PET, and PP trends to determine the sustainability of AET trend, with respect to climate condition in each pixel. This index titled the “evapotranspiration warning index (ETWI)” is described in Equation (1).
where for pixel is the evapotranspiration warning index, is the slope of the annual AET linear regression trend, is the slope of the annual PET linear regression trend, is the slope of the annual PP linear regression trend, and is the standard deviation. The increasing trend in AET is not necessarily an index of nonsustainable water management in a region.
In the ETWI equation, the terms for water loss (AET and PET) have negative signs, but PP has a positive, as it adds water to the system. The trends are divided by their standard deviation to avoid inclination of the index to any specific component, because the ranges of the variables are not the same. In case the trends are not divided by their standard deviation, the index would mainly follow the PP trend, because it has a higher interannual change. This process (standardization) allows us to compare the variables on the same scale. The weight of is twice, because the index is developed for AET, and it is the only anthropogenic variable in this equation. The AET forcing variables, which are PET and PP, should have the same weight after summing up to allow comparing AET and its forcing variables. As a result, the more negative value of ETWI means the more nonsustainable AET of croplands, which is an index of water use in croplands. In other words, the more negative value of ETWI gives us a warning in trends of water use of that cropland, because the changes in PET and PP were not enough to compensate for the increasing trend in AET.
Further analysis is performed in water and energy limited areas to determine any convergence or divergence of trends between these two areas over the entire global land as well as cropland-only regions. The concepts of water-limited and energy-limited evaporation have long been used to investigate the role of evaporation in the water balance at both hydroclimatologic and agronomic areas and time scales [29,30]. The annual average (2001–2018) of the PP over the corresponding annual average PET is calculated for each pixel. Assuming that precipitation is the only source of water, areas where this ratio is >1.0 are named energy-limited (as AET is limited by energy, not water) and areas where the ratio is <1.0 are termed water-limited (AET is limited by water, not energy).
We will also perform our analysis, separately for each country, and three major crop types (i.e., wheat, maize, and rice) of the world to add further perspectives on their sustainability of water use. Furthermore, we separate these crops into irrigated and rainfed classes, because they can show different responses to environment conditions.
For connecting the trends to other variables, comparison analysis with other variables is done to find out any relationship with other global variable changes.
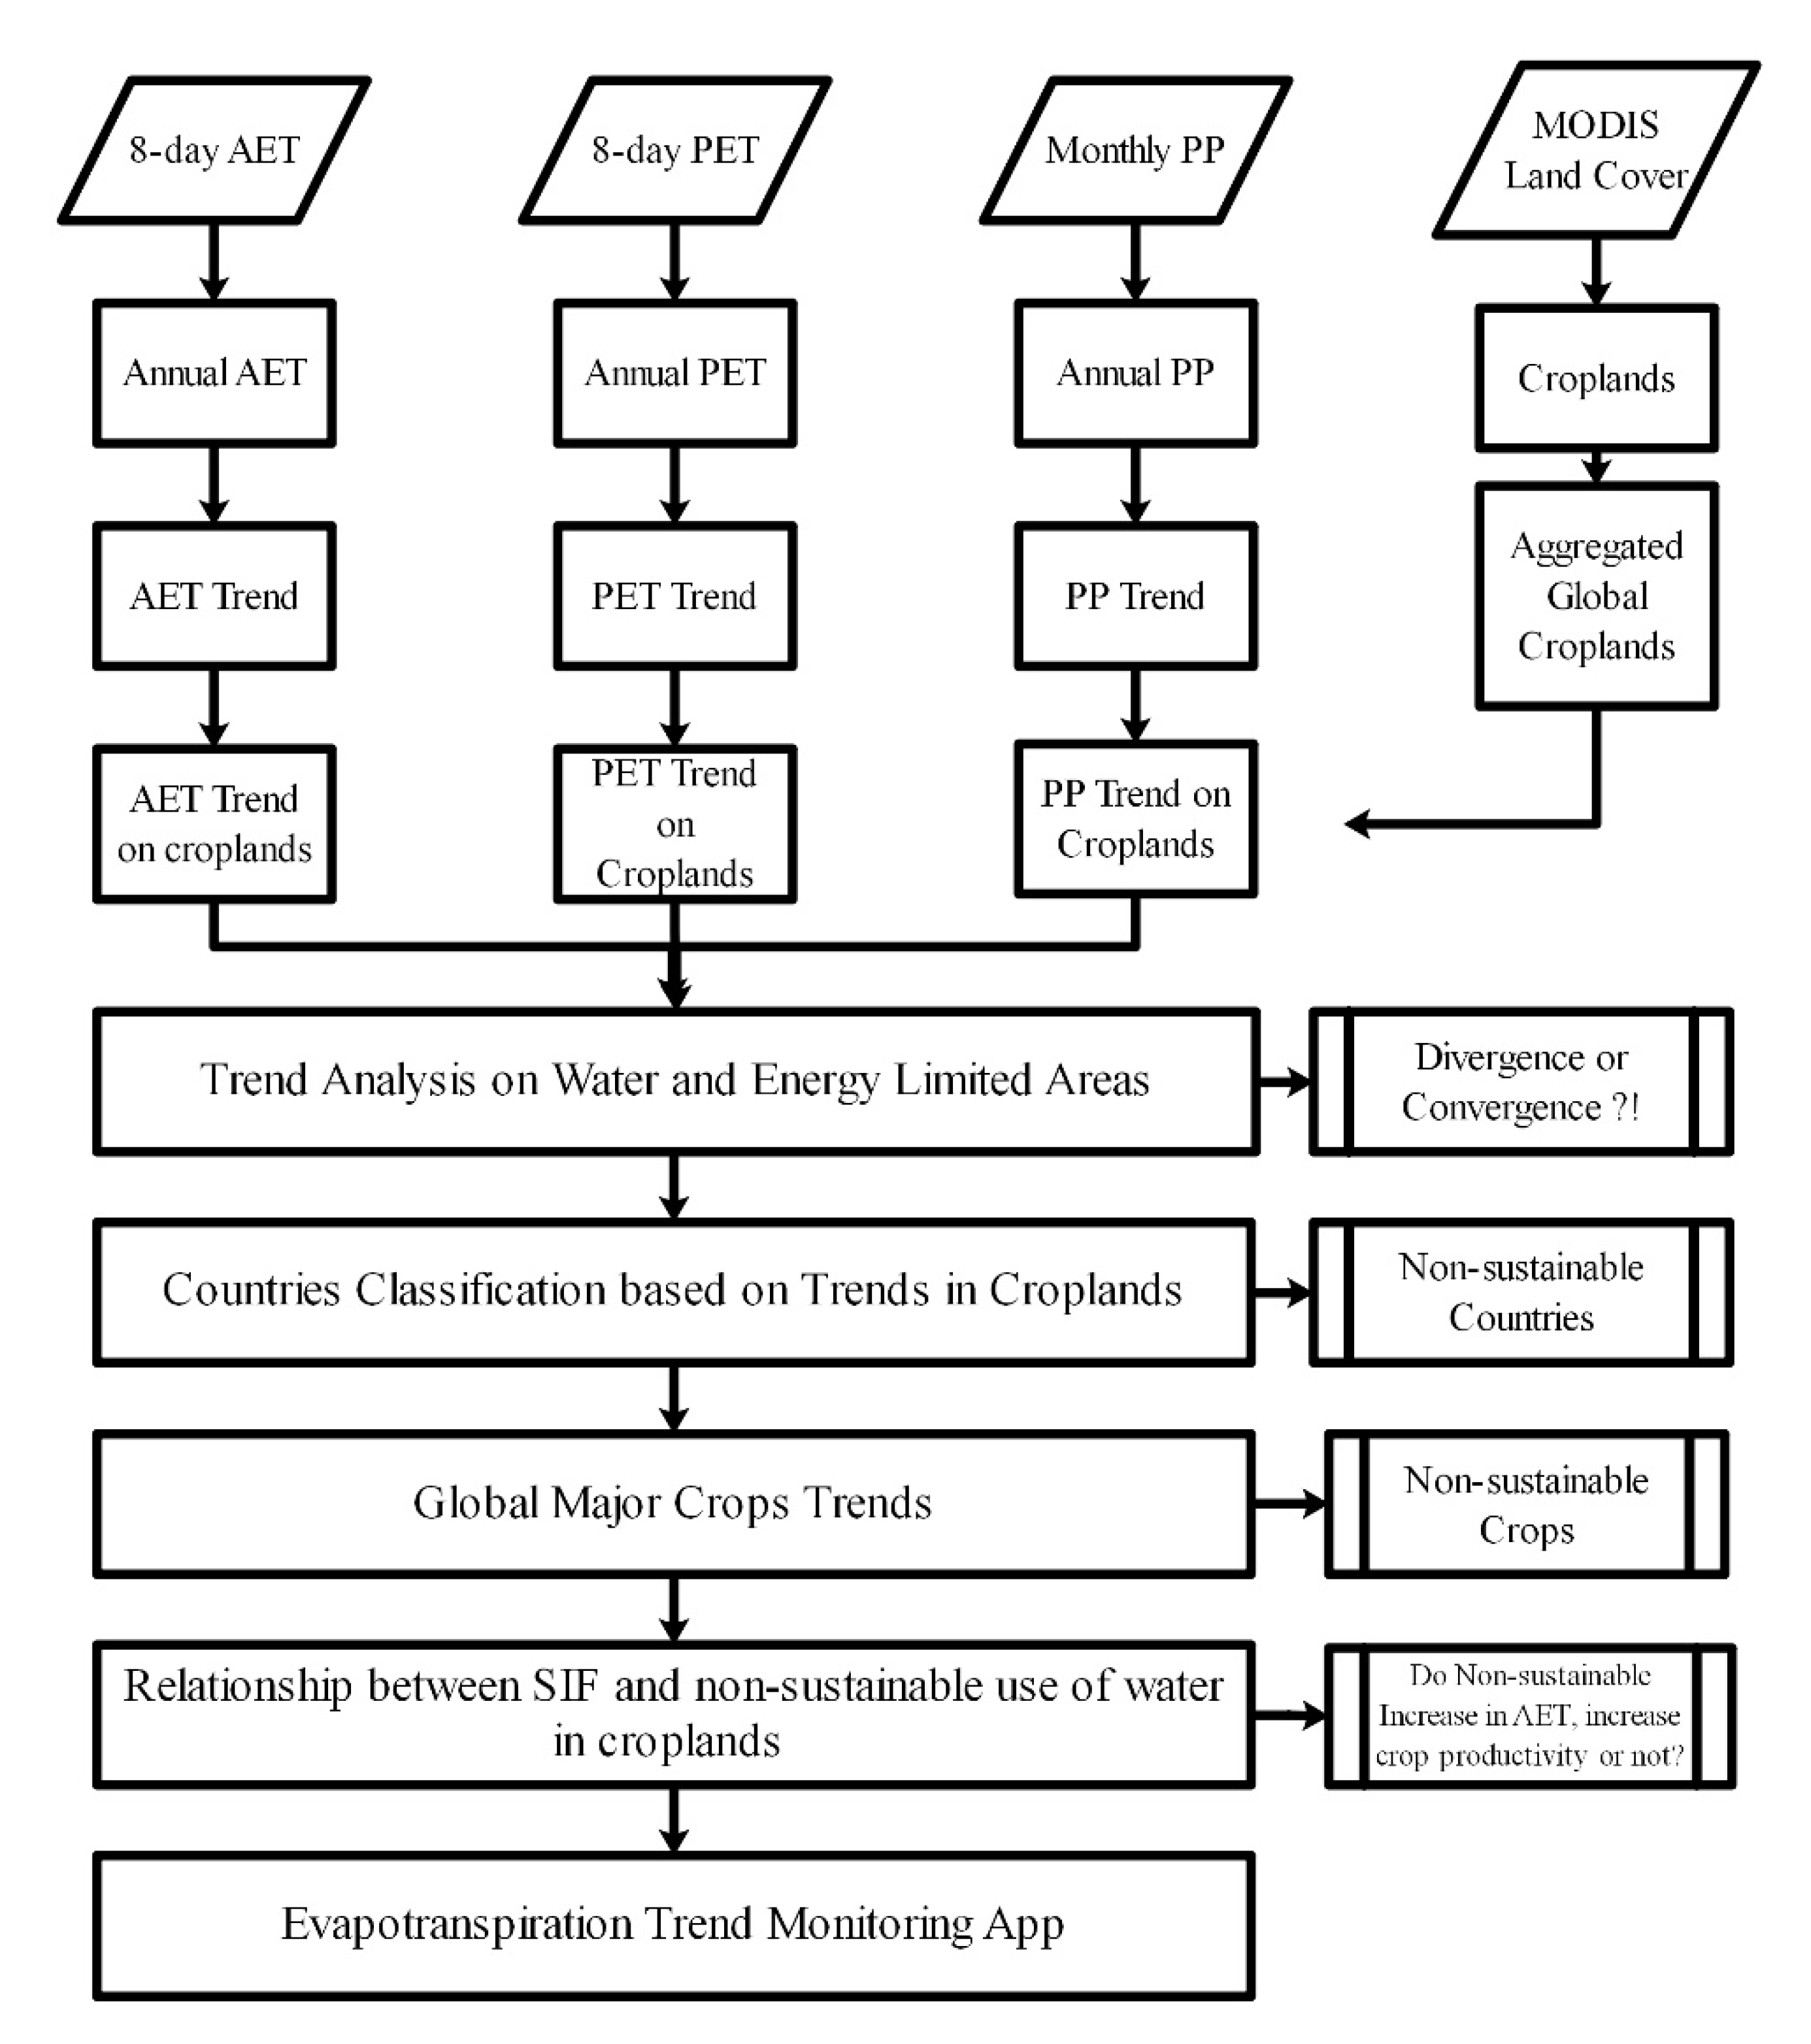
Finally, an online public app in GEE will be introduced and made available, which can be used for comprehensive trend analysis, including those investigated in this paper (Figure 1).
3. Datasets
The datasets used in this study are introduced in Table 1. The moderate resolution imaging spectroradiometer ET (MOD16) product [31] has AET and PET products. MOD16 AET product is based on the Penman-Monteith (P-M) equation [32], which includes inputs of daily meteorological reanalysis data along with MODIS data products like vegetation, albedo, and land cover. The MODIS PET product utilizes Priestley-Taylor (P-T) expression [33].
TerraClimate is a high spatial-resolution dataset (1/24°, ~4-km) for global terrestrial surfaces from 1958–present [34]. TerraClimate uses climatically aided interpolation, combining high-spatial-resolution climatological normals from the WorldClim dataset, with coarser resolution time-varying data from other datasets in order to produce a monthly dataset of precipitation (PP), maximum and minimum temperature, wind speed, vapor pressure, and solar radiation [34]. Global coverage, high spatial resolution, and availability in GEE are the main factors for selecting this dataset for obtaining PP in this study.
The Terra and Aqua MODIS Land Cover Type (MCD12Q1) Version 6 data product provides global land cover types at yearly intervals, derived from six different classification schemes [35]. The MCD12Q1 Version 6 data product is based on supervised classifications of MODIS Terra and Aqua reflectance data [35]. Then, the supervised classifications undergo additional post-processing that incorporates prior knowledge and ancillary information to further refine specific classes [35]. In this study, the 500-m cropland class of this product is extracted for cropland analysis.
MIRCA2000 is a Global data set of monthly irrigated and rainfed crop areas around the year 2000, providing irrigated and rainfed crop areas for 26 crop classes [36].
GOSIF is a new global ”OCO-2” SIF data set with high spatial and temporal resolutions based on a data-driven approach [37]. The GOSIF product has reasonable seasonal cycles and captures the similar seasonality as the coarse-resolution OCO-2 SIF (1°), directly aggregated from the discrete OCO-2 soundings, and tower-based GPP [37].
4. Results and Discussion
4.1. Global Changes in AET, PET, and PP
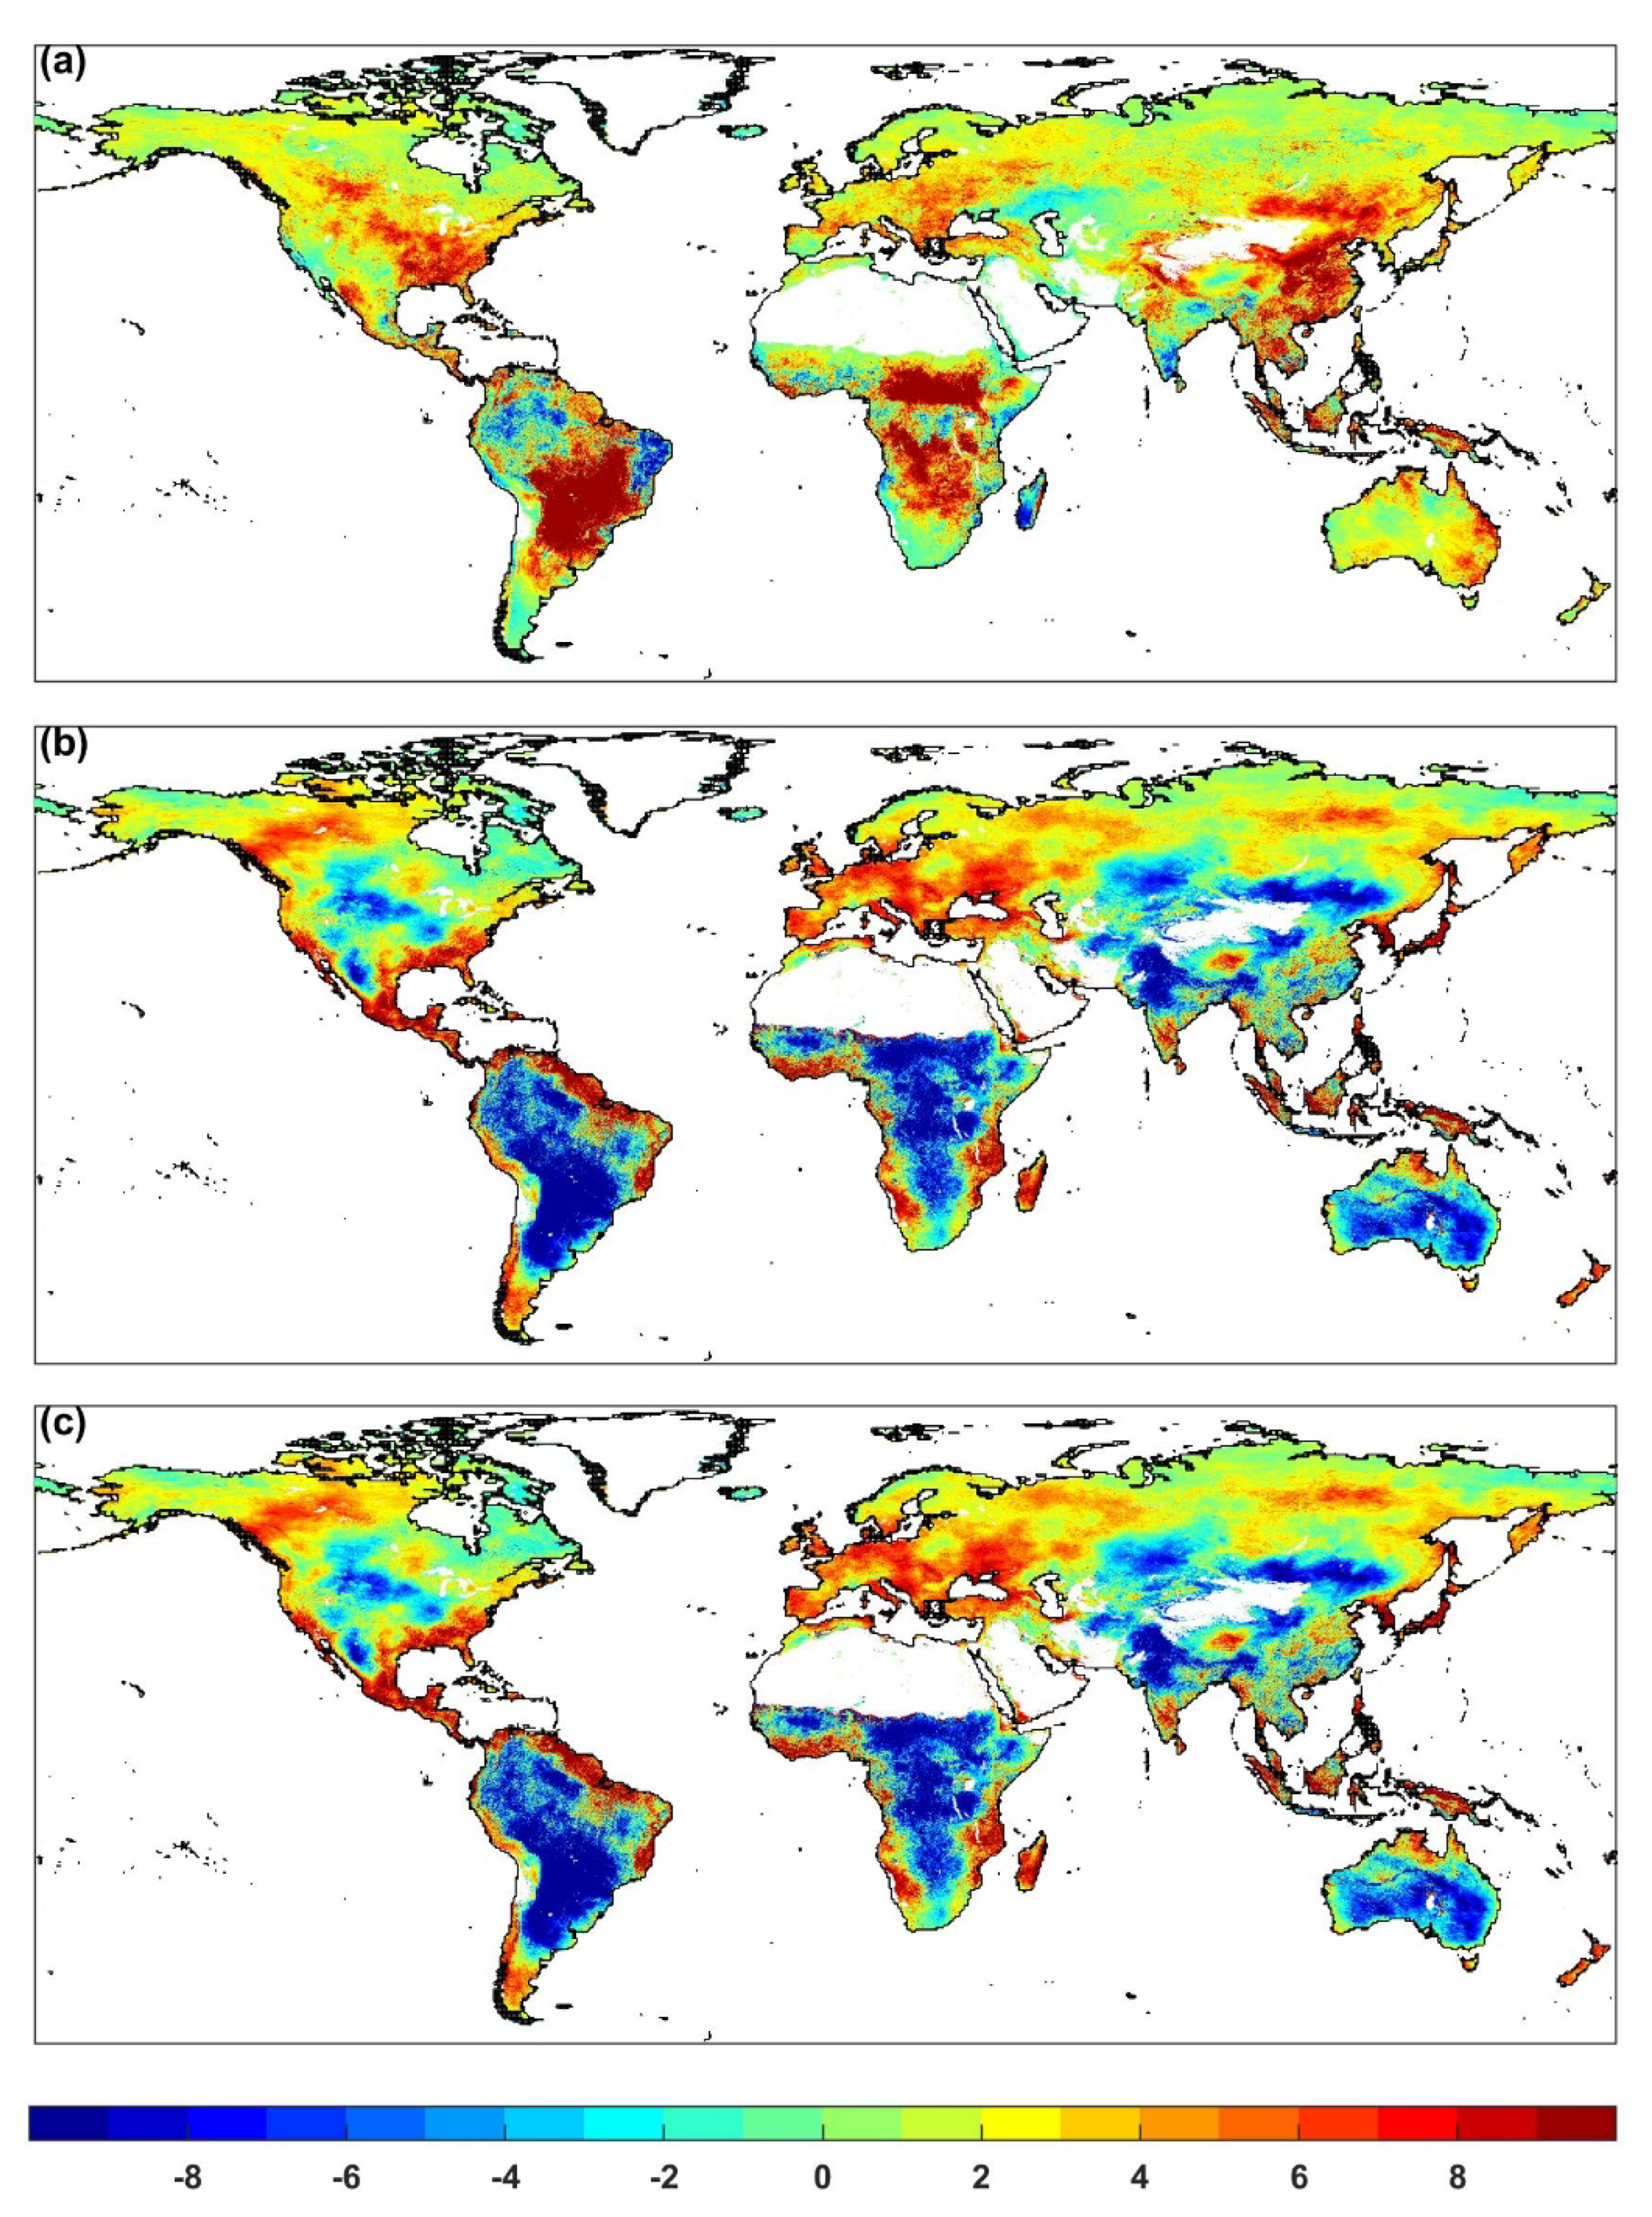
The annual trend of AET, PET, and PP in mm/year are demonstrated in Figure 2. The most significant increasing trends in AET are located in central South America, Southern Africa, and Eastern Asia (Figure 2a). In contrast, north high latitudes and the amazon rainforest show a decreasing trend in AET (Figure 2a), which might be related to decreasing in PP and deforestation, respectively. Figure 2b shows a significant (p < 0.05) decrease in PET over wide regions in the tropics and Central Asia. On the other hand, an increasing trend in PET is observed over Europe and Central America. PP trend shows that PP is increasing in the Amazon rainforest and Southeastern Asia. Moreover, the PP trend is negative over Central Africa (Figure 2c), consistent with the monthly trend analysis by Anabalón and Sharma [13] using 15 years (2000 to 2014) of PP data and [18] using different satellite and reanalysis precipitation products. The AET trends of [12] which are from 1981 to 2012 show consistent results with this study.
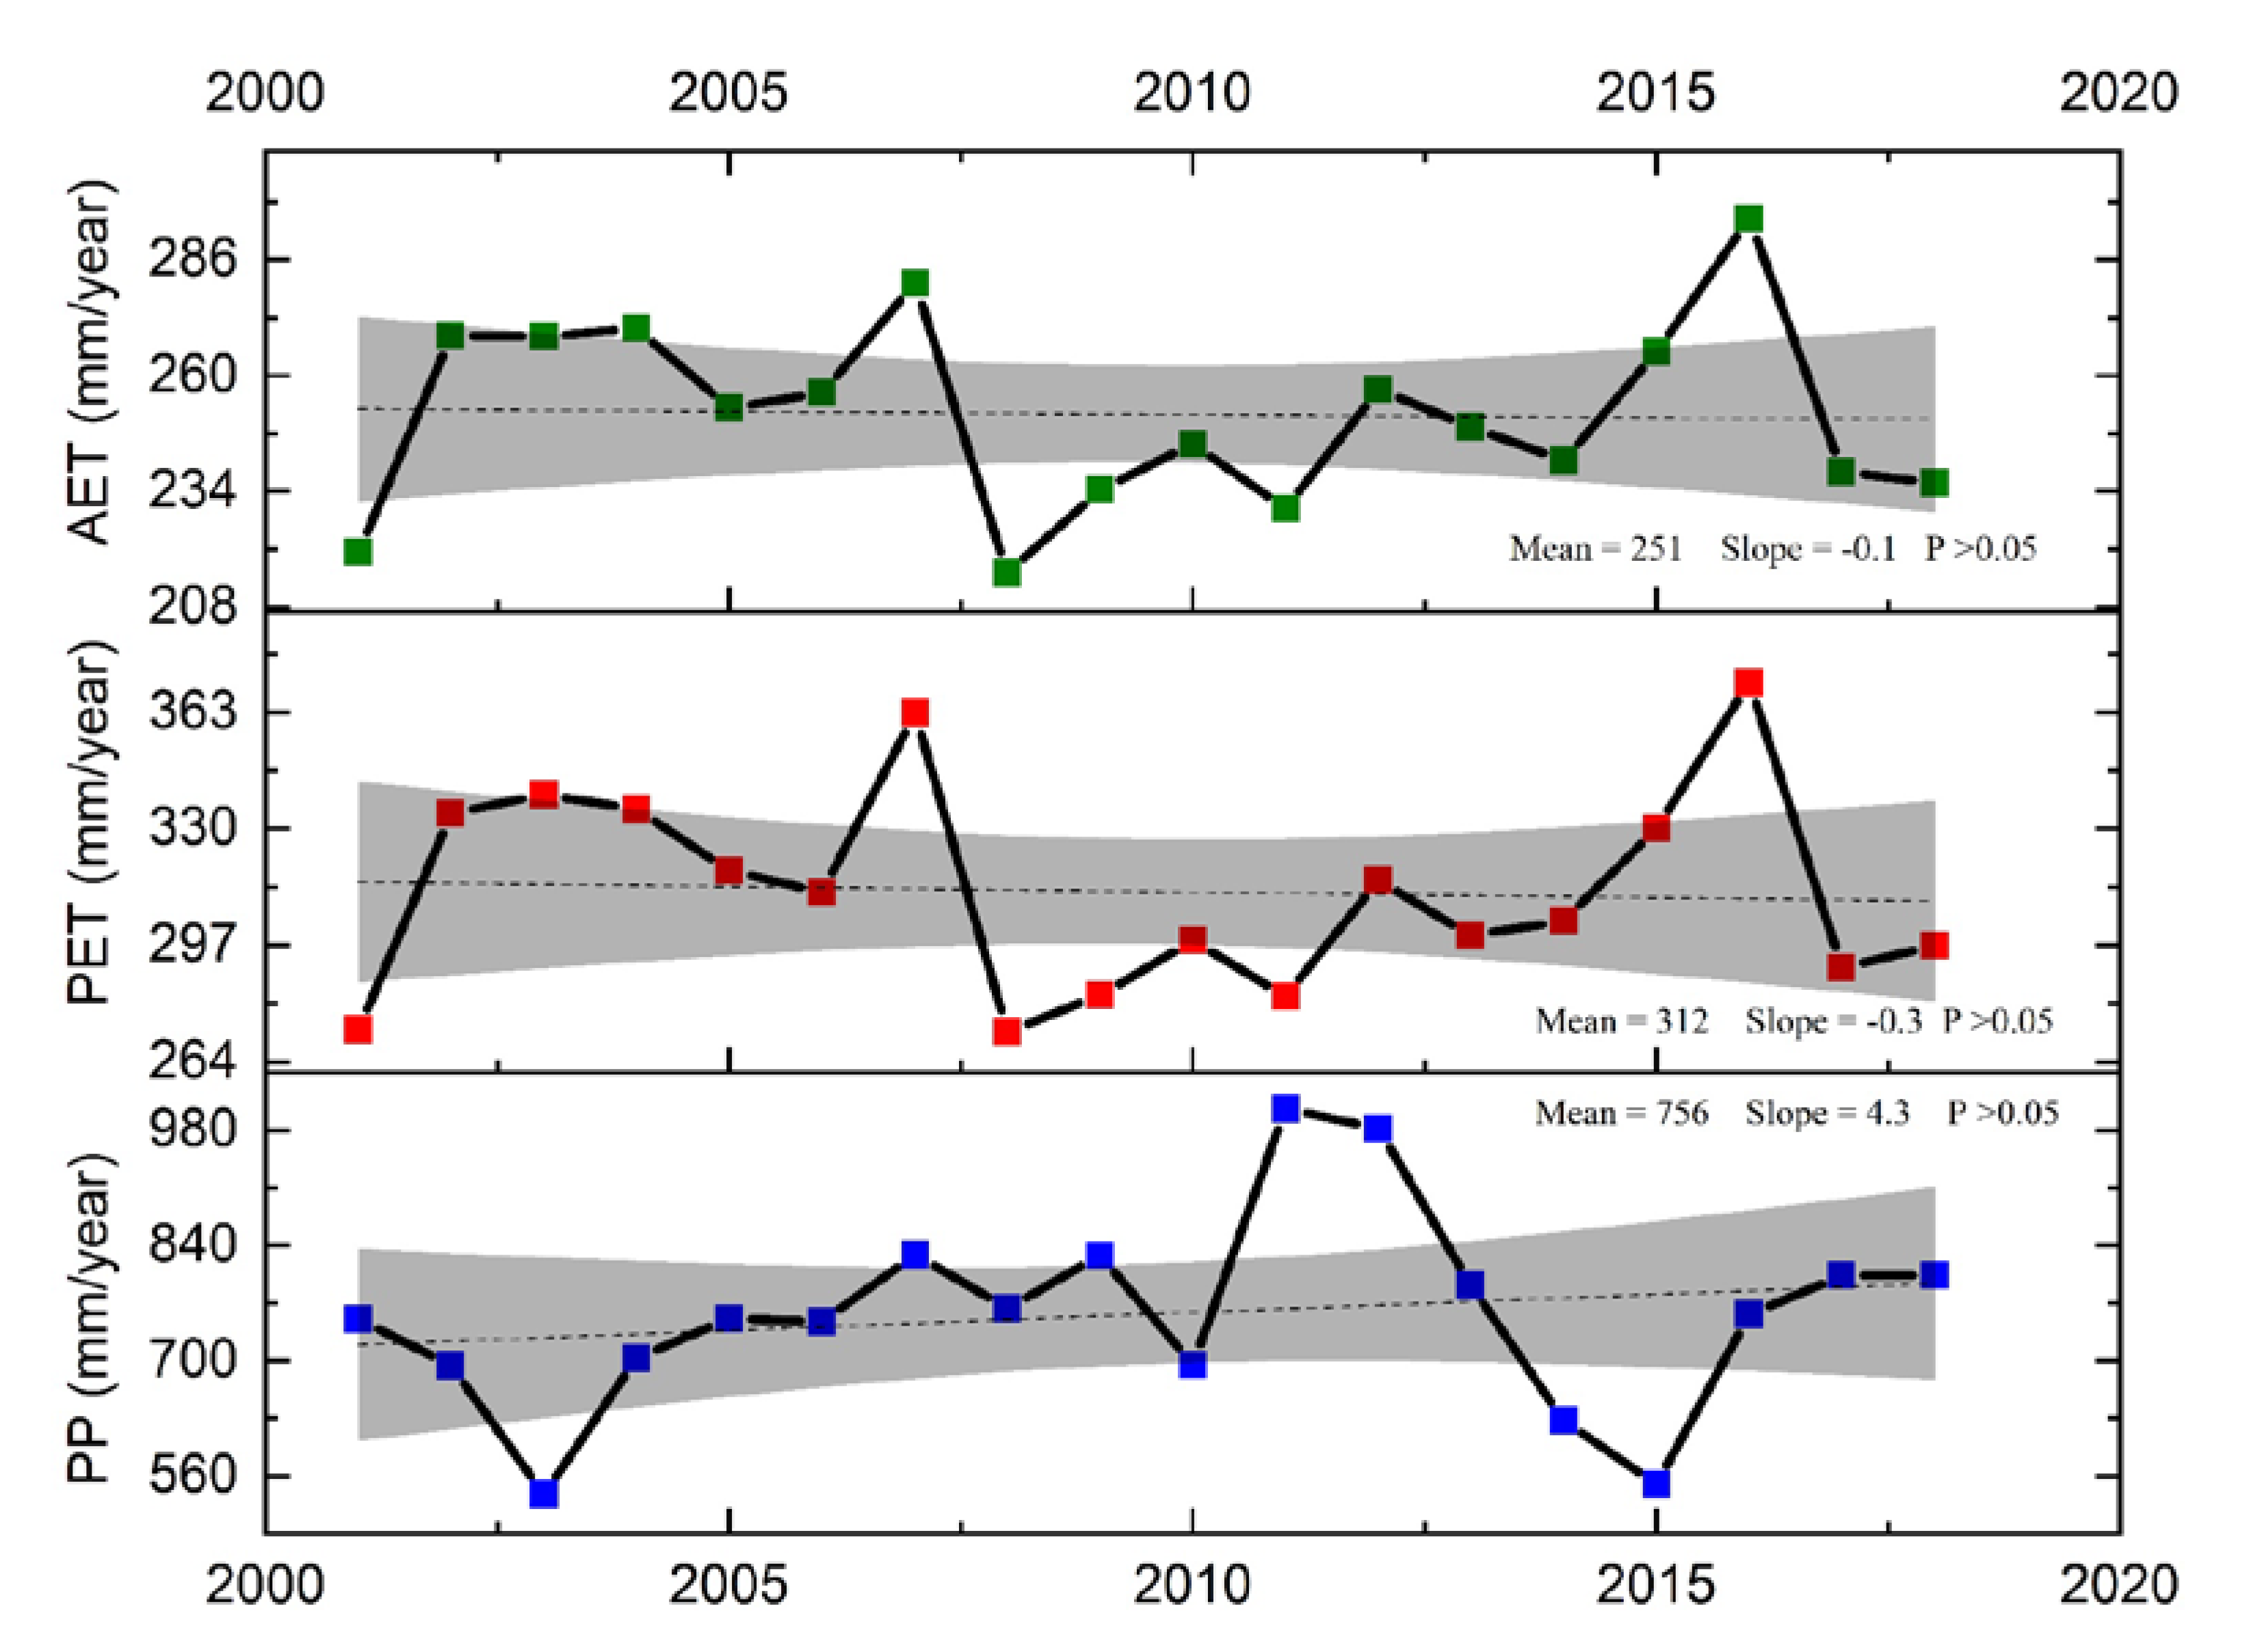
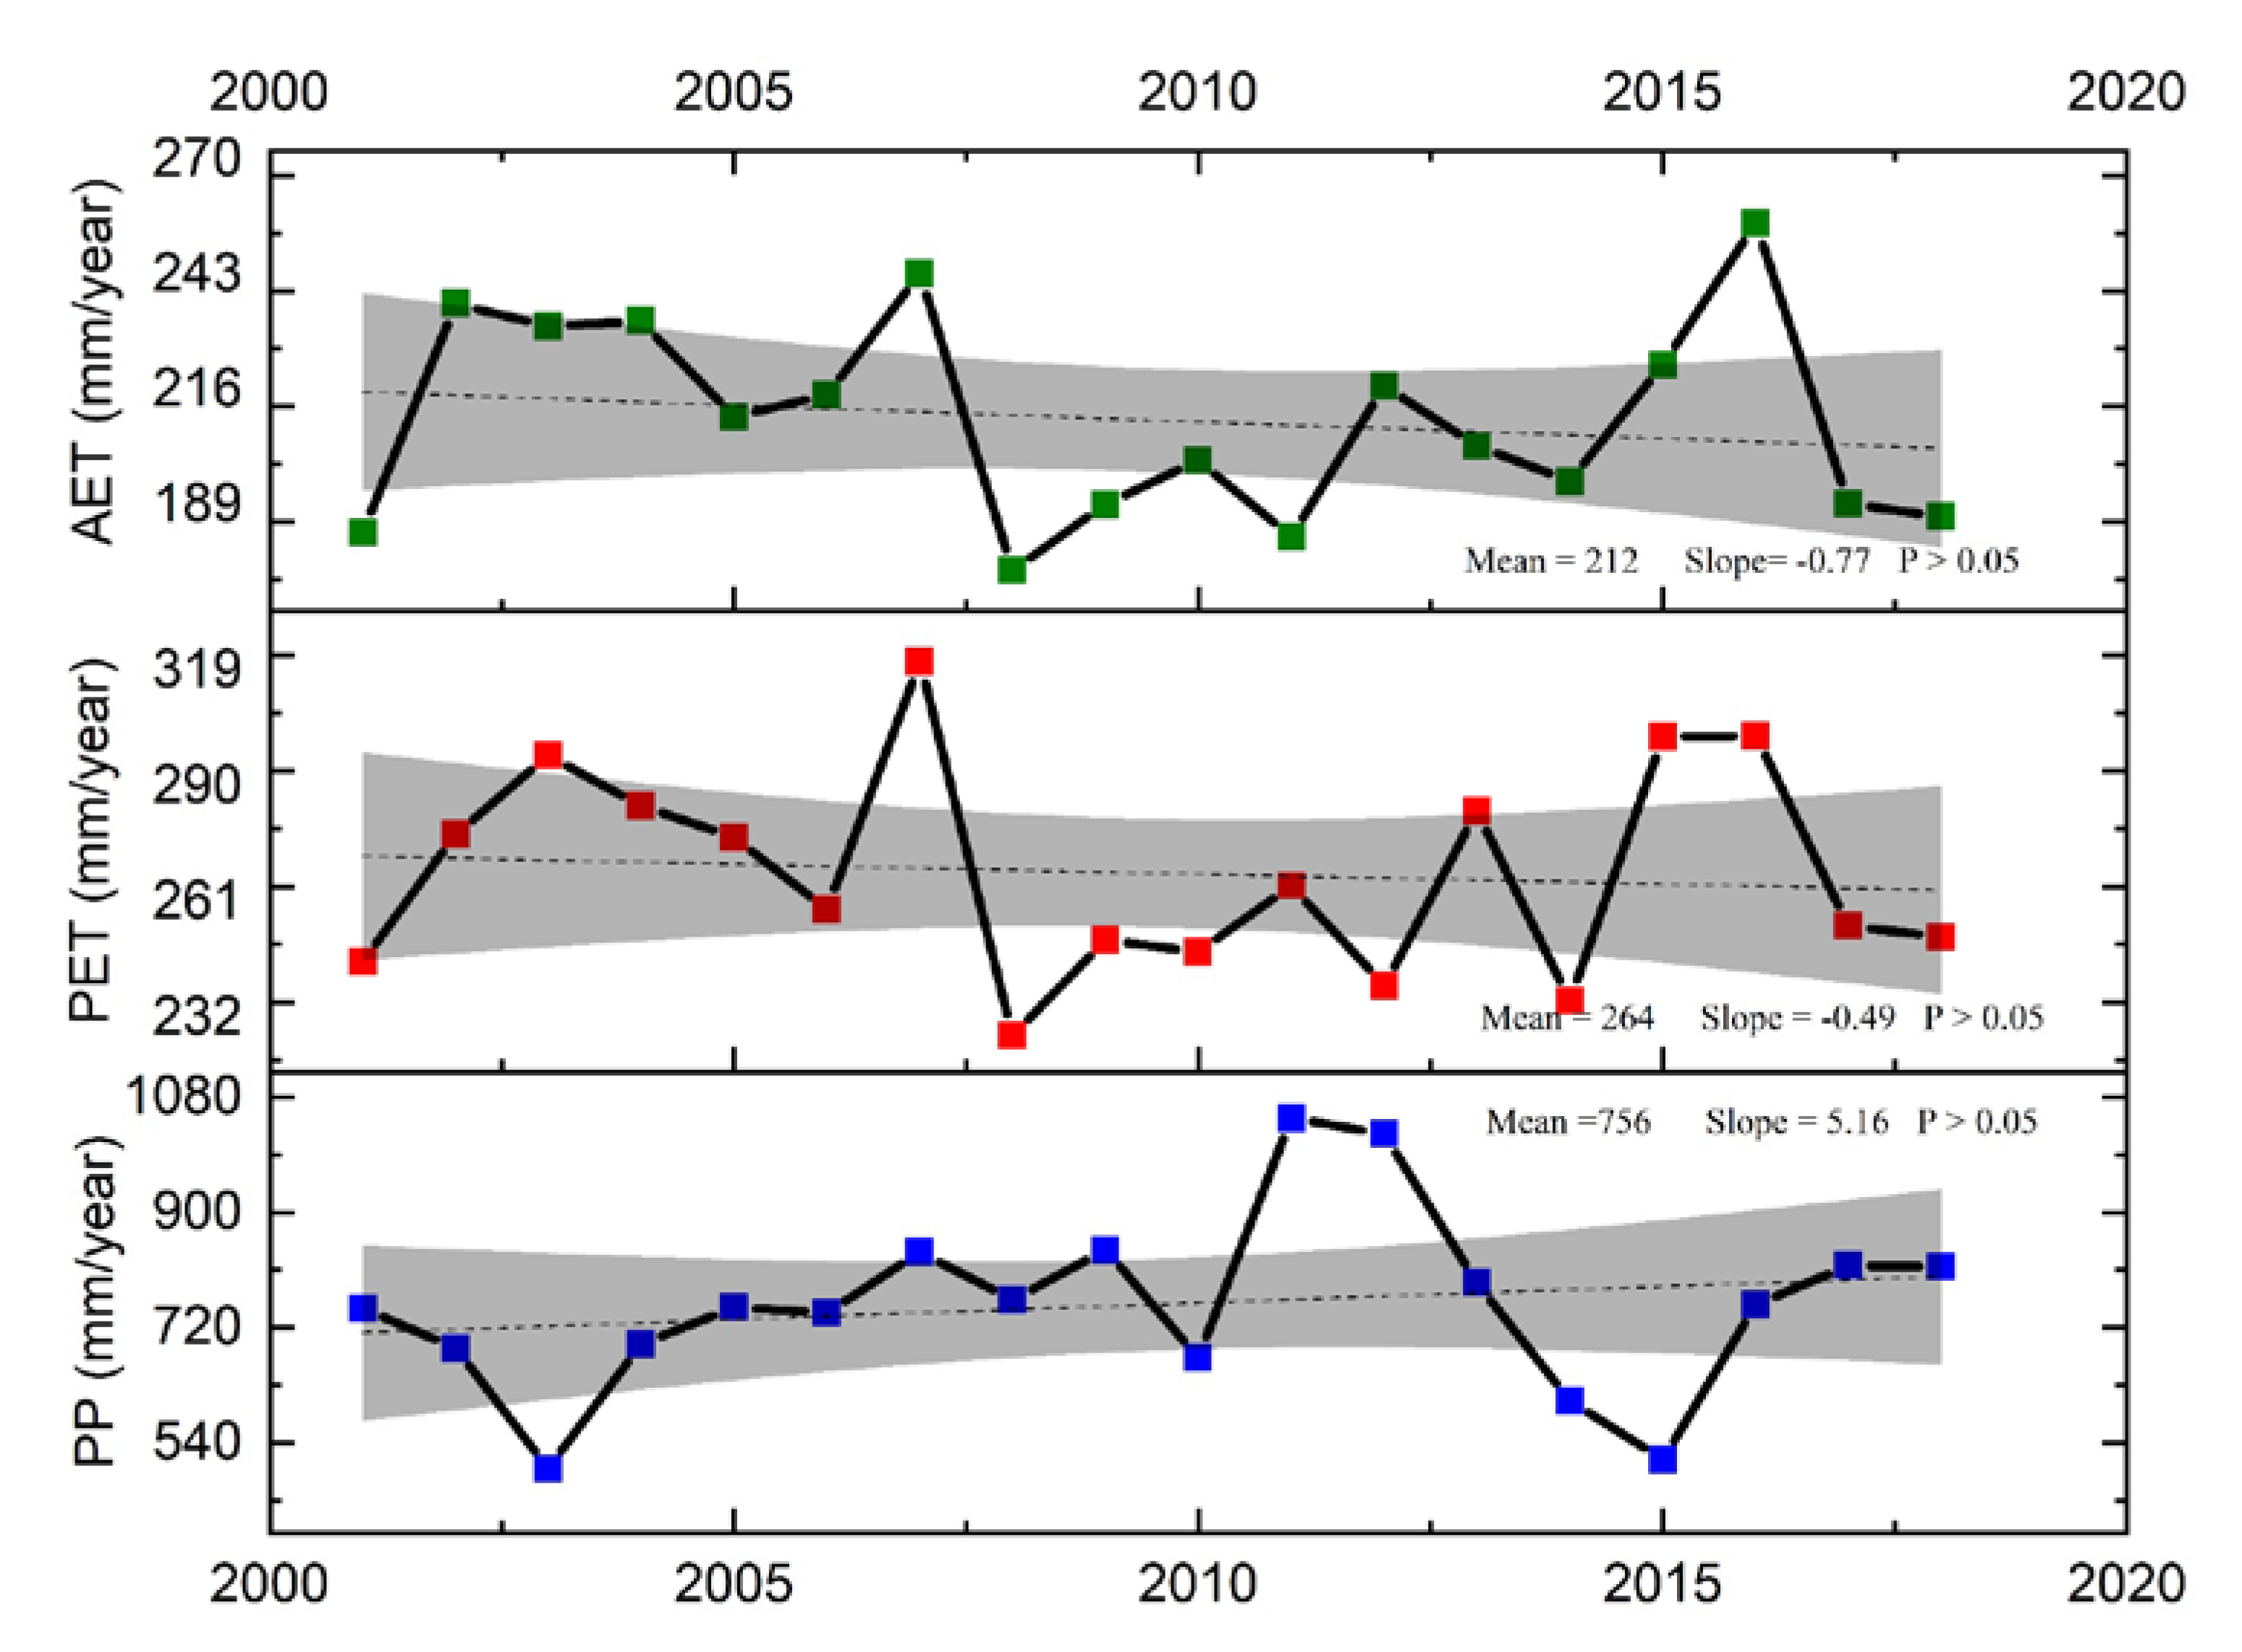
The mean global annual values of AET, PET, and PP demonstrate that there is no significant trend in mean global AET, and PET over land between 2001 and 2018 (Figure 3). In contrast, the PP has increased to 4.3 mm per year during this time period, which is not significant (p > 0.05) (Figure 3). The average global mean of AET, PET, and PP are 251, 312, and 756 mm/year, respectively.
4.2. Global Changes in AET, PET, and PP for Natural Lands and Croplands
The changes in AET, PET, and PP for natural lands explored by excluding croplands, urban areas, and water bodies from the whole globe. The results are pretty close to global results, because natural lands are the most dominant landcover (Figure 4). There is a nonsignificant decreasing trend in natural lands’ AET.
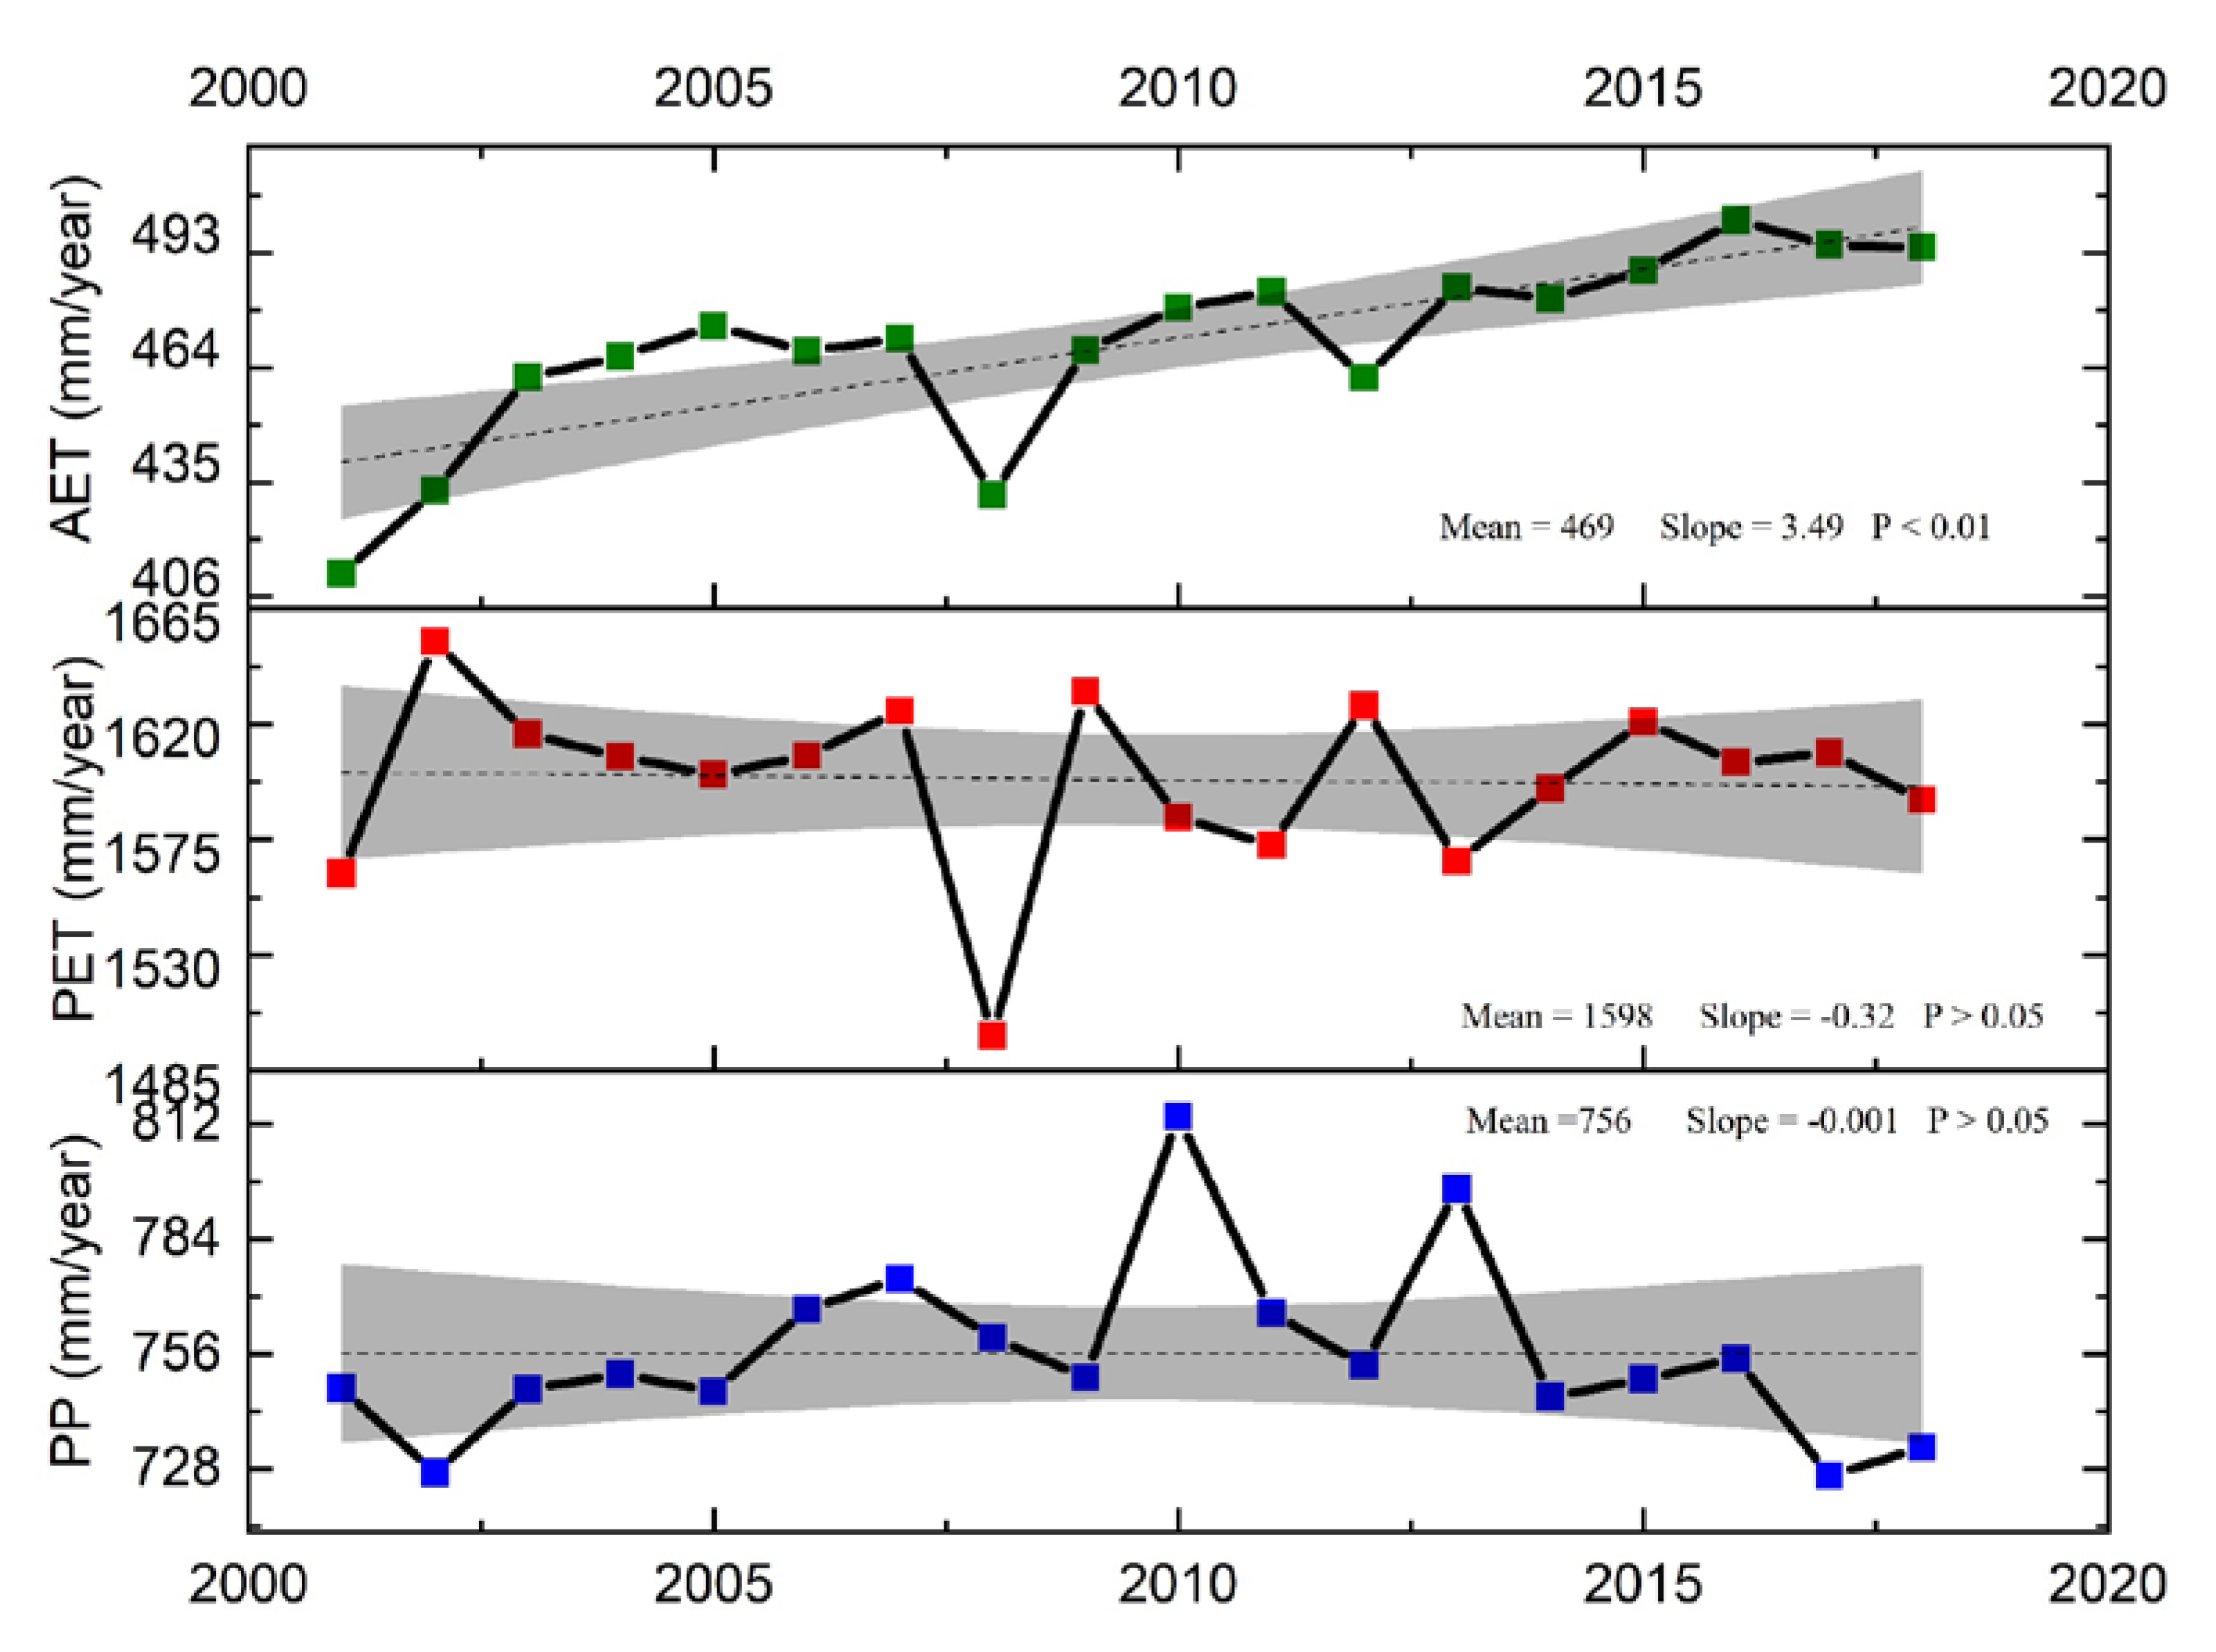
We further focused our trend analysis on croplands due to their importance for food production. The trends of AET, PET, and PP in croplands were calculated, which is shown in Figure 5. For croplands, the average global mean of AET, PET, and PP are 469, 1598, and 756 mm/year, respectively, which are 1.8, 5.1, and 1 times more than that calculated over the entire global lands. While there is no significant trend in croplands PET and PP, AET demonstrates a significant increasing trend during the 18 years studied here (Figure 5). AET of the global cropland has increased by 3.5 mm/year (i.e., ~14%), much larger than the AET trend of the natural land.
As noted in the methodology section, an increasing trend in AET is not necessarily an index of nonsustainable water management in a region, unless it is studied in the context of water balance. A combination of AET, PET, and PP can give us better information about water supply and demand. Therefore, ETWI was applied to croplands to consider the combined effect of these variables. The average value of ETWI for the global croplands is −0.40, suggesting that changes in PET and PP trends are not enough to compensate for the large increasing trend in AET.
While ETWI is not a drought index, a correlation analysis between ETWI and the trend of PDSI, VPD, NDVI, and EVI was done to validate the approach of the ETWI. The average spatial correlation coefficient between ETWI and PDSI trends between 2001 and 2018 is 0.41. As negative values of both ETWI and PDSI relate to harmful effects, the correlation coefficient indicates ETWI is not far from PDSI, which is one of the popular agricultural drought indices that includes ET. Furthermore, the correlation coefficients between the ETWI index and other variables like VPD, NDVI and EVI, are—−0.33, −0.47, and −0.52, respectively, which shows while they do not have a strong correlation, they all promote more AET.
4.3. Changes in AET, PET, and PP for Water and Energy-Limited Areas
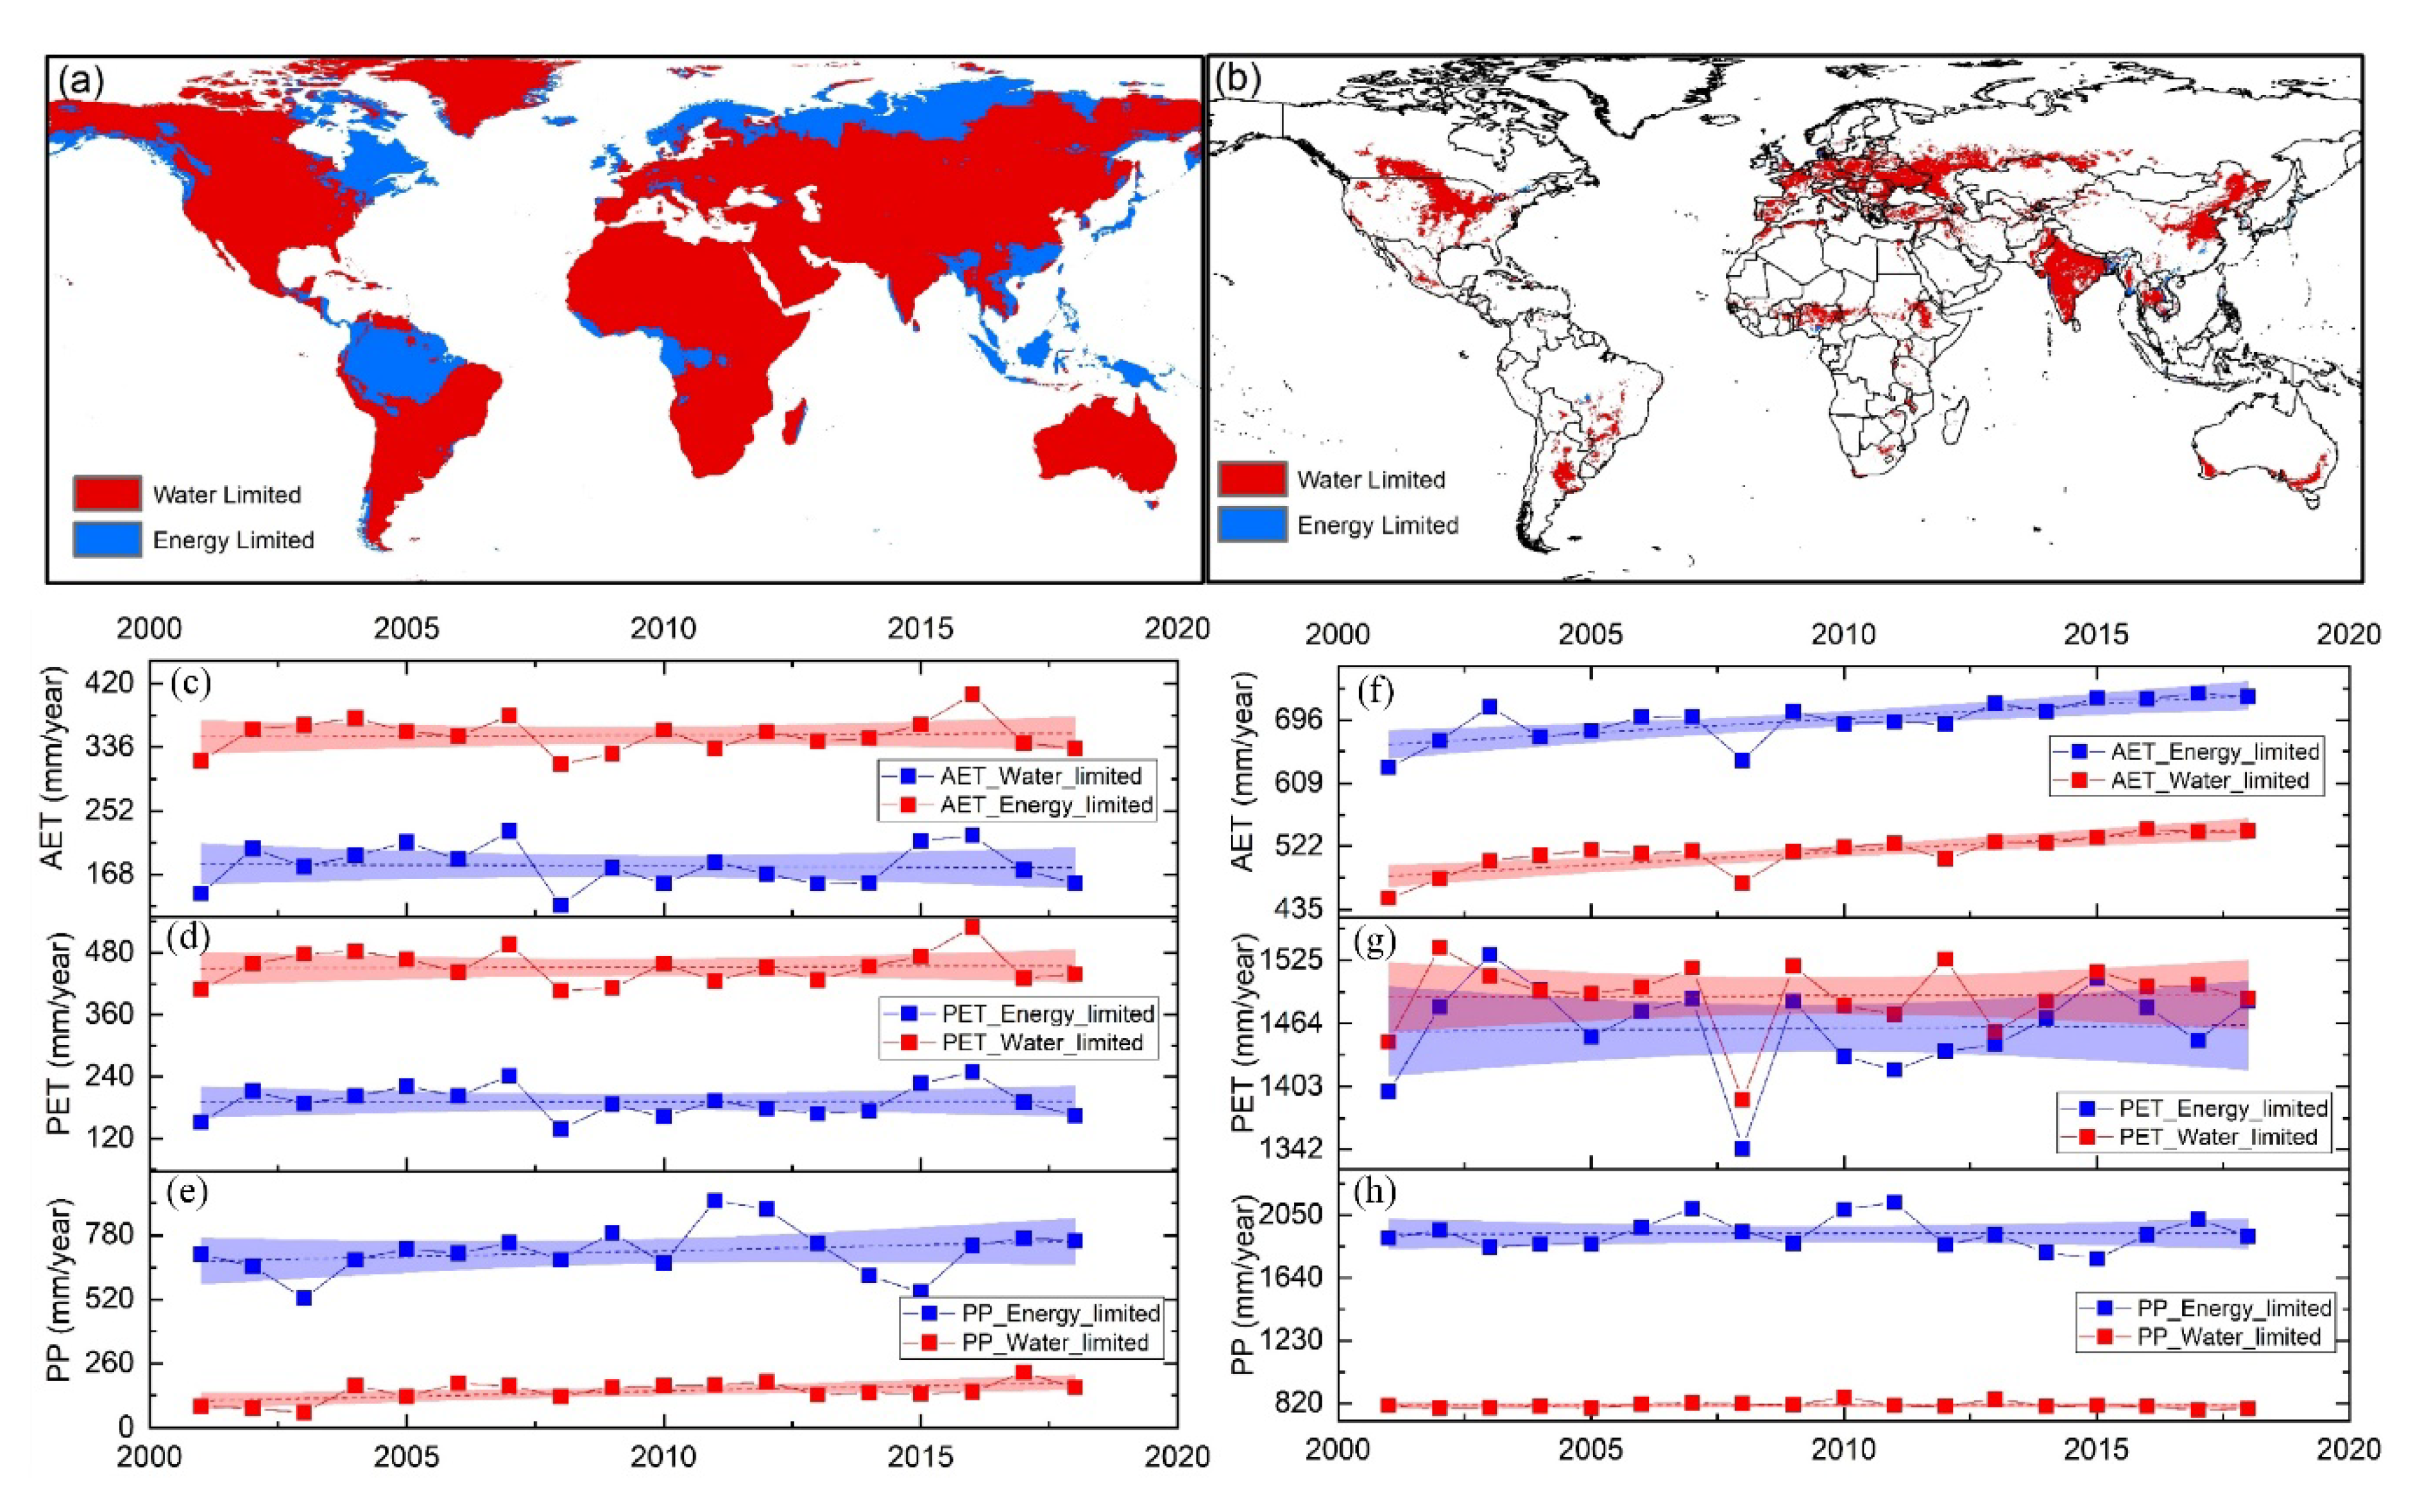
The trends were also investigated in water and energy-limited areas. The concept of water-limited and energy-limited evaporation has long been used to investigate the role of evaporation in the water balance at different hydroclimatic and agronomic areas and time scales [29,30]. The water and energy limited areas for global and croplands are shown in Figure 6a,b. The water and energy-limited regions resulted from this study are consistent with previous studies [29,40]. The trends in global scale show that, while the AET and PET do not have significant trends in both water and energy limited areas, the increasing trend of PP in energy-limited areas is more than water-limited areas (Figure 6c–e). The results in water and energy limited croplands converge together, because most of the croplands cannot grow in energy-limited areas (Figure 6f–h). Therefore, mostly they are in water-limited areas which have enough energy from the sun.
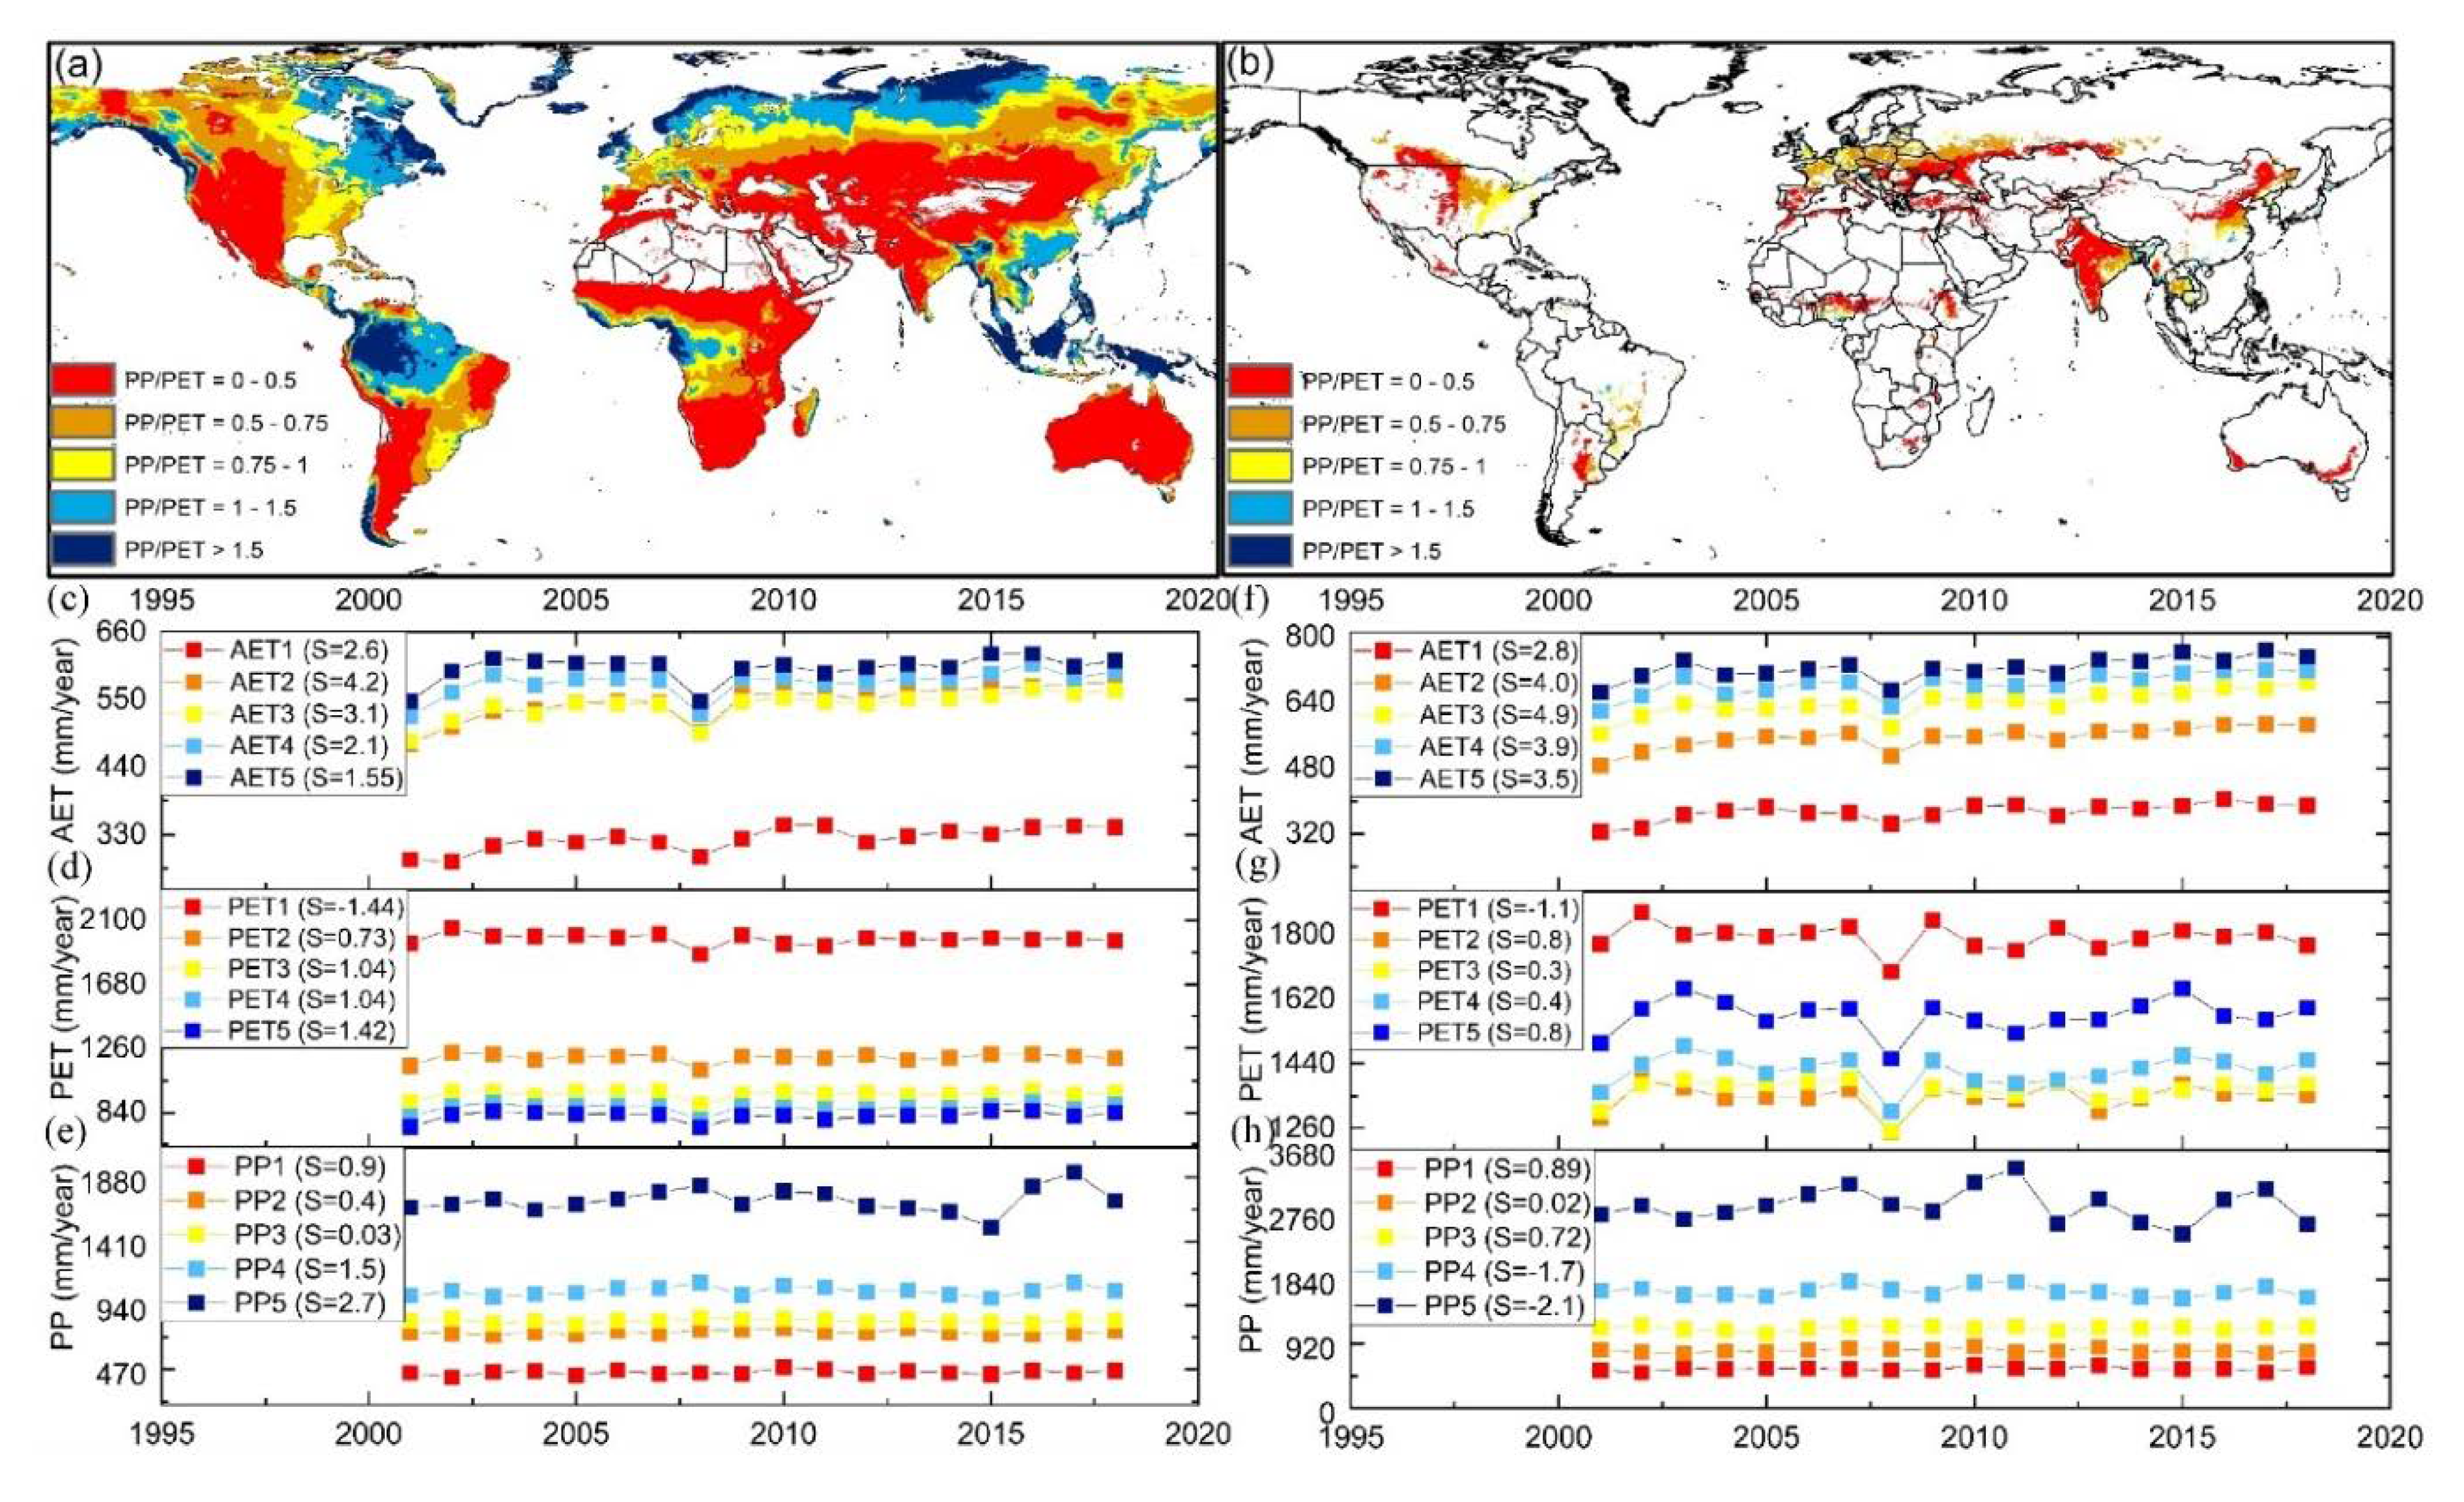
Dissecting the whole globe in just two classes might not be sufficient to explore their characteristics [41]. Therefore, based on [29], we classified the world based on their PP/PET into five classes (Figure 7a,b) to compare the results with two classes analysis. The annual averaged of PP/PET of class 1–5 are 0–0.5, 0.5–0.75, 0.75–1, 1–1.5, and greater than 1.5, respectively. The timeseries of AET, PET, and PP for both global scale and cropland scale, including the slope of each variable trendline, are shown in Figure 7c–h. The results show that class 2 and 3 are more nonsustainable in their AET trend than others. In other words, the water-limited areas which have PP/PET between 0.5 and 1 experienced more stress than other regions. Furthermore, in these two classes, croplands experienced more serious trends than natural lands.
4.4. Changes in AET, PET, PP, and ETWI for Countries’ Croplands
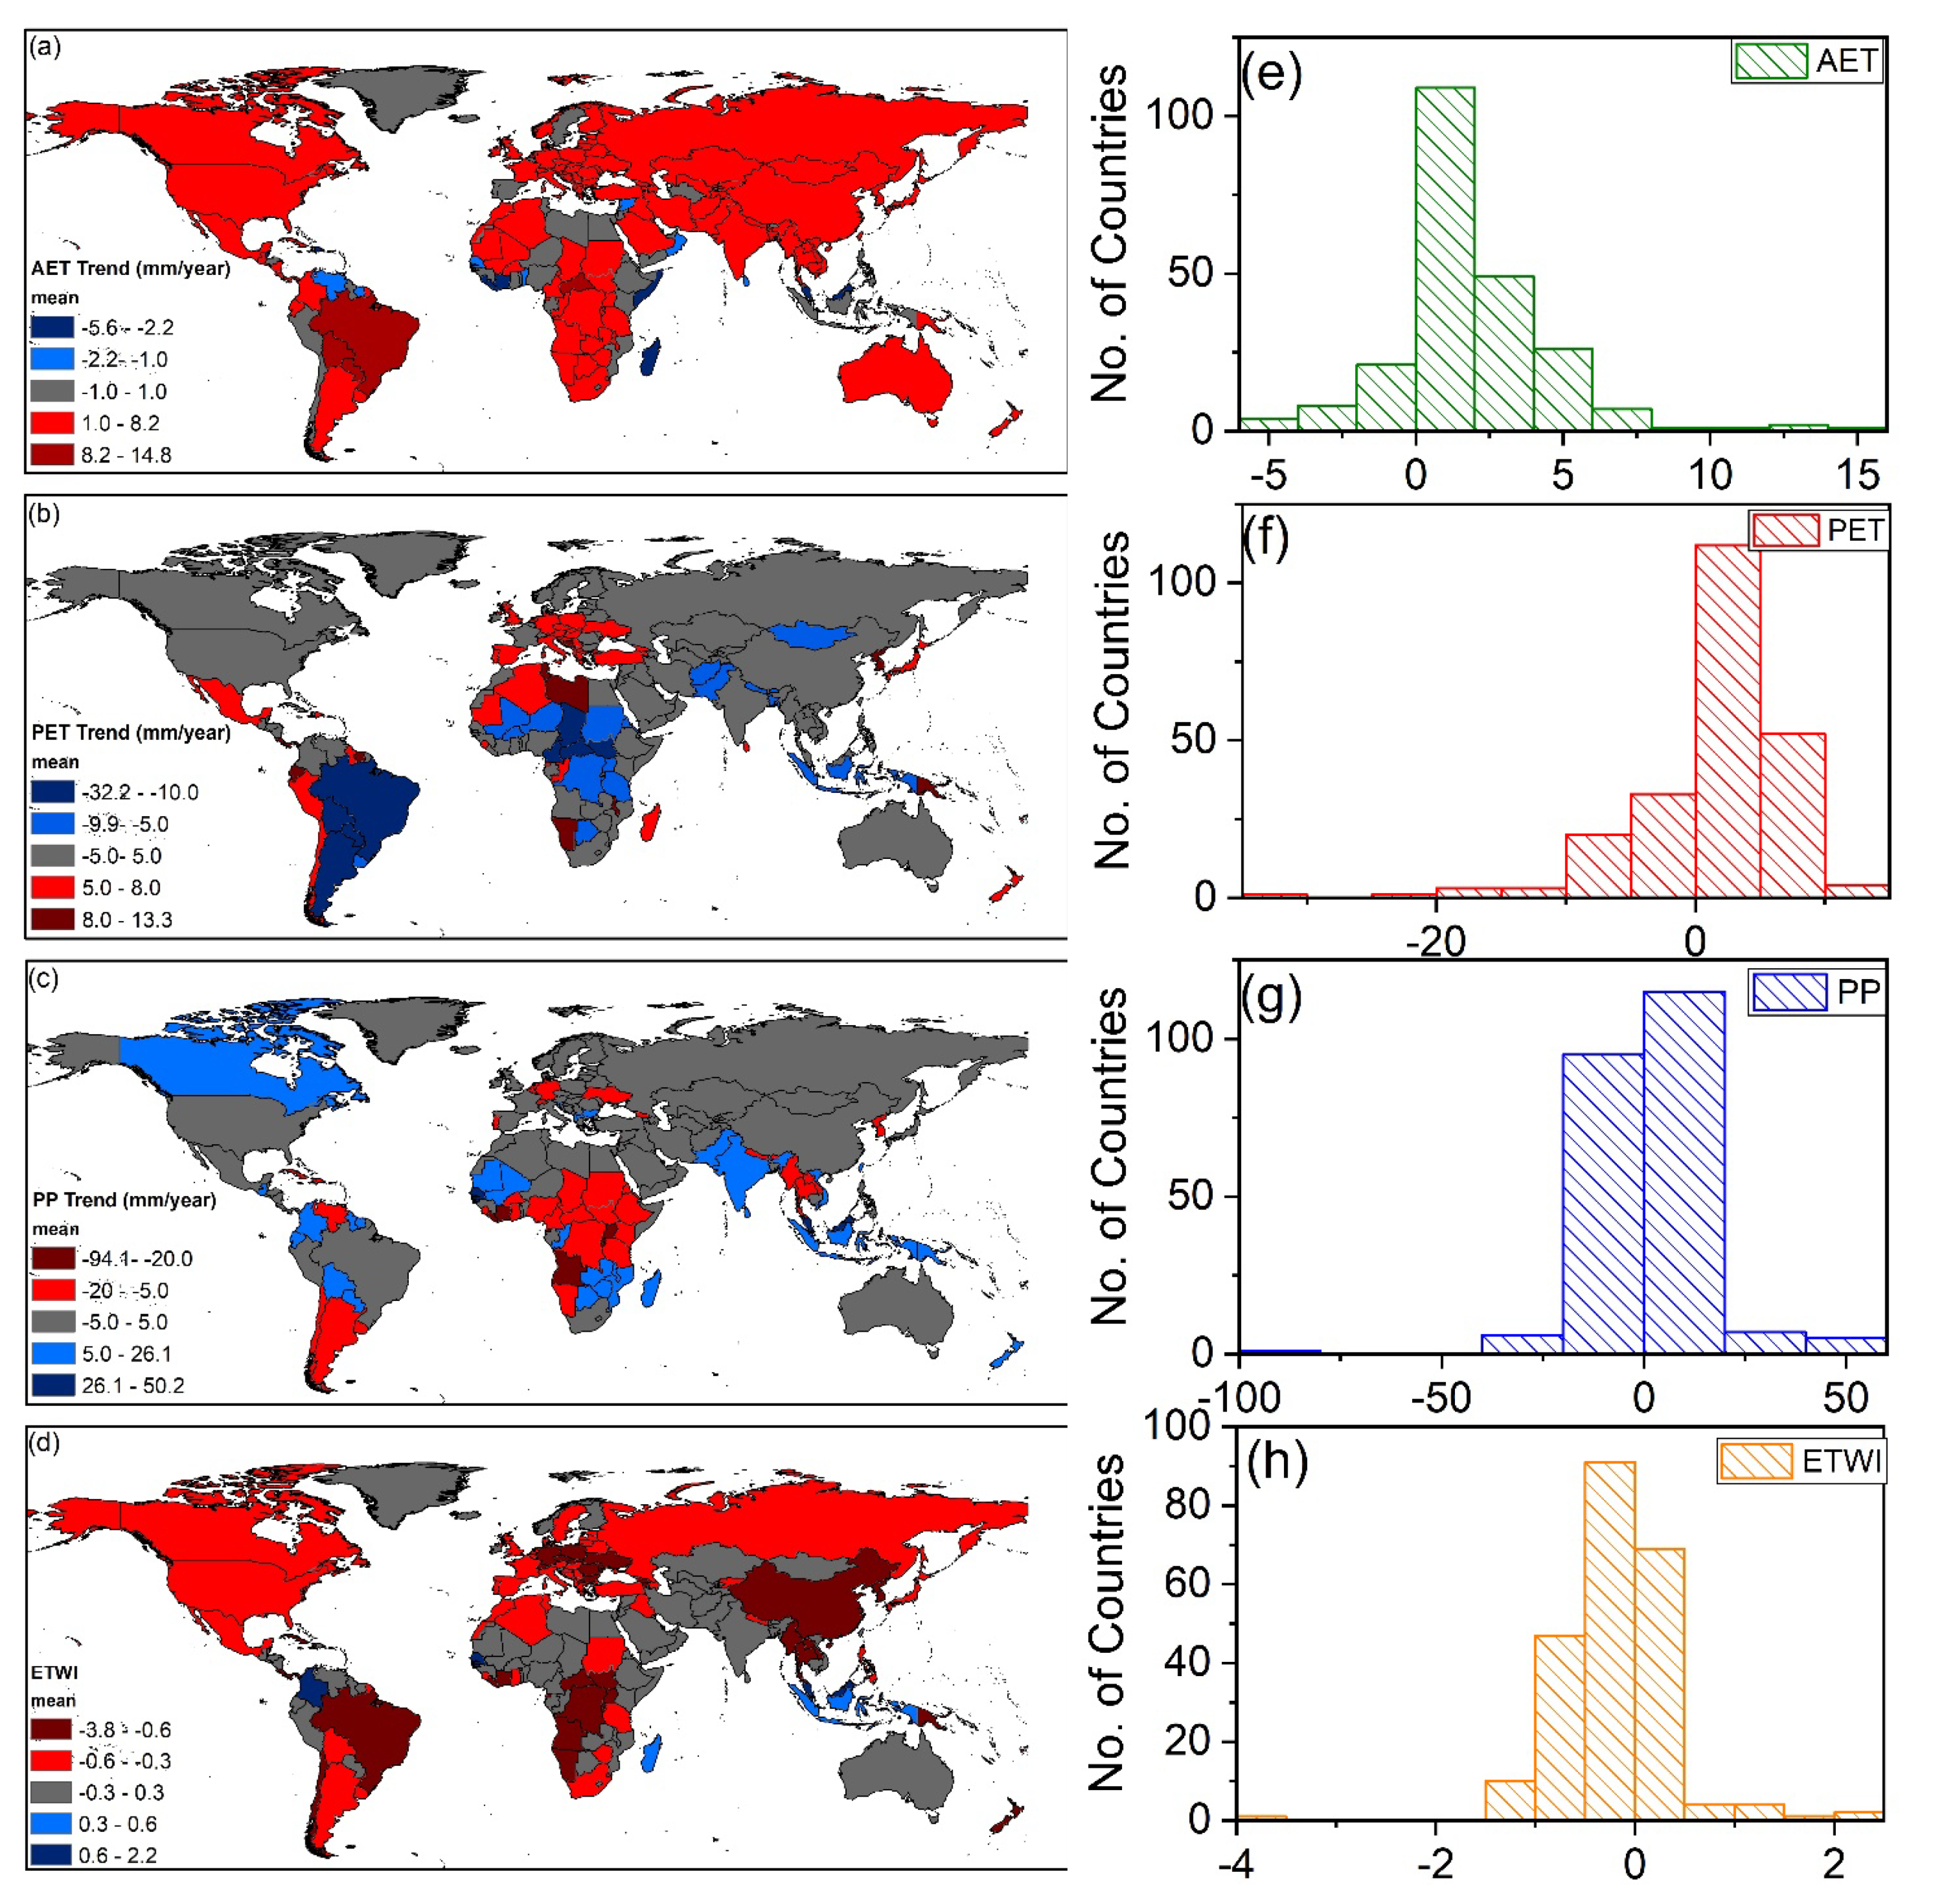
Cropland’s water management mainly depends on the internal roles of counties, and also, climate change can affect countries croplands differently. Therefore, the trends in croplands and ETWI were averaged in each country and compared (Figure 8). Most of the countries except those in Southeast Asia and a few others show an increasing AET trend in croplands (Figure 8a); among those, Brazil has the largest AET trends. For PET, most African and South American countries show a decreasing trend while European countries demonstrate an increasing trend (Figure 8b). India and Southeast Asia countries show the largest positive trends in precipitation for their croplands (Figure 8c).
By neglecting countries with low agricultural activities, the overstressed countries in the nonsustainable trend of AET in croplands are Thailand (ETWI = −1.04), Brazil (ETWI = −0.94), Germany (ETWI = −0.79), and China (ETWI = −0.74). On the other hand, Senegal (ETWI = 1.11), Benin (ETWI = 0.23), India (ETWI = 0.21), and Pakistan (ETWI = 0.06) show the most sustainable trend in AET of croplands. Interestingly, developing countries have better conditions than developed countries in terms of the sustainable trend of AET in croplands (Figure 8d).
One of the main sources of water for nonsustainable croplands is groundwater. Richey, et al. [42] characterized global groundwater losses by NASA’s twin GRACE satellites. They classified the 37 largest aquifers of the world based on their groundwater storage trends from 2003 to 2013 [42]. Several overstressed regions shown in Figure 8d are consistent with the overstressed aquifers identified by [42]. North China Aquifer System, Congo Basin, Russian Platform Basins, Atlantic and Gulf Coastal Plains Aquifer, Californian Central Valley Aquifer System and Paris Basin are overstressed aquifers, which also have lower ETWI, which means nonsustainable trend in AET in the croplands. Furthermore, most of these basins are overstressed in terms of groundwater depletion in Wada, et al. [43]. In other words, nonsustainable use of water in croplands of these aquifers might enhance ground water extraction, eventually leading to overstressed aquifers.
4.5. Global Major Crops Changes in AET, PET, PP, and ETWI
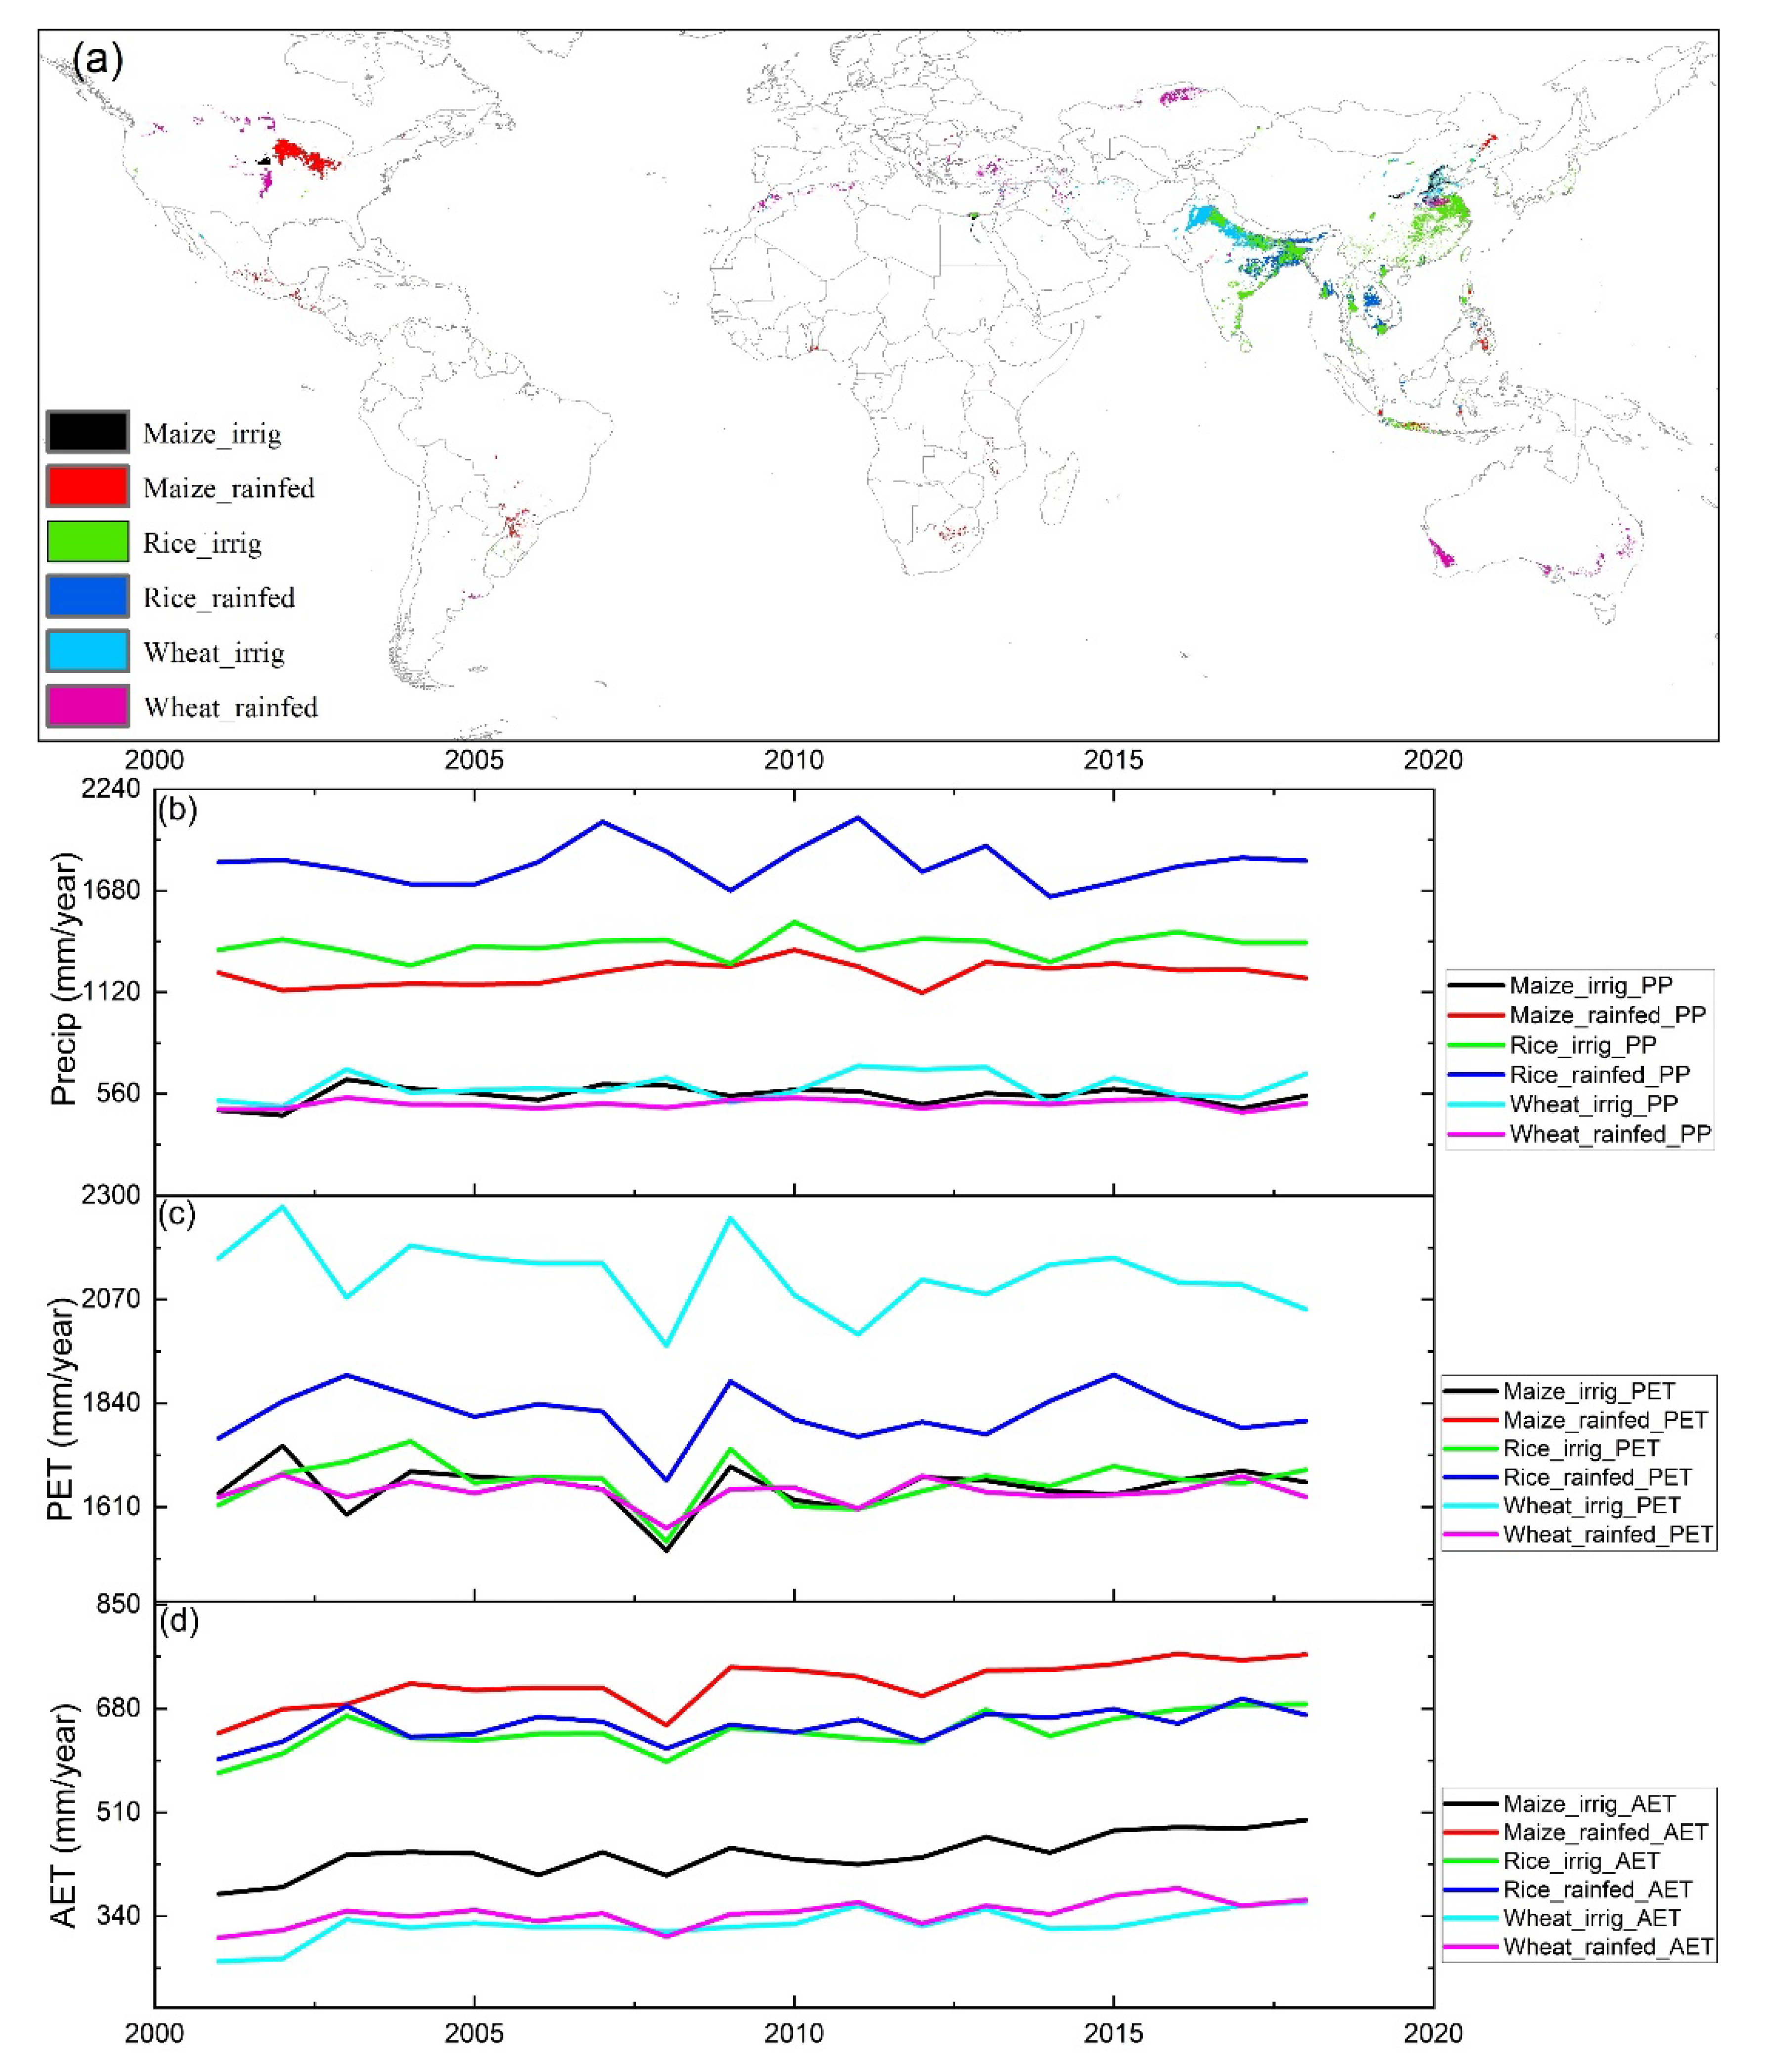
One may expect that trends may not be the same for different crop types. While there is no public global high-resolution gridded data for these crops, here we used a 9.2 km*9.2 km dataset (Table 1) and sharpened the map by applying thresholds to retain grids that mostly contain major crops to avoid large uncertainties in the results. The global major cropland map is shown in Figure 9a. The time series of mean annual values of PP, PET, and AET for these major croplands are demonstrated in Figure 9b–d. Based on Figure 9b, rainfed rice lands are mainly located in high-precipitation areas with more than 1650-mm annual rainfall, which makes sense due to the high need for water for growing rice crops. In contrast, rainfed wheat lands are mostly located in low-precipitation lands with annual precipitation of 500 mm (Figure 9b). Irrigated wheat has higher PET and lower AET among the major crops because the water requirement for this crop is not as much as other major crops (Figure 9c,d). Besides, the year 2008 shows a significant low value of both AET and PET in all major crops (Figure 9c,d). Interestingly, irrigated and rainfed rice AETs are pretty close due to the high water requirement of rice. However, rainfed maize evaporates more water than rice (Figure 9d).
For further checking, the mean annual AET value of each major crops compared with annual crop water needs reported by Food and Agriculture Organization [44]. Based on [44], the approximate annual values of crop water needs of maize, rice, and wheat are 400–800, 450–700, and 400–650 mm, respectively. The mean annual AET showed in Figure 9d is in these ranges for each crop, adding more confidence on the reliability of the analysis.
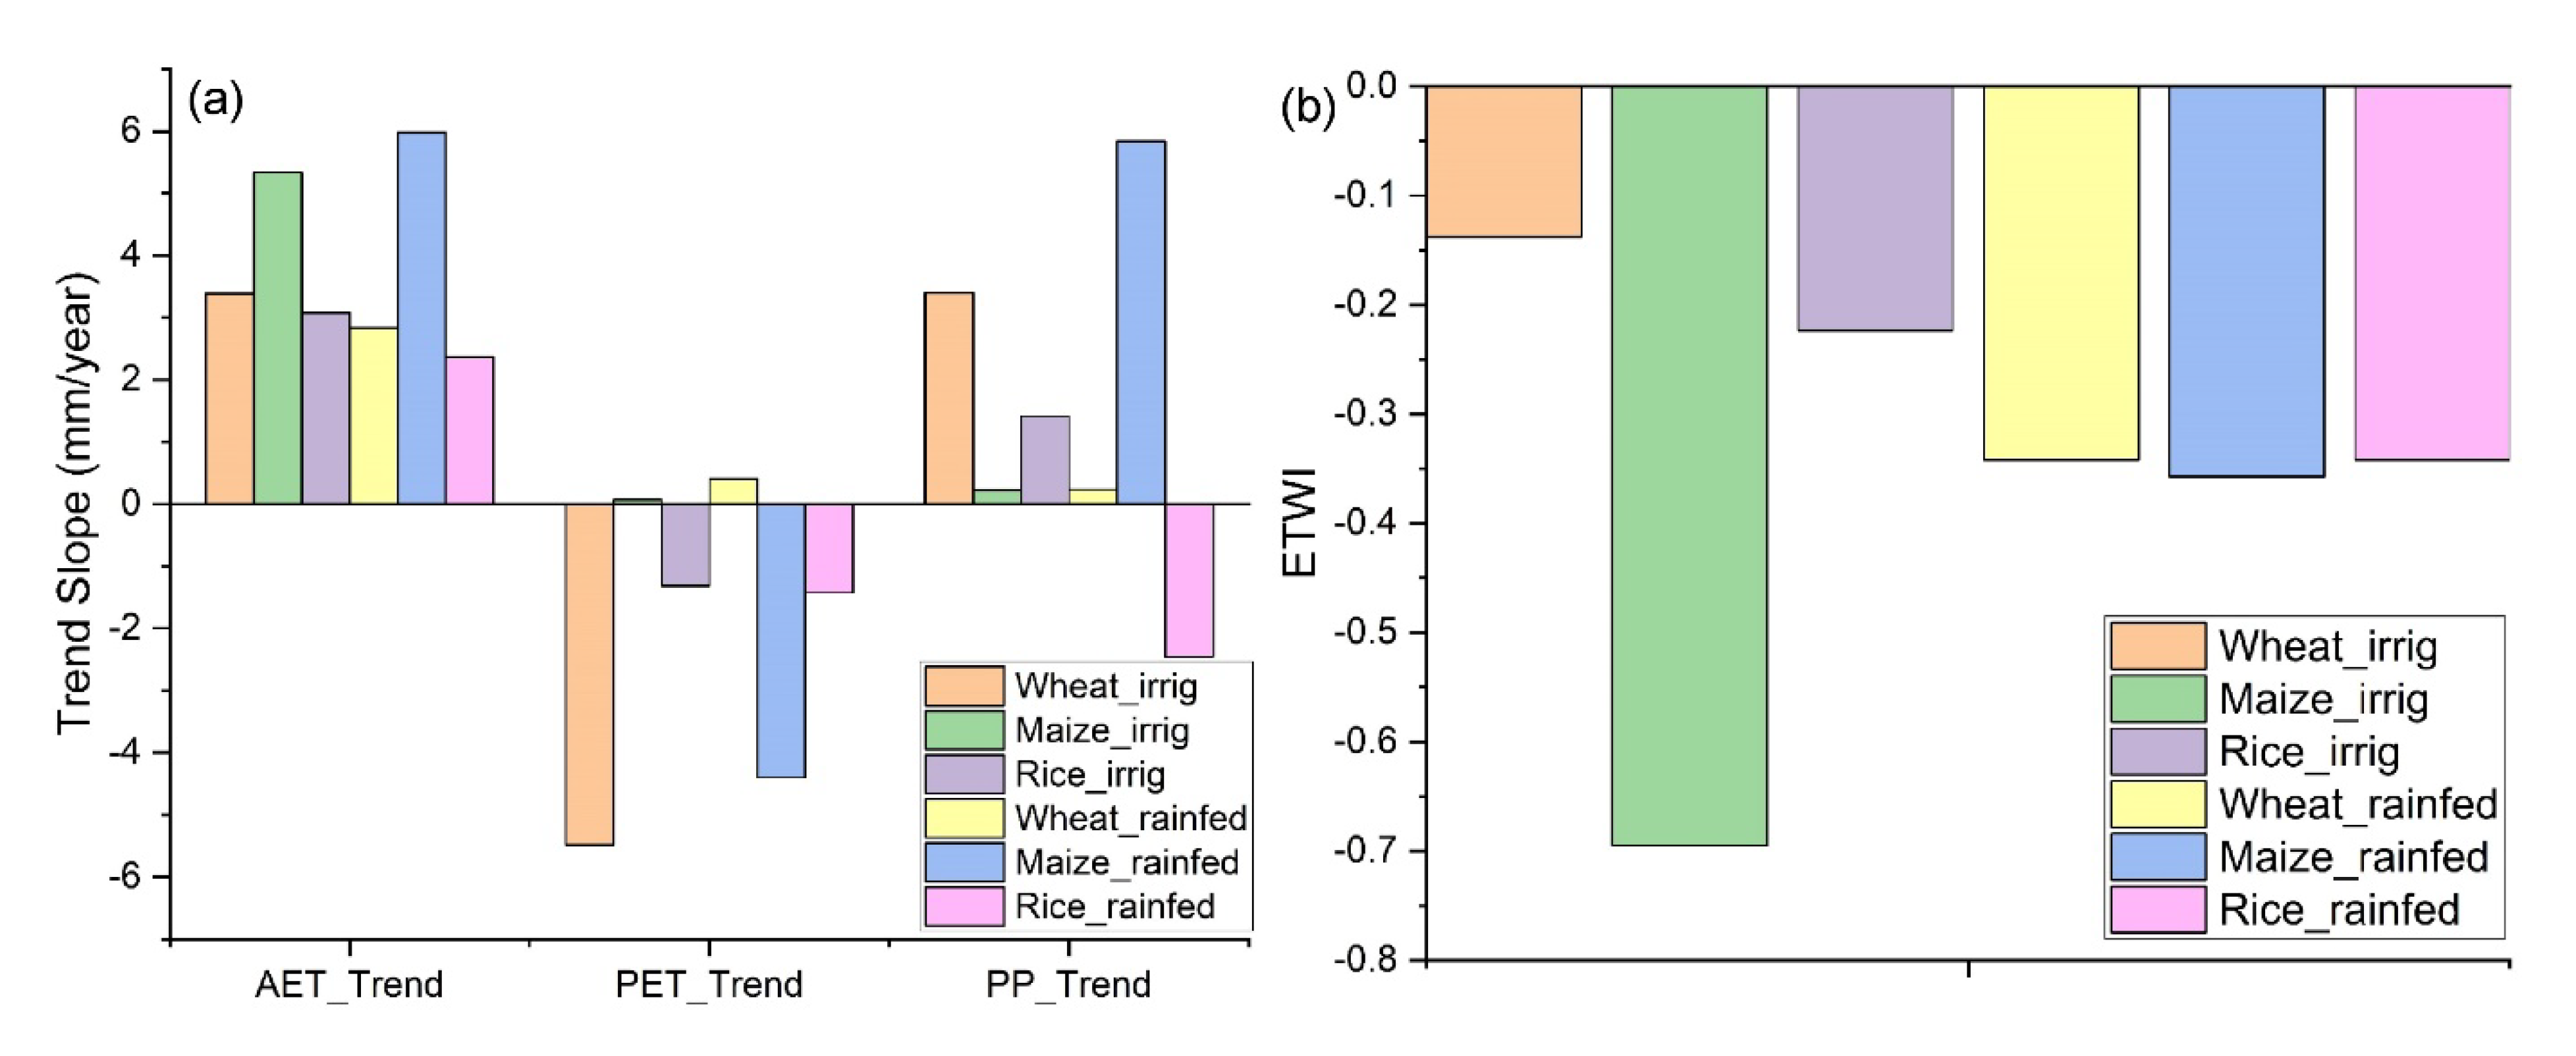
The AET trends in all major crops are significantly positive. In this case, rainfed and irrigated maize show a more increasing trend which is about 6 and 5 mm increase in AET per year respectively (Figure 10a). Surprisingly, most of the major crops demonstrate a decrease in their PET at this time period. Irrigated wheat has a minimum negative trend value than others (Figure 10a). Additionally, most of the major crops except rainfed rice experienced an increasing trend in their precipitation (Figure 10a). By combining all these variables in ETWI, irrigated maize experienced the most non-sustainable trend in AET (Figure 10a).
4.6. Relationship Between SIF and Nonsustainable Use of Water in Croplands
Solar Induced Fluorescence (SIF) can be used as an index of crop productivity [45]. The question is “Whether non-sustainable increase of water use in croplands results in higher productivity or not?”.
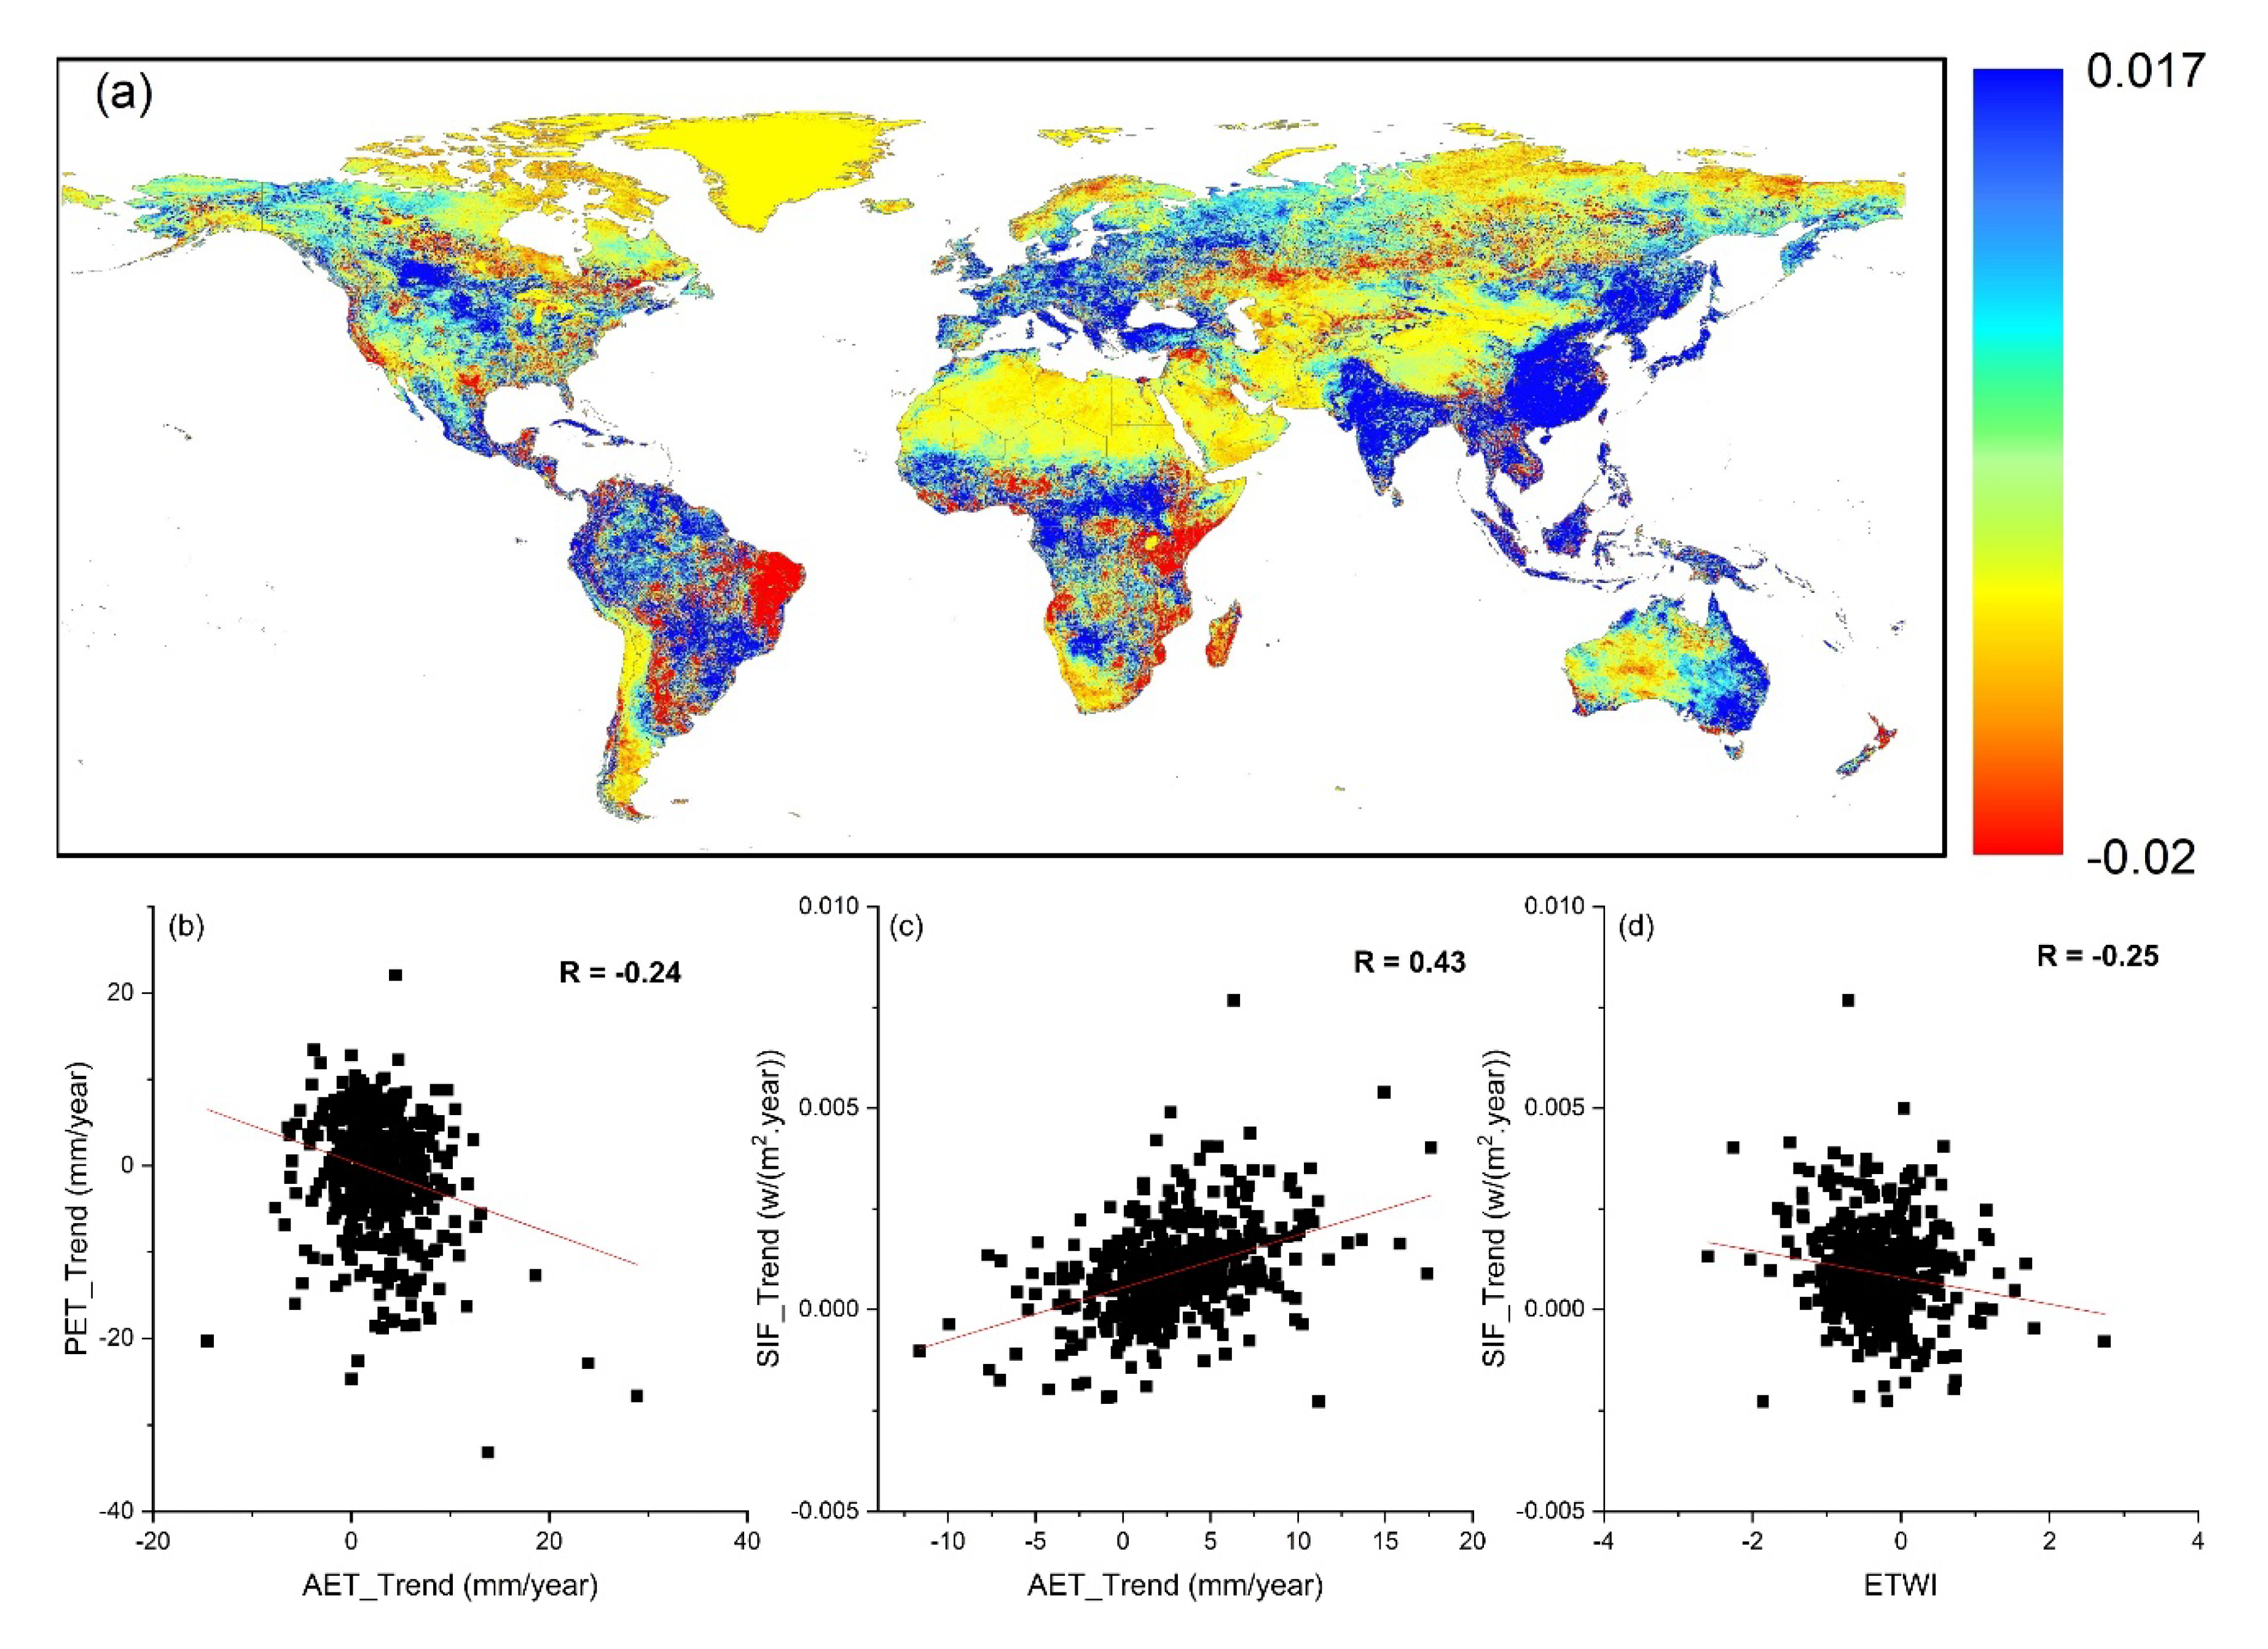
The SIF annual trend is shown in Figure 11a. According to Figure 11a, Southeast Asia and Europe have experienced an increasing trend in SIF. In contrast, SIF in some parts of Central Asia, southwest US and South Africa have decreased during 2001 and 2017.
Correlation analysis shows that in croplands, the AET trend does not necessarily follow the PET trend (Figure 11b, R = −0.24). In other words, irrigation planning has likely done with little or no consideration for changes in climate.
As expected, trends of SIF trend and AET show high correlation in croplands (Figure 11c, R = 0.43).
Interestingly, ETWI, which is an index of sustainability in water use in croplands, does not have a significant relationship with SIF trend (Figure 11d, R = −0.25). According to this result, we can somehow conclude that a nonsustainable increasing trend in AET in croplands may not increase crop productivity in the long term. In other words, increasing water consumption in long-term without considering the climate, does not necessarily increase the crop yield.
4.7. Interactive Application for Monitoring the Annual Values and Trends of AET, PET, and PP Using Google Earth Engine
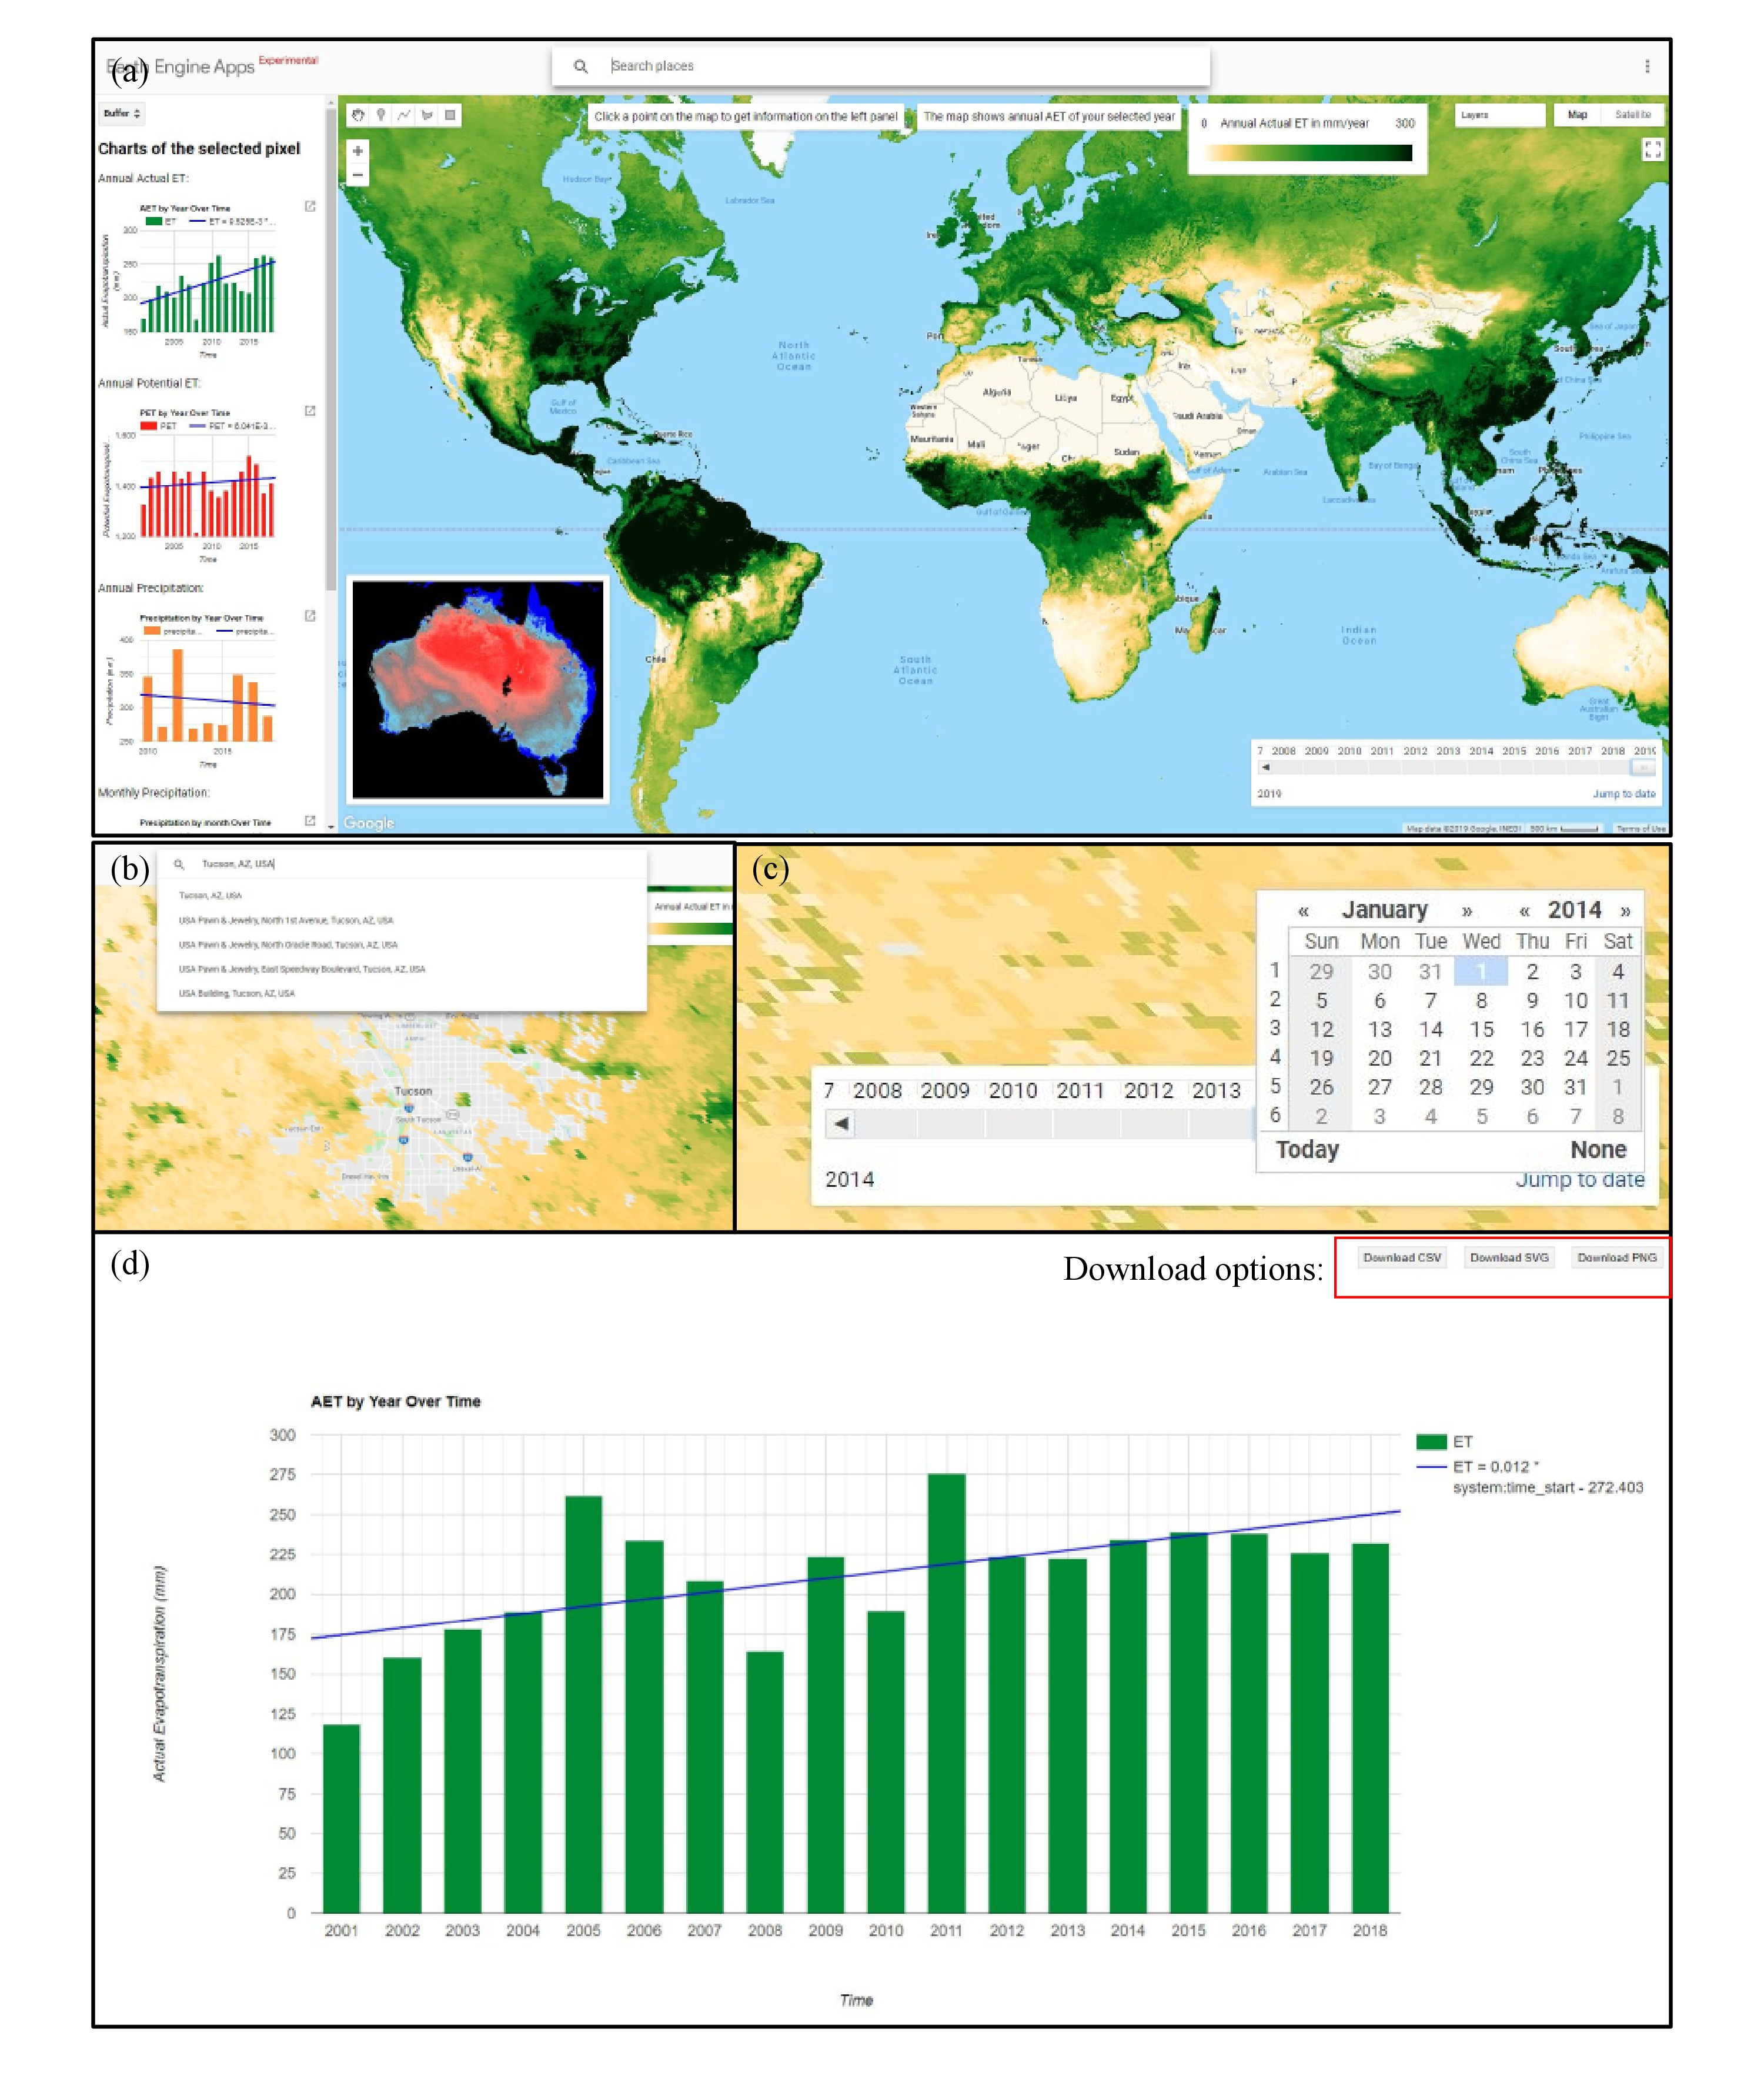
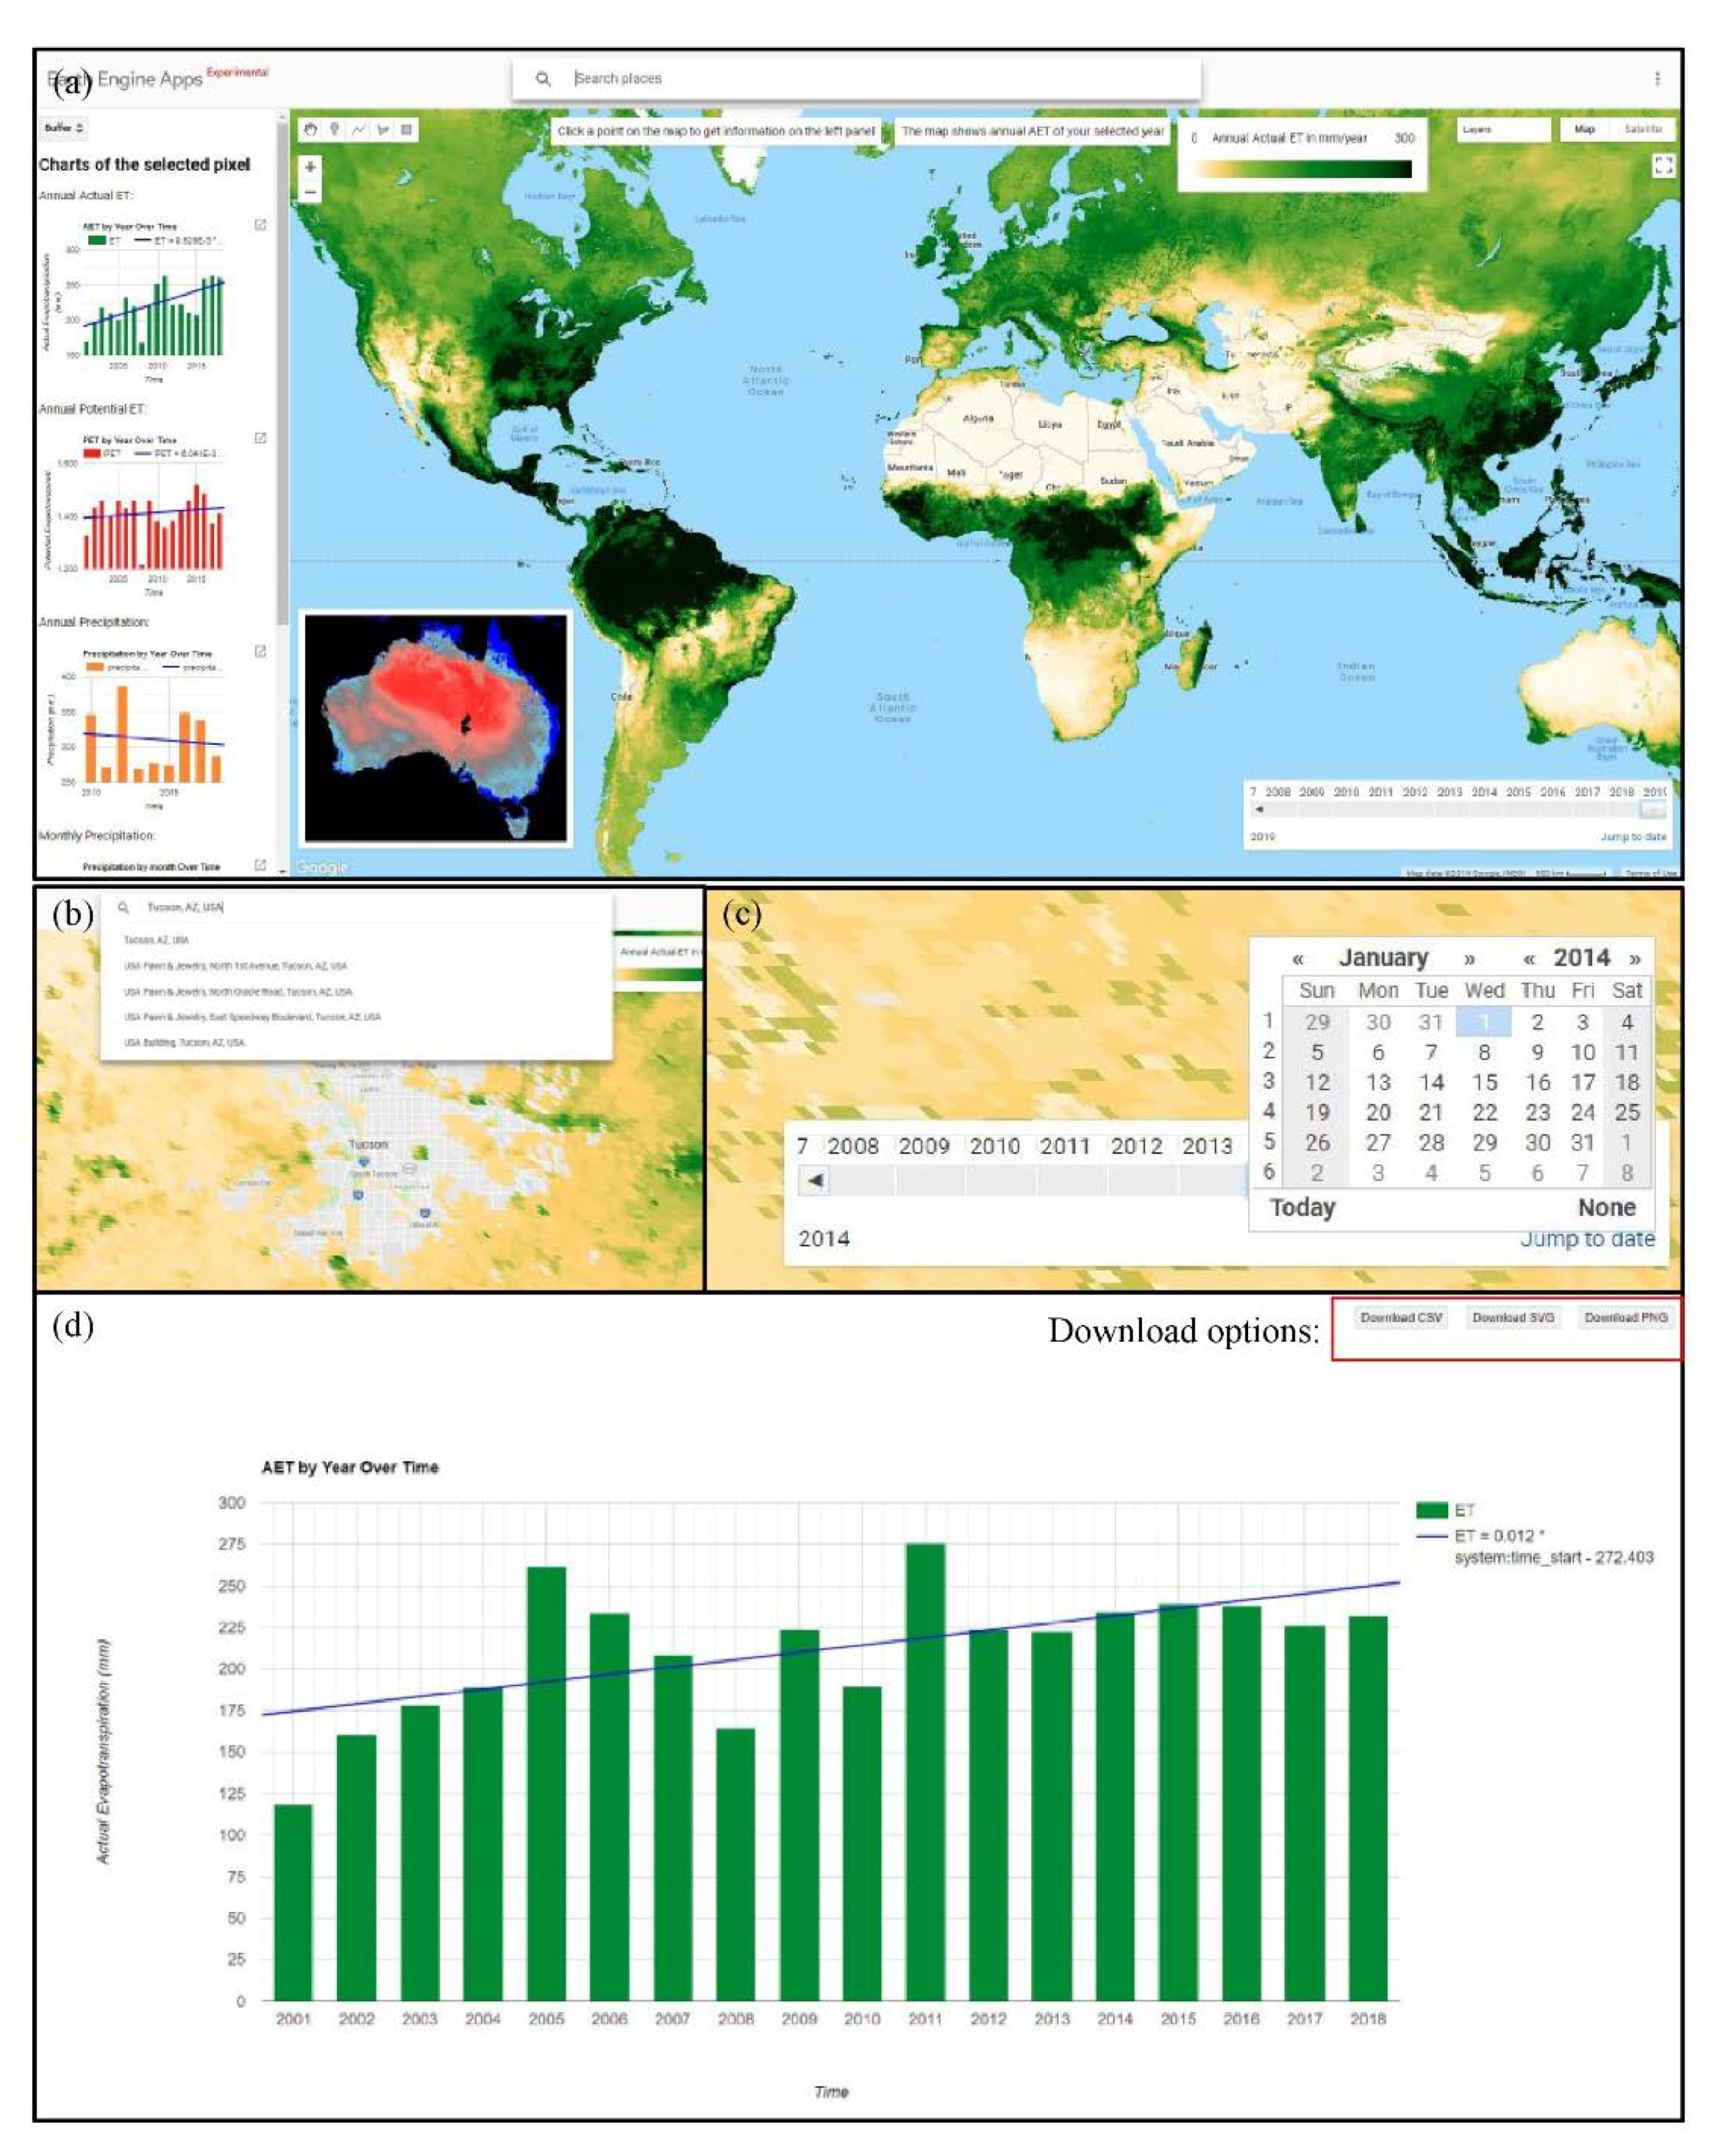
While monitoring of ET and its related variables are crucial for both decision-makers and scientists, there is not any specific online application for it. In this study which has entirely done by Google Earth Engine, we developed a user-friendly evapotranspiration Trend monitoring (ETM) application that enables users to produce annual AET map for any user-selected year. Furthermore, users can obtain annual trends for AET, PET, PP, and GPP trends, as well as monthly PP trend for any user-selected grid. Furthermore, the app can be used to produce animations (e.g., eight-day changes of AET in Australia in 2018 are animated in the bottom left of the app).
The user interface of the ETM app is shown in Figure 12a. Users can search for a location at the top of the app in any language (Figure 12b). The user is also able to select a year to display its annual actual ET map (Figure 12c). By selecting any point on the map, the charts for the selected pixel will appear in the left panel. Users can also save any chart for the selected pixel in CSV, SVG, and PNG format (Figure 12d).
The application is publicly available through the following link:
5. Conclusions
In this study, global trends in actual ET (AET), potential ET (PET), and precipitation (PP) were estimated within the Goggle Earth Engine cloud computing environment enabling calculation using about 10 TB of data without downloading. Most of the analysis was done in 500-m resolution from 2001 to 2018. The results demonstrate that, while AET has a nonsignificant decreasing trend over natural lands, and it has significantly increased in croplands (+14% ± 5%).
Additionally, we introduce a new index based on a combination of AET, PET, and PP trends aimed at indicating the sustainability of the AET trend, termed the “evapotranspiration warning index (ETWI)”. The introduced index (ETWI) can distinguish between the sustainable and nonsustainable increasing trend of AET. High negative ETWI means the increasing trend in AET is more than PP and PET trend. Therefore, it does not necessarily mean high AET in croplands. The ETWI is not designed for investigating the sustainability in irrigation. It has been introduced for exploring the sustainability of the AET trend in water balance. The region that experienced an increase in AET due to any reason could lead to stress in the water balance of that region, because the outputs from that region would be more than the input of it. Despite that, ETWI can still give us some information about irrigation plans in general. The average ETWI for global croplands is −0.40 (± 0.25), which shows an extreme trend in AET which overwhelmed both PET and PP. The results demonstrated that “ETWI < −0.5” is very nonsustainable. In contrast, “ETWI > +0.5” is very sustainable in terms of the AET trend.
Furthermore, the AET, PET, and PP trends in water and energy-limited areas were demonstrated at a global scale. While AET and PET do not have significant trends in both water and energy-limited areas, the increasing trend of PP in energy-limited areas is more than water-limited areas. The higher trend of PP in energy-limited areas show that the available water in water-limited areas is decreasing in comparison to energy-limited areas. Furthermore, defining more classes for water and energy limited areas demonstrated that PP/PET between 0.5 and 1 experienced more stress than other regions. Stated differently, semi-arid regions are more in-danger than arid regions in terms of sustainable trend of AET.
Since the cropland’s water management mainly depends on the internal roles of counties, the trends in croplands and ETWI were averaged in each country to classify them. The most overstressed countries in the nonsustainable trend of AET in croplands were Thailand, Brazil, and Germany, and China. These regions are also experiencing some of the largest increases in NPP and SIF, implying that recent increases in food production may not be sustainable. In contrast, Senegal, Benin, India, and Pakistan demonstrate sustainable trend in AET. It does not mean that these countries are overall sustainable countries in their agriculture; It only means that their AET trends were less than their PP and PET trends in their croplands which means they likely considered climate in their agricultural system by adjusting the output (AET) based on input (PP). Additionally, these countries have significant increasing trends in their PP, which is more important in rainfed agriculture lands, the dominant cropland in these countries.
The trends were calculated for three major croplands of the world, which are maize, wheat, and rice in both irrigated and rainfed agriculture. In terms of AET, rainfed and irrigated maize show a more increasing trend, which is about 6 and 5 mm, increase in AET per year, respectively. Interestingly, most of the major crops demonstrate a decrease in their PET during this time period. Irrigated wheat has the most significant negative trend in PET value than others. Additionally, most of the major crops except rainfed rice experienced an increasing trend in their precipitation. By combining all these variables in ETWI, irrigated maize experienced the most nonsustainable trend in AET (Figure 8b).
The solar-induced fluorescence (SIF) annual trend analysis demonstrates that a nonsustainable increasing trend in AET in croplands cannot increase crop productivity in the long-term. In other words, overirrigation even from groundwater or other sources without considering climate change may not increase crop yield in the long-term due to imbalance between demand and supply.
In this study we also designed a user-friendly interactive application in Google Earth Engine that provides an annual AET map for user-selected year. Additionally, it provides annual AET trend, annual PET trend, annual PP trend, monthly PP trend, and annual GPP trend for user-selected pixels.
In a warming climate, arid and semi-arid regions are going through significant changes due to the combination of natural responses and anthropogenic activities (e.g., surface and groundwater extraction for agriculture, etc.). This heightens the need for more accurate measurements of regional water and energy cycle components for the planning, prediction, and mitigation of negative social and environmental aspects of such changes. ET has remained one of the mostly poor measured components of water and the energy cycle in most regions of the world. Furthermore, diurnal cycle of ET in croplands is the other important information for scientists that has been missed by most of the satellite ET products. It is hoped that the new generation of instruments (e.g., ECOSTRESS [46], among others) can provide a more reliable estimate of ET regionally and globally, which is more accurate for ET trend analysis in the future.
Author Contributions
Conceptualization, M.J. and A.B.; methodology, M.J.; programming, M.J.; formal analysis, M.J., A.B., W.K.S., and J.B.F.; investigation, M.J., A.B., W.K.S., and J.B.F.; resources, M.J., A.B., W.K.S., and J.B.F.; data curation, M.J., A.B., W.K.S., and J.B.F.; writing—original draft preparation, M.J., A.B., W.K.S., and J.B.F.; writing—review and editing, M.J., A.B., W.K.S., and J.B.F.; visualization, M.J.; supervision, A.B., W.K.S., and J.B.F.; project administration, A.B.; funding acquisition, A.B., W.K.S., and J.B.F. All authors have read and agreed to the published version of the manuscript.
Funding
Partial financial support was made available from the University of Arizona Earth Dynamics Observatory, funded by the office of Research, Innovation & Impact.
JBF contributed to this work at the Jet Propulsion Laboratory, California Institute of Technology, under a contract with the National Aeronautics and Space Administration. California Institute of Technology. Government sponsorship acknowledged. JBF was supported in part by NASA programs: ECOSTRESS, IDS, and SUSMAP. Copyright 2020. All rights reserved.
Conflicts of Interest
The authors declare no conflicts of interest.
References
- Westra, S.; Alexander, L.V.; Zwiers, F.W. Global Increasing Trends in Annual Maximum Daily Precipitation. J. Clim. 2013, 26, 3904–3918. [Google Scholar] [CrossRef] [Green Version]
- Becker, A.; Finger, P.; Meyer-Christoffer, A.; Rudolf, B.; Schamm, K.; Schneider, U.; Ziese, M. A description of the global land-surface precipitation data products of the Global Precipitation Climatology Centre with sample applications including centennial (trend) analysis from 1901-present. Earth Syst. Sci. Data 2013, 5, 71–99. [Google Scholar] [CrossRef] [Green Version]
- Alkama, R.; Decharme, B.; Douville, H.; Ribes, A. Trends in Global and Basin-Scale Runoff over the Late Twentieth Century: Methodological Issues and Sources of Uncertainty. J. Clim. 2011, 24, 3000–3014. [Google Scholar] [CrossRef]
- Milly, P.C.D.; Dunne, K.A.; Vecchia, A.V. Global pattern of trends in streamflow and water availability in a changing climate. Nature 2005, 438, 347–350. [Google Scholar] [CrossRef]
- Dai, A.G. Increasing drought under global warming in observations and models. Nat. Clim. Chang. 2013, 3, 52–58. [Google Scholar] [CrossRef]
- Sheffield, J.; Wood, E.F. Global trends and variability in soil moisture and drought characteristics, 1950–2000, from observation-driven Simulations of the terrestrial hydrologic cycle. J. Clim. 2008, 21, 432–458. [Google Scholar] [CrossRef] [Green Version]
- Fisher, J.B.; Melton, F.; Middleton, E.; Hain, C.; Anderson, M.; Allen, R.; McCabe, M.F.; Hook, S.; Baldocchi, D.; Townsend, P.A.; et al. The future of evapotranspiration: Global requirements for ecosystem functioning, carbon and climate feedbacks, agricultural management, and water resources. Water Resour. Res. 2017, 53, 2618–2626. [Google Scholar] [CrossRef]
- Fisher, J.B.; Whittaker, R.J.; Malhi, Y. ET come home: Potential evapotranspiration in geographical ecology. Glob. Ecol. Biogeogr. 2011, 20, 1–18. [Google Scholar] [CrossRef]
- Oki, T.; Kanae, S. Global Hydrological Cycles and World Water Resources. Science 2006, 313, 1068. [Google Scholar] [CrossRef] [Green Version]
- Mao, J.; Fu, W.; Shi, X.; Ricciuto, D.M.; Fisher, J.B.; Dickinson, R.E.; Wei, Y.; Shem, W.; Piao, S.; Wang, K.; et al. Disentangling climatic and anthropogenic controls on global terrestrial evapotranspiration trends. Environ. Res. Lett. 2015, 10, 094008. [Google Scholar] [CrossRef]
- Jung, M.; Reichstein, M.; Ciais, P.; Seneviratne, S.I.; Sheffield, J.; Goulden, M.L.; Bonan, G.; Cescatti, A.; Chen, J.; de Jeu, R.; et al. Recent decline in the global land evapotranspiration trend due to limited moisture supply. Nature 2010, 467, 951–954. [Google Scholar] [CrossRef] [PubMed]
- Zhang, Y.; Peña-Arancibia, J.L.; McVicar, T.R.; Chiew, F.H.S.; Vaze, J.; Liu, C.; Lu, X.; Zheng, H.; Wang, Y.; Liu, Y.Y.; et al. Multi-decadal trends in global terrestrial evapotranspiration and its components. Sci. Rep. 2016, 6, 19124. [Google Scholar] [CrossRef] [PubMed] [Green Version]
- Anabalón, A.; Sharma, A. On the divergence of potential and actual evapotranspiration trends: An assessment across alternate global datasets. Earth’s Future 2017, 5, 905–917. [Google Scholar] [CrossRef]
- Allen, R.; Pereira, L.; Smith, M. Crop Evapotranspiration. Guidelines for Computing Crop Water Requirements; FAO: Rome, Italy, 1998; Volume 56. [Google Scholar]
- Javadian, M.; Behrangi, A.; Gholizadeh, M.; Tajrishy, M. METRIC and WaPOR Estimates of Evapotranspiration over the Lake Urmia Basin: Comparative Analysis and Composite Assessment. Water 2019, 11, 1647. [Google Scholar] [CrossRef] [Green Version]
- Javadian, M.; Kordi, F.; Tajrishy, M. Evaluation and Comparison of Estimation Methods for Actual Evapotranspiration in the Urmia Lake Basin. Iran. J. Ecohydrol. 2019, 6, 125–136. [Google Scholar] [CrossRef]
- Feng, F.; Li, X.; Yao, Y.; Liu, M. Long-term spatial distributions and trends of the latent heat fluxes over the global cropland ecosystem using multiple satellite-based models. PLoS ONE 2017, 12, e0183771. [Google Scholar] [CrossRef] [Green Version]
- Golian, S.; Javadian, M.; Behrangi, A. On the use of satellite, gauge, and reanalysis precipitation products for drought studies. Environ. Res. Lett. 2019, 14, 075005. [Google Scholar] [CrossRef]
- Javadian, M.; Behrangi, A.; Sorooshian, A. Impact of drought on dust storms: Case study over Southwest Iran. Environ. Res. Lett. 2019, 14, 124029. [Google Scholar] [CrossRef]
- Palmer, W.C. Meteorological Drought; U.S. Weather Bureau: Washington, DC, USA, 1965. [Google Scholar]
- Meyer, S.J.; Hubbard, K.G.; Wilhite, D.A. A Crop-Specific Drought Index for Corn: I. Model Development and Validation. Agron. J. 1993, 85, 388–395. [Google Scholar] [CrossRef]
- Narasimhan, B.; Srinivasan, R. Development and Evaluation of Soil Moisture Deficit Index (SMDI) and Evapotranspiration Deficit Index (ETDI) for Agricultural Drought Monitoring. Agric. For. Meteorol. 2005, 133, 69–88. [Google Scholar] [CrossRef]
- Yao, Y.; Liang, S.; Qin, Q.; Wang, K. Monitoring Drought over the Conterminous United States Using MODIS and NCEP Reanalysis-2 Data. J. Appl. Meteorol. Climatol. 2010, 49, 1665–1680. [Google Scholar] [CrossRef]
- Mu, Q.; Zhao, M.; Kimball, J.S.; McDowell, N.G.; Running, S.W. A Remotely Sensed Global Terrestrial Drought Severity Index. Bulletin of the American Meteorological Society 2012, 94, 83–98. [Google Scholar] [CrossRef] [Green Version]
- Anderson, M.C.; Zolin, C.A.; Sentelhas, P.C.; Hain, C.R.; Semmens, K.; Tugrul Yilmaz, M.; Gao, F.; Otkin, J.A.; Tetrault, R. The Evaporative Stress Index as an indicator of agricultural drought in Brazil: An assessment based on crop yield impacts. Remote Sens. Environ. 2016, 174, 82–99. [Google Scholar] [CrossRef]
- Gorelick, N.; Hancher, M.; Dixon, M.; Ilyushchenko, S.; Thau, D.; Moore, R. Google Earth Engine: Planetary-scale geospatial analysis for everyone. Remote Sens. Environ. 2017, 202, 18–27. [Google Scholar] [CrossRef]
- Mutanga, O.; Kumar, L. Google Earth Engine Applications. Remote Sens. 2019, 11, 591. [Google Scholar] [CrossRef] [Green Version]
- Gao, G.; Chen, D.; Xu, C.-y.; Simelton, E. Trend of estimated actual evapotranspiration over China during 1960–2002. J. Geophys. Res. Atmos. 2007, 112. [Google Scholar] [CrossRef] [Green Version]
- McVicar, T.R.; Roderick, M.L.; Donohue, R.J.; Li, L.T.; Van Niel, T.G.; Thomas, A.; Grieser, J.; Jhajharia, D.; Himri, Y.; Mahowald, N.M.; et al. Global review and synthesis of trends in observed terrestrial near-surface wind speeds: Implications for evaporation. J. Hydrol. 2012, 416–417, 182–205. [Google Scholar] [CrossRef]
- Budyko, M.I. Climate and Life; Academic: New York, NY, USA, 1974. [Google Scholar]
- Mu, Q.; Zhao, M.; Running, S.W. Improvements to a MODIS global terrestrial evapotranspiration algorithm. Remote Sens. Environ. 2011, 115, 1781–1800. [Google Scholar] [CrossRef]
- Penman, H.L.; Keen, B.A. Natural evaporation from open water, bare soil and grass. Proc. R. Soc. Lond. Ser. A Math. Phys. Sci. 1948, 193, 120–145. [Google Scholar] [CrossRef] [Green Version]
- Priestley, C.H.B.; Taylor, R.J. On the Assessment of Surface Heat Flux and Evaporation Using Large-Scale Parameters. Mon. Weather Rev. 1972, 100, 81–92. [Google Scholar] [CrossRef]
- Abatzoglou, J.T.; Dobrowski, S.Z.; Parks, S.A.; Hegewisch, K.C. TerraClimate, a high-resolution global dataset of monthly climate and climatic water balance from 1958–2015. Sci. Data 2018, 5, 170191. [Google Scholar] [CrossRef] [PubMed] [Green Version]
- Friedl, M.; Sulla-Menashe, D. MCD12Q1 MODIS/Terra+Aqua Land Cover Type Yearly L3 Global 500 m SIN Grid V006 [Data set]. DAAC, N.E.L.P., Ed. NASA. 2019. Available online: https://0-doi-org.brum.beds.ac.uk/10.5067/MODIS/MCD12Q1.006 (accessed on 2 March 2020).
- Portmann, F.T.; Siebert, S.; Döll, P. MIRCA2000—Global monthly irrigated and rainfed crop areas around the year 2000: A new high-resolution data set for agricultural and hydrological modeling. Glob. Biogeochem. Cycl. 2010, 24. [Google Scholar] [CrossRef]
- Li, X.; Xiao, J. A Global, 0.05-Degree Product of Solar-Induced Chlorophyll Fluorescence Derived from OCO-2, MODIS, and Reanalysis Data. Remote Sens. 2019, 11, 517. [Google Scholar] [CrossRef] [Green Version]
- Running, S.; Mu, Q.; Zhao, M. MOD17A3H MODIS/Terra Net Primary Production Yearly L4 Global 500 m SIN Grid V006 [Data set]. DAAC, N.E.L.P., Ed. 2015. Available online: https://0-doi-org.brum.beds.ac.uk/10.5067/MODIS/MOD17A3H.006 (accessed on 2 March 2020).
- Didan, K. MOD13A1 MODIS/Terra Vegetation Indices 16-Day L3 Global 500 m SIN Grid V006. DAAC, N.E.L.P., Ed. 2015. Available online: https://0-doi-org.brum.beds.ac.uk/10.5067/MODIS/MOD13A1.006 (accessed on 2 March 2020).
- Müller Schmied, H.; Müller, R.; Sanchez-Lorenzo, A.; Ahrens, B.; Wild, M. Evaluation of Radiation Components in a Global Freshwater Model with Station-Based Observations. Water 2016, 8, 450. [Google Scholar] [CrossRef] [Green Version]
- Smith, W.K.; Dannenberg, M.P.; Yan, D.; Herrmann, S.; Barnes, M.L.; Barron-Gafford, G.A.; Biederman, J.A.; Ferrenberg, S.; Fox, A.M.; Hudson, A.; et al. Remote sensing of dryland ecosystem structure and function: Progress, challenges, and opportunities. Remote Sens. Environ. 2019, 233, 111401. [Google Scholar] [CrossRef]
- Richey, A.S.; Thomas, B.F.; Lo, M.-H.; Reager, J.T.; Famiglietti, J.S.; Voss, K.; Swenson, S.; Rodell, M. Quantifying renewable groundwater stress with GRACE. Water Resour. Res. 2015, 51, 5217–5238. [Google Scholar] [CrossRef]
- Wada, Y.; van Beek, L.P.H.; Bierkens, M.F.P. Nonsustainable groundwater sustaining irrigation: A global assessment. Water Resour. Res. 2012, 48. [Google Scholar] [CrossRef]
- Doorenbos, J.; Pruitt, W.; Aboukhaled, A.; Damagnez, J. Crop Water Requirments; Food and Agriculture Organization: Rome, Italy, 1997. [Google Scholar]
- Sun, Y.A.-O.; Frankenberg, C.A.-O.; Wood, J.A.-O.; Schimel, D.S.; Jung, M.; Guanter, L.A.-O.; Drewry, D.A.-O.; Verma, M.A.-O.; Porcar-Castell, A.A.-O.; Griffis, T.A.-O.; et al. OCO-2 advances photosynthesis observation from space via solar-induced chlorophyll fluorescence. Science 2017, eaam5747. [Google Scholar] [CrossRef] [Green Version]
- Hulley, G.; Hook, S.; Fisher, J.; Lee, C. ECOSTRESS, A NASA Earth-Ventures Instrument for studying links between the water cycle and plant health over the diurnal cycle. In Proceedings of the 2017 IEEE International Geoscience and Remote Sensing Symposium (IGARSS), Fort Worth, TX, USA, 23–28 July 2017; pp. 5494–5496. [Google Scholar]
Figure 1.
The workflow of the study. AET: actual evapotranspiration, PET: potential ET, and PP: precipitation rate.
Figure 1.
The workflow of the study. AET: actual evapotranspiration, PET: potential ET, and PP: precipitation rate.

Figure 2.
The trend of (a) actual ET, (b) potential ET, and (c) precipitation; from 2001 to 2018 (mm/year).
Figure 2.
The trend of (a) actual ET, (b) potential ET, and (c) precipitation; from 2001 to 2018 (mm/year).

Figure 3.
Time series of the global annual mean for AET, PET, and PP.

Figure 4.
Time series of the natural lands global annual mean for AET, PET, and PP.

Figure 5.
Time series of the croplands global annual mean for AET, PET, and PP.

Figure 6.
(a) Global energy-limited and water-limited areas in two classes. (b) Energy-limited and water-limited croplands in two classes. (c) Global annual AET. (d) Global annual PET. (e) Global annual PP. (f) croplands’ annual AET. (g) Croplands’ annual PET. (h) Croplands’ annual PP.
Figure 6.
(a) Global energy-limited and water-limited areas in two classes. (b) Energy-limited and water-limited croplands in two classes. (c) Global annual AET. (d) Global annual PET. (e) Global annual PP. (f) croplands’ annual AET. (g) Croplands’ annual PET. (h) Croplands’ annual PP.

Figure 7.
(a) Global energy-limited and water-limited areas in five classes. (b) Energy-limited and water-limited croplands in five classes: (c) global annual AET, (d) global annual PET, (e) global annual PP, (f) croplands’ annual AET, (g) croplands’ annual PET, (h) croplands’ annual PP.
Figure 7.
(a) Global energy-limited and water-limited areas in five classes. (b) Energy-limited and water-limited croplands in five classes: (c) global annual AET, (d) global annual PET, (e) global annual PP, (f) croplands’ annual AET, (g) croplands’ annual PET, (h) croplands’ annual PP.

Figure 8.
Country-based trend-analysis of (a) AET, (b) PET, (c) PP, and (d) ETWI. The panels on the right side show histograms of annual trends in (e) AET, (f) PET, (g) PP, and (h) ETWI derived from the countries included in the analysis.
Figure 8.
Country-based trend-analysis of (a) AET, (b) PET, (c) PP, and (d) ETWI. The panels on the right side show histograms of annual trends in (e) AET, (f) PET, (g) PP, and (h) ETWI derived from the countries included in the analysis.

Figure 9.
Time series of annual AET, PET, and PP averaged over major rainfed and irrigated croplands.
Figure 9.
Time series of annual AET, PET, and PP averaged over major rainfed and irrigated croplands.

Figure 10.
The trend of AET, PET, and PP in global major croplands. (a) trend slope; (b) ETWI.

Figure 11.
(a) SIF global trend from 2001–2017 in w/(m2.year); Relationship between (b) AET trend and PET trend, (c) AET trend and SIF trend, and (d) ETWI and SIF trend (Note that the points are sample of variables in croplands but R-value covers all data).
Figure 11.
(a) SIF global trend from 2001–2017 in w/(m2.year); Relationship between (b) AET trend and PET trend, (c) AET trend and SIF trend, and (d) ETWI and SIF trend (Note that the points are sample of variables in croplands but R-value covers all data).

Figure 12.
(a) Evapotranspiration trend monitoring application user the interface; (b) selecting a location; (c) selecting a date for the ET map on date slider; (d) downloading annual AET, PET, PP and GPP and monthly PP data for a selected grid.
Figure 12.
(a) Evapotranspiration trend monitoring application user the interface; (b) selecting a location; (c) selecting a date for the ET map on date slider; (d) downloading annual AET, PET, PP and GPP and monthly PP data for a selected grid.


Table 1.
Datasets used in the study and their main characteristics.
| Dataset | Spatial Resolution | Temporal Resolution | Spatial Coverage | Temporal Coverage | References |
|---|---|---|---|---|---|
| MODIS AET | 500 m*500 m | 8-days | 80°N-60°S | 2001-Present | Mu, Zhao and Running [31] |
| MODIS PET | 500 m*500 m | 8-days | 80°N-60°S | 2001-Present | Mu, Zhao and Running [31] |
| TerraClimate PP | 4 km*4 km | Monthly | Global lands | 1958-Present | Abatzoglou, Dobrowski, Parks and Hegewisch [34] |
| MODIS landcover | 500 m*500 m | Yearly | Global lands | 2000–2018 | Friedl and Sulla-Menashe [35] |
| MIRCA2000 (Major croplands) | 9.2 km*9.2 km | - | Global lands | - | Portmann, Siebert and Döll [36] |
| GOSIF Solar Induced Fluorescence (SIF) | 0.05°*0.05° | Yearly | Global lands | 2001–2017 | Li and Xiao [37] |
| MODIS Gross Primary Product | 500 m*500 m | Yearly | Global lands | 2001-Present | Running, Mu and Zhao [38] |
| Palmer Drought Severity Index (PDSI) | 4 km*4 km | Monthly | Global lands | 1958-Present | Abatzoglou, Dobrowski, Parks and Hegewisch [34] |
| MODIS Normalized Difference Vegetation Index (NDVI) | 500 m*500 m | 16-days | 80°N-60°S | 2001-Present | Didan [39] |
| MODIS Enhanced Vegetation Index (EVI) | 500 m*500 m | 16-days | 80°N-60°S | 2001-Present | Didan [39] |
© 2020 by the authors. Licensee MDPI, Basel, Switzerland. This article is an open access article distributed under the terms and conditions of the Creative Commons Attribution (CC BY) license (http://creativecommons.org/licenses/by/4.0/).
Share and Cite
MDPI and ACS Style
Javadian, M.; Behrangi, A.; Smith, W.K.; Fisher, J.B. Global Trends in Evapotranspiration Dominated by Increases across Large Cropland Regions. Remote Sens. 2020, 12, 1221. https://0-doi-org.brum.beds.ac.uk/10.3390/rs12071221
AMA Style
Javadian M, Behrangi A, Smith WK, Fisher JB. Global Trends in Evapotranspiration Dominated by Increases across Large Cropland Regions. Remote Sensing. 2020; 12(7):1221. https://0-doi-org.brum.beds.ac.uk/10.3390/rs12071221
Chicago/Turabian StyleJavadian, Mostafa, Ali Behrangi, William Kolby Smith, and Joshua B. Fisher. 2020. "Global Trends in Evapotranspiration Dominated by Increases across Large Cropland Regions" Remote Sensing 12, no. 7: 1221. https://0-doi-org.brum.beds.ac.uk/10.3390/rs12071221
Note that from the first issue of 2016, this journal uses article numbers instead of page numbers. See further details here.