An Overview of Platforms for Big Earth Observation Data Management and Analysis


1
C4ISR Division, Institute for Advanced Studies (IEAv), São José dos Campos, SP 12228-001, Brazil
2
Image Processing Division, National Institute for Space Research (INPE), São José dos Campos, SP 12227-010, Brazil
*
Authors to whom correspondence should be addressed.
Remote Sens. 2020, 12(8), 1253; https://0-doi-org.brum.beds.ac.uk/10.3390/rs12081253
Submission received: 15 March 2020
/
Revised: 2 April 2020
/
Accepted: 6 April 2020
/
Published: 16 April 2020
(This article belongs to the Special Issue Spatial Data Infrastructures for Big Geospatial Sensing Data)
Abstract
:In recent years, Earth observation (EO) satellites have generated big amounts of geospatial data that are freely available for society and researchers. This scenario brings challenges for traditional spatial data infrastructures (SDI) to properly store, process, disseminate and analyze these big data sets. To meet these demands, novel technologies have been proposed and developed, based on cloud computing and distributed systems, such as array database systems, MapReduce systems and web services to access and process big Earth observation data. Currently, these technologies have been integrated into cutting edge platforms in order to support a new generation of SDI for big Earth observation data. This paper presents an overview of seven platforms for big Earth observation data management and analysis—Google Earth Engine (GEE), Sentinel Hub, Open Data Cube (ODC), System for Earth Observation Data Access, Processing and Analysis for Land Monitoring (SEPAL), openEO, JEODPP, and pipsCloud. We also provide a comparison of these platforms according to criteria that represent capabilities of the EO community interest.

1. Introduction
Nowadays, Earth observation (EO) data play a crucial role in understanding processes on our planet, enabling us to make great strides in monitoring environmental change, risk detection and urban occupation analysis [1,2]. Based on information extracted from EO data, researchers and decision-makers are able to conceive and apply effective policies for environment protection and sustainable management of natural resources.
In recent years, the amount of EO data freely available for society and researchers has quite increased, driven by technological advances and open data policies adopted by governments and space agencies. Only in 2019, the volume of open data produced by Landsat-7 and Landsat-8, MODIS (Terra and Aqua units), and the three first Sentinel missions (Sentinel-1, -2 and -3) is around 5 PB [3]. These big data sets often exceed the memory, storage and processing capacities of personal computers; imposing severe limits that lead users to take advantage of only a small portion of the available data for scientific research and operational applications [2,4,5]. Thus, there is a need for novel technological solutions to properly store, process, disseminate and analyze these big EO data sets.
A Spatial Data Infrastructure (SDI) is a platform that facilitates the interface between people and systems in the exchanging and sharing of spatial data, including EO information, by providing required technologies, policies and standards [6]. SDI as a sharing platform aims to facilitate the access and integration of multi-source spatial data inside a framework with a number of technological components. In the last years, traditional SDIs have been built based on standards to represent and store spatial information in data files (e.g., GeoTIFF and Esri Shapefile) and database systems (e.g., PostGIS and Oracle Spatial), as well as to serve spatial data, metadata and processes via web services, such as Web Map Service (WMS), Web Feature Service (WFS), Web Coverage Service (WCS), Catalog Service for Web (CSW) and Web Coverage Processing Service (WCPS). These standards proposed by Organization for Standardization (ISO) and the Open Geospatial Consortium (OGC) [7] are essential to enable the spatial data interoperability among SDIs from worldwide agencies and institutions. Although there are ISO and OGC web services that allow data processing in the server side such as WCPS, most current SDIs on regional, national, and international levels are focused on EO data sharing and dissemination in the form of individual files, through HTTP, FTP and SSH protocols, web services for data access and web portals [8].
In the current era of big spatial and EO data, there is a need for a next generation of SDIs able to properly deal with this vast amount of data [9,10,11,12]. To take advantage of all potential of this era, users need to handle hundreds (or thousands) of EO data files, of different spectral, temporal and spatial resolutions, by using or developing software scripts to extract information of interest. To meet these demands, novel technologies have been proposed and developed, based on cloud computing and distributed systems.
According to Merticariu et al. [13], Array Database Management Systems (Array DBMS) have set out to fill an important gap in storage and management of EO data represented as regular and multidimensional arrays, such as satellite images. Unlike Relational Database Management Systems (RDBMS), which are based on the concept of relations (or tables) and relational algebra, Array DBMS are centered on multidimensional arrays. Examples of Array DBMS are RasDaMan [14], SciDB [15] and TileDB [16]. Most array DBMS have the capability to split large arrays into indexed blocks or chunks that are stored and shared among multiple computers to improve efficiency and performance. Besides that, they provide their own query language for multidimensional arrays, such as RasDaMan RasQL, SciDB AFL (Array Functional Language) and AQL (Array Query Language).
Another approach that has been explored for managing and handling big EO data is MapReduce systems. Traditionally, high-performance computing systems separate compute nodes and storage nodes, which are interconnected with high-speed links to meet data access requirements. However, the capacity of these high-speed links is still less than the aggregate bandwidth of all compute nodes [17]. In parallel data systems such as Google File System (GFS) [18] and Hadoop Distributed File System (HDFS) [19], clusters are built from standard servers and each node takes on both compute and storage functions. In these systems, data location stands out as a significant advantage over traditional systems by leveraging data location and reducing network traffic - one of the bottlenecks in computing applications that handle a large amount of data [17,20,21]. Assis et al. [22] propose an approach to use MapReduce systems for EO satellite image time series analysis. A comparison between Hadoop and SciDB in processing EO satellite images is presented by Camara et al. [5].
Despite these novel technologies addressing issues of storage and access, an increasing number of applications have reached data volumes and acquisition speeds that make it impossible to move data to local systems for processing and analysis [11,23]. The Moving Code paradigm stands out as an alternative in this scenario. In this approach, the executable application (or source code) is sent to run on the servers where the data is located, avoiding data movement [8]. To properly deal with big EO data, the next generation of SDIs should provide solutions based on the Moving Code paradigm and the approach to processing data on the server side where data is stored.
Regarding web services protocols that allow EO data processing on the server side, we can cite two examples WCPS proposed by OGC and Web Time Series Service (WTSS). WCPS is an extension of WCS which allows server-side coverage manipulation, extraction, and analysis through a functional language [24]. This language allows the retrieving of one or more server-side coverages and performing of operations on the data. The EarthServer project has a WCPS implementation using the RasDaMan array database as a backend [25]. WTSS is a lightweight web service for time series recovery from big amounts of remote sensing images organized as coverages [26].
Recently, a solution that has facilitated the building of infrastructures based on Moving Code paradigm is the cloud computing environment offered by providers as services, such as Amazon Web Services (AWS) and Microsoft Azure Cloud Services. These environments are often highly scalable and provide developer tools, storage, database, and networking services. Besides providing services for virtual machines and containers, AWS contains several of the most used EO satellite image collections as open data, including Landsat-8, Sentinel-2 and CBERS-4 (Open Data on AWS [27]). Following this trend, the European Commission has financed five systems for cloud computing in the context of DIAS (Data and Information Access Service) [28]: CREODIAS [29], Mundi [30], ONDA [31], WEkEO [32] e Sobloo [33]. These systems provide open EO data from Copernicus program through standard web services and protocols such as OpenSearch, WFS, WMS, WCS e CSW [29,30,31,32,33]. Besides that, these systems allow users to contract on-demand services to store and process EO data sets as well as to directly access these data sets. Similar to AWS, the DIAS systems allow users to execute their applications in a cloud environment where data is stored, avoiding the movement of data through the network and so improving the processing performance.
Although the cloud computing environments such as AWS and DIAS facilitate the high scale processing of EO data, considerable effort and advanced technical knowledge are still required for users to take advantage of these cloud computing environments. In addition to analytical tasks, the EO community scientists and users face challenges to the management of these environment computational resources. Thus, there is a need for user-friendly solutions that provide high-level analytical tools for EO community researchers and users, abstracting the technical issues of these cloud computing environments. The Sentinel Hub platform is an example of this kind of solution [34]. This platform uses the CREODIAS cloud computing services to access and process the Copernicus EO data sets and provide a high-level programming interface that allow users to deal with these data sets without worrying about technical details.
In this context, we define “Platforms for big EO Data Management and Analysis” as computational solutions that provide functionalities for big EO data management, storage and access; that allow the processing on the server side without having to download big amounts of EO data sets; and that provide a certain level of data and processing abstractions for EO community users and researchers. These platforms integrate different kinds of technologies, Application Programming Interfaces (API) and web services to provide a more complete solution for big EO data management and analysis. Based on this definition, this paper presents an overview of seven platforms and a comparison among their functionalities—Google Earth Engine (GEE) [35], Sentinel Hub (SH) [34], Open Data Cube (ODC) [36], System for Earth Observation Data Access, Processing and Analysis for Land Monitoring (SEPAL) [37], OpenEO [38], JEODPP [3], and pipsCloud [39]. These platforms have close purposes but use different storage systems, access interfaces and abstractions for EO data sets.
This paper is organized as follows—in Section 2, we present an overview of the platforms where their main functionalities and technical issues are described. In Section 3, ten capabilities of the EO community interest are presented and used to compare the platforms presented. Finally, in Section 4, we discuss the platforms that stand out in the evaluated capabilities, the challenges in building a platform that fully meets the evaluated capabilities, and the new trends in these technologies.
2. Platforms for Big Earth Observation Data Management and Analysis
This section presents the features, available functionality, and technical details of the seven platforms evaluated in this paper. The questions that are addressed about each platform in this section are—(i) who support?; (ii) how is it made available?; (iii) what is the software architecture?; (iv) how is the data stored?; (v) how is the data processed?; (vi) how is the data made available?; (vii) what are the data abstractions used?; (viii) is it possible to extend the platform?; and (ix) is there support for reproducible science?
2.1. Google Earth Engine
Google Earth Engine (GEE) is a cloud-based platform that enables large-scale scientific analysis and visualization of geospatial data sets. GEE was launched in 2010 by Google as a proprietary system. Currently, it is available to users as a free service for small and medium workloads, using a business model similar to the other cloud-based services of the company.
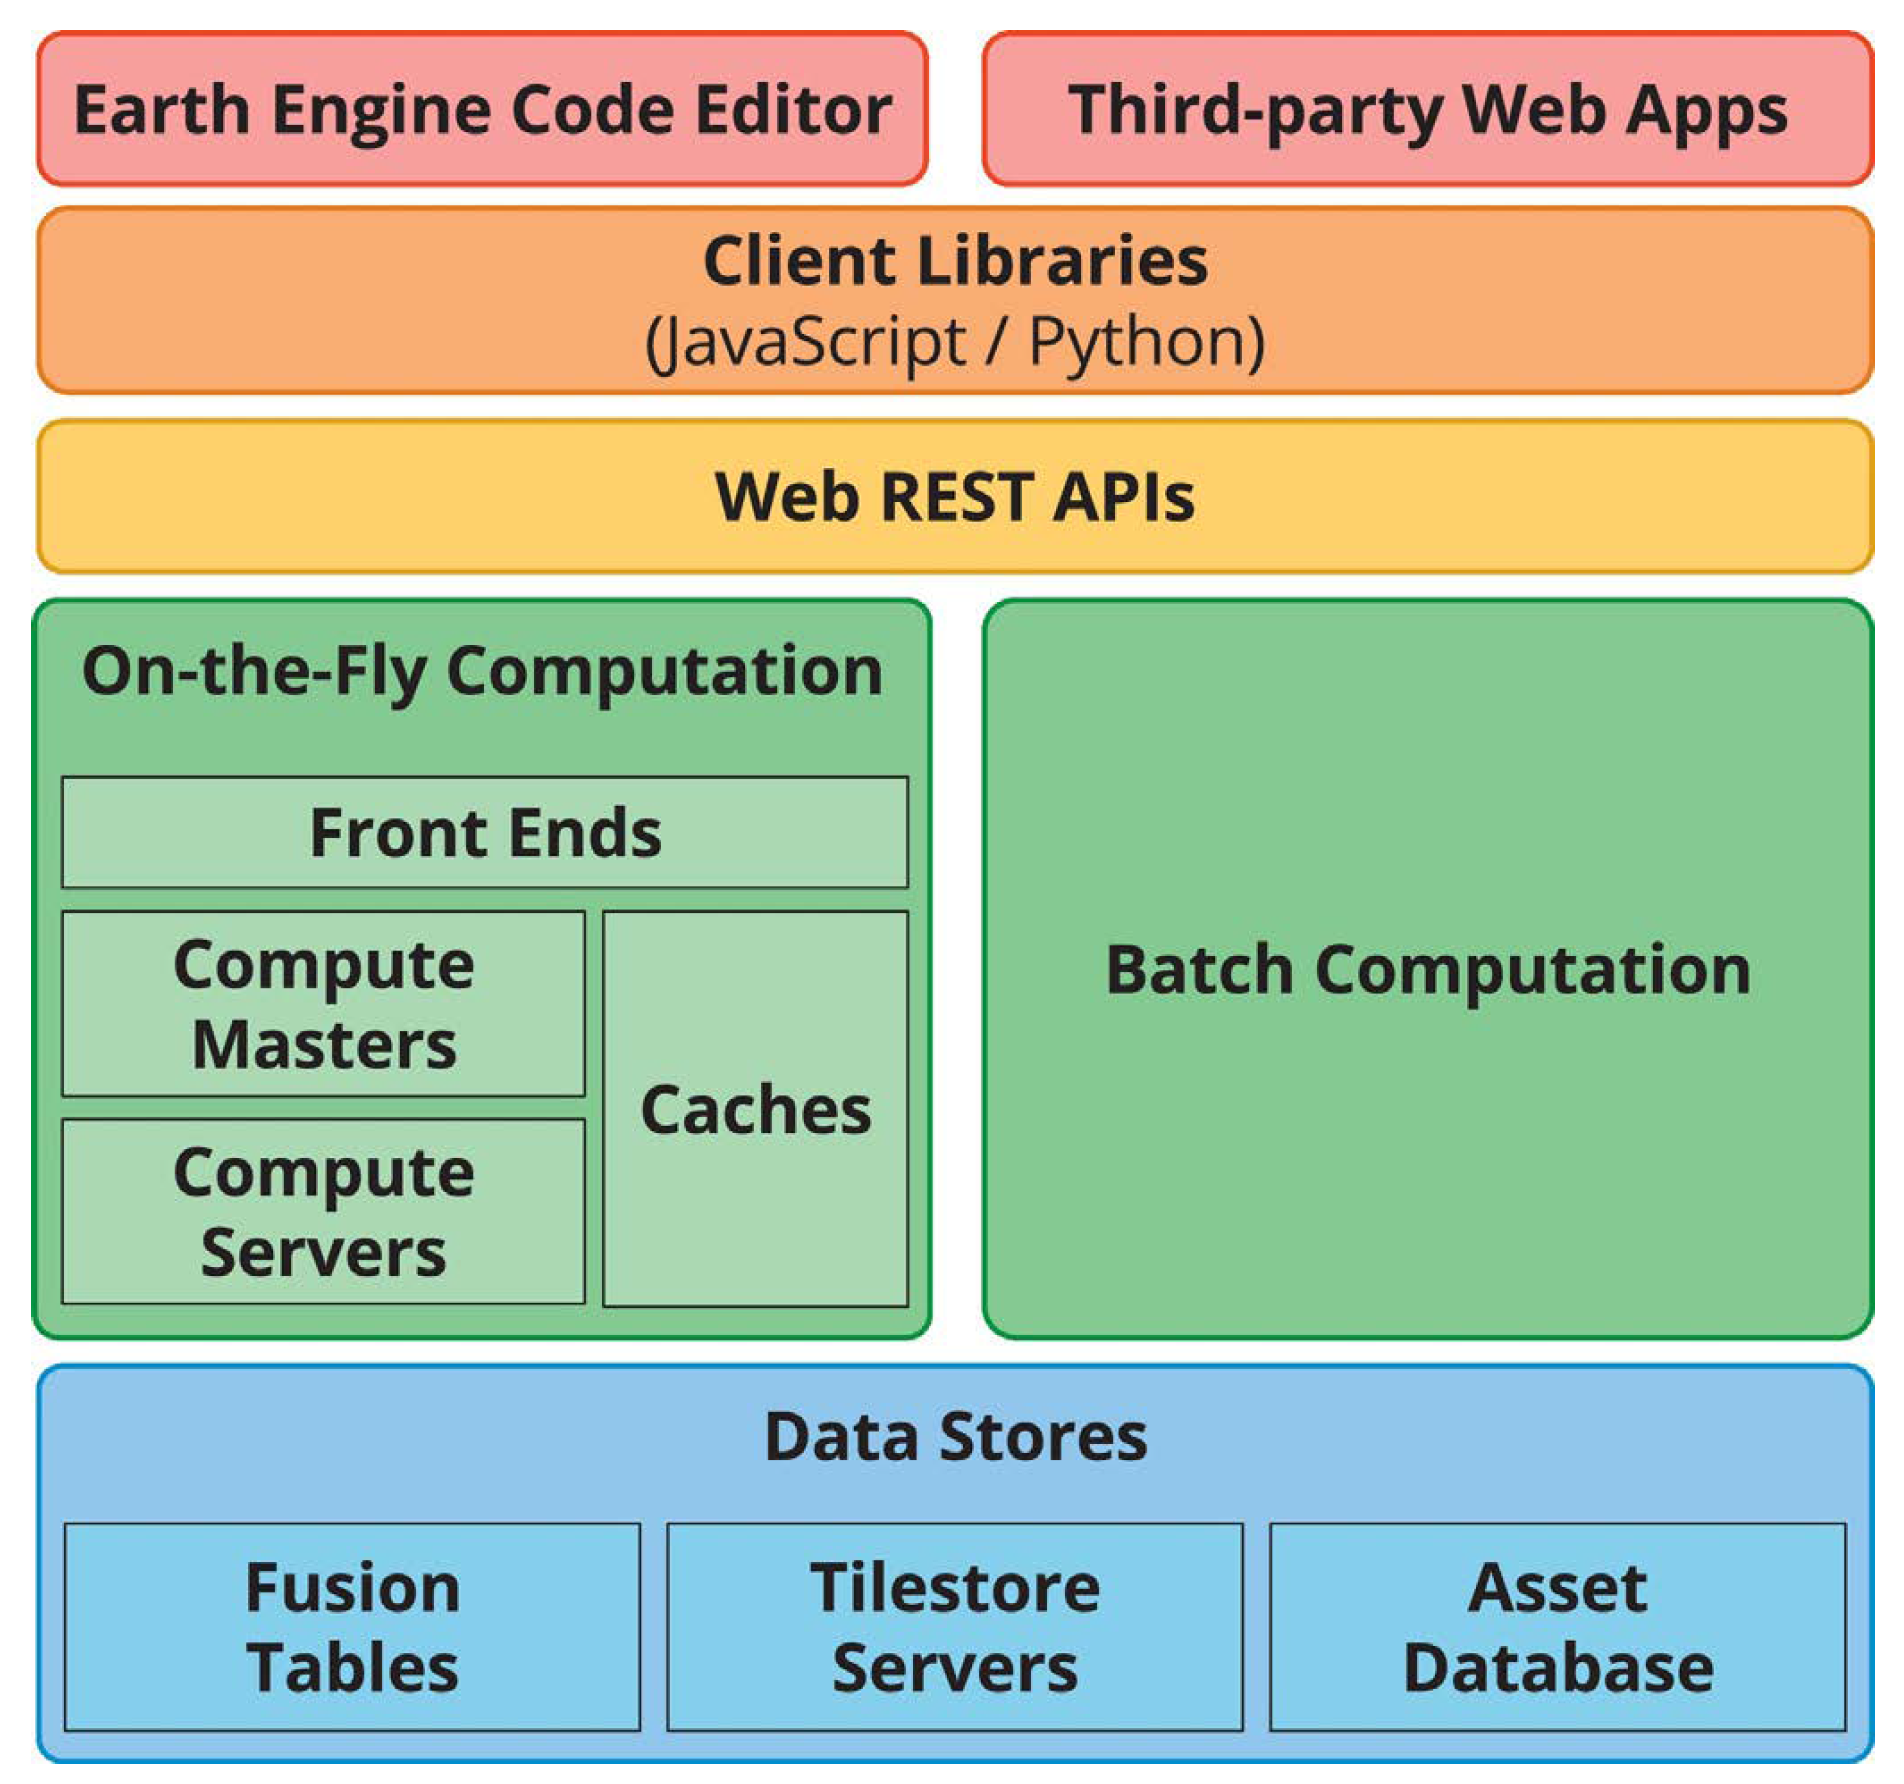
This platform is built from a collection of technologies available on Google’s infrastructure, such as the large-scale computer cluster management system (Borg), the distributed databases (Bigtable and Spanner), the distributed file system (Colossus) and the parallel pipeline execution framework FlumeJava, as depicted in Figure 1 [35].
GEE provides a JavaScript API and a Python API for data management and analysis. For the JavaScript version, a web Integrated Development Environment (IDE) (https://code.earthengine.google.com) is also provided, where the user has easy access to available data, applications and real-time visualization of the processing results. The Python API is available through a module and has a structure similar to its JavaScript version.
This platform provides a data catalog that stores a large repository of geospatial data, including optical imagery of a variety of satellites and air systems, environmental variables, weather, and climate forecasts, land cover, socioeconomic and topographic datasets. Before being made available, these data sets are preprocessed, enabling efficient access and removing many barriers associated with data management [35].
GEE uses four object types to represent data that can be manipulated by its API. The Image type represents raster data that can consist of one or more bands, which contain a name, data type, scale, and projection. A stack or a time series of Images is represented by the ImageCollection type. GEE represents vector data through the Feature type. This type is represented by a geometry (point, line, or polygon) and a list of attributes. The FeatureCollection type represents groups of related Features and provides functions to manipulate this data, such as sorting, filtering, and visualization.
To process and analyze data available in the GEE public catalog or data from the user’s private repository, GEE provides an operator library for the object types listed above. These operators are implemented in a parallel processing system that automatically splits the computation so that it can be performed in a distributed environment.
In the GEE approach, objects handled via JavaScript or Python represent proxies for data stored in Google’s infrastructure. When a new object is generated as a result of some operation, the locally stored object has the description of the operation and the addresses of the input objects of the operation. Processing only occurs when there is an output (visualization or writing) of the object produced for computation. This lazy computation mode allows the processing of only some parts of the data that actually produce the required output.
The result of a GEE processing can be viewed in the web IDE or saved in one of three company services—Drive, Cloud Storage or Assets. GEE uses a Tiles server to make data available to the web interface efficiently. However, this service is not explicitly provided and so users cannot integrate it into other applications.
As a computing system with shared resources among users, GEE imposes limits on the iterative usage mode (On-the-Fly Computation box in Figure 1), where execution takes place in real-time. The limits are on the maximum duration of each request, the maximum number of simultaneous requests per user and the maximum execution of operations considered costly, such as spatial aggregations. Processing beyond thresholds is possible through the batch computing mode (Batch Computation box in Figure 1) [35]. For data-intensive processing or compute-intensive analytics, there is currently a need to make a request to Google.
The Google Earth Engine library has over 800 functions for handling big EO data sets. Despite this large number of builtin functions, these functions are close and users can not update or extend their basic functionalities. While GEE provides a friendly environment for scientists, the implementation of procedures that are not available through the GEE API functions requires significant user effort [40]. Besides that, GEE only offers programming interfaces that support pixel-based processing, and there are natively no region-based methods such as image segmentation or large-scale time series analysis.
The characteristics of GEE have motivated its use by the EO community researchers. There are, for example, studies using this platform for urban area assessment [41] and evaluations of the performance of algorithms available in the platform for the classification of agricultural crops [40].
One facility that GEE provides to users is the capability to share their scripts and assets with other users of the platform. Nevertheless, it is important to keep in mind that these scripts use algorithms implemented internally by the platform and that these algorithms are close and can not be extended on the server side. Therefore, GEE can not guarantee that an analysis performed on the platform can be reproduced in the future, since these internal algorithms can be changed or discontinued by the platform at any time [42].
The GEE terms of service guarantee users the intellectual property of their codes and data as well as that the company will not use such information for purposes other than what is necessary to provide the service to the user [42].
2.2. Sentinel Hub
Sentinel Hub (SH) is a platform developed by Sinergise that provides Sentinel data access and visualization services. This is a private platform with public access (https://www.sentinel-hub.com). Unlike Google Earth Engine, SH limits access to functionality in different payment plans. The free plan only allows viewing, selection and downloading of raw data. Paid access enables data access through OGC protocols and a specific API, data processing, mobile application data access, higher resource access limits, and technical support [34].
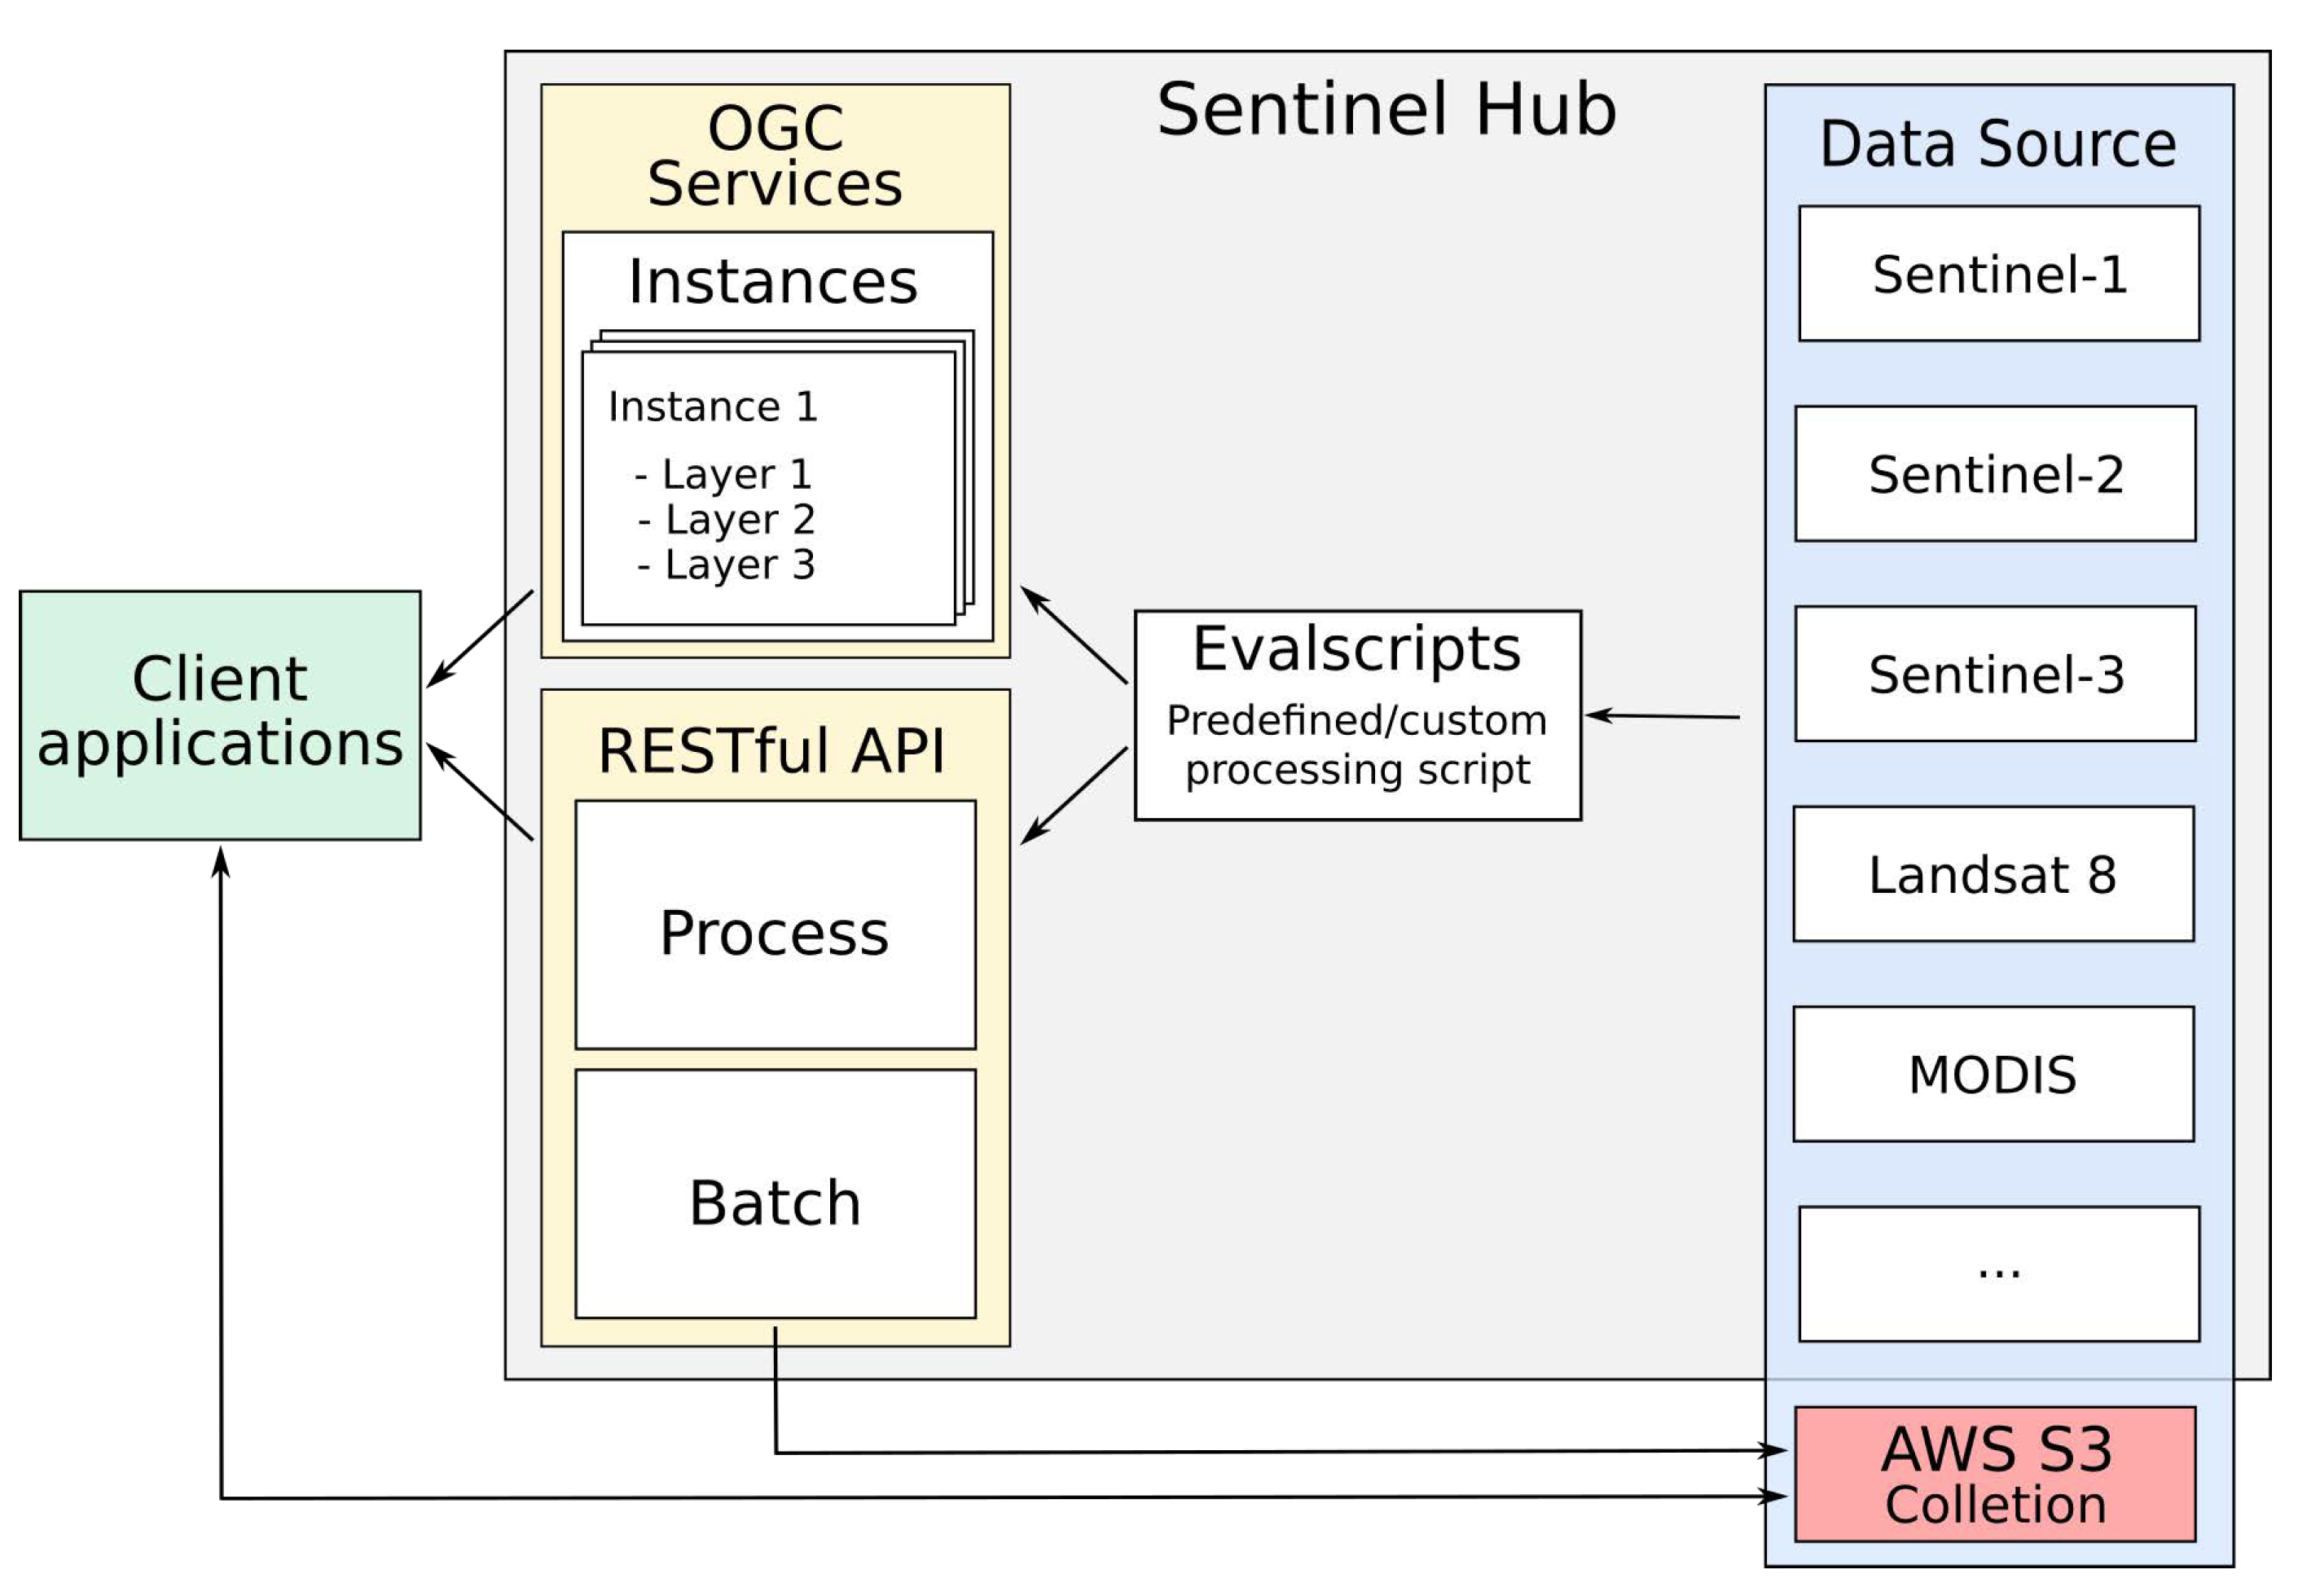
The features of the SH platform are made available through OGC services and a RESTful API. A web interface is also available that allows the configuration of specific services. Sinergise does not provide a diagram of the system architecture used by Sentinel Hub or information about how data is stored or processed. Thus, Figure 2, prepared by us, intends to illustrate the interaction between the services provided and the data abstractions used by the SH platform. In this figure, the arrows indicate the direction of the data flow.
SH uses the concepts of Data Source, Instances and Layer to represent the data available in its services. Data Source is an abstraction equivalent to the GEE ImageCollection, representing datasets that share the same set of bands and metadata.
The Data Sources currently available on SH are—Landsat 8 L1C, Mapzen DEM, MODIS MCD43A4, Sentinel-1 GRD, Sentinel-2 L1C and L2A, Sentinel-3 OLCI and SLSTR, and Sentinel-5P L2. It is also possible to include your own data in the SH platform. These data sets are named Collections by SH and need to be stored in the cloud optimized GeoTIFF (COG) format in a S3 bucket.
An Instance in SH platform acts as a distinct OGC service that can be configured to provide a set of Layers that fulfill user needs. Each Layer is associated with one or more bands of a specific Data Source and a processing script. These scripts, called Evalscripts by the SH, are applied to each pixel of the data requested by the user. It is not possible to access the data of a pixel’s neighborhood during the execution of the script, which can basically perform operations between bands.
Evalscripts are also used for SH API Process and Batch modules. In the Process module, the user can request a Data Source, informing filtering parameters, such as bounding box and time range, and indicating an Evalscript that will be applied to each pixel of the data before being delivered by the service. In the Batch mode the behavior is the same, except the service that is asynchronous and saves the result in an S3 bucket informed by the user during the request [43]. The SH web interface provides an interactive means for creating Instances and registering Collections by users.
The Sentinel Hub source code is close and so it is not possible to extend it. Sinergise provides good documentation with examples for using the web interface and SH API. Similar to GEE, Sentinel Hub terms of service guarantee users the intellectual property of their content and that the company will use it only for the provision of the platform services. Also, Sentinel Hub can change the offered functionalities at any time and there is no guarantee of continuity of services [34]. Currently, SH has no tools to facilitate the sharing of Evalscripts among researchers.
2.3. Open Data Cube
The Open Data Cube (ODC), previously known as the Australian Geoscience Data Cube (AGDC), is an analytical framework composed of a series of data structures and tools that facilitate the organization and analysis of EO data. It is available under Apache 2.0 license as a suite of applications. It is currently supported by Analytical Mechanics Associates (AMA), The Committee on Earth Observation Satellites (CEOS), The Commonwealth Scientific and Industrial Research Organization (CSIRO), Geoscience Australia (GA) and United States Geological Survey (USGS).
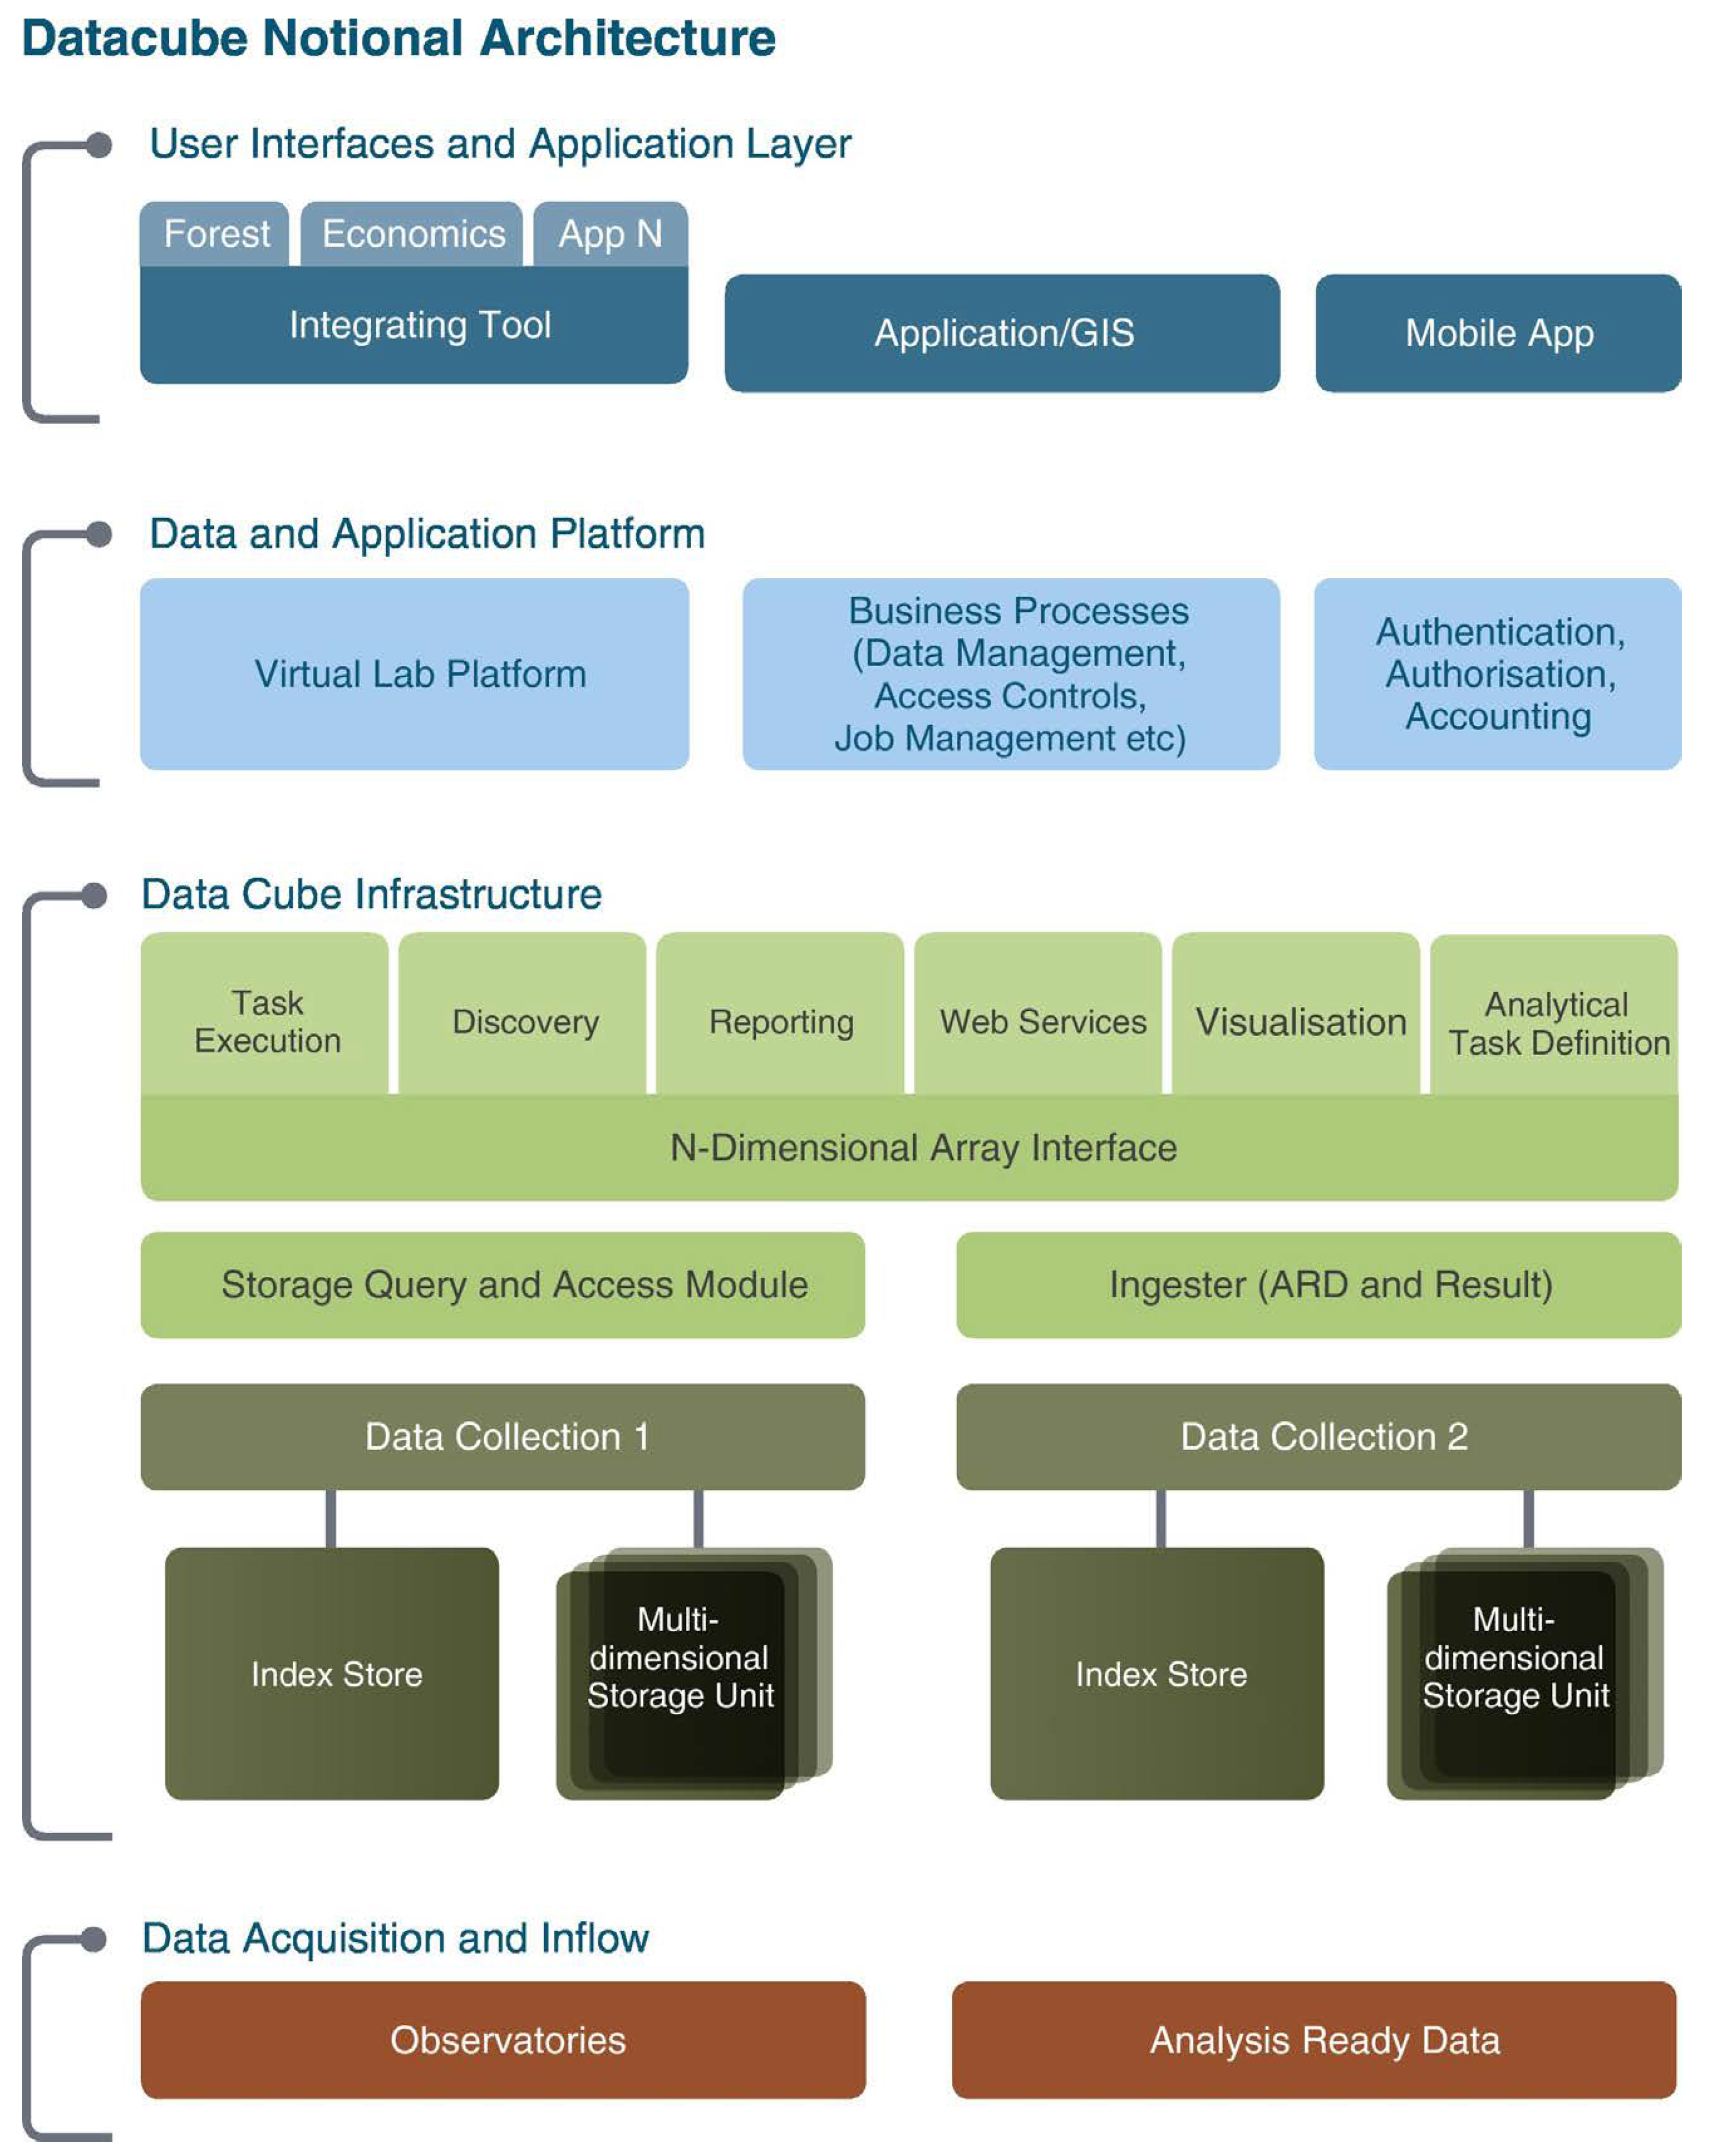
ODC allows the cataloging of massive EO data sets and their access and manipulation through a set of command line tools and a Python API. Figure 3 illustrates the architecture of ODC. Data Acquisition and Inflow represents the process to collect and prepare EO data before indexed by ODC. Data Cube Infrastructure illustrates the main core of ODC, where EO data is indexed, stored and delivered to users over the Python API. Data and Application Platform group auxiliary application modules as job management and authentication.
The source code of ODC and its tools are open and are officially distributed through dozens of git repositories (https://github.com/opendatacube). These repositories include web interface modules for data visualization, data statistics extraction tools as well as jupyter notebooks with examples of access and use of indexed data in ODC.
The main module responsible for data indexing is called datacube-core and consists of a Python script set that uses a PostgreSQL database to catalog the metadata of the data and provides an API for data retrieval. ODC can index data stored on a file system or the web. This platform does not use any approach to data distribution between servers, and it is the user’s chosen file system’s responsibility to ensure the scalability of data storage and access.
ODC uses the concepts of Product and Dataset to represent the data indexed in its catalog. Products are collections of data sets that share the same set of measures and some subsets of metadata. The Dataset represents the smallest independently described, inventoried and managed data aggregation. These are usually scenes stored in files that together represent a Product [45].
The data loading process in ODC consists of four steps. First, a Product must be registered from its metadata. In the second step, the metadata is extracted from each file (Dataset) that will be linked to the Product. To automate this process, ODC provides metadata extraction scripts for the following instruments/sensors: Landsat-5/7/8, Sentinel-1/2, ALOS-1/2, ASTER Digital Elevation Model (DEM), and MODIS [36]. With the metadata of the prepared files, the third step is to register these Datasets in the ODC catalog. The last step, called data ingestion, is optional and deals with the process of creating new Datasets from already registered Datasets. These new Datasets is saved using a new storage scheme, composing a new Product. At this stage, data can be re-sampled, re-organized in time series and/or broken into smaller blocks for storage. The main purpose of producing these new Datasets is to optimize the data format to speed up the reading process of data in the file system.
The development of applications for processing data indexed by an ODC instance requires the use of the framework’s Python API. This API allows the listing of indexed Products, retrieving Products and Datasets data and metadata. Data retrieval is performed by a load function that receives parameters such as product name, bounding box, period range, and spatial output resolution. This function returns a xarray object to be used by user’s application. For parallelization of processing, ODC has examples of using asynchronous task queues through the use of the Celery framework. Nevertheless, the parallelization of the processing of applications using ODC is the responsibility of the user.
For data access, ODC provides implementations of OGC web services such as WCS, WMS and WMTS. In addition to these modules, ODC also provides tools that facilitate ODC deployment through containers, an implementation that exposes the ODC Python API through a REST API, Jupyter Notebooks with Sample Applications, an application for extracting statistics from indexed data and an implementation of a web portal. In this web portal, it is possible to discover the available products, select and retrieve datasets (GeoTIFF and NetCDF), and perform analyzes through applications available in the portal.
Out of the box, this web portal offers a small set of sample applications, but new features can be added. This requires using a template provided by ODC developers. In this template, the researcher needs to extend classes from the Django framework and the Celery framework [46].
Currently the ODC platform has no tools to facilitate the sharing of applications and data between researchers. For a user to be able to reproduce results in another instance of ODC it is necessary to manually share and index the data and applications used.
In June 2019, nine institutions were using ODC operationally, fourteen were in the implementation phase and thirty three were analyzing its implementation [47]. The most prominent instance is the Australian version, called the Australian Geoscience Data Cube (AGDC). This instance stores over 300,000 Landsat images covering Australia, corresponding to approximately measurements stored. To store this volume of data, AGDC uses a cluster of computers with the Lustre distributed file system [44]. Two other operational instances are Switzerland [48] and Colombia [49].
2.4. SEPAL
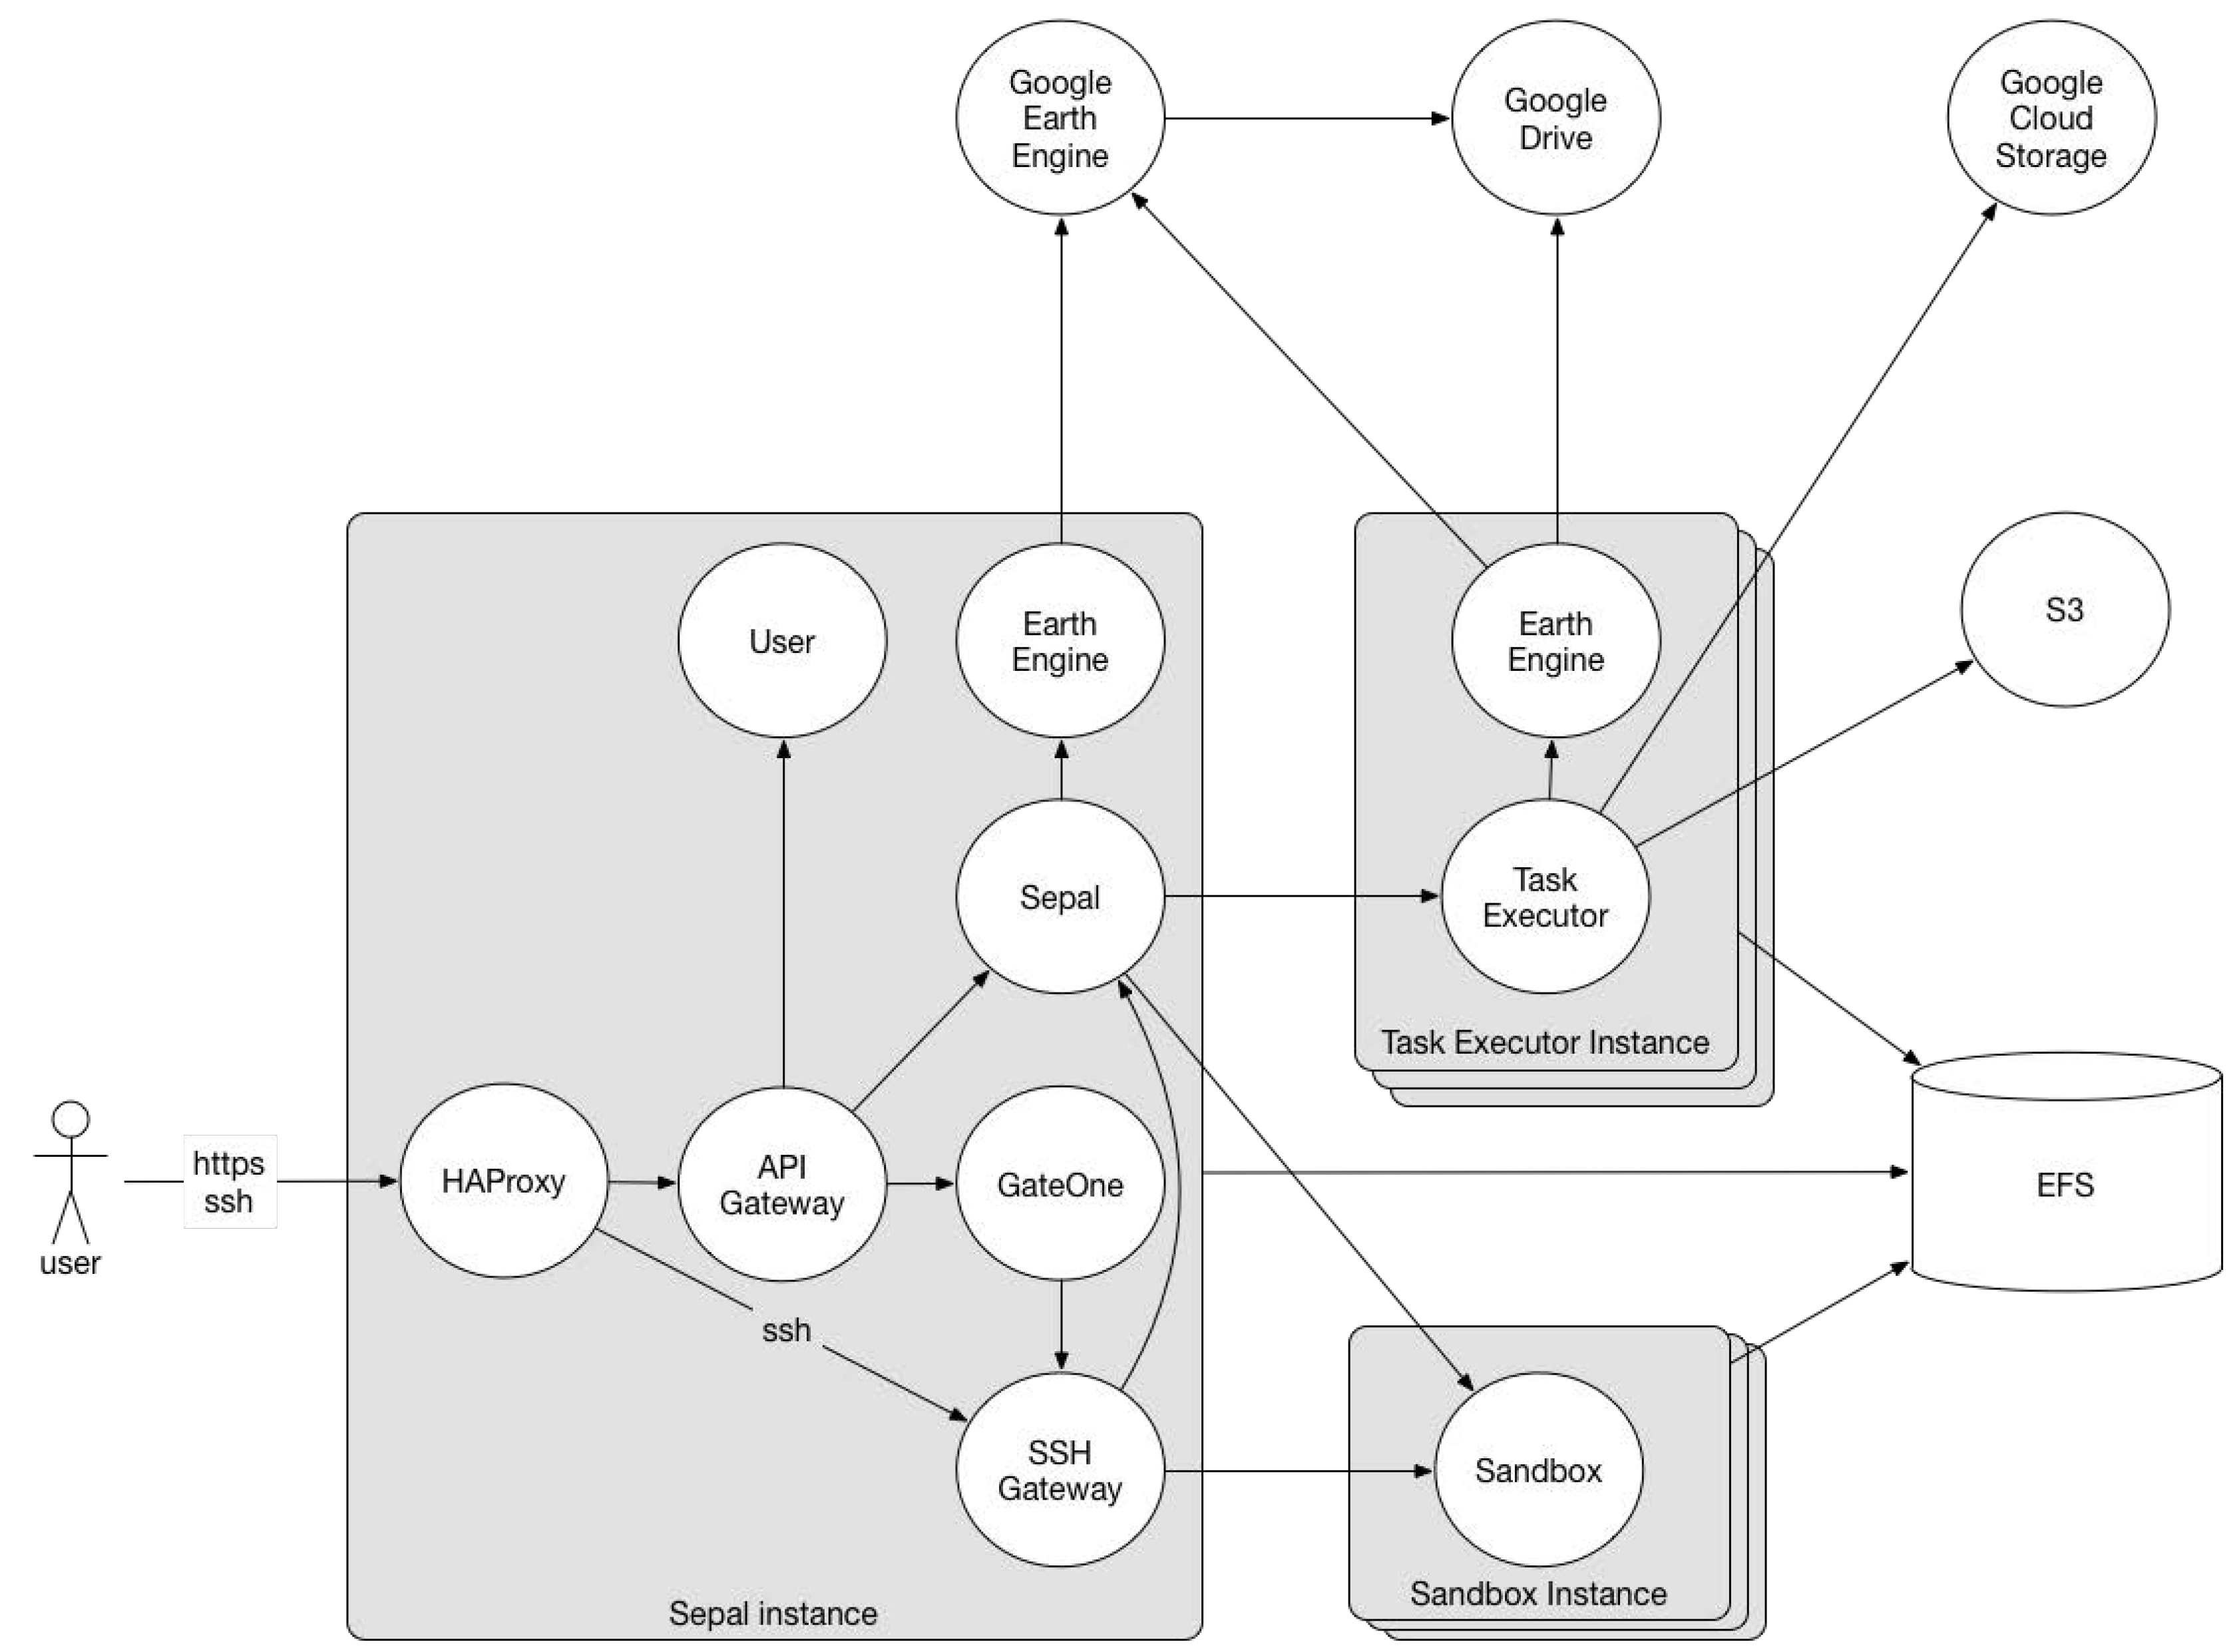
The System for Earth Observation Data Access, Processing and Analysis for Land Monitoring (SEPAL) is a cloud computing platform developed for the automatic monitoring of land cover. It combines cloud services, such as Google Earth Engine, Amazon Web Services Cloud (AWS), with free software, such as Orfeo Toolbox, GDAL, RStudio, R Shiny Server, SNAP Toolkit and OpenForis Geospatial. The main focus of this platform is on building an environment with previously configured tools and on managing the use of computational resources in the cloud to facilitate the way scientists search, access, process and analyze EO data, especially in countries that have difficulties with connection with the Internet and few computational resources [37].
SEPAL is an initiative of the Forestry Department of the United Nations Food and Agriculture Organization (FAO) and financed by Norway. Its source code (https://github.com/openforis/sepal) is available under MIT license and is still under development [37]. It works as an interface that facilitates access and integration of other services. Figure 4 presents a diagram of SEPAL architecture. The Sepal Instance, provides a web-based user interface where users can search and retrieve datasets and start preconfigured cloud-based machines to perform their analysis.
SEPAL uses Google Cloud Storage and Google Drive to store EO data and metadata. The Google Earth Engine is used for data processing and retrieval and the Amazon Web Services Cloud (AWS) is used for data storage (S3 and EFS AWS services) and as an infrastructure for computing analyses (EC2 AWS service).
The SEPAL platform can be accessed through a web portal (https://sepal.io), running on the AWS infrastructure, or it can be installed on the user own infrastructure using Vagrant for the management of processing instances. Currently, there are few available documentations about the deployment on in-house infrastructure.
In the web portal, the functionalities are divided into 4 areas—Process, Files, Terminal, and Apps. In Process, the user can search and retrieve images for further processing or viewing, by selecting the area, the sensor (Landsat or Sentinel-1 and 2) and the period of interest on the web interface. After searching, it is possible to select the best scenes for the production of a mosaic that can be downloaded to a user’s storage space. In the Files section, users can browse through the files previously saved in their storage space. The files searched and retrieved in the Search section can be accessed and viewed from this area of the portal. The area called Terminal allows users to start a machine in the AWS cloud. Before executing it, users must choose one of the 22 hardware configurations available. Each machine is associated with a cost per hour of use. Upon accessing the SEPAL account, users receive a fixed amount of credits monthly. The machine configuration options available are some possibilities found in the AWS EC2 service. In the Apps area, applications are available to process and analyze data previously stored in the user’s storage space. When an option is selected, SEPAL deploys the application code to the user’s running machine (or instantiates a new one, if none is active) and opens a new browser window pointing to its interface. Currently available applications are RStudio, Jupyter Notebook, Jupyter Lab, and interactive documents that run on an R Shiny Server.
Although SEPAL provides functionality for users to manage and view data on its web interface (Files), this platform does not provide any web service to access the data or send processing requests to the server. Its features are more focused on the management of computational resources (virtual machines) and the aid of data pre-processing from EO data providers through a web interface (Process). SEPAL automatically connects the storage service to the virtual machines allocated by the users, making the previously downloaded files available to the user’s applications. In this environment, researchers are responsible for developing applications that make good use of available computational resources. SEPAL also does not provide tools to facilitate the sharing of analysis between users.
2.5. JEODPP
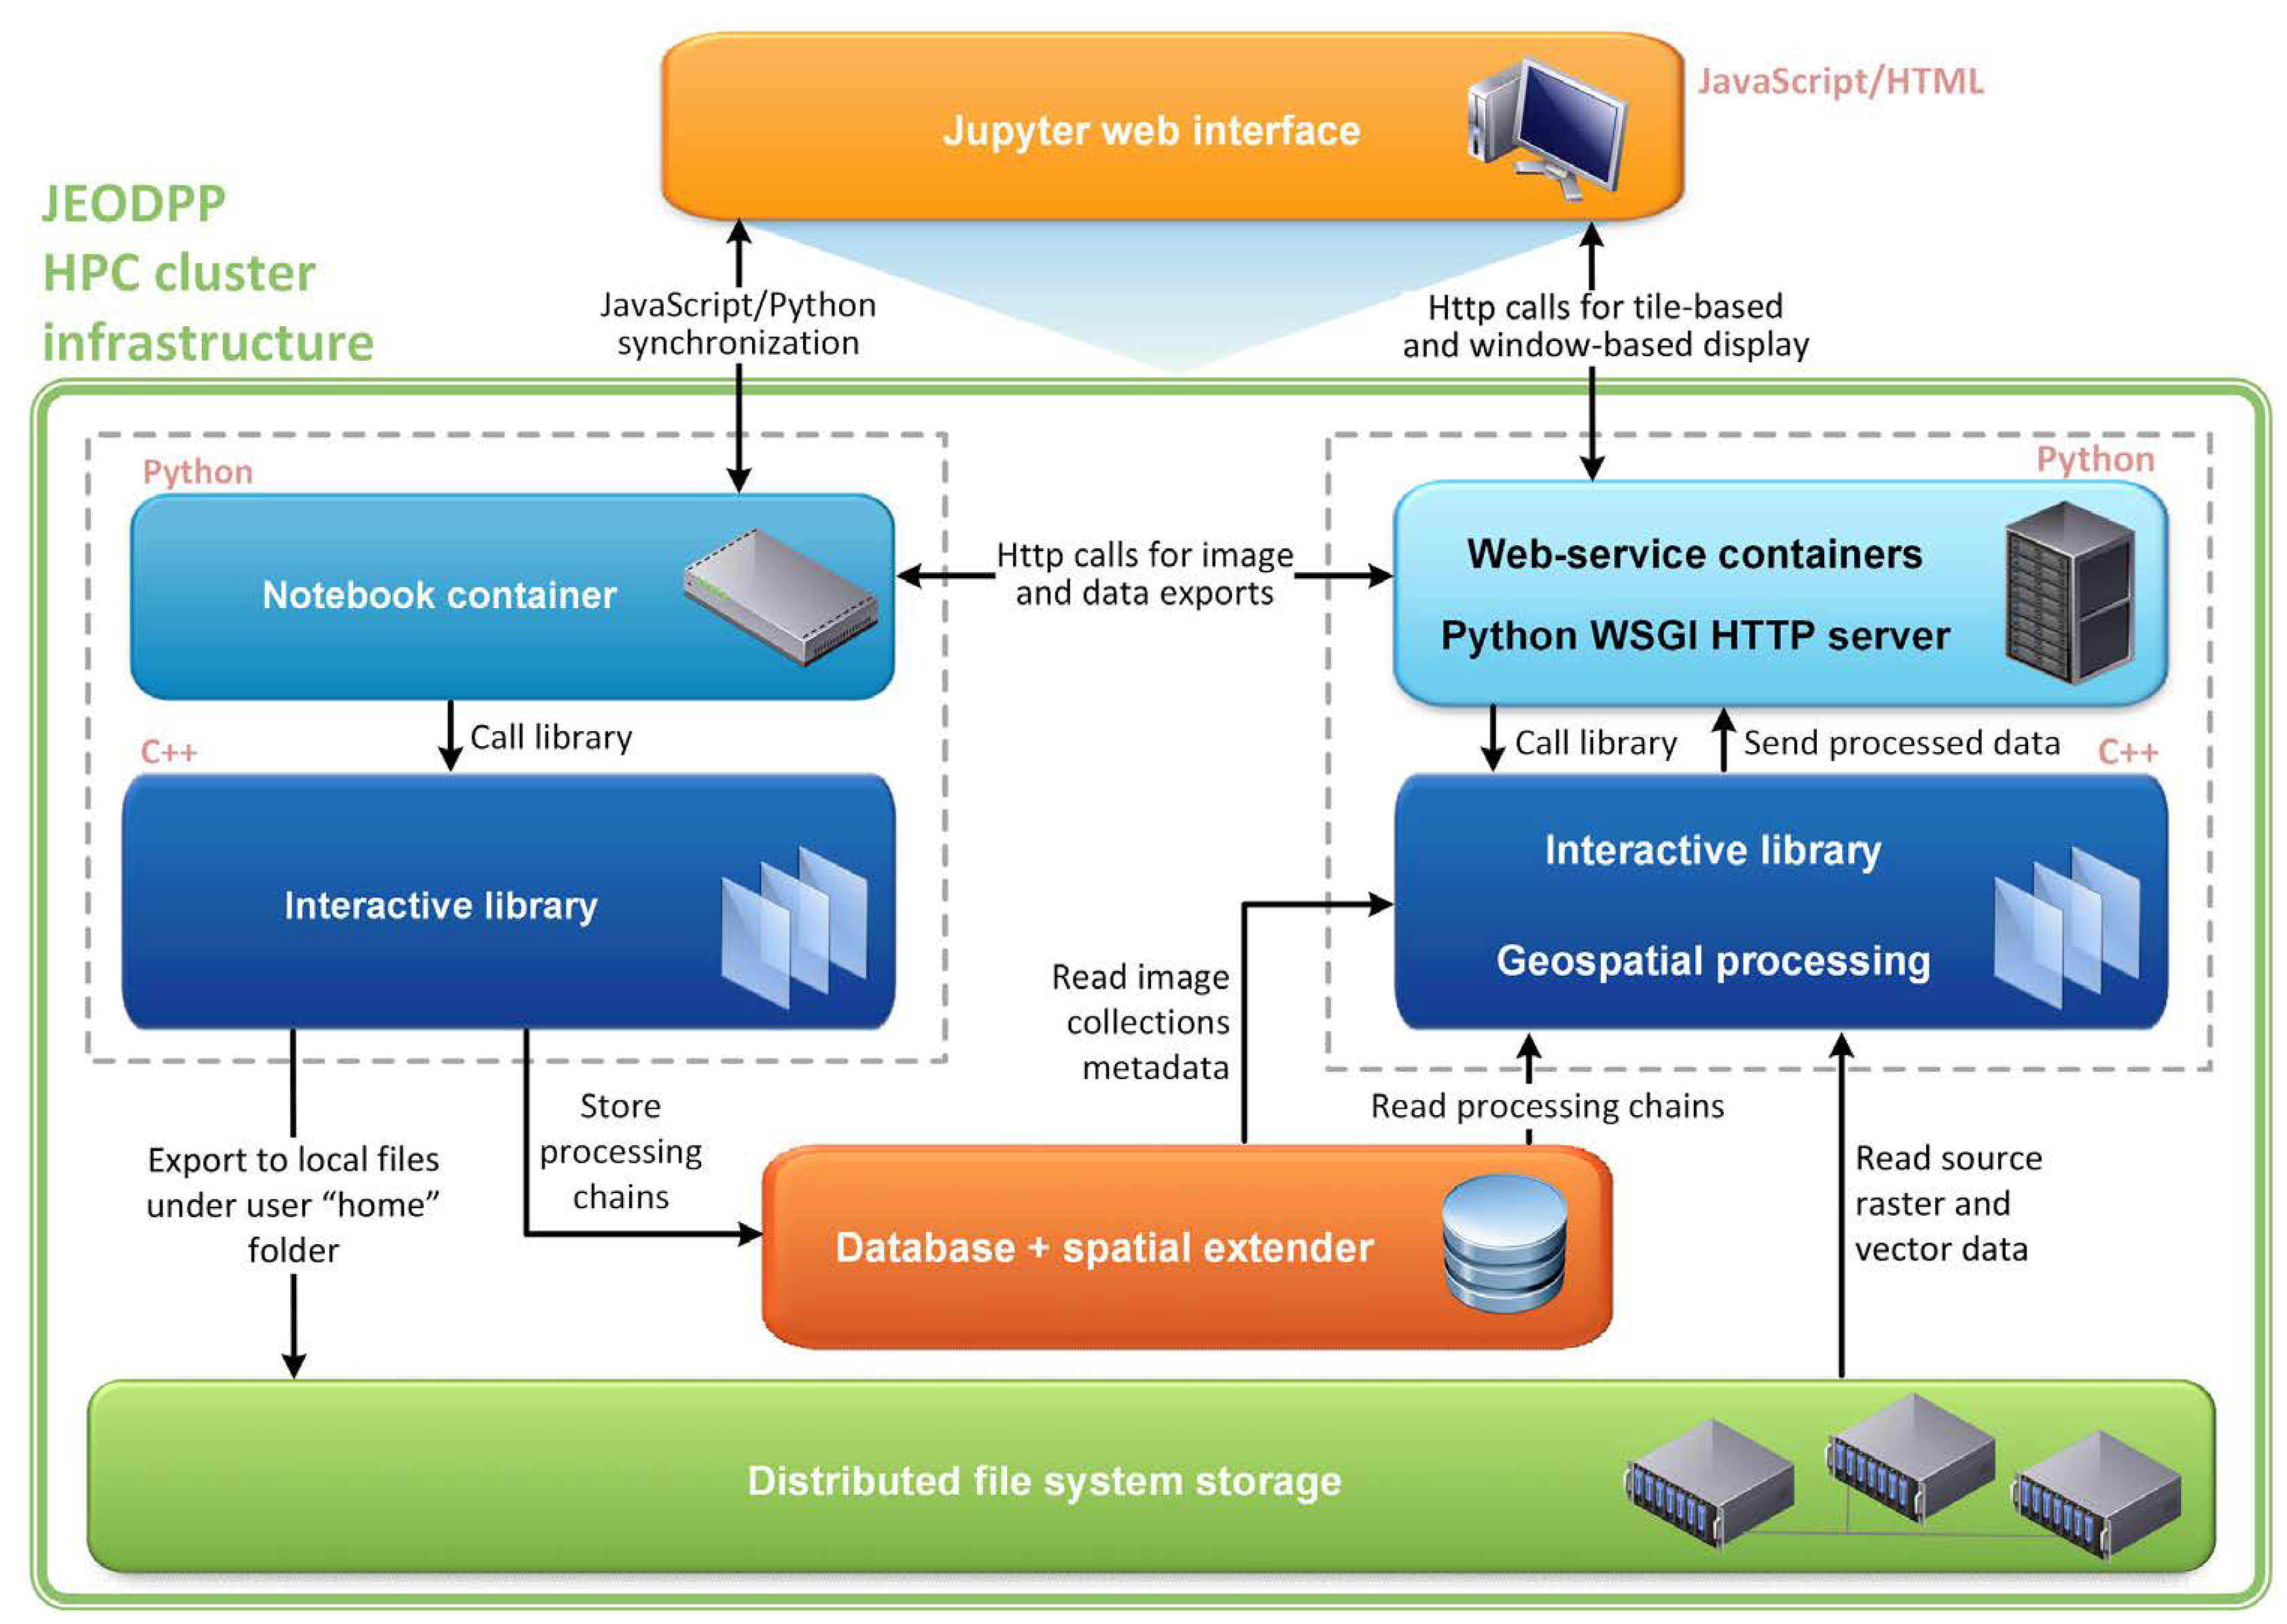
The Joint Research Center (JRC) Earth Observation Data and Processing Platform (JEODPP) is a closed solution developed since 2016 by the JRC for the storage and processing of large volumes of Earth observation data. This platform has features for interactive data processing and visualization, virtual desktop and batch data processing. This platform uses a set of servers for data storage and another set for processing. The storage servers use the EOS [50] distributed file system and store the data in its original format, with only pyramidal representations added to speed up the reading and visualization of the data.
For data visualization, JEODPP uses a Jupyter Notebook environment and provides an API for the construction of objects that represent processing chains, through previously defined functions. When a visualization object is built, the associated processing chain is not executed instantly. The execution of the processing chain only occurs when data associated with the object is used. This lazzy processing approach is the same as that adopted by GEE for data visualization.
Figure 5 illustrates the data processing and visualization flows adopted by JEODPP. The left side shows the flow of registration of the processing chains, while the right side shows the flow of data delivery for visualization.
For the virtual desktop feature, JEODPP uses the Apache Guacamole system, which allows viewing a remote terminal through a browser. This feature allows the use of remote Linux or Windows terminals, which are previously prepared with tools for processing EO data (R, Grass, GIS, QGIS, MATLAB, etc.) and where the data is available through the EOS file system.
For batch processing, JEODPP uses the HTCondor framework for scheduling tasks on servers. Users are responsible for integrating HTCondor into their applications in order to take advantage of the cluster of processing servers. In these processing modes, users directly access the files, making it necessary to know the folder structure and the formats of the stored data. JEODPP does not provide any kind of extra abstraction for accessing and manipulating this data.
Soille et al. [3] presents the results of two tests performed with JRC applications in an instance of the JEODPP system running in a cluster with 912 cores (15.8TFLOS) and accessing 1PB of data. The tested applications are: (i) Search for Unidentified Maritime Objects (SUMO); and (ii) Global Human Settlement Layer (GHSL) framework. For each application, the number of pixels processed per second in Mpixel/s was calculated. The results show a linear growth of performance in relation to the increase of processor numbers, indicating good processing and data access scalability.
Based on the documentation available, the JEODPP does not have tools to facilitate the sharing of analysis among researchers. This capability is only available for internal use of JRC and there is no source code available for implementation in other institutions.
2.6. pipsCloud
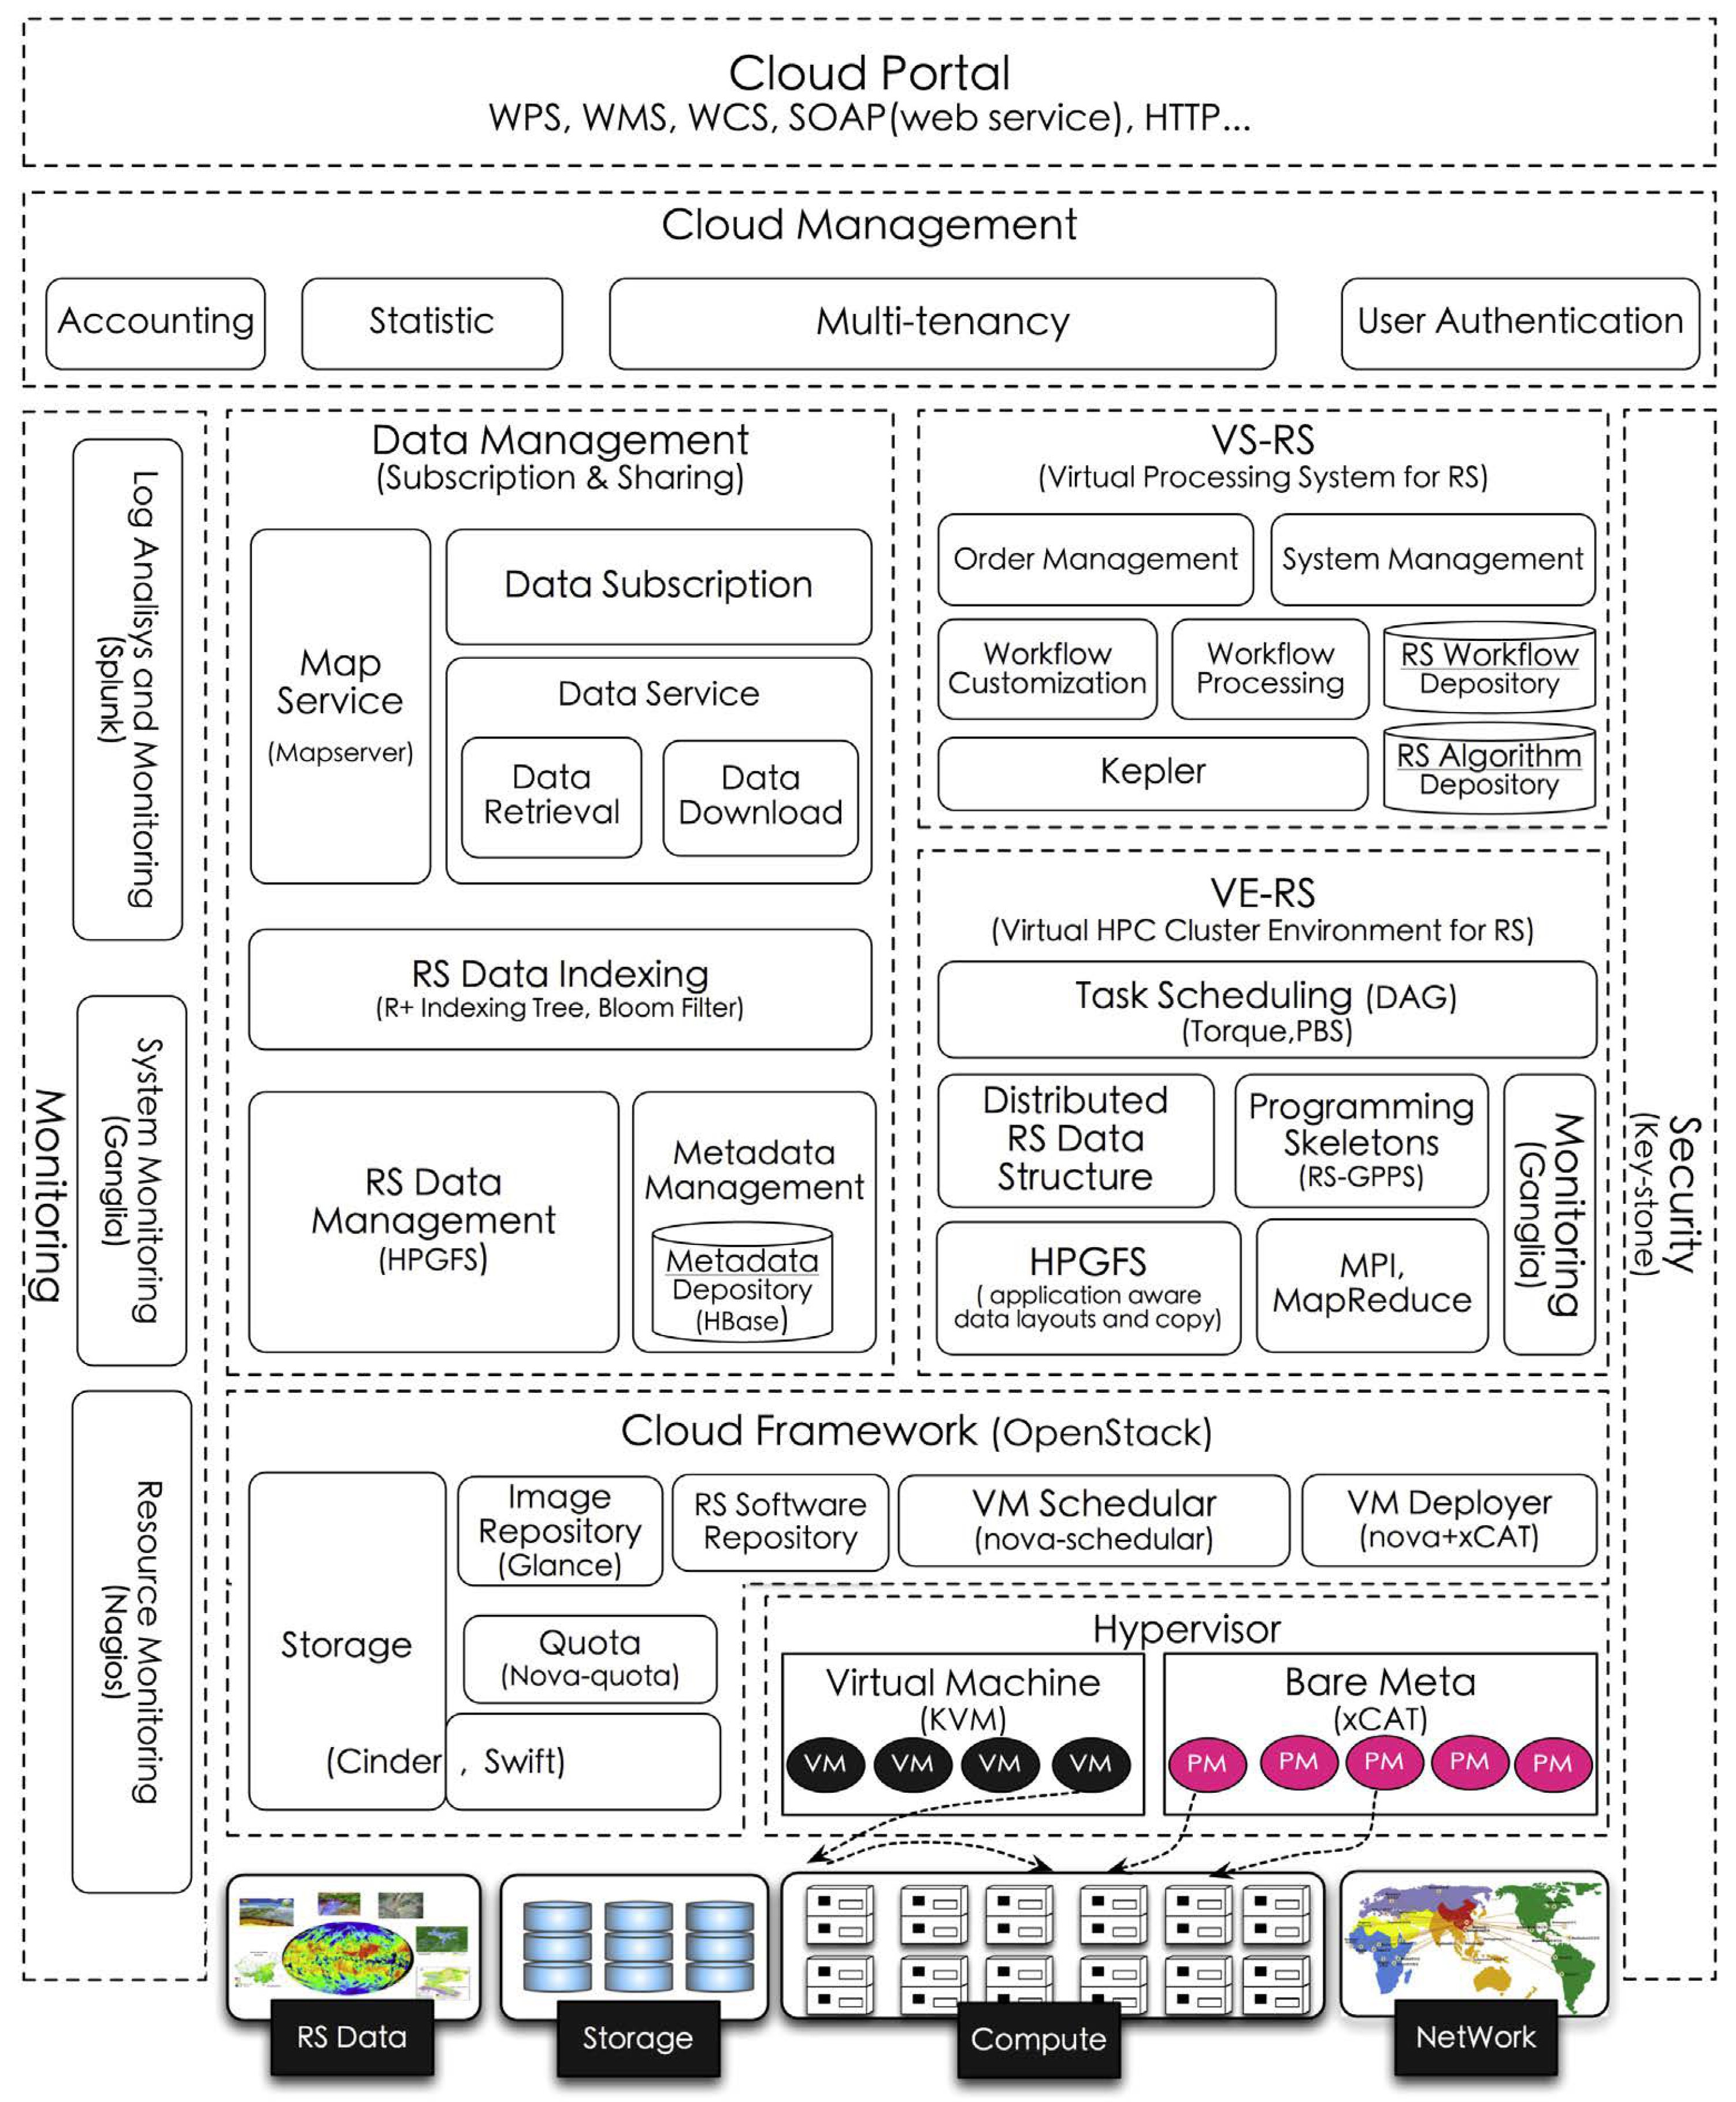
pipsCloud [39] is a proprietary solution developed by Chinese research institutions for the management and processing of large volumes of EO data based on cloud computing. The file system used in pipsCloud is HPGFS, a proprietary file system also developed by Chinese institutions and which is not available for use by third parties. Its cloud environment is implemented in the organization’s internal infrastructure using OpenStack technology, which allows the construction of virtualized services infrastructure.
Figure 6 shows the architecture of pipsCloud. The highlight is given to the file indexing scheme, which uses a Hilbert-R+ tree, and a virtual file catalog. Users who need to process data should describe a query to identify the files of interest. From these files, a file system is mounted on the user’s processing machine with only the requested data.
For data processing on the server-side, pipsCloud provides C++ code templates for building applications. These templates abstract the reading of the data on disk and the submission of the processes to the processing nodes. The communication between the processing nodes and the parallel reading of the files is done using features of the MPI interface (Message Passing Interface).
The pipsCloud platform does not provide any functionality to export data using OGC standards or to facilitate the reproducibility of science. In addition, it is only available for internal use by the institutions that participate in the project and its source code is close and is not available for implementation in other institutions.
2.7. OpenEO
The OpenEO project started in October 2017 in order to meet the need to consolidate available technologies for storing, processing and analyzing large volumes of EO data. This demand arises from the difficulty that many users of EO data have in migrating their data analytics to cloud-based processing platforms. The main reason is not, in many cases, of a technical nature, but the fear of becoming dependent on the provider of the chosen platform. OpenEO aims to reduce these concerns, by providing a mechanism for scientists to develop their applications and analyzes using a single standard that can be processed in different systems, even facilitating the comparison of these providers. With this approach, OpenEO aims to reduce the entry barriers for the EO community in cloud computing technologies and in big EO data analysis platforms.
To this end, this system has been developing as a common and open source (https://github.com/Open-EO) interface (Apache license 2.0) to facilitate the integration between storage systems and analysis of EO data and applications of the European program Copernicus.
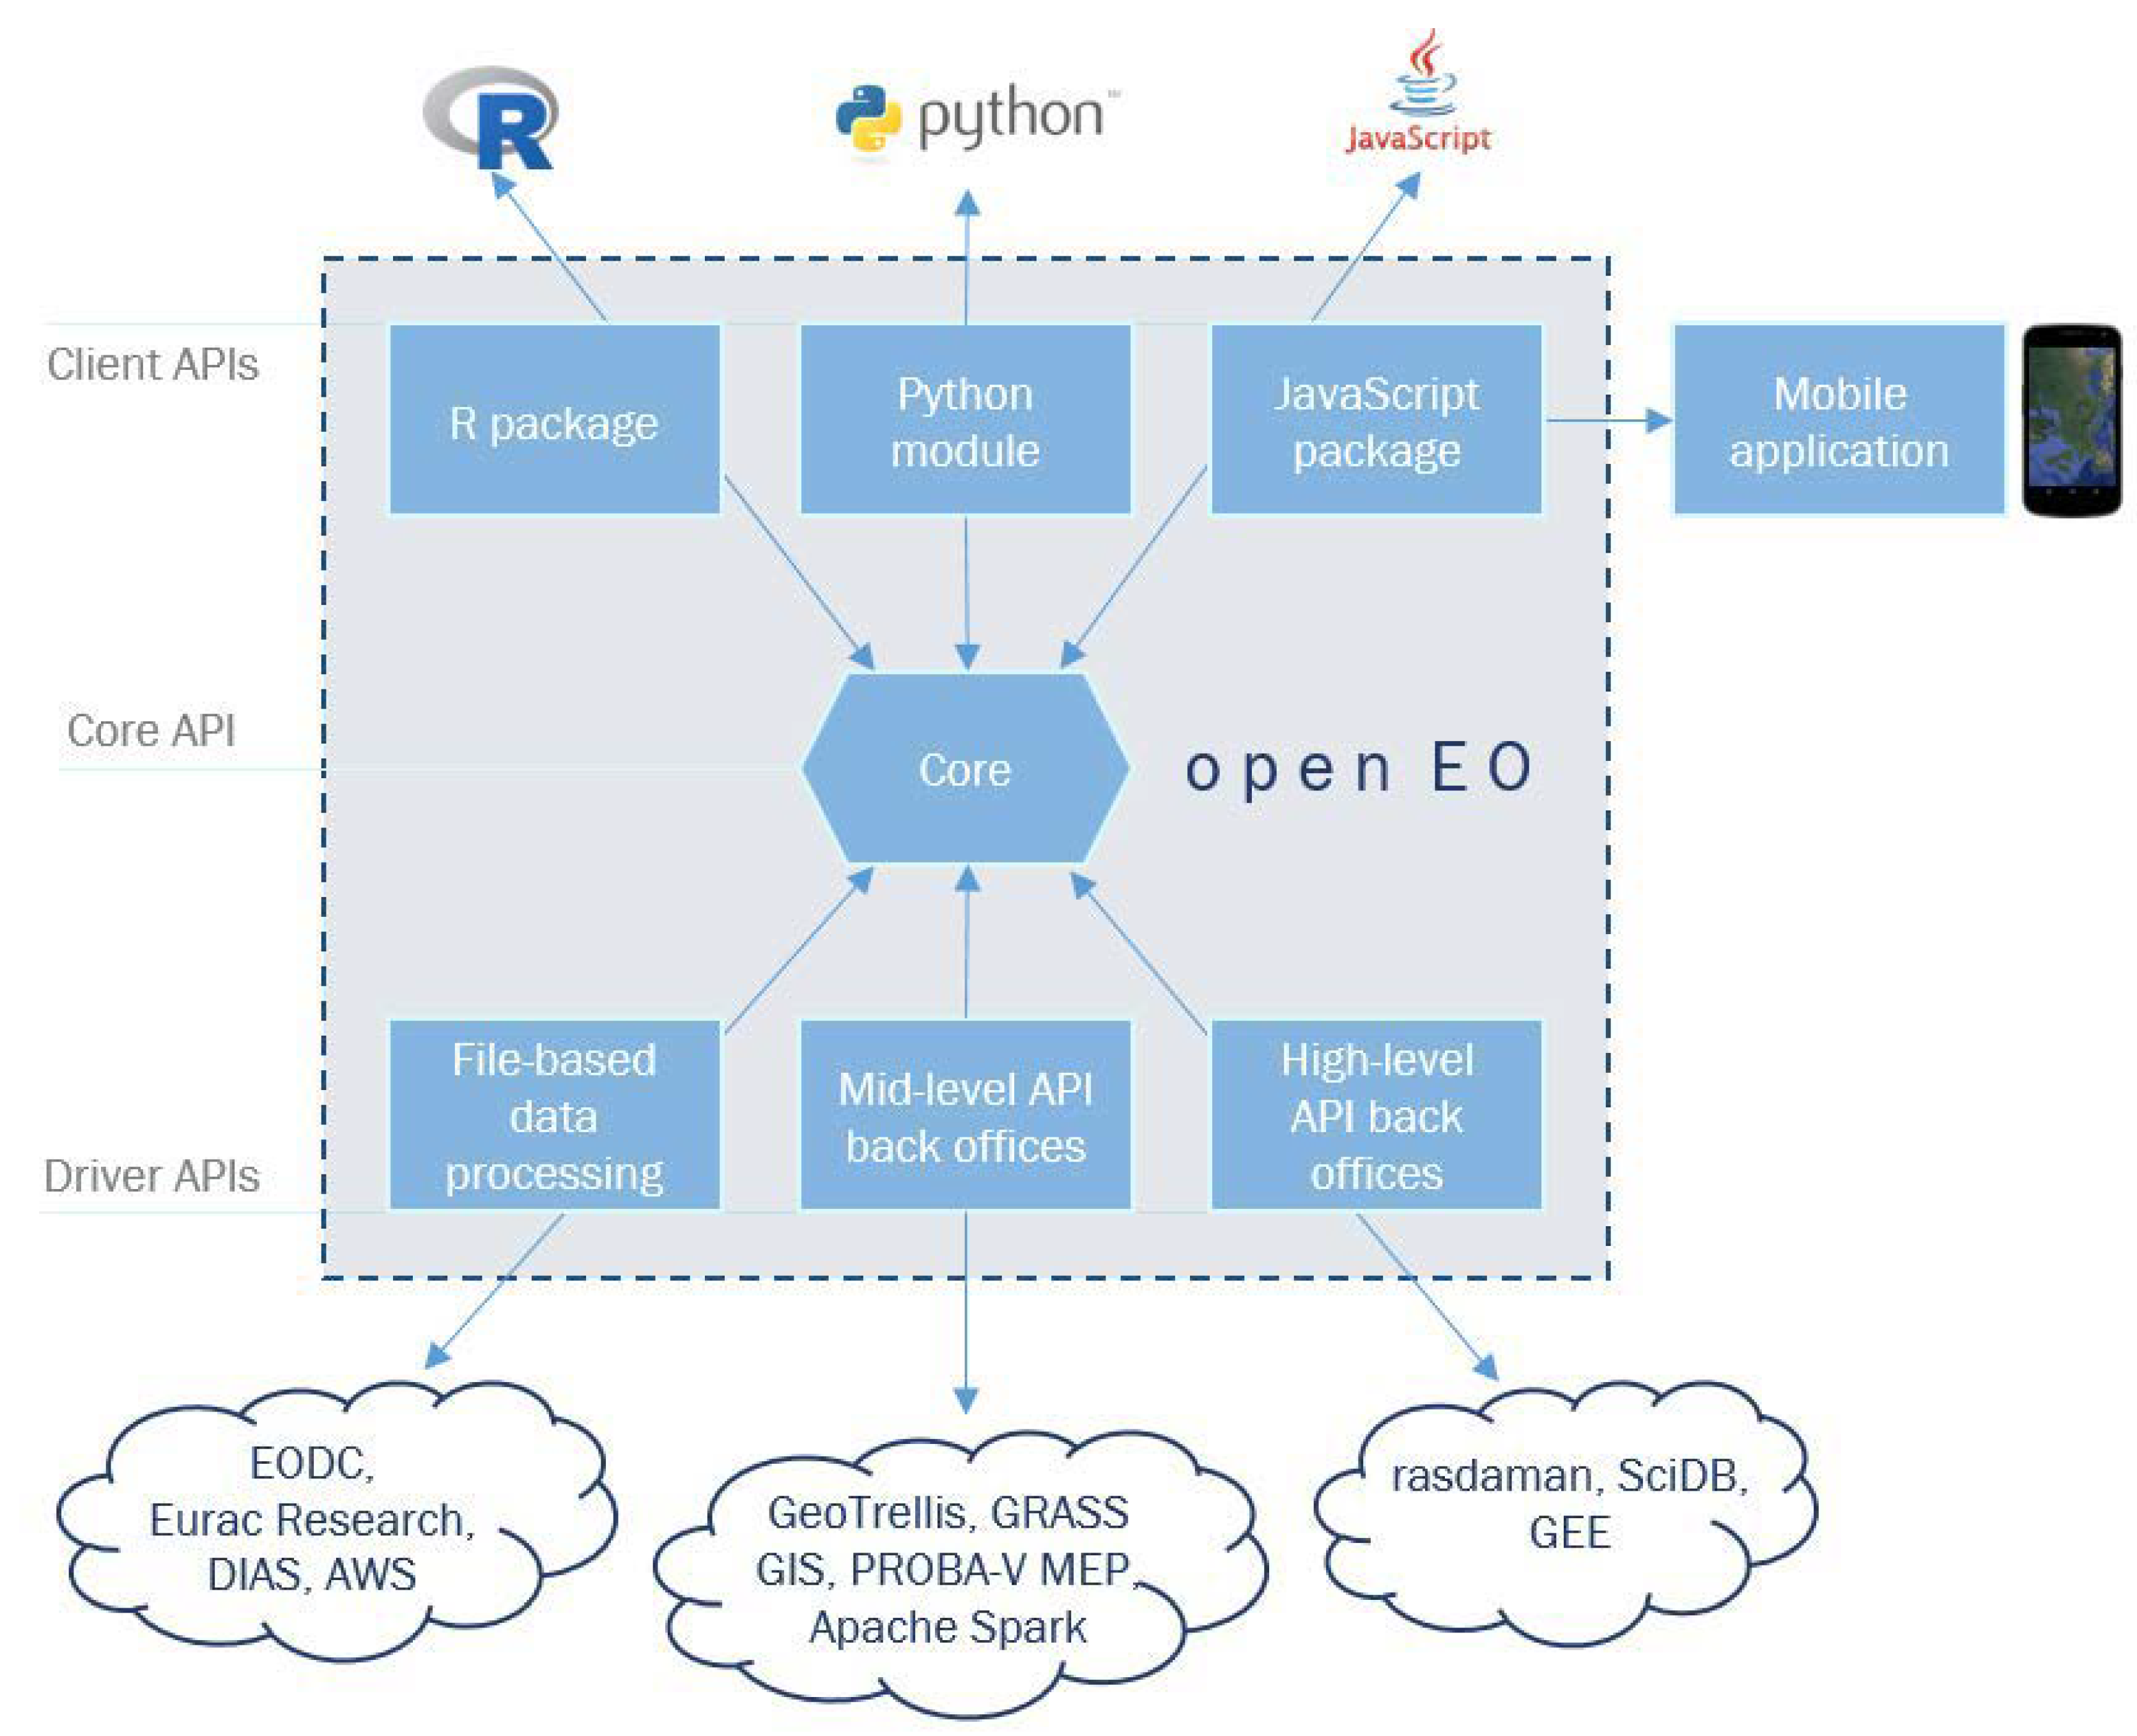
Figure 7 shows the three-tier architecture adopted by OpenEO. The Client APIs layer consists of packages or modules in R, Python and JavaScript, which act as an entry point for the development of analysis by researchers. This API uses two terms to describe EO datasets. The Granule refers to a limited area and represents the less granularity of data that can be managed independently. The Collection is a sequence of Granules sharing the same product specification [51]. The Core API layer is responsible for standardizing Client APIs requests, unifying access to services provided by data processing technologies and platforms. Finally, the Driver APIs layer is responsible for the interface between the Core API and the data storage and processing services (back-end services).
OpenEO uses microservices to implement the Core API. These web services use the REST architectural style and are divided into the following functionalities [52]:
- Capabilities: retrieves the functionality of the back-end services, such as which authentication methods are supported and which User-defined functions (UDF) can be performed;
- EO Data Discovery: describes which data sets and image Collections are available on back-end services;
- Process Discovery: provides the types of processing available at each back-end provider;
- UDF Runtime Discovery: allows the discovery of programming languages and environments for the execution of UDFs;
- Job Management: organizes and manages the tasks running at the back-end providers;
- Result Access and Services: provides the services for data recovery and processing results in the form of OGC Web Coverage Service (WCS) or OGC Web Map Service (WMS);
- User Data Management: manages the user account, such as storage and processing usage issues; and
- Authentication: provides user authentication.
The interaction between the Client API and Core API layers is made using four abstractions of processing elements, which are used to represent the objects sent by users to the OpenEO web services. The first, Process Graphs, defines process calls, including input parameters for previously defined functions. For more complex processing, these graphs allow the linking of multiple processes, where one process can receive another graph as a parameter, and so on. This type of computation invocation is equivalent to that used by GEE. Tasks represents another abstraction used in the processing flow adopted by OpenEO. These Tasks can be: Lazy evaluated jobs; Batch jobs; or Synchronously executed jobs. From the execution of a Job, it is possible to make its results available through OGC WCS or WMS.
The third abstraction used by OpenEO is User Defined Functions. They are used to expose, on the server side, data to applications in different ways. They represent the interface of the functions that users can implement to run on the server side. The last abstraction provided by OpenEO is Data View. This functionality allows the user to select and configure the temporal and spatial resolution of the data to be viewed. A Data View allows processing on demand, when only the data to be viewed is processed. This approach is similar to that adopted by the Lazy mode used by the GEE [51,52].
OpenEO does not restrict the technologies used in the back-end for data storage or processing. Thus, it is not possible to guarantee that all functionalities will be available or that the applications will work in the same way in different back-ends. Besides that, OpenEO does not provide facilities to guarantee the reproducibility of science.
3. Assessment of the Platforms
We define “Platforms for big EO Data Management and Analysis” as computational solutions that provide functionalities for big EO data management, storage and access, which allow the processing on the server side without having to download big amounts of EO data sets; and which provide a certain level of data and processing abstractions for EO community users and researchers. EO community users need efficient and stable solutions that provide analytical tasks and that minimize their effort and required technological expertise to manage large EO data sets. These solutions should provide a certain level of data and processing abstraction that allows scientists to deal with large EO data sets without worrying about technologies such as database systems, web services and distributed computing. These technologies should be integrated and presented to scientists in the form of a platform where the complexities of data storage, processing, and infrastructure must be abstracted. According to Camara et al. [5], an architecture for big EO data analysis must meet the following requirements:
- Analytical Scalability: it should cover the entire research cycle, allowing algorithms developed on personal computers to be executed in massive computing environments or large data volumes without major changes.
- Software reuse: it should allow researchers to adapt existing methods for application to large volumes of data with minimal rework.
- Collaborative work: it should allow results to be shared with the scientific community.
- Replication: it should encourage research groups to deploy their own infrastructure.
Ariza-Porras et al. [49] list the following characteristics needed in a system for managing and analyzing EO data of interest to their research group:
- Data ownership: historical out-of-the-box data series should be available without reliance on external services.
- Extensibility: new processing algorithms should be easily added to the system.
- Lineage: the origin of the results should be identifiable by the algorithms and parameters used.
- Replicability: results should be replicable.
- Complexity abstraction: developers should be able to create new algorithms without interacting directly with the data query API. Developers should work with multidimensional arrays.
- Ease of use: The user interface should allow analysts to execute algorithms without long training. Developers should be able to create new algorithms using programming language knowledge with a small learning curve.
- Parallelism: Available computing resources should be used effectively by the system.
The demands and needs presented by Camara et al. [5] and Ariza-Porras et al. [49] motivated us to define ten capabilities to serve as criteria for evaluating the platforms presented in this work. The following list provides each capability name, its description, and, when applicable, its associated term proposed by other authors in parentheses:
- Data abstraction: the capacity to provide data abstraction, hiding from scientists details about how data is stored without limiting its access mode (Complexity abstraction; Ease of use).
- Processing abstraction: the capacity to provide data processing abstraction, hiding from scientists details about where and how data is processed, without limiting its processing power (Complexity abstraction).
- Physical infrastructure abstraction: the capacity to hide from scientists aspects regarding the number of servers, hardware and software resources (Analytical scalability; Complexity abstraction).
- Open Governance: the capacity of the scientific community to participate in the governance and development of the platform.
- Reproducibility of science: the capacity to provide means that allow scientist to share their analysis and/or reproduce the results among other researchers (Collaborative work; Replicability).
- Infrastructure replicability: the capacity to replicate the software stack, processes and data on own infrastructure (Replication).
- Processing scalability: the capacity to scale processing performance by adding more resources (hardware/software) without a direct impact on the way scientists conducts their analysis (Parallelism).
- Storage scalability: the capability to scale storage space by adding more resources (hardware/software) without a direct impact on how scientists access data (Parallelism).
- Data access interoperability: the capacity to provide means, based on standardized interfaces, that allow other applications to access analysis results or data sets available in the platform.
- Extensibility: the capacity to add new software tools that utilize the storage and processing modules available internally in the platform (Analytical Scalability; Software reuse; Extensibility).
In this work, we evaluate these ten capabilities of the platforms Google Earth Engine (GEE), Sentinel Hub (SH), Open Data Cube (ODC), System for Earth Observation Data Access, Processing and Analysis for Land Monitoring (SEPAL), OpenEO, JEODPP, and pipsCloud. Table 1 presents a summary of this evaluation. For each platform, we classify each capability in three levels—low, medium and high. The following paragraphs present details about the platform capabilities.
GEE, ODC, OpenEO and SH provide high data abstraction to facilitate data access by users. On these platforms, users can make queries with spatial and temporal criteria to select the data set of interest. GEE uses the concept of ImageCollection to represent the data sets stored in these platforms. ODC uses the concept of Product and delivers data through a multidimensional data, while OpenEO uses the concept of Collection for these structures. SH provides access to data through Data Sources that can be accessed through services. SEPAL, JEODPP, and pipsCloud do not provide data abstraction. On these platforms, data is accessed through direct file manipulation.
Regarding the abstraction of data processing, we consider that no platform fully meets this capacity. GEE and SH platforms make transparent to users how and where processing is performed, but limit or hinder the use of a non-pixel-by-pixel processing approach. ODC does not have this limitation, but it requires the user to be aware of the processing mode used. In this platform, it is possible to perform sequential or parallel processing. For parallel mode, ODC provides a toolkit to facilitate application development, which should be developed by the user. OpenEO provides a complete interface for performing server-side processing transparently, but it demands that such functionality must be available on the back-end used. Thus, the processing abstraction may or may not be observed in the OpenEO, depending on the chosen back-end platform. SEPAL, JEODPP, and pipsCloud platforms do not have processing abstraction capabilities because they require users to develop their applications and access data directly through files. On these platforms, parallelization or distribution of processing must be implemented and managed by the users themselves.
GEE, OpenEO and SH platforms provide an high abstraction of the physical infrastructure used for data storage and processing. In the case of GEE and SH, the user only interacts with their APIs using JavaScript (SH and GEE) or Python languages (GEE) or OGC web services (SH). For OpenEO, physical infrastructure abstraction is one of the main goals of the platform. Thus, it provides a single interface for analysis on different back-ends.
The platforms ODC, JEODPP, pipsCloud, and SEPAL partially abstract the physical infrastructure. Although users have facilities to use ODC, JEODPP, pipsCloud, and SEPAL through remote resources, it is not transparent for users the use of the file system or the use of multiple resources for distributed processing.
ODC, SEPAL and OpenEO platforms are open source and their code are available in open repositories that allow the scientific community to collaboratively participate in their development. Considering these platforms, ODC is the only one that provide publicly disclose documents that formalize the platform governance process and how to create or incorporate new features into the platform. GEE, JEODPP, pipsCloud and SH are closed solutions that do not allow collaborative development or participation in governance by members outside the responsible teams.
The only solution reviewed that presents a clear initiative in providing reproducibility of science is the GEE platform. Users can share their scripts and data, allowing other platform users to reproduce their analysis. Nevertheless, the analysis of reproducibility of science is a complex issue when we observe that GEE is a closed solution and that the scripts only represent processing invocations to the platform API. Changes in algorithm implementations, even if they are corrections, can impact the results observed by running the same script on the same dataset at different dates. GEE does not provide a versioning system for algorithms or data in public catalog. For this reason, we consider that GEE provides only an intermediate reproducibility of science capability.
The reproducibility of results in the other platforms is not facilitated through some platform-specific functionalities. In general, users need to manually share scripts and data with other users before the analyses can be replicated.
ODC, SEPAL and OpenEO platforms allow users to deploy them on their own infrastructures. ODC, besides providing source code, provides a good documentation about the platform deployment process and a repository with docker images, facilitating the platform infrastructure replication process. Differently from ODC, SEPAL and OpenEO have little documentation about the deployment of available applications, making this process difficult. The other platforms analyzed do not publicly present means to be deployed in user infrastructures.
Regarding the processing scalability, GEE has the best performance gain with the increase of resources because it uses a MapReduce architecture where data and processing are distributed using technologies developed by Google. Processing scalability can also be observed in the solution adopted by JEODPP in the production of visualization data (processing chains). This same capability is not available in the other data processing modes of the JEODPP, leading us to classify it as medium.
We consider that ODC and pipsCloud partially meet the scalability of processing. For while, these platforms help users to make better use of processing resources by incorporating distributed processing tools or code templates. However, the responsibility to implement such solutions is entirely of the users.
A high level of storage scalability is observed in the GEE, SH, JEODPP, SEPAL, ODC, and pipsCloud platforms. These platforms use or allow the use of distributed file systems to scale data storage. The file systems themselves used by these solutions allow new storage features to be added without a direct impact on how users access data.
Regarding data access interoperability, only ODC, OpenEO and SH platforms provide standardized APIs for accessing stored data. These platforms provide OGC web services, such as WMS, WTMS and WCS. GEE uses a Tile Map Service (TMS) only to show the results on the web IDE, without explicitly informing the API endpoint.
Only ODC, SEPAL and OpenEO allow the extension of their functionalities by including new software tools to the solutions already used by them. ODC stands out in this capacity because it provides a good documentation about how to add new features by other users, including the distribution of sample applications for distributed processing.
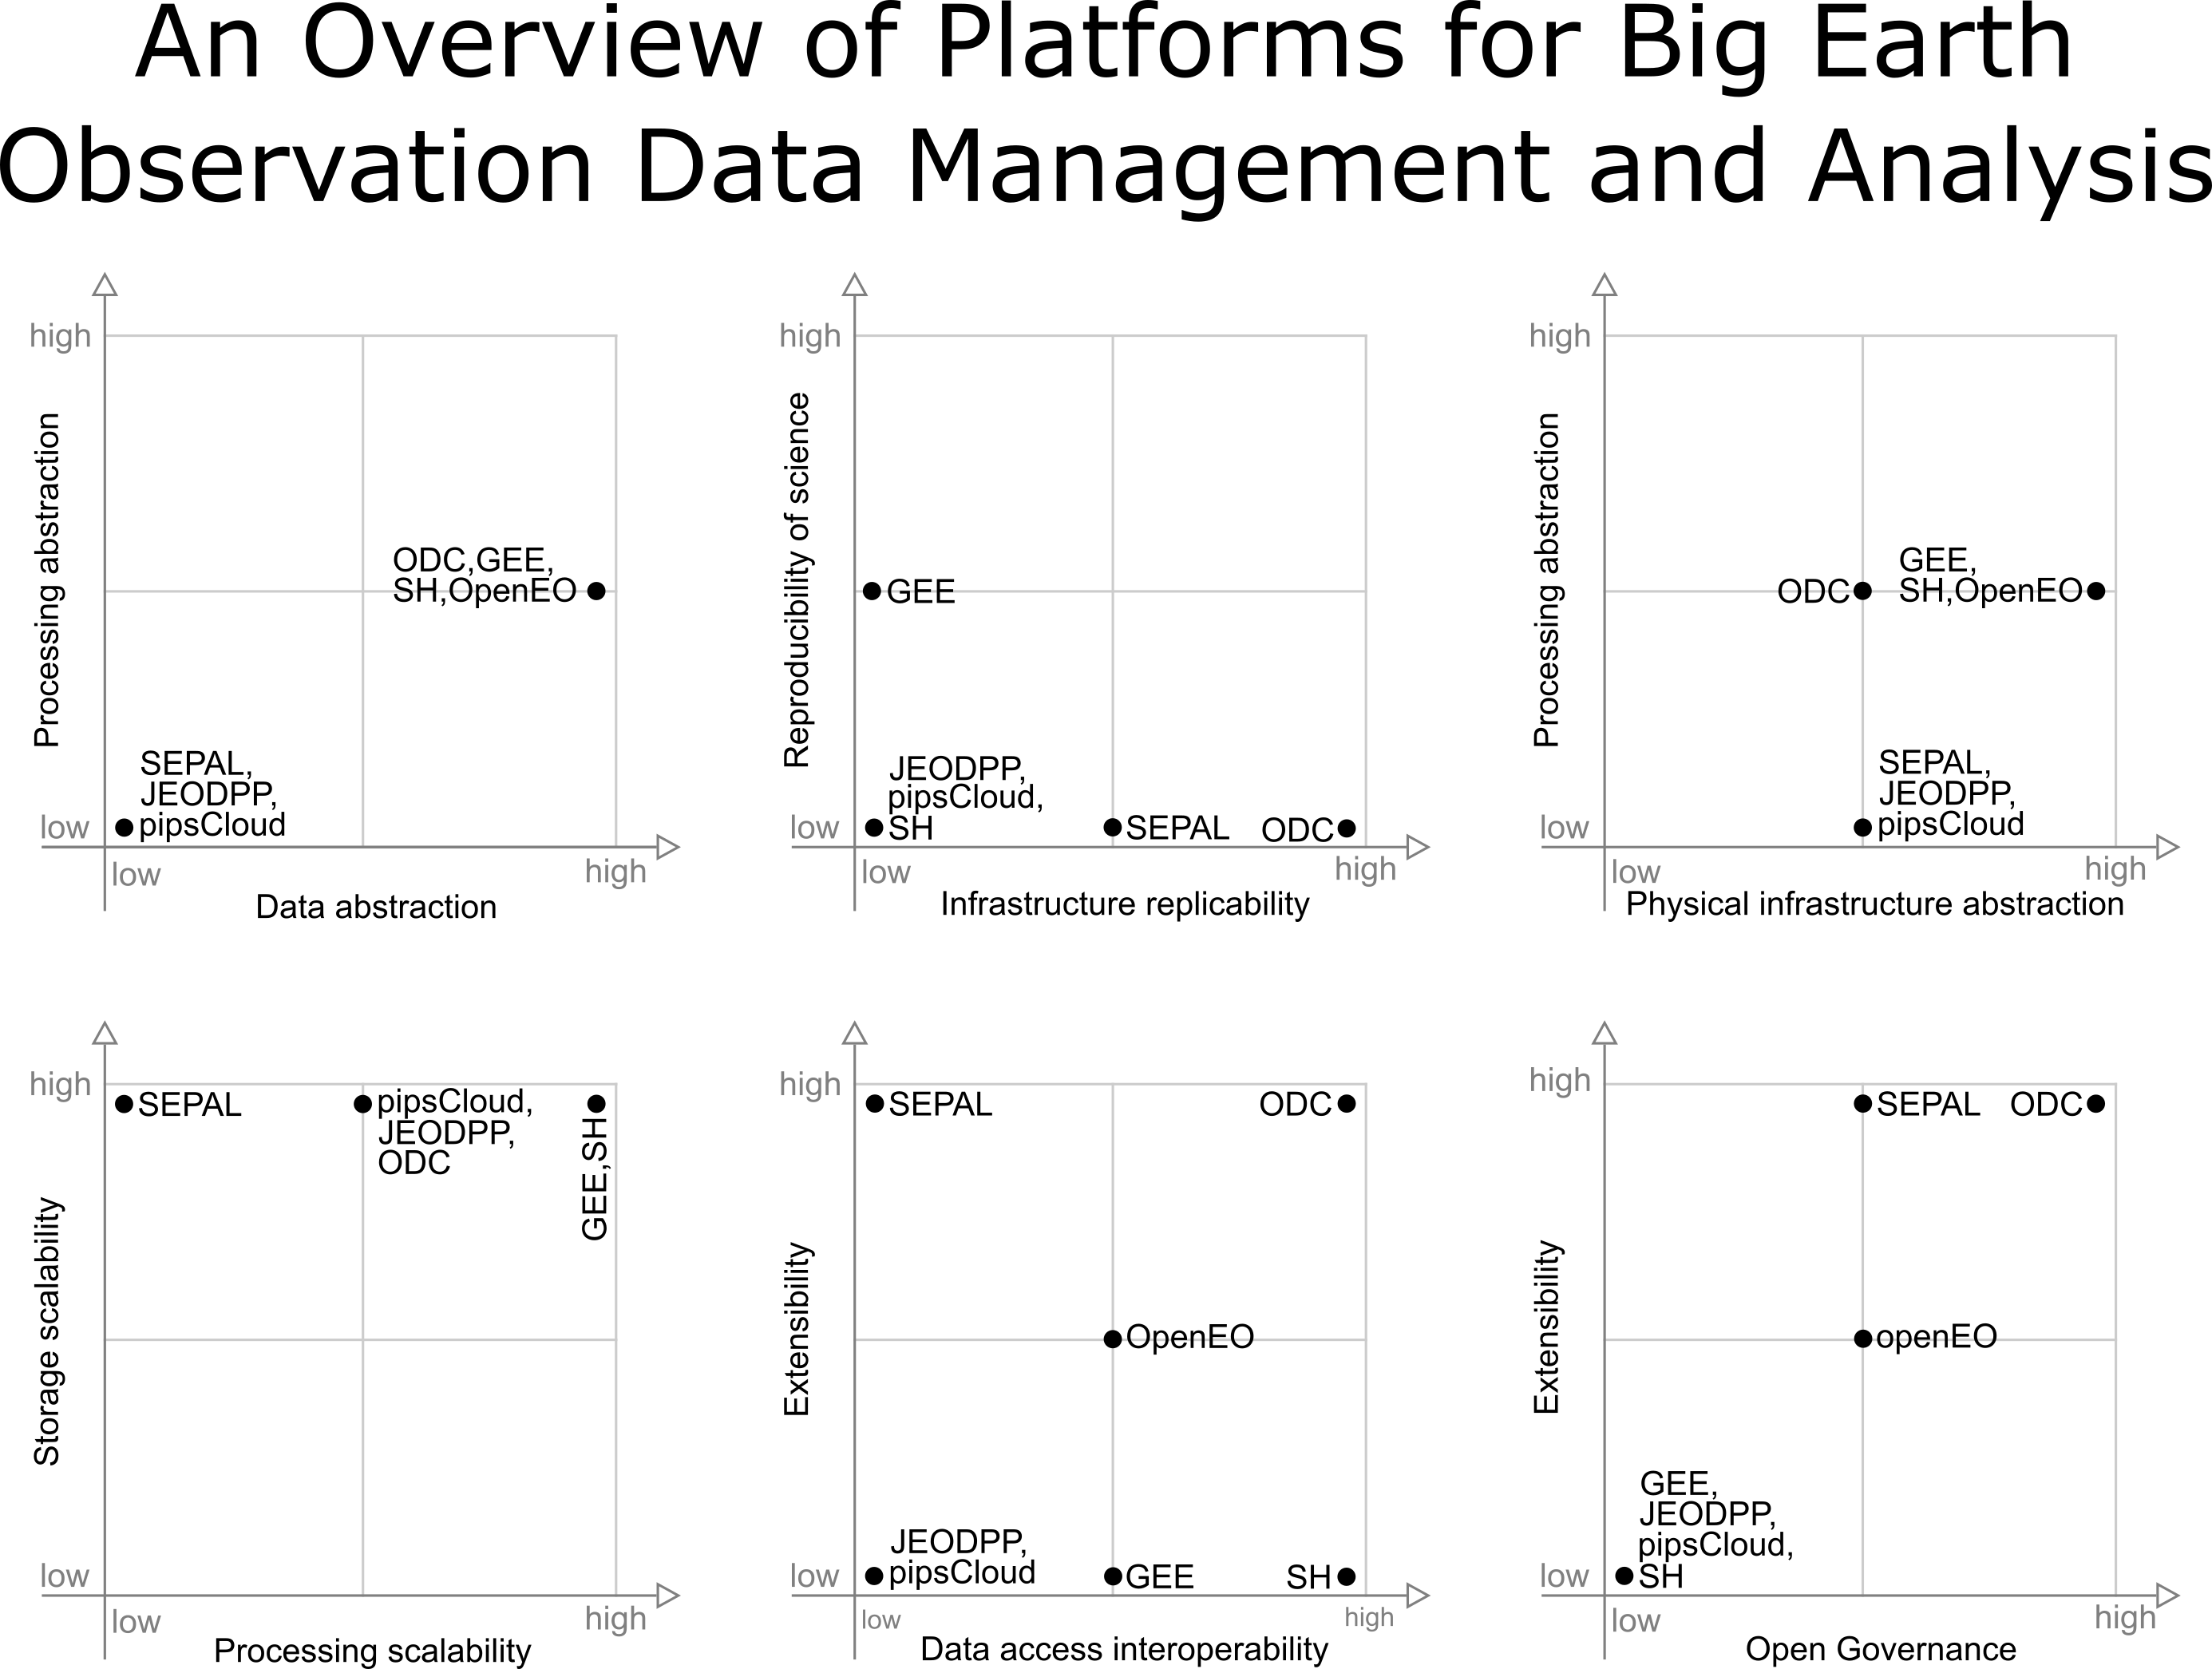
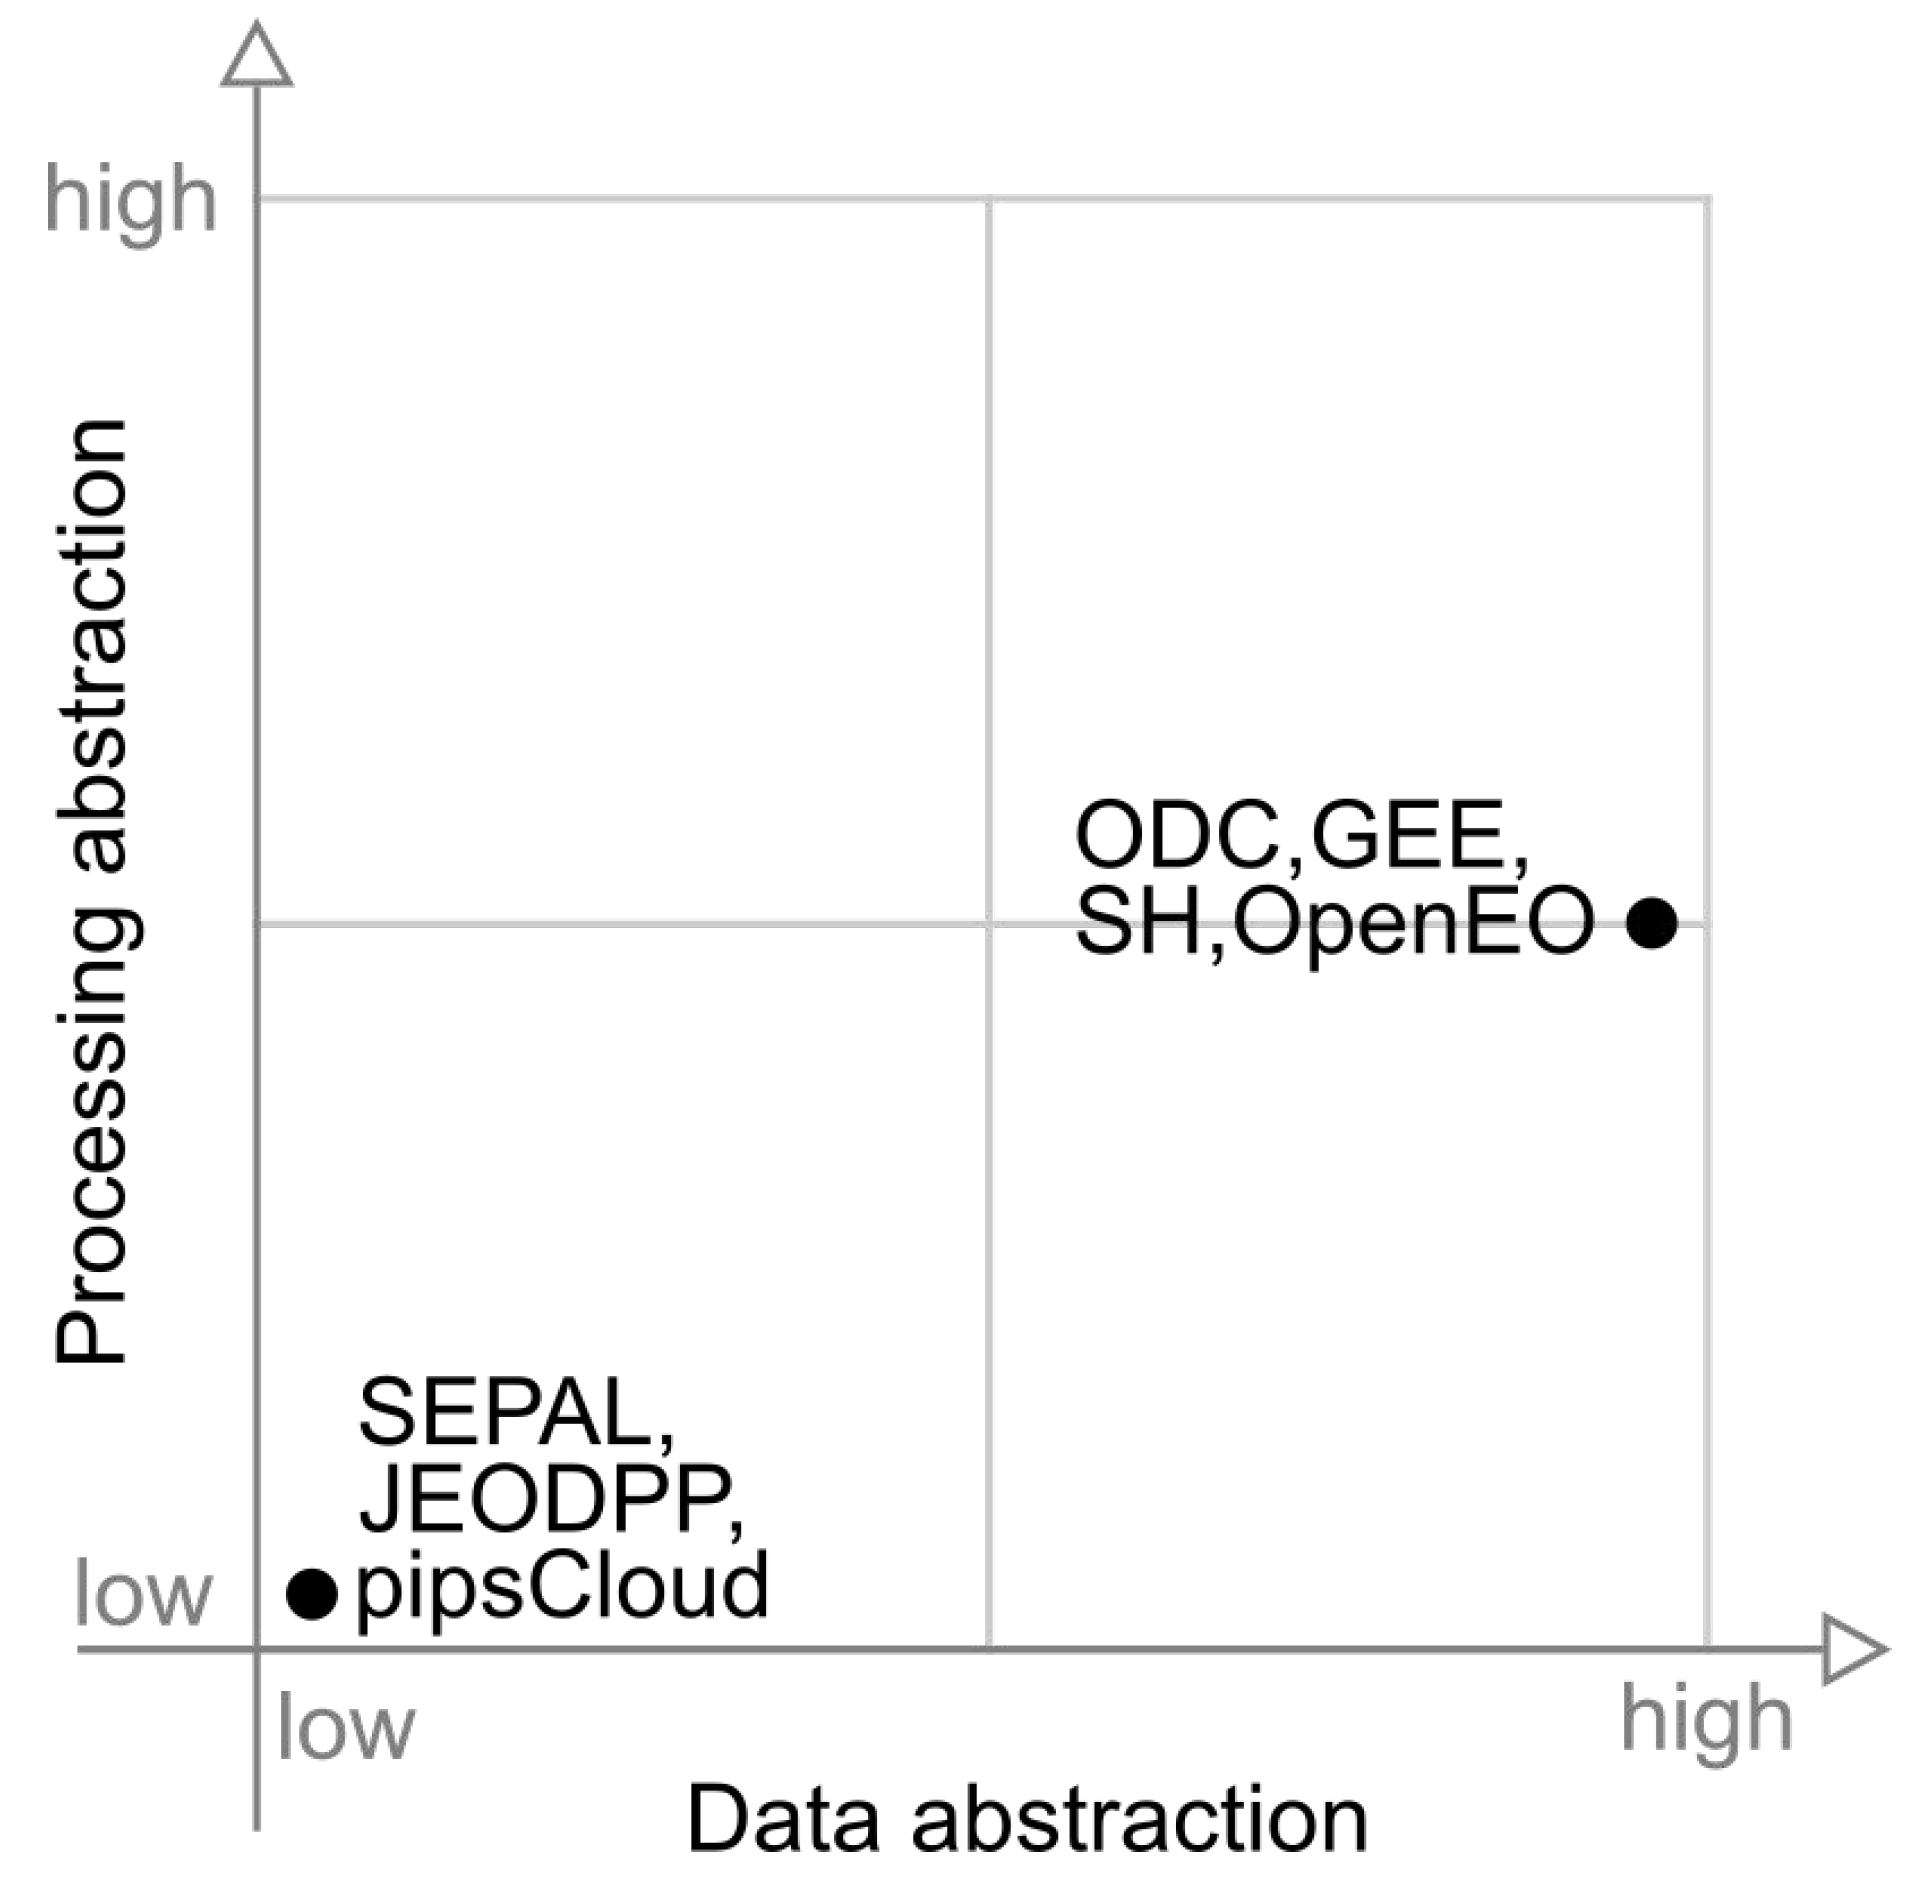
To summarize and visually illustrate the rating levels assigned to each platform in the analyzed capacities, we produced six graphs. Each graph shows a pair of capacities. When possible, capabilities were grouped by similarities, such as abstraction and scalability issues.
Figure 8 presents a graph illustrating the position of each platform in relation to data abstraction and processing abstraction capabilities. In this figure, we observe two groups of platforms, those with low data and processing abstraction (SEPAL, JEODPP and pipsCloud) and those with high data abstraction and medium processing abstraction (ODC, GEE and OpenEO).
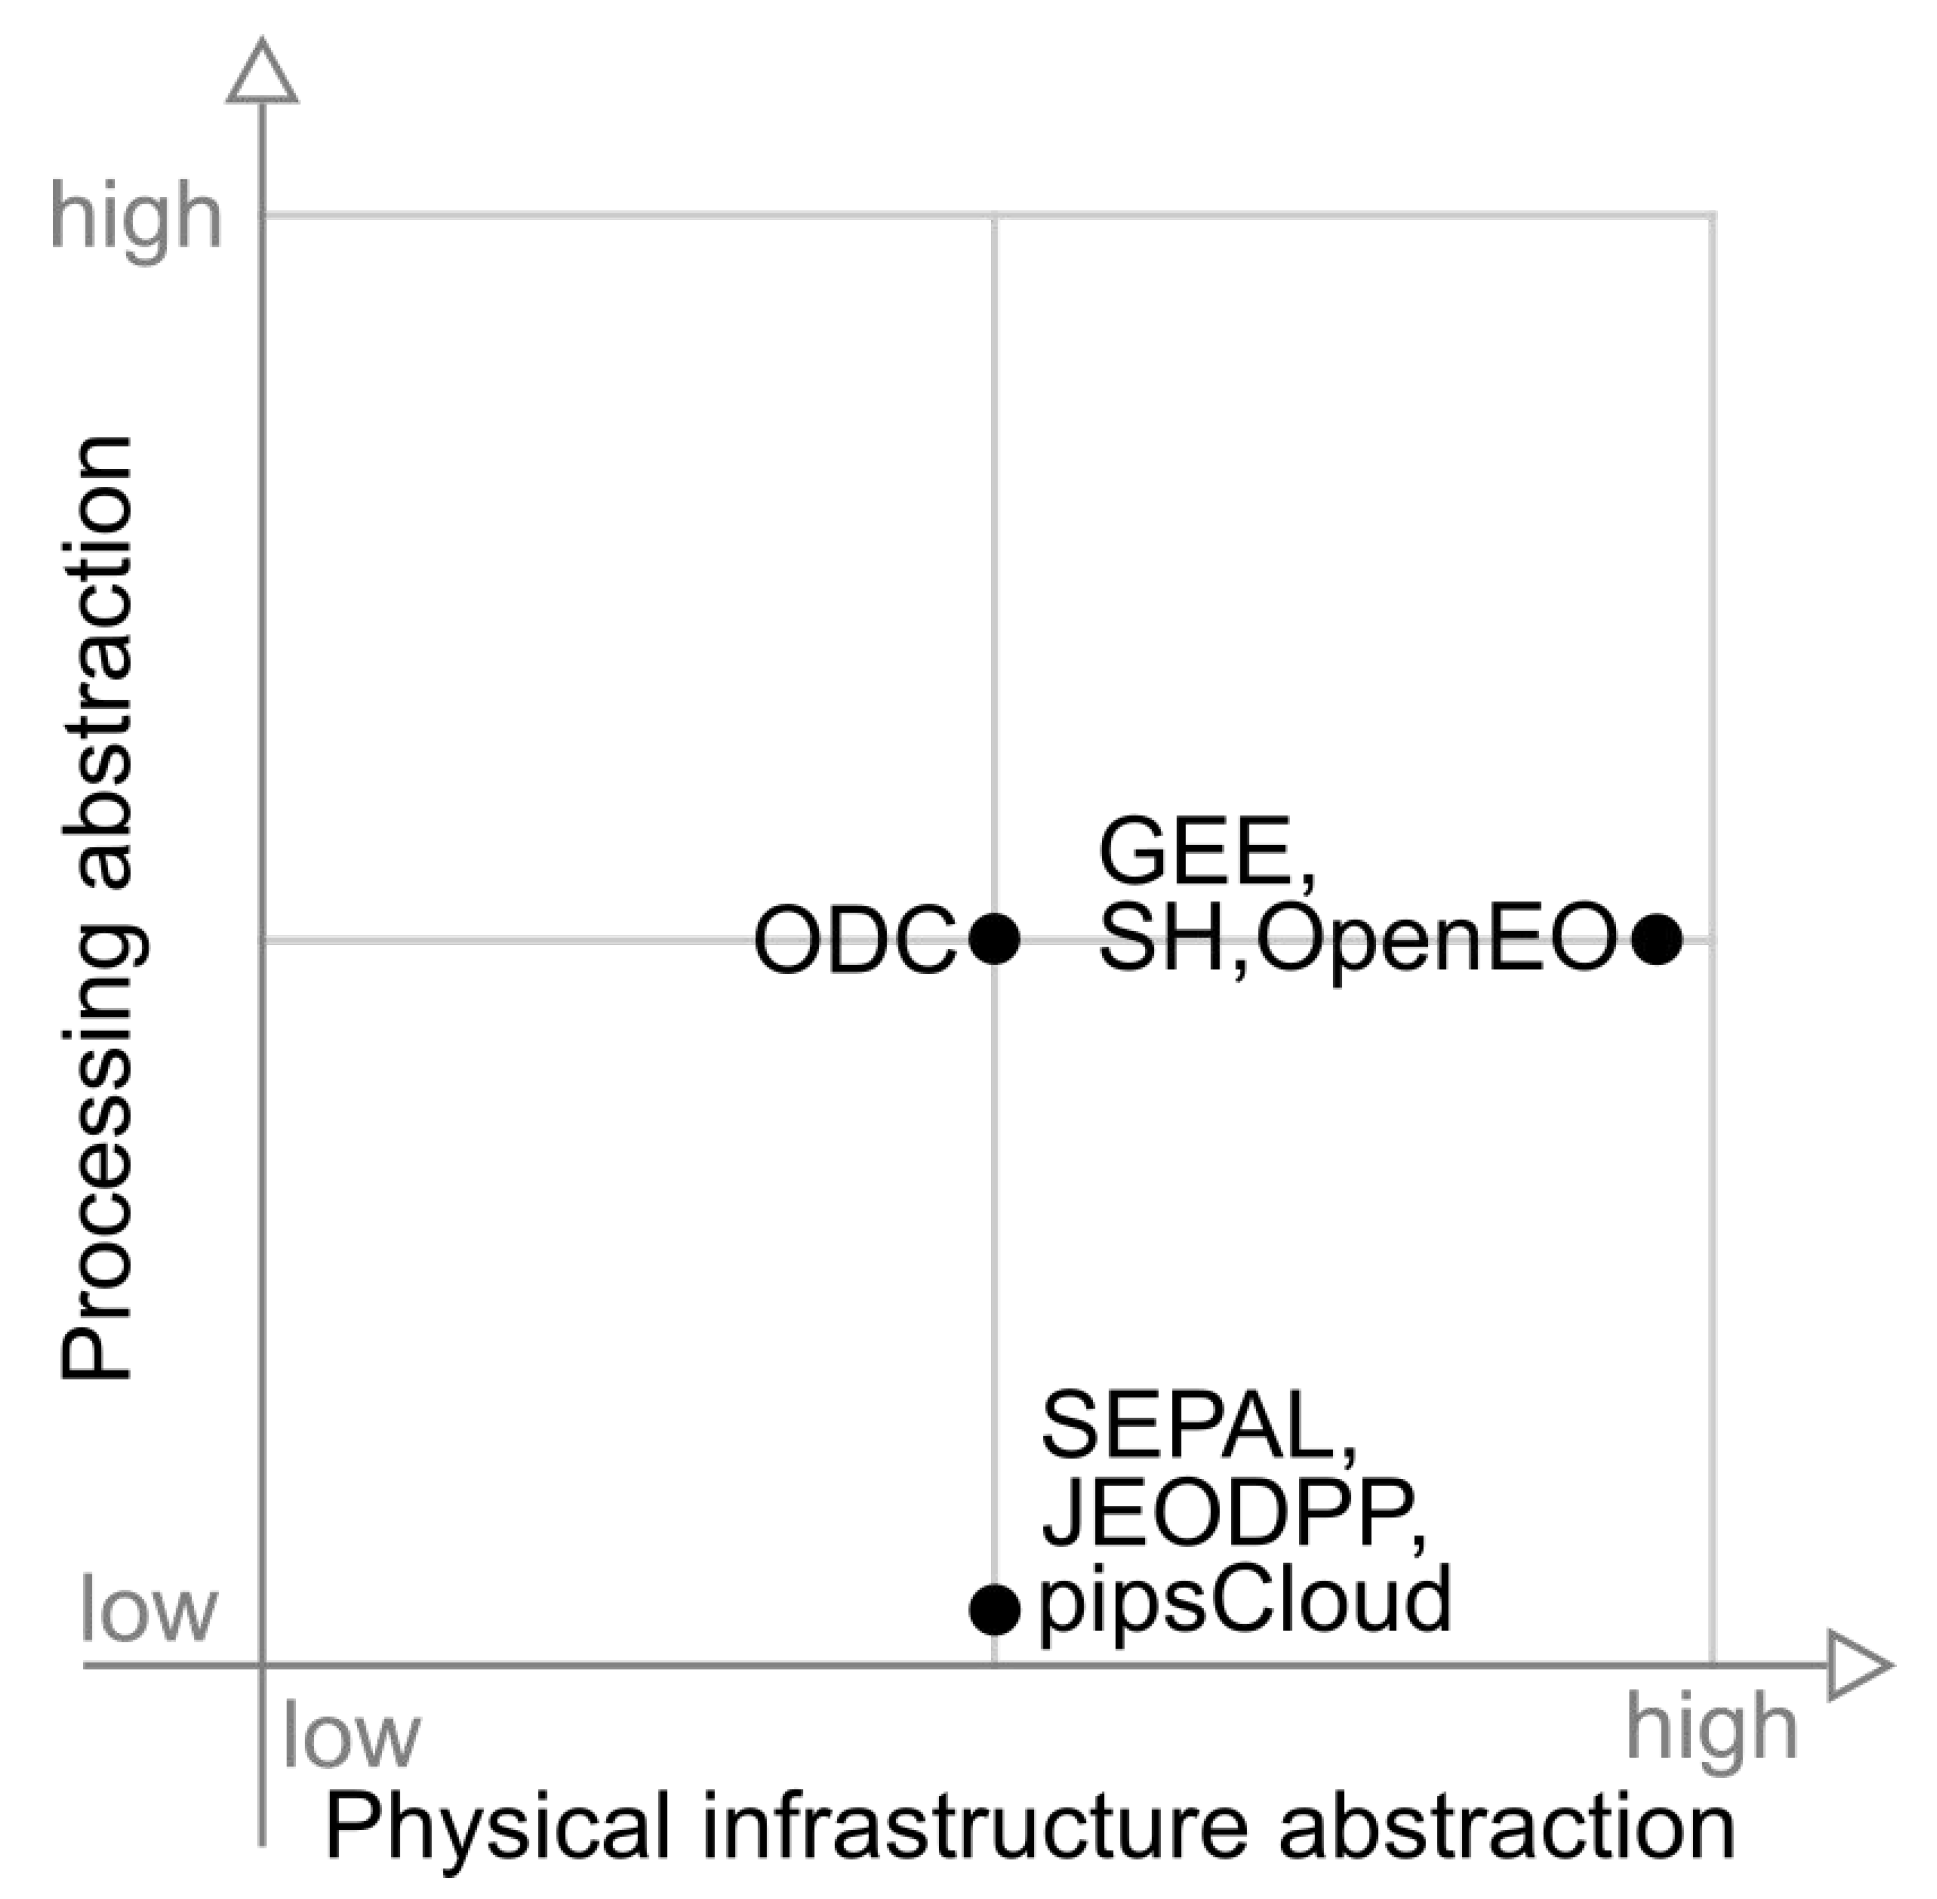
Figure 9 illustrates the distribution of platforms against processing and physical infrastructure abstractions. In this figure, SEPAL, JEODPP and pipscloud platforms are grouped with low processing abstraction and medium level of physical infrastructure abstraction capability. ODC presents medium classification in both categories presented in this figure.
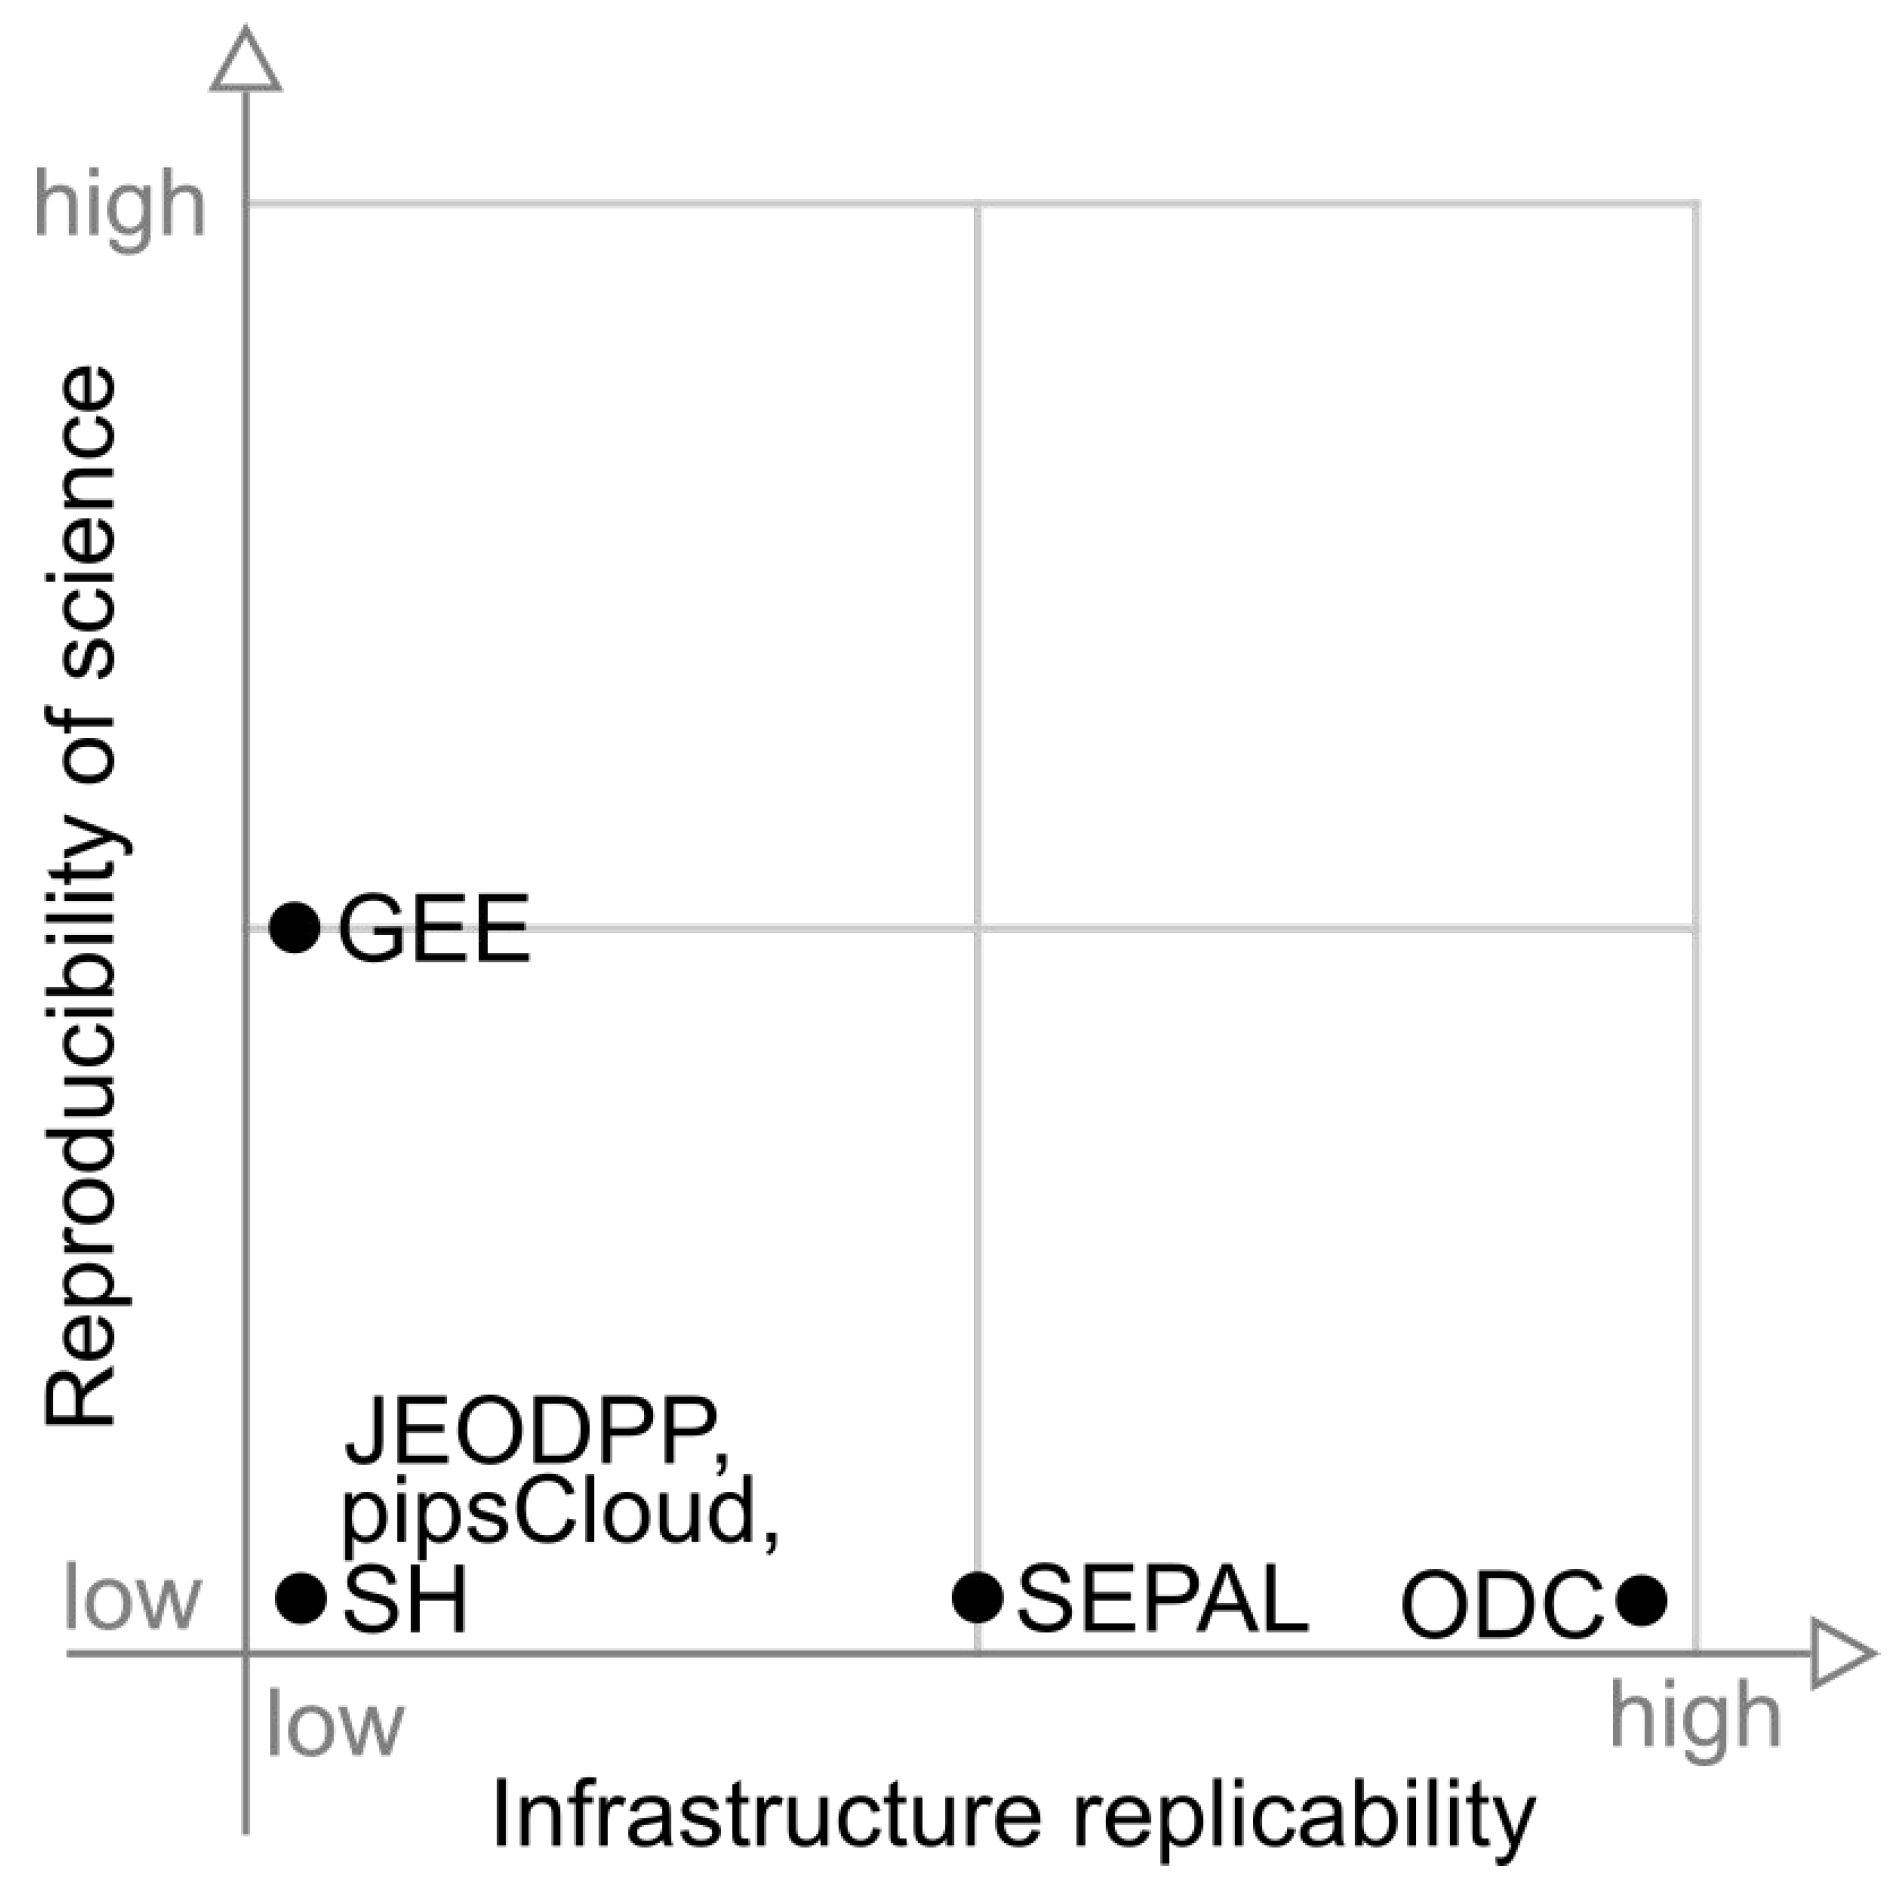
Figure 10 presents the position of each platform in relation to reproducibility of science and infrastructure replicability. In this graph we can observe that, in terms of infrastructure replicability, the highlight is ODC, while GEE stands out in the reproducibility of science axis. JEODPP, pipsCloud, and SH have none of these capabilities.
Figure 11 presents a graph that shows platforms in relation to storage scalability and processing scalability capabilities. Note that all platforms appear at the top of the this figure. SEPAL appears in the top left corner, pipsCloud, JEODPP and ODC are rated with medium processing scalability and the platforms that appear in the upper right are only GEE and SH.
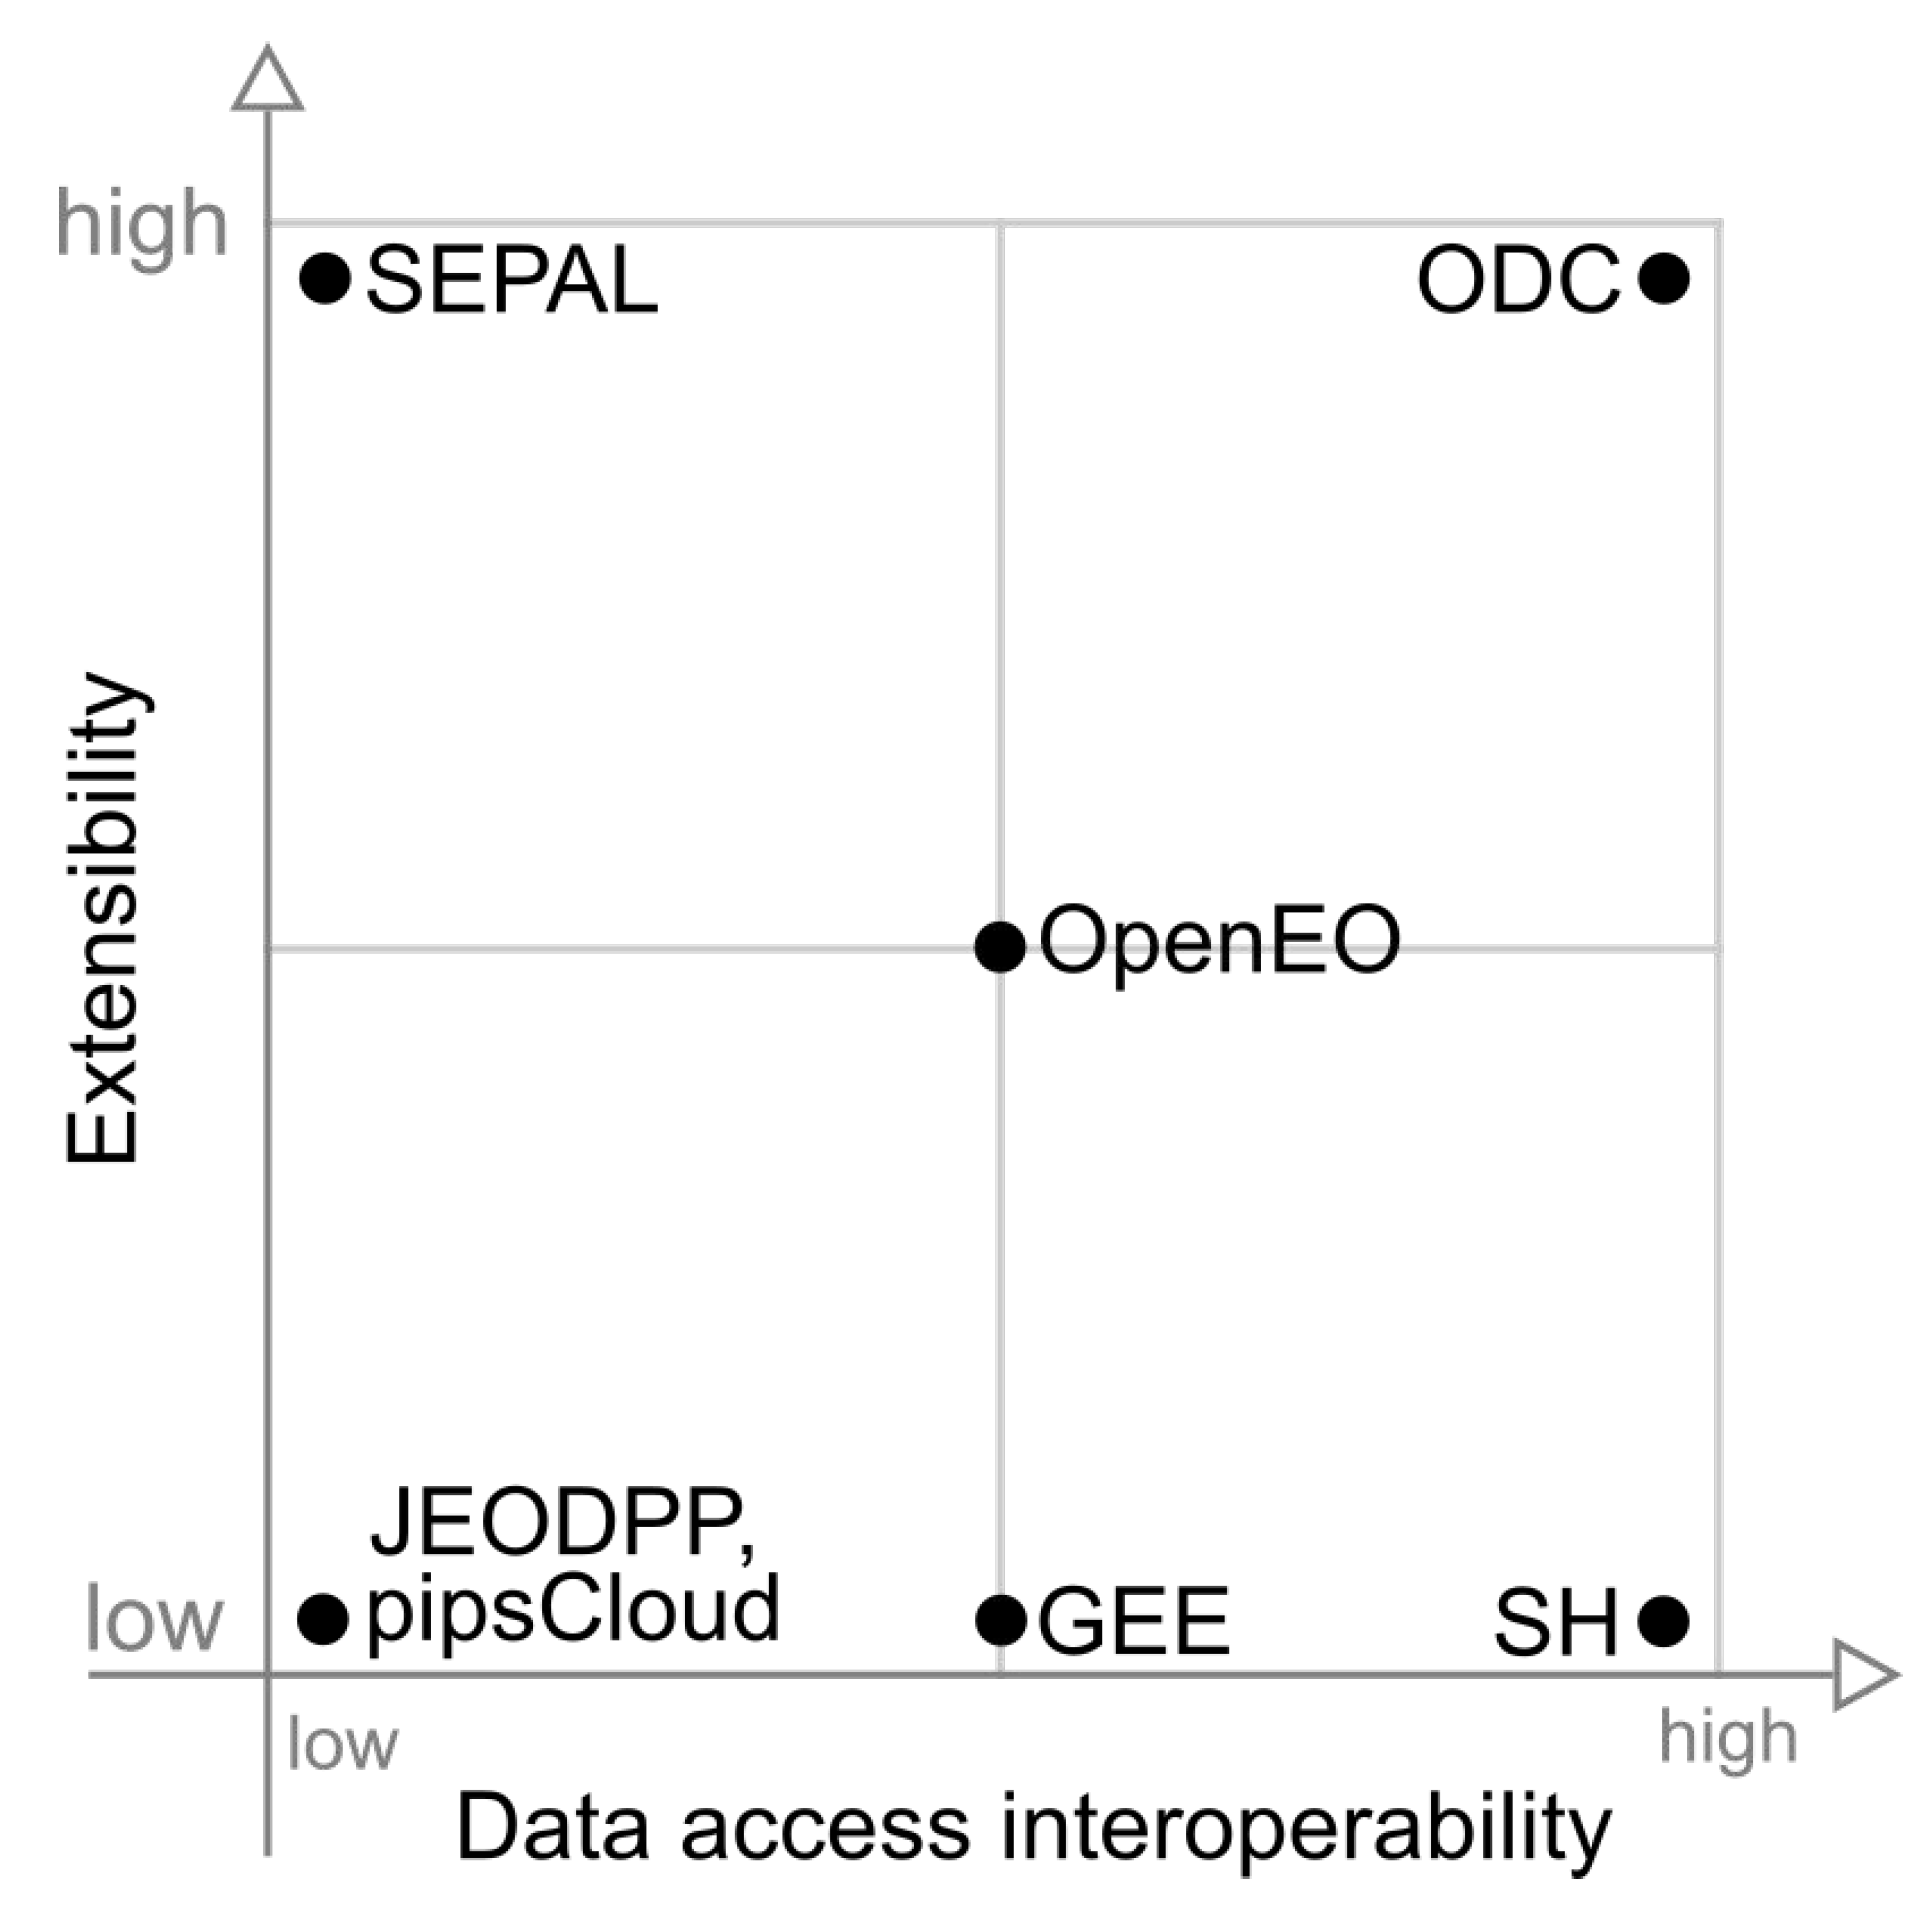
Figure 12 maps the extensibility and data access interoperability capabilities. Among the graphs showed in this paper, this graph presents the largest dispersion among the capabilities of the platforms. At the lower left corner, we have JEODPP and pipsCloud, while in the lower right corner only the SH appears. ODC appears at the upper right corner, highlighting its high level in these two capabilities. SEPAL is in the northwest corner, showing good extensibility, while GEE shows a medium data access interoperability.
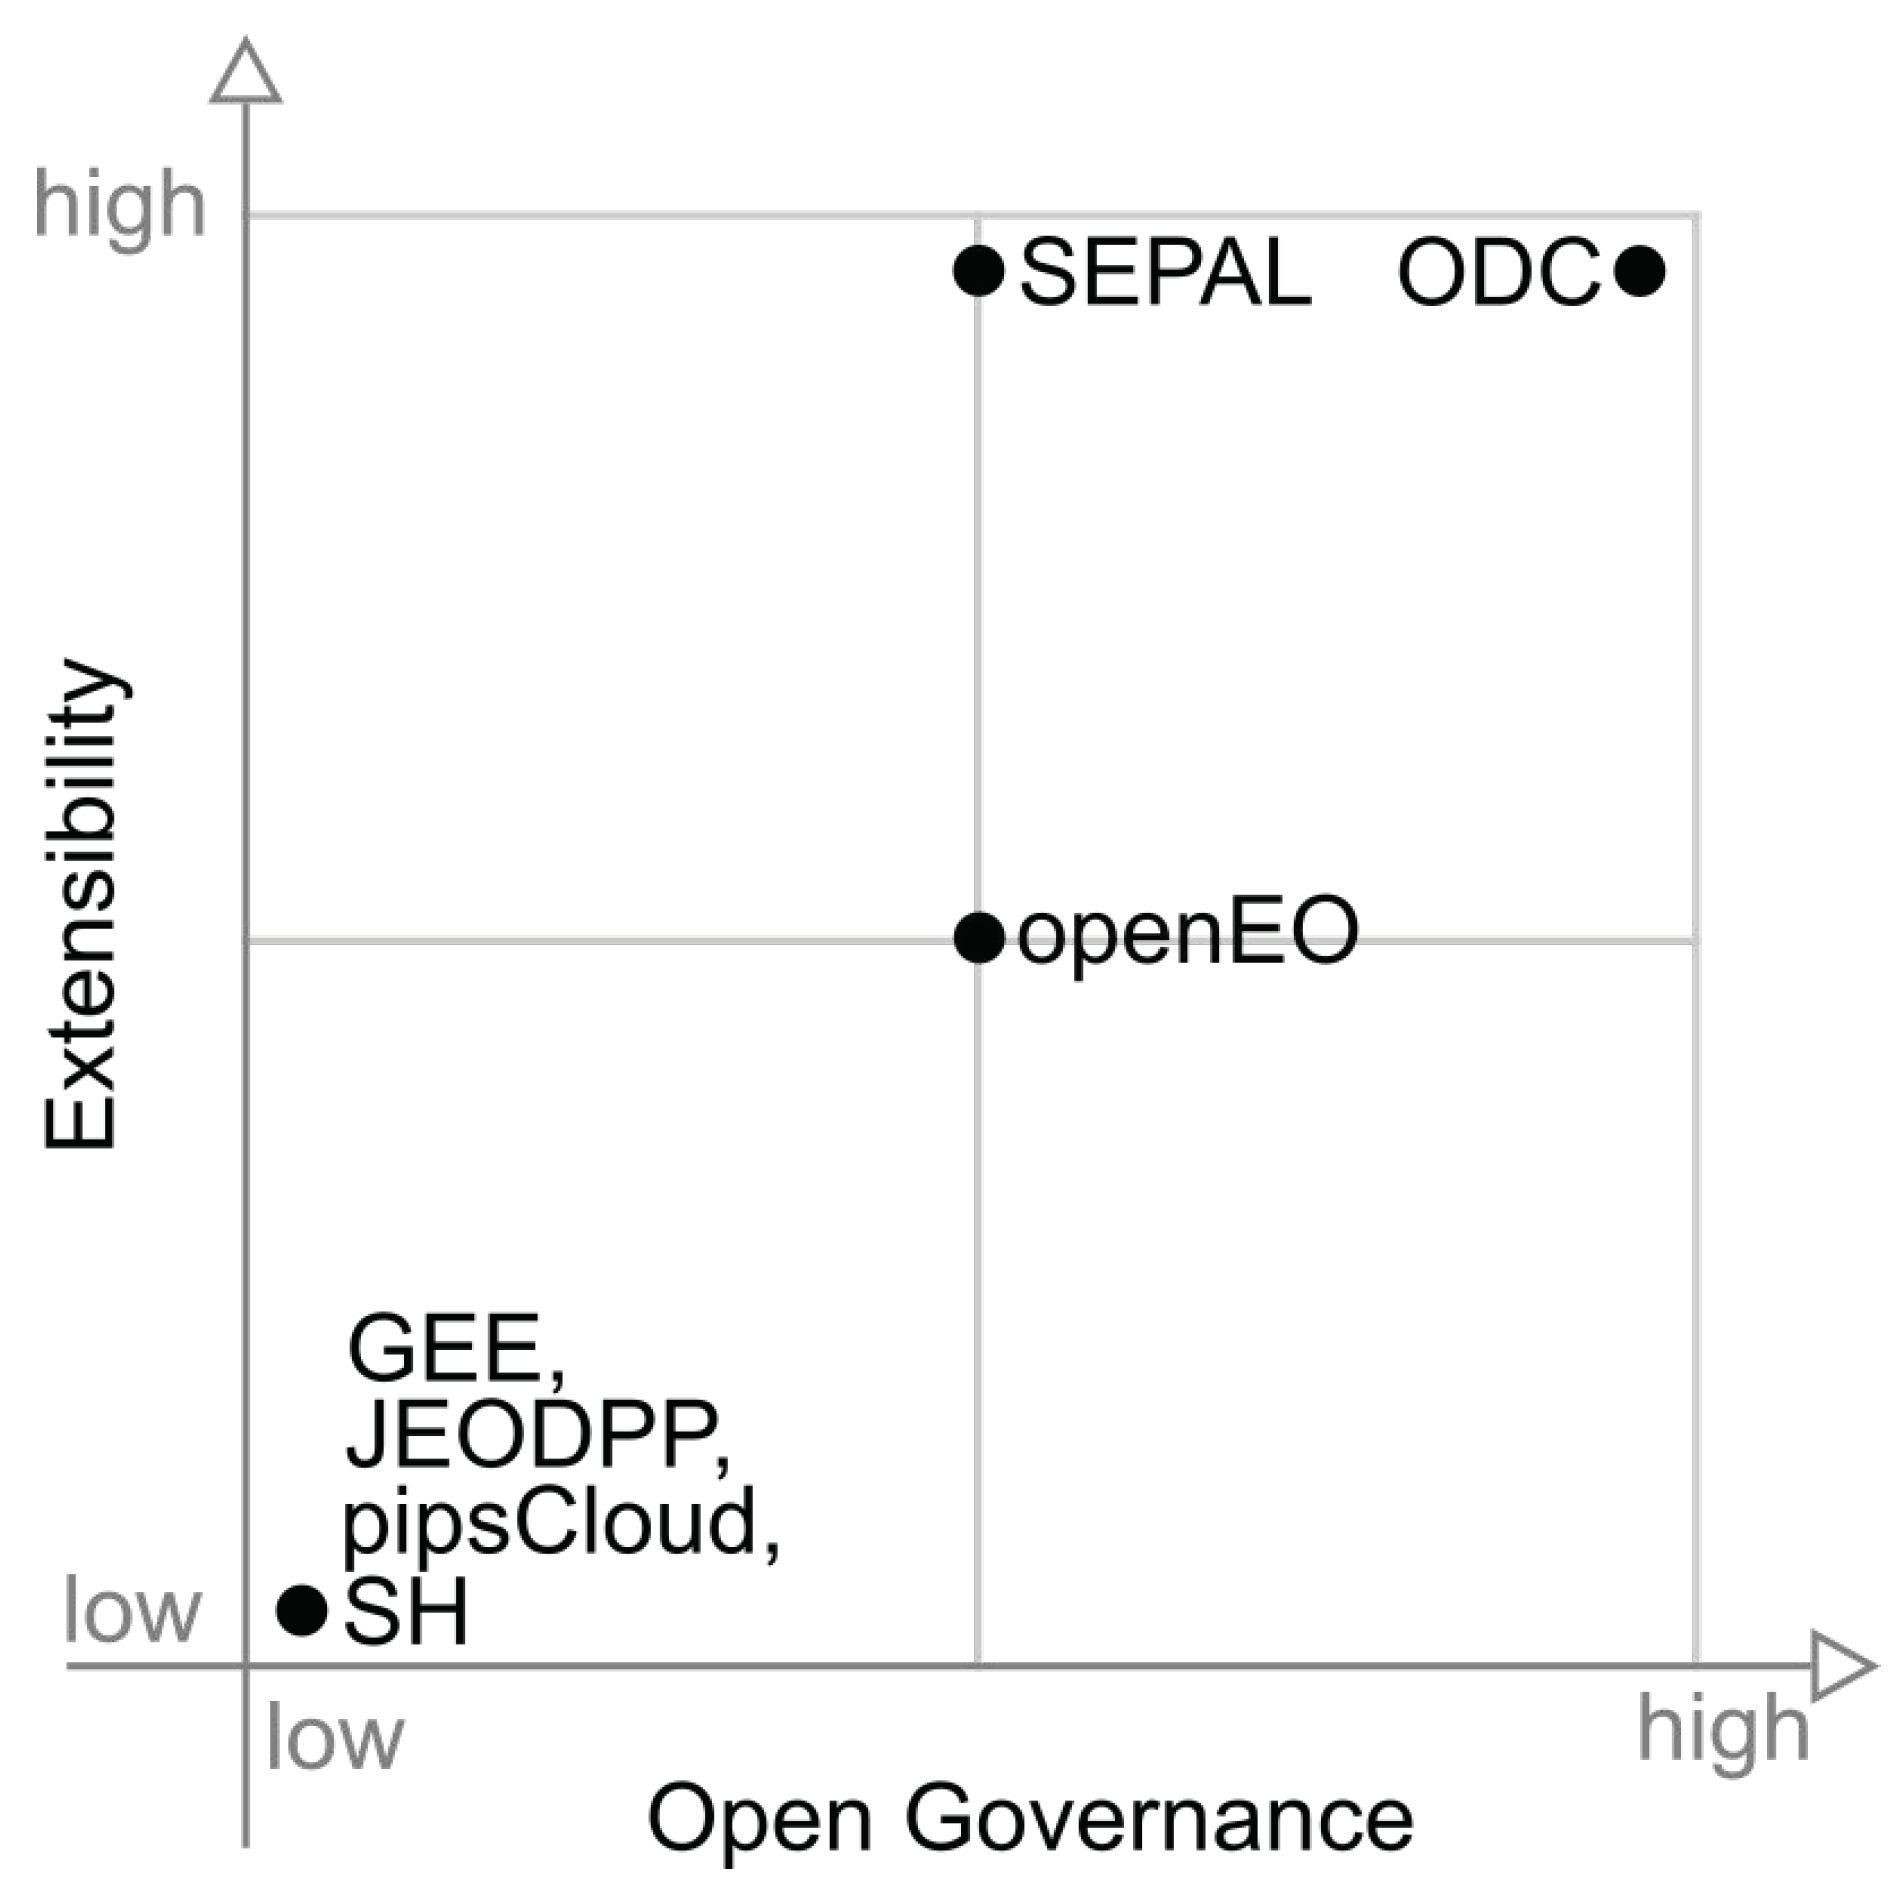
Figure 13 presents a graph relating the extensibility and open governance capabilities. In this figure we can observe four groups. The first is formed by the platforms GEE, JEODPP, pipsCloud and SH that does not have these capabilities. The in the upper part, SEPAL appears on the center of the open governance axis, while ODC appears on the right edge. The latter group appears at the center of both axes and is formed only by OpenEO platform.
4. Final Remarks and Discussion
From the point of view of data abstraction and processing, OpenEO is the system that provides the most flexible solution to the scientist. Process chaining through Process Graphs allows a high degree of abstraction of processing tasks, equivalent to the solution used by GEE. Besides that, OpenEO allows the scientist to use User Defined Functions, which allow data processing in different modes (scenes, time series, cubes and windows). The shortcoming of this processing mode is the lack of support to operate on more than one image.
On the other hand, OpenEO cannot guarantee that back-end systems will provide data, features, and implementations that are compatible with each other. This fact can limit the execution of the same analysis on different back-ends or require researchers to adapt their applications.
From the standpoint of ease of use and development maturity, GEE is the platform that delivers the best solution for users. However, it has limitations because it is a closed platform, especially as to guarantee the reproducibility of the analyses. Another important issue to consider is the lack of guarantee of platform continuity, as it is not possible to replicate GEE in particular infrastructure. These drawbacks are also shared by Sentinel Hub.
The technological solution adopted by SEPAL is more focused on infrastructure management and the provision of tools for the analysis of EO data. Big data challenges are not directly addressed by this platform, leaving the user with the burden to make efficient use of available hardware and software resources. The ability to order hardware on demand, as provided by this platform, implies moving data to perform processing. This strategy may be efficient for CPU-bound tasks, but in I/O-bound computations, the approach of moving analysis closer to the data (moving code paradigm) is more appropriate.
Among the analyzed platforms, ODC is the solution that presents the best balance between the analyzed capacities. The drawback of the ODC solution is mainly the lack of support for reproducibility of science, which is not found in the others either. On the other hand, the other capacities evaluated are at least partially met.
Recently, ODC has been used by different projects to manage multidimensional data cubes created from remote sensing images for a specific country, such as the Australian Data Cube [44], Swiss Data Cube [48] and Africa Regional Data Cube [53]. In these projects, Analysis Ready Data (ARD) generated from Earth observation satellite images are modeled as multidimensional data cubes, especially for image time series analysis [54]. Such data cubes have three or more dimensions that include space, time and spectral derived properties. These data cubes can also be defined as a set of time series associated to spatially aligned pixels ready for analysis [55].
This novel worldwide trend in creating multidimensional data cubes from big amounts of remote sensing images brings new challenges for SDI. A novel generation of SDI has to properly store, access, visualize and analyze these multidimensional data cubes, based on image time series processing. Following this trend, ODC provides functions to index multidimensional data cubes and to handle them, partially meeting these challenges.
Building a platform that fully meets all the capabilities discussed in this paper is a big challenge. The greater the degree of abstraction delivered to the scientist, the greater the difficulty in providing flexibility in data processing approaches. The solution, perhaps, is to provide a platform with two forms of processing for the scientist. The most frequently used features could be made available through a high abstraction API, similar to that provided by OpenEO and GEE. For more complex analyzes, the platform could allow its extension through a framework, such as the solution adopted by ODC, so that the scientist has direct access to data and infrastructure processing capabilities. Besides that, the use of distributed data storage is important to minimize data movement during processing. In this approach, processing would occur where data is stored, using the moving code approach. In the scenario presented in this paper, we believe that ODC is the solution that presents the best conditions to evolve to a platform with these characteristics.
Author Contributions
Conceptualization, V.C.F.G., G.R.Q. and K.R.F.; Funding acquisition, G.R.Q. and K.R.F.; Investigation, V.C.F.G.; Project administration, G.R.Q. and K.R.F.; Supervision, G.R.Q. and K.R.F.; Writing—original draft, V.C.F.G.; Writing—review & editing, G.R.Q. and K.R.F. All authors have read and agreed to the published version of the manuscript.
Funding
This study was financed in part by the Coordenação de Aperfeiçoamento de Pessoal de Nível Superior–Brasil (CAPES)–Finance Code 001 and by the Environmental Monitoring of Brazilian Biomes project (Brazil Data Cube), funded by the Amazon Fund through the financial collaboration of the Brazilian Development Bank (BNDES) and the Foundation for Science, Technology and Space Applications (FUNCATE), Process 17.2.0536.1 (ARS, AS, MP).
Conflicts of Interest
The authors declare no conflict of interest.
References
- Appel, M.; Lahn, F.; Buytaert, W.; Pebesma, E. Open and scalable analytics of large Earth observation datasets: From scenes to multidimensional arrays using SciDB and GDAL. ISPRS J. Photogramm. Remote Sens. 2018, 138, 47–56. [Google Scholar] [CrossRef]
- Stromann, O.; Nascetti, A.; Yousif, O.; Ban, Y. Dimensionality Reduction and Feature Selection for Object-Based Land Cover Classification based on Sentinel-1 and Sentinel-2 Time Series Using Google Earth Engine. Remote Sens. 2020, 12, 76. [Google Scholar] [CrossRef] [Green Version]
- Soille, P.; Burger, A.; De Marchi, D.; Kempeneers, P.; Rodriguez, D.; Syrris, V.; Vasilev, V. A versatile data-intensive computing platform for information retrieval from big geospatial data. Future Gener. Comput. Syst. 2018, 81, 30–40. [Google Scholar] [CrossRef]
- Müller, M.; Bernard, L.; Brauner, J. Moving code in spatial data infrastructures–web service based deployment of geoprocessing algorithms. Trans. GIS 2010, 14, 101–118. [Google Scholar] [CrossRef]
- Camara, G.; Assis, L.F.; Ribeiro, G.; Ferreira, K.R.; Llapa, E.; Vinhas, L. Big earth observation data analytics: Matching requirements to system architectures. In Proceedings of the 5th ACM SIGSPATIAL International Workshop On Analytics for Big Geospatial Data, Burlingame, CA, USA, 31 October 2016; ACM: New York, NY, USA, 2016; pp. 1–6. [Google Scholar] [CrossRef]
- Rajabifard, A.; Williamson, I.P. Spatial data infrastructures: Concept, SDI hierarchy and future directions. In Proceedings of the GEOMATICS’80 Conference, Proceedings Geomatics, Tehran, Iran, 29 May–2 April 2001. [Google Scholar]
- OGC. OGC Standards and Supporting Documents. 2019. Available online: http://www.opengeospatial.org/standards/ (accessed on 12 December 2019).
- Müller, M. Service-Oriented Geoprocessing in Spatial Data Infrastructures. Ph.D. Thesis, Technische Universität Dresden, Dresden, Germany, 2016. [Google Scholar]
- Yue, P.; Zhang, C.; Zhang, M.; Zhai, X.; Jiang, L. An SDI approach for big data analytics: The case on sensor web event detection and geoprocessing workflow. IEEE J. Sel. Top. Appl. Earth Obs. Remote Sens. 2015, 8, 4720–4728. [Google Scholar] [CrossRef]
- Yue, P.; Ramachandran, R.; Baumann, P.; Khalsa, S.J.S.; Deng, M.; Jiang, L. Recent activities in Earth data science [technical committees]. IEEE Geosci. Remote Sens. Mag. 2016, 4, 84–89. [Google Scholar] [CrossRef]
- Woodcock, R.; Cecere, T.; Mitchell, A.; Killough, B.; Dyke, G.; Ross, J.; Albani, M.; Ward, S.; Labahn, S. CEOS Future Data Access and Analysis Architectures Study. Available online: http://ceos.org/document_management/Meetings/Plenary/30/Documents/5.2_Future-Data-Architectures-Interim-Report_v.1.pdf (accessed on 13 June 2019).
- Sedona, R.; Cavallaro, G.; Jitsev, J.; Strube, A.; Riedel, M.; Benediktsson, J.A. Remote sensing big data classification with high performance distributed deep learning. Remote Sens. 2019, 11, 3056. [Google Scholar] [CrossRef] [Green Version]
- Merticariu, G.; Misev, D.; Baumann, P. Towards a general array database benchmark: Measuring storage access. In Big Data Benchmarking; Springer: Cham, Switzerland, 2015; pp. 40–67. [Google Scholar]
- Baumann, P.; Dehmel, A.; Furtado, P.; Ritsch, R.; Widmann, N. The multidimensional database system RasDaMan. In Proceedings of the 1998 ACM SIGMOD International Conference on Management of Data, Seattle, WA, USA, 1–4 June 1998; Volume 27, pp. 575–577. [Google Scholar] [CrossRef]
- Stonebraker, M.; Duggan, J.; Battle, L.; Papaemmanouil, O. SciDB DBMS Research at M.I.T. IEEE Data Eng. Bull. 2013, 36, 21–30. [Google Scholar]
- Papadopoulos, S.; Madden, S.; Mattson, T. The TileDB Array Data Storage Manager. Proc. VLDB Endow. 2016, 10, 349–360. [Google Scholar] [CrossRef] [Green Version]
- Guo, Z.; Fox, G.; Zhou, M. Investigation of data locality in MapReduce. In Proceedings of the 12th IEEE/ACM International Symposium on Cluster, Cloud and Grid Computing, CCGrid 2012, Ottawa, ON, Canada, 13–16 May 2012; pp. 419–426. [Google Scholar] [CrossRef] [Green Version]
- Ghemawat, S.; Gobioff, H.; Leung, S.T. The Google File System. In Proceedings of the 19th ACM Symposium on Operating Systems Principles, Bolton Landing, NY USA, 21–24 October 2003; pp. 20–43. [Google Scholar]
- Shvachko, K.; Kuang, H.; Radia, S.; Chansler Yahoo, R. The Hadoop Distributed File System. In Proceedings of the IEEE 26th Symposium on Mass Storage Systems and Technologies (MSST), Lake Tahoe, NV, USA, 3–7 May 2010; pp. 1–10. [Google Scholar]
- Blomer, J. A Survey on Distributed File System Technology. J. Phys. 2014, 608, 012039. [Google Scholar] [CrossRef] [Green Version]
- Wang, W.; Ying, L. Data locality in MapReduce: A network perspective. Perform. Eval. 2016, 96, 1–11. [Google Scholar] [CrossRef] [Green Version]
- Assis, L.F.F.G.d.; de Queiroz, G.R.; Ferreira, K.R.; Vinhas, L.; Llapa, E.; Sanchez, A.I.; Maus, V.; Câmara, G. Big data streaming for remote sensing time series analytics using MapReduce. Rev. Bras. Cartogr. 2017, 69, 991–1000. [Google Scholar]
- Wu, Y.; Xiang, Y.; Ge, J.; Muller, P. High-Performance Computing for Big Data Processing. Future Gener. Comput. Syst. 2018, 88, 693–695. [Google Scholar] [CrossRef]
- Baumann, P. The OGC web coverage processing service (WCPS) standard. GeoInformatica 2010, 14, 447–479. [Google Scholar] [CrossRef]
- Baumann, P.; Mazzetti, P.; Ungar, J.; Barbera, R.; Barboni, D.; Beccati, A.; Bigagli, L.; Boldrini, E.; Bruno, R.; Calanducci, A.; et al. Big data analytics for earth sciences: The EarthServer approach. Int. J. Digit. Earth 2016, 9, 3–29. [Google Scholar] [CrossRef]
- Vinhas, L.; Ribeiro De Queiroz, G.; Ferreira, K.R.; Camara, G. Web Services for Big Earth Observation Data. Geoinfo 2016 2016, 69, 166–177. [Google Scholar]
- Amazon Web Services. Open Data on AWS. 2020. Available online: https://aws.amazon.com/opendata/ (accessed on 26 March 2020).
- Copernicus. DIAS|Copernicus. 2020. Available online: https://www.copernicus.eu/en/access-data/dias/ (accessed on 26 March 2020).
- CREODIAS. What is CREODIAS? 2020. Available online: https://creodias.eu/ (accessed on 26 March 2020).
- Mundi Web Services. 2020. Available online: https://mundiwebservices.com/ (accessed on 26 March 2020).
- ONDA. 2020. Available online: https://www.onda-dias.eu/ (accessed on 26 March 2020).
- WEkEO. 2020. Available online: https://www.wekeo.eu/ (accessed on 26 March 2020).
- Sobloo. 2020. Available online: https://sobloo.eu/ (accessed on 26 March 2020).
- Sinergise. Sentinel Hub by Sinergise. 2020. Available online: https://www.sentinel-hub.com/ (accessed on 10 January 2020).
- Gorelick, N.; Hancher, M.; Dixon, M.; Ilyushchenko, S.; Thau, D.; Moore, R. Google Earth Engine: Planetary-scale geospatial analysis for everyone. Remote Sens. Environ. 2017, 202, 18–27. [Google Scholar] [CrossRef]
- Open Data Cube. 2019. Available online: https://www.opendatacube.org/ (accessed on 13 June 2019).
- FAO. SEPAL Repository. 2020. Available online: https://github.com/openforis/sepal/ (accessed on 7 February 2020).
- Pebesma, E.; Wagner, W.; Schramm, M.; Von Beringe, A.; Paulik, C.; Neteler, M.; Reiche, J.; Verbesselt, J.; Dries, J.; Goor, E.; et al. OpenEO—A Common, Open Source Interface Between Earth Observation Data Infrastructures and Front-End Applications; Technical Report; Technische Universitaet Wien: Vienna, Austria, 2017. [Google Scholar]
- Wang, L.; Ma, Y.; Yan, J.; Chang, V.; Zomaya, A.Y. pipsCloud: High performance cloud computing for remote sensing big data management and processing. Future Gener. Comput. Syst. 2018, 78, 353–368. [Google Scholar] [CrossRef] [Green Version]
- Shelestov, A.; Lavreniuk, M.; Kussul, N.; Novikov, A.; Skakun, S. Exploring Google Earth Engine Platform for Big Data Processing: Classification of Multi-Temporal Satellite Imagery for Crop Mapping. Front. Earth Sci. 2017, 5, 17. [Google Scholar] [CrossRef] [Green Version]
- Goldblatt, R.; You, W.; Hanson, G.; Khandelwal, A. Detecting the Boundaries of Urban Areas in India: A Dataset for Pixel-Based Image Classification in Google Earth Engine. Remote Sens. 2016, 8, 634. [Google Scholar] [CrossRef] [Green Version]
- Google. Google Earth Engine. 2020. Available online: https://earthengine.google.com/ (accessed on 27 March 2020).
- Sentinel-Hub. Sentinel-Hub Documentation. 2020. Available online: https://docs.sentinel-hub.com/api/ (accessed on 10 January 2020).
- Lewis, A.; Oliver, S.; Lymburner, L.; Evans, B.; Wyborn, L.; Mueller, N.; Raevksi, G.; Hooke, J.; Woodcock, R.; Sixsmith, J.; et al. The Australian Geoscience Data Cube—Foundations and lessons learned. Remote Sens. Environ. 2017, 202, 276–292. [Google Scholar] [CrossRef]
- Open Data Cube. Open Data Cube Manual. 2020. Available online: https://datacube-core.readthedocs.io/en/latest/ (accessed on 7 February 2020).
- Open Data Cube. Open Data Cube Repository. 2020. Available online: https://github.com/opendatacube/ (accessed on 7 February 2020).
- Open Data Cube. The “Road to 20” International Data Cube Deployments. Available online: https://www.opendatacube.org/road-to-20/ (accessed on 13 June 2019).
- Giuliani, G.; Chatenoux, B.; De Bono, A.; Rodila, D.; Richard, J.P.; Allenbach, K.; Dao, H.; Peduzzi, P. Building an Earth Observations Data Cube: Lessons learned from the Swiss Data Cube (SDC) on generating Analysis Ready Data (ARD). Big Earth Data 2017, 1, 100–117. [Google Scholar] [CrossRef] [Green Version]
- Ariza-Porras, C.; Bravo, G.; Villamizar, M.; Moreno, A.; Castro, H.; Galindo, G.; Cabera, E.; Valbuena, S.; Lozano, P. CDCol: A Geoscience Data Cube that Meets Colombian Needs; Advances in Computing; Springer International Publishing: Cham, Switzerland, 2017; pp. 87–99. [Google Scholar] [CrossRef]
- Adde, G.; Chan, B.; Duellmann, D.; Espinal, X.; Fiorot, A.; Iven, J.; Janyst, L.; Lamanna, M.; Mascetti, L.; Rocha, J.M.; et al. Latest evolution of EOS filesystem. J. Phys. Conf. Ser. 2015, 608, 012009. [Google Scholar] [CrossRef] [Green Version]
- OpenEO. OpenEO Documentation. 2020. Available online: https://openeo.org/documentation/0.4/ (accessed on 10 January 2020).
- OpenEO. OpenEO—Concepts and API Reference. 2018. Available online: https://open-eo.github.io/openeo-api/arch/index.html (accessed on 10 January 2020).
- Killough, B. The Impact of Analysis Ready Data in the Africa Regional Data Cube. In Proceedings of the IGARSS 2019—2019 IEEE International Geoscience and Remote Sensing Symposium, Yokohama, Japan, 28 July–2 August 2019; pp. 5646–5649. [Google Scholar] [CrossRef]
- Nativi, S.; Mazzetti, P.; Craglia, M. A View-Based Model of Data-Cube to Support Big Earth Data Systems Interoperability. Big Earth Data 2017, 1, 75–99. [Google Scholar] [CrossRef] [Green Version]
- Appel, M.; Pebesma, E. On-Demand Processing of Data Cubes from Satellite Image Collections with the gdalcubes Library. Data 2019, 4, 92. [Google Scholar] [CrossRef] [Green Version]
Figure 1.
A simplified Google Earth Engine (GEE) system architecture diagram. Source: Gorelick et al. [35].
Figure 1.
A simplified Google Earth Engine (GEE) system architecture diagram. Source: Gorelick et al. [35].

Figure 2.
Sentinel Hub (SH) services and data abstraction diagram.

Figure 3.
Architecture diagram of the Open Data Cube (ODC) platform. Source: Lewis et al. [44].
Figure 3.
Architecture diagram of the Open Data Cube (ODC) platform. Source: Lewis et al. [44].

Figure 4.
Architecture diagram of the System for Earth Observation Data Access, Processing and Analysis for Land Monitoring (SEPAL) platform. Source: FAO [37].
Figure 4.
Architecture diagram of the System for Earth Observation Data Access, Processing and Analysis for Land Monitoring (SEPAL) platform. Source: FAO [37].

Figure 5.
System architecture for interactive visualization and processing ofEarth observation (EO) data on Joint Research Center (JRC) Earth Observation Data and Processing Platform (JEODPP) platform. Source: Soille et al. [3].
Figure 5.
System architecture for interactive visualization and processing ofEarth observation (EO) data on Joint Research Center (JRC) Earth Observation Data and Processing Platform (JEODPP) platform. Source: Soille et al. [3].

Figure 6.
Architecture of the pipsCloud platform. Source: Wang et al. [39].
Figure 6.
Architecture of the pipsCloud platform. Source: Wang et al. [39].

Figure 7.
Architecture of the OpenEO project. Source: Pebesma et al. [38].
Figure 7.
Architecture of the OpenEO project. Source: Pebesma et al. [38].

Figure 8.
Data abstraction vs. Processing abstraction.

Figure 9.
Physical infrastructure abstraction vs. Processing abstraction.

Figure 10.
Infrastructure replicability vs. Reproducibility of science.

Figure 11.
Processing scalability vs. Storage scalability.

Figure 12.
Data access interoperability vs. Extensibility.

Figure 13.
Open Governance vs. Extensibility.


Table 1.
Capacities of the platforms for big EO data management and analysis
| 3 Capability | ODC | GEE | SEPAL | JEODPP | pipsCloud | OpenEO | SH |
|---|---|---|---|---|---|---|---|
| Data abstraction | High: Product and Dataset | High: Image, ImageCollection, Feature and FeatureCollection | Low: Direct file handling | Low: Direct file handling | Low: Direct file handling | High: Collection and Granule | High: Data Source, Instances and Layers |
| Processing abstraction | Medium: Xarray and celery | Medium: Predefined pixel-wise functions | Low: User runs his own code | Low: User runs his own code | Low: User runs his own code | Medium: User-Defined Functions, Process graphs and Jobs | Medium: Custom scripts (Evalscripts) layers perform pixel-wise processing |
| Physical infrastructure abstraction | Medium: Only data storage infrastructure | High: Both data storage and processing infrastructure | Medium: Only data storage infrastructure | Medium: Only data storage infrastructure | Medium: Only data storage infrastructure | High: Both data storage and processing infrastructure | High: Both data storage and processing infrastructure |
| Open Governance | High: Defined governance process | Low: Proprietary software, closed source software | Medium: Only open source repository | Low: Proprietary closed source software | Low: Proprietary closed source software | Medium: Only open source repository | Low: Proprietary closed source software |
| Reproducibility of science | Low: Without any ease | Medium: Data links and scripts shareable without guarantee to be reproducible | Low: Without any ease | Low: Without any ease | Low: Without any ease | Low: Without any ease | Low: Without any ease |
| Infrastructure replicability | High: Open source code, docker containers and documentation available | Low: Proprietary closed source software | Medium: Open source code with basic documentation available | Low: Proprietary closed source software | Low: Proprietary closed source software | Undefined: Dependent on the backend used | Low: Proprietary closed source software |
| Processing scalability | Medium: A template application available (Python and Celery) | High: Code automatically executed in parallel using a MapReduce approach | Low: User runs his own code | Medium: HTCondor | Medium: A template application available (C++ and MPI) | Undefined: Dependent on the backend used | High: Closed solution |
| Storage scalability | High: Distributed File System, S3 and HTTP | High: Google storage services | High: Google storage services | High: Distributed File System | High: Distributed File System | Undefined: Dependent on the backend used | High: Closed solution |
| Data access interoperability | High: OGC Services | Medium: Tile service | Low: Without any ease | Low:Without any ease | Low:Without any ease | High: OGC Services | High: OGC Services |
| Extensibility | High: Open source and modular code | Low: Proprietary closed source software | High: Open source | Low: Proprietary closed source software | Low: Proprietary closed source software | Medium: open source software integrated with proprietary software | Low: Proprietary closed source software |
© 2020 by the authors. Licensee MDPI, Basel, Switzerland. This article is an open access article distributed under the terms and conditions of the Creative Commons Attribution (CC BY) license (http://creativecommons.org/licenses/by/4.0/).
Share and Cite
MDPI and ACS Style
Gomes, V.C.F.; Queiroz, G.R.; Ferreira, K.R. An Overview of Platforms for Big Earth Observation Data Management and Analysis. Remote Sens. 2020, 12, 1253. https://0-doi-org.brum.beds.ac.uk/10.3390/rs12081253
AMA Style
Gomes VCF, Queiroz GR, Ferreira KR. An Overview of Platforms for Big Earth Observation Data Management and Analysis. Remote Sensing. 2020; 12(8):1253. https://0-doi-org.brum.beds.ac.uk/10.3390/rs12081253
Chicago/Turabian StyleGomes, Vitor C. F., Gilberto R. Queiroz, and Karine R. Ferreira. 2020. "An Overview of Platforms for Big Earth Observation Data Management and Analysis" Remote Sensing 12, no. 8: 1253. https://0-doi-org.brum.beds.ac.uk/10.3390/rs12081253
Note that from the first issue of 2016, this journal uses article numbers instead of page numbers. See further details here.